Article

The Impact of Public Concern and Negative Sentiment Regarding Climate Risk on Corporate ESG Performance: Evidence from China

1
School of Economics, Peking University, Beijing 100871, China
2
BOC Postdoctoral Research Center, Bank of China, Beijing 100818, China
3
CNPC Economics and Technology Research Institute, Beijing 100724, China
*
Author to whom correspondence should be addressed.
These authors contributed equally to this work.
Sustainability 2026, 18(16), 8404; https://doi.org/10.3390/su18168404
Submission received: 18 July 2026 / Revised: 10 August 2026 / Accepted: 13 August 2026 / Published: 17 August 2026

Abstract

Environmental, Social, and Governance practices have emerged as a critical mechanism for mitigating extreme climate risks and achieving Sustainable Development Goals (SDGs). Against this backdrop, this study focuses on Chinese listed manufacturing enterprises from 2015 to 2023. By incorporating the city-level climate risk expressions of public views index, we examine the impact of public concern and negative sentiment regarding climate risk (CR-PCNS) on corporate ESG performance. Our baseline findings indicate that elevated CR-PCNS significantly enhances corporate ESG performance, particularly within the environmental and social pillars, while exerting no significant effect on the governance dimension. Heterogeneity analysis reveals that this promotional effect is more pronounced among non-state-owned enterprises and firms located in the eastern region, with the most noticeable improvements manifested in their environmental performance. Furthermore, the moderation analysis demonstrates that higher executive educational attainment significantly amplifies the positive impact of CR-PCNS on corporate ESG performance, whereas local protectionism severely attenuates this promotional effect. These findings offer crucial policy implications for how to effectively harness public involvement to incentivize greater corporate engagement in ESG initiatives.

1. Introduction

The Global Risks Report 2026 highlights that extreme weather events remain the most severe risk facing the global community over the next decade. According to the China Country Climate and Development Report released by the World Bank in 2022, climate change could trigger an estimated 0.5% to 2.3% reduction in China’s GDP as early as 2030. Against this backdrop, the Environmental, Social, and Governance (ESG) framework has evolved into a core corporate value globally, increasingly recognized as a critical driver for achieving Sustainable Development Goals (SDGs) [1,2]. Extensive evidence demonstrates that superior ESG performance significantly enhances a firm’s market competitiveness and risk mitigation capabilities, endowing companies with greater development resilience when confronting crises and challenges [3,4]. Furthermore, strong ESG performance can effectively mitigate corporate financing constraints [5], boost corporate financial performance [6,7], and enhance overall firm value [8]. Consequently, identifying pathways to improve corporate ESG performance has emerged as a core research agenda for both governments and academia [9,10,11].
With climate disasters becoming more frequent, public attention has shifted from economic growth to ecological quality and corporate sustainability [12]. By leveraging channels such as news media, social platforms, and search engines, the public translates its concern over climate risks into a potent effect of social oversight [10,12,13]. With the deepening of public participation in environmental governance, a burgeoning body of literature explores the impact of this informal oversight mechanism on corporate green innovation [14], carbon reduction [13], and environmental information disclosure [15]. Concurrently, several studies note that public attention is often intertwined with complex emotional fluctuations, jointly shaping corporate strategic choices [16]. However, there remains a relative paucity of research regarding how public climate risk attention and sentiment systematically affect corporate ESG performance. Therefore, an investigation into this relationship is essential. It enriches the existing literature by revealing how public climate sentiment drives ESG optimization. More importantly, it provides critical practical insights. These insights can help enterprises achieve sustainable development and guide policymakers in refining environmental governance instruments.
Against this framework, this paper empirically investigates how public concern and negative sentiment regarding climate risk (CR-PCNS) influence corporate ESG performance. Utilizing firm-level data from 3164 Chinese A-share listed manufacturing companies, we construct a fixed-effects panel data model for our analysis. The baseline results show that CR-PCNS significantly enhances ESG performance, particularly in the Environmental (E) and Social (S) dimensions, while the Governance (G) dimension shows no significant response. Heterogeneity analysis reveals that this effect is stronger among non-SOEs and firms in the eastern region, with the most pronounced improvement in environmental performance. In terms of moderation effect, we unpack the boundary conditions of this relationship by demonstrating that the positive impact of CR-PCNS is symmetrically shaped by internal human capital and external institutional frictions. Higher executive educational attainment amplifies this positive effect, as well-educated leaders possess the cognitive risk insight and strategic foresight necessary to proactively drive green practices. Conversely, this constructive drive is significantly attenuated by regional protectionism, which insulates local markets and erodes firms’ external motivations for sustainable alignment. These findings suggest that public attention and sentiment regarding climate risk act as an informal supervisory force, exerting external pressure on local firms to regulate their environmental behavior.
This paper makes three contributions. First, this study extends the existing research by operating at a more granular, city-level dimension. Unlike prior studies that predominantly rely on web search indices to measure public environmental attention [17,18], we use a city-level composite indicator (CREPVI) that integrates both the intensity of public climate-loss concern and negative sentiment to provide a more comprehensive portrayal of public climate-risk concerns and sentiment. Furthermore, by expanding the theoretical locus to the specific nexus between CR-PCNS and corporate ESG performance, this study enriches the broader literature on corporate sustainable development. Second, this study expands the literature on how external factors moderate the relationship between public oversight and corporate ESG performance from the perspective of local government protectionism. Driven by regional tax competition, local governments frequently shield domestic enterprises more heavily than nonlocal competitors, thereby breeding local protectionism. Such administrative intervention tends to create a sheltered market environment characterized by low competition, which can distort corporate resource allocation logic and alter how firms respond to shifts in CR-PCNS. Against this backdrop, this paper explores the moderating effect of local protectionism on the relationship between CR-PCNS and corporate ESG performance, offering novel entry points for policymakers to enhance ESG practices and advance sustainable development from a governmental stance. Third, this study expands the domain of internal governance factors by examining how executive education shapes the relationship between public engagement and corporate ESG performance. While existing scholarship has established that executive education directly enhances a firm’s ESG performance [3,19], its potential contingency role remains largely unexplored. To address this lacuna, this study adopts a moderating effect perspective to investigate how executive educational attainment influences the relationship between CR-PCNS and corporate ESG performance. In doing so, this paper provides valuable reference and actionable insights into how firms can effectively enhance their ESG metrics from an internal governance standpoint.
The rest of this paper is structured as follows. Section 2 presents the literature review. Section 3 introduces data, variables, and econometric specification. Section 4 reports empirical results. The last section concludes with policy implications and avenues for future research.

2. Literature Review

2.1. The Influencing Factors of Firms’ ESG Performance

Currently, the most prevalent framework for assessing corporate sustainability is the Environmental, Social, and Governance perspective [20,21,22]. Identifying the determinants of ESG performance enables firms to precisely recognize the driving mechanisms behind ESG improvements. Consequently, by optimizing resource allocation, companies can achieve sustainable value creation, cultivate stakeholder trust, and secure greater resource commitments [23]. Extant literature on the determinants of corporate ESG performance has primarily branched into internal and external streams [24].
Regarding internal factors, a body of research suggests that firm-level characteristics serve as critical determinants of a firm’s ESG performance, such as size [20], age [2], financial performance [25,26,27], ownership structure [28,29], board structure [30,31,32], board independence [33], corporate culture [34], and geographic proximity to environmental protection agencies [35]. Corporate behavior and strategy also serve as pivotal determinants of ESG performance [36,37,38]. Specifically, equity incentives effectively curb managerial short-termism, thereby fostering superior ESG outcomes [39]. This improvement is further driven by heightened climate attentiveness [40,41] and the strategic implementation of digital transformation [42,43]. Moreover, active engagement in global market competition and the integration of frontier technologies, such as artificial intelligence, significantly bolster ESG performance [44,45,46].
Regarding the external determinants of ESG, extant literature has conducted extensive and in-depth analyses across a multi-dimensional landscape, encompassing governmental intervention [47,48,49,50,51], corporate political ties [52], industry competition intensity [1], technological shifts [53,54,55], external risks [56,57,58,59,60,61], macroeconomic uncertainty [16,23,62,63,64,65], and informal institutions [11,66]. In the realm of informal monitoring mechanisms, public participation serves as a critical adjunct to traditional administrative oversight, as heightened environmental concerns articulated through internet searches and media discourse compel firms to improve their ESG performance [18,67]. Similarly, investor attention exerts a form of compliance pressure that incentivizes corporations to optimize ESG outcomes in alignment with market expectations [13]. Beyond direct stakeholders, media coverage acts as a potent external monitoring tool, as such exposure intensifies scrutiny from securities analysts and alleviates agency costs, thereby steering management away from short-termism toward long-term sustainable development [10].

2.2. The Impact of Public Concern and Sentiment

Regulatory pressure often exerts a direct transmission effect and a strong binding force on corporate climate risk management behaviors [68]. As a critical informal institution, public concern and social sentiment can equally function as effective external monitoring mechanisms [69,70]. Extant research suggests that positive public sentiment not only directly augments firm value [71], but also fosters indirect gains in financial performance [72]. In contrast, negative public sentiment generates intense public pressure, which can precipitate critical reputational risks for the organization [73]. Furthermore, negative public sentiment can adversely affect corporate market valuation and exacerbate financing constraints [74,75]. Therefore, such external pressures necessitate that enterprises adjust their strategic orientations and refine resource distribution in response to fluctuations in public attention and sentiment [12,76,77]. In addition, the media represents another pivotal external monitoring force. On the one hand, negative media coverage can directly impair firm value by eroding investor confidence and dampening market expectations [15,78,79,80,81]. On the other hand, the tone of media reports acts as a metric for public attention [82], functioning as either an amplifier that intensifies the transmission of public sentiment into corporate behavior [83,84], or as a buffer that mitigates such effects [85].
Regarding climate risks, heightened public attention and more pronounced pessimistic sentiment, or intensified negative emotions toward corporate environmental management, typically correlate with higher levels of green investment [86,87], and a stronger propensity for firms to pursue a sustainable transition [88,89,90,91]. Specifically, heightened public attention to climate risks exerts pressure via social discourse and political advocacy, driving enterprises to implement environmental risk mitigation strategies in response to volatile public emotions and anticipating changes in the regulatory landscape [92,93]. In a similar vein, public attention and sentiment regarding climate risks carry weight in determining a firm’s market value and financing costs. When heightened public concern is coupled with intense negative sentiment, firms may preemptively enhance their environmental performance or increase investments in sustainable development to safeguard their market valuation and mitigate financing costs [94,95,96,97]. Nevertheless, some studies find that the effect of public emotions on CSR engagement is moderated by the firm’s idiosyncratic sentiment. Specifically, managerial optimism can act as a cognitive filter; even in the face of public negativity toward climate risks, such internal complacency may lead to strategic inertia or inaction concerning sustainable transitions [9].
In summary, the existing literature exhibits two gaps. First, few studies have integrated both public attention intensity and negative sentiment regarding climate risk into a unified framework to examine their overall effect on ESG performance. Second, prior research has largely focused on the direct effects of public oversight, with limited exploration of the internal and external conditions that amplify or attenuate this transmission—in particular, how executive cognitive capabilities and local government intervention moderate this relationship remains unclear. To address these gaps, this paper employs a city-level composite indicator of CR-PCNS, and examines the moderating roles of executive educational attainment and local protectionism.

3. Data and Methodology

3.1. Sample Selection and Data Sources

As the cornerstone of China’s national economy, the manufacturing sector’s low-quality and extensive growth model poses a severe challenge to achieving the national carbon peak goal before 2030. Consequently, manufacturing enterprises play a critical role in driving the green and low-carbon transition. Given that mandatory disclosure requirements are only applicable to a limited number of firms in China, we focus specifically on Chinese manufacturing firms that have publicly listed on the Shanghai or the Shenzhen Stock Exchange. Furthermore, we exclude the samples with special treatment (ST or ST*), period delisting, or suspended from trading.
To investigate the impact of CR-PCNS on manufacturing firms’ ESG performance, it is necessary to collect data on such public concern and sentiment, corporate ESG scores, and other relevant control variables at the firm and regional level. Firstly, we extract the city-level climate risk expressions of public views index (CREPVI) from the database constructed by Sun et al. [98]. Based on the constructed dictionaries including a climate feature dictionary of 292 words covering nine climate event types, a climate loss concern dictionary of 1820 words, and sentiment dictionaries, Sun et al. [98] developed a city-level climate risk expressions of public views index through textual analysis of messages from the Message Board for Leaders. The platform is openly accessible to all citizens across China, covering all prefecture-level cities. It captures genuine public expressions of concerns in daily life and disaster scenarios, with minimal advertisements or false information. The sentiment dictionaries are aggregated from mainstream lexicons including those from Baidu, Harbin Institute of Technology and other representative studies [98], forming separate positive and negative dictionaries. For each message, the index is calculated as the proportion of loss concern words weighted by sentiment polarity, ranging from 0 (most positive) to 1 (most negative). Notably, users post original expressions without reposting mechanisms, resulting in significantly lower echo chamber effects than other social media platforms like Weibo. One limitation is that, owing to the anonymity of message-board data, it is difficult to obtain users’ socio-demographic information and track individual users across observations. Overall, this index effectively captures the intensity of public loss concern and negative sentiment associated with climate risk for each city [98]. Secondly, we utilize HZ_ESG scores released by Sino-Securities Index Information Service (Shanghai) Co., Ltd., (Shanghai, China) to assess corporate ESG performance. HZ_ ESG data serves as a valid measure of corporate ESG performance, with higher scores indicating superior ESG-related practices by companies. Relative to alternative ESG data sources, it provides relatively comprehensive coverage and has been extensively employed in papers [54,99], demonstrating reasonable reliability. Thirdly, data for other variables at the firm and regional level in our sample are derived from CSMAR and the China Urban Statistical Yearbook. In addition, this paper applies a 1% winsorization to the continuous variables to mitigate the potential influence of outliers and extreme values on the results.
We compile a final sample of 15,773 observations from 2015 to 2023. The starting year is determined by the data availability of the key variables used in this study.

3.2. Empirical Model and Variable Description

This paper investigates the impact of CREPVI on firms’ ESG performance with the following equation:
ESG it   = β 1   +   β 2 CREPVI it   +   β 3 X it   +   μ i   +   δ t   +   ε it
where the subscripts i and t represent firm and the year, respectively. ESG it denotes the ESG performance of firm i in the year t, measured by the HZ_ESG scores. To further investigate the impact of independent variable on the distinct dimensions of firms’ ESG performance, we extend our analysis by incorporating firms’ environmental, social responsibility and corporate governance scores as additional dependent variables. The independent variable, CREPVI it , is climate risk expressions of public views index for the headquarters city of firm i in the year t. A higher value of CREPVI it indicates greater public concern regarding climate risk and higher levels of negative emotions. Moreover, X it is a set of control variables, including a set of characteristic variables at the firm and city level. To mitigate potential omitted variable bias, we select a set of control variables that may influence firms’ ESG performance. At the firm-level, we control for the following variables: Return on total assets (ROA), Tobin’s Q value, Size—the log of total assets, Net cash flow, Leverage—the debt-to-asset ratio, Growth of sales revenue. ROA is a useful indicator that reflects the probability of a company [100]. Tobin’s Q value is widely employed to gauge firm performance and growth [54]. Size is a fundamental factor that significantly affects a firm’s ESG disclosure and performance [20]. According to Garcia et al. [27], we control for the impact of net cash flow. Leverage is a proxy for a firm’s risk exposure. Furthermore, it reveals a company’s ability to obtain external funding, which may in turn affect its ESG performance [101]. Growth of sales revenue is annual growth rate of firms’ sales revenue. Following Fang et al. [42], we incorporate this variable as a control. We also select city-level control variables, including GDP, GDP share of the secondary industry, and urban population size [47,100]. μ i represents the individual heterogeneity of the data sample firms that do not vary over time. δ t denotes the time-fixed effect of year. ε it is the random error term. β 1 , β 2 and β 3 are the parameters to be estimated in the regression. Standard errors are clustered at the firm level in all regressions.
Table 1 displays the definitions and descriptive statistics for the main variables adopted in the model. The average value and standard deviation of ESG are 73.397 and 4.766, respectively. Meanwhile, the mean value of CREPVI is 2.918, with a standard deviation of 5.086. Collectively, the results presented above demonstrate a statistically significant variation in both ESG scores and the CREPVI among the firms in the sample pool, thereby establishing a solid foundation for our subsequent empirical analysis.
A potential issue of multicollinearity between explanatory and control variables could bias the coefficient estimates and make them unstable. Therefore, we calculated the correlation coefficients among these variables, and the results are presented in Table 2. As can be seen from Table 2, the correlation coefficients between the variables do not exceed 0.6. Based on this, we conclude that no severe multicollinearity exists between CREPVI and control variables.

4. Empirical Results

4.1. Baseline Results

To empirically investigate the impact of CR-PCNS on firms’ ESG performance, we examine how climate risk expressions of public views influence corporate ESG performance, as measured by the overall ESG score and its individual environmental, social, and governance pillar scores based on Equation (1). We first estimate Equation (1) without control variables and then present the results in columns (1)–(4) of Table 3. We also estimate Equation (1) with control variables and then present the results in columns (5)–(8) of Table 3. All standard errors of the results are clustered at the firm level. Columns (1) and (5) of Table 3 show that the estimated coefficient on CREPVI remains positive and statistically significant at the 1% level, regardless of whether control variables are included. Moreover, a one-standard-deviation increase in CREPVI (5.086) is associated with an increase of approximately 0.208 points in the ESG score. Relative to the sample mean of ESG (73.397), this corresponds to a 0.28% improvement. This result suggests that local public concern and negative sentiment on climate risks promote better overall ESG performance of listed manufacturing firms. Furthermore, columns (2)–(4) and (6)–(8) present that the estimated coefficients on CREPVI are both significantly positive for the environmental and social performance of listed firms in our sample, yet remain statistically insignificant for governance performance, regardless of control variables inclusion. These findings indicate that the environmental and social performance of firms can be positively impacted by increased local CR-PCNS. Specifically, the coefficient on CREPVI for environmental dimension is both more statistically significant and larger in magnitude compared to other dimensions, suggesting that CREPVI has a more pronounced influence on environmental performance. This could be because an increase in CREPVI prompts firms to pay greater attention to their pollution emissions and resource consumption. By demonstrating better performance in the environmental dimension, they seek to gain public trust [76]. The effect of CR-PCNS on governance performance is not significant, mainly because governance reforms involve formal procedures such as charter amendments and board re-elections, with adjustment costs far exceeding those for environmental or social improvements. When facing public pressure, firms tend to prioritize low-cost, fast-responding environmental or social initiatives over procedurally complex governance reforms.
Regarding the control variables at the firm level, the estimated coefficients on ROA and Size are significantly positive, indicating that firms with greater size and superior operating performance are positively associated with enhanced ESG performance [42,100]. This may be explained by the fact that larger and more profitable firms, benefiting from stronger capital positions and greater operational maturity, are better positioned to allocate resources toward ESG performance beyond financial objectives. Furthermore, the estimated coefficients on LEV are negative and statistically significant, suggesting higher leverage risk contribute to poorer ESG performance [102]. In addition, the results presented in Table 3 show that the coefficients on Tobin’s Q and the sales revenue growth rate are significantly negative. These results may be attributed to the fact that Tobin’s Q and sales revenue growth rate reflect corporate performance and growth. Firms pursuing better financial performance may allocate more resources toward enhancing financial metrics rather than advancing their ESG development. At the city level, the coefficient on urban population size is significantly positive, indicating that larger city population size is positively associated with enhanced ESG performance of local firms. To provide a more standard and informative multicollinearity diagnostic, we further conduct the Variance Inflation Factor (VIF) test. The results show that all VIF values range from 1.10 to 1.68, well below the commonly accepted threshold of 5. This confirms that multicollinearity does not pose a concern in our model.

4.2. Robustness Tests

To ensure the robustness of the core conclusions, we conduct comprehensive robustness checks from five perspectives. Firstly, we incorporate city-level fixed effects in addition to year fixed effects, thereby accounting for potential unobserved heterogeneity at the city level. The result is shown in column (1) of Table 4. We observe that CREPVI continues to exert a statistically significant positive effect on firms’ ESG performance after controlling for city-level fixed effects, proving the robustness of our core conclusions.
Secondly, we account for the impact of the COVID-19 pandemic. To further control for the potential confounding influence of the COVID-19 pandemic on the estimated effect of CREPVI on firms’ ESG performance, we re-estimate Equation (1) with year dummy variables for the 2020–2023 period. During the COVID-19 pandemic, enterprises experienced operational suspensions and production halts due to supply chain disruptions, labor shortages, and regional lockdowns [103]. Consequently, these operational challenges may have induced variations in firms’ ESG performance. Column (2) of Table 4 show the result of the empirical result. It is evident that CREPVI still positively impacts firms’ ESG performance, which suggests our results are solid.
Thirdly, there is a potential concern of reverse causality. Although we have controlled for the effects of many potential factors that are difficult to capture at the firm, time and regional level, it is still possible that some unobserved factors remain, potentially introducing endogeneity into our estimates. For example, companies with higher levels of ESG performance are located in regions where the public exhibits greater concern about climate risk, thereby potentially compromising the validity of the estimated effect of CREPVI on corporate ESG performance. As the historical expressions of public views on climate risk can hardly affect current corporate ESG performance, we re-estimate Equation (1) using one-period lagged CREPVI and all control variables to further eliminate the interference of reverse causality problem [54]. The results in column (3) of Table 4 indicate that the impact of CREPVI on firms’ ESG performance remains significantly positive, which verifies the robustness of our findings.
Fourthly, to further address potential endogeneity concerns beyond reverse causality, such as omitted city-level shocks correlated with both public sentiment and corporate ESG performance trends, we adopt an instrumental variable strategy following Cipollone and Rosolia [104]. Specifically, we use the historical frequency of natural disasters at the provincial level as an instrument for CREPVI. Regions with higher historical disaster frequency are likely to exhibit greater public sensitivity to climate risks, leading to more frequent expressions of climate-risk-related concern and sentiment. Moreover, the historical occurrence of natural disasters at the provincial level is unlikely to be affected by corporate behavior. Regarding exclusivity, first, the selected historical disasters are meteorological in nature, with exogenous occurrence and broad spatial distribution rather than concentration in specific industrial regions. Thus, the disaster-based instrument is unlikely to affect corporate ESG performance through direct asset destruction or regional policy changes. Second, our empirical specifications include year-fixed effects and region-fixed effects to absorb time-varying macro shocks and time-invariant regional characteristics, further ruling out potential confounding influences through other channels. On this basis, we argue that our instrument plausibly satisfies the exclusion restriction. To preserve time variation in our panel setting, we construct the instrument as the interaction between historical disaster frequency and year dummies, following Nunn and Qian [105]. The historical disaster data are obtained from the EM-DAT international disaster database. The instrumental variable estimation results are presented in Table 5. The Kleibergen–Paap Wald F statistic and the Cragg-Donald Wald F statistic both exceed the critical value of 16.38 at the 10% level, rejecting the weak instrument concern. The second-stage results, reported in column (2) of Table 5, remain consistent with our baseline findings, confirming the robustness of our conclusions.
Fifthly, to further validate the causal interpretation of our baseline findings, we conduct a mediation analysis following Feng and Yuan [67]. Based on the theoretical logic that heightened public climate concern intensifies reputational pressure, stakeholder scrutiny, and environmental legitimacy demands on local firms, we select environmental investment disclosure as the mediating variable. This variable takes the value of 1 if the firm has original records of environmental expenditure in a given year, and 0 otherwise within the sample coverage period. The mediation results are presented in Table 6. The mediation results show that both the first-stage and second-stage coefficients are statistically significant, and the Sobel test confirms the significance of the indirect effect at the 1% level. This mediation analysis also serves as an additional robustness check for our baseline findings, supporting the existence of the reputational pressure mechanism.

4.3. Heterogeneity Analysis

4.3.1. Firm Ownership

To extend our analysis, we develop a further heterogeneity analysis of the sample data according to firm characteristics and regional differences. Given that firms of different ownership types may react differently to the dynamics of CR-PCNS, the effect of CREPVI on corporate ESG performance is likely to be heterogeneous. Hence, we first divide the sample firms into two groups based on their ownership type in this study. A firm is classified as a SOE if its ultimate controlling shareholder is a state-owned entity, including state-owned enterprises, administrative agencies, public institutions, central government bodies, or local government authorities. If a firm has multiple ultimate controllers, it is defined as a SOE so long as at least one of them is identified as a state-owned entity. All other firms are defined as non-SOEs.
The re-estimated results for each subsample are presented in Panel A and B of Table 7, respectively. According to Table 7, the ESG performance of non-SOEs, both overall and in each of the E and S dimensions, is more susceptible to the influence of CREPVI than that of SOEs. CREPVI is insignificant for G dimension in both SOEs and non-SOEs. To test whether the effect of CREPVI on ESG performance, as well as on the E and S dimensions, indeed differs across the subsamples, we further include an interaction term between CREPVI and a non-SOE dummy in the regression. The results are presented in Table 8 and show that the effect of CREPVI on overall ESG and environmental performance significantly differs between non-SOEs and SOEs.
This is primarily because SOEs, as the backbone of local economic development, inherently benefit from preferential access to government support and financing from state-owned banks, which buffers them from fluctuations in public trust. By contrast, as local public concern to climate risks intensifies and the associated sentiment turns more negative, non-SOEs must comprehensively improve their ESG performance, especially environmental performance, to earn public trust and thereby strengthen their competitiveness. These results suggest that the impact of CREPVI on firms’ overall ESG and E/S/G performance depends on different ownership types.

4.3.2. Geographical Location

Given China’s vast territory, there are significant variations in natural geographical conditions and economic development levels across different regions. As a result, the impact of CREPVI on corporate ESG performance is likely to vary substantially among firms. We therefore categorize the sample firms into three regional groups, eastern, central, and western China, based on their geographic location. Table 9 presents the regression results by subgroup: Panel A for the west, Panel B for the east, and Panel C for the central region. The estimated coefficients on CREPVI in Table 9 show that the overall ESG, the environmental and the social performance of firms in the eastern region are significantly influenced by CREPVI. In contrast, CREPVI shows no significant impact on the overall ESG performance or its individual dimensions (E, S, and G) for firms located in the central and western regions. To test whether the effect of CREPVI differs between firms in the eastern region and those in the central and western regions, we further add an interaction term between CREPVI and an eastern region dummy to the full sample. The results are presented in Table 10. The interaction term is significantly positive, confirming that the effect of CREPVI is indeed stronger for firms in the eastern region.
The possible reason for this is that the eastern region is characterized by a higher level of economic development, greater marketization, and a more robust institutional environment. Following the rise in public concern and negative sentiment regarding climate risks, firms in the eastern region demonstrate greater capacity and motivation to enhance their overall ESG and environmental performance to secure public trust and support. Furthermore, strong corporate ESG performance generates prompt positive market feedback, which in turn creates additional incentives for firms to improve their ESG performance. Consequently, these finding indicate that the impact of CREPVI on firms’ overall ESG performance and environmental dimension is contingent upon their geographic location.

4.4. Moderating Effects Analysis

4.4.1. Moderating Effect of Executive Education Background

We next examine the moderating roles of firm- and region-specific characteristics. Highly educated individuals typically exhibit superior abilities [106]. Senior managers with higher levels of education are characterized by superior analytical and judgment capabilities as well as a forward-looking vision, which enable them to develop a more nuanced understanding of environmental, social, and governance challenges [107]. When confronted with external shocks, highly educated executives proactively incorporate corporate ESG development directions into their decision-making processes, resulting in choices that better serve the long-term interests of the enterprise. Accordingly, we propose that when CR-PCNS intensify, the subsequent changes in corporate ESG performance will vary significantly with executives’ educational level. Consistent with Wu et al. [87], this paper incorporates an interaction term between corporate executives’ educational level and local CREPVI to investigate the moderating effect of executive education on the relationship between CR-PCNS and corporate ESG performance. We obtain data on executives’ educational backgrounds from the CSMAR database. Specifically, we assign a numerical score from 1 to 5 to each executive based on their highest attained education level, with 1 representing “secondary education or below,” 2 for “associate degree,” 3 for “bachelor’s degree,” 4 for “master’s degree (including MBA and EMBA),” and 5 for “doctorate degree”. A higher score indicates a more advanced level of education. We then calculate the average of all executives’ education scores within each firm to serve as a proxy for the firm’s overall executive education level. To facilitate cleaner interpretation, we mean-centered executive education before constructing the interaction term. The main effect of CREPVI represents its effect when executive education is at its mean value.
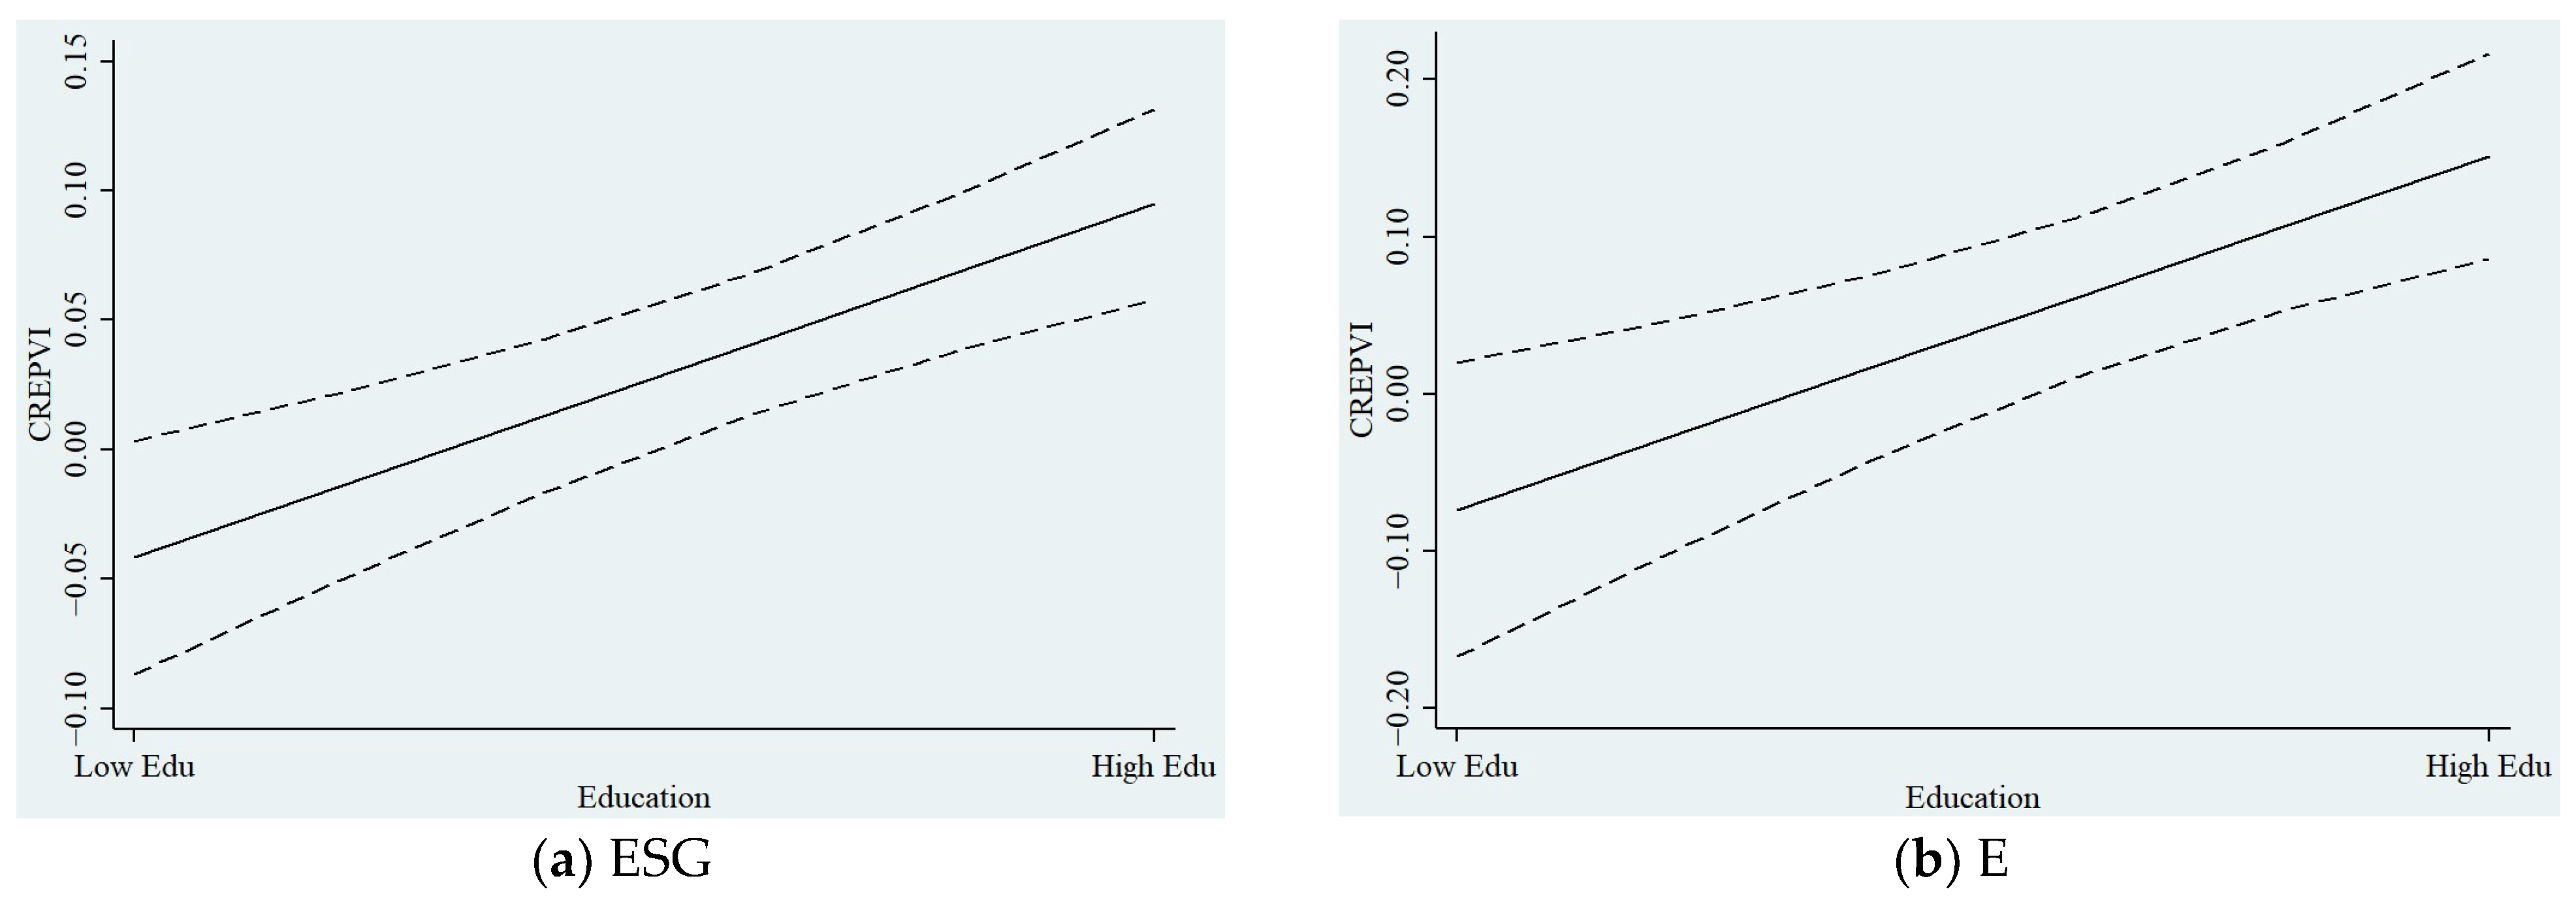
In column (1) of Table 11, the interaction term between executive education and CREPVI has a significantly positive impact on corporate ESG performance. This suggests that a higher educational level of executives strengthens the positive impact of CREPVI on corporate ESG performance. Furthermore, the regression results in column (2)–(4) of Table 11 indicate that the moderating effect of higher executive education is exclusively evident in the positive impact of CREPVI on corporate environmental and governance performance, showing no moderating effect on corporate social performance. Figure 1 presents the marginal effects of CREPVI on overall ESG and E dimension performance across the observed range of executive education. As shown, the marginal effect is positive and statistically significant for most of the observed range, and increases as executive education rises. This confirms that higher executive educational attainment amplifies the positive impact of CREPVI on corporate ESG performance.

4.4.2. Moderating Effect of Local Protectionism

Enterprises located in areas with stronger regional protectionism exhibit lower investment efficiency [108], and consequently lack the drive to pursue sustainable development and green transformation [109]. When confronting external shocks, firms accustomed to local government protectionism may lack the initiative to enhance their ESG performance and bolster their risk resilience. To test whether local protectionism moderates this relationship, we add an interaction term between local protectionism and CREPVI to Equation (1). In China, procurement organizations operate under the jurisdiction of either the central or local governments. Approximately 95% of procurement activities are managed by locally governed entities, which utilize local budgets and operate under the supervision of local finance departments. This operational structure empowers local leaders with direct control over the allocation of procurement resources. While this measure primarily reflects general market protectionism, it shelters firms from external pressures and reduces their incentives to respond to public concern and sentiment over climate risks. Following the established literature [110], we construct a variable to quantify the level of local protectionism using city-level procurement data. Specifically, we extract prefecture-level city information from the addresses of both procurers and suppliers. Based on this geographic data, local protectionism is identified through the co-location of both parties within the same administrative jurisdiction. Subsequently, the share of procurement contracts awarded to local firms is used to gauge the extent of local protectionism. We also mean-centered local protectionism before constructing the interaction term.
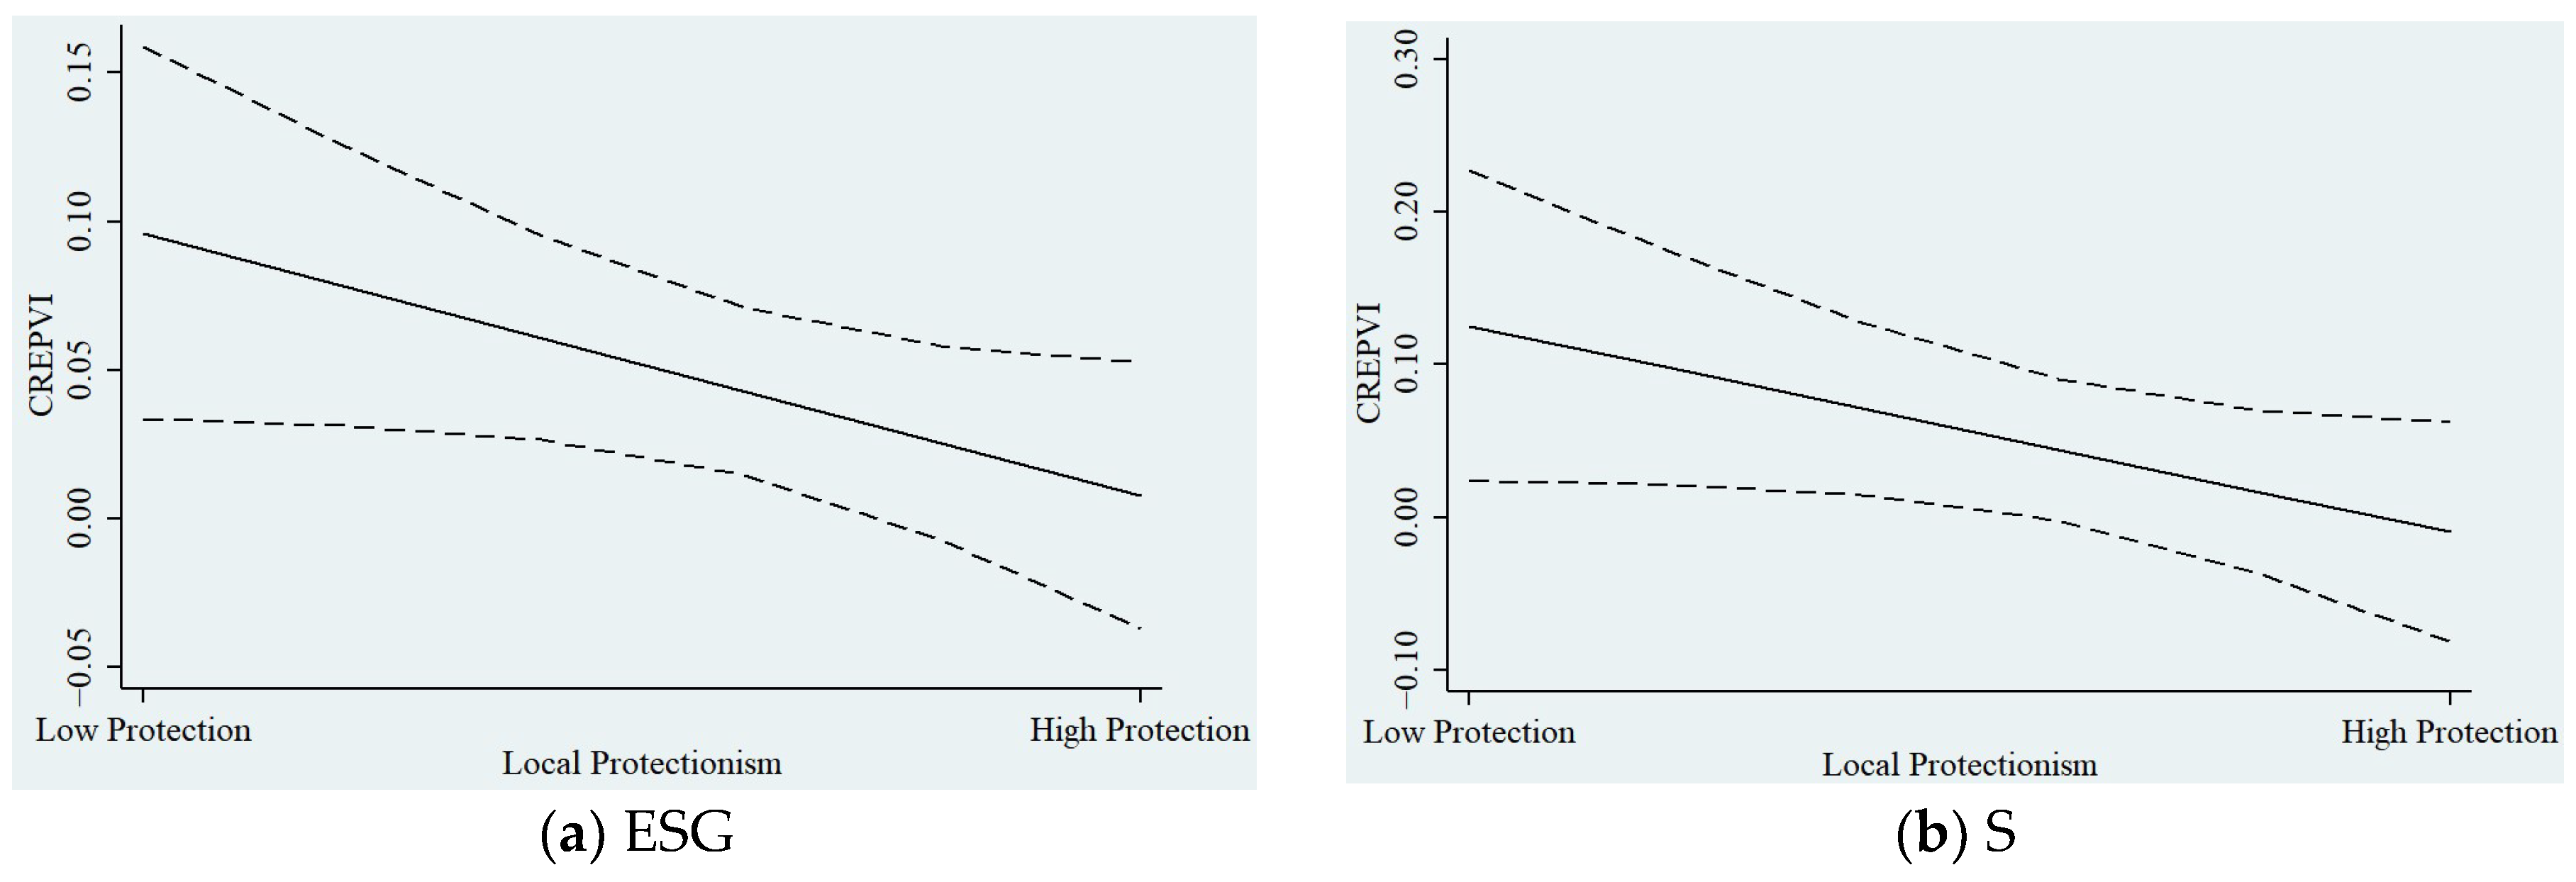
In column (1) of Table 12, the interaction term between local protectionism and CREPVI has a significantly negative impact on corporate ESG performance. This suggests that a higher degree of local protectionism weakens the positive impact of CREPVI on corporate ESG performance. Furthermore, the regression results in column (2)–(4) of Table 12 indicate that local protectionism negatively moderates the relationship between CREPVI and corporate social performance, attenuating its positive impact. Figure 2 presents the marginal effects of CREPVI on ESG performance across the observed range of local protectionism. As shown, as the level of local protectionism increases, the positive effect of CREPVI on firms’ overall ESG and social performance declines.

5. Conclusions

This paper explores the impact of public climate risk attention and negative sentiment at the city level on corporate ESG performance. Using the city-level CREPVI, this study finds that heightened CR-PCNS serve as a catalyst for local firms to enhance their ESG performance, particularly within the E and S dimensions, whereas no significant impact is observed on the G dimension. The heterogeneity analysis reveals that in response to elevated CREPVI, non-SOEs demonstrate a stronger propensity than SOEs to comprehensively enhance their ESG and environmental performance—with the most pronounced improvements occurring in the E dimension. Meanwhile, firms located in the eastern region possess both greater incentives and superior capabilities to bolster their ESG performance compared to their counterparts in the central and western regions, particularly regarding environmental and social stewardship. Moreover, the moderation analysis shows that the positive impact of CR-PCNS is amplified by executive education but attenuated by regional protectionism. Specifically, when faced with elevated CREPVI, executives with higher academic qualifications demonstrate superior risk insight and strategic judgment, rendering them more inclined to drive ESG enhancements. Conversely, a higher degree of local protectionism in a firm’s home city significantly diminishes the incentive for enterprises to improve their ESG performance, effectively weakening the transmission of public pressure.
Regarding the impact of public attention and sentiment toward climate risks, the findings of this study align with the prevailing literature, suggesting that heightened public concern and negative sentiment regarding climate-related losses drive firms to enhance their ESG performance [14,17,18,111]. However, most extant studies focus primarily on aggregate ESG scores, leaving the three individual pillars of ESG relatively underexplored. This paper extends the empirical analysis by disaggregating ESG into its environmental, social, and governance dimensions. The results demonstrate that the impact of public attention and sentiment regarding climate risk is heterogeneous across these distinct components. Specifically, while the environmental dimension experiences the most pronounced impact, public climate risk concern and sentiment also significantly influence a firm’s performance in the social dimension.
The findings of this study provide valuable insights for enhancing corporate ESG performance. First, for firms, firms with different ownership structures should adopt nuanced strategies in response to shifts in public attention and sentiment. For non-SOEs, it is imperative to more keenly capture public interest and emotional trends to proactively enhance their ESG performance. Moreover, these firms can leverage social media platforms to cultivate a positive corporate image and bolster external stakeholder confidence. Conversely, SOEs which often possess established reputations, should focus on continuously strengthening their ESG commitments to sustain long-term market competitiveness. Furthermore, enterprises should prioritize the appointment of highly educated managerial talent. Such leaders are more likely to acutely perceive the diverse signals embedded in public discourse on social media and other open platforms. Consequently, they are better positioned to transform these informal pressures into strategic opportunities for advancing the firm’ s ESG objectives.
Second, for policymakers, the government should be vigilant against the dampening effect of local protectionism, which significantly diminishes corporate incentives to upgrade their ESG performance when faced with elevated CR-PCNS. It is essential for authorities to lower local protectionism by improving regional transparency and fostering a more equitable competitive landscape. In addition, the government should refine the external governance environment by advancing the level of regional marketization. Especially in the central and western regions, the government should implement complementary green transition incentives—such as tax concessions and subsidies—to bridge the gap between firms’ inherent capabilities and their motivation for sustainable development.
Third, for the public, the public should recognize that their collective discourse and emotional leanings serve as a direct determinant of corporate environmental decision-making. Therefore, citizens are encouraged to maintain a proactive role in environmental monitoring and advocacy. By articulately voicing concerns and negative sentiments regarding climate risks, the public can exert substantive external pressure on high-pollution enterprises or those failing to comply with environmental standards, thereby compelling them to align with sustainability norms.
While providing meaningful insights, this study possesses several limitations, primarily stemming from its specific research scope and constraints in data accessibility. On the one hand, while the CREPVI developed by Sun et al. [98] provides a valuable metric for quantifying public attitudes, it exhibits a specific orientation toward public concern over climate-related losses and negative emotions, which may introduce certain limitations to the breadth of our findings. By developing city-level metrics for positive public sentiment and attention on climate risk, future studies can investigate potential asymmetries in how public perception drives corporate ESG outcomes. Specifically, the composite index integrates both public attention intensity and negative sentiment, making it difficult to disentangle their respective independent effects. These two conceptually distinct forces may influence corporate behavior through different channels. Future research could construct separate indicators for public attention and negative sentiment at the city level to examine their potentially asymmetric impacts on ESG performance. On the other hand, our results derived from the manufacturing sector and listed firms; therefore, the findings of this study may lack generalizability. Future research could benefit from the acquisition of ESG-related data for non-listed enterprises to further explore how public attention and sentiment regarding climate risks influence their sustainability performance. Incorporating these firms would provide a more comprehensive understanding of the broader corporate landscape.

Author Contributions

Conceptualization, S.C. and W.S.; methodology, S.C.; data curation, W.S.; formal analysis, S.C. and W.S.; visualization, S.C. and W.S.; validation, S.C. and W.S.; writing—original draft, S.C. and W.S.; writing—review and editing, S.C. and W.S.; supervision, S.C. and W.S.; project administration, S.C. and W.S. These authors contributed equally to this work. All authors have read and agreed to the published version of the manuscript.

Funding

The authors received no funding for this work.

Institutional Review Board Statement

Not applicable. The research does not involve human or animal subjects, nor does it include any identifiable personal information. Therefore, ethical review and approval were not required for this study.

Informed Consent Statement

Not applicable. This study uses publicly available secondary data and does not involve human subjects. Therefore, informed consent was not required.

Data Availability Statement

The data presented in this study are available from the corresponding author upon reasonable request. Some datasets were obtained from public institutions and are subject to third-party restrictions.

Acknowledgments

The authors would like to thank the editors and reviewers for their constructive comments. No generative AI tools were used in the conception, design, data collection, analysis, interpretation, or writing of this manuscript.

Conflicts of Interest

The authors declare no conflicts of interest. Author Shuya Chang was employed by BOC Postdoctoral Research Center, Bank of China. The remaining author declares that the research was conducted in the absence of any commercial or financial relationships that could be construed as a potential conflict of interest.

Abbreviations

The following abbreviations are used in this manuscript:
ESGEnvironmental, Social, and Governance
CR-PCNSPublic Concern and Negative Sentiment regarding Climate risk
CREPVIclimate risk expressions of public views index
GDPGross Domestic Product
SOEsState-Owned Enterprises
non-SOEsnon-state-owned enterprises
SDGsSustainable Development Goals
CSRCorporate Social Responsibility

References

  1. Wang, Q.; Xu, Y. Can Industry Competition Stimulate Enterprises ESG Performance? Int. Rev. Financ. Anal. 2025, 104, 104274. [Google Scholar] [CrossRef] [Scilit]
  2. Huarng, K.-H.; Yu, T.H.-K. Causal Complexity Analysis of ESG Performance. J. Bus. Res. 2024, 170, 114327. [Google Scholar] [CrossRef] [Scilit]
  3. E-Vahdati, S.; Binesh, F. The impact of CEO’s attributes on R&D intensity and ESG practices. Span. J. Financ. Account. Rev. Esp. Financ. Contab. 2022, 51, 326–349. [Google Scholar] [CrossRef] [Scilit]
  4. Karwowski, M.; Raulinajtys-Grzybek, M. The Application of Corporate Social Responsibility (CSR) Actions for Mitigation of Environmental, Social, Corporate Governance (ESG) and Reputational Risk in Integrated Reports. Corp. Soc. Respons. Env. 2021, 28, 1270–1284. [Google Scholar] [CrossRef] [Scilit]
  5. Cheng, B.; Ioannou, I.; Serafeim, G. Corporate Social Responsibility and Access to Finance. Strat. Manag. J. 2014, 35, 1–23. [Google Scholar] [CrossRef] [Scilit]
  6. Xie, J.; Nozawa, W.; Yagi, M.; Fujii, H.; Managi, S. Do Environmental, Social, and Governance Activities Improve Corporate Financial Performance? Bus. Strat. Env. 2019, 28, 286–300. [Google Scholar] [CrossRef] [Scilit]
  7. Trinks, A.; Mulder, M.; Scholtens, B. An Efficiency Perspective on Carbon Emissions and Financial Performance. Ecol. Econ. 2020, 175, 106632. [Google Scholar] [CrossRef] [Scilit]
  8. Wong, W.C.; Batten, J.A.; Ahmad, A.H.; Mohamed-Arshad, S.B.; Nordin, S.; Adzis, A.A. Does ESG Certification Add Firm Value? Financ. Res. Lett. 2021, 39, 101593. [Google Scholar] [CrossRef] [Scilit]
  9. Dang, X.; Wang, S.; Deng, X.; Zhang, Z.; Zhang, N.; Mao, H. How Does Public Sentiment Affect the Socially Responsible Behavior of Construction Enterprises? Processes 2022, 10, 2403. [Google Scholar] [CrossRef] [Scilit]
  10. He, F.; Guo, X.; Yue, P. Media Coverage and Corporate ESG Performance: Evidence from China. Int. Rev. Financ. Anal. 2024, 91, 103003. [Google Scholar] [CrossRef] [Scilit]
  11. Zhu, B.; Wang, Y. Does Social Trust Affect Firms’ ESG Performance? Int. Rev. Financ. Anal. 2024, 93, 103153. [Google Scholar] [CrossRef] [Scilit]
  12. Anderson, T.; Sarkar, S.; Kelley, R. Analyzing Public Sentiment on Sustainability: A Comprehensive Review and Application of Sentiment Analysis Techniques. Nat. Lang. Process. J. 2024, 8, 100097. [Google Scholar] [CrossRef] [Scilit]
  13. Zhang, Z.; Zhang, L. Investor Attention and Corporate ESG Performance. Financ. Res. Lett. 2024, 60, 104887. [Google Scholar] [CrossRef] [Scilit]
  14. Shuai, Y.; Li, J.; Jiao, J.; Chen, Z. Public Attention and ESG Performance of Solid Waste Disposal Companies: Empirical Evidence from China. Environ. Dev. Sustain. 2025, 13, 1–25. [Google Scholar] [CrossRef] [Scilit]
  15. Fu, Y.; He, L.; Xia, Y.; Liu, R.; Chen, L. Asymmetric Effects of Media Climate Sentiment Divergence on the Volatility of Green and Grey Energy Stocks. Financ. Res. Lett. 2025, 74, 106798. [Google Scholar] [CrossRef] [Scilit]
  16. Wang, W.; Sun, Z.; Wang, W.; Hua, Q.; Wu, F. The Impact of Environmental Uncertainty on ESG Performance: Emotional vs. Rational. J. Clean. Prod. 2023, 397, 136528. [Google Scholar] [CrossRef] [Scilit]
  17. Cheong, T.S.; Liu, S.; Ma, N.; Han, T. The Impact of Public Environmental Concern on Corporate ESG Performance. J. Risk Financ. Manag. 2025, 18, 82. [Google Scholar] [CrossRef] [Scilit]
  18. Ren, X.; Ren, Y. Public Environmental Concern and Corporate ESG Performance. Financ. Res. Lett. 2024, 61, 104991. [Google Scholar] [CrossRef] [Scilit]
  19. Wan, Y.; Hong, Z.; Liu, W.; Cui, J. Executives’ Education: A Catalyst for Enhanced ESG Disclosure. Financ. Res. Lett. 2023, 58, 104429. [Google Scholar] [CrossRef] [Scilit]
  20. Drempetic, S.; Klein, C.; Zwergel, B. The Influence of Firm Size on the ESG Score: Corporate Sustainability Ratings Under Review. J. Bus. Ethics. 2020, 167, 333–360. [Google Scholar] [CrossRef] [Scilit]
  21. Rau, P.R.; Yu, T. A Survey on ESG: Investors, Institutions and Firms. China Financ. Rev. Int. 2024, 14, 3–33. [Google Scholar] [CrossRef] [Scilit]
  22. Verheyden, T.; Eccles, R.G.; Feiner, A. ESG for All? The Impact of ESG Screening on Return, Risk, and Diversification. J. Appl. Corp. Financ. 2016, 28, 47–55. [Google Scholar] [CrossRef] [Scilit]
  23. Ongan, S.; Işık, C.; Aydın, R.; İmamoğlu, İ.K.; Alvarado, R.; Ahmad, M. Measuring Sustainability Under Uncertainty: Introducing Net ESG (N-ESG) Performance. Bus. Strat. Env. 2026, 35, 1735–1755. [Google Scholar] [CrossRef] [Scilit]
  24. Martiny, A.; Taglialatela, J.; Testa, F.; Iraldo, F. Determinants of Environmental Social and Governance (ESG) Performance: A Systematic Literature Review. J. Clean. Prod. 2024, 456, 142213. [Google Scholar] [CrossRef] [Scilit]
  25. D’Amato, V.; D’Ecclesia, R.; Levantesi, S. Fundamental Ratios as Predictors of ESG Scores: A Machine Learning Approach. Decis. Econ. Financ. 2021, 44, 1087–1110. [Google Scholar] [CrossRef] [Scilit]
  26. DasGupta, R. Financial Performance Shortfall, ESG Controversies, and ESG Performance: Evidence from Firms around the World. Financ. Res. Lett. 2022, 46, 102487. [Google Scholar] [CrossRef] [Scilit]
  27. Garcia, A.S.; Mendes-Da-Silva, W.; Orsato, R.J. Sensitive Industries Produce Better ESG Performance: Evidence from Emerging Markets. J. Clean. Prod. 2017, 150, 135–147. [Google Scholar] [CrossRef] [Scilit]
  28. Liu, K.; Wang, J.; Liu, L.; Huang, Y. Mixed-Ownership Reform of SOEs and ESG Performance: Evidence from China. Econ. Anal. Policy 2023, 80, 1618–1641. [Google Scholar] [CrossRef] [Scilit]
  29. Doshi, M.; Jain, R.; Sharma, D.; Mukherjee, D.; Kumar, S. Does Ownership Influence ESG Disclosure Scores? Res. Int. Bus. Financ. 2024, 67, 102122. [Google Scholar] [CrossRef] [Scilit]
  30. Aabo, T.; Giorici, I.C. Do Female CEOs Matter for ESG Scores? Glob. Financ. J. 2023, 56, 100722. [Google Scholar] [CrossRef] [Scilit]
  31. Cucari, N.; Esposito De Falco, S.; Orlando, B. Diversity of Board of Directors and Environmental Social Governance: Evidence from Italian Listed Companies. Corp. Soc. Responsib. Environ. Manag. 2018, 25, 250–266. [Google Scholar] [CrossRef] [Scilit]
  32. Fan, Y.; Li, S.; Yang, W. The Impact of the Percentage of Female Directors on Corporate ESG Score. Financ. Res. Lett. 2024, 63, 105376. [Google Scholar] [CrossRef] [Scilit]
  33. Haque, F. The Effects of Board Characteristics and Sustainable Compensation Policy on Carbon Performance of UK Firms. Br. Account. Rev. 2017, 49, 347–364. [Google Scholar] [CrossRef] [Scilit]
  34. Bai, F.; Shang, M.; Huang, Y. Corporate Culture and ESG Performance: Empirical Evidence from China. J. Clean. Prod. 2024, 437, 140732. [Google Scholar] [CrossRef] [Scilit]
  35. Xiong, Z.; Liu, J.; Yan, F.; Shi, D. Corporate ESG Performance When Neighboring the Environmental Protection Agency. J. Environ. Manag. 2024, 349, 119519. [Google Scholar] [CrossRef] [Scilit] [PubMed]
  36. Duan, D.; Wei, R.; Wang, C.; Xia, B. Opportunity or Obstacle? Climate Risk Disclosure and Corporate ESG Performance. Int. Rev. Econ. Financ. 2025, 100, 104101. [Google Scholar] [CrossRef] [Scilit]
  37. Jang, G.-Y.; Kang, H.-G.; Kim, W. Corporate Executives’ Incentives and ESG Performance. Financ. Res. Lett. 2022, 49, 103187. [Google Scholar] [CrossRef] [Scilit]
  38. Wang, S.; Esperança, J.P. Can Digital Transformation Improve Market and ESG Performance? Evidence from Chinese SMEs. J. Clean. Prod. 2023, 419, 137980. [Google Scholar] [CrossRef] [Scilit]
  39. Zeng, Y.; Zhao, X.; Zhu, Y. Equity Incentives and ESG Performance: Evidence from China. Financ. Res. Lett. 2023, 58, 104592. [Google Scholar] [CrossRef] [Scilit]
  40. Wang, Y. Climate Risk Cognition and Corporate ESG Performance: The Moderating Role of Confucian Culture. Financ. Res. Lett. 2025, 86, 108429. [Google Scholar] [CrossRef] [Scilit]
  41. Yin, L.; Tan, L.; Wu, J.; Gao, D. From Risk to Sustainable Opportunity: Does Climate Risk Perception Lead Firm ESG Performance? Financ. Manag. Acc. 2025, 36, 581–597. [Google Scholar] [CrossRef] [Scilit]
  42. Fang, M.; Nie, H.; Shen, X. Can Enterprise Digitization Improve ESG Performance? Econ. Model. 2023, 118, 106101. [Google Scholar] [CrossRef] [Scilit]
  43. Lu, Y.; Xu, C.; Zhu, B.; Sun, Y. Digitalization Transformation and ESG Performance: Evidence from China. Bus. Strat. Env. 2024, 33, 352–368. [Google Scholar] [CrossRef] [Scilit]
  44. Hu, H.; Tu, Z.; Chen, A.; Huang, J. Enterprises’ Globalization and ESG Performance. Financ. Res. Lett. 2023, 58, 104653. [Google Scholar] [CrossRef] [Scilit]
  45. Liu, X.; Ma, C.; Ren, Y.-S. How AI Powers ESG Performance in China’s Digital Frontier? Financ. Res. Lett. 2024, 70, 106324. [Google Scholar] [CrossRef] [Scilit]
  46. Zhang, C.; Yang, J. Artificial Intelligence and Corporate ESG Performance. Int. Rev. Econ. Financ. 2024, 96, 103713. [Google Scholar] [CrossRef] [Scilit]
  47. Liu, X.; Cifuentes-Faura, J.; Zhao, S.; Wang, L. The Impact of Government Environmental Attention on Firms’ ESG Performance: Evidence from China. Res. Int. Bus. Financ. 2024, 67, 102124. [Google Scholar] [CrossRef] [Scilit]
  48. Gao, D.; Zhou, X.; Wan, J. Unlocking Sustainability Potential: The Impact of Green Finance Reform on Corporate ESG Performance. Corp. Soc. Responsib. Environ. Manag. 2024, 31, 4211–4226. [Google Scholar] [CrossRef] [Scilit]
  49. Li, Y.; Hua, Z. Environmental Protection Tax Law and Corporate ESG Performance. Financ. Res. Lett. 2024, 64, 105423. [Google Scholar] [CrossRef] [Scilit]
  50. Shu, H.; Tan, W. Does Carbon Control Policy Risk Affect Corporate ESG Performance? Econ. Model. 2023, 120, 106148. [Google Scholar] [CrossRef] [Scilit]
  51. Zhang, D.; Meng, L.; Zhang, J. Environmental Subsidy Disruption, Skill Premiums and ESG Performance. Int. Rev. Financ. Anal. 2023, 90, 102862. [Google Scholar] [CrossRef] [Scilit]
  52. Carè, R.; Cerciello, M.; Fatima, R.; Taddeo, S. Simony as Strategy? The Role of Political Contributions in Managing ESG Engagement. J. Environ. Manag. 2025, 378, 124753. [Google Scholar] [CrossRef] [Scilit] [PubMed]
  53. Li, Y.; Zhu, C. Regional Digitalization and Corporate ESG Performance. J. Clean. Prod. 2024, 473, 143503. [Google Scholar] [CrossRef] [Scilit]
  54. Ren, X.; Zeng, G.; Zhao, Y. Digital Finance and Corporate ESG Performance: Empirical Evidence from Listed Companies in China. Pac.-Basin Financ. 2023, 79, 102019. [Google Scholar] [CrossRef] [Scilit]
  55. Truant, E.; Borlatto, E.; Crocco, E.; Bhatia, M. ESG Performance and Technological Change: Current State-of-the-Art, Development and Future Directions. J. Clean. Prod. 2023, 429, 139493. [Google Scholar] [CrossRef] [Scilit]
  56. Chen, Y.; Ren, Y.-S.; Narayan, S.; Huynh, N.Q.A. Does Climate Risk Impact Firms’ ESG Performance? Evidence from China. Econ. Anal. Policy 2024, 81, 683–695. [Google Scholar] [CrossRef] [Scilit]
  57. Bagh, T.; Fuwei, J.; Khan, M.A. From Risk to Resilience: Climate Change Risk, ESG Investments Engagement and Firm’s Value. Heliyon 2024, 10, e26757. [Google Scholar] [CrossRef] [Scilit] [PubMed]
  58. Erhemjamts, O.; Huang, K.; Tehranian, H. Climate Risk, ESG Performance, and ESG Sentiment in US Commercial Banks. Glob. Financ. J. 2024, 59, 100924. [Google Scholar] [CrossRef] [Scilit]
  59. Li, C.; Tang, W.; Liang, F.; Wang, Z. The Impact of Climate Change on Corporate ESG Performance: The Role of Resource Misallocation in Enterprises. J. Clean. Prod. 2024, 445, 141263. [Google Scholar] [CrossRef] [Scilit]
  60. Sun, C.; Pan, C.; Xu, N. Industry-Level Climate Policy Risk Exposure and Corporate ESG Performance. Financ. Res. Lett. 2025, 81, 107542. [Google Scholar] [CrossRef] [Scilit]
  61. Zhao, Y.; Dong, L.; Sun, Y.; Ma, Y.; Zhang, N. Is Air Pollution the Original Sin of Firms? The Impact of Air Pollution on Firms’ ESG Scores. Energy Econ. 2024, 136, 107704. [Google Scholar] [CrossRef] [Scilit]
  62. Chen, K.-X.; Erzurumlu, Y.O.; Gozgor, G.; Lau, C.K.M.; Turkkan, M. The Impact of Economic Uncertainty on Corporate ESG Performance: Global Evidence. Res. Int. Bus. Financ. 2024, 72, 102533. [Google Scholar] [CrossRef] [Scilit]
  63. Bin-Feng, C.; Mirza, S.S.; Ahsan, T.; Qureshi, M.A. How Uncertainty Can Determine Corporate ESG Performance? Corp. Soc. Responsib. Environ. Manag. 2024, 31, 2290–2310. [Google Scholar] [CrossRef] [Scilit]
  64. Jiang, L.; Zhou, W.; Hualiang, W.; Deng, W. Impact of Business Environment Uncertainty on ESG Performance from the Perspective of Resource Supply and Demand Based on ESG Performance. Econ. Anal. Policy 2025, 85, 1012–1030. [Google Scholar] [CrossRef] [Scilit]
  65. You, W.; Kang, H.; Ryu, D. How Do Climate and Market Uncertainties Affect ESG Performance? Financ. Res. Lett. 2025, 86, 108794. [Google Scholar] [CrossRef] [Scilit]
  66. Huang, Q.; Yuan, W.; Zheng, C.; Chen, K.; Chen, X.; Wang, Y.; Li, C. Can Confucianism Improve ESG Performance? Financ. Res. Lett. 2024, 64, 105462. [Google Scholar] [CrossRef] [Scilit]
  67. Feng, J.; Yuan, Y. Green Investors and Corporate ESG Performance: Evidence from China. Financ. Res. Lett. 2024, 60, 104892. [Google Scholar] [CrossRef] [Scilit]
  68. Chithambo, L.; Tingbani, I.; Agyapong, G.A.; Gyapong, E.; Damoah, I.S. Corporate Voluntary Greenhouse Gas Reporting: Stakeholder Pressure and the Mediating Role of the Chief Executive Officer. Bus. Strategy Environ. 2020, 29, 1666–1683. [Google Scholar] [CrossRef] [Scilit]
  69. Yiu, D.W.; Wan, W.P.; Chen, K.X.; Tian, X. Public Sentiment Is Everything: Host-Country Public Sentiment toward Home Country and Acquisition Ownership during Institutional Transition. J. Int. Bus. Stud. 2022, 53, 1202–1227. [Google Scholar] [CrossRef] [Scilit]
  70. Sarkar, R. Public Policy and Corporate Environmental Behaviour: A Broader View. Corp. Soc. Responsib. Environ. Manag. 2008, 15, 281–297. [Google Scholar] [CrossRef] [Scilit]
  71. Benjamin, S.J.; Biswas, P.K.; M Marathamuthu, M.S.; Arunachalam, M. Social Media Sentiments and Firm Value. Appl. Econ. 2022, 54, 2983–2997. [Google Scholar] [CrossRef] [Scilit]
  72. Islam, T.; Arunachalum, M.; Wellalage, N.; Benjamin, S. Corporate Environmental Performance Leading Financial Performance: Impacts of Social Media Sentiment and Corporate Reputation. Bus. Strategy Environ. 2025, 34, 4274–4290. [Google Scholar] [CrossRef] [Scilit]
  73. Nicolas, M.L.D.; Desroziers, A.; Caccioli, F.; Aste, T. ESG Reputation Risk Matters: An Event Study Based on Social Media Data. Financ. Res. Lett. 2024, 59, 104712. [Google Scholar] [CrossRef] [Scilit]
  74. Li, B.; Chan, K.C.C.; Ou, C.; Ruifeng, S. Discovering Public Sentiment in Social Media for Predicting Stock Movement of Publicly Listed Companies. Inf. Syst. 2017, 69, 81–92. [Google Scholar] [CrossRef] [Scilit]
  75. Shi, R.; Shan, W.; Gao, J.; Cheng, C. Public Attention, Investor Sentiment and Stock Markets: Evidence from Chinese Listed Firms. Invest. Anal. J. 2025, 54, 253–274. [Google Scholar] [CrossRef] [Scilit]
  76. Abideen, Z.U. The Moderating Role of Investor Sentiments between Sustainability Reporting and Firm Reputation. Evidence from Chinese Listed Firms. Corp. Soc. Responsib. Environ. Manag. 2025, 32, 138–159. [Google Scholar] [CrossRef] [Scilit]
  77. Cheong, C.W.H.; Sinnakkannu, J.; Ramasamy, S. Reactive or Proactive? Investor Sentiment as a Driver of Corporate Social Responsibility. Res. Int. Bus. Financ. 2017, 42, 572–582. [Google Scholar] [CrossRef] [Scilit]
  78. Kölbel, J.F.; Busch, T.; Jancso, L.M. How Media Coverage of Corporate Social Irresponsibility Increases Financial Risk. Strateg. Manag. J. 2017, 38, 2266–2284. [Google Scholar] [CrossRef] [Scilit]
  79. Luo, Q.; Li, H. Media Sentiment and Corporate R&D Manipulation. Financ. Res. Lett. 2025, 81, 107505. [Google Scholar] [CrossRef] [Scilit]
  80. Wan, D.; Liu, H.; Yang, D.; Li, G. How Does Climate Risk Impact Corporate Green Investment? Evidence from Chinese Listed Firms. J. Environ. Manag. 2025, 396, 128040. [Google Scholar] [CrossRef] [Scilit] [PubMed]
  81. Zhou, B.; Ge, W. ESG in the Headlines: Media-Driven Reputational Risk and Stock Performance. Glob. Financ. J. 2025, 66, 101127. [Google Scholar] [CrossRef] [Scilit]
  82. Hsu, A.W.; Wang, T. Does the Market Value Corporate Response to Climate Change? Omega 2013, 41, 195–206. [Google Scholar] [CrossRef] [Scilit]
  83. Smith, J. Dangerous News: Media Decision Making about Climate Change Risk. Risk Anal. 2005, 25, 1471–1482. [Google Scholar] [CrossRef] [Scilit] [PubMed]
  84. Yan, N.; Xue, Y.; Xu, M.; Sun, Y.; Yang, Y. Sentiment Tendency of ESG Coverage, Public Concern, and Corporate Environmental Performance. Financ. Res. Lett. 2025, 76, 106918. [Google Scholar] [CrossRef] [Scilit]
  85. Chen, Y.; Mai, W. Investor Attention and Environmental Performance of Chinese High-Tech Companies: The Moderating Effects of Media Attention and Coverage Sentiment. Humanit. Soc. Sci. Commun. 2024, 11, 1020. [Google Scholar] [CrossRef] [Scilit]
  86. Li, X.; Tian, Q. Public Perception of Climate Risk, Environmental Image, and Corporate Green Investment. Ann. Am. Assoc. Geogr. 2024, 114, 1137–1155. [Google Scholar] [CrossRef] [Scilit]
  87. Wu, P.; Zhang, C.; Yu, B. From Attention to Action: How Public Environmental Concern Shapes Corporate Green Investment in China. J. Environ. Manag. 2025, 395, 127757. [Google Scholar] [CrossRef] [Scilit] [PubMed]
  88. Debnath, R.; Bardhan, R.; Shah, D.U.; Mohaddes, K.; Ramage, M.H.; Alvarez, R.M.; Sovacool, B.K. Social Media Enables People-Centric Climate Action in the Hard-to-Decarbonise Building Sector. Sci. Rep. 2022, 12, 19017. [Google Scholar] [CrossRef] [Scilit] [PubMed]
  89. Huang, Q.; Lin, M. Do Climate Risk Beliefs Shape Corporate Social Responsibility? Glob. Financ. J. 2022, 53, 100739. [Google Scholar] [CrossRef] [Scilit]
  90. Ozkan, A.; Temiz, H.; Yildiz, Y. Climate Risk, Corporate Social Responsibility, and Firm Performance. Br. J. Manag. 2023, 34, 1791–1810. [Google Scholar] [CrossRef] [Scilit]
  91. Todaro, N.M.; Testa, F.; Daddi, T.; Iraldo, F. The Influence of Managers’ Awareness of Climate Change, Perceived Climate Risk Exposure and Risk Tolerance on the Adoption of Corporate Responses to Climate Change. Bus. Strategy Environ. 2021, 30, 1232–1248. [Google Scholar] [CrossRef] [Scilit]
  92. Dellmuth, L.; Shyrokykh, K. Climate Change on Twitter: Implications for Climate Governance Research. WIREs Clim. Change 2023, 14, e848. [Google Scholar] [CrossRef] [Scilit]
  93. Roxburgh, N.; Guan, D.; Shin, K.J.; Rand, W.; Managi, S.; Lovelace, R.; Meng, J. Characterising Climate Change Discourse on Social Media during Extreme Weather Events. Glob. Environ. Change 2019, 54, 50–60. [Google Scholar] [CrossRef] [Scilit]
  94. Bardos, K.S.; Mishra, D.R.; Somé, H.Y. Firm-Level Climate Sentiments, Climate Politics and Implied Cost of Equity Capital. J. Corp. Financ. 2025, 94, 102846. [Google Scholar] [CrossRef] [Scilit]
  95. Huang, J.; Bu, Y. Who Views What from Whom? Social Media Exposure and the Chinese Public’s Risk Perceptions of Climate Change. Risk Anal. 2025, 45, 4231–4245. [Google Scholar] [CrossRef] [Scilit] [PubMed]
  96. Huynh, T.D.; Xia, Y. Climate Change News Risk and Corporate Bond Returns. J. Financ. Quant. Anal. 2021, 56, 1985–2009. [Google Scholar] [CrossRef] [Scilit]
  97. Serafeim, G. Public Sentiment and the Price of Corporate Sustainability. Financ. Anal. J. 2020, 76, 26–46. [Google Scholar] [CrossRef] [Scilit]
  98. Sun, X.; Li, L.; Shen, Y.; Sheng, Y.; Zhang, D.; Ji, Q. Climate Risk Expressions of Public Views and Government Responses in China. Sci. Data 2025, 12, 877. [Google Scholar] [CrossRef] [Scilit] [PubMed]
  99. Tu, Z.; Cao, Y.; Ma, G.; Goh, M.; Wang, Y. Research on the Impact of Energy Transition Policies on Corporate ESG Performance. J. Environ. Manag. 2025, 392, 126702. [Google Scholar] [CrossRef] [Scilit] [PubMed]
  100. Erzurumlu, Y.O.; Gozgor, G.; Lau, C.K.M.; Soliman, A.M.; Turkkan, M. The Effects of Geopolitical and Political Risks on Corporate ESG Practices. J. Environ. Manag. 2025, 386, 125747. [Google Scholar] [CrossRef] [Scilit] [PubMed]
  101. Ortas, E.; Gallego-Álvarez, I.; Álvarez, I. National Institutions, Stakeholder Engagement, and Firms’ Environmental, Social, and Governance Performance. Corp. Soc. Responsib. Environ. Manag. 2019, 26, 598–611. [Google Scholar] [CrossRef] [Scilit]
  102. Ji, Q.; Nie, S. How Does Local Government Fiscal Pressure Affect Corporate ESG Performance? Financ. Res. Lett. 2024, 64, 105478. [Google Scholar] [CrossRef] [Scilit]
  103. Leng, A.; Sun, Y. The Impact Mechanism and Breakthrough Path of COVID-19 on Enterprise Financial Distress: Evidence from China. Econ. Anal. Policy 2024, 82, 16–31. [Google Scholar] [CrossRef] [Scilit]
  104. Cipollone, P.; Rosolia, A. Social Interactions in High School: Lessons from an Earthquake. Am. Econ. Rev. 2007, 97, 948–965. [Google Scholar] [CrossRef] [Scilit]
  105. Nunn, N.; Qian, N. US Food Aid and Civil Conflict. Am. Econ. Rev. 2014, 104, 1630–1666. [Google Scholar] [CrossRef] [Scilit]
  106. Gurin, P.; Dey, E.; Hurtado, S.; Gurin, G. Diversity and Higher Education: Theory and Impact on Educational Outcomes. Harv. Educ. Rev. 2002, 72, 330. [Google Scholar] [CrossRef] [Scilit]
  107. Welch, K.; Yoon, A. Do High-Ability Managers Choose ESG Projects That Create Shareholder Value? Evidence from Employee Opinions. Rev. Account. Stud. 2023, 28, 2448–2475. [Google Scholar] [CrossRef] [Scilit]
  108. Chen, Y.; Cui, C.; Yang, T.; Zhang, X. Political Favouritism and Investment Efficiency. Pac.-Basin Financ. J. 2020, 61, 101058. [Google Scholar] [CrossRef] [Scilit]
  109. Keulemans, S.; Van De Walle, S. Cost-Effectiveness, Domestic Favouritism and Sustainability in Public Procurement: A Comparative Study of Public Preferences. Int. J. Public Sect. Manag. 2017, 30, 328–341. [Google Scholar]
  110. Tang, W.; Wang, Y.; Wu, J. Local Favoritism in China’s Public Procurement: Information Frictions or Incentive Distortion? J. Urban Econ. 2025, 145, 103716. [Google Scholar] [CrossRef] [Scilit]
  111. Liu, Y.; Dong, K.; Nepal, R.; Afi, H. How Do Climate Risks Affect Corporate ESG Performance? Micro Evidence from China. Res. Int. Bus. Financ. 2025, 76, 102855. [Google Scholar] [CrossRef] [Scilit]
Figure 1. Marginal effect of CREPVI on corporate ESG performance (Executive Education).
Sustainability 18 08404 g001
Figure 2. Marginal effect of CREPVI on corporate ESG performance (Local Protectionism).
Sustainability 18 08404 g002
Table 1. Definitions and Descriptive Statistics of Main Variables.
(1)(2)(3)(4)(5)(6)
TypeVariableDefinitionCountMeansdMinMax
Dependent variablesESGFirms’ ESG performance, which comprises three pillars: environmental, social, and governance15,77373.3974.76648.93090.930
Independent variableCREPVIClimate risk expressions of public views index15,7732.9185.0860.00026.119
Control variablesROATotal corporate profit/total corporate assets15,7730.0390.066−0.2250.202
TobinQTotal corporate market value/total corporate assets15,7732.1571.3410.8748.195
SizeThe logarithm of total firm assets15,77322.1031.20417.64127.638
CashflowNet corporate cash flow15,7730.0150.076−0.2130.411
LevTotal corporate debt/total corporate assets15,7730.3790.1890.0500.875
GrowthAnnual growth rate of firms’ sales revenue15,7730.1360.334−0.4851.856
IndustryGDP share of the secondary industry of the city firm located (%)15,77338.93010.29115.83063.910
PopulationThe logarithm of the population of the city firm located15,7736.4760.6393.0088.136
GDPThe logarithm of the GDP of the city firm located15,77311.6854.0455.25219.605
Table 2. Pairwise correlations between the dependent variables and the control variables.
CREPVIROATobinQSizeCashflowLevGrowthIndustryPopulationGDP
CREPVI1.000
ROA−0.048 ***1.000
TobinQ−0.015 *0.157 ***1.000
Size0.055 ***0.040 ***−0.288 ***1.000
Cashflow0.0120.130 ***0.0020.262 ***1.000
Lev−0.038 ***−0.385 ***−0.198 ***0.452 ***0.055 ***1.000
Growth−0.0120.291 ***0.100 ***0.074 ***0.144 ***0.049 ***1.000
Industry−0.488 ***0.038 ***−0.007−0.052 ***−0.0090.030 ***0.0061.000
Population0.419 ***−0.0010.0110.019 **0.020 **−0.049 ***0.003−0.572 ***1.000
GDP−0.148 ***0.0050.092 ***−0.037 ***−0.024 ***0.0030.040 ***0.029 ***0.123 ***1.000
Note: ***, **, and * indicate significance at the 1%, 5%, and 10% levels, respectively.
Table 3. Results of baseline regressions.
(1)(2)(3)(4)(5)(6)(7)(8)
ESGESGESGESG
CREPVI0.0451 ***0.0678 **0.0442 *0.00160.0410 ***0.0626 **0.0432 *−0.0009
(3.03)(2.47)(1.86)(0.10)(2.83)(2.33)(1.81)(−0.06)
ROA 1.8466 *−0.16533.3988 **2.6503 **
(1.92)(−0.13)(2.37)(1.98)
TobinQ −0.0990 **−0.0730−0.0662−0.0954
(−2.18)(−1.05)(−1.00)(−1.47)
Size 1.1006 ***1.8521 ***1.1207 ***0.8909 ***
(6.60)(7.03)(4.57)(4.15)
Cashflow −0.5417−0.9502−2.4317 ***1.0304 *
(−1.26)(−1.26)(−3.57)(1.89)
Lev −4.9981 ***−2.5149 ***0.4153−9.6467 ***
(−8.63)(−2.88)(0.48)(−12.23)
Growth −0.4179 ***−0.8254 ***0.0397−0.3324*
(−3.38)(−4.86)(0.21)(−1.90)
GDP −0.5348−0.9742−0.13190.0623
(−1.24)(−1.52)(−0.24)(0.12)
Industry −0.0101−0.00190.0337−0.0485 *
(−0.52)(−0.07)(1.17)(−1.86)
Population 1.7921 ***3.6867 ***1.1810−0.2071
(3.13)(4.50)(1.53)(−0.30)
Constant72.9282 ***59.2786 ***71.1604 ***81.1261 ***49.7969 ***14.638640.2645 ***67.6765 ***
(626.09)(368.11)(402.48)(466.02)(6.05)(1.22)(4.01)(7.09)
Firm EffectYESYESYESYESYESYESYESYES
Year EffectYESYESYESYESYESYESYESYES
Observations15,77315,77315,77315,77315,77315,77315,77315,773
Adjust R-squared0.01750.08990.12070.04390.04030.10490.12580.0747
Notes: ***, **, and * indicate significance at the 1%, 5%, and 10% levels, respectively. Parentheses are t-statistics. Standard errors are clustered at the firm level.
Table 4. Results of robustness tests.
(1)(2)(3)
Controlling for City-Level Fixed EffectsExcluding the Impact of the COVID-19 Lagging the Independent Variable
CREPVI0.0337 **0.0410 ***
(2.20)(2.83)
L.CREPVI 0.0270 *
(1.81)
Constant27.0122 ***49.7969 ***59.4666 ***
(3.51)(6.05)(6.73)
ControlsYESYESYES
Year effectYESYESYES
Firm effectNOYESYES
City effectYESNONO
Observations15,77315,77311,162
Adjust R-squared0.19260.04030.0567
Notes: ***, **, and * indicate significance at the 1%, 5%, and 10% levels, respectively. Parentheses are t-statistics. Standard errors are clustered at the firm level.
Table 5. Excluding the possibility of Reverse Causality (Disaster).
(1)(2)
First-StageTwo-Stage
CREPVIESG
Disaster0.0227 ***
(4.84)
CREPVI 0.6029 **
(1.98)
Kleibergen–Paap Wald rk F statistic 23.42
Cragg-Donald Wald F statistic 43.37
Stock-Yogo 10% 16.38
ControlsYESYES
Firm EffectYESYES
Year EffectYESYES
Observations13,74713,747
Notes: *** and ** indicate significance at the 1% and 5% levels, respectively. Parentheses are t-statistics. Standard errors are clustered at the firm level.
Table 6. Mediation Analysis.
(1)(2)
DisclosureESG
CREPVI0.0024 ***0.0396 ***
(2.84)(2.73)
Disclosure 0.5595 ***
(3.00)
Sobel 0.0214 ***
(2.83)
Constant0.196649.6870 ***
(0.36)(5.99)
ControlsYESYES
Firm EffectYESYES
Year EffectYESYES
Observations15,77315,773
Adjust R-squared0.02280.0412
Notes: *** indicates significance at the 1% level. Parentheses are t-statistics. For the Sobel test, the value reported in parentheses is the Sobel (Z)-statistics. Standard errors are clustered at the firm level.
Table 7. Different impact of CREPVI in firms with different ownership.
Panel A: State-Owned Enterprises
(1)(2)(3)(4)
ESGESG
CREPVI−0.0102−0.04740.0098−0.0256
(−0.40)(−1.04)(0.22)(−0.94)
Constant56.3581 ***13.329560.0023 **78.7738 ***
(3.70)(0.50)(2.47)(3.20)
ControlsYESYESYESYES
Firm EffectYESYESYESYES
Year EffectYESYESYESYES
Observations3630363036303630
Adjust R-squared0.07610.12140.21580.0492
Panel B: Non-State-Owned Enterprises
ESGESG
CREPVI0.0772 ***0.1362 ***0.0548 *0.0256
(4.37)(3.99)(1.88)(1.35)
Constant46.4789 ***12.948635.2266 ***66.3263 ***
(5.03)(0.93)(3.11)(6.34)
ControlsYESYESYESYES
Firm EffectYESYESYESYES
Year EffectYESYESYESYES
Observations12,14312,14312,14312,143
Adjust R-squared0.04020.10460.09970.0876
Notes: ***, **, and * indicate significance at the 1%, 5%, and 10% levels, respectively. Parentheses are t-statistics. Standard errors are clustered at the firm level.
Table 8. Cross group test of CREPVI in firms with different ownership.
(1)(2)(3)
ESGES
CREPVI0.00930.00650.0751 **
(0.44)(0.17)(2.06)
Non_SOE−0.8338 **−1.2434 **−0.1767
(−2.18)(−2.13)(−0.33)
CREPVI × Non_SOE0.0547 **0.0966 **−0.0532
(2.20)(2.07)(−1.29)
Constant50.6005 ***15.900640.1584 ***
(6.16)(1.33)(4.00)
ControlsYESYESYES
Firm EffectYESYESYES
Year EffectYESYESYES
Observations15,77315,77315,773
Adjust R-squared0.04140.10620.1260
Notes: *** and ** indicate significance at the 1% and 5% levels, respectively. Parentheses are t-statistics. Standard errors are clustered at the firm level.
Table 9. Different impact of CREPVI in firms with different geographical location.
Panel A: West
(1)(2)(3)(4)
ESGESG
CREPVI0.03460.0266−0.04540.0631
(1.12)(0.56)(−1.01)(1.66)
Constant17.8567−17.4891−51.4298 *72.9285 **
(0.81)(−0.65)(−1.81)(2.58)
ControlsYESYESYESYES
Firm EffectYESYESYESYES
Year EffectYESYESYESYES
Observations1718171817181718
Adjust R-squared0.04440.13080.17240.0971
Panel B: East
ESGESG
CREPVI0.1189 ***0.1443 ***0.1883 ***0.0418
(3.72)(2.94)(4.10)(0.97)
Constant61.1411 ***22.255866.7638 ***73.5692 ***
(5.05)(1.17)(4.87)(5.72)
ControlsYESYESYESYES
Firm EffectYESYESYESYES
Year EffectYESYESYESYES
Observations12,33112,33112,33112,331
Adjust R-squared0.03860.10420.11860.0738
Panel C: Central
ESGESG
CREPVI0.03750.0855−0.0252−0.0011
(0.99)(1.28)(−0.37)(−0.02)
Constant23.430315.994727.757337.4059
(1.15)(0.44)(0.81)(1.29)
ControlsYESYESYESYES
Firm EffectYESYESYESYES
Year EffectYESYESYESYES
Observations1724172417241724
Adjust R-squared0.07980.09480.16500.0707
Notes: ***, **, and * indicate significance at the 1%, 5%, and 10% levels, respectively. Parentheses are t-statistics. Standard errors are clustered at the firm level.
Table 10. Cross group test of CREPVI in firms with different geographical location.
(1)(2)(3)
ESGES
CREPVI0.0322 **0.0528 *0.0293
(2.12)(1.85)(1.17)
Eastern0.54000.1155−0.7385
(0.71)(0.07)(−0.55)
CREPVI × Eastern0.0947 ***0.1047 **0.1462 ***
(2.92)(1.98)(3.08)
Constant49.8808 ***14.783640.5649 ***
(6.03)(1.23)(4.03)
ControlsYESYESYES
Firm EffectYESYESYES
Year EffectYESYESYES
Observations15,77315,77315,773
Adjust R-squared0.04130.10540.1266
Notes: ***, **, and * indicate significance at the 1%, 5%, and 10% levels, respectively. Parentheses are t-statistics. Standard errors are clustered at the firm level.
Table 11. Regression results for the moderating effect of executive educational background.
(1)(2)(3)(4)
ESGESG
CREPVI0.0353 **0.0533 **0.0413 *−0.0069
(2.53)(2.03)(1.75)(−0.46)
Edu−0.0148−0.0144−0.07090.0668
(−0.28)(−0.17)(−0.90)(1.07)
CREPVI × Edu0.0273 ***0.0450 ***0.00940.0289 ***
(4.42)(3.65)(0.97)(4.25)
Constant50.3648 ***15.576640.4387 ***68.2819 ***
(6.15)(1.31)(4.05)(7.14)
ControlsYESYESYESYES
Firm EffectYESYESYESYES
Year EffectYESYESYESYES
Observations15,77315,77315,77315,773
Adjust R-squared0.04240.10730.12580.0760
Notes: ***, **, and * indicate significance at the 1%, 5%, and 10% levels, respectively. Parentheses are t-statistics. Standard errors are clustered at the firm level.
Table 12. Regression results for the moderating effect of local protectionism.
(1)(2)(3)(4)
ESGESG
CREPVI0.0477 ***0.0705 ***0.0514 **0.0033
(3.24)(2.60)(2.12)(0.21)
Protection0.7359 ***1.0407 ***0.7153 **0.5900 *
(3.24)(2.91)(1.99)(1.96)
CREPVI × Protection−0.0885 *−0.0771−0.1350 *−0.0356
(−1.91)(−0.99)(−1.82)(−0.61)
Constant50.0604 ***15.478740.0678 ***68.1239 ***
(6.07)(1.28)(3.96)(7.12)
ControlsYESYESYESYES
Firm EffectYESYESYESYES
Year EffectYESYESYESYES
Observations15,77315,77315,77315,773
Adjust R-squared0.04220.10620.12660.0751
Notes: ***, **, and * indicate significance at the 1%, 5%, and 10% levels, respectively. Parentheses are t-statistics. Standard errors are clustered at the firm level.
Disclaimer/Publisher’s Note: The statements, opinions and data contained in all publications are solely those of the individual author(s) and contributor(s) and not of MDPI and/or the editor(s). MDPI and/or the editor(s) disclaim responsibility for any injury to people or property resulting from any ideas, methods, instructions or products referred to in the content.