1. Introduction
Urban areas face compounding environmental challenges that directly affect human health and quality of life, including the urban heat island effect, air pollution, flooding, and degraded water quality caused by increased stormwater runoff. The uncertainty of climate change, chronic underinvestment in infrastructure, and a legacy of persistent poverty and spatial inequity exacerbate these problems [
1].
In response, Nature-Based Solutions (NBS) have emerged as a key strategy in urban sustainability planning [
2,
3,
4,
5]. NBS are multifunctional, nature-based approaches to address interconnected social, economic, and environmental challenges such as climate change, food insecurity, and biodiversity loss [
6,
7,
8]. The term NBS is frequently described as “an umbrella concept,” in that it integrates a variety of approaches which provide sustainable benefits for human well-being and ecosystem services such as green infrastructure, and blue-green infrastructure, ecosystem-based adaptation/mitigation, and eco-engineering [
2,
3,
6,
8].
NBS in urban areas include large-scale interconnected networks of parks, greenbelts, and wetlands. It also encompasses smaller, site-scale green infrastructure practices such as trees, green roofs, green façades, and permeable pavements. These interventions have become central elements of the sustainability planning and climate adaptation efforts of many cities due to their ability to provide ecological services, including microclimate regulation, air quality improvements, habitat, and stormwater management [
9,
10,
11,
12,
13,
14]. In some cases, these practices provide an alternative to traditional engineering approaches while simultaneously delivering multiple ecosystem services and aesthetic benefits, even in dense urban areas where available land is scarce or expensive [
9,
15,
16].
Municipalities wanting to address urban environmental concerns urgently need mechanisms to evaluate, incentivize, and/or require the creation of NBS to achieve widespread implementation [
17]. Progress has been made in developing a wide variety of theoretical frameworks, planning and modeling tools for sustainable development and landscapes [
18,
19,
20,
21,
22,
23,
24]. Fewer theoretical metrics exist for green infrastructure, NBS, or addressing urban environmental concerns through decentralized landscape improvements given the complexity and site-specific nature of these strategies [
17,
25,
26,
27]. As Juhola [
21] (p. 255) articulates: “less attention has been paid to the use of these tools in actual planning cases and there is a lack of cases assessing their use in cities.” As cities increasingly seek to encourage green infrastructure on private property, they rely on community-based development initiatives; market-based strategies like financial incentives for ecosystem services; or ‘green law’—the body of legal code, ordinances and legislation used to address sustainability concerns within urban landscapes [
19].
1.1. Performance-Based Zoning
Recently, performance-based land-use planning approaches have been identified as a “new paradigm” for promoting NBS because these strategies can account for and reward multifunctionality and while remaining flexible enough for application in complex urban systems [
6,
28,
29]. Performance-based zoning functions differently than traditional Euclidean zoning, which relies on defined land uses (like commercial and residential) and prescribed interventions. Traditional Euclidean regulatory systems are highly consistent, easy to manage, and provide predictable outcomes [
28]. However, these prescriptive planning regulations can be narrow in scope, lack flexibility, and limit adaptation within complex and rapidly changing social-ecological and economic systems. These limitations can become an obstacle to urban transformation and regeneration [
30].
Performance-based zoning functions differently: “potential development is assessed against predetermined standards (performance measurement) that set quantitative limits on acceptable levels of use” [
30] (p. 396). Early performance-based planning applications in the 1950s included standards to control the negative impacts of industry such as noise, smoke, odor, and fire hazard, and predated most environmental protection laws and even the creation of the US Environmental Protection Agency [
31]. However, applications have expanded to residential and commercial properties and can address a range of local needs. Performance measures including thresholds of safety, carrying capacity, and environmental quality can be used to assess safety margins, politically acceptable levels of risk, or simply the establishment of community character. Kendig et al. (1980), for instance, proposed an approach to protect environmentally sensitive areas and preserve open space by regulating the intensity of development based upon four variables: open space ratio, impervious surface ratio, floor area ratio, and density [
32].
Jaffe’s (1993) critical reassessment of performance-based zoning warned that this is a “wonderfully seductive land use control technique” for planners for whom it is “an alluring symbol of better land use regulation” and scientific management of urban problems [
31] (p. 9). That same review article generally frames performance zoning as an inadequate and disappointing regulatory enigma, with “painfully” little case law behind it [
31]. While some communities fully adopted performance zoning to replace traditional Euclidean zoning, few “pure” performance-based approaches have been implemented, and even fewer remain in use. Subsequent evaluations suggest that many of the jurisdictions ultimately abandoned performance-based planning because of the administrative burden required and that “the purported advantages of this type of planning are rarely achieved in practice” [
33] (p. 239).
More commonly, hybrid performance-based systems are used, which often layer prescriptive or subjective standards (aspects of performance zoning) upon activity-based zones as per traditional zoning practice. These systems are implemented either through policy overlays or by applying performance standards within traditional zoning districts. Their form ranges from point systems developed to rate appropriate land uses to land use compatibility assessments designed to meet environmental, agricultural, or open space standards [
30].
The sparse academic literature on performance-based zoning highlights a profound lack of critical, empirical studies of this method in practice, especially given the wide variety of forms and applications of the approach, including differences between stand-alone and hybrid systems. This gap in rigorous assessment was identified as early as 1980, but continues to characterize the literature [
28,
29,
30,
31,
32,
33]. Much of the existing work relies on qualitative assessments and expert opinion derived from consultants’ reports or other practice-oriented literature [
30], which may lack a critical perspective or context surrounding application and decision-making or is theoretical in nature [
28]. A better understanding of the administration, implementation, and governance of performance-based zoning regulations is therefore required to inform decisions around NBS.
1.2. The Green Area Ratio (GAR)
Throughout the 1980s, German academics innovated a variety of hybrid performance-based zoning strategies to promote the widespread adoption of more ecological site design [
34]. One of these instruments, the
Biotopflächenfaktor (translated here as Green Area Ratio, GAR), has been used in the city of Berlin (Germany) since 1997 [
34,
35]. In a remarkable international transfer of policy practice, Berlin’s model has been adapted and implemented by at least eight other major cities in Europe, Asia, and North America, under different names (
Table 1). DC specifically identifies Berlin, Malmö, and Seattle as inspirations for its GAR framework [
36].
Generally, the GAR requires the integration of NBS into the site design of private development though a flexible score-based framework composed of three adaptable, interconnected components: (1) a defined menu of Best Management Practices (BMPs) with multipliers based on relative environmental performance; (2) score requirements for different zoning districts; and (3) the final score achieved for each property lot (
Table 2) [
34]. The first two GAR components are established by municipal planners and determine the scope and stringency of the regulation. Developing BMP categories and assigning multipliers is time-intensive and reflects local environmental priorities, but it also creates the basis for streamlined compliance and regulatory review, addressing known challenges of performance-based zoning. GAR Score Requirements must also reflect differences in the built environment and implementation costs. The Final GAR Score is calculated by the developer during site design by multiplying the area of each selected BMP by its assigned multiplier, summing these weighted values, and dividing the result by the total lot area (
Figure 1). The achieved GAR score must meet or exceed the minimum target score set by planners [
34].
While most GAR systems follow a similar calculation, each city has adapted Berlin’s original framework, in some cases modifying environmental priorities, BMP categories, multipliers, and score requirements. Early adopters like Malmö, Seattle, and Seoul generally created relatively simple instruments similar to Berlin’s, where planners developed multipliers for eight BMPs based on their contribution to five environmental services [
34,
38,
40,
42]. Seattle created a more differentiated list of BMPs and multipliers—for instance, for green roofs of different substrate depth—to account for differential environmental benefits of these systems [
39]. Malmö’s Green Space Factor (GSF) is further supplemented with the Green Point system, which requires developers to include 10 out of 35 possible ecological features ranging from building bird boxes at a 1:1 ratio to apartments; feeding birds year-round; and composting all biodegradable waste [
37]. More recent adopters, including Oslo, Melbourne and Helsinki, have generally adopted more complex frameworks, although some remain voluntary. Melbourne and Helsinki created a wider and more differentiated list of BMPs (a total of 35 and 40, respectively) [
42,
48]. Melbourne’s system allows for all 35 vegetative BMPs to be further evaluated based on their contribution of eight ecosystem services ranging from habitat provision to air purification [
46].
The variation in GAR applications among these cities illustrates an inherent tension within performance-based zoning, namely the challenge of creating a simple and flexible framework while incorporating a growing science-based understanding of the multiple benefits provided by NBS. Cities seeking to maximize the effectiveness of these regulations face an additional challenge. The literature on GAR applications is currently limited to discussions of regulatory framework development and administration. The authors are currently unaware of any available, systematic assessment of implementation outcomes from a similar metric in any municipality.
1.3. Contributions of This Study
This study presents an empirical evaluation of the implementation and effectiveness of the Green Area Ratio (GAR), a hybrid performance-based zoning regulation for sustainable landscapes, in Washington, DC between 2015 and 2025. This analysis used more than a decade of regulatory plan approval records to address a significant gap in the literature, as the implementation outcomes of performance-based zoning regulations designed to promote NBS have rarely been assessed post implementation [
21,
49].
The specific goals of this effort, then, are to (1) characterize the implementation of the GAR regulation in Washington, DC; (2) identify trends in GAR BMP selection and examine their relationship to parcel-level attributes, including zoning district, lot area and GAR Score Requirement; and (3) assess policy interactions on properties subject to both GAR and Stormwater Management requirements to better understand the differential impact of these complementary regulations.
Collectively, these analyses provide an evidence base to inform future refinement of the GAR in Washington, DC, contribute one of the first empirical evaluations of an implemented performance-based zoning regulation, and support broader efforts to integrate NBS into urban planning and climate resilience strategies.
2. Materials and Methods
Through a Data Sharing and Use Agreement, this study utilized regulatory plan approval records extracted from DC’s Surface and Groundwater System, which has tracked compliance, approvals, and approved BMP implementation data for both GAR and SWMP regulatory programs since 2015. Prior to analysis, the dataset was cleaned to remove duplicate site records; verify approval dates; and reconcile inconsistent formatting across reporting years.
Categorical variables required additional harmonization because zoning classifications, GAR applicability designations, GAR score Requirements, BMP names, and reporting fields evolved over the study period. Standardization included consolidating equivalent zoning subcategories, aligning historical zoning designations with current classifications where appropriate, verifying GAR Score Requirements against applicable zoning regulations, and ensuring BMP classifications were applied consistently across all reporting years. Fewer than 30 records lacking approval confirmation, key identifiers, or sufficient information to verify regulatory status were excluded from the analysis.
The GAR dataset of all approvals between January 2015 and June 2025 included: (1) property characteristics, including parcel address, lot area, zoning district, and approval date; (2) regulatory compliance data; including GAR Score Requirements, Final GAR Score, GAR BMPs used for compliance, bonuses, and approved stormwater controls; and (3) selected environmental context variables [
50].
All analyses were conducted using approved plan records and therefore evaluate BMP adoption and planned implementation rather than post-construction performance. Two methodological decisions were particularly important for this analysis: (1) aggregating zoning districts and GAR BMPs into broader categories and (2) utilizing BMP occurrence data (presence and absence binary categories) rather than BMP area for statistical analyses. The rationale for these decisions is described below.
DC zoning districts and GAR BMPs were grouped into categories to satisfy chi-square test assumptions, specifically to avoid expected cell frequencies below five, and to improve interpretability of results. In each case, functionally similar zoning districts and BMPs were aggregated while less common or dissimilar types were assigned to an “Other” category. Lot areas were also grouped into size quintiles for comparative analyses. The eleven DC’s zoning districts with GAR applicability were condensed into seven classifications reflecting comparable land-use intent while preserving meaningful distinctions in development form as follows: (1) Residential; (2) Mixed-Use; (3) Neighborhood Mixed-Use; (4) Downtown, (5) Commercial (including Capitol Gateway); (6) Production, Distribution, and Repair; and the (7) “Other” category, which included the remaining four zones with fewer than 30 GAR properties designated.
For the analysis of GAR BMP implementation, the 19 eligible BMPs plus three bonuses within the GAR framework were consolidated into six broader categories. BMPs were grouped according to their primary environmental or regulatory function within the GAR framework. This approach reduced analytical complexity while preserving distinctions between major implementation strategies as follows: (1) landscaping areas, including soils of various depths and planting media; (2) plantings, including groundcover and shrub layer vegetation; (3) tree planting and preservation of various sized trees; (4) stormwater controls, green infrastructure practices commonly used for stormwater management; (5) other, including renewable energy generation and approved water features; and (6) bonuses, including the use of native plants.
For the statistical analyses, two of the broad categories were disaggregated to evaluate differences in BMP selection patterns. Specifically, vegetated walls were separated from other planting categories, while the five stormwater controls were disaggregated into three categories: bioretention, green roofs (extensive and intensive) and permeable pavements (with depths below and above 24 inches). This level of categorization balanced statistical requirements with the need to reveal meaningful differences in BMP utilization and site application.
The GAR and SWMP interaction analyses utilized a broader dataset of Stormwater BMP plan approvals between January 2015 and August 2025. Properties were categorized as: (1) GAR-only, with no SWMP requirements, (2) SWMP-only, with no GAR requirements, and (3) GAR&SWMP, which are subject to both regulations.
Finally, the decision to use BMP occurrence data (presence and absence binary categories) instead of BMP area for statistical analyses was driven by two factors. First, BMPs are quantified using different measurement approaches within GAR. While most practices are measured by area, others–including trees, plantings, and vegetated walls–are credited using unit counts or equivalent surface area values as defined in the GAR Guidebook, confounding direct comparisons of BMP area across all BMPs. Second, parcel sizes varied substantially across the dataset (ranging from 50 to 113,536 m2), creating the potential for a small number of very large sites to dominate area-based analyses.
The use of occurrence data is conceptually similar to the ecological concept of richness, applied when data about rare or sensitive species may be obscured or skewed by the overwhelming presence of a few dominant species [
51]. Similarly, this analysis of BMP area would be dominated by the largest sites, potentially obscuring BMP selection patterns on smaller properties that meet regulatory requirements with substantially less BMP area. In this way, the simplification of GAR plan approval data to binary occurrence categories allowed for a comparison of BMP selection patterns across lot sizes. Because sites may contain multiple BMPs, totals across grouped BMP categories may exceed the total number of properties in the dataset.
Spatial analysis was performed in ArcGIS Pro 3.3.0 (Esri, Redlands, CA, USA) and utilized DC data sets shared in alignment with the June 2025 Data Sharing and Use Agreement. The Average Nearest Neighbor (ANN) Analysis was used to determine patterns of spatial clustering or dispersion based on the Observed Mean Distance (OMD), the average distance between each GAR property point and its closest neighbor, and the Expected Mean Distance (EMD), an average for an identical number of points (1329) randomly distributed across the same space [
52]. This analysis relied on geocoded GAR project addresses. The analysis used Euclidean distance and generated a report of the OMD, EMD, Nearest Neighbor Ratio, z-score,
p-value, and results for the point distribution.
To further identify the clustering of GAR properties, the Kernel Density Estimation (KDE) calculated the density of the input features, in this case the 1329 address points, around each output cell with a smoothing parameter that spreads the point value over an area using a circular neighborhood definition and Gaussian distribution [
53,
54]. The input parameters used for this test were: Population Field: None; Output cells: 1 m; Search Radius: 869.25 m (default calculation: modified Silverman’s equation); Area: Sq_km; Output Value: Densities; Method: Planar. The resulting KDE raster was then reclassified to set all zero values to null and the results displayed were symbolized in 7 classes using natural breaks (jenks) [
55].
Chi-square goodness of fit tests and Cramer’s V tests, followed by pairwise Z-tests with Bonferroni correction as appropriate, were performed to determine if significant associations exist between variables. These tests were conducted in Python 3.12. (Python Software Foundation, Beaverton, Oregon, USA) [
56,
57] using the NumPy (1.26.4), SciPy (1.14.1), and Statmodels libraries (0.14.4) [
58,
59,
60]. Statistical test assumptions were consistently met.
3. Results
3.1. The GAR in DC: Development and Regulatory Applicability
The introduction of GAR marked a significant shift in DC’s approach to environmental regulation. Previously, environmental requirements within DC’s zoning framework were largely limited to permeable surface requirements in low-density residential zones, which emphasized open space rather than ecological performance [
61]. Provisions often relied on practices such as turf grass, mulched groundcover, or elevated decks over nominally “permeable” areas, many of which provided limited hydrologic or ecological function. These provisions remain in place for low-density residential zones, while GAR establishes additional environmental performance requirements in higher-density zoning districts, where impervious cover and development intensity are greater, and where opportunities for environmental landscape integration are both more limited and more impactful.
The GAR was developed by DC’s Office of Planning, in collaboration with the District Department of the Environment (later renamed the Department of Energy and Environment (DOEE)). It was officially adopted on 12 July 2013, as part of DC’s 2013 comprehensive zoning update to create environmental performance requirements for moderate- and high-density zoning districts [
61]. The adoption of the GAR was driven by the desire to create broader, more “integrated environmental requirements for landscape elements and site design that contribute to the reduction in stormwater runoff, the improvement of air quality, and the mitigation of the urban heat island effect” [
61] (p. 8). Over time, even broader goals were associated with the requirement, including “greater livability, ecological function, green space accessibility and climate adaptation in the urban environment,” which are in line with increasing city attention to climate change adaptation, broader sustainability goals, and the role of NBS in addressing these issues [
36] (p. 1).
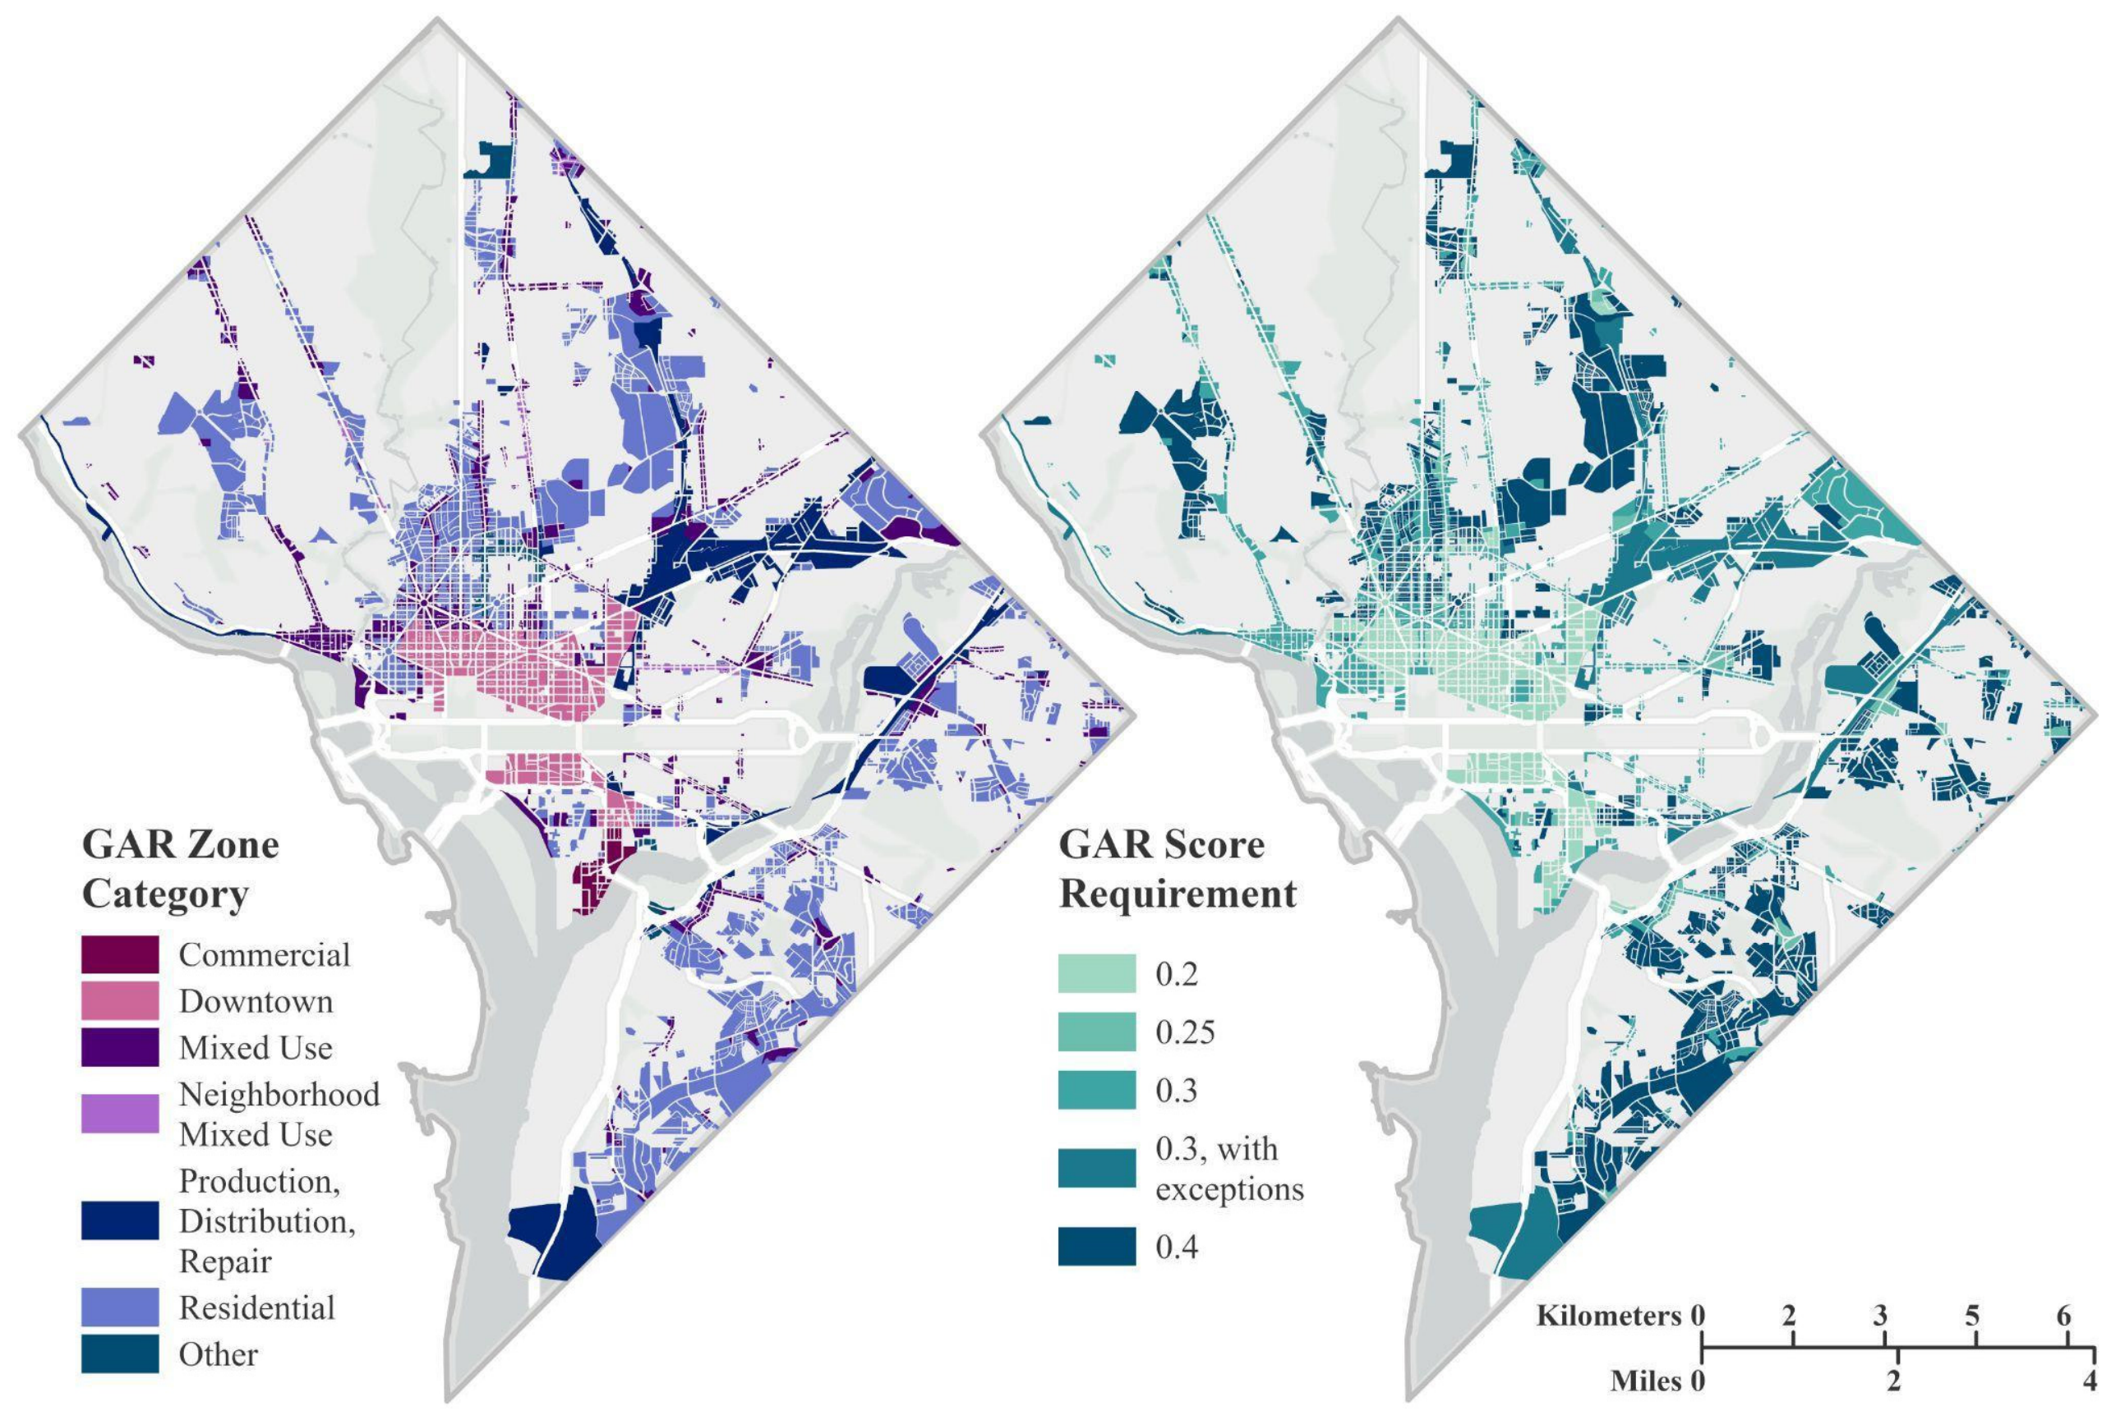
GAR applies to qualifying projects in designated zoning districts that meet applicable regulatory thresholds and require a Certificate of Occupancy as part of DC’s zoning and building permit process (
Figure 2). Compliance is evaluated during the building permit process for new construction projects, additions, and substantial renovations that exceed defined thresholds of building value [
36]. Subsequent regulatory amendments in March 2016 and the publication of the GAR Guidebook in 2017 further refined its framework [
36,
62].
Applicants must demonstrate that proposed BMPs achieve or exceed the minimum GAR score for the applicable zoning district using a standardized GAR Scoresheet (
Figure 2 and
Table 3) [
36]. GAR plans are then submitted through the Department of Buildings (DOB) as part of zoning and building permit review. Administration of the GAR regulation involves coordination among multiple agencies. DOEE conducts technical GAR plan review and post-construction inspection as part of the zoning compliance process, while the Zoning Administrator retains authority over GAR applicability and zoning compliance [
36]. DOB issues the Certificate of Occupancy following completion of applicable permit and zoning compliance requirements, including GAR where required. This administrative structure reflects GAR’s intersection with zoning, environmental compliance, and building permitting.
3.2. The GAR as a Performance-Based Zoning Regulation
In DC, property owners, designers, and developers select combinations of BMPs (in DC, called Landscape Elements) based on site constraints, costs, and design objectives. At the same time, the use of multipliers ensures that different BMPs—most of which are NBS strategies—are weighted according to their relative environmental benefit, as determined by planners, to meet required GAR scores (
Table 3). Trees and plantings are credited using unit-based equivalent areas, while landscaped areas and stormwater control features are measured by area [
36].
Table 3.
Washington, DC’s GAR BMPs by Category, including Bonuses, Multipliers, Equivalent area for plants and trees, and SWMP applicability. Adapted from DC’s GAR Guidebook [
36].
Table 3.
Washington, DC’s GAR BMPs by Category, including Bonuses, Multipliers, Equivalent area for plants and trees, and SWMP applicability. Adapted from DC’s GAR Guidebook [
36].
| BMP Categories | GAR BMPs | Equivalent m2 * | Multiplier | SWMP
Applicability |
|---|
| Landscaping areas | Landscaped areas with a soil depth < 24″ | | 0.3 | |
| Landscaped areas with a soil depth ≥ 24″ | | 0.6 | |
| Enhanced tree growth systems | | 0.4 | |
| Plantings | Groundcover and grasses < 2′ height | 0.09 | 0.2 | |
| Shrubs and Herbaceous Perennials ≥ 2′ height | 0.83 | 0.3 | |
| Vegetated wall, plantings on a vertical surface | | 0.6 | |
| Tree Planting and Preservation | New trees < 40-foot canopy spread | 4.65 | 0.5 | X |
| New trees > 40-foot canopy spread | 23.23 | 0.6 | X |
| Tree Preservation 6″ to 12″ DBH | 23.23 | 0.7 | X |
| Tree Preservation 12″ to 18″ DBH | 55.74 | 0.7 | X |
| Tree Preservation 18″ to 24″ DBH | 120.77 | 0.7 | X |
| Tree Preservation 24″ DBH or greater | 185.81 | 0.8 | X |
| Stormwater Controls | Bioretention facilities | | 0.4 | X |
| Green Roofs 2–8″ of growth medium | | 0.6 | X |
| Green Roofs ≥ 8″ of growth medium | | 0.8 | X |
| Permeable pavement < 24″ gravel | | 0.4 | X |
| Permeable pavement ≥ 24″ gravel | | 0.5 | X |
| Other | Renewable energy generation | | 0.5 | |
| Approved water features | | 0.2 | |
| Bonuses | Native Plant Species | | 0.1 | |
| Landscaping in food cultivation | | 0.1 | |
| Harvested stormwater irrigation | | 0.1 | X |
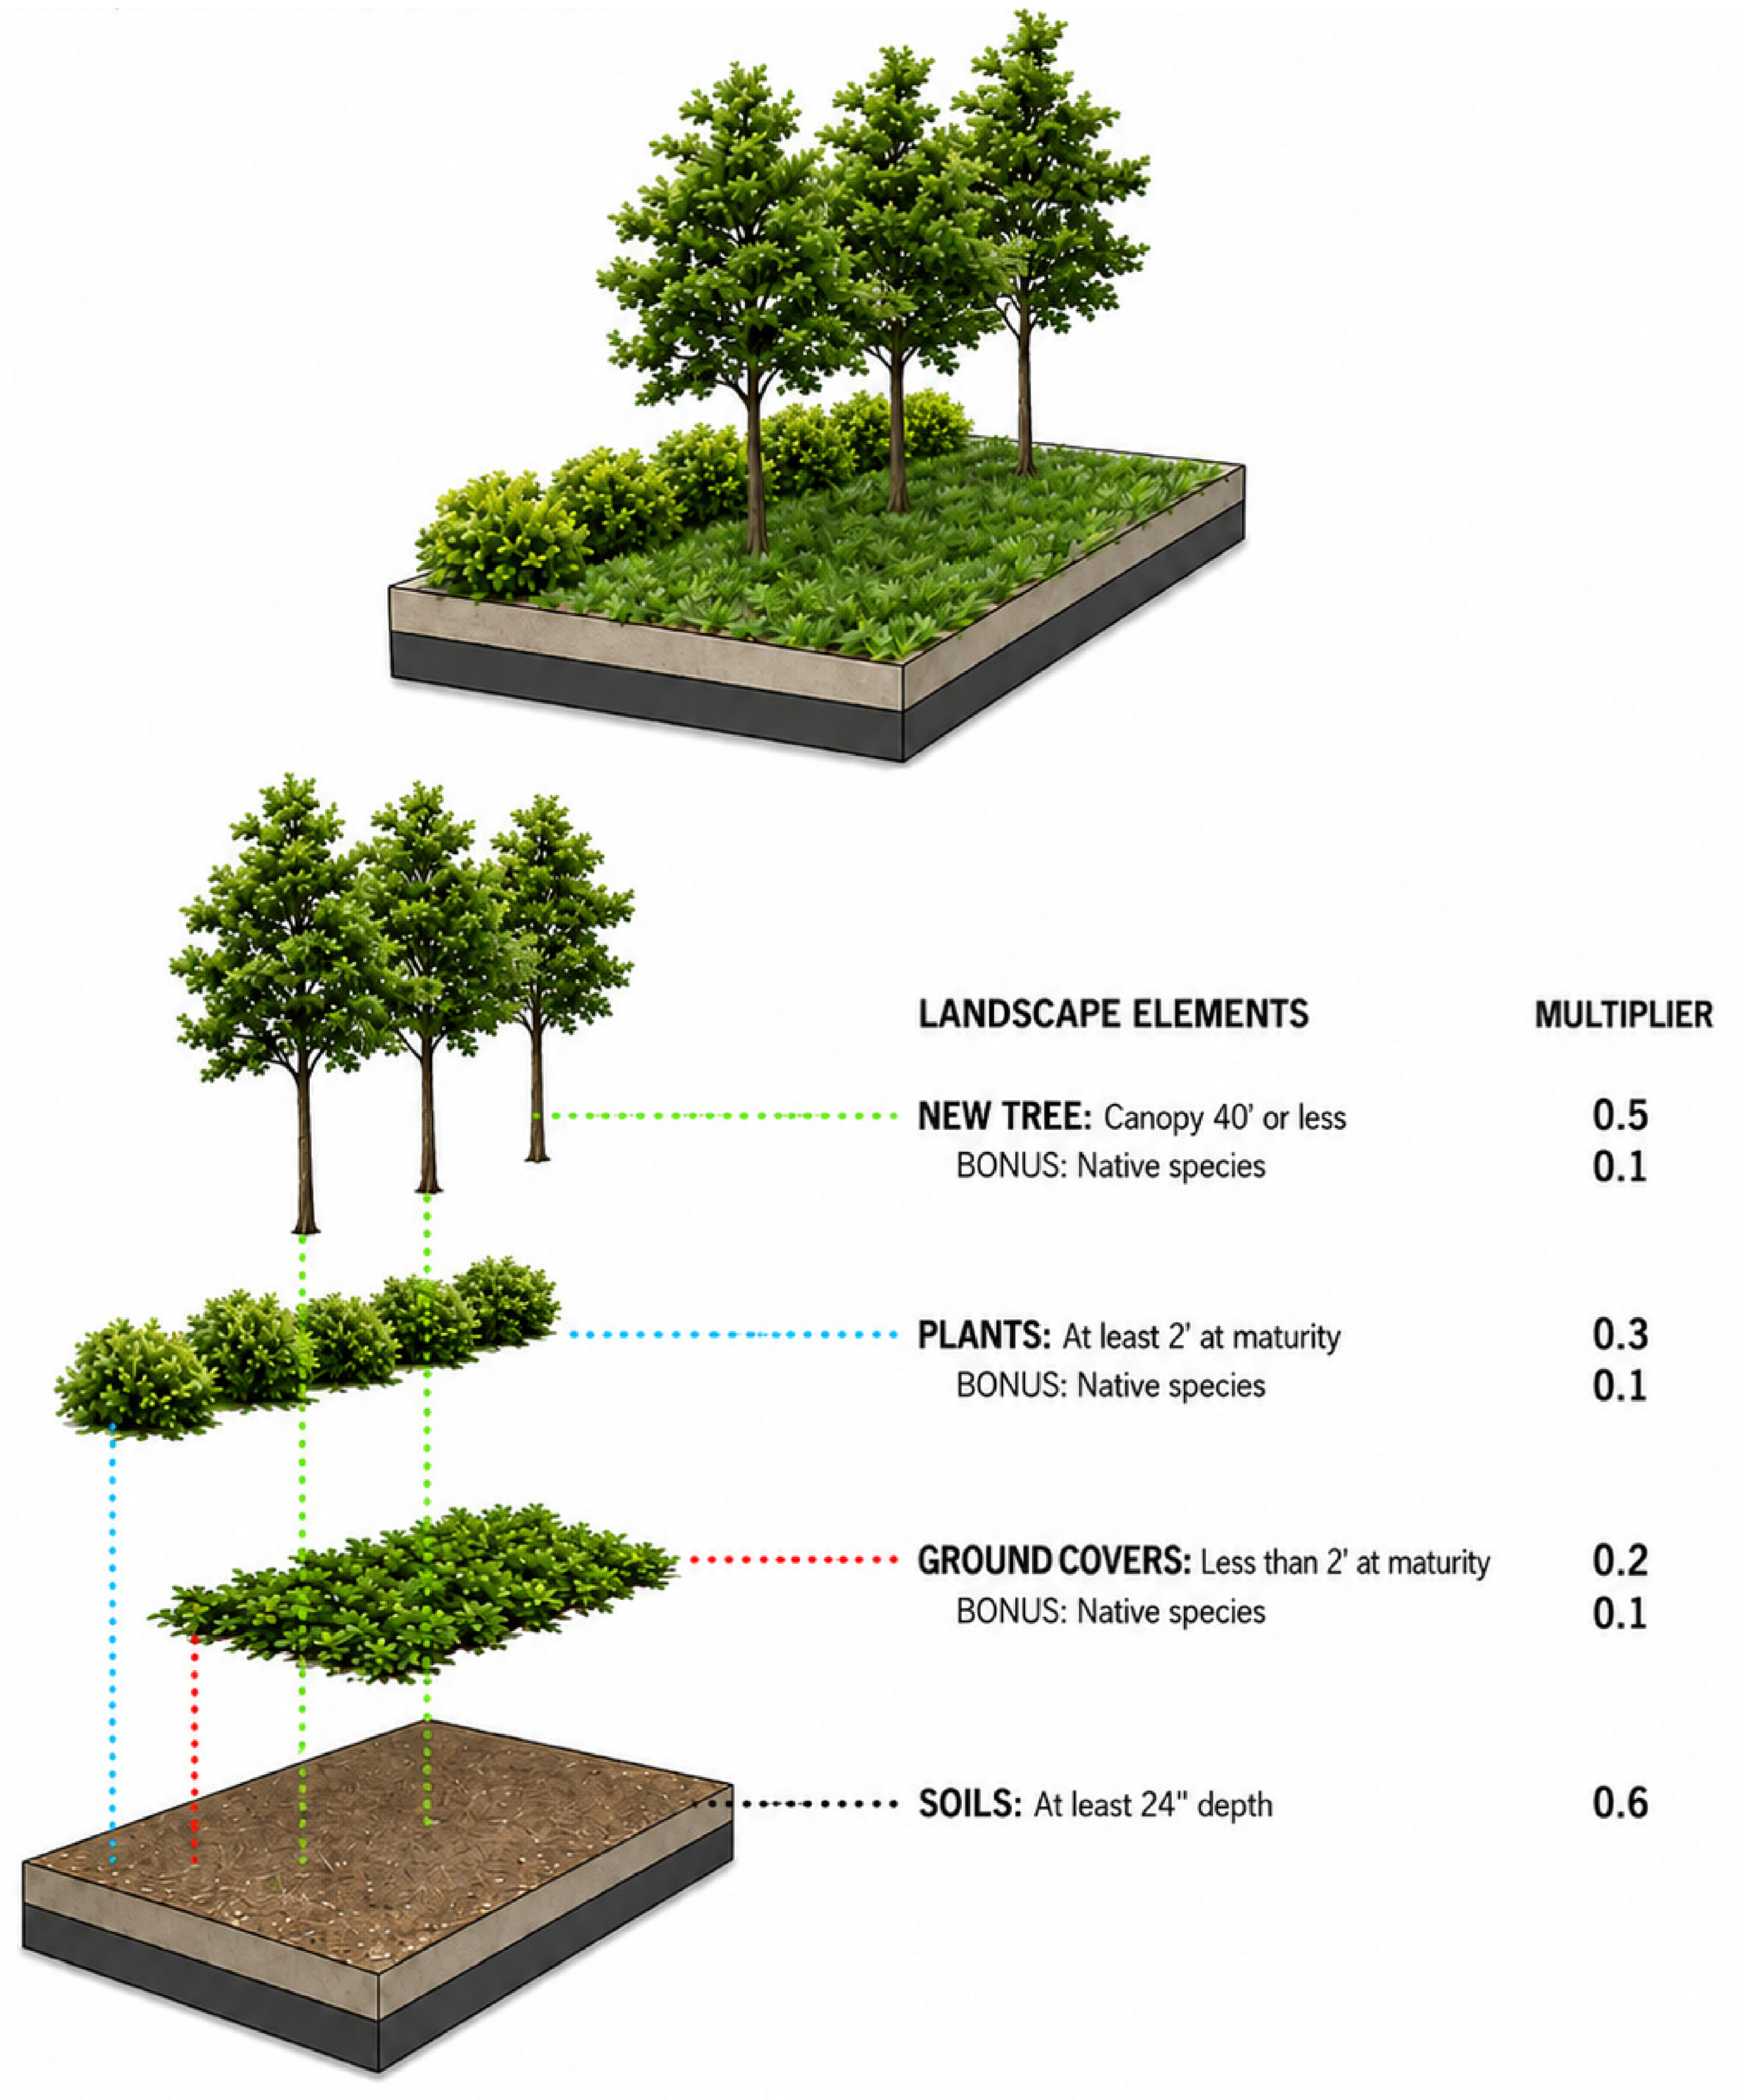
A key feature of DC’s GAR framework is that many BMPs are stackable, allowing multiple practices to occupy the same footprint while contributing cumulatively to the Final GAR Score. For example, a single area may simultaneously include deep soils, groundcovers, shrubs, and tree canopy, each of which is credited separately (
Figure 3). DC’s GAR also includes bonuses, such as the use of native plant species or harvested stormwater irrigation, which provide additional credit toward the Final GAR Score. This approach reflects both the multifunctional and three-dimensional nature of ecological systems and enables multiple landscape elements to contribute to GAR compliance within limited urban space.
3.3. GAR and Stormwater Management Regulatory Framework in DC
The year 2013 marked not just the adoption of the GAR, but also updates to DC’s stormwater regulations, which require Stormwater Management Plans (SWMPs) for projects meeting applicable regulatory thresholds, including projects with 464.5 m
2 (5000 ft
2) or more of land disturbance. These regulations mandate on-site retention of the 3 cm (1.2-inch) storm event for major land-disturbing activities and the 2 cm (0.8-inch) storm event for major substantial improvements [
64].
While some BMPs (bioretention, green roofs, permeable pavements, and trees) are included in both the SWMP and GAR regulatory frameworks, these regulations differ in their objectives, structure, triggers, and design incentives (
Table 4). SWMP regulations focus primarily on stormwater retention and water quality performance, while the GAR operates as a zoning regulation, assigning performance multipliers to a diverse set of landscape BMPs intended to reflect broader environmental benefits (
Table 3). SWMP regulations are triggered through defined land-disturbance and substantial-improvement criteria and rely on prescriptive engineering standards to achieve specific runoff reduction targets. In contrast, GAR applicability is determined by zoning, project type, and different development thresholds (thus including some properties below the SWMP threshold of 464.5 m
2). Further, the GAR’s flexible, performance-based framework allows developers to meet requirements through a variety of landscape strategies. As a result, some properties are subject to SWMP requirements, others to GAR, and a subset must comply with both.
3.4. GAR Uptake and Distribution of Regulated Sites
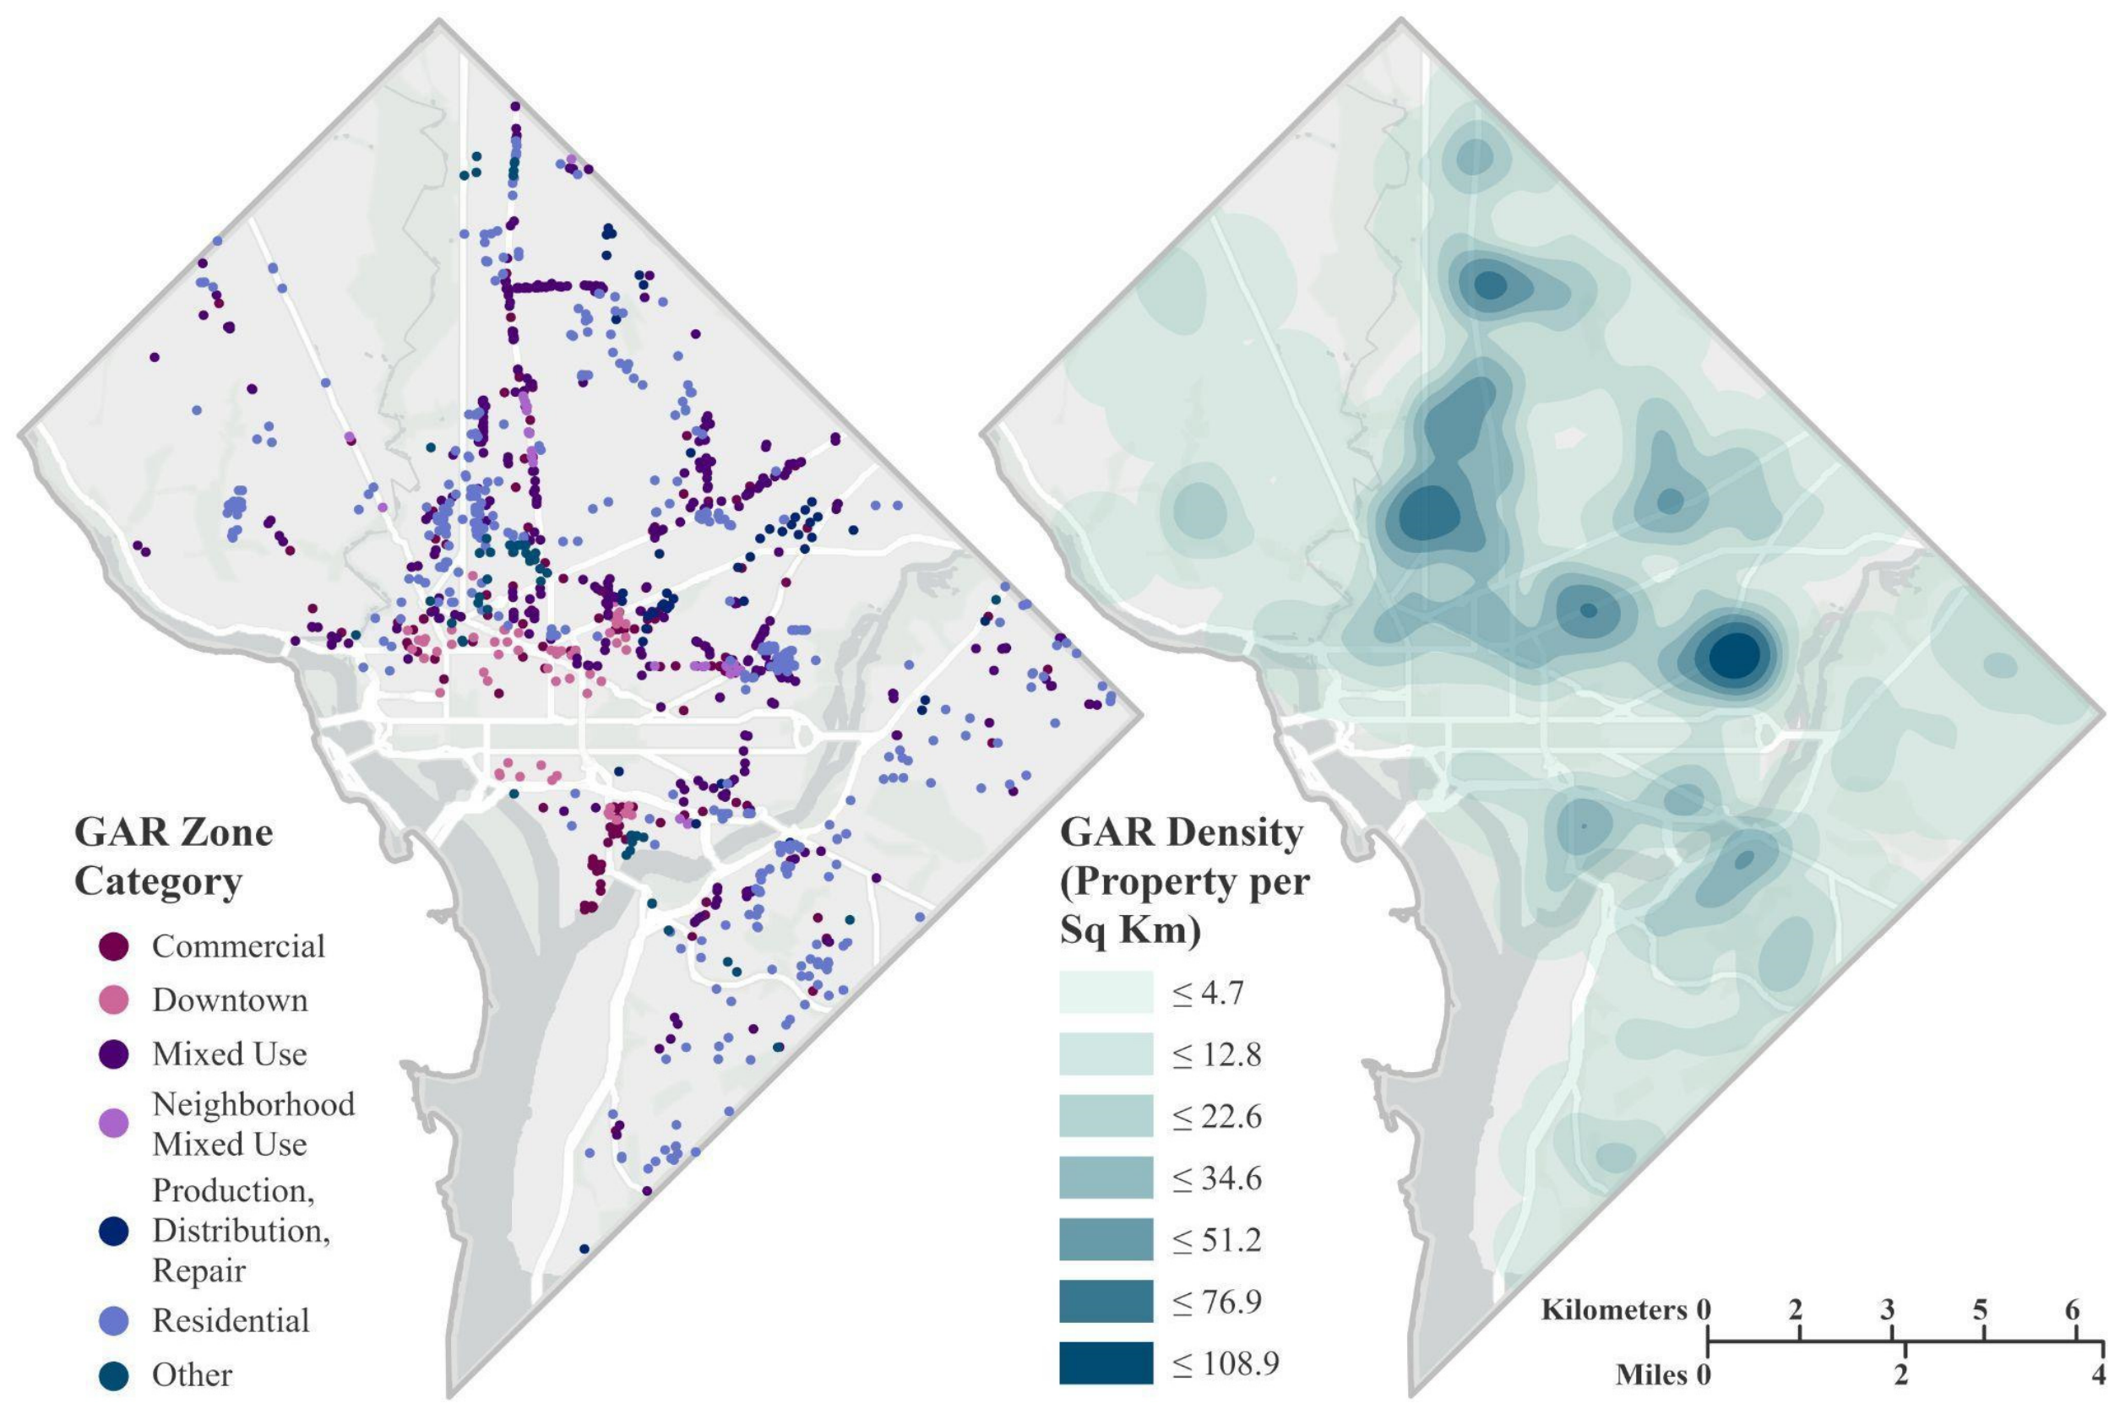
Between January 2015 and June 2025, a total of 1329 GAR-regulated plans were approved, representing slightly more than a decade of regulatory implementation. Trends in the number of GAR plan approvals and their distribution reflect new development, additions, and major renovation projects within the GAR-regulated zoning districts of the city (
Figure 4).
A Nearest Neighbor Analysis of the spatial distribution of GAR-regulated properties revealed spatial clustering, with a Nearest Neighbor Ratio of 0.38 (
z = −43.15,
p < 0.001). Moreover, the kernel density map (
Figure 4) reveals two primary concentrations of GAR-regulated properties: one extending north of downtown generally along the 16th Street-Georgia Avenue corridor, and a second following the H Street Corridor east of downtown, with the highest density located northwest of Kingman Park. This distribution has important implications for understanding the GAR as a regulatory instrument. GAR implementation in DC is shaped by zoning applicability and redevelopment activity rather than by direct spatial targeting of environmental needs. As a result, the regulation embeds NBS requirements into private development where qualifying projects occur, but it does not necessarily prioritize areas with the greatest heat vulnerability, flood risk, tree canopy deficits, or other socio-environmental burdens.
To better understand implementation patterns, this study further examined GAR compliance in relation to three property attributes: zone, property lot area, and GAR Score Requirement. Most approved GAR-regulated properties occurred within Residential and Mixed-Use zones, which together account for approximately three-quarters of all approved sites (
Table 4). In contrast, relatively few GAR-regulated sites were in Production, Distribution, and Repair zones or specialized zoning districts such as Downtown, Waterfront, or Arts zones.
Property lot size distributions also varied by zoning context (
Table 5). Mixed-Use zone properties were represented across all lot sizes but skewed toward smaller and mid-sized lots, reflecting the prevalence of corridor redevelopment and moderate-scale infill projects. Residential zones were also represented across all lot sizes but notably included a substantial share of the largest sites. In contrast, Commercial, Downtown, and Production, Distribution, and Repair zones were concentrated in the two largest lot-size quintiles, reflecting the large lot area configurations typical of these districts. These differences in zoning distribution and parcel size provide important context for the BMP selection patterns examined in the following sections.
3.5. GAR Score Requirements and Compliance Margins
GAR Score Requirements were concentrated in two principal thresholds: 0.3 and 0.4, which applied to 46% and 37% of all regulated properties, respectively (
Table 6). Lower requirements of 0.2 accounted for a smaller but still notable share of sites, while score thresholds of 0.25 were relatively uncommon.
GAR Score Requirements were strongly associated with zoning districts (
Table 6). Properties with a 0.4 requirement were heavily concentrated in Residential zones, which represent 97% of all sites subject to that threshold. Further demonstrating this connection, 93% of all Residential properties were assigned a 0.4 requirement. Similarly, properties with a 0.3 GAR Score Requirement were concentrated in Mixed-Use Zones, which represent 65% of all sites in the 0.3 category, while 89% of all Mixed-Use properties were subject to a 0.3 requirement. Lower score requirements are more prevalent in high-density commercial areas. Approximately 76% of properties with a 0.2 GAR requirement were located in either Commercial or Downtown zones. Properties with a GAR Score Requirement of 0.25 were relatively rare and dispersed across multiple zoning categories. These patterns show that GAR Score Requirements are not distributed evenly across the regulatory landscape; rather, they are closely tied to zoning classifications and the development forms associated with those zones.
Relationships between GAR Score Requirements and property lot size were less pronounced (
Table 7). While each score threshold is represented across all lot sizes, some patterns emerged: the score requirement of 0.2 was more prevalent for moderately large and large properties, the score requirement of 0.3 was distributed across all lot sizes but most prevalent in the smallest properties, whereas the score requirement of 0.4 was also broadly distributed but with highest prevalence among the middle lot-size quintiles.
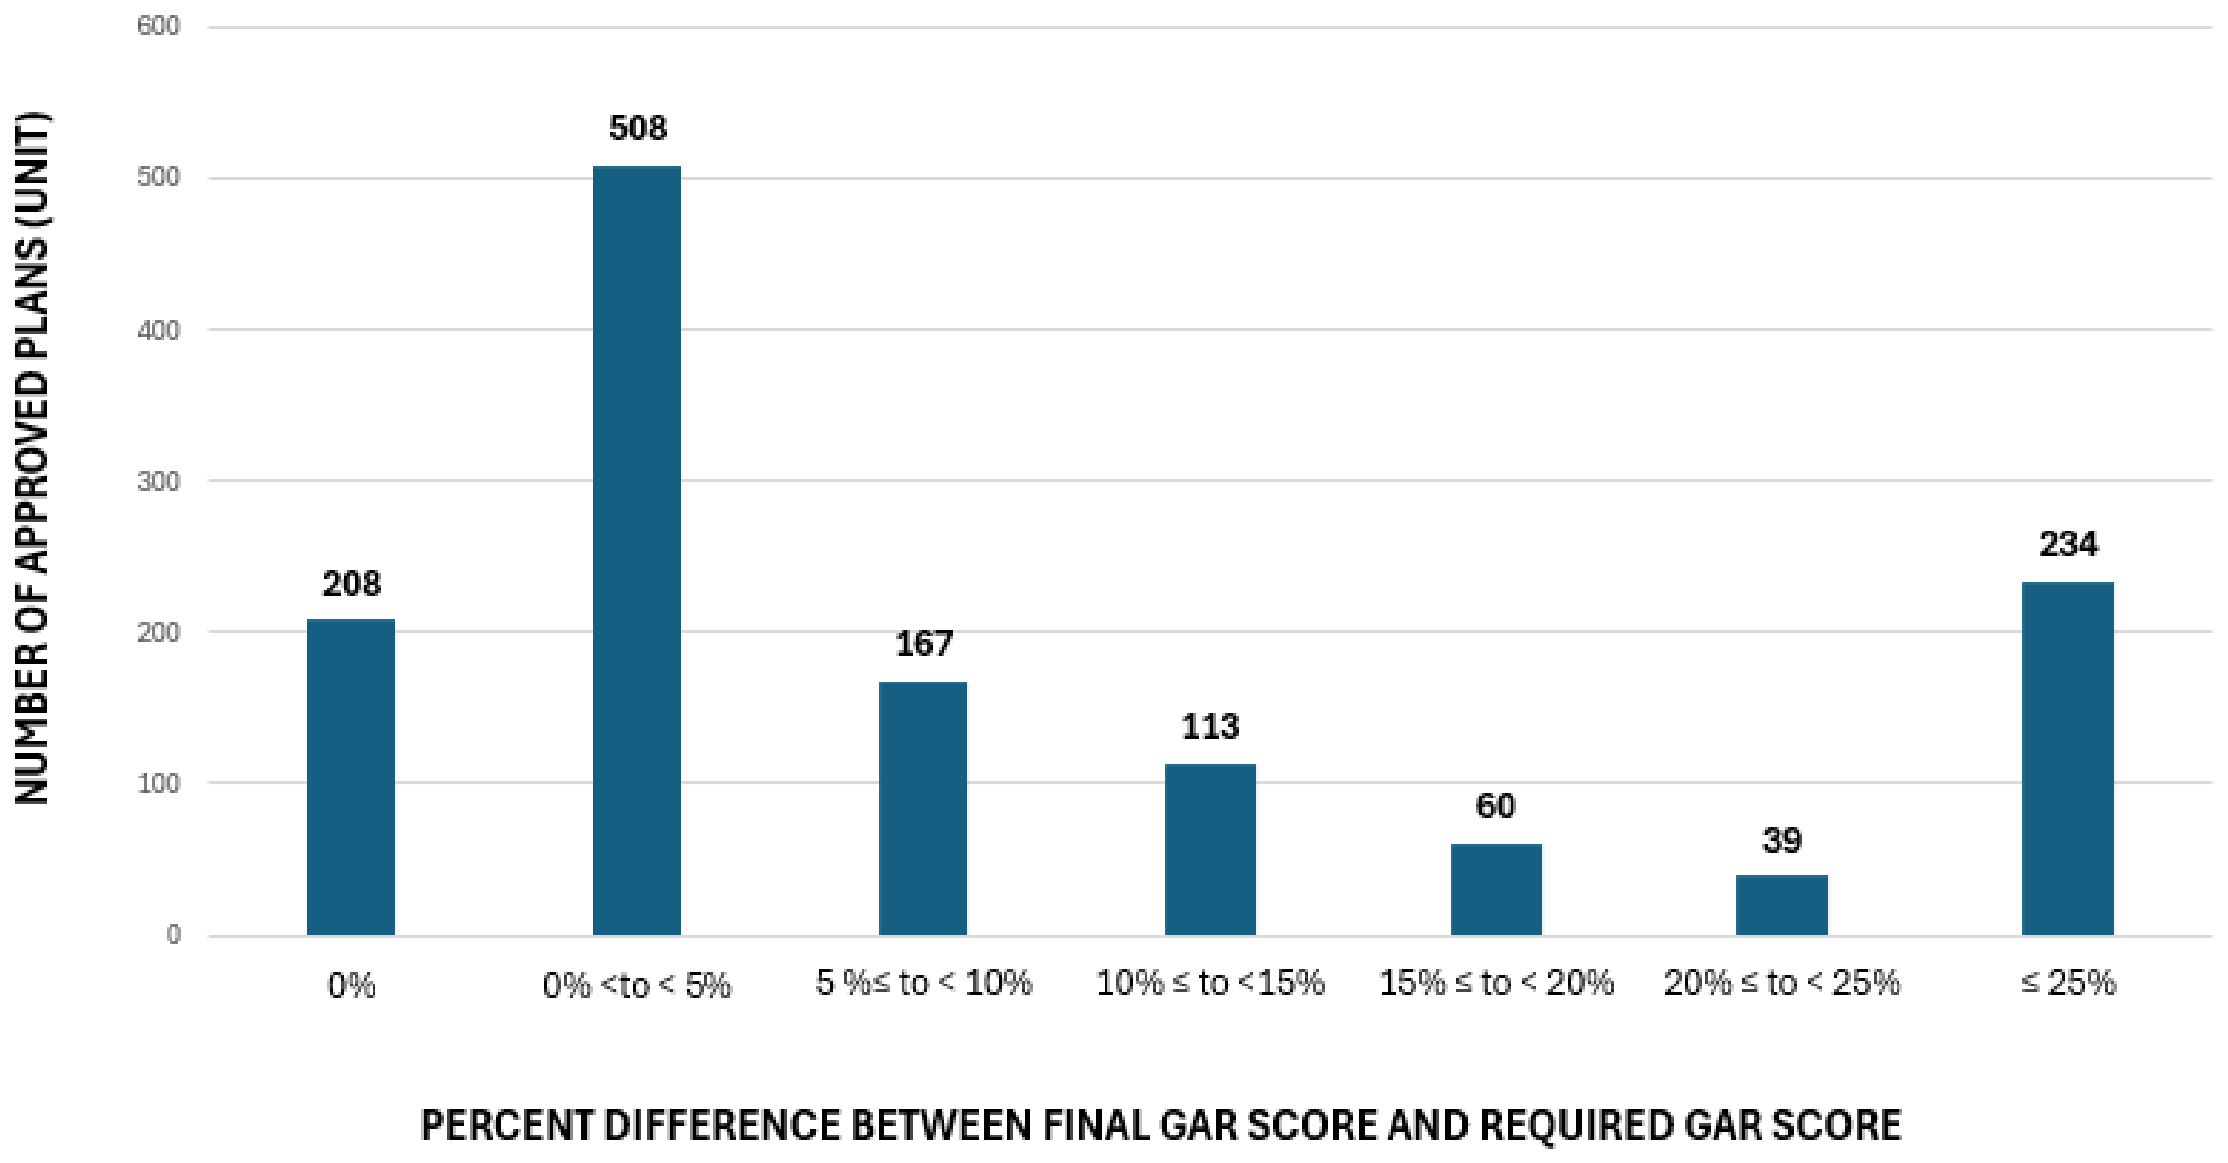
Approved plans were also evaluated based on the extent to which Final GAR Scores exceeded the minimum required threshold (
Figure 5). Although approved GAR scores must always meet or exceed the required minimum GAR target score, most clustered close to the minimum: 208 properties (16%) achieved scores that just met the requirement, while an additional 508 properties (38%) exceeded the threshold by less than 5%. Only 234 properties (18%) exceeded their GAR Score Requirement by more than 25%.
This clustering near minimum thresholds suggests that developers generally optimize compliance rather than pursue substantially higher GAR Scores. Thus, GAR’s strength as a regulatory instrument is currently to establish a predictable floor for NBS inclusion for new development. Further, the GAR is not currently designed to incentivize or even recognize exceptional NBS adoption beyond the required minimum. In this way, the GAR lies in contrast with voluntary landscape sustainability frameworks like the SITES v2 Rating System, which offers certification for different levels of achievement [
66]. Finally, because most projects cluster near the required GAR threshold, the regulation’s environmental outcomes depend heavily on the calibration of GAR Score Requirements, eligible BMPs, and multipliers, and whether these remain aligned with evolving priorities related to urban resilience, biodiversity, stormwater, heat mitigation, and environmental equity.
3.6. BMP Selection Within the GAR Framework
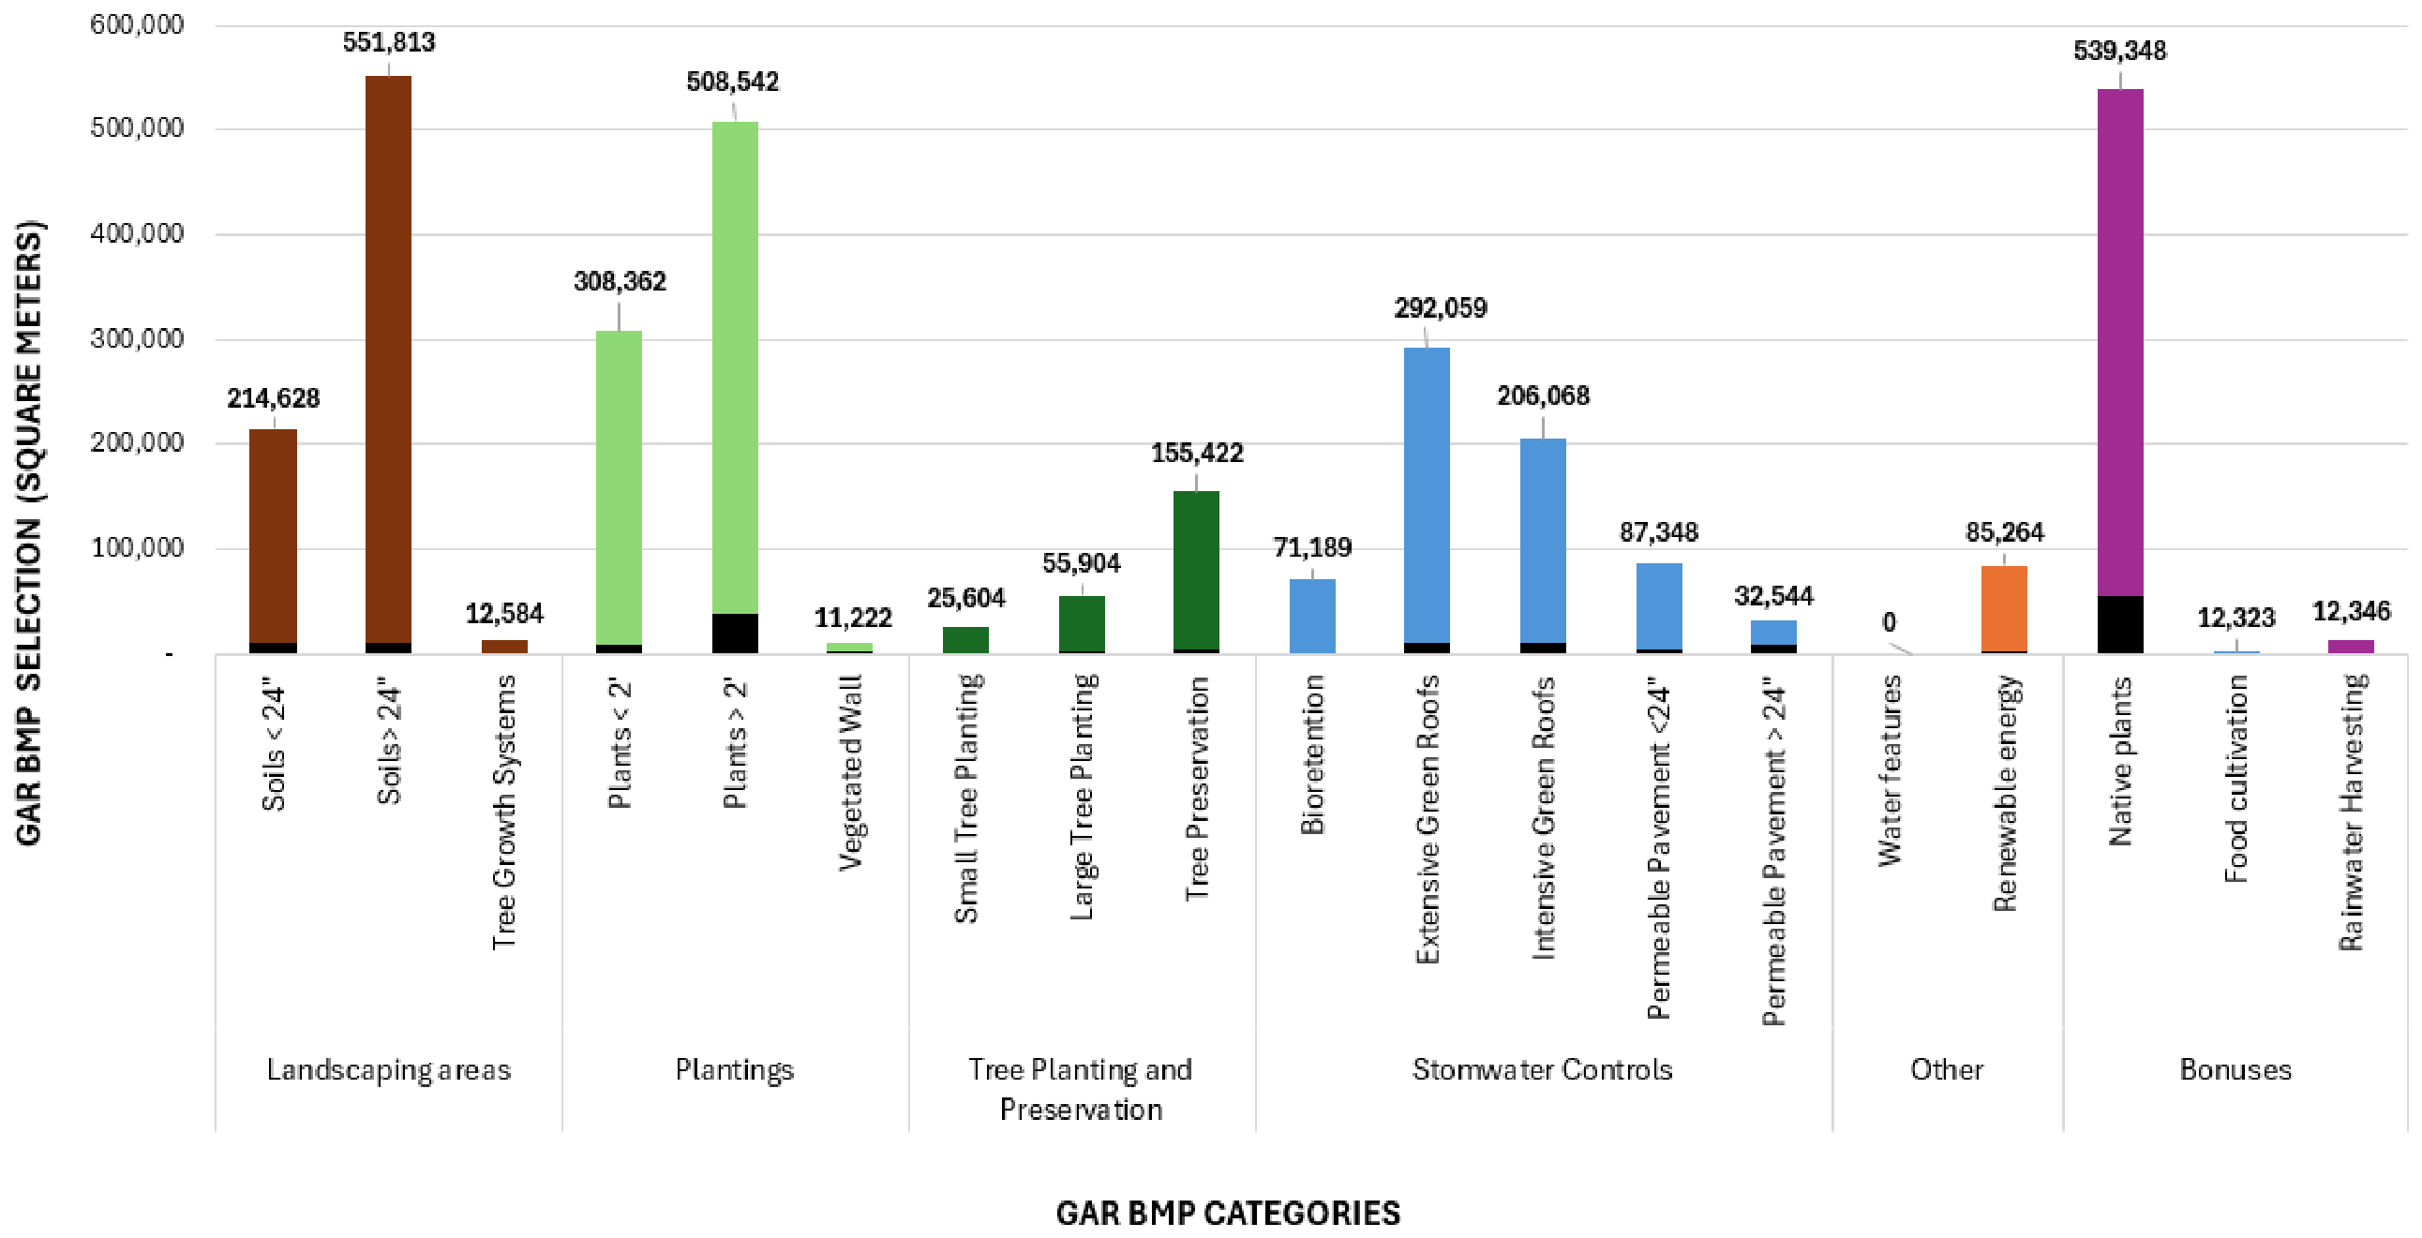
Across all GAR regulated properties, compliance was driven primarily by planted landscape elements (landscaping areas, plantings, and tree planting/preservation) rather than stormwater controls (
Figure 6). Cumulatively, approximately 779,025 m
2 of landscaping areas (25% of all credited area) and 816,904 m
2 of plantings (26%) were approved, making these the dominant GAR BMP categories. Tree planting and preservation accounted for a smaller but still important share with 236,931 m
2 (8%) of credited area. Amongst stormwater control practices, green roofs were the most widely utilized, totaling 498,128 m
2 (16%) across extensive and intensive roof systems, reflecting their suitability for sites with limited ground-level open space. Native vegetation was also extensively incorporated, representing 539,348 m
2 (68% of all planting area) through application of the native plant bonus.
Although soils and plantings are reported as separate GAR elements, they are often implemented together within the same footprint. A proposed landscaped soil area is accompanied by associated plantings, and bioretention facilities likewise include plantings as part of the practice. In addition, the soils ≥24-inch category may include qualifying existing soil preserved on site, not only newly installed soil, which provides additional context for the relatively large credited area associated with this element.
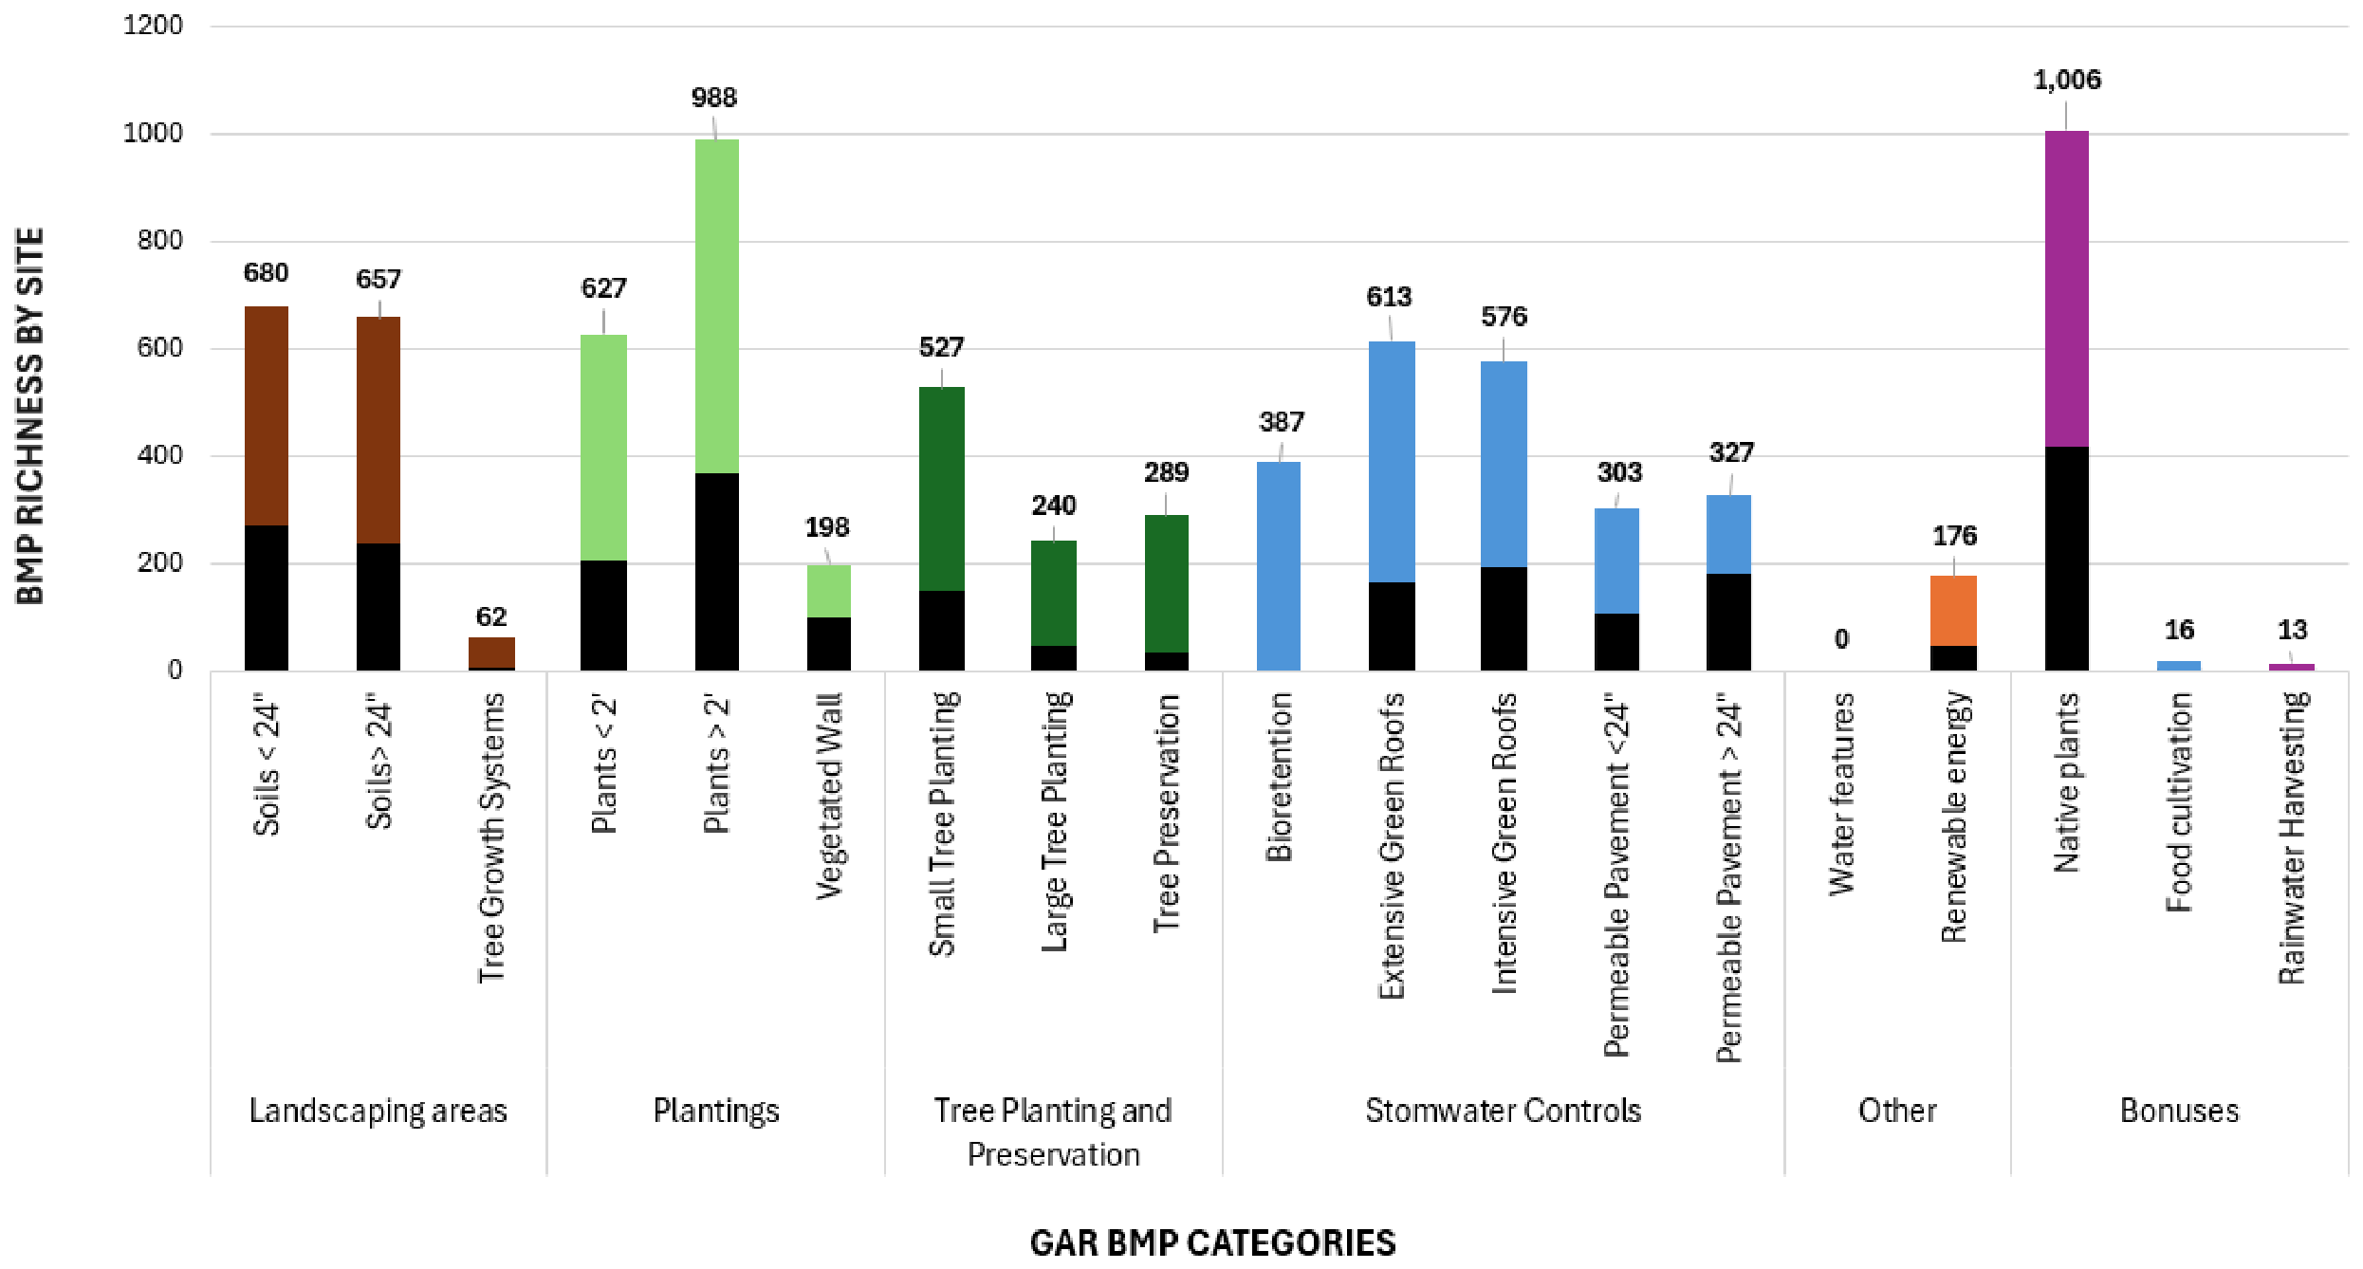
While area provides insight into the scale of implementation, this paper focuses on property-level BMP occurrence (similar to the ecological concept of richness) to reduce bias associated with large differences in property lot size and enable a comparison of BMP selection across properties of different sizes (
Figure 7). This richness analysis again revealed strong preferences for planted landscapes, primarily landscaping areas and plantings, which were included in plans for approximately half of all sites. The most utilized stormwater control practices were extensive green roofs and intensive green roofs (used by 46% and 43% of properties, respectively).
The dominance of landscaping areas, plantings, and tree planting/preservation reflects the objectives of the GAR framework itself. Unlike stormwater regulations, which primarily incentivize hydrologic performance, the GAR was specifically designed to encourage broader ecological landscape elements, including plantings and urban tree canopy. Many of these practices are not required by other environmental regulations and therefore represent a distinct regulatory contribution of the GAR framework.
The scale of tree implementation observed in this study suggests that GAR may be an important mechanism for advancing urban canopy goals on new development. This influence is particularly significant because tree planting and preservation are increasingly recognized as critical NBS that provide multiple ecosystem services [
48,
67], yet trees receive relatively limited credit under DC’s stormwater regulations compared with engineered stormwater controls.
A notable feature of GAR implementation was the widespread use of the native plant bonus. Of the total planting area, approximately 539,348 m2 (68%) incorporated native species. The native plant bonus was also broadly distributed across sites, appearing on 76% of all GAR-regulated properties. This suggests that the native plant bonus has become one of the most used mechanisms for meeting GAR requirements while potentially supporting broader biodiversity enhancement, pollinator habitat, and ecosystem resilience. Interestingly, two other bonus categories–food cultivation and rainwater harvesting–were rarely utilized during the study period.
By contrast, other practices such as food cultivation, harvested stormwater irrigation, approved water features, and vegetated walls were rarely incorporated into approved plans. This suggests that while GAR provides applicants with a broad menu of eligible BMPs, actual implementation was concentrated in a relatively small subset of practices. Further research is needed to understand the rationale influencing BMP selection.
3.7. BMP Selection Variation by Zoning District
Chi-square goodness-of-fit tests (Critical Value = 12.59) indicated that the distribution of most GAR BMP categories varied significantly across zoning districts, except for vegetated walls, for which no significant relationship was observed (
χ2 (6,
N = 198) = 9.82,
p < 0.133) (
Table 8). All statistical assumptions were met, with one cell below the expected frequency of five (less than 20%). To evaluate the practical magnitude of these relationships, Cramér’s V effect sizes were calculated. Most BMP categories had moderate associations (0.1 < V ≤ 0.3), while tree planting and preservation exhibited a strong association and vegetated walls a weak association (
Table 8). This finding indicates that BMP selection under GAR is not uniform across zoning contexts, but instead varies with the development patterns and site conditions associated with different zones. Further Bonferroni post-hoc analyses (
αadj = 0.002) were used to explore differences in GAR BMP category selection across zoning districts (
Table 8).
Properties in residential zones exhibited the most distinctive BMP selection pattern (
Table 8). Residential properties, representing 38% of GAR-regulated sites, used proportionally higher proportions of landscaping areas, plantings, tree planting/preservation, permeable pavement, and bonuses than any other zoning category. This pattern suggests that lower-density Residential developments provide greater opportunities for ground-level landscape strategies, including planted areas, tree preservation or planting, and permeable surfaces.
Properties in the Mixed-Use zone (34% of all GAR-regulated properties) exhibited a second distinctive implementation pattern. These properties used proportionally more green roofs than any other zoning category, likely reflecting the spatial constraints of denser mixed-use corridors where ground-level landscaping opportunities are more limited. More broadly, Mixed-Use and Residential properties showed the highest adoption rates for bioretention facilities and renewable energy.
In contrast, Downtown; Neighborhood Mixed-Use; Production, Distribution, and Repair; and Other zones generally exhibited lower implementation rates across multiple BMP categories, particularly landscaping areas, plantings, tree planting/preservation, permeable pavement, and bonuses. These lower adoption rates likely reflect differences in development form, site constraints, land use intensity, and the availability of space for vegetation-based practices. These findings demonstrate that zoning context is a major factor shaping the type of NBS ultimately implemented under GAR.
3.8. BMP Selection Variation by Lot Area
Chi-square goodness of fit tests (Critical Value = 9.49) meeting all assumptions indicated that BMP selection varied significantly across property lot-size quintiles for all categories except bonuses, which showed no statistically significant differences (
X2 (4,
N = 1035) = 7.63,
p < 1.06) (
Table 9). Cramer’s V effect sizes were calculated to find the strength of association in the relationships. Bonuses indicated a weak association with lot size (V = 0.076), while most BMP categories had moderate associations (0.1 < V ≤ 0.3). The strongest relationships were observed for tree planting and preservation (V = 0.623) and bioretention facilities (V = 0.504), suggesting that parcel size is particularly important in determining the feasibility of implementing these practices. These results suggest that property lot area is an important factor shaping GAR BMP selection, although its influence differs among BMP types.
Further Bonferroni post-hoc analysis (
αadj = 0.005) revealed that larger properties were proportionally more likely than smaller properties to incorporate most BMPs except for vegetated walls and bonuses. (
Table 9). By contrast, permeable pavements were proportionally more common on lower-middle and middle lot-size quintiles (≤40% and ≤60%) than in the largest parcels, reflecting the physical requirements of these BMPs. Tree planting and preservation, bioretention, and larger landscaped areas generally require sufficient open space, soil volume, grading flexibility, or coordination with building placement and site circulation. The particularly strong associations observed for tree planting and bioretention are unsurprising because both practices require not only substantial horizontal space but can additionally face below-ground constraints, such as utility conflicts. Larger properties therefore provide greater opportunities to incorporate these practices into site design.
Smaller properties also exhibited different selection patterns. The two smallest property lot-size quintiles (<20% and <40%) were proportionally least likely to utilize landscaping areas, plantings, tree planting/preservation, bioretention facilities, and renewable energy. In contrast, permeable pavement was more commonly implemented on smaller sites that may face constrained building footprints, limited open space, and fewer opportunities for landscape-based BMPs. Notably, nearly half of the smallest properties are also located within Mixed-Use zones, where redevelopment pressures and limited available open space may further constrain BMP selection. An additional consideration is that many smaller properties do not trigger SWMP requirements and therefore are less likely to incorporate engineered stormwater controls as part of the development process.
The medium and medium-high lot-size quintiles (≤60% and ≤80%) did not consistently follow the broader size-related trends, suggesting transitional development conditions between small urban infill sites and larger redevelopment parcels.
3.9. BMP Selection Variation by GAR Score Requirement
Chi-square goodness of fit tests (Critical Value = 7.82) meeting all test assumptions indicate that GAR BMP category implementation differs significantly across GAR Score Requirements for most categories, with the exception of vegetated walls (
X2 (3,
N = 198) = 5.12,
p < 1.64) and renewable energy (
X2 (3,
N = 176) = 6.92,
p < 0.074), for which no statistical differences were observed (
Table 10). To test the strength of association in these relationships, Cramer’s V effect sizes were calculated. Weak associations (V ≤ 0.1) were observed for vegetated walls, renewable energy, and bioretention facilities. Most BMP categories demonstrated moderate associations (0.1 < V ≤ 0.3). Tree planting and preservation exhibited the strongest relationship with GAR Score Requirement (V = 0.371).
Further Bonferroni post-hoc analysis revealed discernable trends in how GAR Score Requirements influence BMP selection (
Table 10). Properties with the highest GAR Score Requirement (0.4) were proportionally more likely to incorporate landscaping areas and tree plantings/tree preservation than properties with lower score requirements. Similarly, properties with GAR Score Requirements of 0.3 and 0.4, which together account for 82% of all GAR-regulated properties, showed the highest implementation rates for plantings, bioretention facilities, permeable pavement, and bonuses.
These patterns should be interpreted in relation to the zoning and lot-size relationships identified in earlier sections. The Residential zone (38% of all GAR properties) was closely associated with the 0.4 GAR Score Requirement and also shows distinctive BMP use patterns, including greater proportional use of planted landscape BMPs (e.g., landscaping areas, plantings, tree planting/preservation, and bonuses). This suggests that the highest GAR Score Requirements are frequently achieved through layered landscape strategies that combine soils, vegetation, trees, and bonuses within the same site footprint.
Green roofs were a notable exception, being proportionally most associated with GAR Score Requirements of 0.3. This pattern likely reflects the strong association between 0.3 score requirements and Mixed-Use zones, including corridor redevelopment contexts where sites may face spatial constraints limiting opportunities for ground-level landscaping, tree planting, or permeable pavement. In these settings, green roofs may provide a more feasible pathway to GAR compliance because they can be incorporated directly into building footprints rather than requiring additional open space.
Properties with a GAR Score Requirement of 0.25 (representing 5% of all properties) consistently showed lower adoption rates across most BMP categories, including landscaping areas, plantings, tree planting/preservation, bioretention facilities, green roofs, and bonuses. Because this category contains relatively few properties and occurs across several zoning contexts, the observed patterns should be interpreted cautiously.
Higher GAR Score Requirements appear to encourage greater use of BMPs that contribute substantial credited area and can be layered to generate cumulative GAR value, including landscaping areas, plantings, trees, permeable pavement, and bonuses. This finding is consistent with the structure of the GAR framework, which rewards multifunctional landscapes through the stacking of multiple BMPs within the same footprint. The contrasting pattern observed for green roofs further demonstrates that BMP selection is also shaped by development form and site constraints.
3.10. GAR and Stormwater Management (SWM) Interactions
Discerning the impacts of overlapping and interacting regulations within a wider and changing regulatory framework is a common challenge of public policy analysis [
21,
50]. In this case, assessing the independent contribution of the GAR is complicated by the concurrent implementation of several policies that encourage NBS. Among these, the SWMP requirement is the principal regulatory framework governing stormwater BMP implementation on larger development projects. Complementary initiatives include DOEE’s RiverSmart Homes, Schools, and Communities programs (providing grants and rebates for impervious surface reduction, bioretention, tree planting, rain barrels, permeable pavement, and native plantings since 2012); River Smart Rooftops (providing green roof rebates since 2008); the Stormwater Retention Credit Trading program (providing a market-based financial incentive for voluntary green infrastructure implementation, established in 2013); and Sustainable DC, the city’s long-term sustainability plan, which promotes broader adoption of NBS [
65,
66].
Many development projects in Washington, DC are simultaneously subject to GAR and SWMP requirements, both of which include NBS BMPS, but differ in their regulatory objectives and design frameworks (
Table 4). While the GAR uses a broader, multifunctional performance-based framework to encourage environmental site design, SWMP requirements are primarily based on hydrologic performance. The two regulations are triggered by different regulatory thresholds, meaning projects may be required to comply with one of the regulations or both. (Notably, SWMP also includes voluntary and roadway projects which are not subject to the GAR.) Thus, a key contribution of this research project is the analysis of policy interactions on properties subject to both GAR and SWMP regulations, utilizing the dataset of Stormwater BMP plan approvals between January 2015 and August 2025.
During the study period, approximately 19% of all regulatory plan approvals (482 properties) were subject only to GAR, with 98% occurring within the smallest parcel size quintile (
Table 11). This is unsurprising, given the SWMP applicability threshold of 465 m
2. This indicates that GAR extends landscape-based environmental performance requirements to smaller sites that would not otherwise be regulated under SWMP. While traditional stormwater regulations typically focus on larger development projects, the GAR extends environmental requirements to hundreds of smaller sites that would otherwise remain unregulated. This substantially expands the geographic reach of NBS implementation throughout the city and embeds environmental landscaping expectations into a broader segment of private development activity.
Of the remaining properties, 737 (30%) were subject to both GAR and SWMP (GAR&SWMP) and 1259 (51%) were regulated solely through SWMP requirements (SWMP-only) (
Table 11). Importantly, these properties are distributed across larger lot sizes. The size discrepancy between GAR-only and GAR&SWMP properties is consequential because larger properties must devote more area to BMPs to achieve GAR Score Requirements, since larger parcel areas increase the denominator used in GAR score calculations (
Figure 1). This is reflected in the differences between
Figure 6 (BMP selection by area) and
Figure 7 (BMP richness by site). GAR&SWMP properties account for most of the BMP implementation by area, while GAR-only sites contribute to a relatively small percentage of total BMP area.
To isolate the influence of GAR on BMP selection, BMP usage frequency was then compared between GAR&SWMP and SWMP-only properties. Eleven of the 22 GAR BMPs overlap with SWMP-eligible practices (
Table 3). These overlapping BMPs fall within four categories: tree planting and preservation, green roofs, permeable pavement, and bioretention. The remaining 11 GAR BMP elements are unique to the GAR framework and represent primarily landscape-based practices and bonuses. In contrast, BMPs that are unique to SWMP consist of engineered subsurface and gray infrastructure (e.g., infiltration trenches, storage systems, sand filters).
Chi-square goodness of fit tests (Critical Value = 3.84) meeting all test assumptions were performed to compare BMP use in GAR&SWMP and SWMP-only properties (
Table 12). Cramer’s V effect sizes were calculated to evaluate the strength of association for each category. A strong association was observed for green roofs (Cramér’s V = 0.492), which were present in 74.0% of GAR&SWMP plans compared with 20.3% of SWMP-only plans (χ
2 = 517.3,
p < 0.001), suggesting that the addition of GAR requirements substantially influences BMP selection of green roofs. Three additional NBS BMPs–tree planting, bioretention, and permeable pavement–also exhibit moderate associations and higher adoption rates on properties subject to both GAR and SWMP requirements.
The additional layering of GAR significantly alters BMP selection patterns within SWMP-regulated properties, shifting implementation toward multifunctional NBS practices that satisfy stormwater requirements while also contributing broader landscape, greening, and potential ecological benefits. By contrast, SWMP-only properties were significantly more likely to incorporate infiltration trenches designed primarily for stormwater runoff reduction. Infiltration trenches are eligible under SWMP but not GAR and generally provide fewer visible landscape or ecological co-benefits than multifunctional vegetated systems.
4. Discussion
4.1. Strengths of the GAR Framework: Simplicity, Flexibility, Adaptability
This assessment provides a rare empirical evaluation of (1) a hybrid performance-based zoning framework and (2) an implemented urban NBS regulation [
30]. While NBS governance generally is an increasingly important research topic, few studies have evaluated how these regulatory frameworks function after implementation [
49,
68]. Beyond documenting implementation outcomes, this study demonstrates several characteristics that make GAR a promising model for integrating NBS into urban development: regulatory simplicity, flexibility, and adaptability.
4.1.1. Simplicity of the GAR Framework
The GAR provides a level of regulatory simplicity uncommon in performance-based standards through its use of standardized environmental multipliers assigned to a defined set of BMPs. The ability to account for multifunctionality is essential for NBS governance [
2]. Performance-based standards are well-suited to accomplish this yet are notoriously difficult to administer, often requiring more highly trained administrative staff than other instruments [
31,
34,
69]. Rather than requiring individual assessment of multiple ecosystem services for every project, GAR translates relative environmental performance into a transparent scoring system that can be consistently applied during plan review. The framework’s straightforward calculation addresses the need for performance-based zoning applications to be clear and precise [
30,
69]. Notably, this same need for planning mechanisms that are “balanced, clear, widely accepted, and implementable” has also been identified as fundamental to NBS governance [
2] (p. 1224). While many cities utilizing the GAR-style frameworks retain this feature, Melbourne, Helsinki, and several more recent adopters include substantially larger numbers of differentiated BMPs, which may increase environmental service specificity but also introduces additional administrative complexity (
Table 1) [
30,
42].
4.1.2. Flexibility Within the GAR Framework
Flexibility within the GAR framework allows owners and developers choice in selecting BMPs that fit within usage plans for their site, rather than prescribing a specific landscape solution. The implementation patterns observed in this study illustrate the value of this flexibility. BMP selection varied significantly with parcel size, zoning district, and GAR Score Requirement, demonstrating that applicants adapt compliance strategies to different development contexts while still achieving required environmental performance. For instance, the GAR framework accommodates both horizontal and vertical greening strategies–from stacked planting systems and tree preservation to green roofs and renewable energy–making GAR applicable across a wide range of urban redevelopment conditions. This flexibility is characteristic of most GAR-type regulations, which favor flexible performance-based outcomes over prescriptive design standards [
42].
The diversity of implementation observed across 1329 approved projects demonstrates the flexibility of the GAR framework for NBS implementation. This analysis indicates that although parcel size, zoning district, and GAR Score Requirements significantly influenced BMP selection, additional factors–such as site configuration, building footprint, land use, design preferences, and project costs–may also impact these decisions. While further research is needed to better understand these influences, the GAR’s flexible framework accommodates this variability while maintaining consistent environmental expectations [
21].
4.1.3. Adaptability Within the GAR Framework
A valuable feature of the GAR framework is its adaptability. Adaptive management approaches are widely recognized as a best practice in NBS planning as they take an iterative approach to mitigate the uncertainty surrounding applications of these BMPs within complex urban systems [
70]. As Nesshöver [
2] (p. 1221) aptly highlights, “uncertainty will be a prevailing characteristic” in the application of NBS. Castelo et al. [
49] (p. 1) stress that the novelty of NBS and the urgency of their implementation require approaches that give “urban planning practices the time to adjust” while filling “knowledge gaps through the assessment of effectiveness”. These observations align closely with Baker’s [
30] (p. 399) recommendation that planners implementing performance-based zoning should “accept the incremental nature of innovation.”
The implementation patterns identified in this study provide exactly the type of evidence needed to support such adaptive management. GAR’s BMPs, environmental multipliers, and score requirements could be periodically recalibrated based upon updated program implementation data and evolving scientific understandings, to better support emerging social and environmental priorities. Importantly, these refinements could occur without fundamentally restructuring the regulatory framework, allowing GAR to evolve while preserving its underlying performance-based approach. Although such adjustments have not occurred in DC, this study demonstrates how long-term implementation data can inform future program refinement.
4.2. GAR Limitations
At the same time, DC’s experience also highlights several fundamental limitations associated with the GAR framework, many of which have been previously identified in the performance-based zoning literature [
30,
42].
4.2.1. Trigger Threshold and Minimum Compliance Standard
A first limitation stems from the GAR trigger threshold (projects requiring a Certificate of Occupancy, within designated zoning districts). In DC, trends in the number of GAR plan approvals and their distribution reflect redevelopment activity within the city. On one hand, the GAR can be seen as requiring NBS that offset the impacts of development where they occur and frequently by owners and developers who can afford to implement these amenities as a relatively small percentage of overall development costs. However, because GAR’s implementation depends on redevelopment activity, spatial overlap with social or environmental priority areas would be only coincidental. In this way, the GAR may well be caught within an equity paradox in which “efforts to enhance urban environments may inadvertently amplify social inequalities” [
71] (p. 2).
Similarly, the GAR functions as a minimum floor of compliance, as most projects meet GAR requirements with relatively little overperformance. In contrast with voluntary landscape sustainability frameworks like the Sustainable Sites Initiative’s SITES Rating System, the GAR does not currently incentivize or recognize exceptional NBS adoption beyond the required minimum [
66].
4.2.2. Flexibility, Optimization, and Local Environmental Priorities
Second, the very flexibility that contributes to GAR broad applicability can lessen its environmental effectiveness, because property owners and developers have choice in BMP selection. For example, property owners and developers can choose BMPs that do not align with larger community visions, management plans, or localized environmental priorities (e.g., choosing renewable energy generation in flood-prone areas, or within a designated blue-green habitat corridor) [
72]. This limitation has been previously associated with performance-based zoning [
30]. As Porter [
73] suggests, the need for certainty—i.e., the desire to specify BMPs used or more closely determine outcomes—is a driver for communities that reject or dismantle performance-based zoning and return to prescriptive zoning strategies.
This aspect of the GAR lies in contrast to much of the literature on ecosystem services, landscape planning, and NBS, which frequently focuses on “optimization” in the selection and spatial allocation of NBS to achieve maximum benefit [
20,
74,
75]. For instance, varied NBS planning tools use multi-criteria analysis to consider a variety of environmental attributes to prioritize the location of different types of NBS [
76,
77]. NBS BMPs do not contribute environmental services equally, and their creation does not “automatically lead to socially just and inclusive developments” [
78] (p. 222). This growing body of research has increased emphasis on NBS strategies that explicitly address community needs, including patterns of uneven development [
79,
80].
4.2.3. Administrative Capacity, Governance, and Maintenance
Performance-based zoning regulations are widely considered to require greater administrative effort than traditional Euclidean zoning. However, DC’s hybrid application utilizes a simplified point-system variant recognized for reducing administrative burden (e.g., paperwork, duration of the approval process, and staffing needs) for both applicants and regulators [
73]. Despite this, as noted in previous evaluations of performance-zoning regulations, successful implementation still requires advanced technical expertise and adequate resources for administration and enforcement [
31,
69].
In DC, GAR administration spans multiple agencies. As noted in previous sections, DC OP developed the framework and DC OZ administers the zoning regulation, while DOEE conducts technical plan review and post-construction inspections. This division of responsibilities allows GAR to integrate planning, zoning, permitting, and environmental review, but also distributes program responsibilities across multiple agencies. Such governance structures require sustained interagency coordination, clear program ownership, and long-term institutional commitment if regulatory programs are to evolve over time.
Within DOEE, plan review and site inspection are conducted by the same technical staff responsible for plan review, inspection, and enforcement of SWMP regulations. In this way, DC’s review leverages existing technical expertise and review workflows. Thus, DC’s experience with GAR administration illustrates that successful NBS regulation depends not only on regulatory design but also on sufficient institutional capacity to support consistent implementation over time.
Maintenance represents a second governance challenge. BMP maintenance is essential for their continued function, social benefits, and public acceptance, yet this is not directly controlled in DC [
17,
81,
82]. DC’s GAR attempts to address this through landscape management plans and a maintenance obligation: “A property owner is required to maintain the GAR score through appropriate stewardship and maintenance of landscape elements after the property is granted its Certificate of Occupancy” [
36] (p. 23). However, after construction, there is no systematic post-implementation verification to confirm that approved BMPs are maintained, replaced, or continue functioning as intended. While property owners may adjust site conditions to maintain compliance with GAR Score Requirements, they are not required to resubmit GAR plans for reapproval. As a result, ongoing compliance is largely self-managed, and the persistence and performance of installed BMPs are not consistently monitored or enforced. Maintenance, or the lack thereof, will greatly impact the environmental services generated through the GAR over time, an insight that is an increasingly recognized truth of NBS more broadly [
83].
4.3. Study Limitations
Key data limitations shape the scope of this study and the conclusions that can be drawn from this work. Crucially, this assessment of the application of the GAR in DC utilized regulatory plan approval records extracted from DC’s Surface and Groundwater System, which has tracked GAR and SWMP implementation since 2015. Systematic compliance, approval, and implementation records are unavailable for the period between GAR adoption in 2013 and creation of this system, and relatively few records exist prior to the 2016 regulatory amendments. The unavailability of these data prevents a temporal assessment of BMP selection trends during the earliest years of GAR implementation.
Further, this remains a correlational study because the implementation of GAR in DC does not provide a clear natural control group. First, GAR is widely applied to qualifying projects within applicable zoning districts and development categories, leaving few otherwise comparable properties not subject to its requirements. Second, while this paper examines key policy interactions between the GAR and SWMP, other potentially impactful NBS policies were also implemented concurrently. Consequently, while the analyses identify implementation patterns and policy interactions between GAR and SWMP requirements, they cannot fully isolate the independent effects of the GAR.
The statistical analyses relied on aggregated zoning districts and BMP categories to satisfy statistical assumptions and improve interpretability while preserving meaningful distinctions in land-use intent and BMP function. However, this simplification may obscure variation within broader categories, such as the substantially different uptake within the bonus category (native plant species, food cultivation, and rainwater harvesting).
This analysis is also based on approved GAR plans rather than post-implementation conditions. Neither modifications made during construction nor long-term maintenance conditions are captured within the available dataset. As Cameron and Blanuša [
84] poignantly highlight, the devil is in the details. Although DC’s GAR regulation includes detailed BMP specifications, technical plan review, and post-construction inspections, the long-term environmental performance of BMPs ultimately depends on factors including plant selection, installation quality, and long-term maintenance which are beyond both the regulatory authority of GAR to fully control and the scope of this study to evaluate [
36].
Finally, both the GAR and this study evaluate the adoption of regulated BMPs rather than their realized environmental performance. The GAR simplifies the administration of a multifunctional performance-based regulation through standardized BMP categories and multipliers rather than requiring direct measurement of ecosystem services. Likewise, this study evaluated implementation patterns rather than environmental outcomes by using binary BMP occurrence data to assess BMP selection across properties ranging from 50 to 113,536 m2. An assessment of the environmental impacts of the GAR was outside the scope of this study, yet a different, area-based approach would be more appropriate to assess socio-ecological contributions and the scale of implementation given the large percentage of NBS area contributed by the largest properties.
4.4. Recommended Next Steps
A principal recommendation emerging from this study is that DC adopt an adaptive management approach, periodically reassessing and recalibrating the GAR to align with the city’s evolving sustainability priorities. After more than a decade of implementation, this study has generated empirical evidence regarding BMP selection, implementation trends, and interactions with stormwater regulations that can now inform future program refinements. Combined with advances in scientific understanding of NBS benefits in urban settings, these findings provide an evidence base for updating eligible BMPs, recalibrating GAR multipliers, bonuses, and score requirements, as well as refining implementation guidance. Globally, more complex GAR-adjacent frameworks in Melbourne and Helsinki have similarly updated BMPs, multipliers, and score requirements without restructuring the entire regulatory framework [
42]. In this way, DC can leverage a known strength of performance-based zoning: the ability to translate local objectives into development that reflects those goals [
73].
More broadly, DC could benefit from broader interdisciplinary discussions on decision-making strategies and planning frameworks designed to maximize the environmental, economic and social co-benefits of NBS [
79,
85,
86]. Greater transparency and broader stakeholder participation in the establishment of GAR multipliers, eligible BMPs, and GAR Score Requirements could strengthen future program assessments, support adaptive management, and better align the GAR with evolving sustainability goals, including urban heat mitigation, biodiversity enhancement, climate resilience, stormwater management, and environmental justice [
87].
One potential direction for future GAR evolution is the incorporation of spatially targeted planning approaches that align NBS implementation with localized environmental priorities and vulnerabilities [
18,
19,
20,
21,
22,
23,
24]. Both Malmö and London have created more spatially differentiated GAR-type policies than DC, with London allowing boroughs to establish locally appropriate score requirements [
37,
47]. Similarly, Cortinovis and Geneletti (2020) proposed a theoretical performance-based scoring system using mapped ecosystem service assessments [
28]. Comparable approaches could allow DC to adjust BMP weighting according to neighborhood-specific priorities.
At the same time, greater spatial specificity should be pursued cautiously. First, as Kendig [
32] p. 285 presciently noted, communities must carefully weigh the costs of detailed studies that supply the basis for such standards. Second, efforts to optimize NBS placement within the landscape and maintain high levels of decision-making certainty and control could undermine the flexibility that is a current strength of the GAR. Such was a finding of Frew et al. (2016) who observed a range of unintended consequences in the implementation of Queensland, Australia’s Integrated Planning Act (IPA) of 1997, a hybrid performance-zoning application designed to promote ecological sustainability [
33]. Similarly, DC should consider Baker’s (2006) advice for successful performance-based zoning to “avoid complexity at all costs” [
30] (p. 399).
Yet, an accessible spatial data portal populated with socio-environmental data already collected by DC could help DC residents, developers, and planners understand the importance of individual sites within broader city priorities and could even streamline adoption of a more spatially articulated version of the GAR. Future GAR updates should evaluate whether BMP categories, multipliers, and score requirements remain aligned with current District sustainability priorities and revise them as supported by growing evidence of the environmental, economic and social benefits of NBS.
Finally, understanding why applicants select particular BMPs remains an important area for future research. Surveys and interviews with those involved in GAR implementation, ranging from landscape architects, developers, and regulators, could provide valuable insight into BMP selection, implementation and management challenges, as well as barriers within the current regulatory structure. For instance, Limb and Feeney (2025) surveyed urban planners about Queensland’s IPA planning process and outcomes, highlighting challenges including transparency, certainty, flexibility, and professional competency [
88].
While this study identified significant associations between BMP selection and parcel size, zoning district, and GAR Score Requirement, additional factors–such as site configuration, building footprint, intended land use, design preferences, and project costs–likely also influence implementation decisions. Along these lines, Nawrath et al.’s (2026) cost-effectiveness analysis of a GAR-type instrument in Oslo asserts that within that instrument framework, developers may prioritize low-cost, and potentially lower-performing BMPs [
89]. DC planners specifically, and those interested in urban NBS applications generally, would benefit from more concrete and detailed information about factors impacting BMP selection for GAR-regulated properties to strengthen future GAR revisions and contribute more broadly to understanding the implementation of urban NBS regulations.
5. Conclusions
This analysis of Washington DC’s implementation of the GAR, a hybrid performance-based sustainable landscape zoning regulation, contributes a rare empirical evaluation of both an implemented urban NBS regulation and a performance-based zoning instrument. Because the GAR operates through private development rather than public investment, it provides cities with an opportunity to incrementally expand NBS as redevelopment occurs.
Over a decade, approximately 184 ha of multifunctional NBS were approved through DC’s GAR across 1329 private properties, based on regulatory plan approval records between 2015 and 2025. While the GAR provides flexibility in BMP selection, property owners and developers most frequently utilize landscaping areas, plantings, tree planting/preservation, and the native plant bonus for compliance. These findings demonstrate that the GAR has been particularly effective at promoting planted landscapes, rather than solely stormwater-oriented infrastructure. Because these practices can be stacked within the same footprint, the framework encourages multifunctional landscape design capable of delivering multiple ecosystem services simultaneously.
Rather than producing a uniform landscape outcome, BMP selection varied significantly with the three parcel-level attributes examined in this study: zoning district, property lot area, and GAR Score Requirement, which are themselves interrelated. Residential zones, larger property sizes, and higher GAR Score Requirements were associated with greater use of many BMPs, especially ground-level planted landscapes, trees, and the native plant bonus. In contrast, denser Mixed-Use zones were associated with greater use of vertical and rooftop greening strategies that can be integrated into compact urban forms.
Properties complying with both GAR and SWMP regulations are proportionally more likely to implement green roofs, bioretention, permeable pavement, and tree planting than properties regulated solely under SWMP, as these BMPs fulfill both regulatory frameworks. These findings demonstrate that the GAR complements rather than duplicates traditional stormwater regulation by shifting implementation toward multifunctional vegetated practices capable of providing ecological and landscape co-benefits in addition to runoff management.
These findings highlight opportunities for the future of the GAR in DC and contribute to broader understandings of NBS governance in urban areas. The authors encourage an adaptive management approach to periodically evaluate and iteratively realign the GAR with DC’s sustainability goals and advances in scientific understandings of NBS. While the city can leverage existing spatial socio-environmental data to inform future revisions, such evolution should preserve the simplicity, flexibility, adaptability, and administrative practicality that have been central strengths of the GAR’s hybrid performance-based zoning regulation. Overall, the GAR demonstrates how a hybrid performance-based zoning regulation can integrate landscape sustainability goals directly into zoning compliance and thus encourage the proliferation of multifunctional NBS within private development while supporting broader goals for climate adaptation, biodiversity, and urban resilience.





 ,
,