Article

Evaluating Open Government Data as a Tool for Planning and Sustainability in U.S. Cities: Portals, Policies, and Plans


by
Gulnara N. Nabiyeva
* and
Stephen M. Wheeler
Department of Human Ecology, University of California, Davis, CA 95616, USA
*
Author to whom correspondence should be addressed.
Sustainability 2026, 18(16), 8177; https://doi.org/10.3390/su18168177
Submission received: 17 June 2026 / Revised: 21 July 2026 / Accepted: 3 August 2026 / Published: 10 August 2026
(This article belongs to the Section Sustainable Urban and Rural Development)

Abstract

Open Government Data (OGD) has the potential to support urban planning by increasing transparency, improving evidence-based decision-making, enhancing public participation, and monitoring progress toward sustainability goals. Despite this potential, the extent to which OGD supports planning and sustainability in practice remains unclear. This study evaluates the user-friendliness of OGD portals in 19 U.S. cities using four criteria identified in the literature: breadth of portal content, structure of governance, user-friendly support, and equitable user access. It also examines how cities incorporate OGD into OGD policies, general plans, and sustainability/climate action plans. This study was designed as an exploratory comparative case study of OGD practices, and the methods included portal assessment using four criteria, content analysis of OGD policies and plans, and semi-structured interviews with OGD and planning experts. The findings indicate that most OGD portals function primarily as data repositories, rather than as planning support tools, and vary considerably in portal content, governance, and user support, affecting their usefulness for planning and sustainability efforts. OGD policies are often absent or underdeveloped and typically emphasize transparency rather than planning applications or public engagement. Only nine cities identified a role for OGD in at least one planning-related document. Interviewees identified low public awareness, limited user capacity, and insufficient integration of data into decision-making as key barriers. The findings identify practical strategies that cities can adopt to better integrate OGD into urban planning and sustainability, including proactive identification of datasets and indicators that will be of interest to various stakeholders, improved stakeholder engagement, data standardization, use of graphics to highlight policy-relevant data trends, improved OGD management, and closer alignment between OGD initiatives and action-oriented planning processes.

1. Introduction

Despite the rapid growth of Open Government Data (OGD), its accessibility and integration into local planning processes remain uneven. OGD refers to public data that anyone can freely use, reuse, and redistribute [1]. Although municipal OGD initiatives have become increasingly common over the past 15 years, the availability, usability, and accessibility of data vary considerably across cities. Many datasets are not provided through user-friendly online portals or effectively incorporated into planning processes, limiting their use beyond technologically skilled individuals and organizations. For example, Data.gov expanded from just 47 datasets at its launch to hosting 132 city OGD portals [2]. Despite this growth and the increasing expectations that cities use OGD to support strategic planning and sustainability, OGD initiatives remain only weakly integrated into OGD policies, general plans, and sustainability/climate action plans.
OGD can improve government transparency, public participation, evidence-based decision-making, and monitoring of sustainability goals [3,4,5]. The UN report “A World That Counts: Mobilizing the Data Revolution for Sustainable Development” underscores the need for an “open data revolution” [6] (p. 5). Beyond these governance benefits, OGD can also generate substantial public, economic, and environmental benefits. For example, Beijing’s smart traffic system reduced congestion by 60%, shortened driving times by 45%, increased vehicle efficiency by 50%, and decreased fuel consumption by 15%, while the McKinsey Global Institute (2013) estimated that OGD could create US$3–5 trillion in annual value across seven economic sectors worldwide [7,8,9,10,11].
Substantial academic literature on open data emerged during the 2010s, when many national and municipal OGD systems were first established. Early research focused largely on issues of data publication, transparency, accountability, and technical standards and was concentrated in the fields of public administration and information science. More recent scholarship has expanded this focus to examine OGD as a tool for digital transformation, smart city development, sustainability monitoring, public value creation, and evidence-based governance [4,12,13,14]. Nevertheless, there remains relatively little consideration in planning journals of how OGD might assist urban planning and sustainability. In this paper, we evaluate local open data initiatives in 19 U.S. cities in terms of their basic characteristics, alignment with OGD policy, municipal general plans, and sustainability/climate action plans. Then we make recommendations on strategies for more effective open data initiatives. This study addresses the following research questions (RQs): How do OGD portals vary across cities in terms of user-friendliness, including breadth of portal content, structure of governance, user-friendly support, and equitable user access? (RQ1; assessed in Section 5.2.) Do OGD initiatives meet the intentions of OGD policies? (RQ 2; examined in Section 5.3.) Do general plans and sustainability/climate action plans use OGD initiatives as planning tools? (RQ 3; addressed in Section 5.4.) This research will be useful for municipal staff, elected officials, citizens, and organizations interested in making cities better planned and more sustainable.

2. Background

Data Within Planning

Planning has always relied on systematic collection and analysis of data, for example, about land uses, housing, populations, transportation, ecosystems, and economies. In the early 20th century, Patrick Geddes (1915) famously emphasized data collection as the precondition to planning; his mantra of “survey, analysis, plan” still describes the process that many agencies follow [15]. OGD portals can be seen as the modern equivalent of the Outlook Tower that Geddes proposed for the public to observe and learn about the urban region.
With the rise of the social sciences in the mid-20th century, planning became even more data-driven. Critics such as Jane Jacobs (1961) pointed out problems that uncritical preoccupation with data and supposedly objective analysis can lead to, including loss of understanding of people’s lived experience [16]. NeoMarxist critics such as David Harvey (1973) and Manuel Castells (1978) emphasized ways that economic power, rather than data, drives planning decisions [17,18]. Writers such as Foucault (1972), Fainstein & Fainstein (1979), Forester (1989), Innes (1998), and Flyvbjerg (2002) developed nuanced analyses of ways that information evolves within public processes [19,20,21,22,23]. Such critiques make us better generators and consumers of data. Nevertheless, good and freely available data remain central to planning. Systematic data collection and analysis are also legally required for purposes such as environmental review.
Data in the public sector must now be seen as co-evolving with institutions, political forces, technologies, and cultures. It plays many roles: as the basis for planners and other officials to understand contexts and propose actions; as a way to empower and engage the public; as a way to spread information and promote social learning; as a way to monitor progress toward goals and strengthen plans; and as a way to promote government transparency and improve institutional functioning. The generation, use, manipulation, or withholding of data can empower or disempower various actors. For example, Wirtz et al. (2016) point out that public officials and bureaucracies may actively resist sharing data that reflects upon organizational characteristics and effectiveness [24]. Conversely, data can empower citizens, businesses, and nongovernmental organizations (NGOs) to demand change. Battles over information, disinformation, truth, and “fake news” have been central to American politics in recent years. All of these dynamics potentially affect municipal open data systems. From a constructive view, the presence of well-curated portals may help the public understand complex issues rife with disinformation and manipulation, hence supporting planning.
During the first quarter of the twenty-first century, cities generated mushrooming amounts of data, a “third data revolution” [25] (p. 445) made possible by electronic devices and sensors. Nearly every resident activity—including traveling, making purchases, and using services—now produces real-time big data that can be analyzed for purposes such as identifying trends, improving resource allocation, and optimizing staffing. The rise of Geographic Information Systems (GIS) has also added many types of datasets and spatial analysis abilities. Artificial Intelligence (AI) is likely to further influence the accumulation of information. All of these new forms of data will likely require unprecedented levels of coordination and organization to facilitate effective planning and sustainable futures.

3. Literature Review

3.1. Open Government Data

Although multiple definitions exist, OGD can be most simply defined as information from public sector agencies that is available to the public free of charge, reusable without restrictions, platform-independent, machine-readable, and often de-identified [2,4,13,26,27,28]. The philosophical roots of open data include sociologist Robert K. Merton’s “common pot” idea—treating scientific knowledge as public property to be shared freely for the common good [29]. Such roots also include Elinor Ostrom’s notion of the information commons, in which data becomes a public good [30]. According to Ostrom, “these are public goods of a new kind: not only does their use not deplete the common stock, but it enriches it” [31] (p. 1).
While early OGD research focused primarily on transparency, accountability, data publication, and technical standards, more recent scholarship increasingly examines OGD as a tool for digital transformation, smart city development, sustainability monitoring, and public value creation. Recent studies emphasize that the effectiveness of OGD depends not only on data availability but also on governance capacity, stakeholder engagement, interoperability, institutional readiness, and integration into decision-making processes [4,12,13,14]. This shift reflects growing recognition that open data can support broader planning and sustainability objectives rather than serving solely as a transparency mechanism.
The concept of OGD emerged in the 2000s with pioneering national-scale initiatives in the United Kingdom and the U.S. [2,5]. The latter was launched in 2009 as part of President Obama’s Open Government Initiative [32]. The Obama Administration’s Open Government Initiative expedited the implementation of OGD policies by issuing the Open Government Directive, requiring federal agencies to release high-value datasets, develop transparency plans, and launch the federal data portal Data.gov, supported by funding for agency-level data infrastructure. Ten years later, Congress passed the Open Government Data Act with bipartisan support, requiring all federal data to be made available in open and machine-readable formats [33].
According to the California Open Data Handbook, an OGD portal, a user-friendly catalog of datasets, is a centralized platform designed to provide citizens and the government with a single location to search for and access authoritative open data from government entities [34]. The OGD portal serves as a one-stop shop for data consumers, providing policymakers, researchers, and the public with centralized access to datasets and metadata that support data discovery and use. Modern OGD portals also offer tools for querying, converting, mapping, visualizing, requesting, and transforming data into customized reports [12,35,36].
At the municipal scale, cities like Washington, D.C., San Francisco, and New York first created OGD portals around the year 2010, assisted by $34 million in federal funds [37]. These websites were typically organized by categories such as transportation, environment, housing, and public safety, and provided visualization tools and downloadable files for users [38]. Many OGD portals have become quite large. According to the Sunlight Foundation, by 2018, more than 100 U.S. cities, counties, and states had launched OGD portals and adopted related policies [39]. Many of these efforts were shaped by federal requirements for public access to “high-value” datasets [40]. As federal funding declined, responsibility for maintaining and expanding OGD initiatives shifted to local governments. Larger and wealthier cities, such as Los Angeles and New York, institutionalized open data by integrating OGD into municipal budgets, hiring dedicated staff, and embedding OGD within formal governance structures. By 2026, Data.gov listed more than 132 municipal OGD portals providing access to over 358,000 datasets [2].
Scholars emphasize the importance of high-quality public data for effective urban planning. According to Simon et al. (2015), cities that use timely, disaggregated, and locally relevant data are better positioned to monitor sustainability targets and design effective policies [41]. Satterthwaite (2016) and Patel et al. (2017) similarly argue that data capacity varies widely across cities and is often insufficient [42,43]. Specifically, based on their analysis of Cape Town’s engagement with SDG 11, Patel et al. (2017) concluded that success depends on access to robust data and governance reforms that align urban planning with global sustainability agendas [43]. Likewise, Satterthwaite (2016) highlighted the need for “co-production of the SDGs,” involving contributions from multiple sectors, with local governments playing a critical role in ensuring coherence and coordination [42]. Davis et al. (2015) further emphasized that “indicators are both a form of knowledge and a technology for governance,” shaping—and being shaped by—political decision-making, public understanding, and institutional practices [44].
Good public data is particularly important for sustainability planning, given that this often involves ambitious goals such as ending GHG emissions and improving social equity. Both the public and decision-makers need to know exactly how a jurisdiction is doing in these regards. Arfvidsson et al. (2017), analyzing the data environments of Cape Town and Kisumu under SDG 11, found that city governments often lack baseline data on informal settlements, transport, and waste management, making it difficult to track SDG 11 progress [45]. Similarly, Koch et al. (2019) identified data limitations, planning constraints, and coordination challenges across fifteen German cities, emphasizing the need for localized governance and transparent processes [46]. Klopp and Petretta (2017) pointed to the lack of standardized, open, and comparable data, along with insufficient support for inclusive local monitoring of SDGs [47]. These studies collectively highlight that achieving sustainability planning depends not only on the availability of high-quality data but also on adequate institutional capacity, governance, and responsible data management [48,49].
Local governments initiated open data systems for many reasons: to foster transparency, improve accountability, fight corruption, support environmental goals, more effectively manage existing infrastructure, and strengthen public service delivery [3,4,5,8,9,13,50,51]. Additionally, de Castro Neto et al. (2017), Mutuku & Colaco (2012), and Ubaldi (2013) expanded that OGD potentially can promote better city governance and more effective management of existing infrastructure by enhancing transparency, analysis, and planning in decision-making, reinforcing citizen engagement and participation, fostering co-creation and collective intelligence, and supporting innovative, data-driven products and services [52,53,54]. Ahlgren et al. (2016) emphasize that open access to data fosters unexpected ideas, theories, and innovations that contribute to sustainability [55]. Similarly, Ojo et al. (2015) argue that OGD empowers cities to advance sustainability across economic, environmental, and social dimensions [56]. Specifically, Wang et al. (2024) find that OGD catalyzes smart city development by enhancing urban outcomes and strengthening digital infrastructure and the digital economy [14]. Ruijer et al. (2020) add that the effective use of open data requires people-centered engagement and continuous dialogue to integrate public knowledge into sustainability planning [57]. Schweitzer and Afzalon (2017) argue that open data can be a force for social equity, helping citizens counter the power of large data systems controlled by private firms [58].
Many recent studies conceptualize OGD as a public-value innovation requiring strong institutional and policy frameworks to support planning and sustainability. Meijer (2015) argues that technological innovations are adopted not because of their technical capabilities alone, but because they are framed as tools for creating public value when they are embedded in governance and planning processes and explicitly linked to broader public goals [59]. Consistent with this perspective, Ruijer and Meijer (2020) conceptualize OGD as an innovation process whose success depends on strong managerial commitment and supportive organizational change [60]. Similarly, Susha et al. (2017) emphasize that data collaborations create public value by enabling evidence-based and more agile policy decisions [61]. Nugroho et al. (2015) further show that successful OGD initiatives require comprehensive policy frameworks addressing legal and operational issues, data quality, institutional responsibilities, and incentives to stimulate both the release and use of data [62]. Extending this perspective, Ballari et al. (2025) identify a governmental and readiness dimension of Open Geographical Data Infrastructure development in Latin America, emphasizing that effective OGD initiatives depend on legal frameworks, policy guidelines, and political commitment to openness as foundations for both policy formulation and implementation [13].

3.2. The Challenges of Open Government Data

While open data initiatives offer many benefits to local governments, they also present challenges [5,14,63,64]. In the following discussion, we consolidate potential challenges discussed in the literature into three main categories: (1) institutional and technical difficulties in curating data, (2) obstacles around public engagement, trust, awareness, and collaboration, and (3) political and institutional resistance to integrating data with policy in constructive ways.
Data management and curation represent one main set of challenges. Simply publishing large volumes of data does not guarantee usefulness, transparency, or accountability [64]. Simon et al. (2015) found that in five diverse cities—Bangalore (India), Cape Town (South Africa), Gothenburg (Sweden), Greater Manchester (United Kingdom), and Kisumu (Kenya)—data gaps, inconsistencies, and limited local capacity all hinder the use of data for urban sustainability [41]. Weak institutions and poor coordination also work against effective data management [47,49]. Oversight mechanisms must exist to ensure that OGD data is proactively framed for the public and reviewed for accuracy, relevance, and completeness [65,66]. Data must be published in a standardized manner, updated regularly, and disaggregated so that users can undertake precise analyses. Good search functions are necessary so that viewers can easily locate what they need.
User-friendly website design is essential to capture the public’s attention, highlight the most relevant data, and promote ease of use. Ansari et al. (2022) argue for visualization techniques that help make key data trends more engaging and relevant [67]. Simple language and clear explanations are crucial; Helbig et al. (2012) argue that many open data platforms are too technically focused, amounting to “little more than websites linked to miscellaneous data files, with no attention to usability, quality of the content, or consequences of [their] use” [68] (p. 9). The sheer volume of data can be a problem, making it more difficult to find key information and draw meaningful conclusions [4,5,13,69,70]. Limitations and assumptions built into datasets must also be stated clearly.
Public engagement and collaboration are the second main area of challenge. Low data literacy, technical barriers, insufficient incentives, and lack of awareness of OGD’s benefits can prevent effective use by those who need it most [71]. O’Connor (2015) emphasizes that frequent users of OGD portals tend to be highly educated, civically engaged individuals with strong data analytics or programming skills [72]. Kitchin (2013) and Harrison et al. (2012) note that technically oriented OGD portals do not support broad public engagement but often reinforce existing power structures and privilege those with the skills and resources to extract value from data [73,74]. Open data does not inherently lead to democratization [75,76]. For example, in Karnataka, India, the digitization of land records—promoted as a “pro-poor” initiative—ultimately disenfranchised the poor and facilitated land and wealth transfers to the wealthy, who had the means to access and exploit the data [77].
To reach its potential, open data must integrate public knowledge into planning, which requires people-centered engagement and continuous dialogue with the public [57]. Active strategies to engage the public include events and forums, conversations with diverse audiences, online platforms for direct communication, advisory groups, and efforts to develop data and applications to address specific community needs. Chattanooga, TN, shares its governmental data through Facebook and other social media platforms, maintains an open public board to track projects, and hosts monthly “hack nights” to apply open data to solving specific local issues. Denton, TX, tackled historically low voter turnout by organizing a hackathon to develop the Vote Denton application. Tacoma, WA, connects more than 2000 residents with its strategic planning data via fairs, festivals, online forums, surveys, and feedback tools [78].
Political and bureaucratic resistance to the effective use of data is a third main challenge for municipal governments. For example, Peled (2011) found that just five of 169 participating agencies accounted for 99.37% of all published datasets, while 30% of agencies had not uploaded any data for over a year [79]. Orchestrating collaboration between OGD managers and a broad range of existing or potential users is a time-consuming activity that requires political commitment on the part of municipal leaders, including mayors, councilmembers, and department heads. Dawes and Helbig (2010) find that cities tend to delay opening their data to avoid criticism for its poor usability, weak application of stewardship principles, lack of data feedback and improvement mechanisms, and inadequate metadata [80]. According to Janssen et al. (2012) “Only data that is relatively safe is publicized and dropped in the large pile” [64] (p. 261). Few communities anywhere possess a culture in which policies and programs are rigorously evaluated over time through data that is then made available to the public.

3.3. Evaluation of OGD Quality, User-Friendliness, and Relevance

There is no single, universally accepted framework for evaluating the quality and effectiveness of an OGD system. However, previous studies have considered criteria such as data quality, data trustworthiness, and accessibility (see Appendix A). Among these contributions, Kalampokis et al. (2011) emphasize that OGD initiatives should be systematically benchmarked and assessed based on the value they generate for users and society [81].
Lourenço (2013) analyzed seven international OGD portals with respect to transparency and accountability [82]. They found that the portals, while currently functioning as “simple data repositories,” had the potential to evolve their functionality and organizational structure to support community engagement for better accountability. Zhu and Freeman (2019) explored the OGD portals of 34 U.S. municipal government agencies, finding that the portals generally performed well in providing access to governmental data but did not help users understand and engage with data [83]. Thorsby et al. (2017) developed an index-based scale to describe OGDs of 37 U.S. cities, concluding that the portals were still in an early stage of development and needed to enhance user help and analysis features, such as data visualization, to improve data understanding [84]. Vetrò et al. (2016) proposed a set of indicators to measure the quality of open data in two Italian OGD portals, using a cell of the dataset as the unit of measurement [85]. The authors found that the centralized OGD released at the national level, with strong quality controls, resulted in more understandable, more accurate, traceable, and current data than the OGD from the municipal decentralized portal, which had less stringent quality controls. On the other hand, the decentralized OGD of the municipal portal had a greater extent of completeness. Máchová et al. (2018) propose a user-centered methodology for evaluating OGD portal usability based on dataset specification, feedback mechanisms, and dataset requests, highlighting the importance of designing portals around users’ informational needs and interactions [86]. More recently, the Organization for Economic Co-operation and Development reported the results of the 2023 Open, Useful and Reusable Data Index, which evaluates how governments design open data policies, engage stakeholders, and publish high-value datasets [87]. The index reveals substantial differences in open data maturity across countries, underscoring that effective OGD depends not only on data availability but also on supportive policies, institutional capacity, and user engagement.
In 2017, Bloomberg Philanthropies launched the What Works Cities Certification program to promote well-managed data practices and data-driven decision-making. Since its inception, the program has certified 250 cities with a population of over 30,000 each in North, Central, and South America. This program outlines eight foundational good practices. One of these includes open data and rates four dimensions of sustainable open data systems: relation to open data policy, the portal, user guidance, and mechanisms for user feedback [88]. “Open data policy” means that the local government has a publicly available, codified policy guiding proactive public disclosure of data and data practices. For example, Baton Rouge, Louisiana, has published a detailed 20-page-long Open Data Policy Administrative Handbook which describes the roles and duties of officials from the mayor to the data coordinator in each department, as well as policy related to metadata, data protection, prioritization, quality assessment, and management. The city conducted user interviews to refine this handbook and submitted the policy draft for public feedback before approval. An annual open data report assesses progress toward achieving the city’s goals, identifies further priorities, and establishes a publication timeline for the following year [89].
In terms of the OGD portal itself, in addition to the usual characteristics of data being free, downloadable, machine-readable, and disaggregated, the Bloomberg framework calls for it to be “appropriately contextualized with clear language, contact information, relevant policies, and/or reports and other documents” [88]. For example, the City of Arlington, Texas, has incorporated a “Your City at Work” performance dashboard providing real-time information on 87 measures related to the city’s programs and services [90].
In the Bloomberg framework, appropriate user guidance means providing both internal and external users with clear instructions on how to access, analyze, engage with, and utilize the city’s open and shared data. As one example, Pittsburgh’s Data User Guides provide detailed metadata for each dataset and describe why the data was collected, how to use it, applicable standards and software, and suggested applications [91]. Finally, Bloomberg encourages local governments to track and document feedback from internal and external users and to incorporate user needs into the design and implementation of OGD, analytics services, and transparency practices. For example, the Center for Government Excellence at Johns Hopkins University has developed a community engagement playbook that helps cities engage residents and community groups in data efforts. The playbook describes the tools, case studies, and good practices to inspire meaningful engagement with diverse stakeholders [78].
Building on previous OGD evaluation frameworks [82,83,84,85], this study synthesizes recurring evaluation criteria into four complementary dimensions that are particularly relevant to planning and sustainability applications: (1) breadth of portal content, (2) structure of governance, (3) user-friendly support, and (4) equitable user access. These dimensions provide the analytical framework for evaluating OGD portals in this study (Table 1).

4. Materials and Methods

4.1. Sample and Data Sources

Given our interest in understanding the implications of open data for sustainability planning, we chose to examine the 19 U.S. cities ranked in the Arcadis Sustainable Cities Index 2024 report (SCI 2024) (see Appendix B). This report assessed 100 cities worldwide based on 67 indicators of social, environmental, and economic dimensions of sustainable development [92]. The sample included all 19 U.S. cities evaluated in the SCI 2024, representing the complete U.S. subset of the 100 cities included in the global ranking. Using this list allowed us to compare OGD systems in cities rated better or worse in terms of sustainability. While other sustainability rankings exist with varying outcomes, the SCI 2024 is an independent, up-to-date international assessment that highlights a set of relatively high-performing U.S. cities (though by no means all; Portland, Austin, and Minneapolis, for example, are not represented). To maintain a consistent and transparent sampling framework, we included the complete U.S. subset of cities evaluated in the SCI 2024 rather than supplementing it with cities from other sustainability rankings. The SCI 2024 is widely recognized, with other ranking systems referencing its data. Because the study is based on this predefined sample rather than a representative sample of all U.S. municipalities, the findings should be interpreted as indicative patterns within this group of cities rather than statistically generalizable to all U.S. cities.
For this group of cities, we examined five main types of data: the OGD portals themselves; local OGD policies; municipal general plans; municipal sustainability/climate action plans; and interview data from OGD and planning experts (links to documents are contained in Appendix C). The data collection identified 15 out of 19 OGD policies through the portals or the websites of their oversight agencies; the remaining four cities did not have a formal OGD policy. Eighteen of these nineteen cities have general plans (also known as comprehensive or master plans); Pittsburgh is the only city without one. All 19 have sustainability/climate action plans that emphasize diverse aspects of sustainability. For example, Dallas emphasizes the environmental dimension of sustainability planning in its Comprehensive Environmental and Climate Action Plan. In addition to climate initiatives, New York City addressed the categories of equity, economic growth, and resilience in its One NYC 2050: Getting Sustainability Done plan [93]. Los Angeles focuses on “combating climate change” and “promoting equity and sustainability” in its Green New Deal plan [94] (p. 7). Washington, DC, has two plans: the Clean Energy DC Climate and Energy Action Plan and Sustainability DC.
The study conducted semi-structured interviews with city officials to examine experts’ perspectives on OGD, refine our findings on the relationship between OGD and urban planning, and frame potential strategies for improvements. The interviews included open-ended questions addressing organizational and functional aspects of OGD and planning. To recruit participants, we sent invitation letters along with a questionnaire to the official email addresses of OGD and planning offices in all 19 cities included in the study. A total of 10 officials representing seven cities participated in the interviews, including both higher- and lower-ranked cities. Four interviews were conducted synchronously in person, while six were conducted as asynchronous email interviews. The respondents included OGD managers and coordinators responsible for developing policies and strategies, an OGD coordinator, a planning expert involved in disclosing and publishing OGD, an expert promoting OGD initiatives, and an IT expert providing technical support. This diverse group of participants ensured a variety of perspectives on the topic.

4.2. Data Analysis

The study began by reviewing the current OGD portals of 19 U.S. cities from March to May 2024 to provide our user-friendliness assessment of these OGD portals. Specifically, the analysis examined how local OGD portals differ across cities in their user-friendliness and how these variations may influence sustainable urban development. To analyze user-friendliness, we examined how OGD portals vary across cities in terms of (1) breadth of portal content, (2) structure of governance, (3) user-friendly support, and (4) equitable user access.
Breadth of content assesses data categories, export formats of files, the number of datasets, and applications that help users engage with the data. Governance refers to a clearly defined management structure, which may include a Chief Data Officer, the Mayor’s Office, a dedicated OGD team, and an advisory committee. User-friendly support refers to guidelines, materials, and tools that facilitate understanding of OGD. Equitable user access focuses on efforts to promote active participation by a variety of stakeholders through data request mechanisms, support centers, blogs, and events (see Table 1). These four criteria represent complementary dimensions for evaluating OGD portals rather than equally weighted measures of user-friendliness and provide a comprehensive framework for assessing how OGD portals support planning and sustainability.
According to the SCI 2024 report, the top half of cities refers to the nine highest-ranked U.S. cities, while the bottom half refers to the nine lowest-ranked. The 19 U.S. cities included in this study were ranked between 35 and 78, placing them approximately in the second and third quartiles of the SCI 2024 index. The median rank among the sample was 66, represented by Phoenix [92]. To analyze the data, we divided the sample into two groups: high-ranked sustainable cities (ranks 35–65) and low-ranked sustainable cities (ranks 67–78). The median split was used solely as an exploratory analytical approach to facilitate comparison between the two groups and should not be interpreted as representing statistically meaningful categories or causal relationships between sustainability performance and OGD maturity. It is important to note that due to the small sample size, further research is needed to validate these findings. Only descriptive statistical analysis was used to assess differences between the two groups.
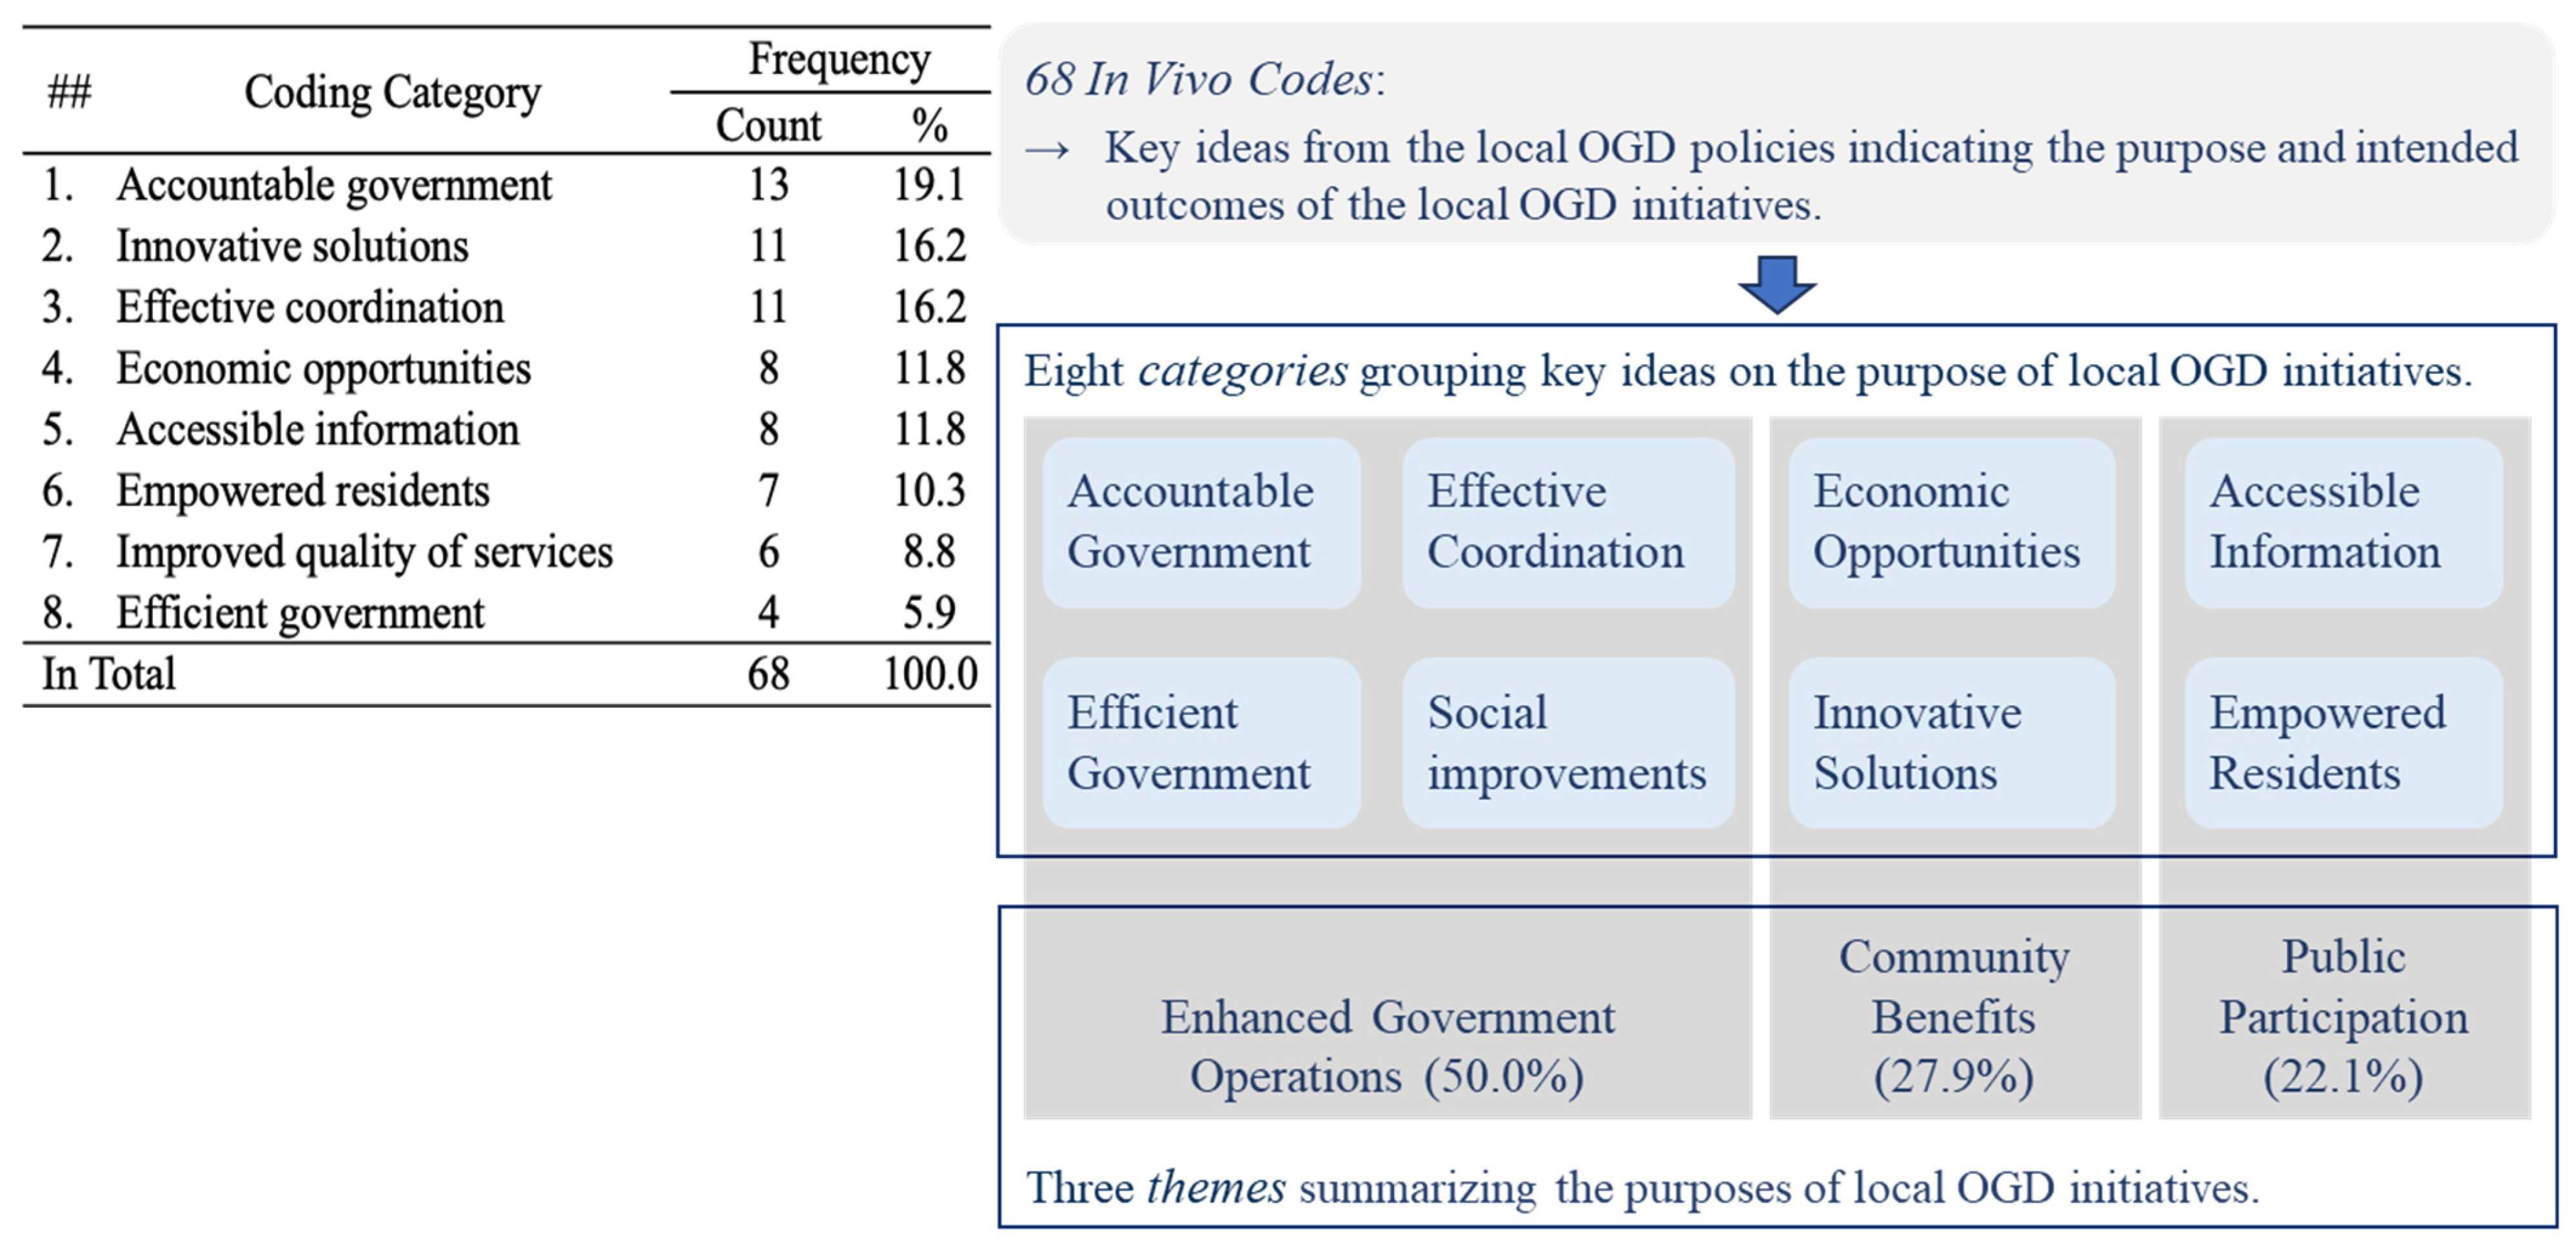
In our analysis of cities’ OGD policies, we examine expected purposes. In the study, we used In Vivo coding in Microsoft Word to analyze main categories and themes within policies, employing a three-cycle coding process (see Figure 1).
First, we summarized the purposes of the local OGD initiatives with 68 In Vivo codes using words and short phrases from OGD purpose statements to condense the text into key ideas while preserving meaning [95]. Next, we categorized the main intentions of cities’ OGD policies into eight categories, indicating the purposes of these initiatives. Finally, by analyzing topic frequencies, we identified three main themes: (i) enhanced government operations, (ii) community benefits, and (iii) public participation. For example, In Vivo codes referring to accountability and transparency were grouped into the category “Accountable Government,” which was subsequently synthesized into the broader theme “Enhanced Government Operations” (Figure 1). The coding and analysis were conducted by a single researcher using predefined evaluation criteria derived from the literature to ensure a consistent analytical approach across all policies. Additionally, to gain a comparative perspective, we interviewed experts to find their expectations of OGD initiatives.
To examine how general plans and sustainability/climate action plans of the cities interrelate with OGD initiatives, we conducted a content analysis of the relevant documents. Specifically, we applied the search terms ‘open data’, ‘open government data’, and ‘OGD’ and used the resulting frequencies to characterize linkages. Search results were manually reviewed in context to confirm their relevance. Plans using substantially different terminology may not have been identified, representing a limitation of the study.

5. Findings and Discussion

5.1. Characteristics of OGD Portals

The study found considerable variation in how cities design and structure their OGD platforms. All portals function as searchable catalogs, enabling users to locate datasets within categories such as transportation, housing, public safety, or city finance. However, the consistency and usability of platforms vary greatly. Some offer well-maintained, regularly updated datasets with user-friendly interfaces and visualizations, while others lack clear metadata, timely updates, or intuitive interfaces.
Many cities, such as Seattle, Dallas, and Chicago, offer curated landing pages with dashboards, featured datasets, news stories, and thematic groupings that highlight the most relevant, most viewed, and/or most recently added data. These portals also include user-friendly tools such as search bars, category filters, and introductory text to guide users. Some of the highly ranked cities on the SCI 2024 index, such as New York, San Francisco, and Washington, DC, go further by incorporating project galleries, case studies, glossaries, event announcements, support features (e.g., Q&A, appointment scheduling), performance metrics, documentation of planning and policy, and comprehensive data inventories. In contrast, Tampa and Miami present more basic designs with fewer interactive features, simply listing available data by departments.
Several cities offer unique or specialized features that extend the functionality of their portals. For example, the Los Angeles Open Data Portal includes a Records request tool with more than 63,000 searchable entries [96]. The city of Boston’s Analyze Boston portal features a Tips section and archives of training videos [97]. The City of Phoenix Mapping Portal offers a dedicated Mapping Portal that provides access to applications, interactive maps, and spatial data [98]. The City of Detroit’s Base Unit Tools organizes much information by “base units” such as address, building, and parcel [99]. The City of Houston’s Open Finance section includes data on budgets, payroll, checkbook-level transactions, and financial reports, allowing users to monitor city expenditures [100].
Despite superficial sophistication, many portals still fall short in providing accessible, policy-relevant data, especially on topics related to urban sustainability. Key measures related to greenhouse gas (GHG) emissions, motor vehicle use, transportation mode share, housing affordability, recycling rates, pollution trends, and social equity are often difficult to locate or entirely absent. These types of practice are central to the SDGs, particularly SDG 11, and their availability helps evaluate progress toward sustainability objectives [101].
Data quality and updating are also frequent issues. For instance, the Chicago Park District’s Facilities Work Order Management system was intended to be updated weekly but has not been updated since 2012. Additionally, many datasets lack complete descriptions, often failing to explain column headers or using unclear abbreviations and acronyms. Excessive data aggregation is a further problem. Agencies often release only summary data from completed programs and projects, highlight isolated metrics from large datasets without context, or fail to include breakdowns by neighborhood, demographic groups, or other meaningful classifications. This may create misleading impressions.

5.2. Assessment of OGD Portals

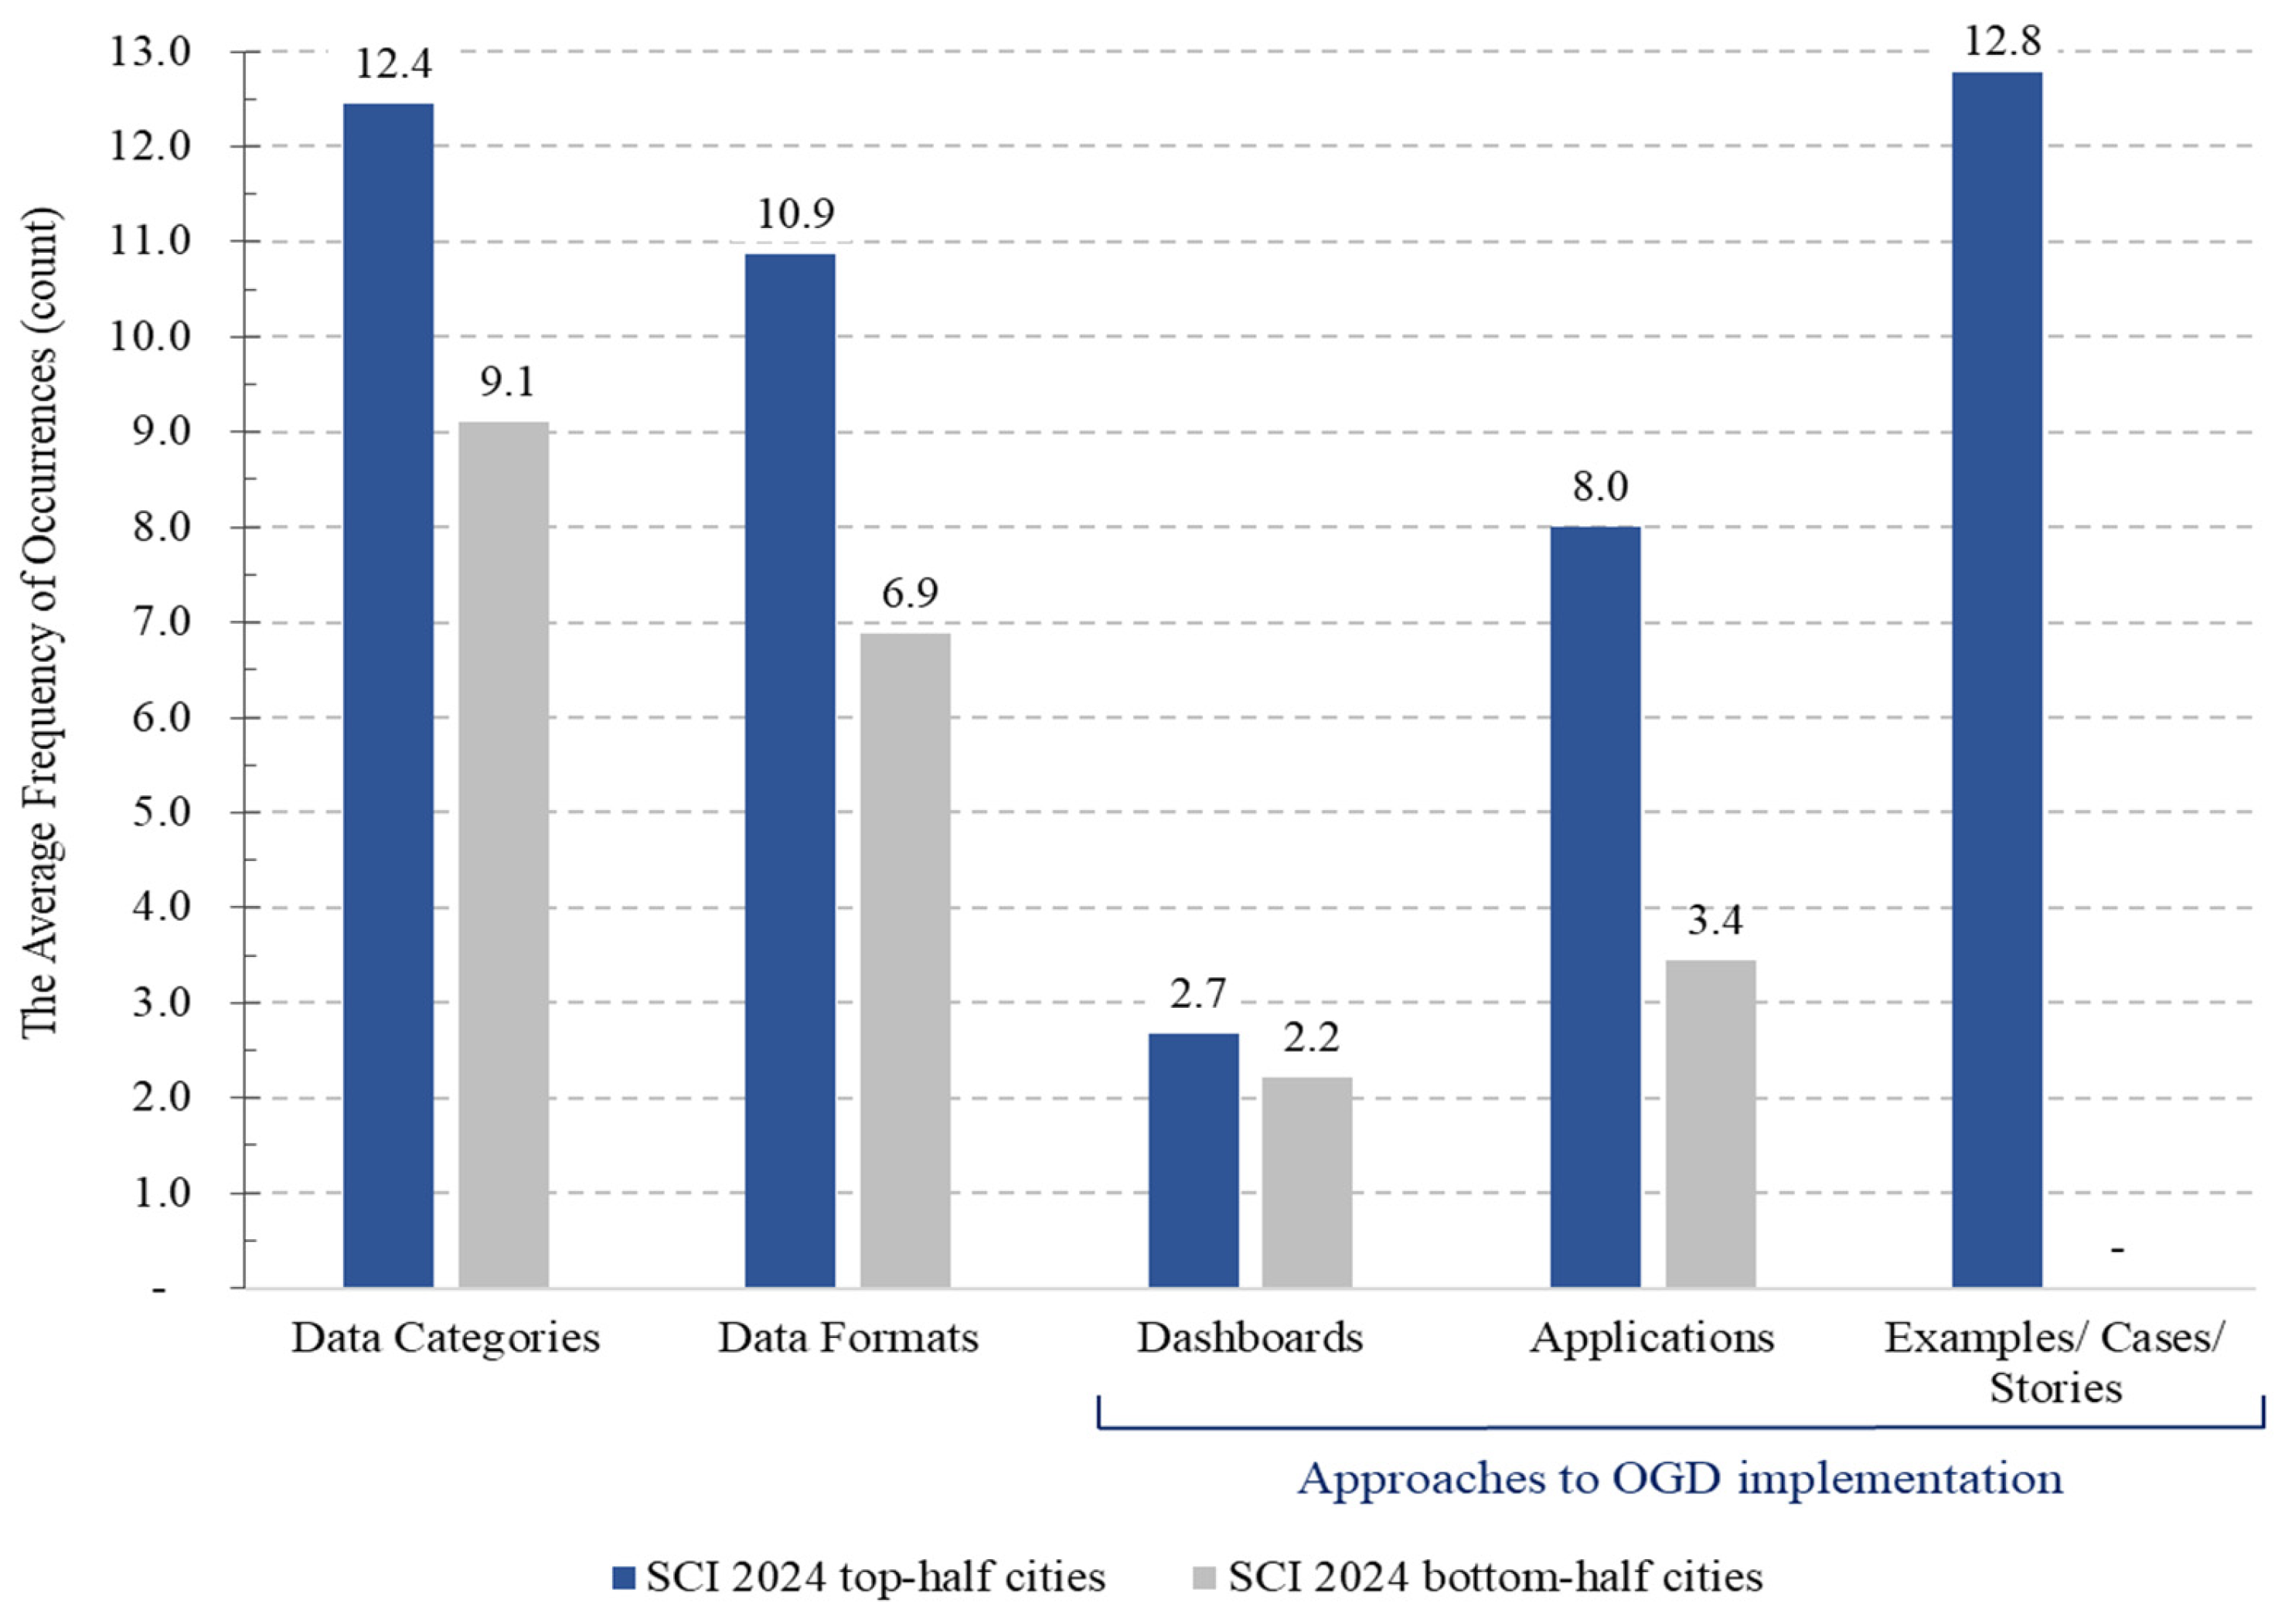
The study evaluated user-friendliness according to the four groups of criteria: (1) breadth of portal content, (2) structure of governance, (3) user-friendly support, and (4) equitable user access. In terms of breadth of portal content, the count of data categories ranged from three in Tampa to 21 in Washington, DC. On average, cities offered 11 data categories, such as environment, city government, health, food, recreation, safety, housing, culture and education, climate change, economy, and transportation (see Figure 2).
The number of export formats available was only one in Tampa (CSV), while Boston offered 18 data file formats (see Figure 2). The high-ranked sustainable cities offered an average of 10.9 formats, compared to 6.9 in the low-ranked cities. This diversity is not just a statistic but a practical advantage that supports diverse user needs and enhances the usability of the data.
The number of dashboards, applications, and case studies varied widely between city portals. High-ranking and low-ranking cities showed notable differences in the inclusion of dashboards (2.7 vs. 2.2), applications (8.0 vs. 3.4), and case studies (12.8 vs. 0.0). Not all cities develop dashboards, applications, or case studies on the use of OGD. Of the 19 cities analyzed, only seven have dashboards, ranging from 17 in Washington, DC, to two in New Orleans. Ten cities provide applications, from 64 in Washington, DC, to one in Houston. For instance, Washington, D.C., offers several dashboards; its 911 Performance dashboard displays emergency responder data while its Planting by Ward dashboard supports urban greening initiatives. Seattle’s Demographics dashboard emphasizes a Race and Social Equity Index consolidating demographic, socioeconomic, and health indicators into a single score.
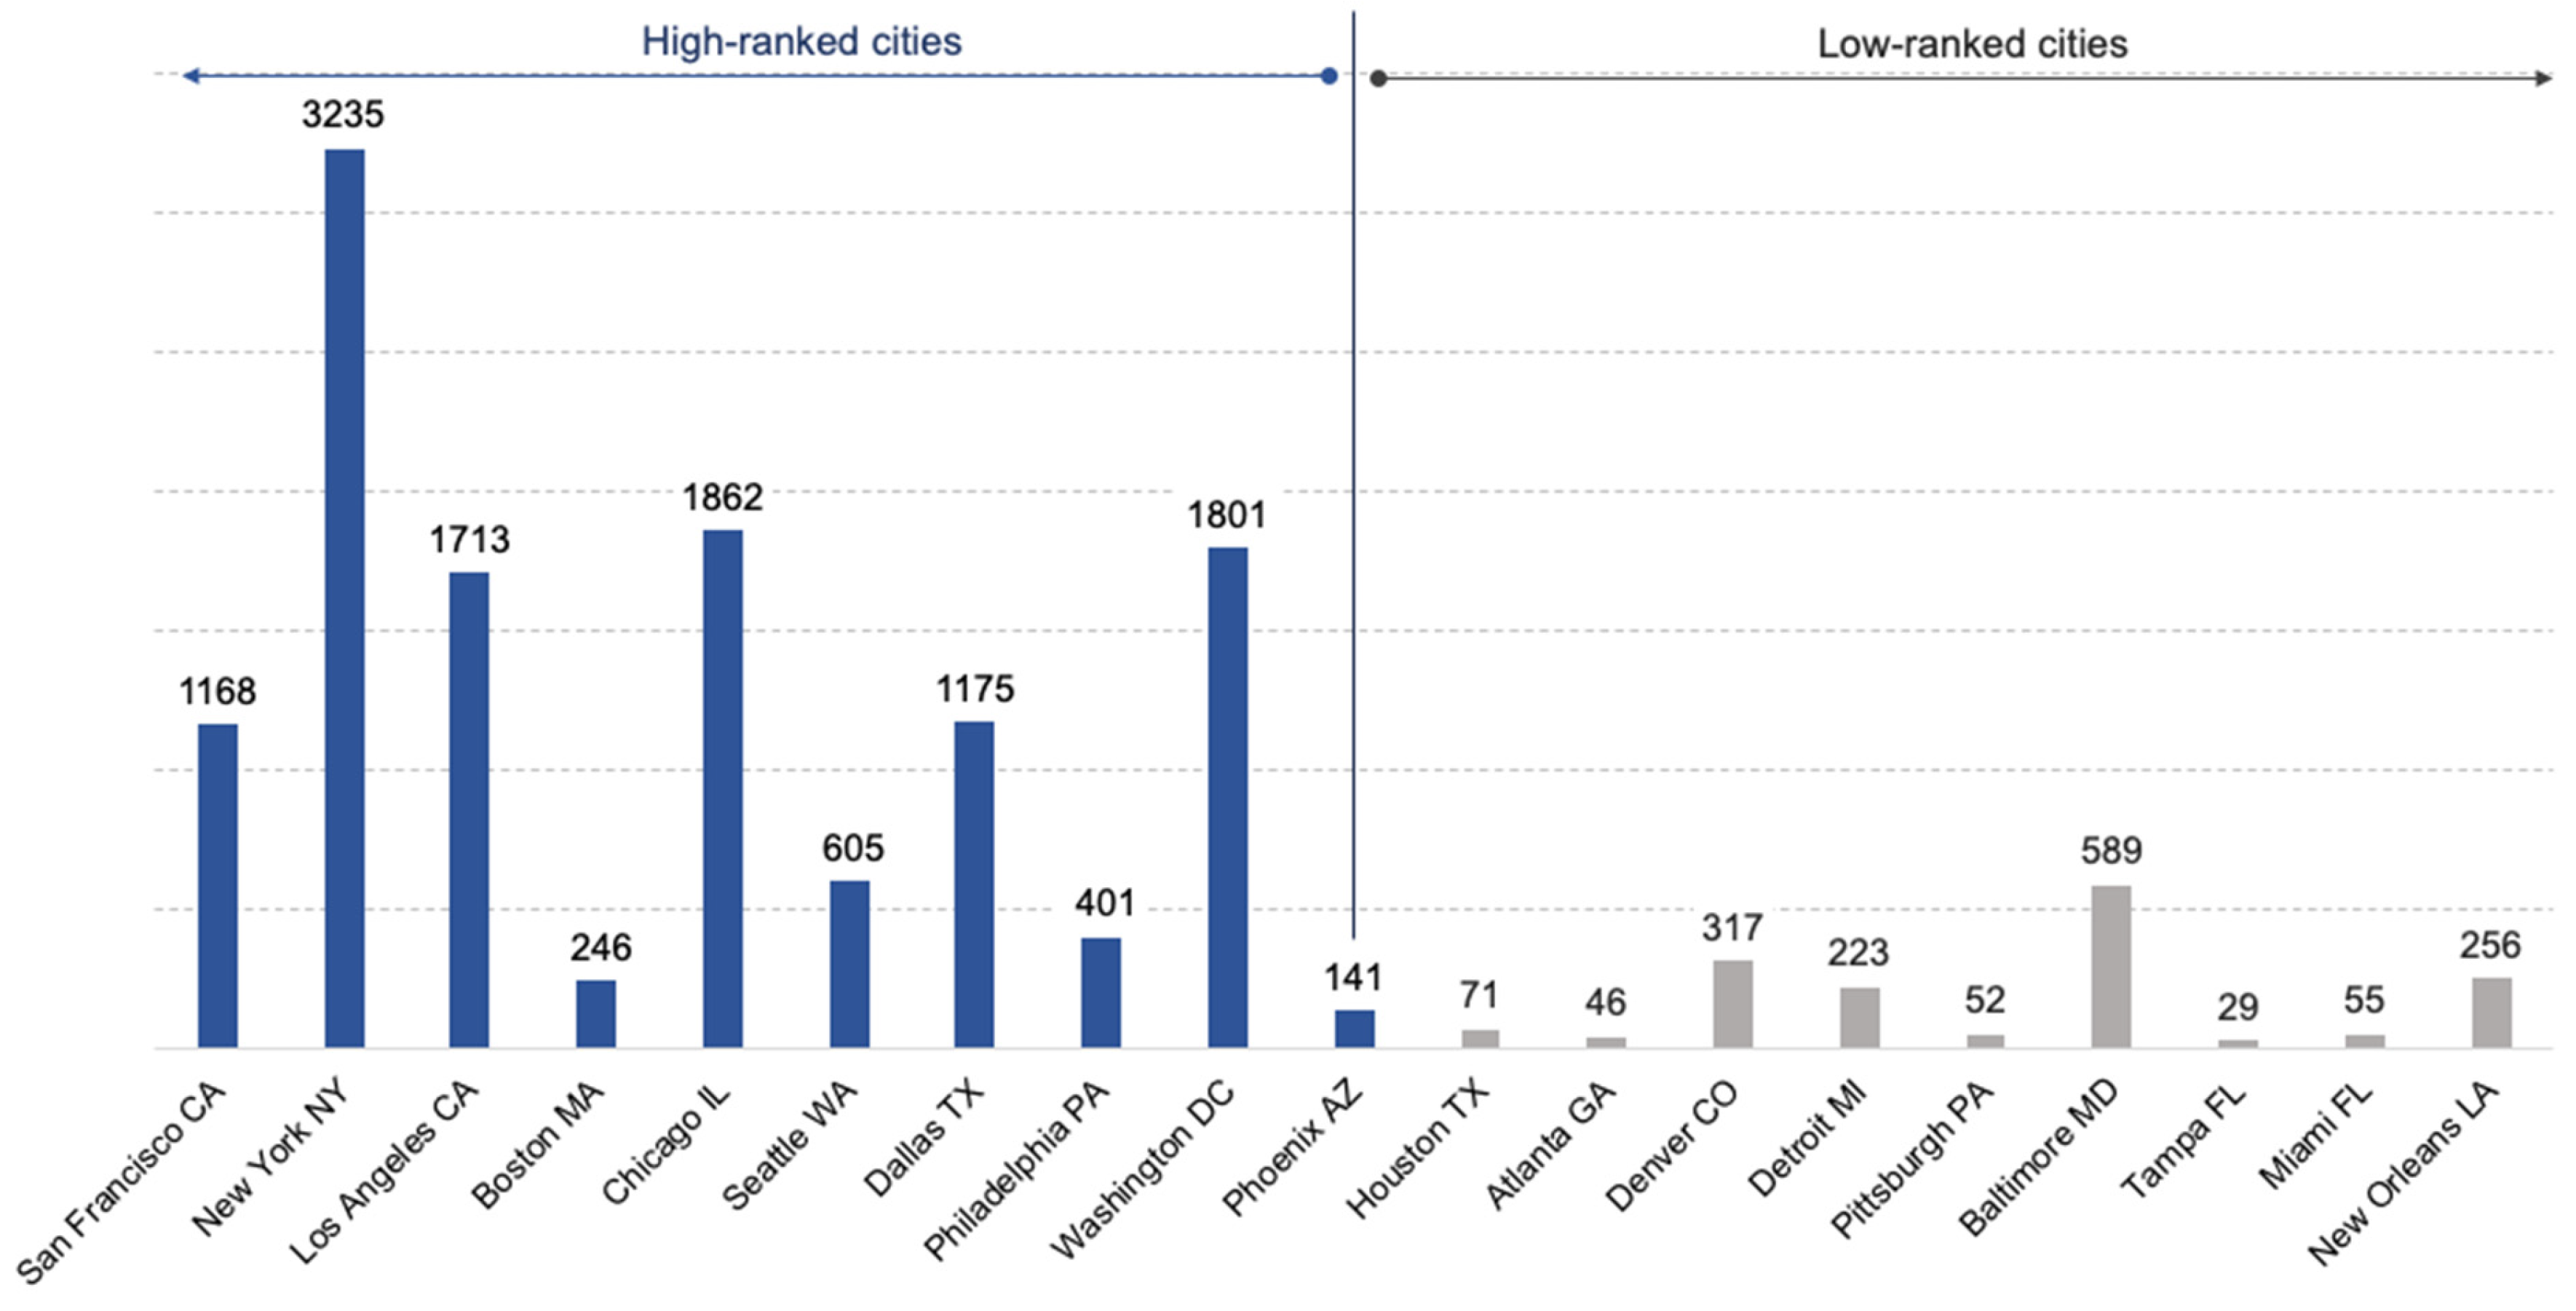
The range of datasets is uneven and shapes the capacity of OGD portals (Figure 3). Notable differences in dataset availability and portal capabilities exist between high-ranked and low-ranked sustainable cities: New York City and Chicago have thousands, whereas Tampa, Atlanta, and Pittsburgh have far fewer.
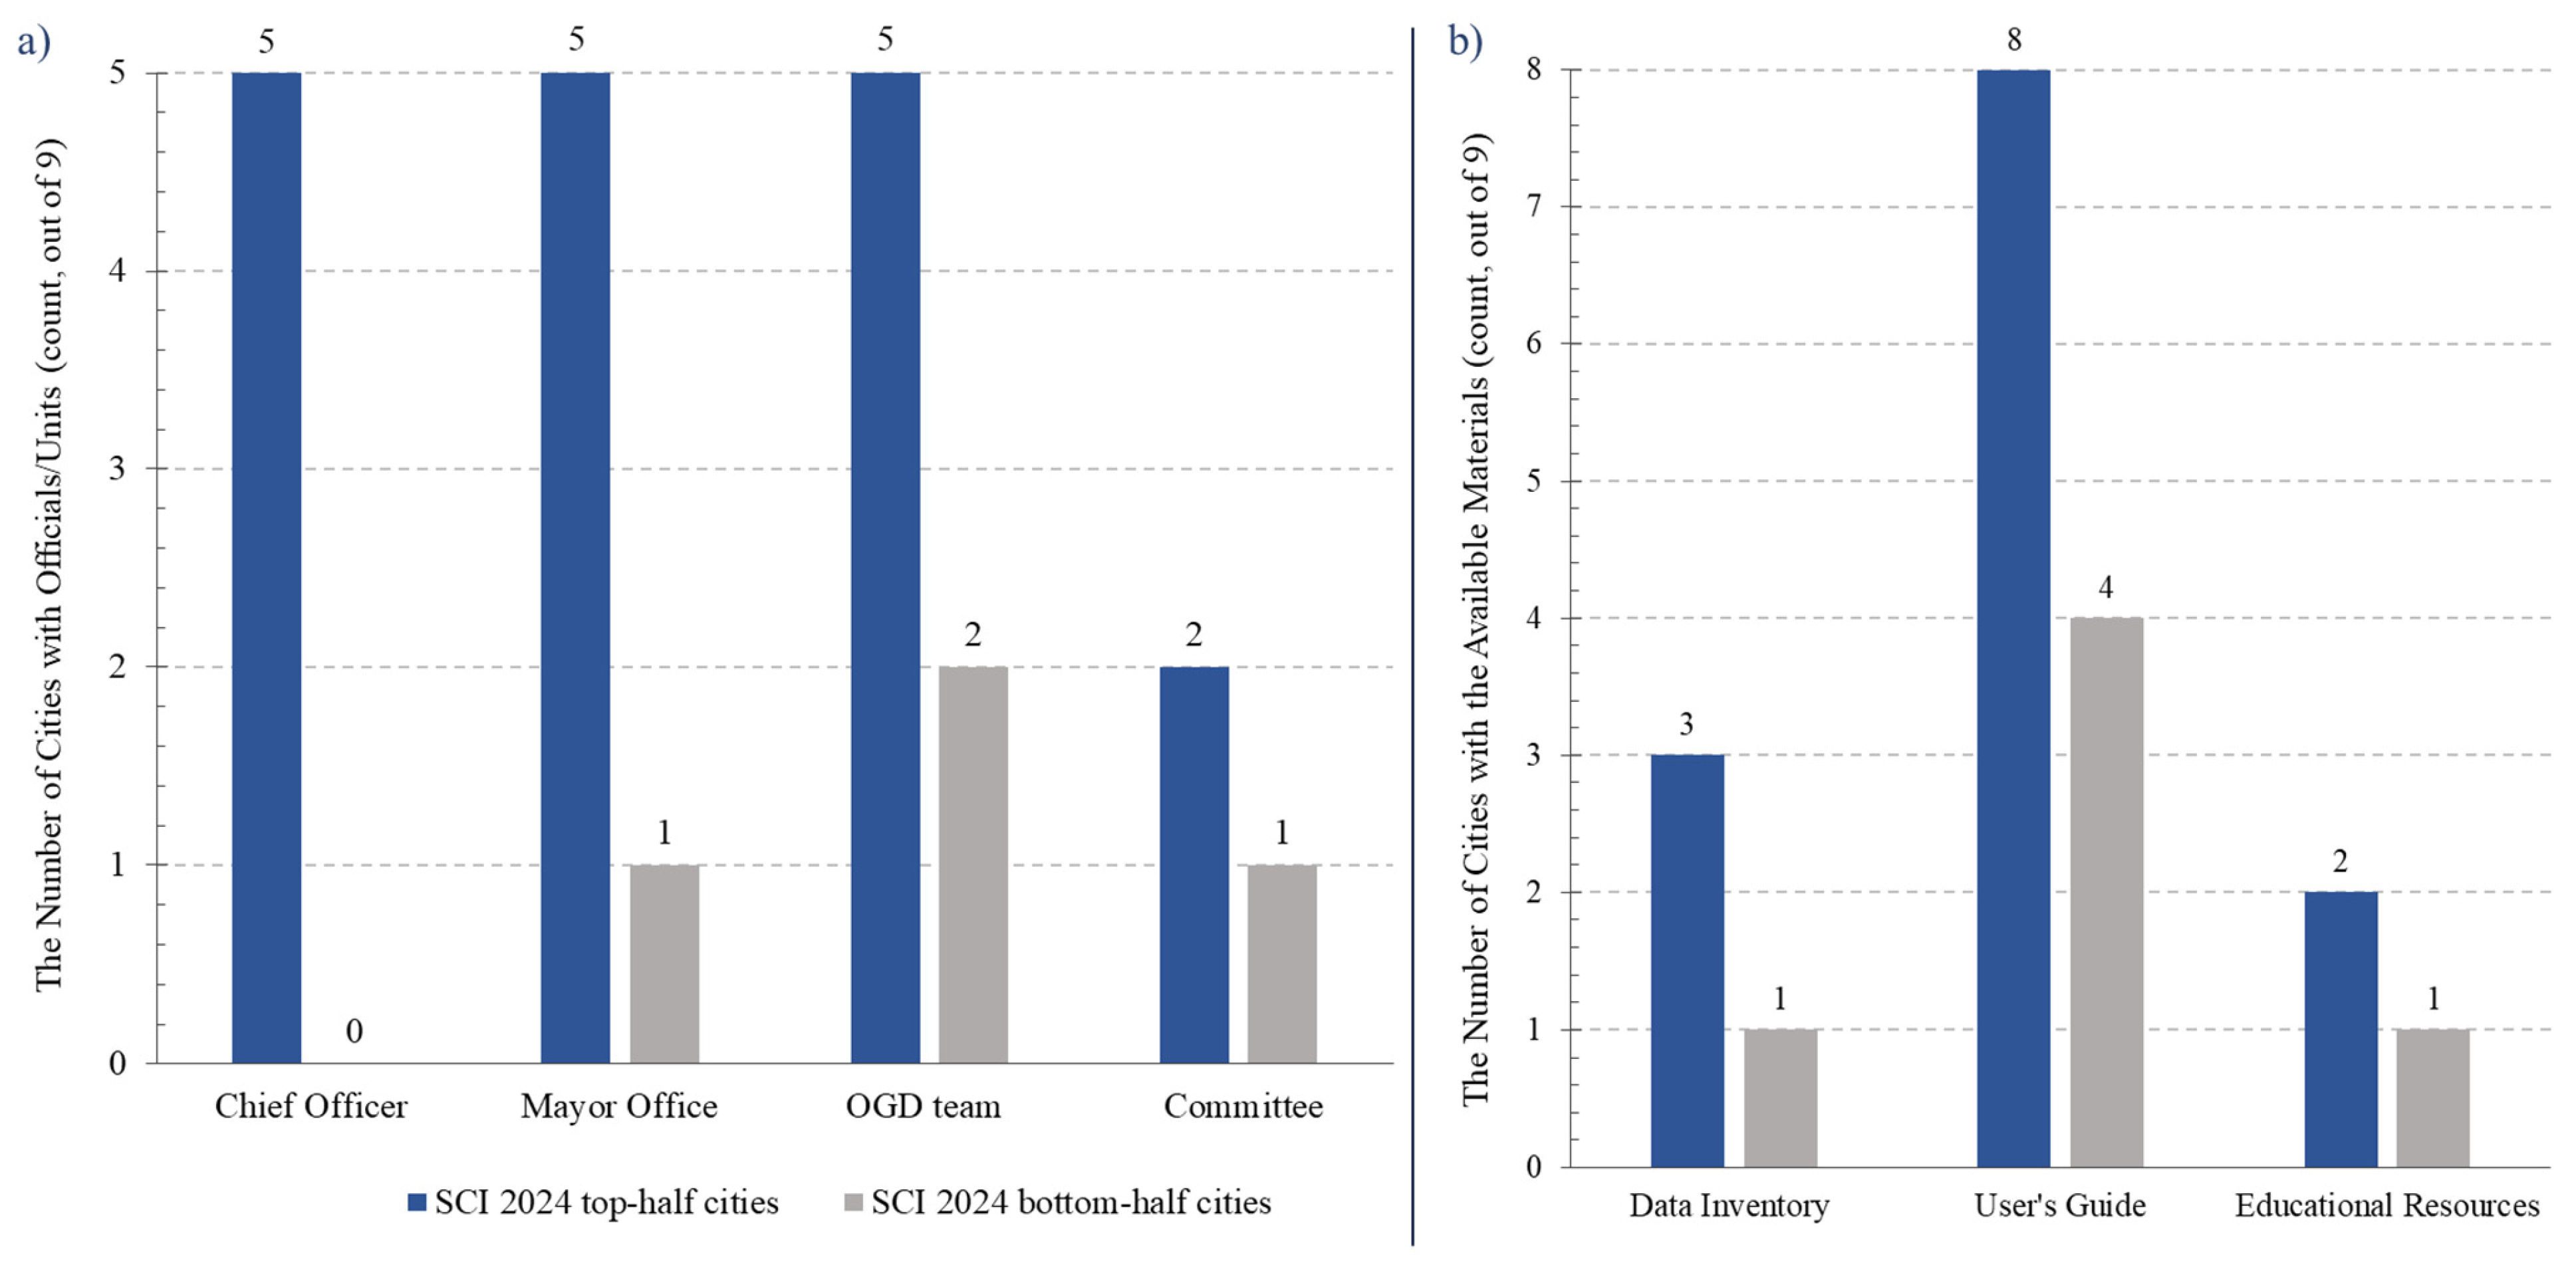
Our second set of user-friendliness criteria concerns clear and accountable oversight. This varied greatly as well. In New York, the Office of Technology and Innovation collaborates with city agencies to release datasets, manage the platform, and promote data use under the Chief Technology Officer. Philadelphia promotes transparency by listing OGD team members and their roles, including experts in geospatial tools and technology-related initiatives that address civic and environmental needs. Boston links its portal to the Mayor, Analytics Team, and Department of Innovation and Technology. Washington, DC, and Detroit rely on advisory groups of public sector and external stakeholders to guide transparency and ensure high-quality, accessible data. Only five of the nine high-ranked cities —New York, Boston, Seattle, Philadelphia, and Washington—cite a Chief Officer responsible for OGD initiatives (Figure 4a).
Similarly, five of nine high-ranked cities (San Francisco, Los Angeles, Boston, Seattle, and Dallas) mention the role of the mayor in their portals, in contrast to the single low-ranked sustainable city (Baltimore). Five highly ranked sustainable cities—San Francisco, New York, Boston, Seattle, and Philadelphia—underscore the importance of OGD teams, while only Atlanta and New Orleans do so among the lower-ranked cities.
Our third criterion focuses on user support and includes the presence of a dataset inventory, user guides, and educational resources. Creating a dataset inventory is a crucial requirement for tracking citywide data systems and identifying valuable datasets. Overall, only these four cities apply inventories (see Figure 4b). San Francisco offers an inventory with 1183 entries, making it the most viewed (16.7 K) and downloaded (56.1 K) dataset on its portal. New York provides an interactive inventory dashboard with filters by agency, update time, and more. Washington, DC, organizes its inventory by data sensitivity and includes searchable, interactive features. Among low-ranked cities, only New Orleans has a prominently placed inventory with similar search options.
All high-ranked cities except Philadelphia provide comprehensive user guides. New York includes a ‘Getting Started’ section with step-by-step tutorials, while Boston offers training videos on navigation and dataset use. In contrast, low-ranked cities usually lack such resources. San Francisco, New York, and Baltimore offer OGD-related classes to the public. The latter gives city employees credit for attending classes covering topics such as coding, Python, and software development using OGD data (see Figure 4b).
Another key difference in sustainable city portals is the availability of educational resources to build users’ skills. San Francisco, New York, and Baltimore offer OGD-related classes. New York outlines class details, including content on OGD history, dataset use, filtering, visualization, and tools for advanced users. San Francisco’s Data Academy provides a course catalog, calendar, and instructor open to all users. Baltimore offers data literacy training with no prerequisites and includes credit for city employees, covering topics such as coding, Python, and software development.
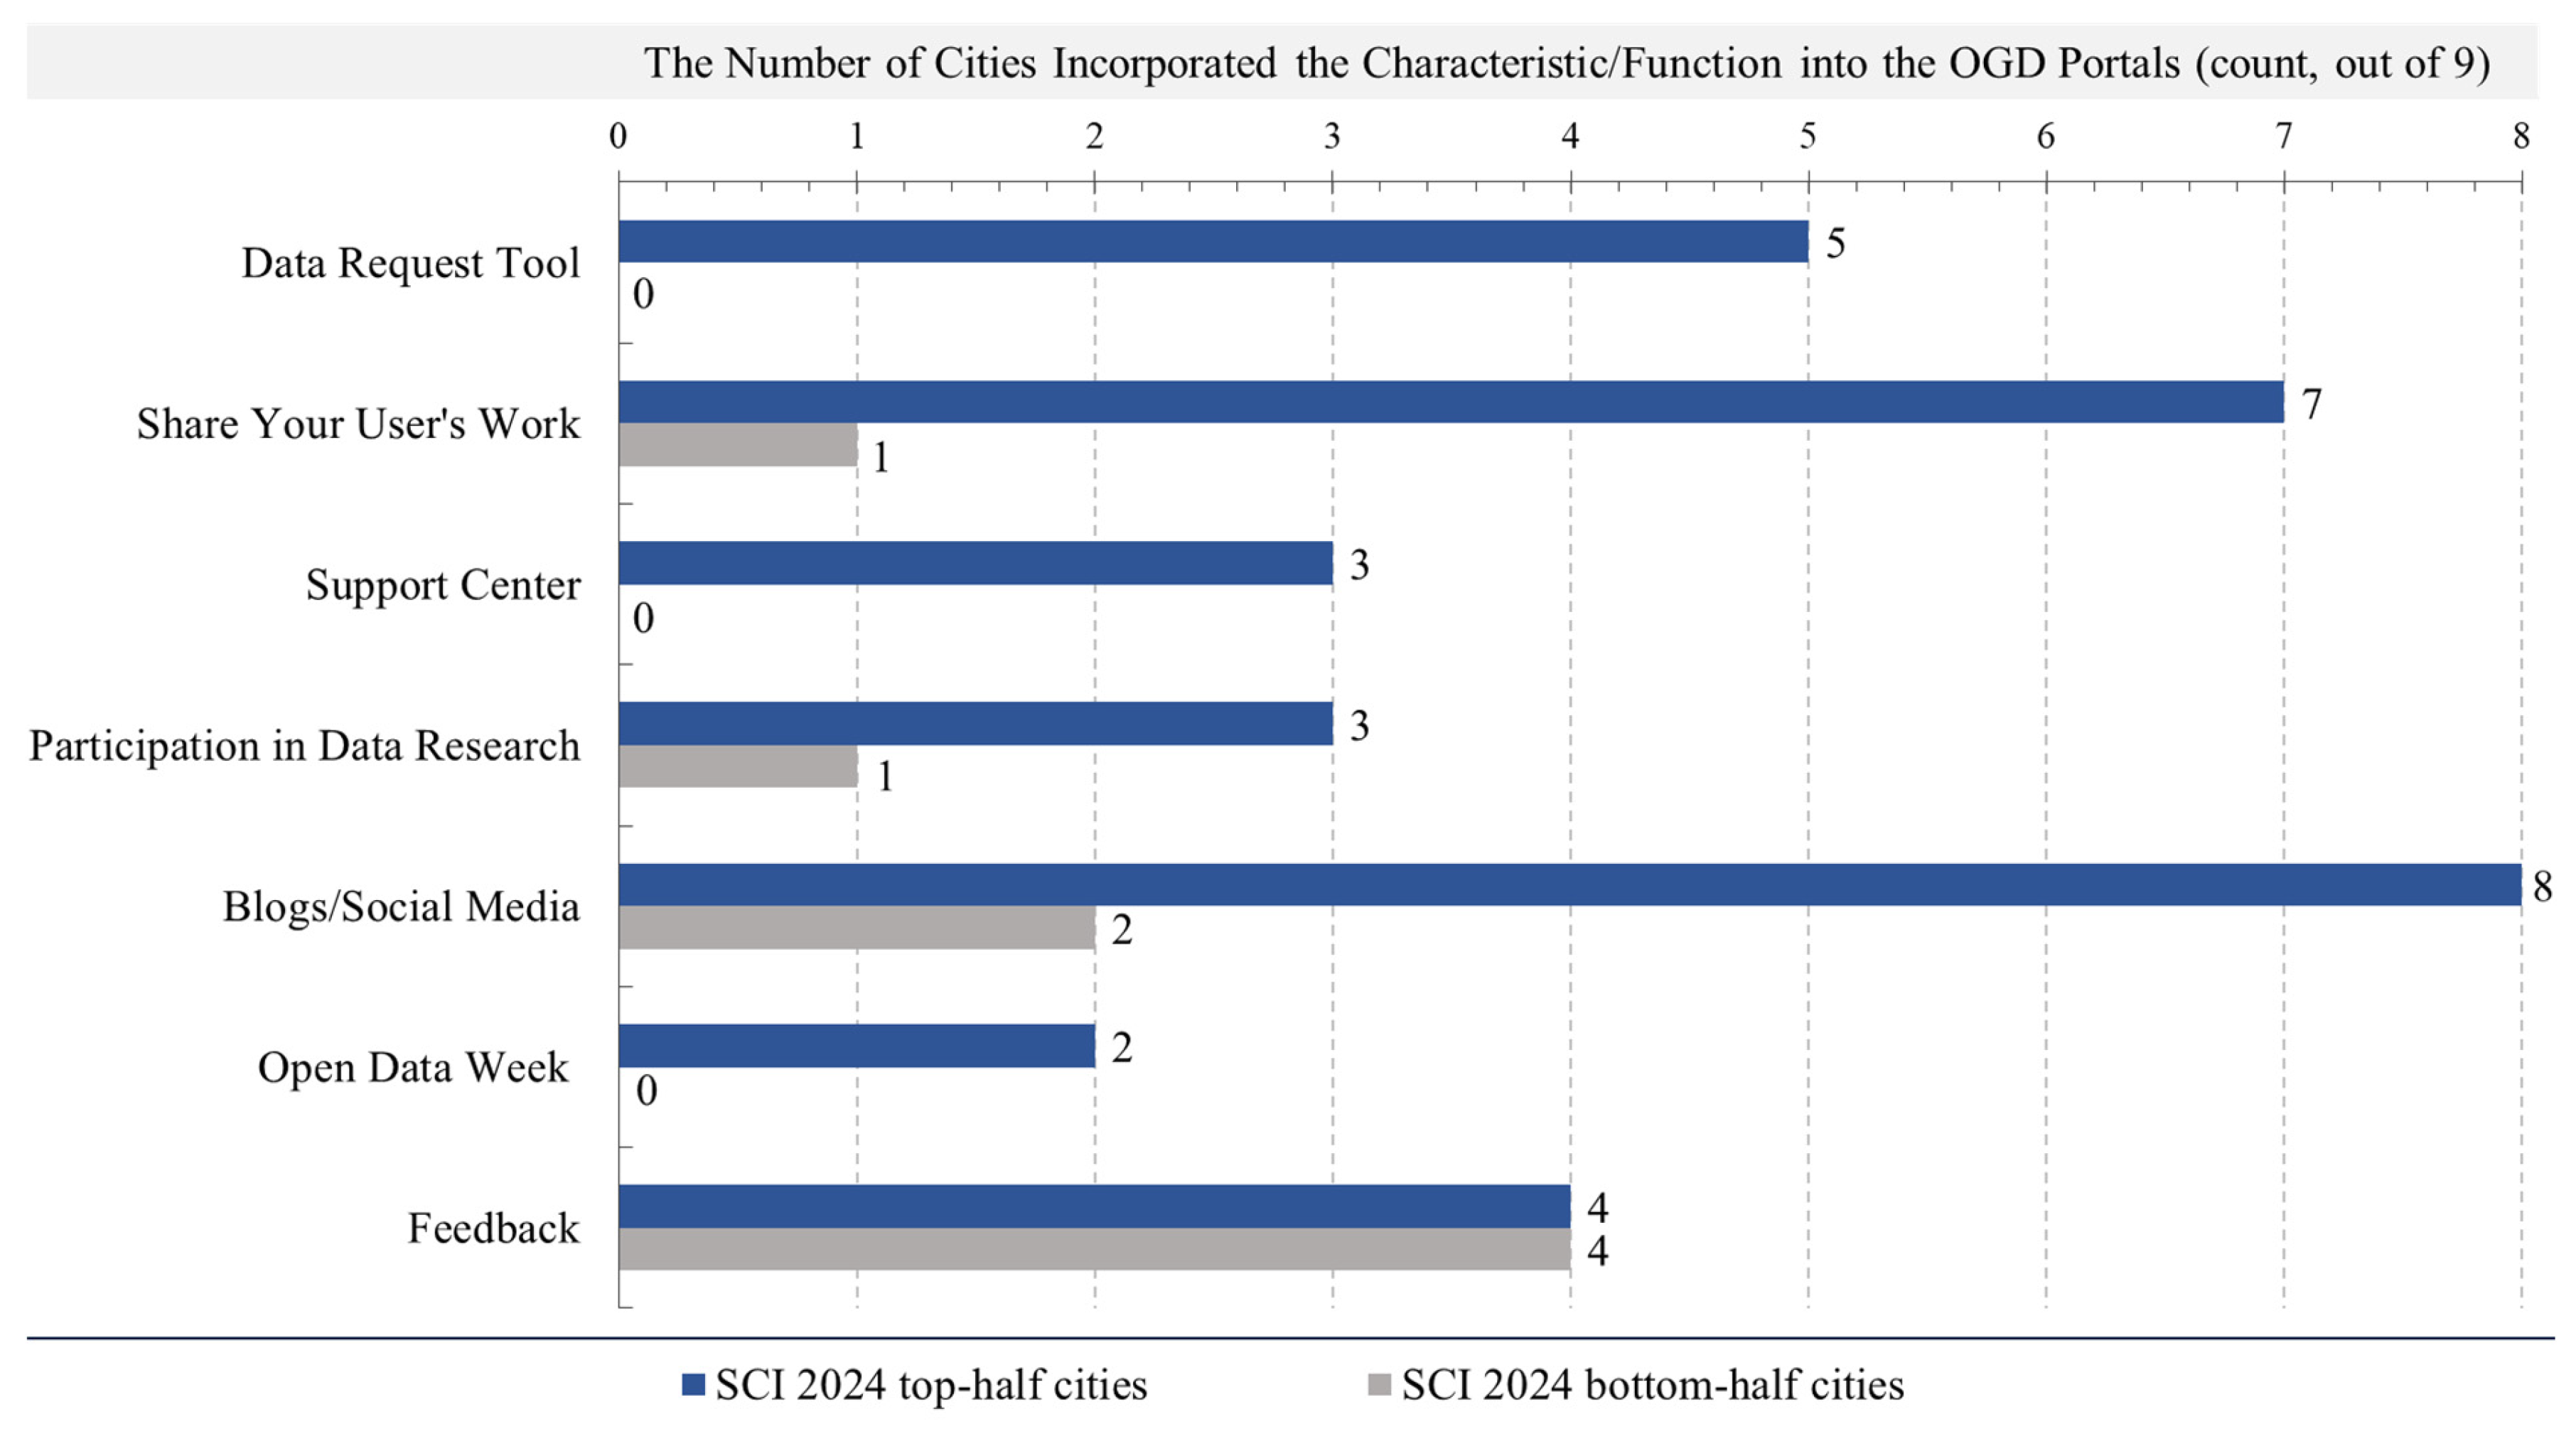
Finally, equitable user access is a core element of user-friendliness. Elements enhancing this include a data request tool, a support center, procedures for sharing users’ work and encouraging involvement in data research, a blog and/or social media engagement, Open Data Week activities, and procedures to solicit feedback (see Figure 5).
San Francisco offers a public records request link, a support team email for assistance, and the option to book office hours with San Francisco Data Portal (DataSF) for personalized help. Los Angeles allows users to submit records requests and access over 63,000 previously requested records. Dallas hosts an Open Records Center where users can request specific datasets and track the status of their requests. Seven of the high-ranked cities—San Francisco, New York, Boston, Seattle, Washington, Philadelphia, and Los Angeles—allow users to showcase OGD-based apps or projects on the cities’ portals. Detroit organizes city visualization contests and art galleries through its portal, showcasing the work of GIS professionals, students, and enthusiasts. Washington, DC, and New York host Open Data Week events, including talks, exhibitions, workshops, and conferences. However, cities were less successful with blogs, which must be regularly updated and marketed to be most useful. Seattle’s GitHub, intended to make city-generated data publicly accessible, has zero posts and has not been updated since 2018. Only four of the nine high-ranked and four of the nine low-ranked sustainable cities offered feedback options, for example, through email links, forms, or user surveys. This crucial aspect of community engagement seems underappreciated.
One problem for many sites was the design of search functions. Well-designed search tools can help users efficiently locate relevant datasets. Poorly implemented features can lead to important data being overlooked. For example, the Boston and Phoenix portals do not allow users to filter by type of data (charts, maps, and stories), limiting their ability to explore data efficiently. Searching for keywords such as “flood vulnerability” in San Francisco and New York revealed that although both cities have relevant datasets, differences in how data is tagged and organized cause some datasets to be missed in searches.

5.3. Relation to OGD Policies

Open data policies varied widely between these 19 cities. Typically, these policies set forth the purpose, goals, and principles of local open data initiatives, the roles of city agencies and committees, and the responsibilities of senior officials and units. Some specify the format of information and the frequency of publications. Cities such as New York City and San Francisco have developed extensive policies, which they publish along with detailed documents such as a Data Standards Handbook, Data Visualization Guide, and Data Standards Guide. Other cities like Dallas and Phoenix have only brief policies.
Only two (13.3%) out of 15 cities (four do not have OGD policies at all) provided real-life cases of using OGD policies (Table 2). Los Angeles OGD policy stated, “Open data and analysis have already been the hallmark of the successful application of COMPSTAT in the Los Angeles Police Department, spurring innovation and producing dramatic and tangible reductions in crime each year for the past decade,” highlighting the role of community collaboration in driving these outcomes [102] (p. 1). New Orleans’ OGD policy referenced an implemented initiative that made neighborhood blight data publicly accessible, enabling residents and community groups to analyze the data and collaborate with the city. This partnership strengthened the city’s efforts with neighborhood groups and residents, advancing blight remediation and demonstrating the potential of open data to support community-driven solutions [103].
Three common priorities emerge from In Vivo analysis of OGD policies: (i) enhanced government operations, (ii) community benefits, and (iii) public participation (See Figure 6).
In contrast, interviewees emphasized public participation most highly and noted that community engagement with OGD is relatively low. They particularly mentioned the development of civic tools, the formation of public–private partnerships, and mechanisms for community feedback as key benefits. According to one, “People do not know what OGD is and why it is important for government transparency…they also do not know how to use it for advocacy.” Another commented that OGD has yet to generate two-way collaboration, saying that open data is still “a one-way road transporting data from city agencies to whoever would use it.”
Community benefits from utilizing the open data for innovative solutions and economic advancement were the second most popular theme among the purposes of OGD policies. Twelve out of 15 cities emphasized at least one category relevant to community benefits in their OGD policies. However, in the interviews, our respondents mentioned community benefits least frequently, compared to enhanced government operations or public participation. While the respondents generally admitted that OGD can support economic growth and innovation, they primarily linked economic benefits to developing applications based on local OGD and establishing additional economic value for a city or its businesses. “There could be a positive outcome and a business application of the data,” a data coordinator of one city said, “but keep in mind that not every dataset is economically beneficial”.
The extent to which OGD portals fulfill the objectives of OGD policies is difficult to ascertain. Many policies are not clear about which data should be disclosed, with OGD coordinators noting that “agencies decide what data gets published as open data” and “certain departments retain control over their data, citing the sensitive nature of the information or contractual restrictions, which makes it exclusive.” Some cities provide raw data in forms difficult for the public to understand, or else provide datasets only upon request, strategies that do not completely fulfill transparency goals. These findings are also consistent with the evaluation criteria presented in Section 3.3, particularly those related to data accessibility, user support, and equitable user access, which emphasize that OGD should be understandable and usable by a broad range of users. The scope of the OGD goals that the policies claim to address is usually limited. For example, the OGD policy of Dallas was primarily centered on the concepts of accountable government and effective coordination, without explicit references to public participation and community benefits. Similarly, Baltimore emphasized access to high-quality data, but did not explicitly link OGD to enhanced government operations or other community benefits. This mismatch may influence implementation by creating differences between the objectives emphasized in OGD policies and the practical priorities identified by practitioners. While policies frequently emphasize community benefits, practitioners highlighted that public participation remains limited, agencies retain substantial discretion over dataset publication, and barriers to data accessibility persist, all of which may affect how OGD initiatives are prioritized and implemented.
Overall, OGD experts added, “I think we are in the infancy of the data being largely useful; as data becomes more common in decision-making, open data will certainly play a greater role in the development of our city.” They observed that the actual contribution of local OGD to sustainable development remains limited and could be significantly strengthened through better policy integration.

5.4. OGD and Plans (General Plans + Sustainability/Climate Action Plans)

Although it would seem natural that portals would mention relevant planning documents and goals in conjunction with data, and also discuss OGD data sources within plans, this still seems far from the norm. Seven out of 19 cities (36.8%) in our sample consistently integrated OGD with general plans or sustainability/climate action plans (see Table 2). Several interviewees highlighted the lack of topical and accessible data, as well as limited awareness of open data among decision-makers, as possible reasons for this. As one put it, “Currently, there isn’t much that OGD is helping to solve. Rather, we contribute to OGD after our projects are completed, making the data available for further research.”
Three cities— Baltimore, Chicago, and Phoenix —specifically incorporated OGD into their general plans and mentioned OGD as a tool for tracking the city’s progress and aiding decision-making. Perhaps not coincidentally, all three of these plans are relatively new (2023 or after).
Baltimore’s comprehensive plan provides examples of how OGD initiatives can be planning tools. The plan’s water section references the “Surface Water Quality Data 1995 to 2024” dataset on the Open Baltimore portal and uses this data as evidence to support the creation of a new sanitary sewer overflow wastewater system. Meanwhile, another section of the plan highlights the “Public Art Inventory” dataset from the portal, which engaged residents and community stakeholders for feedback [104].
The City of Chicago’s framework plan recognizes its OGD initiative as a key tool for enhancing government transparency and improving data access for residents. According to the plan, every Chicago resident should be able to find city records in “a user-friendly way with sufficient context to identify and understand the information.” To accomplish this, the plan outlines goals such as developing “a best-in-class practice of affirmative and automated release of data,” ensuring equitable access to data, and making it easier for people “to understand and participate in the public body processes” [105] (p. 44). Bar charts illustrate the most frequently accessed datasets—such as traffic crashes and crimes, which received over 23.2 million visits between 2021 and 2022—and the city departments contributing the most datasets to the local OGD portal, including Budget and Management, Public Libraries, and Public Health [105] (p. 45).
Phoenix’s PlanPHX 2025 general plan highlights its OGD initiative as a tool for tracking progress toward 42 goals [106]. However, aside from a link to the Phoenix Open Data web portal, no further details are provided. It would have been useful if the city had identified particular datasets or visual tools that could showcase progress toward each goal.
To summarize, cities rarely consider their OGD initiatives in their general plans aside from the prime role of the tool of communication and data storage. The analysis suggests that a lack of awareness about the potential capabilities of the local OGD initiatives, both among the city officials and the data users, played a part in this situation. On the other hand, the lack of topical and accessible data that can be easily understood and utilized by various users could be another factor here. The respondents of our interviews partially communicated both these points: several respondents mentioned limited awareness of OGD among the potential data users.
Only four of 19 cities—San Francisco, Boston, Los Angeles, and New Orleans—referenced OGD in their sustainability/climate action plans. Based on the city’s existing data capabilities, including the DataSF OGD portal, San Francisco aims to establish “robust monitoring, evaluation, and reporting (MER) systems that enable stakeholders to track key [climate and equity] metrics and understand progress” [107] (p. 127). The city’s 2021 Climate Action Plan emphasizes the need for more disaggregated data, particularly by race, to make discriminatory policies “evident across every social indicator” [107] (p. 44).
Boston discloses Building Energy Reports on its OGD portal to support steps to reduce energy use. In 2013, Boston enacted the Building Energy Reporting and Disclosure Ordinance (BERDO), which requires all buildings of 35,000 square feet or larger to report their energy and water use to the city annually. This information is publicly available on the city’s OGD platform. BERDO data showed that the first cohort of buildings subject to the reporting requirement reduced their average energy use by 7% between 2014 and 2017. In addition to annual reporting, buildings must either demonstrate a 15% reduction in energy use or emissions every five years or conduct a detailed assessment of options for energy reduction [108]. In 2021, Boston launched BERDO 2.0 with phased GHG caps starting in 2025, backed by a $3.5 million retrofit fund and an open-data strategy to cut emissions and energy use [109]. This initiative is a strong example of how pairing policy with open data can support sustainable urban planning.
Los Angeles’ Green New Deal sustainability plan points to the city’s OGD portal along with global platforms as tools to ensure commitment and transparency [94]. However, the OGD portal’s Environment and Sustainability Development category folder had no data available as of 2025.
New Orleans integrates OGD to enhance transparency and support climate action. The city includes climate-related data to implement sector-based strategies for reducing community GHG emissions while monitoring key performance indicators, such as waste and recycling volumes, and energy usage. Specifically, the implementation plan outlines actions, tasks, and statuses under the “Assemble and make data available for analysis and action” section [110] (p. 61). At the start of this process, a few waste and recycling data points were available in the Environment category of the city’s OGD portal. By incorporating OGD into its climate strategy, New Orleans aims to improve transparency, facilitate data-driven decision-making, and engage the community in sustainability efforts.
To summarize, most cities did not consider their OGD initiatives as a tool for supporting their sustainability/climate action plans. Both Los Angeles and New Orleans are cities that mention the role of OGD in their sustainability/climate action plans. They mainly utilized their local OGD initiatives to accumulate data as a data repository and communicate through data regarding the city’s progress, thereby promoting government accountability and public participation in city-level decision-making. Interviews supported this finding. The respondents emphasized that, from the cities’ perspective, the primary purpose of OGD initiatives was to provide the public with access to the city’s raw data. An OGD manager mentioned, “Our goal is not to draw conclusions or promote certain interpretations from the data, but to present it in a way to the public, like dashboards, visualizations, and clean raw data, so that the public can draw their own conclusions.” These findings suggest that, in most cities, OGD initiatives primarily function as data repositories rather than as planning-support tools integrated into sustainability decision-making.
These findings illustrate two contrasting approaches to designing and managing OGD initiatives: a repository logic and a planning-action logic. A repository logic focuses primarily on publishing datasets to promote transparency and public access, leaving users responsible for locating, interpreting, and applying relevant information. While this approach supports transparency objectives, it does not necessarily help users understand data or apply it to planning and policy decisions. By contrast, a planning-action logic treats OGD as an integral part of planning and sustainability decision-making. Rather than simply storing data, OGD portals are intentionally designed to help planners, policymakers, and the public identify policy-relevant information through dashboards, maps, charts, case studies, performance indicators, and other visual and analytical tools that highlight trends, comparisons, and progress toward sustainability goals. This approach anticipates users’ informational needs, facilitates evidence-based planning, and has important organizational implications. Effective OGD initiatives require not only technical specialists who maintain databases and ensure data quality, but also professionals with expertise in planning, policy, communication, public engagement, and data visualization who can translate raw datasets into accessible information that supports policy development, implementation, monitoring, and public participation.
This approach also requires portal designers and administrators to anticipate the needs of different user groups rather than assuming that all users interact with data in the same way. City council members, municipal agencies, neighborhood organizations, NGOs, businesses, researchers, students, journalists, and residents may all require different types of information, levels of technical detail, visualization tools, and communication strategies. Designing OGD portals around these diverse user needs can improve accessibility, broaden meaningful participation, and strengthen the capacity of OGD to inform planning and sustainability decision-making.
Similarly, most interviewees recognized the potential of OGD to support municipal planning and sustainability. However, interviewees did not see open data being well integrated into planning processes. One interviewee suggested that the city of Boston’s action-centered policy of utilizing OGD to inform and support the city’s climate action programs, mentioned above, could be adopted by other cities. As a city data manager said in their interview, “You need action-oriented programs that leverage data to be used to achieve sustainability objectives.”

5.5. Strategies to Better Link OGD to Planning and Sustainability

Improving OGD policies represents a starting point to better link open data to planning. These policies are often lacking or underdeveloped; they also focus on improving transparency and government operations rather than increasing public engagement, coordinating data and planning processes, and evaluating progress toward goals. Coordinating local data with SDG targets and indicators would also help link cities to global sustainability planning.
Another key step lies in engaging the public. Interviewees emphasized deficient public understanding and user skills as barriers to OGD use. As one noted, “Too many people do not know what OGD is, why it is important for government transparency, and how to use it for advocacy. Many see large data tables and are overwhelmed by the raw data.” Experts argue that “OGD will only become more extensive and widely used by the public.” As the promotion manager highlighted: “We need more datasets of public interest if we want anyone to apply them, workshops to help people navigate and utilize tools and functions effectively, and public sessions that explain what GIS, OGD, and data are.” Tactics to improve public knowledge include training classes, hands-on workshops, and community engagement events where participants learn to navigate and apply OGD tools. For instance, New York City’s Open Data Ambassadors provide year-round introductory training across diverse communities to bridge data literacy gaps. That city also hosts Open Data Week, an annual festival featuring art exhibitions, in-person and virtual events, and conferences highlighting real-world applications of OGD. Boston has an Open Data starter kit, glossary, and slides to provide an orientation to the uses of available datasets. Portland’s DiscoTech offers a collaborative space for the public to explore OGD through app development, data visualization, and metadata analysis, empowering residents to develop practical tools for their communities.
Effective public engagement around open data requires gathering feedback, tracking use, encouraging users to share their work, forming user groups or advisory committees, and publicizing successful examples of OGD use. Some cities use social media, community newsletters, and OGD reports to keep users informed. Neighborhood forums such as NextDoor and participatory planning apps such as Mindmixer can potentially link to open data [111]. Seattle collaborates with civic tech groups, students, businesses, and advocacy organizations around open data. Detroit has established the GO DATA Advisory Commission, a group of volunteer members from various sectors that enhances data accessibility, scores datasets, and fosters community engagement. Since data reflects the biases of those in power [112], involving a broad range of local groups and advisory commissions in data publication and curation decisions can help ensure the data aligns with community needs.
Efforts to improve the quality and standardization of open data are much needed. Equally important is framing data in such a way that the public and decision-makers can understand key implications. As one expert explained, “We collect metrics on all sorts of things, but the relationships between the data points or the significance of what we’re collecting and why can sometimes get lost in the frenzy of simply collecting data to collect it.” Additionally, another expert noted, “…data that isn’t standardized in a way that makes it easy for us to collaborate, to ensure we’re comparing apples to apples, or even referencing the same business/community.” Moreover, “…We have a plethora of demographic-type data (gender, age, ethnicity, etc.), but it’s not formatted or asked in a way that the next steps with the data are useful.”
Visualizations can help make complex data more accessible. By presenting data through apps, dashboards, and interactive tools, users can better understand trends, identify patterns, and take action based on data-driven insights. For example, Albuquerque’s “Where’s My Bus” real-time transit tracking tool helps riders monitor bus locations and arrival times. Phoenix’s “City Checkbook” provides insights into city expenditures, including vendor payments, departmental spending, and financial transactions.
Action-oriented policies leveraging OGD are crucial for achieving cities’ sustainability/climate action plan goals. While public disclosure of OGD is vital, it alone cannot address urban sustainability planning challenges. Integrating OGD into planning through targeted policies and programs can be key to achieving climate goals. For example, Seattle’s OGD portal includes the Building Energy Benchmarking Data, requiring owners of buildings over 20,000 square feet to track and report their energy performance annually. By making this data publicly accessible, residents can review information about their buildings and assess city-wide energy performance, including electricity consumption, natural gas usage, and GHG emissions. However, while disclosure raises awareness among building owners, it does not directly reduce emissions. Seattle implemented the Building Emissions Performance Standard, which establishes GHG reduction targets that building owners must meet over time, promoting energy efficiency, electrification, and a transition from fossil fuels. By aligning data-driven policies with OGD, Seattle aims to achieve carbon neutrality by 2050. Similarly, New York has set ambitious targets to reduce GHG emissions by 40% by 2030 and 80% by 2050, and Boston enacted the Building Energy Reporting and Disclosure Ordinance to minimize energy use.
Identifying datasets of public interest and involving the community in deciding what OGD should publish is essential. According to Kitchin (2013) and Kitchin et al. (2015), data is not politically, technologically, or socio-culturally neutral; rather, it reflects the biases of those in power and the selectiveness of information, which can highlight strengths while obscuring weaknesses [73,112]. For example, OGD coordinators noted, “…certain departments retain control over their data, citing the sensitive nature of the information or contractual restrictions, which makes it exclusive.” Another expert highlighted, “…the process of data availability and the willingness of departmental data owners to drive the selection of open data shapes the OGD of cities.” San Francisco’s OGD policy, for instance, specifies that the Chief Data Officer’s duties include ensuring that “Data prioritized for publication should be of likely interest to the public.” In some cities, decisions about what data to publish involve city officials such as the mayor, council members, or specialized committees. As discussed in the literature review, Kitchin et al. (2013), Lourenço (2013), and Harrison et al. (2012) argued that simply providing access to thousands of datasets—without considering public interest—does not necessarily increase government transparency or accountability [73,74,82]. Users need clear answers to their questions and expect tangible services or benefits from OGD. Therefore, decisions on data publication should involve a broad range of local groups and advisory commissions to ensure the data aligns with community needs. In another interview, a data coordinator said: Data operations, creating data curation pipelines, and agreements on data management work at different business layers and require a group, committee, or common space for discussion, collaboration, and deliberation. It takes time and resources to get there, but [the city] has been working on that for years now.
A final set of strategies focuses on improving ways that open data supports planning, policy, and action. This is particularly essential around climate and sustainability topics, where progress toward goals is urgently needed. GHG emissions inventories and models are vital for climate planning and can be showcased on OGD portals. Sustainability indicators can be highlighted as well, covering topics such as recycling rates, air and water pollution, public health, social equity, educational levels, poverty, housing affordability, and bicycling and walking. The City of Santa Monica provides one example of such data use; it has developed a set of performance indicators through its Sustainability Plan and has made many of these available on its OGD portal [113].
One respondent noted, “The culture of engagement is hard to maintain, and data management systems are expensive; cities, especially smaller ones, struggle to implement open data programs and retain staff with the expertise and commitment to support them.” “I believe we had a good amount of data to understand the major sustainability issues,” noted a city-level data supervisor, “A lot of the work still needs to be managed at the city governance level.”

6. Conclusions

This study aimed to assess how OGD initiatives in 19 U.S. cities relate to planning, particularly for urban sustainability. The analysis examined the user-friendliness of OGD portals, their alignment with OGD policies, and their alignment with plans (general plans and sustainability/climate action plans). OGD portals across 19 U.S. cities differ significantly in content, usability, and governance, which affects their contributions to sustainability. Cities with high sustainability performance tend to provide broader datasets, inclusive governance, user-friendly support, and equity-focused features, while lower-ranked cities often fall short in these areas. These disparities affect how effectively cities leverage OGD to promote sustainability.
No city had references to OGD in all of its planning (OGD policies, general plans, and sustainability/climate action plans). Only nine of the 19 cities referenced OGD in at least one planning document or OGD policy, and only two cities did so in both their OGD policy and sustainability/climate action plan, indicating limited integration across these planning instruments. The findings indicated that U.S. cities rarely linked their open data policies, general plans, and sustainability/climate action plans with OGD, even though those cities actively utilized elements of sustainability and the corresponding vocabulary in their planning. These findings contribute to planning scholarship by providing empirical evidence of limited integration between OGD initiatives and planning documents across U.S. cities. By examining OGD portals, policies, and planning documents together, this study demonstrates the value of an integrated approach for understanding how OGD can better support urban sustainability planning.
Most city open data policies prioritize government transparency over the core goals of OGD—genuine public participation and community benefits. The data flow remains one-way and is controlled by city agencies. Thus, we recommend better aligning local OGD with planning, enhancing public engagement, improving awareness and accessibility, leveraging action-oriented programs to promote OGD use, strengthening data integrity, identifying datasets of public interest, and engaging diverse local representatives in OGD to meet community needs.

Author Contributions

Conceptualization, S.M.W. and G.N.N.; methodology, S.M.W. and G.N.N.; validation, S.M.W. and G.N.N.; formal analysis, S.M.W. and G.N.N.; investigation, S.M.W. and G.N.N.; data curation, G.N.N.; writing—original draft preparation, S.M.W. and G.N.N.; writing—review and editing, S.M.W.; visualization, G.N.N.; supervision, S.M.W.; project administration, S.M.W. and G.N.N. All authors have read and agreed to the published version of the manuscript.

Funding

This research received no external funding.

Institutional Review Board Statement

The study was reviewed by the University of California, Davis Institutional Review Board (IRB ID 1945095-1) and was granted exempt status, with the formal exemption determination issued on 24 April 2023.

Informed Consent Statement

Informed consent for participation was obtained from all subjects involved in the study.

Data Availability Statement

The original contributions presented in this study are included in the article. Further inquiries can be directed to the corresponding author.

Conflicts of Interest

The authors declare no conflicts of interest.

Abbreviations

The following abbreviations are used in this manuscript:
OGDOpen Government Data
SDGSustainable Development Goal(s)
RQsResearch Questions
SCISustainable Cities Index
BERDOBuilding Energy Reporting and Disclosure Ordinance
OGDPILocal Open Data Portal Index
ITInformation Technology
AIArtificial Intelligence
GISGeographic Information Systems
NGOsNongovernmental Organizations
MERMonitoring, Evaluation, and Reporting
GHGGreenhouse Gas
RQResearch Question
DataSFSan Francisco Data Portal

Appendix A

Table A1. Summary of the Metrics of the OGD Portals’ Performance from the Previous Studies.
##SourcePurpose of StudyDimension (Group)Criteria (Subgroup)
1.[82]The author analyzed the functionality and data organization of the OGD portals from Australia, Canada, France, New Zealand, Singapore, the United Kingdom, and the United States based on the seven desired characteristics of data disclosure proposed in the literature on open government and transparency assessment.1.1. Quality[R1] Portals should consider mechanisms for external and independent quality assurance processes and associate the results of such revision processes with each published dataset.
1.2. Completeness[R2] Portals should present a master list of:
all relevant governmental dataset sources (not just entities publishing data);
all entities for which data is being disclosed;
all accountability-related information;
all time periods covered.
[R3] Portals should provide metadata (the detailed description of each dataset) for each dataset.
1.3. Access & Visibility[R4] Portals should provide a mechanism for clearly identifying and distinguishing accountability-related datasets.
[R5] Portals should provide free, oriented search and browsing mechanisms to help users find the required and related/complementary datasets.
1.4. Usability & Comprehensibility[R6] Portals should provide clear and simple descriptions (dictionaries) about the concepts associated with the data being disclosed.
1.5. Timeliness[R7] Portals should provide information that allows for assessing delay in information provision, such as release date, periodicity of publication, and the actual release and update date of each dataset.
1.6. Value & Usefulness[R8] Portals should provide mechanisms to allow users to suggest missing valuable data.
[R9] Portals should provide mechanisms that allow users to express some measure of value or usefulness of the data disclosed.
1.7. Granularity[R10] Portals should provide each dataset with an indication of its granularity level (unit of analysis).
2.[85]The authors developed a framework of indicators to assess the quality of OGD at level of cells and datasets. They validated the framework by comparing two Italian OGD cases: one with centralized disclosure and strong quality controls, and another from decentralized municipalities with fewer quality controls.2.1. Traceability2.1.1. Track of creation—the presence of metadata associated with the creation of a dataset.
2.1.2. Track of updates—the presence of metadata associated with the updates done to a dataset.
2.2. Currentness 2.2.1. Percentage of current rows—the percentage of rows in a dataset that have current values; it means that they do not have any value that refers to a previous or following period.
2.2.2. Delay in publication—the ratio between (i) the number of days passed between the moment in which the information is available and the publication of the dataset and (ii) the period referred by the dataset (week, month, year).
2.3. Expiration 2.3.1. Delay after expiration—the ratio between (i) the delay in the publication of a dataset after the expiration of its previous version and (ii) the period referred by the dataset (week, month, year).
2.4. Completeness 2.4.1. Percentage of complete cells—the percentage of the cells that are not empty and have a meaningful value assigned (a value coherent with the domain of the column).
2.5. Compliance 2.5.1. Percentage of complete rows—the percentage in a dataset of the rows that do not have any incomplete cell.
2.5.2. Percentage of standardized columns—the percentage in a dataset of the columns representing some kind of information that has standards associated with it (for example, geographic information).
2.5.3. e-Government Metadata Standard (eGMS) compliance—the degree to which a dataset follows the e-GMS standard (a standardized framework designed to ensure the consistent description of OGD datasets and other government information, including the data categories, store, and presentation).
2.5.4. Five-star Open Data—the level of the Five-star Open Data model by Tim Berners-Lee in which the dataset is and the advantage offered by this reason. To get the maximum score of five stars, a dataset must (i) be available in the Internet under an open license, (ii) be in the form of structured data, (iii) be in a non-proprietary file format, (iv) use a uniform resource identifier (URI), and (v) include links to other data sources.
2.6. Understandability 2.6.1. Percentage of columns in a dataset that has associated descriptive metadata. The metadata easily allows understanding the information of the data and the way it is represented.
2.6.2. Percentage of columns in comprehensible format—the percentage of columns in a dataset represented in a machine-readable format that can be easily understood by the users.
2.7. Accuracy 2.7.1. Percentage of accurate cells—the percentage cells in a dataset that has correct values according to the domain and the type of information of the dataset.
2.7.2. Accuracy in aggregation—the ratio between the error in aggregation and the scale of data representation.
3.[84]The study analyzed 37 OGDPIs of American cities based on the statistical analysis of interrelations between the characteristics of OGDPI and the city’s type of government, population size, average level of education, associations with regional consortiums (collaboration with communities to support open data portals), the degree of civic innovation, and the age of OGDPI. 3.1. Content3.1.1. Datasets per 100,000 population.
3.1.2. Organization of datasets by categories.
3.1.3. Are users able to manipulate data in datasets online?
3.1.4. Number of categories into which datasets are organized.
3.1.5. Are users able to create visualizations online with the data?
3.1.6. Are the data files in machine readable formats?
3.1.7. Are users able to suggest new datasets?
3.1.8. Is metadata available to define and explain data?
3.2. Help3.2.1. Can users search through datasets?
3.2.2. Can users search through help topics?
3.2.3. Are tutorials available?
3.2.4. Is a list of help topics available?
3.2.5. Is clear contact information available for users if they need help?
3.3. Policy3.3.1. Is there data or an open data policy?
3.3.2. Is there terms of use statement?
3.4. Result3.4.1. Is there an app showcase available?
3.4.2. Is there a call for action or invitation for citizens to use the data?
3.4.3. Is other information about results of datasets available?
3.4.4. Are analytics available?
3.4.5. Are APIs and other information for developers available?
4.[83]The authors developed the User Interaction Framework based on the existing principles and evaluation methods to examine portals of 34 U.S. municipal government agencies from the perspective of potential users. 4.1. Access 4.1.1. Data organization.
4.1.2. Searchability.
4.1.3. Restriction free.
4.1.4. License.
4.1.5. Multiple languages.
4.1.6. Machine processability.
4.1.7. Open formats.
4.2. Trust 4.2.1. Permanent uniform resource identifier (URI).
4.2.2. Completeness.
4.2.3. Currentness.
4.2.4. Availability of data policy.
4.2.5. Sources.
4.2.6. Granularity of data.
4.2.7. Relevancy
4.3. Understand 4.3.1. User support.
4.3.2. App showcase.
4.3.3. Documentation.
4.3.4. Metadata.
4.4. Engage-integrate4.4.1. Availability of analytics.
4.4.2. Availability of Application Programming Interface (API).
4.4.3. Availability of citation format.
4.4.4. Personalization.
4.4.5. Download.
4.4.6. Online manipulation.
4.4.7. Online visualization.
4.4.8. Comparative data sets.
4.5. Participate 4.5.1. Proactive engagement.
4.5.2. Shareability.
4.5.3. Participation.
4.5.4. User feedback.

Appendix B

Table A2. The U.S. Cities Sample from the SCI 2024.
##City, StatePopulation (2024)SCI 2024 RankOverall SCI 2024
PlanetPeopleProfitProgress
High-ranked Cities
1San Francisco, CA874,961217626435
2New York, NY8,419,000227497248
3Los Angeles, CA3,967,0001879177453
4Boston, MA684,3792669258656
5Chicago, IL2,710,000487367158
6Seattle, WA724,3053378109260
7Dallas, TX1,331,000708738563
8Philadelphia, PA1,579,0005184207664
9Washington, DC692,6834683277565
10—MedianPhoenix, AZ1,633,0005081268766
Low-ranked Cities
11Houston, TX2,310,000827179167
12Atlanta, GA488,8005385308468
13Denver, CO705,5764982446970
14Detroit, MI674,8415675487871
15Pittsburgh, PA302,2056070458272
16Baltimore, MD609,0325986417373
17Tampa, FL387,9165477518974
18Miami, FL454,2796690367976
19New Orleans, LA390,8457988349078

Appendix C

Table A3. The Data Sources for the Study.
#CityOGD PortalGeneral PlanStrategic PlanOGD Policy
1.San Francisco CAhttps://datasf.org/opendata/ (accessed on 1 May 2026)San Francisco General Plan, https://generalplan.sfplanning.org (accessed on 1 May 2026) San Francisco’s Climate Action Plan 2021, https://www.sfenvironment.org/files/events/2021_climate_action_plan.pdf (accessed on 1 May 2026) Chapter 22D: Open Data Policy, https://codelibrary.amlegal.com/codes/san_francisco/latest/sf_admin/0-0-0-13982 (accessed on 1 May 2026)
2.New York NYhttps://opendata.cityofnewyork.us (accessed on 1 May 2026) One NYC 2050, https://climate.cityofnewyork.us/reports/onenyc-2050/ (accessed on 1 May 2026)PlaNYC: Getting Sustainability Done, https://climate.cityofnewyork.us/wp-content/uploads/2023/06/PlaNYC-2023-Full-Report.pdf (accessed on 1 May 2026) Local Laws of the City of New York, https://legistar.council.nyc.gov/LegislationDetail.aspx?ID=649911&GUID=E650813B-B1E9-4E56-81BA-58261487DA4A (accessed on 1 May 2026)
3.Los Angeles CAhttps://data.lacity.org (accessed on 1 May 2026) Los Angeles General Plan, https://planning.lacity.gov/plans-policies/general-plan-overview (accessed on 1 May 2026) L.A.’s Green New Deal, https://plan.mayor.lacity.gov/sites/g/files/wph2176/files/2022-12/pLAn_2019_final.pdf (accessed on 1 May 2026) The City of Los Angeles Executive Directive No. 3, https://lacity.gov/sites/g/files/wph2451/files/2021-04/garcetti_ed03.pdf?utm_source=chatgpt.com (accessed on 1 May 2026)
4.Boston MAhttps://data.boston.gov (accessed on 1 May 2026) Imagine Boston 2030, https://www.boston.gov/sites/default/files/embed/file/2018-06/imagine20boston202030_pages2.pdf (accessed on 1 May 2026) City of Boston Climate Action Plan,
https://www.boston.gov/sites/default/files/embed/file/2019-10/city_of_boston_2019_climate_action_plan_update_4.pdf (accessed on 1 May 2026)
City of Boston Open and Protected Data Policy, https://data.boston.gov/dataset/open-and-protected-data-policy/resource/55dff33c-4b53-462f-b4c9-af51a81c7273 (accessed on 1 May 2026)
5.Chicago ILhttps://data.cityofchicago.org (accessed on 1 May 2026) We will Chicago, https://www.chicago.gov/content/dam/city/depts/dcd/we_will/we_will_documents/cpc/WWC_Final_CPC.pdf (accessed on 1 May 2026)Chicago Climate Action Plan,
https://www.chicago.gov/content/dam/city/sites/climate-action-plan/documents/Chicago-CAP-071822.pdf (accessed on 1 May 2026)
Open Data Executive Order No. 2012-2, https://www.chicago.gov/city/en/narr/foia/open_data_executiveorder.html#:~:text=The%20Mayor%20shall%20designate%20a,decision%20making%20and%20management%20through (accessed on 1 May 2026)
6.Seattle WAhttps://data.seattle.gov (accessed on 1 May 2026) City of Seattle Comprehensive Plan, https://www.seattle.gov/documents/Departments/OPCD/OngoingInitiatives/SeattlesComprehensivePlan/SeattleComprehensivePlan.pdf (accessed on 1 May 2026) Seattle Climate Action Plan,
https://www.seattle.gov/documents/departments/ose/2013_cap_20130612.pdf (accessed on 1 May 2026)
Open Data Policy, https://www.seattle.gov/Documents/Departments/SeattleGovPortals/CityServices/OpenDataPolicyV1.pdf (accessed on 1 May 2026)
7.Dallas TXhttps://www.dallasopendata.com (accessed on 1 May 2026) Forward Dallas! Comprehensive Plan, https://dallascityhall.com/departments/sustainabledevelopment/Pages/comprehensive_plan.aspx (accessed on 1 May 2026) Dallas Comprehensive Environmental and Climate Action Plan,
https://www.dallasclimateaction.com/_files/ugd/349b65_e4f9a262cebf41258fd4343d9af0504f.pdf (accessed on 1 May 2026)
City of Dallas Open Data Policy, https://www.dallasopendata.com/stories/s/ODP-Data-Policy/eswx-6mh7/#:~:text=City%20of%20Dallas%20Open%20Data%20Policy&text=The%20City%20of%20Dallas%20recognizes,protecting%20privacy%20and%20sensitive%20data. (accessed on 1 May 2026)
8.Philadelphia PAhttps://opendataphilly.org/ (accessed on 1 May 2026)Philadelphia 2035 Comprehensive Plan, https://www.phila.gov/programs/the-comprehensive-plan/ (accessed on 1 May 2026)Philadelphia Climate Action Playbook,
https://www.epa.gov/system/files/documents/2023-12/philadelphia-climate-action-playbook.pdf (accessed on 1 May 2026)
City of Philadelphia Executive Order No. 1-12, http://cityofphiladelphia.github.io/slash-data/executive-order/ (accessed on 1 May 2026)
9.Washington DChttps://opendata.dc.gov (accessed on 1 May 2026) The Comprehensive Plan for the National Capital, https://planning.dc.gov/page/comprehensive-plan#:~:text=The%20Comp%20Plan%20includes%20policies,and%20develops%20in%20the%20future (accessed on 1 May 2026)Sustainable DC, https://sustainable.dc.gov/sites/default/files/dc/sites/sustainable/page_content/attachments/sdc%202.0%20Edits%20V5_web.pdf (accessed on 1 May 2026) DC Data Policy, https://opendata.dc.gov/pages/data-policy (accessed on 1 May 2026)
10.Phoenix AZhttps://www.phoenixopendata.com (accessed on 1 May 2026) Plan PHX, https://www.phoenix.gov/administration/departments/pdd/growth-infrastructure/general-plan.html (accessed on 1 May 2026) Climate Action Plan, https://www.phoenix.gov/administration/departments/oep/climate-change/2021-climate-action-plan.html?utm_source=chatgpt.com (accessed on 1 May 2026)Open Data Policy, https://www.phoenixopendata.com/pages/open-data-policy (accessed on 1 May 2026)
11.Houston TXhttps://data.houstontx.gov (accessed on 1 May 2026) Plan Houston, https://www.houstontx.gov/planning/GeneralPlan/generalplan.html (accessed on 1 May 2026) Houston Climate Action Plan, http://greenhoustontx.gov/climateactionplan/CAP-April2020.pdf (accessed on 1 May 2026) City of Houston Administrative Procedure No. 8-7, Open Data, https://www.houstontx.gov/adminpolicies/8-7.pdf (accessed on 1 May 2026)
12.Atlanta GAhttps://gis.atlantaga.gov/?page=OPEN-DATA-HUB (accessed on 1 May 2026) Plan A City of Atlanta 2021 Comprehensive Development Plan, https://www.atlantaga.gov/home/showpublisheddocument/59838/638278846516730000 (accessed on 1 May 2026) City of Atlanta Climate Action Plan, https://atlantaclimateactionplan.wordpress.com/wp-content/uploads/2016/02/atlanta-climate-action-plan-07-23-2015.pdf (accessed on 1 May 2026) NA
13.Denver COhttps://opendata-geospatialdenver.hub.arcgis.com (accessed on 1 May 2026) Comprehensive Plan 2040 Denver’s Plan for the Future, https://www.denvergov.org/files/assets/public/v/1/community-planning-and-development/documents/planning/comprehensive-plan/denver_comprehensive_plan_2040.pdf (accessed on 1 May 2026) Denver 80 × 50 Climate Action Plan, https://www.denvergov.org/content/dam/denvergov/Portals/771/documents/EQ/80x50/DDPHE_80x50_ClimateActionPlan.pdf (accessed on 1 May 2026)NA
14.Detroit MIhttps://data.detroitmi.gov (accessed on 1 May 2026) City of Detroit Master Plan of Policies, https://detroitmi.gov/sites/detroitmi.localhost/files/2022-10/Master%20Plan%20Text%2010-22.pdf (accessed on 1 May 2026) Detroit Sustainability Action Agenda, https://detroitmi.gov/sites/detroitmi.localhost/files/2019-06/Detroit-Sustainability-Action-Agenda-Web.pdf (accessed on 1 May 2026) Executive Order No. 2015-2, https://detroitmi.gov/sites/detroitmi.localhost/files/2018-02/ExecOrder201502.pdf (accessed on 1 May 2026)
15.Pittsburgh PAhttps://pghgishub-pittsburghpa.opendata.arcgis.com (accessed on 1 May 2026) NACity of Pittsburgh Climate Action Plan, https://www.pittsburghpa.gov/files/assets/city/v/1/dcp/documents/7101_pittsburgh_climate_action_plan_3.0.pdf (accessed on 1 May 2026) City of Pittsburgh Open Data Legislation, https://www.pittsburghpa.gov/Business-Development/Geographic-Information-Systems-Mapping-Open-Data?utm_source=chatgpt.com (accessed on 1 May 2026)
16.Baltimore MDhttps://data.baltimorecity.gov/ (accessed on 1 May 2026)Our Baltimore, Your Baltimore, A comprehensive Plan for the City of Baltimore, https://www.baltimorecity.gov/planning/our-work/plans/comprehensive-master-plan (accessed on 1 May 2026) Baltimore Climate Action Plan Update, https://www.baltimoresustainability.org/wp-content/uploads/2024/02/2024-Climate-Action-Plan-Update.pdf (accessed on 1 May 2026) City of Baltimore Council Bill 16-0615, https://baltimore.legistar.com/LegislationDetail.aspx?ID=2547408&GUID=10605A37-B70C-4878-A829-21C7AB1067D2&Options=&Search= (accessed on 1 May 2026)
17.Tampa FLhttps://opendata.tampa.gov (accessed on 1 May 2026) Imagine 2040 City of Tampa, Comprehensive Plan, https://planhillsborough.org/wp-content/uploads/2023/01/Adopted-Tampa-2040-Comp-Plan.pdf (accessed on 1 May 2026) City of Tampa Climate Action and Equity Plan, https://www.tampa.gov/sites/default/files/document/2023/climate-action-and-equity-plan-13.pdf (accessed on 1 May 2026) NA
18.Miami FLhttps://datahub-miamigis.opendata.arcgis.com (accessed on 1 May 2026) Miami Comprehensive Neighborhood Plan, https://www.miami.gov/My-Government/Departments/Planning/Comprehensive-Planning-Main-Page (accessed on 1 May 2026) Miami Forever Climate Ready, https://www.miami.gov/files/sharedassets/public/v/1/miami-forever-climate-ready-2020-strategy.pdf (accessed on 1 May 2026) NA
19.New Orleans LAhttps://datadriven.nola.gov/home/ (accessed on 1 May 2026)New Orleans a Plan for the 21st Century, https://nola.gov/next/city-planning/topics/master-plan-plan-for-the-21st-century/ (accessed on 1 May 2026)Climate Action for a Resilient New Orleans, https://nola.gov/nola/media/Climate-Action/Climate-Action-for-a-Resilient-New-Orleans.pdf (accessed on 1 May 2026) Executive Order MJL 16-01, https://content.govdelivery.com/accounts/LANOLA/bulletins/1611287 (accessed on 1 May 2026)
Note: NA = Not applicable.

References

  1. OpenGovData. The 8 Principles of Open Government Data. 2007. Available online: https://opengovdata.org (accessed on 5 August 2025).
  2. Data.gov. Celebrating 15 Years of Data.gov. 2024. Available online: https://data.gov/ (accessed on 1 August 2026).
  3. Berrone, P.; Ricart, J.; Carrasco, C. The open kimono: Toward a general framework for open data initiatives in cities. Calif. Manag. Rev. 2016, 59, 39–70. [Google Scholar] [CrossRef]
  4. Chen, K.; Zhang, S. How does open public data impact enterprise digital transformation? Econ. Anal. Policy 2024, 83, 178–190. [Google Scholar] [CrossRef]
  5. Gao, Y.; Janssen, M.; Zhang, C. Understanding the evolution of open government data research: Towards open data sustainability and smartness. Int. Rev. Adm. Sci. 2023, 89, 59–75. [Google Scholar] [CrossRef]
  6. Independent Expert Advisory Group on a Data Revolution for Sustainable Development. A World That Counts: Mobilising the Data Revolution for Sustainable Development; United Nations: New York, NY, USA, 2014; Available online: http://www.undatarevolution.org/wp-content/uploads/2014/11/A-World-That-Counts.pdf (accessed on 20 July 2024).
  7. McKinsey Global Institute. Open Data: Unlocking Innovation and Performance with Liquid Information; McKinsey Global Institute: San Francisco, CA, USA, 2013; Available online: https://www.mckinsey.com/capabilities/mckinsey-digital/our-insights/open-data-unlocking-innovation-and-performance-with-liquid-information#/ (accessed on 1 June 2025).
  8. Jing, L.; Tianshu, Q.; Qing, H. Open government data and green economic growth. Econ. Anal. Policy 2025, 85, 2207–2218. [Google Scholar] [CrossRef]
  9. Liu, L.; Dang, Y.; Ju, Z. Public data openness and private enterprise growth: The roles of local resource allocation and cross-regional collaborative innovation. Econ. Model. 2026, 157, 107519. [Google Scholar] [CrossRef]
  10. Liu, P.; Peng, Z. China’s smart city pilots: A progress report. Computer 2013, 47, 72–81. Available online: https://www.researchgate.net/profile/Pu-Liu-11/publication/270767244_China’s_Smart_City_Pilots_A_Progress_Report/links/57a9424b08aed1b226245118/Chinas-Smart-City-Pilots-A-Progress-Report.pdf (accessed on 16 April 2024).
  11. World Bank. Open Data for Economic Growth. 2014. Available online: https://www.worldbank.org/content/dam/Worldbank/document/Open-Data-for-Economic-Growth.pdf (accessed on 16 April 2024).
  12. Alexopoulos, C.; Ali, M.; Maratsi, M.I.; Rizun, N.; Charalabidis, Y.; Loukis, E.; Saxena, S. Assessing the availability and interoperability of open government data (OGD) supporting sustainable development goals (SDGs) and value creation in the Gulf Cooperation Council (GCC). Qual. Quant. 2024, 59, 1573–1593. [Google Scholar] [CrossRef]
  13. Ballari, D.; Siabato, W.; Claramunt, C.; Mata, F.; Zagal, R.; Franco, R. On the development of open geographical data infrastructures in Latin America: Progress and challenges. arXiv 2025. [Google Scholar] [CrossRef]
  14. Wang, R.; Xu, C.K.; Wu, X. Open government data (OGD) as a catalyst for smart city development: Empirical evidence from Chinese cities. Gov. Inf. Q. 2024, 41, 101985. [Google Scholar] [CrossRef]
  15. Geddes, P. Cities in Evolution: An Introduction to the Town Planning Movement and to the Study of Civics; Williams& Norgate: London, UK, 1915. [Google Scholar]
  16. Jacobs, J. The Death and Life of Great American Cities; Vintage: New York, NY, USA, 1961. [Google Scholar]
  17. Harvey, D. Social Justice and the City; Edward Arnold: London, UK, 1973. [Google Scholar]
  18. Castells, M. City, Class and Power; St. Martin’s Press: New York, NY, USA, 1978. [Google Scholar]
  19. Foucault, M. The Archaeology of Knowledge; Sheridan Smith, A.M., Translator; Pantheon Books: New York, NY, USA, 1972. [Google Scholar]
  20. Fainstein, N.I.; Fainstein, S.S. New debates in urban planning: The impact of Marxist theory within the United States. Int. J. Urban Reg. Res. 1979, 3, 381–403. [Google Scholar] [CrossRef]
  21. Forester, J. Planning in the Face of Power; University of California Press: Oakland, CA, USA, 1989. [Google Scholar]
  22. Innes, J.E. Information in Communicative Planning. J. Am. Plan. Assoc. 1998, 64, 52–63. [Google Scholar] [CrossRef]
  23. Flyvbjerg, B. Bringing power to planning research: One researcher’s praxis story. J. Plan. Educ. Res. 2002, 21, 353–366. [Google Scholar] [CrossRef]
  24. Wirtz, B.W.; Piehler, R.; Thomas, M.-J.; Daiser, P. Resistance of Public Personnel to Open Government. Public Manag. Rev. 2016, 18, 1335–1364. [Google Scholar] [CrossRef]
  25. Kourtit, K.; Elmlund, P.; Nijkamp, P. The urban data deluge: Challenges for smart urban planning in the third data revolution. Int. J. Urban Sci. 2020, 24, 445–461. [Google Scholar] [CrossRef]
  26. Meschede, C.; Siebenlist, T. Open data portals for urban sustainable development: People, policies, and technology. In Smart Cities and the UN SDGs; Visvizi, A., Perez del Hoyo, R., Eds.; Elsevier: Amsterdam, The Netherlands, 2021; pp. 91–105. [Google Scholar] [CrossRef]
  27. Open Data Handbook. What is Open Data? Open Data Handbook: Sacramento, CA, USA, 2026; Available online: https://opendatahandbook.org/guide/en/what-is-open-data/ (accessed on 7 November 2025).
  28. Verhulst, S.G.; Young, A. Open Data in Developing Economies: Toward Building an Evidence Base on What Works and How; African Minds: Cape Town, South Africa, 2017; p. 284. Available online: https://library.oapen.org/handle/20.500.12657/28916 (accessed on 23 September 2024).
  29. Merton, R.K. The Sociology of Science: Theoretical and Empirical Investigations; University of Chicago Press: Chicago, IL, USA, 1973. [Google Scholar]
  30. Nobel Prize Outreach. Elinor Ostrom–Facts. NobelPrize.org. 2009. Available online: https://www.nobelprize.org/prizes/economic-sciences/2009/ostrom/facts/ (accessed on 5 January 2026).
  31. Chignard, S. A Brief History of Open Data. ParisTech Review. 2013. Available online: https://www.paristechreview.com/2013/03/29/brief-history-open-data/ (accessed on 8 March 2025).
  32. U.S. Government. Transparency and Open Government; The White House: Washington, DC, USA, 2009. Available online: https://obamawhitehouse.archives.gov/the-press-office/transparency-and-open-government (accessed on 2 January 2024).
  33. U.S. Chief Information Officers Council. 2.15 Open Government Data Act. In CIO Handbook; U.S. Chief Information Officers Council: Washington, DC, USA, 2018. Available online: https://web.archive.org/web/20240730053542/https://www.cio.gov/handbook/it-laws/ogda/ (accessed on 10 October 2025).
  34. California Department of Technology. Portal Use; California Open Data Handbook: Sacramento, CA, USA, 2026. Available online: https://handbook.data.ca.gov/portal-use/ (accessed on 10 March 2026).
  35. Alexopoulos, C.; Spiliotopoulou, L.; Charalabidis, Y. Open data movement in Greece: A case study on open government data sources. In Proceedings of the 17th Panhellenic Conference on Informatics; ACM: New York, NY, USA, 2013; pp. 279–286. [Google Scholar] [CrossRef]
  36. Nabiyeva, G.N.; Wheeler, S.M. Open Government Data Portals and SDG 11: Lessons from 19 US Cities. Sustainability 2025, 17, 10405. [Google Scholar] [CrossRef]
  37. Jackel, R. Budget Deal May Shut Down Open Government Websites; The Regulatory Review: Philadelphia, PA, USA, 2011; Available online: https://www.theregreview.org/2011/04/20/budget-deal-may-shut-down-open-government-websites/ (accessed on 20 May 2025).
  38. Hendler, J.; Holm, J.; Musialek, C.; Thomas, G. US government linked open data: Semantic. data. gov. IEEE Intell. Syst. 2012, 27, 25–31. [Google Scholar] [CrossRef]
  39. Sunlight Foundation. Open Data Policy Collection. Open Data Policy Hub. Available online: https://opendatapolicyhub.sunlightfoundation.com/collection/ (accessed on 7 May 2025).
  40. Stone, A. Are Open Data Efforts Working? Government Technology: Folsom, CA, USA, 2018. Available online: https://www.govtech.com/data/are-open-data-efforts-working.html (accessed on 16 April 2024).
  41. Simon, D.; Arfvidsson, H.; Anand, G.; Bazaz, A.; Fenna, G.; Foster, K.; Jain, G.; Hansson, S.; Evans, L.M.; Moodley, N.; et al. Developing and testing the urban sustainable development goal’s targets and indicators—A five-city study. Environ. Urban. 2015, 28, 49–63. [Google Scholar] [CrossRef]
  42. Satterthwaite, D. A new urban agenda? Environ. Urban. 2021, 28, 3–12. [Google Scholar] [CrossRef]
  43. Patel, Z.; Greyling, S.; Simon, D.; Arfvidsson, H.; Moodley, N.; Primo, N.; Wright, C. Local responses to global sustainability agendas: Learning from experimenting with the urban sustainable development goal in Cape Town. Sustain. Sci. 2017, 12, 785–797. [Google Scholar] [CrossRef] [PubMed]
  44. Davis, K.E.; Kingsbury, B.; Merry, S.E. Introduction: The local-global life of indicators: Law, power, and resistance. In The Quiet Power of Indicators: Measuring Governance, Corruption, and Rule of Law; Merry, S.E., Davis, K.E., Kingsbury, B., Eds.; Cambridge University Press: Cambridge, UK, 2015; pp. 1–24. Available online: https://www.cambridge.org/core/books/abs/quiet-power-of-indicators/introduction-the-localglobal-life-of-indicators-law-power-and-resistance/90ADD4454F7F97FEBE74B5555A281430 (accessed on 11 May 2025).
  45. Arfvidsson, H.; Simon, D.; Oloko, M.; Moodley, N. Engaging with and measuring informality in the proposed urban sustainable development goal. Afr. Geogr. Rev. 2017, 36, 100–114. [Google Scholar] [CrossRef]
  46. Koch, F.; Krellenberg, K.; Reuter, K.; Libbe, J.; Schleicher, K.; Krumme, K.; Kern, K. How can the Sustainable Development Goals be implemented? Challenges for cities in Germany and the role of urban planning. disP-Plan. Rev. 2019, 55, 14–27. [Google Scholar] [CrossRef]
  47. Klopp, J.M.; Petretta, D.L. The urban sustainable development goal: Indicators, complexity and the politics of measuring cities. Cities 2017, 63, 92–97. [Google Scholar] [CrossRef]
  48. Bachmann, N.; Tripathi, S.; Brunner, M.; Jodlbauer, H. The contribution of data-driven technologies in achieving the Sustainable Development Goals. Sustainability 2022, 14, 2497. [Google Scholar] [CrossRef]
  49. Mohd Khalid, A.; Sharma, S.; Kunar Dubey, A. Concerns of developing countries and the sustainable development goals: Case for India. Int. J. Sustain. Dev. World Ecol. 2020, 28, 303–315. [Google Scholar] [CrossRef]
  50. Davies, T.; Perini, F. Researching the emerging impacts of open data: Revisiting the ODDC conceptual framework. J. Community Inf. 2016, 12, 148–178. Available online: https://pdfs.semanticscholar.org/fbf3/b67a2f4e1593eab547d29f364ef196322bfb.pdf (accessed on 1 August 2026). [CrossRef]
  51. Jaakola, A.; Kekkonen, H.; Lahti, T.; Manninen, A. Open data, open cities: Experiences from the Helsinki metropolitan area. Stat. J. IAOS 2015, 31, 117–122. [Google Scholar] [CrossRef]
  52. de Castro Neto, M.; Rego, J.S.; Neves, F.T.; Cartaxo, T.M. Smart & open cities: Portuguese municipalities open data policies evaluation. In 2017 12th Iberian Conference on Information Systems and Technologies; IEEE: Piscataway, NJ, USA, 2017; pp. 1–6. Available online: https://ieeexplore.ieee.org/document/7975912 (accessed on 1 May 2025).
  53. Mutuku, L.N.; Colaco, J. Increasing Kenyan open data consumption: A design thinking approach. In Proceedings of the 6th International Conference on Theory and Practice of Electronic Governance; ACM: New York, NY, USA, 2012; pp. 18–21. [Google Scholar] [CrossRef]
  54. Ubaldi, B. Open Government Data: Towards Empirical Analysis of Open Government Data Initiatives; OECD Working Papers on Public Governance No. 22; OECD Publishing: Paris, France, 2013. [Google Scholar] [CrossRef]
  55. Ahlgren, B.; Hidell, M.; Ngai, E.C.H. Internet of things for smart cities: Interoperability and open data. IEEE Internet Comput. 2016, 20, 52–56. [Google Scholar] [CrossRef]
  56. Ojo, A.; Curry, E.; Zeleti, F.A. A tale of open data innovations in five smart cities. In 2015 48th Hawaii International Conference on System Sciences; IEEE: Piscataway, NJ, USA, 2015; pp. 2326–2335. Available online: https://ieeexplore.ieee.org/document/7070094 (accessed on 1 June 2025).
  57. Ruijer, E.; Grimmelikhuijsen, S.; Van Den Berg, J.; Meijer, A. Open data work: Understanding open data usage from a practice lens. Int. Rev. Adm. Sci. 2020, 86, 3–19. [Google Scholar] [CrossRef]
  58. Schweitzer, L.A.; Afzalan, N. 09 F9 11 02 9D 74 E3 5B D8 41 56 C5 63 56 88 C0: Four Reasons Why AICP Needs an Open Data Ethic. J. Am. Plan. Assoc. 2017, 83, 161–167. [Google Scholar] [CrossRef]
  59. Meijer, A. E-governance innovation: Barriers and strategies. Gov. Inf. Q. 2015, 32, 198–206. [Google Scholar] [CrossRef]
  60. Ruijer, E.; Meijer, A. Open government data as an innovation process: Lessons from a living lab experiment. Public Perform. Manag. Rev. 2020, 43, 613–635. [Google Scholar] [CrossRef]
  61. Susha, I.; Janssen, M.; Verhulst, S. Data Collaboratives as a New Frontier of Cross-Sector Partnerships in the Age of Open Data: Taxonomy Development. 2017. Available online: https://aisel.aisnet.org/cgi/viewcontent.cgi?article=1347&context=hicss-50 (accessed on 15 April 2025).
  62. Nugroho, R.P.; Zuiderwijk, A.; Janssen, M.; De Jong, M. A comparison of national open data policies: Lessons learned. Transform. Gov. People Process Policy 2015, 9, 286–308. [Google Scholar] [CrossRef]
  63. Attard, J.; Orlandi, F.; Scerri, S.; Auer, S. A systematic review of open government data initiatives. Gov. Inf. Q. 2015, 32, 399–418. [Google Scholar] [CrossRef]
  64. Janssen, M.; Charalabidis, Y.; Zuiderwijk, A. Benefits, adoption barriers and myths of open data and open government. Inf. Syst. Manag. 2012, 29, 258–268. [Google Scholar] [CrossRef]
  65. Darbishire, H. Proactive Transparency: The Future of the Right to Information? World Bank: Washington, DC, USA, 2010; Available online: https://documents1.worldbank.org/curated/en/100521468339595607/pdf/565980WP0Box351roactiveTransparency.pdf (accessed on 21 August 2024).
  66. McDermott, P. Building open government. Gov. Inf. Q. 2010, 27, 401–413. [Google Scholar] [CrossRef]
  67. Ansari, B.; Barati, M.; Martin, E.G. Enhancing the usability and usefulness of open government data: A comprehensive review of the state of open government data visualization research. Gov. Inf. Q. 2022, 39, 101657. [Google Scholar] [CrossRef]
  68. Helbig, N.; Cresswell, A.M.; Burke, G.B.; Luna-Reyes, L. The Dynamics of Opening Government Data: A White Paper; Center for Technology in Government, State University of New York: New York, NY, USA, 2012; Available online: https://www.ctg.albany.edu/media/pubs/pdfs/opendata.pdf (accessed on 11 September 2024).
  69. Zuiderwijk, A.; Janssen, M. A coordination theory perspective to improve the use of open data in policy-making. In International Conference on Electronic Government; Springer: Berlin/Heidelberg, Germany, 2013; pp. 38–49. Available online: https://link.springer.com/chapter/10.1007/978-3-642-40358-3_4 (accessed on 23 September 2023).
  70. Zurada, J.; Karwowski, W. Knowledge discovery through experiential learning from business and other contemporary data sources: A review and reappraisal. Inf. Syst. Manag. 2011, 28, 258–274. [Google Scholar] [CrossRef]
  71. Gurstein, M. Open data: Empowering the empowered or effective data use for everyone? First Monday 2011, 16. [Google Scholar] [CrossRef]
  72. O’Connor, J. Towards a Profile of Open Government Data Users. Master’s Thesis, The University of North Carolina at Chapel Hill, Chapel Hill, NC, USA, 2015. [Google Scholar] [CrossRef]
  73. Kitchin, R. Four Critiques of Open Data Initiatives. The Programmable City. 9 November 2013. Available online: https://progcity.maynoothuniversity.ie/2013/11/four-critiques-of-open-data-initiatives/ (accessed on 20 July 2024).
  74. Harrison, T.M.; Guerrero, S.; Burke, G.B.; Cook, M.; Cresswell, A.; Helbig, N.; Hrdinova, J.; Pardo, T. Open government and e-government: Democratic challenges from a public value perspective. Inf. Polity 2012, 17, 83–97. [Google Scholar] [CrossRef]
  75. Bates, J. This is what modern deregulation looks like: Co-optation and contestation in the shaping of the UK’s Open Government Data Initiative. J. Community Inform. 2012, 8, 1–20. [Google Scholar] [CrossRef]
  76. Johnson, J.A. From open data to information justice. Ethics Inf. Technol. 2014, 16, 263–274. [Google Scholar] [CrossRef]
  77. Slee, T. Seeing Like a Geek. Crooked Timber. 2012. Available online: https://crookedtimber.org/2012/06/25/seeing-like-a-geek/ (accessed on 7 May 2025).
  78. Center for Government Excellence. Community Engagement Playbook; Center for Government Excellence: Baltimore, MD, USA, 2026; Available online: https://govex.gitbook.io/community-engagement-playbook (accessed on 22 May 2024).
  79. Peled, A. When transparency and collaboration collide: The USA open data program. J. Am. Soc. Inf. Sci. Technol. 2011, 62, 2085–2094. [Google Scholar] [CrossRef]
  80. Dawes, S.S.; Helbig, N. Information strategies for open government: Challenges and prospects for deriving public value from government transparency. In Proceedings of the Electronic Government: 9th IFIP WG 8.5 International Conference, EGOV 2010, Lausanne, Switzerland, 29 August–2 September 2010; Springer: Berlin/Heidelberg, Germany, 2010; pp. 50–60. Available online: https://link.springer.com/chapter/10.1007/978-3-642-14799-9_5 (accessed on 1 April 2024).
  81. Kalampokis, E.; Tambouris, E.; Tarabanis, K. Open government data: A stage model. In Electronic Government; Janssen, M., Scholl, H.J., Wimmer, M.A., Tan, Y.-H., Eds.; Lecture Notes in Computer Science; Springer: Berlin/Heidelberg, Germany, 2011; Volume 6846, pp. 235–246. [Google Scholar] [CrossRef]
  82. Lourenço, R.P. Open government portals assessment: A transparency for accountability perspective. In International Conference on Electronic Government; Springer: Berlin/Heidelberg, Germany, 2013; pp. 62–74. Available online: https://link.springer.com/chapter/10.1007/978-3-642-40358-3_6 (accessed on 7 May 2024).
  83. Zhu, X.; Freeman, M.A. An evaluation of US municipal open data portals: A user interaction framework. J. Assoc. Inf. Sci. Technol. 2019, 70, 27–37. [Google Scholar] [CrossRef]
  84. Thorsby, J.; Stowers, G.N.; Wolslegel, K.; Tumbuan, E. Understanding the content and features of open data portals in American cities. Gov. Inf. Q. 2017, 34, 53–61. [Google Scholar] [CrossRef]
  85. Vetrò, A.; Canova, L.; Torchiano, M.; Minotas, C.O.; Iemma, R.; Morando, F. Open data quality measurement framework: Definition and application to Open Government Data. Gov. Inf. Q. 2016, 33, 325–337. [Google Scholar] [CrossRef]
  86. Máchová, R.; Hub, M.; Lnenicka, M. Usability evaluation of open data portals: Evaluating data discoverability, accessibility, and reusability from a stakeholders’ perspective. Aslib J. Inf. Manag. 2018, 70, 252–268. [Google Scholar] [CrossRef]
  87. Organization for Economic Co-Operation and Development. Open government data. In Government at a Glance 2025; OECD Publishing: Paris, France, 2025. [Google Scholar] [CrossRef]
  88. Results for America. Open Data. What Works Cities. Available online: https://certification.results4america.org/s/practice-area/a3I2M000001c3cxUAA/open-data?language=en_US (accessed on 1 January 2025).
  89. City of Baton Rouge. Open Data Policy Administrative Handbook. 3 May 2018. Available online: https://www.brla.gov/DocumentCenter/View/6346/Open-Data-Administrative-Handbook (accessed on 1 January 2025).
  90. What Works Cities Certification. Leveling up: Arlington, San Francisco, and Seattle all Get the Gold. Medium. 1 May 2023. Available online: https://medium.com/what-works-cities-certification/leveling-up-arlington-san-francisco-and-seattle-all-get-the-gold-19b2abc7f4f (accessed on 5 January 2025).
  91. Western Pennsylvania Regional Data Center. Data User Guides. 2024. Available online: https://www.wprdc.org/en/data-user-guides (accessed on 10 January 2025).
  92. Arcadis. Sustainable Cities Index 2024. 2000 Days to Achieve a Sustainable Future. 2024. Available online: https://www.arcadis.com/en/knowledge-hub/perspectives/global/sustainable-cities-index-2024 (accessed on 12 December 2024).
  93. The New York City Mayor’s Office of Climate and Environmental Justice. PlaNYC: Getting Sustainability Done. 2023. Available online: https://a860-gpp.nyc.gov/concern/nyc_government_publications/m613n2121 (accessed on 1 May 2025).
  94. Garcetti, E. L.A.’s Green New Deal: Sustainable City pLAn. 2019. Available online: https://ladot.lacity.gov/sites/default/files/documents/green-new-deal_plan.pdf (accessed on 8 March 2025).
  95. Saldaña, J. The Coding Manual for Qualitative Researchers, 4th ed.; SAGE: Newcastle upon Tyne, UK, 2021. [Google Scholar]
  96. City of Los Angeles. Records Requests. Available online: https://recordsrequest.lacity.org (accessed on 1 August 2026).
  97. City of Boston. Tips for Users. Available online: https://data.boston.gov/pages/ckan-training-videos (accessed on 1 August 2026).
  98. City of Phoenix. Mapping Phoenix. Available online: https://egishub-phoenix.hub.arcgis.com (accessed on 1 August 2026).
  99. City of Detroit. Base Units Detroit. Available online: https://base-units-detroitmi.hub.arcgis.com (accessed on 1 August 2026).
  100. City of Houston. Open Finance. Available online: https://data.houstontx.gov/pages/openfinance (accessed on 1 August 2026).
  101. Nabiyeva, G.N.; Wheeler, S.M.; London, J.K.; Brazil, N. Implementation of sustainable development goal 11 (sustainable cities and communities): Initial good practices data. Sustainability 2023, 15, 14810. [Google Scholar] [CrossRef]
  102. Garcetti, E. Executive Directive No. 3: Open Data. City of Los Angeles. 18 December 2013. Available online: https://lacity.gov/sites/g/files/wph2451/files/2021-04/garcetti_ed03.pdf (accessed on 1 April 2025).
  103. City of New Orleans. Mayor Landrieu Signs Executive Order to Make Data More Freely Available to the Public. Office of the Mayor Press Releases and Media Advisories. 1 September 2016. Available online: https://content.govdelivery.com/accounts/LANOLA/bulletins/1611287 (accessed on 3 December 2025).
  104. Baltimore City Department of Planning. Our Baltimore, Your Baltimore. A Comprehensive Plan for the City of Baltimore. 2024. Available online: https://s3.amazonaws.com/baltimorecity.gov.if-us-east-1/s3fs-public/2026-04/dop-comp-plan_updated_web_2024-10-10.pdf (accessed on 1 May 2025).
  105. City of Chicago. We Will Chicago: A Framework Plan for the City’s Future. 2023. Available online: https://www.chicago.gov/content/dam/city/depts/dcd/we_will/we_will_documents/cpc/WWC_Final_CPC.pdf (accessed on 1 July 2024).
  106. City of Phoenix. PlanPHX 2025 General Plan. 2024. Available online: https://www.phoenix.gov/content/dam/phoenix/pddsite/documents/planning-zoning-general-plan/city%20council%20adopted_planphx%202025%20update%20final_8.5x11.pdf (accessed on 1 July 2025).
  107. San Francisco Environment Department. San Francisco Climate Action Plan. 2021. Available online: https://www.sfenvironment.org/climateplan (accessed on 1 July 2024).
  108. City of Boston. City of Boston Climate Action Plan. 2019. Available online: https://www.boston.gov/departments/environment/boston-climate-action (accessed on 22 December 2025).
  109. City of Boston. Building Emissions Reduction and Disclosure Ordinance. Available online: https://www.boston.gov/departments/environment/berdo (accessed on 1 August 2026).
  110. City of New Orleans. Climate Action for a Resilient New Orleans. 2017. Available online: https://www.nola.gov/nola/media/Climate-Action/Climate-Action-for-a-Resilient-New-Orleans.pdf (accessed on 1 August 2026).
  111. Afzalan, N.; Muller, B. Online Participatory Technologies: Opportunities and Challenges for Enriching Participatory Planning. J. Am. Plan. Assoc. 2018, 84, 162–177. [Google Scholar] [CrossRef]
  112. Kitchin, R.; Lauriault, T.P.; Mcardle, G. Knowing and governing cities through urban indicators, city benchmarking and real-time dashboards. Reg. Stud. Reg. Sci. 2015, 2, 6–28. [Google Scholar] [CrossRef]
  113. City of Santa Monica Sustainable City Plan. 2022. Available online: https://www.smgov.net/uploadedFiles/Departments/OSE/Categories/Sustainability/SCP_Draft_v9(1).pdf (accessed on 1 May 2025).
Figure 1. Coding Procedures.
Sustainability 18 08177 g001
Figure 2. Breadth of Portal Content of High- and Low-ranked Sustainable Cities. Source: Drafted by the authors.
Sustainability 18 08177 g002
Figure 3. Amount of Datasets on the OGD Portals, grouped by Sustainable City Ranking. Source: Drafted by the authors.
Sustainability 18 08177 g003
Figure 4. (a) Structure Governance and (b) User-Friendly Support Criteria. Source: Drafted by the authors.
Sustainability 18 08177 g004
Figure 5. Equitable User Access. Source: Drafted by the authors.
Sustainability 18 08177 g005
Figure 6. Categories and Themes about the Purposes of the Local OGD Initiatives. Source: Drafted by the authors.
Sustainability 18 08177 g006
Table 1. The Four Criteria of the OGD Portals.
#CriteriaMeasurement of Criteria
1.Breadth of Portal Content
1.1Data CategoriesExtent of data grouped into organized categories
1.2Data File FormatsAvailability of accessible file formats (CSV, JSON)
1.3OGD Implementation ApproachesVariety of applications and their intended purposes
1.4Range of Datasets Scope of datasets available on the portal
2.Structure of Governance
2.1Chief Officer Identification of a primary contact or data officer
2.2Mayor’s Office InvolvementDegree of involvement from the mayor’s office
2.3OGD TeamDefined roles of the OGD team
2.4Committee or Advisory BoardRole of committees or advisory groups in OGD governance
3.User-Friendly Support
3.1Data Inventory Searchable list of available datasets
3.2User’s Guide Materials to help users navigate and understand the data
3.3Educational ResourcesAccess to training sessions or courses to use the data
4.Equitable User Access
4.1Data Request ToolAvailability of tools for users to request missing datasets
4.2Share your WorksOptions for users to share work created using OGD
4.3Support CenterPresence of user support or help centers
4.4Participation in Data ResearchOpportunities for public involvement in data research
4.5Blog/Social MediaPublic platforms to share and promote data engagement
4.6Open Data WeekHosting events for community engagement
4.7Feedback MechanismsMechanisms for users to provide feedback or suggestions
Table 2. Number of OGD References in OGD Policies, General Plans, and Sustainability/Climate Action Plans across the 19 Study Cities.
##CitySourceIn Total
OGD PolicyGeneral PlanSustainability/Climate Action PlanOGD Policy +
Both Plans
1San Francisco CA0011
2New York NY0000
3Los Angeles CA1012
4Boston MA0011
5Chicago IL0101
6Seattle WA0000
7Dallas TX0000
8Philadelphia PA0000
9Washington DC0000
10Phoenix AZ0101
11Houston TX0000
12Atlanta GANA000
13Denver CONA000
14Detroit MI0000
15Pittsburgh PA0NA00
16Baltimore MD0101
17Tampa FLNA000
18Miami FLNA000
19New Orleans LA1012
Total 2349
Note: NA = document does not exist. 0 = document exists but contains no references to OGD. Totals indicate the number of documents containing OGD references across the 19 cities. Source: Drafted by the authors.
Disclaimer/Publisher’s Note: The statements, opinions and data contained in all publications are solely those of the individual author(s) and contributor(s) and not of MDPI and/or the editor(s). MDPI and/or the editor(s) disclaim responsibility for any injury to people or property resulting from any ideas, methods, instructions or products referred to in the content.