Review

A Review on the Interplay Between Nighttime Light and Urban Vegetation: The Role of Remote Sensing Monitoring


1
Department of Architecture (DIDA), University of Florence, 50100 Florence, Italy
2
Department of Agriculture, Food, Environment and Forestry (DAGRI), University of Florence, 50145 Florence, Italy
3
Fondazione Per Il Futuro Delle Città (FFC), 00187 Rome, Italy
4
Department of Agricultural and Food Sciences (DISTAL), University of Bologna, Viale Fanin 50, 40127 Bologna, Italy
*
Author to whom correspondence should be addressed.
Sustainability 2026, 18(15), 7998; https://doi.org/10.3390/su18157998
Submission received: 2 July 2026 / Revised: 31 July 2026 / Accepted: 4 August 2026 / Published: 6 August 2026

Abstract

Artificial light at night (ALAN) is an increasing component of urban environmental change, affecting vegetation dynamics and ecosystem functioning. Satellite nighttime light (NTL) data serve as proxies for urbanization and artificial illumination, aiding the analysis of vegetation responses to human pressures. However, NTL–vegetation relationships are often poorly synthesized, and ALAN is rarely included in frameworks linking urban vegetation, climate, and human drivers. Drawing on a 2014–2025 Scopus and Web of Science search, this review of 22 articles categorizes findings as (i) Lights Track Urbanization, (ii) Vegetation Modulates Light, and (iii) ALAN Shapes Ecology. Results show strong geographical concentration in China, followed by the United States, and high heterogeneity in sensors, metrics, and methods. Increasing nighttime radiance is consistently associated with vegetation decline and higher environmental pressure, while vegetation modulates light through canopy structure and phenology. ALAN effects on plant phenology are reported but vary relative to climatic drivers and are highly context-dependent. Despite these advances, the field remains methodologically inconsistent and geographically biased. This review highlights the need for harmonized multi-sensor frameworks that integrate radiance, vegetation, and climate data to improve assessments of urban environmental change and to support biodiversity conservation and light-sensitive urban planning, thereby preserving ecosystem service functions.

1. Introduction

Rapid urban expansion and anthropogenic pressures are increasingly reshaping urban ecosystems and affecting vegetation structure and functioning [1]. Urban greening initiatives, such as the commitment to plant one trillion trees by 2030, highlight the importance of urban forests for carbon sequestration, biodiversity conservation [2], heat island mitigation, and water cycle regulation [3]. Vegetation dynamics are primarily driven by climatic factors, including temperature, precipitation, and solar radiation [4,5], while urbanization exerts both direct and context-dependent effects mediated by local climate and management practices [6]. Urban vegetation plays a key role in ecosystem functioning and resilience [7], and its performance within nature-based solutions and green infrastructure strategies [8] may also be influenced by nocturnal anthropogenic pressures such as artificial light at night, which can alter vegetation dynamics and ecosystem service delivery [9]. Among anthropogenic drivers, ALAN has emerged as an increasing form of environmental pollution [10,11] that extends beyond illuminated areas and affects microclimate and, in turn, plant ecological and physiological processes [11,12]. It alters photoperiodic and circadian regulation, influencing plant phenology, physiology, and potentially carbon sequestration [13], and can induce stress responses that increase vulnerability to other environmental stressors [14,15]. At the ecosystem level, ALAN disrupts nocturnal plant–pollinator networks, with cascading effects on biodiversity [16], often amplified by co-occurring urban stressors such as heat, drought, air pollution, and soil moisture deficits [14,17].
Vegetation dynamics are commonly assessed using satellite-derived greenness indices, such as the Normalized Difference Vegetation Index (NDVI), which are widely applied for their simplicity, long-term availability, and effectiveness in extracting vegetation information from multispectral imagery [18]. In parallel, advances in remote sensing have improved the monitoring of light pollution and its spatial and temporal dynamics [19]. Nighttime light (NTL) remote sensing data from sensors such as the Visible Infrared Imaging Radiometer Suite (VIIRS), Luojia-1, and SDGSAT-1 have become widely used proxies of urbanization and human activity [20], supporting applications in urban growth analysis, socioeconomic and environmental mapping, anthropogenic activity and light pollution studies [21].
Early global observations were provided by the Defense Meteorological Satellite Program–Operational Linescan System (DMSP-OLS, 1992–2013, United States), based on sun-synchronous polar-orbiting satellites. DMSP-OLS data have a spatial resolution of approximately 2.7 km (resampled to 1 km in standard products) and a near-global revisit cycle of 24 h. However, the sensor is limited by low radiometric resolution (6-bit), saturation in brightly lit urban areas, and the absence of onboard radiometric calibration. Since 2011, the VIIRS, operated by the United States and flown aboard the Suomi National Polar-orbiting Partnership (Suomi NPP) and subsequent Joint Polar Satellite System (JPSS) satellites, has significantly improved nighttime observations. The VIIRS Day/Night Band (DNB), currently the only instrument providing regular global nighttime coverage, provides data at an approximate 750 m spatial resolution at nadir with daily global coverage. Monthly and annual composites have been available since 2012, and the Black Marble product suite offers daily corrected observations at 500 m resolution. Compared to DMSP-OLS, VIIRS provides onboard calibration, a wider dynamic range, and higher sensitivity to low-light emissions. Nevertheless, its spectral response (0.5–0.9 μm) remains limited in its ability to capture shorter wavelengths, including portions of blue and ultraviolet emissions relevant to modern LED lighting. Complementary high-resolution systems, including International Space Station (ISS) imagery (~5–200 m), EROS-B (Israel, ~0.7 m), Jilin-1 (China, ~0.9 m), and Luojia-1-01 (China, ~130 m), enable finer-scale characterization of nighttime lighting patterns but are constrained by irregular acquisition, limited temporal coverage, cloud and moonlight contamination, and data continuity issues [22]. These limitations highlight the importance of integrating satellite-based observations with ground-based measurements within multi-sensor frameworks [23].
Despite the rapid expansion of NTL datasets, the relationships among urbanization, artificial illumination, and vegetation dynamics remain fragmented and insufficiently synthesized. Although urban effects on vegetation phenology have been examined at local and multi-city scales, the relative contributions of different urban drivers and their mechanisms remain poorly quantified [24]. Phenological research has traditionally focused on climatic controls, while vegetation monitoring has largely relied on greenness-based indicators such as NDVI. More recently, urbanization-related anthropogenic drivers have emerged as an important research frontier [25], yet ALAN has rarely been integrated into urban vegetation frameworks. Consequently, the use of NTL data in studies of vegetation phenology and ecosystem functioning remains limited, hindering a mechanistic understanding of how artificial illumination interacts with urban development, vegetation structure, and climate to shape vegetation dynamics across urban landscapes. To address this gap, this review provides a comprehensive synthesis of remote sensing-based evidence on the interplay between NTL and urban vegetation over the last decade. It specifically (i) evaluates how NTL, considered both as a proxy for urbanization intensity and as a representation of ALAN, relates to vegetation structure, phenology, and ecosystem dynamics in urban environments; (ii) identifies key methodological and conceptual gaps, with particular emphasis on the integration of multi-sensor remote sensing datasets and vegetation metrics; and (iii) discusses implications for urban environmental management and policy, highlighting how NTL-based evidence can inform light pollution mitigation, green infrastructure planning, and sustainable urban development.

2. Materials and Methods

The review is organized into three thematic sections, namely (i) the use of NTL data as indicators of urbanization and anthropogenic pressure, including their integration with vegetation and climate-related indices to assess interactions with climate warming; (ii) the role of vegetation structure, canopy properties, and seasonal phenology in modulating ALAN propagation and nighttime light intensity, with implications for vegetation management, land-use planning, and light pollution mitigation strategies; and (iii) the ecological and phenological responses of plants and biodiversity to ALAN, as assessed using NTL observations.
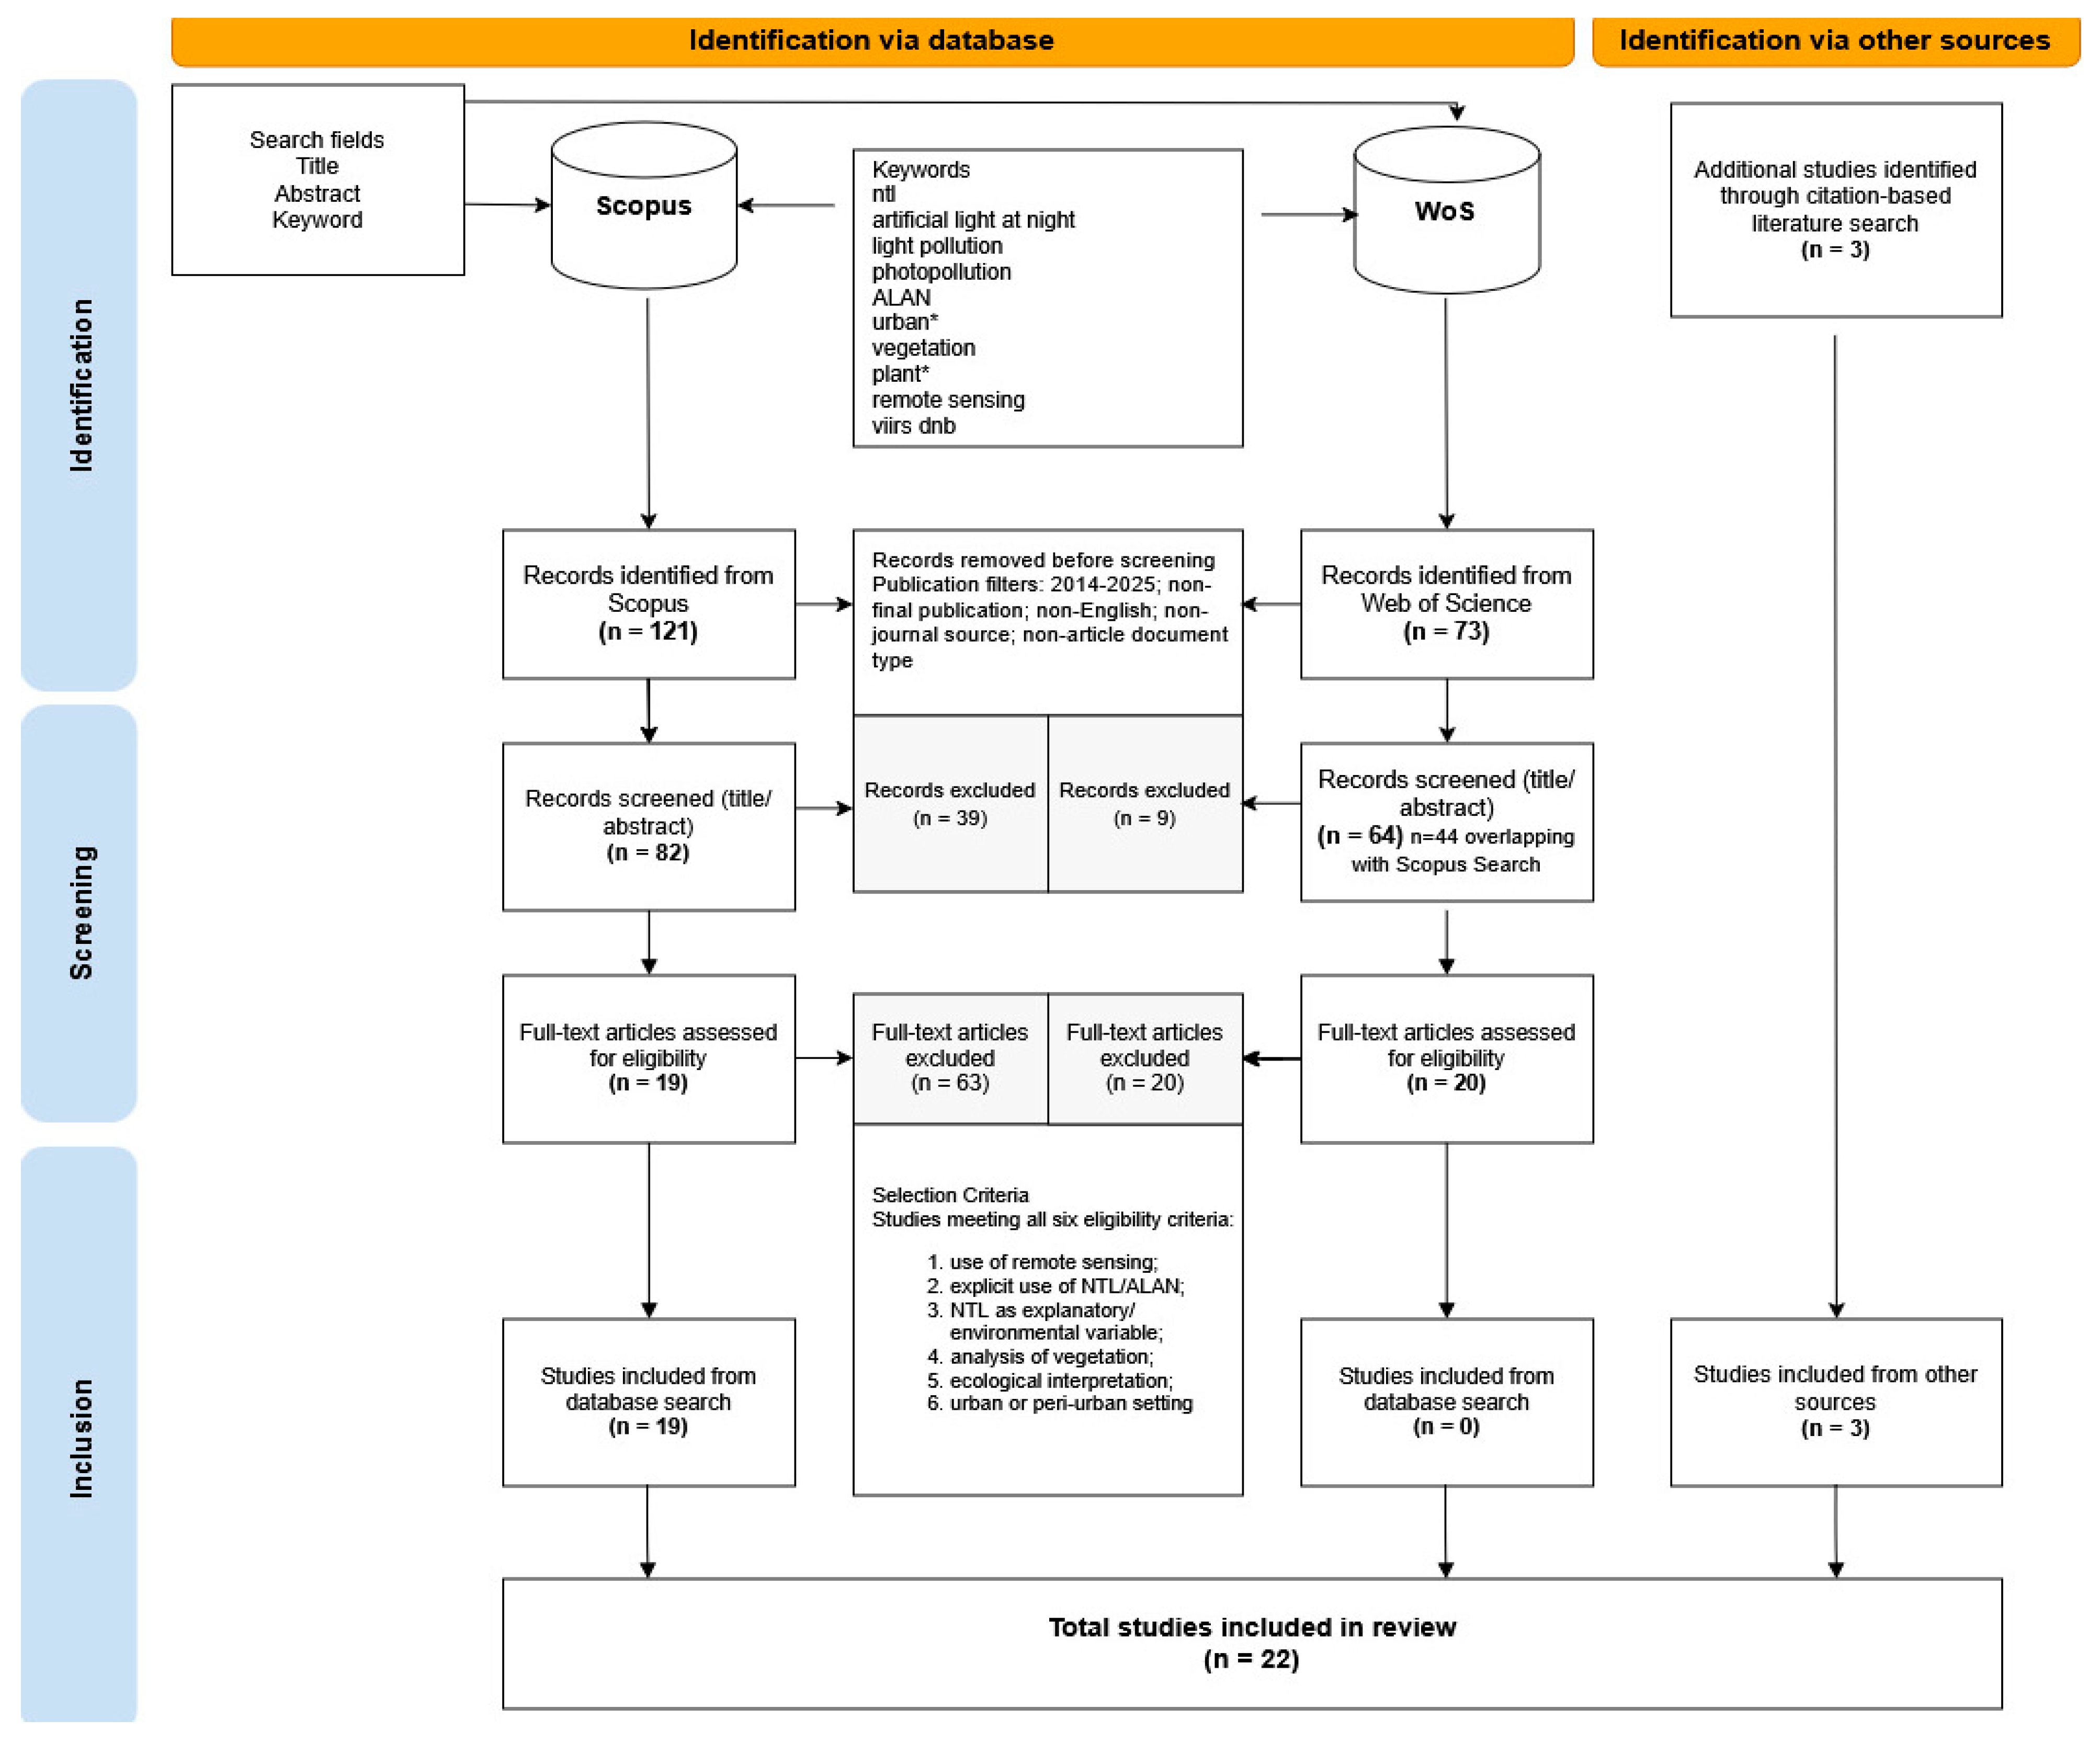
This study was conducted as a structured literature review. The review design was established to ensure transparency, reproducibility, and consistency throughout the study selection and evidence synthesis process. Study screening and eligibility assessment were carried out by the first author and subsequently reviewed by all co-authors, who discussed and agreed on the final set of included studies and on the methodological criteria applied. First, a structured literature search was performed in Elsevier’s Scopus database (https://www.scopus.com) to identify studies that investigated the relationships among NTL, ALAN, and urban vegetation using remote sensing. Scopus was selected as the primary database due to its broad multidisciplinary coverage and comprehensive indexing of environmental and remote sensing literature, aligning with other bibliometric and review studies in this research area [12,20]. The investigation was based on a set of fixed keywords reflecting the core concepts of this review, such as “ntl”, “artificial light at night”, “light pollution”, “photopollution”, “ALAN”, “urban*”, “vegetation”, “plant*”, “remote sensing”, and “viirs dnb”. The asterisk symbol was included for terms with possible spelling variations or plural forms (e.g., “urban”, “plant”). Specifically, the following Boolean query was used to search the Scopus database: (TITLE-ABS-KEY (ntl)) OR (TITLE-ABS-KEY (artificial AND light AND at AND night)) OR (TITLE-ABS-KEY (light AND pollution)) AND (TITLE-ABS-KEY (photopollution)) OR (TITLE-ABS-KEY (ALAN)) OR (TITLE-ABS-KEY (urban*)) AND (TITLE-ABS-KEY (vegetation)) OR (TITLE-ABS-KEY (plant*)) AND (TITLE-ABS-KEY (remote AND sensing)) OR (TITLE-ABS-KEY (viirs AND dnb)). Keywords were queried within the fields (i) article title, (ii) abstract, and (iii) keywords. This initial query yielded a total of 121 documents. We then applied the following filters: publication years 2014–2025, final publication stage, English language, journal sources only, and document type: articles. After filtering, 82 publications remained. The screening process followed a two-stage protocol. First, all abstracts were assessed for relevance. Then, full-text articles were evaluated against predefined eligibility criteria. To ensure reproducibility and consistency, all records were screened using a structured binary coding system based on six variables: (i) the use of remote sensing data, (ii) the explicit use of nighttime light, artificial light at night, or light pollution, (iii) the role of these variables as explanatory factors or environmental indicators, including proxies of urbanization, (iv) the analysis of vegetation or vegetated habitats as a measured ecological component, (v) the presence of an ecological interpretation, including ecosystem dynamics or environmental implications, and (vi) the urban or peri-urban context of the study. Each variable was coded as one when the criterion was met and zero otherwise. Studies were included only when all six variables were set to one and when a significant relationship between nighttime light and vegetation-related variables was explicitly reported, ensuring the selection of publications that provide ecologically meaningful insights relevant to urban planning, environmental management, and the mitigation of artificial light at night. Studies were excluded if they focused exclusively on methodological aspects, such as preprocessing of nighttime light data or algorithm development without ecological analysis; if they did not use nighttime light data; if they did not include vegetation or vegetated habitats as an object of analysis; if ecological variables were treated purely statistically without interpretation; if the research was conducted exclusively in rural or agricultural contexts; or if the focus was limited to astronomical aspects, such as night sky visibility, without ecological implications. Following this screening process, 63 full-text articles were excluded, resulting in 19 studies identified through the database search. In addition, three studies specifically addressing the ecological effects of ALAN on plant phenology [26,27,28] were incorporated through a manual, citation-based literature search, as they were not retrieved by the structured Scopus query described above.
Through this screening procedure, a final set of 22 articles met all inclusion criteria and was selected for detailed review, as illustrated in Figure 1. To address concerns regarding single-database reliance, we conducted a supplementary search in Clarivate’s Web of Science database (https://www.webofscience.com/) using an equivalent query (TS = ((“ntl” OR “artificial light at night” OR “light pollution” OR photopollution OR ALAN) AND (urban*) AND (vegetation OR plant*) AND (“remote sensing” OR “VIIRS DNB”)), filtered to the same publication window (2014–2025) and document type (articles), yielding 73 records. After applying the same publication filters (publication year 2014–2025, final publication stage, English language, journal source, and document type: articles), 64 records remained for screening. Of these, 44 overlapped with the Scopus results, while 20 were exclusive to Web of Science. We applied the same six eligibility criteria described above to these 20 records; none met all criteria, confirming that no additional eligible studies beyond the 22 included in this review were identified through this cross-check. The final sample therefore remained set at 22 studies. For each eligible study, a standardized set of descriptive information was extracted and organized into a comparative database (Table 1, Table 2 and Table 3). The extracted variables included bibliographic information (reference and publication year), area of interest (AOI), type and source of NTL satellite data, temporal coverage of the NTL dataset, thresholds applied to NTL data (where reported), vegetation indices and traits, vegetation dataset source, vegetation-related variables, and plant species investigated (when applicable). To facilitate comparison across studies, the selected publications were first grouped by primary research objective and then ordered by publication year within each group in descending chronological order. This comparative analysis enabled the identification of three overarching thematic categories: (i) Lights Track Urbanization (LTU), (ii) Vegetation Modulates Light (VML), and (iii) ALAN Shapes Ecology (ASE). These category labels denote descriptive thematic framings used to organize the reviewed literature according to the primary conceptual relationship investigated by each study, rather than claims of established causal direction; the majority of the underlying studies report correlational or associative relationships between NTL and vegetation-related variables. The LTU category considers NTL as a proxy for urbanization and anthropogenic pressure, linking light intensity and spatial distribution to vegetation dynamics, thermal conditions, and ecosystem service indicators. The VML category focuses on the role of vegetation structure, canopy density, and seasonal phenology in modulating the propagation of artificial light and influencing urban light pollution patterns. The ASE category addresses how ALAN influences plant phenology, biodiversity and interacts with climatic drivers, with NTL serving as a quantitative measure of ALAN exposure and its ecological impacts.

3. Results

3.1. Global Distribution of Studies and Study Areas

Although the Scopus search covered the period from 2014 to 2025, application of exclusion criteria resulted in the inclusion of studies published between 2016 and 2025. The annual distribution of the included publications shows an overall increase toward the end of the study period. One study was published in 2016, three in 2017, one in 2018, two in 2019, none in 2020, three in 2021, two in 2022, one in 2023, four in 2024, and five in 2025. Overall, 15 of the 22 studies were published between 2021 and 2025, indicating a recent acceleration of research at the intersection of NTL remote sensing and vegetation analysis. A detailed summary of the selected studies is reported in Table 1, Table 2 and Table 3 and presented in Section 3.5, alongside descriptions of each thematic category.
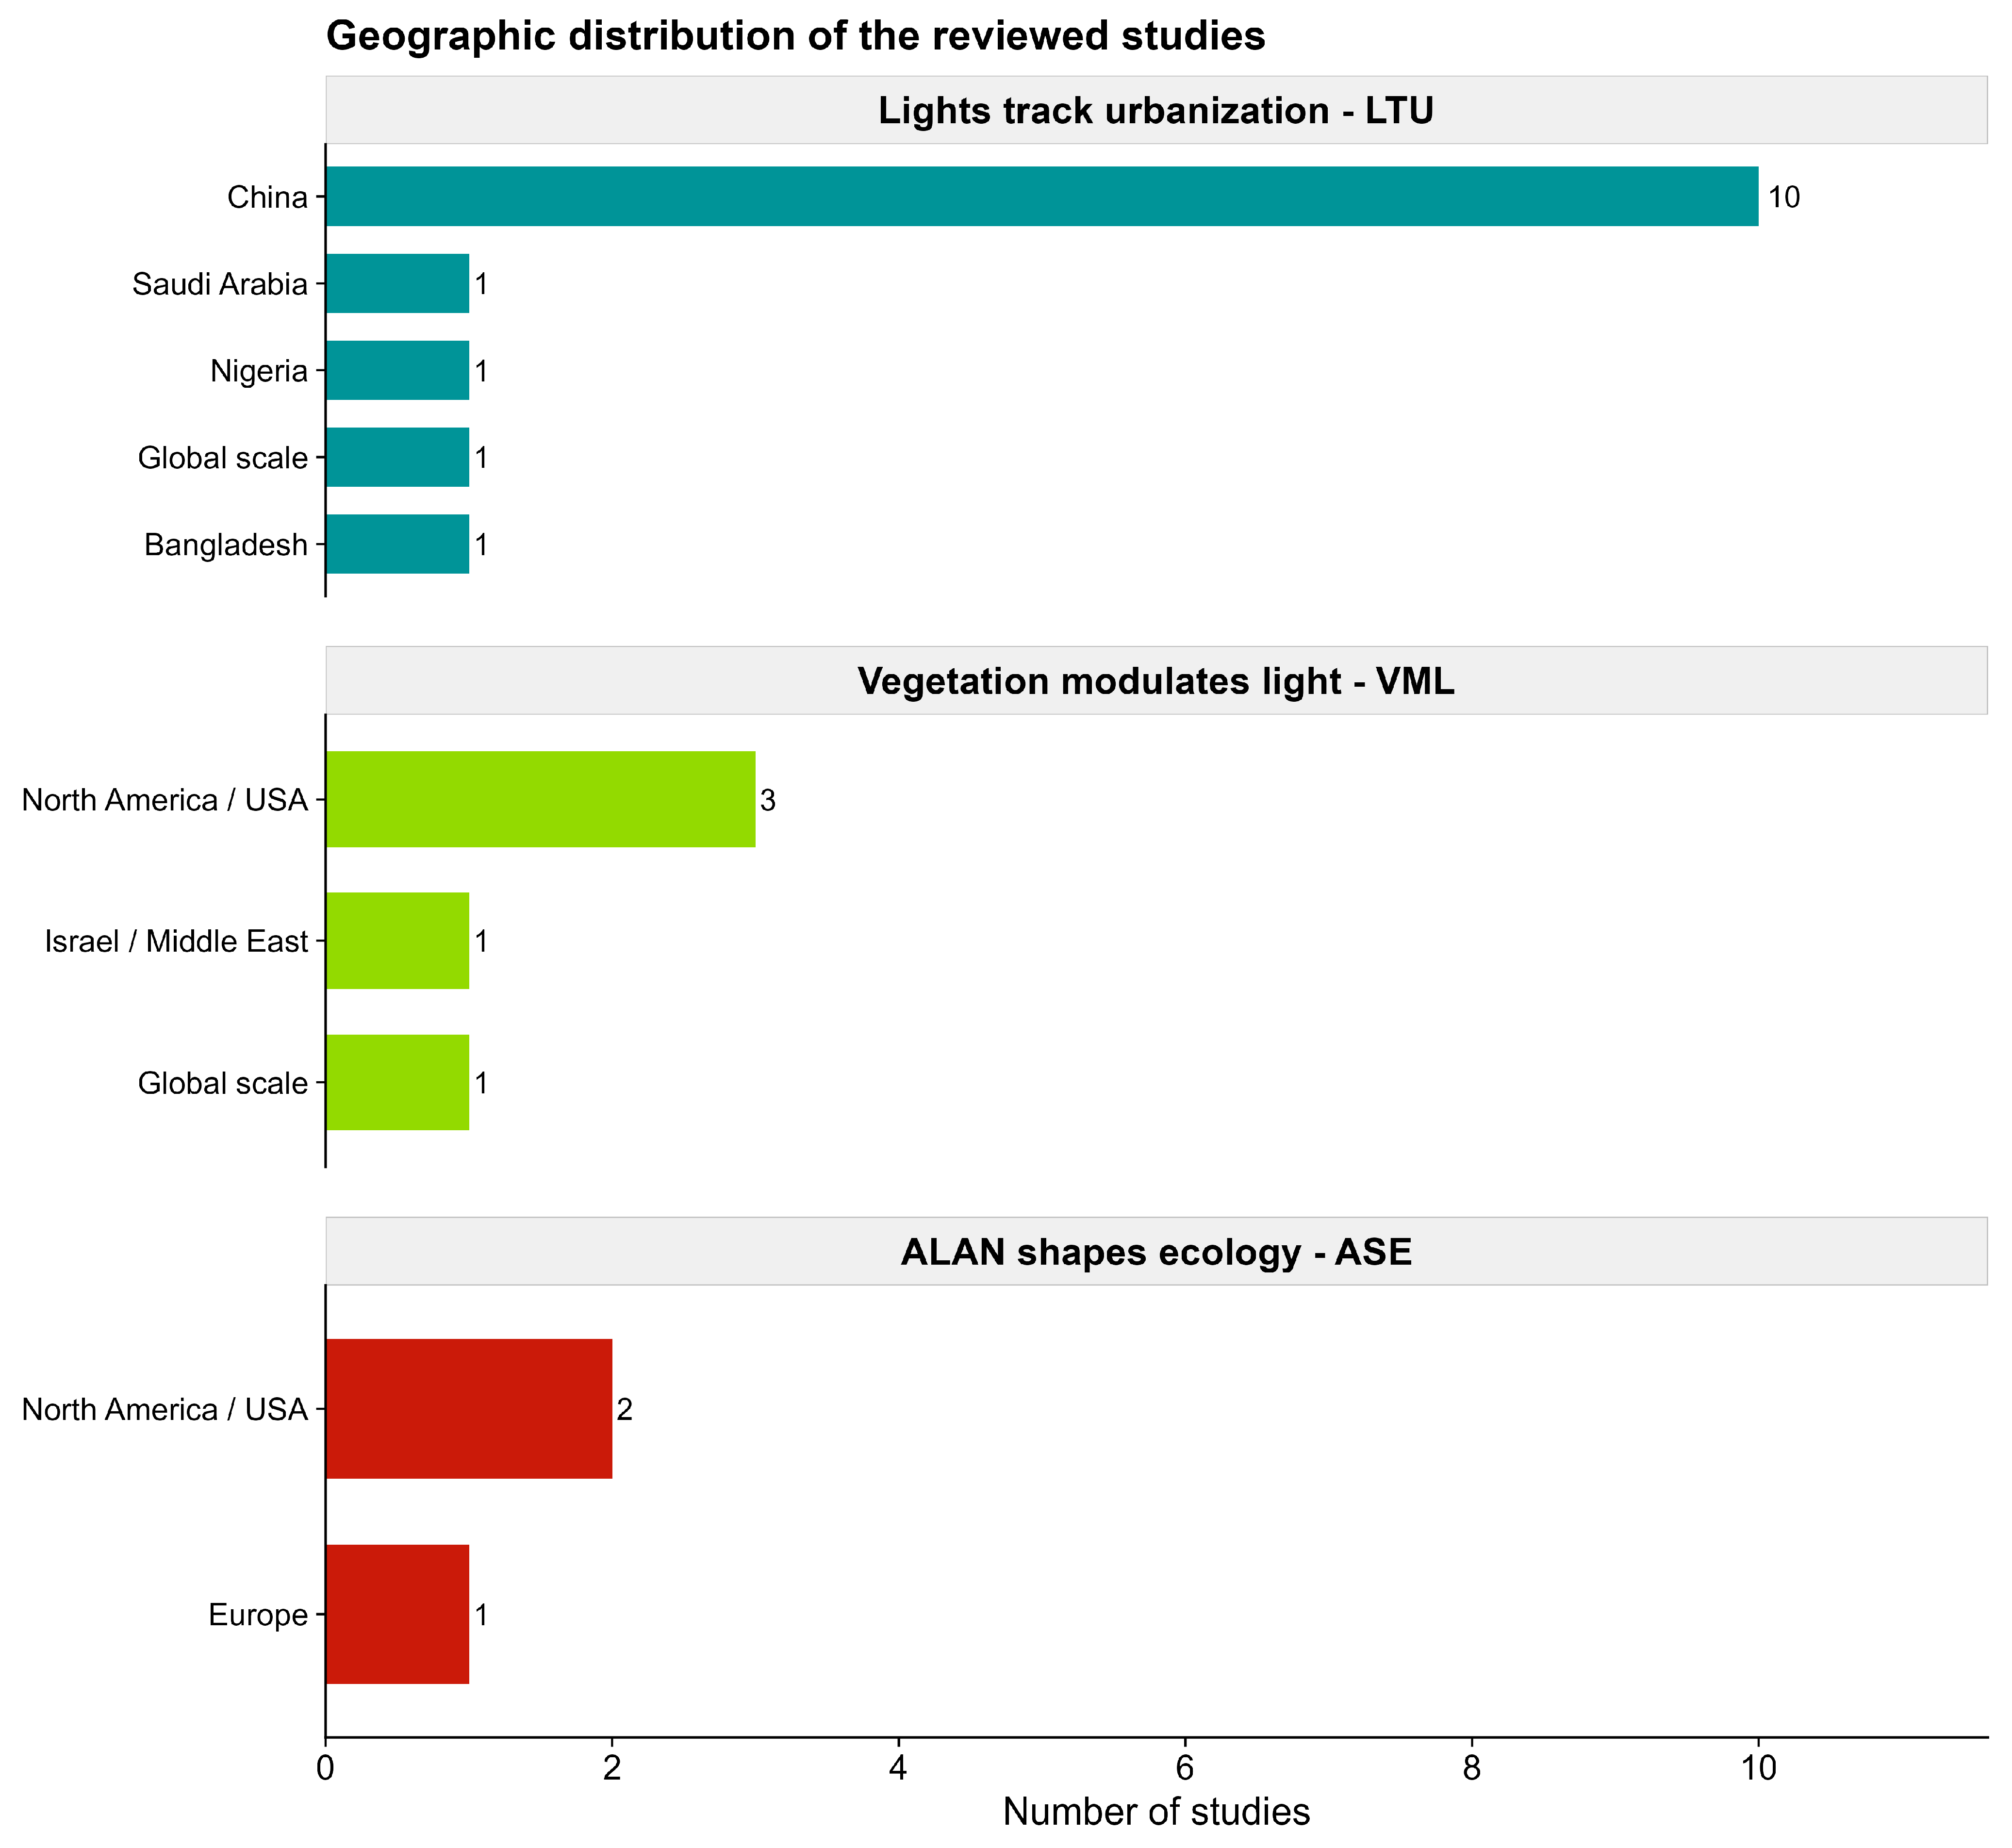
The reviewed studies span a wide range of spatial extents, from individual urban areas to global-scale analyses (Figure 2).
Most investigations focus on single cities or metropolitan regions (10 studies), including Beijing, Shenzhen, Changsha, Lianyungang, Luohe, Jinan, Dhaka, Lagos, Jerusalem, and suburban communities in the Houston extraterritorial jurisdiction. A second group of studies examines multi-city or urban agglomeration datasets (6 studies), including major Chinese urban agglomerations (3 studies), prefecture-level cities in China (1 study), and large cities in the United States and Canada (2 studies). Broader geographic analyses include Saudi Arabia (1 study), large regional assessments conducted across the conterminous United States (CONUS) (2 studies) and one continental analysis in Europe (1 study). Finally, broader spatial frameworks include multi-continental and global datasets, such as global cities (1 study) and multi-scale analyses of major global urban centers combined with intra-urban sites (1 study).

3.2. NTL Data Sources, Temporal Coverage and Thresholds

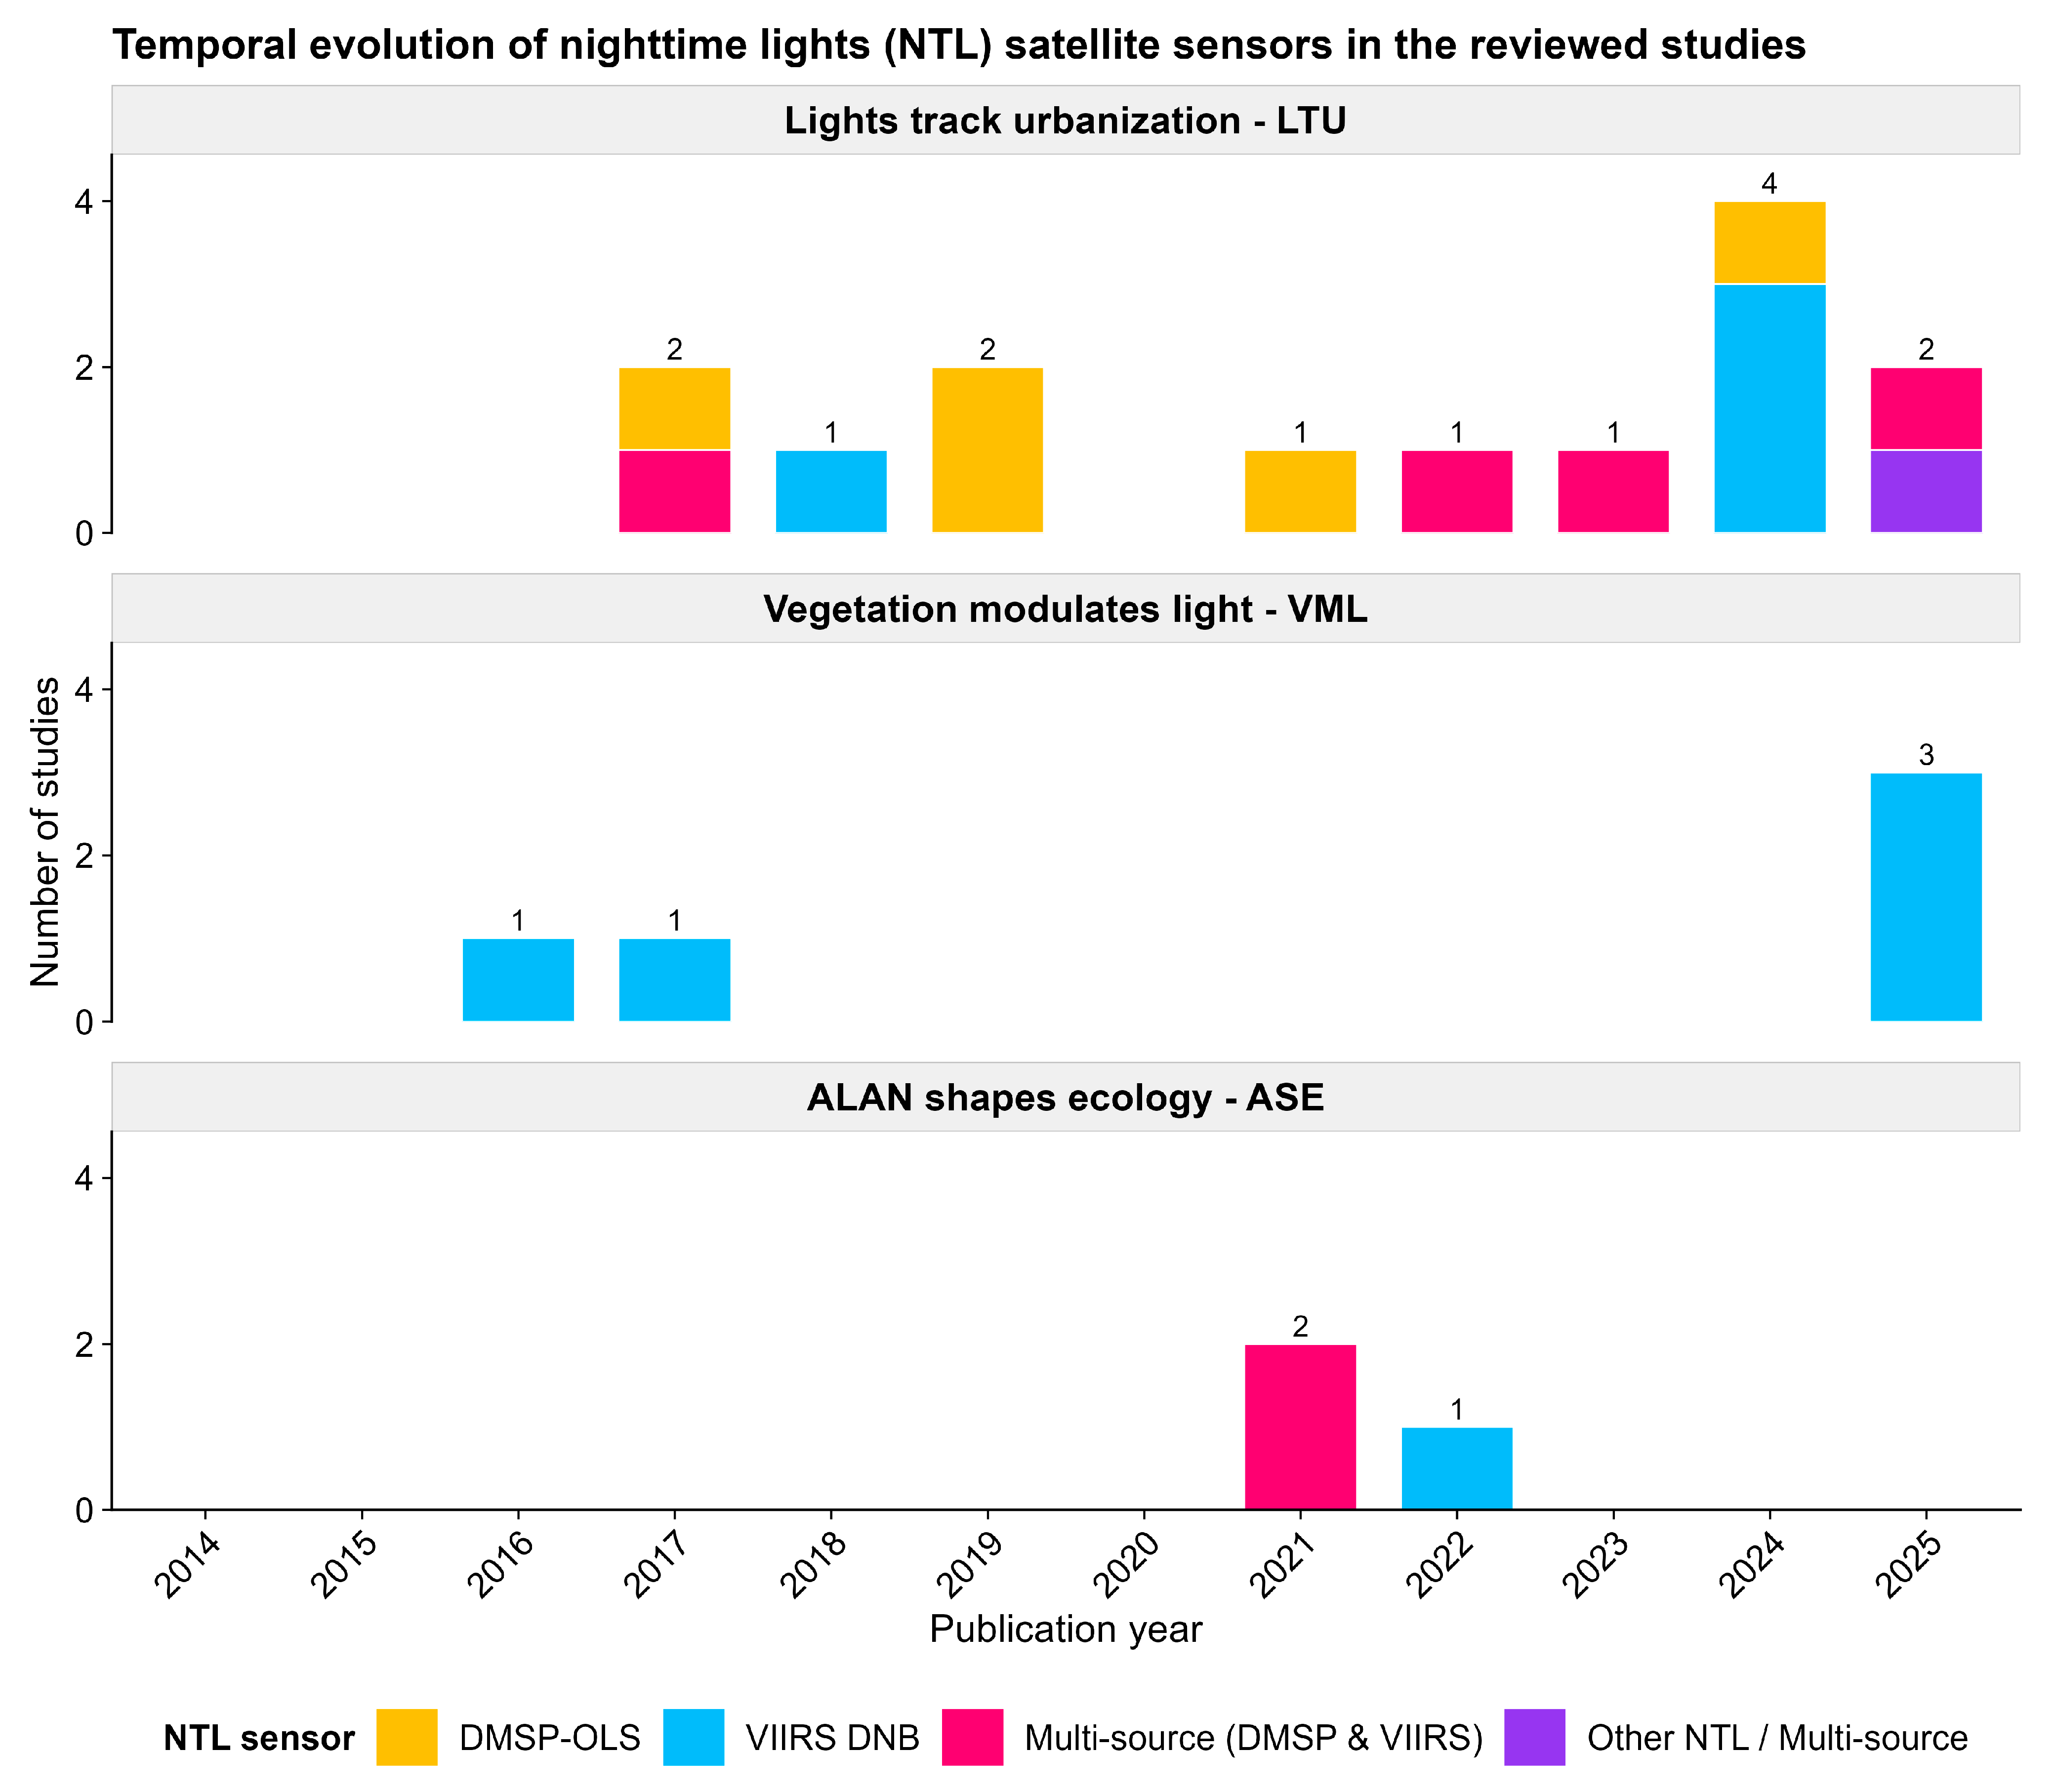
Across the 22 reviewed studies, the most frequently used NTL data source was VIIRS DNB, employed in 16 studies either alone or in combination with other datasets (Figure 3).
DMSP-OLS was used in 10 studies, 6 of which integrated DMSP-OLS and VIIRS to generate continuous, long-term time series. Additional sources included EROS-B nighttime imagery combined with ISS observations and ground-based Sky Quality Meter (SQM) measurements for validation (1 study). One study relied on multi-source remote sensing data without explicitly specifying the NTL product. Data from the NOAA National Geophysical Data Center was used in 10 studies, while the Earth Observation Group was cited in 5 studies. NASA’s Black Marble product suite was employed in 3 studies. One study used a harmonized DMSP-OLS-like dataset for China covering the period 1992–2024, integrating DMSP-OLS and Suomi-NPP VIIRS observations.
On the other hand, temporal coverage varied across studies. Twelve studies used multi-year time series, including 1992–2022, 1998–2018, 1992–2015, 1992–2013, 2000–2015, and 2016–2018. Nine studies relied on single-year or discrete-year observations, including 2009, 2013, 2014 (2 studies), 2015, 2016, 2020, 2021, and 2023. One study used multiple reference years (2000, 2010, and 2020) to assess decadal changes [29]. Thresholds for defining NTL or ALAN varied across studies. Reported criteria included Digital Number (DN) > 45 to identify stable bright light sources or skyglow regions, and DN > 9 to define direct light areas, combined in one study with Sky Luminance Atlas levels 4–10 to represent moderate artificial light and >10 to indicate high-intensity exposure [27]. One study excluded values with DN ≤ 7 to remove noise [28]. Another defined non-ALAN sites as pixels with radiance equal to 0 nW/cm2/sr and ALAN-exposed sites as those above the 75th percentile of radiance. Additional approaches included the use of average monthly VIIRS DNB radiance within a 10 km buffer, classification into radiance thresholds (2, 5, 10, 25, 50, 100, and 250 nW/cm2/sr), thresholds derived from EROS-B (DN > 1000, 2000, 4000) and ISS imagery (DN > 15, 30, 50), and an NTLI criterion requiring values greater than 0 for at least three consecutive years (1998–2018).

3.3. Vegetation Metrics and Remote Sensing Datasets

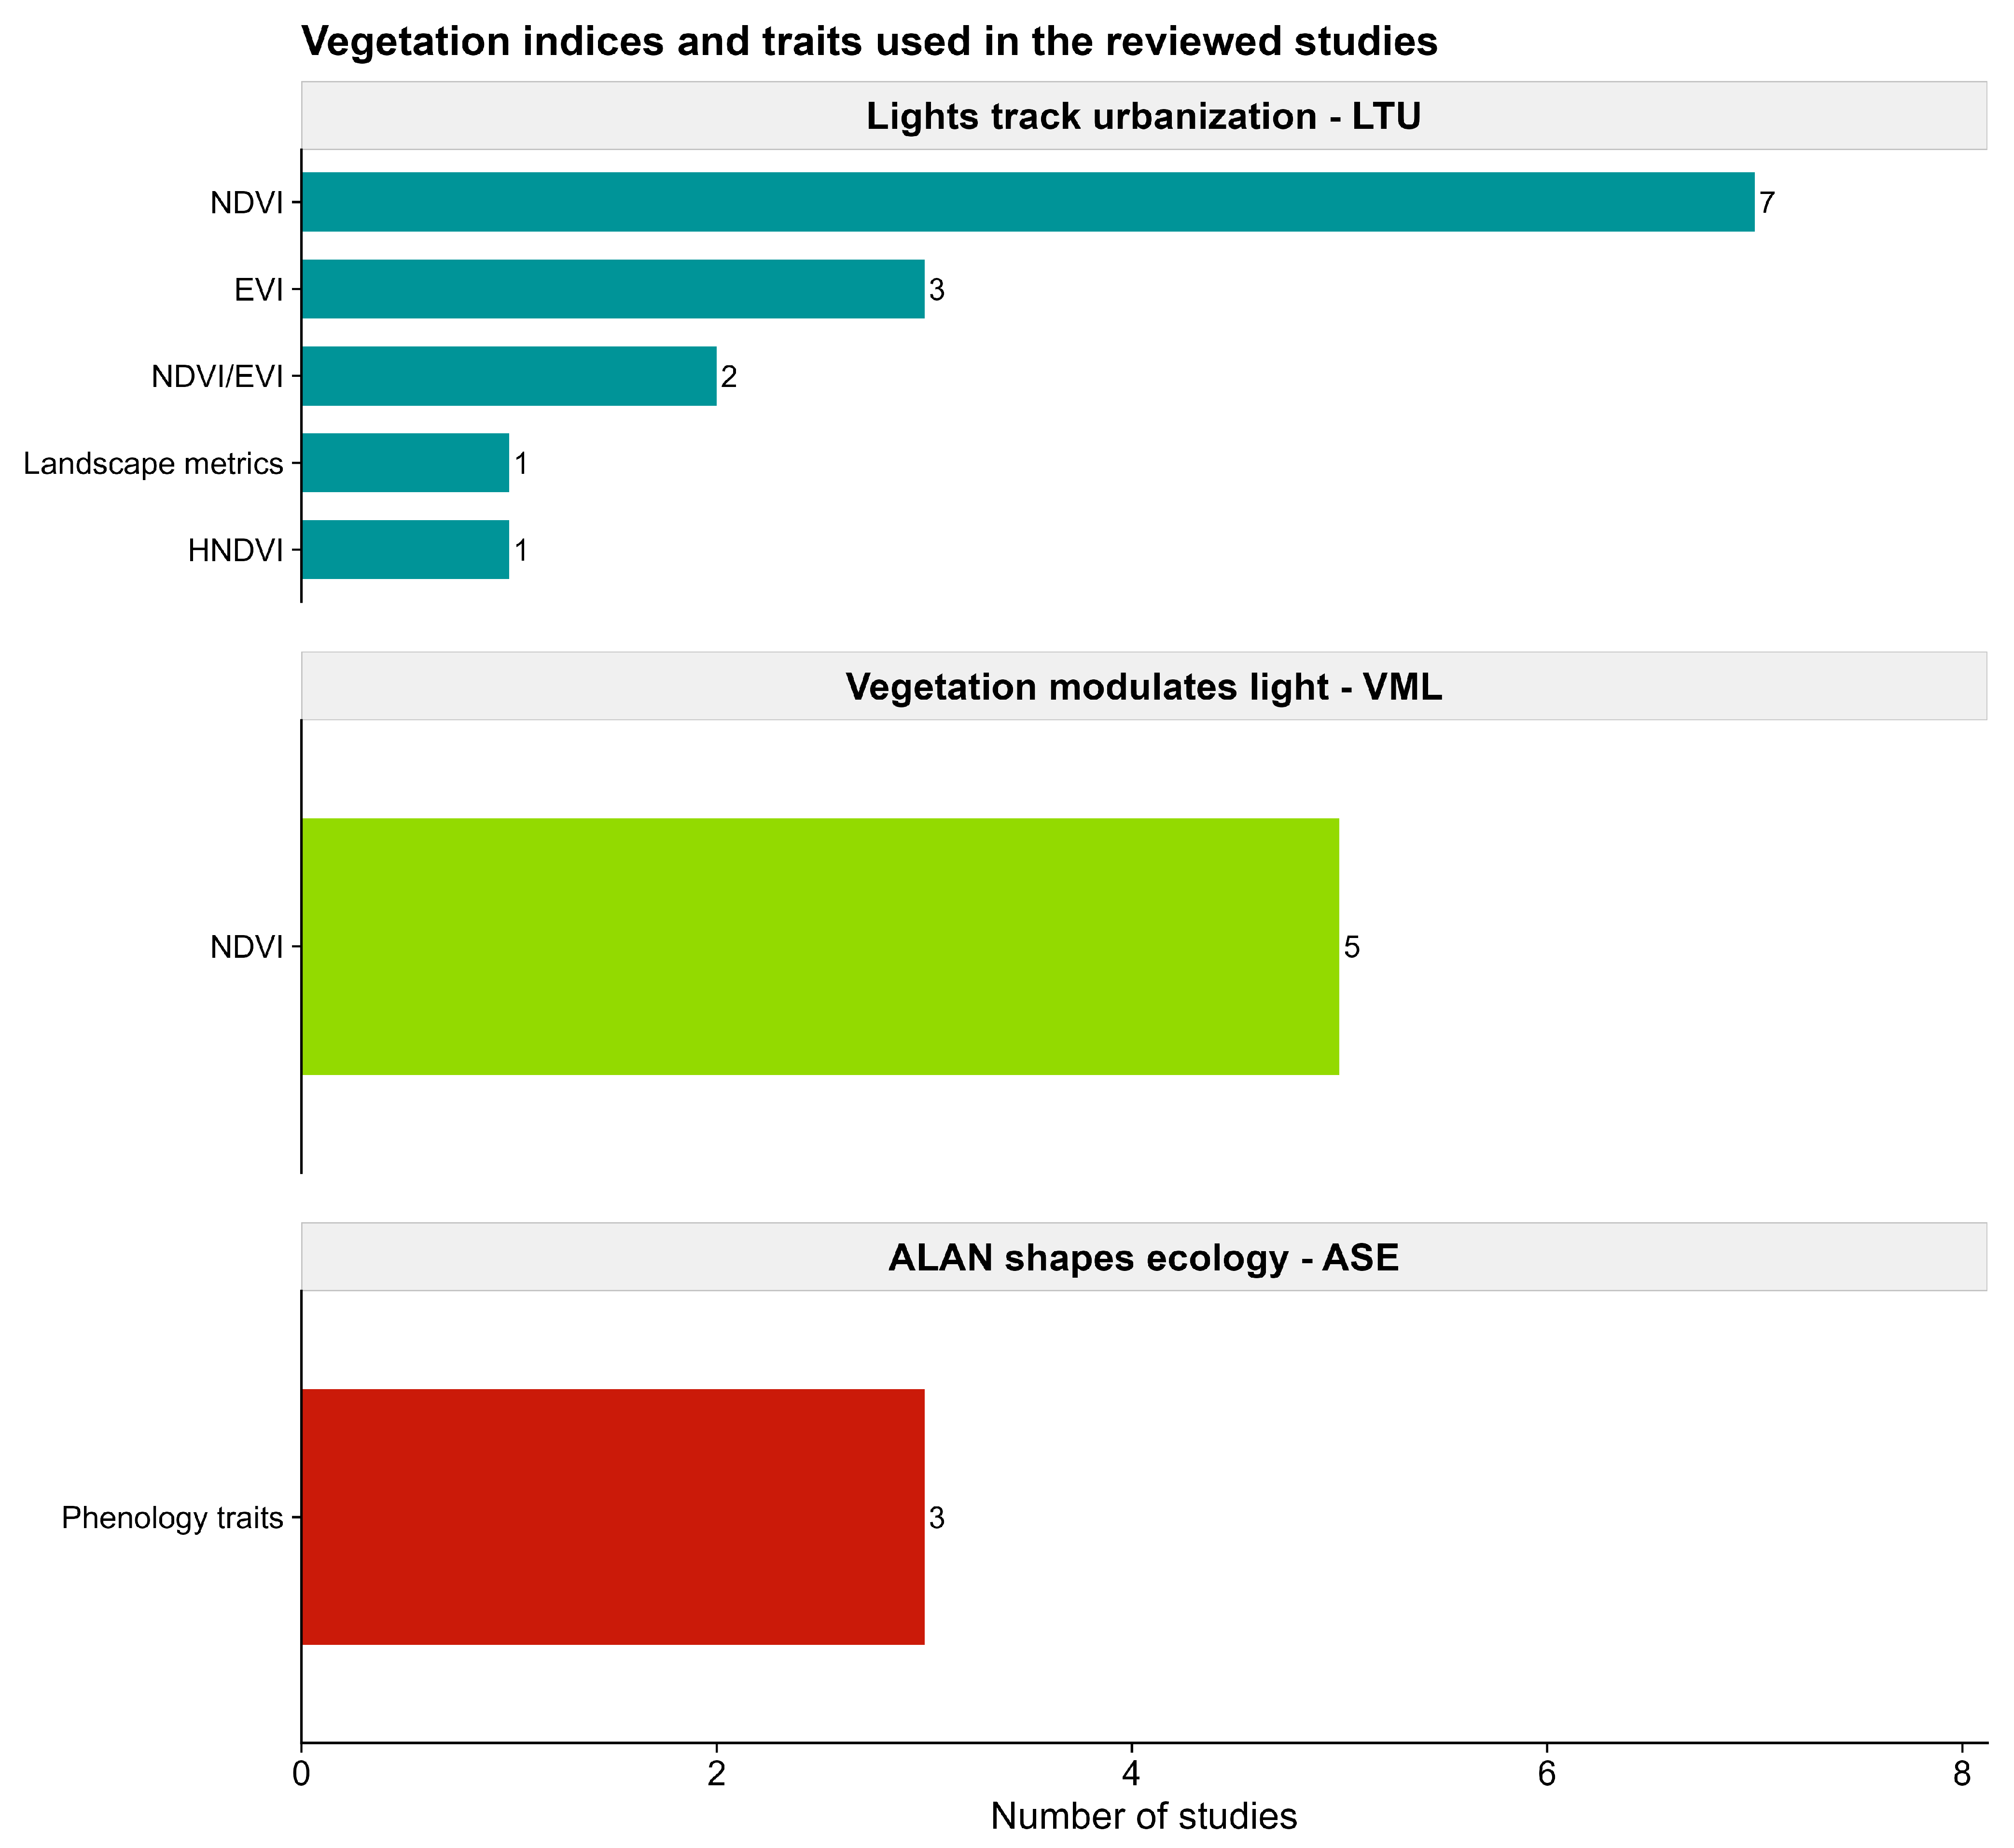
The reviewed studies employed a range of vegetation indices, phenological traits, and landscape metrics to assess vegetation dynamics and responses to ALAN (Figure 4). NDVI was used in 15 studies to quantify vegetation cover, greenness, canopy density, and overall vegetation condition. Among these, one study applied a human-activities-induced NDVI. The Enhanced Vegetation Index (EVI) was applied in 5 studies to capture additional aspects of vegetation dynamics, including structural properties such as leaf area index (LAI).
The NDVI datasets comprised a range of multi-source remote sensing products with varying spatial and temporal resolutions. These included MODIS-based products such as the 16-day vegetation indices (e.g., VNP13A1) at 500 m resolution, monthly NDVI products (e.g., MOD13C2) at 0.05° resolution, and 16-day composites at 250 m resolution. Additional NDVI data were derived from Landsat sensors (TM for 1995 and 2009; Landsat 8) and Sentinel-2 Level 2A imagery, as well as region-specific products such as the 250 m fractional vegetation cover dataset for China. EVI datasets were primarily obtained from MODIS monthly products (e.g., MOD13A3, Collection 6), although some studies did not explicitly report data provenance. Phenological metrics were derived from ground- and satellite-based sources, including the Pan European Phenology Project (PEP725), the USA National Phenology Network (2011–2016), and the MODIS Land Cover Dynamics product (MCD12Q2, Collection 6). Finally, landscape metrics, including Percentage of Landscape (PLAND), Largest Patch Index (LPI), and Mean Patch Size (MPS), were obtained from Map World China in one study [40].

3.4. Vegetation Variables and Species

The reviewed studies assessed vegetation structure, condition, and phenology using a combination of remote sensing and observational approaches. Key variables included vegetation cover, greenness, canopy density, and overall vegetation health, which were quantified in 19 studies using widely adopted spectral indices such as NDVI and EVI. Phenological dynamics were examined in three studies [26,27,43] primarily through observations of spring leaf-out (bud break) and autumn senescence (leaf coloration). These analyses focused on a range of North American tree species, including Acer rubrum, Acer saccharum, Betula papyrifera, Cercis canadensis, Cornus florida, Fagus grandifolia, Liquidambar styraciflua, Liriodendron tulipifera, Populus tremuloides, Prunus serotina, Prunus virginiana, and several Quercus species (e.g., Q. alba, Q. rubra, Q. macrocarpa), among others. Complementary observations of leaf-out and flowering phenology were reported for European species such as Aesculus hippocastanum, Alnus glutinosa, Betula pendula, Fagus sylvatica, Fraxinus excelsior, Quercus robur, and Tilia cordata.
In addition, one study explicitly quantified the start of the growing season for forest tree species, highlighting the more limited but emerging use of integrative phenological metrics across the reviewed literature.

3.5. Categories

3.5.1. Lights Track Urbanization: NTL as a Proxy for Urbanization and Anthropogenic Pressure on Vegetation and Urban Ecology

Vegetation cover, assessed using indicators such as NDVI and EVI, generally shows a declining trend in urban areas (Table 1), though it is influenced by urbanization dynamics and policy interventions over time [43]. Similarly, Zhang et al. [37] used time-series NTL and NDVI data in the Jinan region to identify urban land change patterns and surrounding vegetation dynamics, and to project urban growth up to 2030 using the SLEUTH (Slope, Land use, Exclusion, Urban, Transportation, and Hill-shade) model. NTL and NDVI exhibited inverse spatial patterns, with higher NTL values corresponding to lower vegetation levels in urbanized areas. In contrast, increases in HNDVI were observed in some rural regions [36]. Moreover, across multiple studies, NTL is positively correlated with land surface temperature (LST), canopy heat island intensity (CLHI), regional environmental noise (RN), and air pollutants such as PM2.5 and NO2, whereas vegetation indices show consistent negative relationships with these variables [31,32,34,38,39,40,41]. In Changsha (China), NTL showed a positive correlation with LST (r = 0.537), while NDVI showed a negative correlation (r = −0.316), with nonlinear responses indicating saturation effects for NTL and threshold-dependent cooling effects for NDVI. Together with other urban morphological variables, these factors explained 60.9% of the variance in LST [31].
Consistent evidence is provided by studies integrating nighttime light-based indicators such as the Corrected Night Lights Index (LERNCI), ecological land functions, and urbanization metrics, which have been jointly applied to quantify urban activity, vitality, and environmental change. Within this framework, Wang et al. [33] relate urban activity intensity, expressed through the Urban Vitality Index and modeled as a response variable to NTL-derived indicators, to environmental conditions, reporting significant associations with vegetation represented by Land Ecological Function indicators, including Green Space Ratio, Vegetation Quality, and the Remote-Sensing-based Ecological Index.
In a complementary analysis, Liu et al. [42] used LERNCI to integrate NTL with LST and EVI, correcting saturation effects in DMSP/OLS data and improving the delineation of urban structures. Their results show strong agreement with VIIRS DNB (R2 up to 0.89) and population density (R2 up to 0.72), with spatial gradients reflecting increasing impervious surfaces, decreasing vegetation cover, and intensifying urban heat island effects toward city centers. For instance, areas with higher corrected nighttime light values consistently correspond to zones of reduced vegetation and elevated land surface temperatures. From a broader perspective, Alamgir Hossen Bhuiyan et al. [35] integrate urbanization indicators, including population density, technomass, and vertical growth, to assess ecosystem responses, reporting NTL as a significant indicator of urbanization degree in relation to ecosystem service value (r > 0.56), ranking second after technomass (r > 0.61) and ahead of population density (r > 0.54).

3.5.2. Vegetation Modulates Light: The Role of Vegetation Structure, Canopy Density, and Seasonal Phenology in Modulating ALAN Propagation and Urban Light Pollution Patterns and Mitigation

The five studies reviewed (Table 2) demonstrate that vegetation structure, canopy density, and seasonal phenology are key modulators of ALAN in urban environments (Table 2). Seasonal vegetation dynamics, captured through NDVI, significantly influence ALAN anisotropy, with strong correlations between NDVI and the Change Index (CI) at pixel (0.41–0.79) and regional scales (0.56–0.92), and with CI seasonality closely correlated with vegetation seasonality (r = 0.75), indicating that vegetation growth can reduce the anisotropy of ALAN and leads to a more even distribution of emitted light in different directions [43]. Urban vegetation modulates nighttime light intensity, with NDVI identified as the most influential environmental variable (t = −7.080), and higher vegetation density associated with lower nighttime light levels [44]. On the other hand, vegetation phenology, represented by NDVI, is explicitly integrated into the city emission function (CEF), which characterizes the angular distribution patterns of urban nighttime light (NTL) emissions. Increasing NDVI enhances CEF magnitude and improves angular normalization performance, reducing errors and improving model accuracy, while also weakening ALAN anisotropy and stabilizing multiangle NTL observations across viewing zenith angles [45].
At broader scales, NDVI is generally negatively correlated with nighttime brightness, particularly in winter (Rs = −0.48 to −0.22) [46], while low vegetation cover and surface albedo are associated with bright areas on EROS-B night light imagery [47].

3.5.3. ALAN Shapes Ecology: NTL to Assess the Ecological Impacts of ALAN on Plant Phenology and Its Interaction with Climate Drivers

The three studies reviewed (Table 3) highlight the significant ecological impacts of ALAN on plant phenology and its interactions with climate drivers (Table 3). As shown in studies conducted in CONUS, ALAN significantly advances leaf budburst by 8.9 ± 6.9 days and delays leaf senescence by 6.0 ± 11.9 days in deciduous woody plants, with phenological shifts strongly correlated with light intensity and, in some cases, interacting with temperature for leaf coloring [26]. In the United States, ALAN tended to advance the start of the growing season (SOS), with a statistically negative partial correlation (RALAN = −0.19, p < 0.001), but with a weaker overall effect than preseason temperature (RT = −0.60). The phenological response exhibited a spatially divergent pattern, with most areas showing an advance effect (71.7%) and smaller proportions showing a delay, with stronger advances in climatically moderate regions and reduced or reversed effects in regions with extreme temperatures [28]. In Europe, increased artificial light between 1992–2015 was associated with delays in leaf-out and flowering at 12–39% and 6–53% of observation sites, respectively, with phenological shifts influenced by artificial light pollution and temperature interactions, particularly in light-sensitive species [27].

4. Discussion

Satellite-based remote sensing, particularly through NTL and vegetation datasets, provides widely accessible, high-resolution information that has increasingly been used to study urbanization processes and their ecological consequences. In recent years, the integration of NTL and vegetation metrics has become a key approach to understanding the links among ALAN, land-use change, and ecosystem dynamics amid accelerating urban and environmental pressures. This study reviews 22 peer-reviewed articles identified through a structured search of the Scopus database, using targeted keywords related to nighttime light remote sensing, vegetation indices, and urban environmental change. The review synthesizes current research trends, methodological frameworks, and key knowledge gaps, with particular attention to data heterogeneity, cross-scale comparability, and emerging ecological applications. It provides a consolidated overview of the state of the art in NTL–vegetation research, highlighting directions for future methodological development and interdisciplinary integration.

4.1. Geographical Biases and Research Concentration

Among our 22 reviewed studies, the geographical distribution shows a strong concentration in China, which accounted for 10 study areas [30,32,33,34,35,37,38,39,40,41]. The United States is the second most frequently investigated country, with five study areas located within its territory [26,28,43,44,45]. However, this concentration should be interpreted as a feature of our eligibility-filtered sample rather than a comprehensive characterization of global research activity in this field (see Section 4.7). Nevertheless, the predominance of China and the United States as study areas is in line with broader patterns observed in vegetation phenology, climate change, and urban NTL remote sensing research, where these two countries are frequently the focus of empirical investigation owing to their extensive urbanization, high-resolution monitoring infrastructure, and data availability [21,25]. This is also consistent with a recent meta-analysis of 545 urban NTL publications, which identifies China, the United States, the European Union, Southeast Asia, South Asia, and the Middle East as the six main hotspot regions for NTL urban research in terms of publication frequency [48].
The marked representation of China may further reflect the country’s rapid urbanization and the widespread application of NTL data in urban studies, where these datasets are extensively used to monitor urban expansion, suburbanization, and socioeconomic dynamics owing to their high temporal resolution, free accessibility, and compatibility with other optical remote sensing products [49]. The increasing availability of higher-quality datasets such as NPP/VIIRS has further strengthened their application, reflecting sustained national investment in remote sensing and positioning Earth observation as a central tool for urban and environmental monitoring and governance [50]. In parallel, the growing recognition of environmental externalities, including light pollution, is increasingly reflected in emerging policy frameworks, particularly in China, where recent environmental regulation reforms have expanded the scope of pollution control to include artificial light as part of broader environmental governance approaches [51,52]. On the other hand, the United States is the second-largest contributor in research output and plays a complementary role in the development of nighttime light remote sensing methodologies. US-led studies typically focus on continental-scale frameworks (e.g., CONUS), multi-city comparisons, and validation-oriented analyses, frequently relying on VIIRS DNB and NASA Black Marble products. These contributions have been particularly important for methodological standardization and cross-sensor consistency [26,28,43,44,45].
From a spatial perspective, the geographical coverage of applications remains uneven. Europe appears only occasionally, mainly in global or multi-continental studies rather than as a primary study region, whereas the Middle East and South Asia are represented mainly by single-country or single-city applications (e.g., Saudi Arabia, Bangladesh, Dhaka) rather than by systematic regional analyses. All three regions are nonetheless recognized as hotspots of NTL urban research in the broader literature, which spans a wide range of applications beyond vegetation (e.g., urban expansion, energy, socioeconomic monitoring); their limited presence here more likely reflects the narrower thematic scope of our eligibility criteria, which require the joint presence of NTL data, vegetation indicators, and ecological interpretation, rather than an absence of relevant NTL research activity in these regions [48]. Africa, by contrast, is strongly underrepresented, with only isolated urban case studies (e.g., Lagos). It is not among these six hotspot regions even for NTL research in general, so its underrepresentation more plausibly reflects a broader gap in the wider literature rather than a limitation specific to our sample [48]. Given these clear differences in urban form, vegetation structure, lighting infrastructure, and socio-economic conditions, this uneven distribution limits the global transferability of current findings and may introduce regional bias in observed NTL–vegetation relationships. From a methodological perspective, these patterns reflect both the transition from DMSP-OLS to VIIRS [22] and the pronounced geographical concentration of research activity, which jointly limit the global representativeness of current evidence. This highlights the need for more geographically diversified case studies, harmonized multi-sensor processing frameworks, and cross-regional validation strategies to improve the reliability and general applicability of NTL–vegetation interaction models.

4.2. Data Heterogeneity and Implications for Methodological Consistency and Comparability

The synthesis highlights substantial heterogeneity in both NTL and vegetation datasets. Among the reviewed studies published during 2014–2025, VIIRS DNB has been the most widely used NTL product in recent applications [26,32,33,35,40,43,44,45,46] due to its radiometric calibration, higher spatial resolution, and improved sensitivity compared to DMSP-OLS [22]. However, DMSP-OLS remains essential for long-term reconstructions [34,36,37,38,39,53], and several studies combine both sensors to ensure temporal continuity [27,28,29,30,42]. This predominance is also influenced by the temporal scope of the reviewed literature, which largely overlaps with the operational period of VIIRS-based products. The two sensors nonetheless remain difficult to harmonize directly, owing to differences in spatial resolution, measurement units, saturation behavior, and radiometric properties, which introduce uncertainty when intercalibrating long-term NTL time series and reduce reliability in low-radiance areas [54]. At the same time, isolated applications highlight the potential of alternative high-resolution optical sensors, such as EROS-B, to capture fine-scale spatial variability in urban light pollution. For instance, Katz and Levin [47] show that EROS-B imagery, despite lacking the radiometric calibration typical of standard NTL products, can provide meaningful proxies of nighttime brightness when validated against in situ SQM measurements and particularly when accounting for different viewing geometries (upward, downward and horizontal). More broadly, no single measurement approach is universally appropriate for quantifying light pollution, and inconsistent units and terminology across studies mean that the choice of method should be matched to the specific ecological question under investigation [19]. This is compounded by persistent limitations in the spectral, spatial, temporal, and angular characterization of artificial light, underscoring the need to integrate satellite-based and ground-based observations [23]. Processing frameworks such as NASA’s Black Marble product suite attempt to address some of these issues by correcting for atmospheric, lunar, terrain, snow, and vegetation effects, as well as directional and surface-reflectance effects in VIIRS DNB observations; canopy structure and seasonal vegetation conditions are themselves an important source of this directional variability, meaning that raw radiance cannot be interpreted directly as emitted artificial light [55].
Vegetation metrics show comparable heterogeneity. NDVI is the dominant index (15 studies; see Table 1 for the complete list), either used alone or in combination with other metrics (e.g., [29,36,37,43]). It is derived from MODIS, Landsat, SPOT, and Sentinel-2 products, reflecting its strong performance across multispectral sensors and its long-term continuity in Earth observation datasets; its widespread use is also supported by its simplicity and historical consolidation within remote sensing applications [56,57]. In this context, EVI is used less frequently [32,33,34,39,42], but it is often adopted as a complementary metric within structural or composite indicators (e.g., RSEI [31], LERNCI [31,35], fractional vegetation cover [43]). EVI reduces atmospheric effects and minimizes canopy background noise, thereby improving sensitivity in high-biomass vegetation conditions [58]. Comparisons among vegetation indices derived from different sensors may nonetheless be affected by differences in spectral response functions, atmospheric correction, spatial resolution, compositing procedures, and index formulation [58,59]. As a result, NDVI–NTL integration is the most common analytical configuration, whereas EVI is primarily used in supplementary or robustness analyses. Only a small subset of studies incorporates functional vegetation dynamics [26,27,28]. Phenological metrics (e.g., start of season, leaf-out, senescence) are mainly derived from specialized datasets such as the USA National Phenology Network (CONUS) [26,28], the Pan European Phenology Project (PEP725) [27] and the MODIS MCD12Q2 dataset [28]. These studies predominantly rely on VIIRS or harmonized NTL datasets but are also the only group in which thresholding approaches are explicitly linked to the ecological interpretation of light exposure [26,27,28]. This heterogeneity not only reflects differences in data availability and sensor characteristics, but also introduces substantial variability in analytical choices, including preprocessing workflows, spatial aggregation levels, and statistical modeling approaches. As a result, observed NTL–vegetation relationships are not always directly comparable across studies, limiting the derivation of transferable quantitative estimates.

4.3. NTL as a Proxy of Urban Environmental Pressure

Across the reviewed studies, a consistent spatial pattern emerges, with the majority (i.e., 10 studies) of evidence concentrated in rapidly urbanizing Chinese cities and metropolitan regions (e.g., Beijing, Jinan, Lianyungang, Luohe). In these contexts, increases in NTL are frequently associated with vegetation decline and stronger environmental stress [30,37]. However, urbanization exerts both direct and indirect effects on vegetation, and the direction and magnitude of this response vary with climate, management practices, and socioeconomic conditions [6], a pattern consistent with evidence that the urbanization–vegetation relationship is complex, nonlinear, and dependent on development stage and regional context rather than uniformly negative [60,61]. NDVI and EVI consistently exhibit inverse relationships with NTL, particularly when coupled with climatic variables such as LST and CUHII [31,32,39,41]. These relationships are most pronounced during phases of rapid urban expansion, where vegetation loss and thermal intensification co-occur with rising radiance. At the same time, NTL represents the spatial distribution and intensity of human activity and urban development rather than a direct measurement of temperature, air pollution, or ecological degradation [21]. Therefore, nighttime remote sensing offers a useful proxy for monitoring LST, near-surface air temperature, and apparent temperature, making it particularly useful for tracking these urban environmental dynamics in UHI research. These findings show that, in rapidly urbanizing areas, increases in NTL can serve as a clear indicator of linked environmental changes, capturing the combined effects of vegetation loss (NDVI/EVI decline) and rising temperatures (LST and CUHII) driven by urban expansion. On the other hand, in studies conducted outside China, in cities such as Lagos, Dhaka, and Saudi Arabia, the same inverse NTL–vegetation pattern persists but is embedded in more complex multi-driver systems involving air pollution, precipitation variability, and ecosystem service decline. In these settings, vegetation reduction is simultaneously associated with increases in NTL, temperature, and emissions, suggesting a broader coupling between urbanization intensity and environmental degradation [29,34,35]. This suggests that NTL captures not only spatial patterns of urban expansion but also the cumulative pressure of socio-environmental stressors, with increases in radiance associated with vegetation loss, rising temperatures, and elevated pollution levels (e.g., NO2), thereby reinforcing its role as an integrated indicator of urban environmental degradation. The evidence shows that the NTL–vegetation relationship is largely indirect, mediated by climatic and atmospheric processes. Higher NTL is consistently associated with increased thermal stress (LST, UHI/CLUHII), which in turn corresponds to lower NDVI and EVI values, while parallel links exist between NTL and air pollution indicators [38]. Vegetation indices therefore act as downstream ecological responses to combined radiative, thermal, and pollution pressures. From a methodological perspective, NDVI remains the dominant vegetation remote-sensing metric [57] and primarily captures structural land-cover change, thereby consistently reinforcing the inverse relationship with NTL. EVI is less frequently used but shows greater sensitivity to canopy condition and thermal stress, particularly in urban heat-related analyses [32,39], in integrated urban indices and correction frameworks for NTL saturation [42], highlighting its potential not only as a response variable but also as a structural component in multi-source urban modeling [33]. However, its limited application constrains the assessment of functional ecosystem responses. Despite regional differences, the reviewed studies point to a broadly consistent pattern: NTL serves as an integrated proxy for urban environmental pressure, while vegetation indices reflect both structural and functional ecological decline under combined urbanization, climatic, and pollution stressors. The results therefore suggest that future work should move beyond bivariate correlations toward integrated, process-explicit frameworks that jointly model radiative, thermal, and ecological dynamics, including implications for urban planning, in order to better understand causal relationships and multi-scale urban feedbacks.

4.4. Vegetation as an Active Regulator of Artificial Light Distribution

The reviewed studies highlight that vegetation is not only a passive receptor of ALAN, but also an active structural and phenological regulator of its spatial distribution and intensity. At the structural level, higher vegetation cover is systematically associated with reduced nighttime brightness. Dense tree cover is a significant predictor of lower NTL intensity [44], whereas areas with reduced vegetation consistently exhibit stronger light pollution signals and higher radiance levels [46,47]. This inverse relationship indicates that vegetation canopy occludes and attenuates the satellite-observed radiance signal at the urban surface, an effect documented to reduce NTL magnitude at city-wide scales, particularly in temperate regions with deciduous vegetation [55]. Assessing the ecological significance of this attenuation, however, requires characterizing the intensity, spectral composition, spatial distribution, and timing of light exposure at a scale relevant to plant physiology [62]. More recent evidence further suggests that NTL variability is not only driven by static urban form factors (e.g., GDP, road density), but also by seasonal and environmental dynamics such as vegetation phenology, snow cover, and even lunar illumination, highlighting the importance of disentangling these temporal effects when interpreting radiance data from modern VIIRS products [46]. In addition, suburban studies show that vegetation density interacts with surrounding artificial light sources in shaping light pollution levels, with tree cover potentially mitigating exposure, although its management may conflict with development pressures [44]. Beyond structural effects, vegetation also influences the directional properties of ALAN. Li, J. et al. [43] show that NDVI is strongly correlated with ALAN anisotropy (r = 0.75), suggesting that vegetation density and seasonal growth regulate how artificial light is distributed across viewing angles, with vegetation growth associated with reduced anisotropic emission patterns. This highlights a clear correlation between ecological seasonality and optical characteristics of urban light environments. At the modeling level, vegetation is increasingly incorporated into radiometric correction frameworks. Li, J. et al. [45] show that accounting for vegetation phenology improves CEF estimation by reducing angular bias in VIIRS DNB observations, in which ALAN anisotropy, strongly linked to surface 3D morphology, is a key feature. This indicates that vegetation is not only an environmental driver but also a critical variable for improving the accuracy of NTL remote sensing products. By comparison, NDVI is the only consistently used metric of vegetation influence on ALAN (5 studies; see Table 2). However, its role goes beyond simple correlation, as vegetation also improves the explanatory power and calibration of NTL models, reinforcing its dual ecological and methodological function. An important step forward can be achieved by considering the three main patterns emerging from the evidence: (i) structural attenuation, whereby denser vegetation reduces light intensity; (ii) phenological regulation, in which seasonal vegetation dynamics modulate ALAN anisotropy; and (iii) methodological integration, where vegetation improves the accuracy of NTL retrieval and modeling. Integrating NTL–vegetation datasets enables more accurate identification of areas where vegetation structure and phenology significantly modulate light exposure, thereby supporting more targeted assessments of light pollution dynamics and urban ecological conditions.
These insights open the way to more informed urban planning and environmental management strategies, in which vegetation can be explicitly considered for light pollution mitigation, urban design, and ecosystem-based planning. From this perspective, integrating multi-sensor remote sensing data with ecological indicators can support adaptive, evidence-based approaches to improving urban environmental quality and enhancing the resilience of urban ecosystems under increasing anthropogenic pressure.

4.5. ALAN as an Ecological Driver, and Its Impacts on Vegetation Phenology

Studies on the relationship between ALAN and vegetation phenology show context-dependent effects, with detectable shifts in seasonal timing (both advancement and delay), consistent with broader evidence that artificial light disrupts natural cues governing the timing of biological activities across taxa [63]. The relative importance of ALAN and temperature varies among phenological phases, species, climatic contexts, and spatial scales. Temperature is generally identified as the dominant control on phenology [4], whereas emerging multi-city evidence indicates that ALAN exerts a significantly greater effect than air temperature on both spring onset and autumn senescence, suggesting that ALAN has been underestimated as a key driver of urban vegetation phenology [64]. Collectively, our sample shows that ALAN is associated with shifts in both spring and autumn phenology, often advancing spring onset and delaying autumn timing, although these effects are highly variable across regions and generally weaker than temperature-driven responses [26,28]. Remote sensing studies combining NTL imagery and satellite-derived phenology further show that these responses are spatially heterogeneous, with stronger ALAN effects in climatically moderate regions and reduced sensitivity in extreme cold or hot climates due to temperature constraints on plant development [26,28]. At finer temporal scales, higher ALAN intensity is linked to an advance in budburst of approximately 8.9 days and a delay in leaf coloration, with effects increasing with light intensity [26]. However, these responses are strongly mediated by temperature: spring phenology is primarily controlled by warming, while ALAN plays a more pronounced role in autumn phases, suggesting asymmetric seasonal sensitivity. At broader spatial scales, ALAN effects remain heterogeneous. In the United States, spring onset is earlier in about 70% of observed pixels, but with substantial regional variability and a weaker overall effect than temperature [28]. This indicates that ALAN acts as a secondary but systematic driver shaping spatial variability in phenological responses. A key finding across studies is the interaction between ALAN and climate stressors. Artificial light can partially modulate or dampen temperature-driven phenological shifts, reducing the consistency of warming-induced vegetation responses [27]. Specifically, phenological phases are delayed in 12–39% of leaf-out sites and 6–53% of flowering sites, with stronger delays and reduced advancement under higher sky brightness levels, indicating a statistically detectable inhibitory effect of ALAN on plant phenology despite the dominant role of temperature. From a methodological perspective, these results are largely based on satellite-derived radiance (VIIRS and DMSP-OLS) combined with large-scale phenology networks (e.g., USA National Phenology Network, PEP725, MODIS MCD12Q2), enabling spatially explicit analyses but introducing important constraints. First, the ecological inference is limited to a narrow set of woody, forest-dominated species (e.g., Acer, Quercus, Betula, Fagus), which may not be representative of broader plant functional types or urban vegetation assemblages. In this regard, field experiments on other species and life forms, including grassland communities and urban shrubs, similarly report shifts in flowering time, species composition, and spring physiological activity under artificial light, suggesting these effects may extend beyond the woody species considered here [65,66]. Second, ALAN exposure is derived from coarse-resolution night-time light products, which capture skyglow rather than direct plant-level illumination, potentially underestimating fine-scale heterogeneity in light exposure. Finally, the reliance on only three large-scale studies limits the generalizability of observed patterns, as regional climate regimes, species composition, and urban structure may strongly modulate ALAN–phenology relationships. The evidence suggests that ALAN should be interpreted as a secondary ecological driver that interacts with climate rather than replacing it. Its influence is most evident during seasonal transition phases and in highly illuminated urban and peri-urban areas, where it can alter vegetation timing and disrupt climate–phenology synchrony. Future work should therefore focus on clarifying the underlying mechanisms using spatially and temporally finer-scale light exposure data, improved night-time radiance models, and integrated environmental datasets, while also accounting for additional abiotic and biotic controls that may shape observed phenological variability.

4.6. Toward an Integrated Framework: Linking Urbanization, Light Dynamics, and Ecological Responses

Based on the relationships identified across the three thematic categories, we propose a scale-dependent conceptual framework in which NTL can serve as an indicator of urban intensity, vegetation structure and phenology can modify the remotely observed radiance signal, and biologically relevant ALAN exposure can influence plant and ecosystem processes. These components are interconnected but should not be treated as a single causal sequence, because satellite radiance, urban development, ecological exposure, and biological response operate at different spatial, temporal, and organizational scales. In urbanization studies (see Section 4.3), it primarily reflects structural land conversion, with a predominantly inverse relationship between NTL and vegetation indices (NDVI/EVI), particularly in rapidly expanding urban systems such as those in China. However, this relationship is also influenced by methodological differences across studies (e.g., data sources, spatial resolution, and modeling approaches) and becomes less uniform in regions where urban growth interacts with climatic extremes, pollution, and ecosystem service changes, indicating that the ecological significance of NTL capturing urban intensity varies according to both environmental context and analytical framework. When vegetation is treated as an active component of the system (see Section 4.4), the relationship becomes bidirectional rather than purely reactive. Vegetation not only responds to artificial lighting but also modulates its spatial distribution and remote sensing representation. Canopy structure and density affect light attenuation and anisotropy, while phenological variation introduces seasonal variability in observed radiance. This implies that NTL signals are partly shaped by ecological conditions and surface 3D morphology, and not solely by anthropogenic emission patterns. At the ecological level (see Section 4.5), ALAN shifts from being a structural indicator to a temporal environmental stressor. Its influence is most evident in phenological processes, where it modifies the timing of seasonal transitions. Its influence relative to temperature is phase-dependent rather than uniformly secondary, remaining systematic, spatially heterogeneous, and site-specific, particularly in highly illuminated urban and peri-urban environments. From a remote sensing perspective, NTL–vegetation relationships are often based on simplified bivariate approaches that overlook key sources of uncertainty, including differences between VIIRS and DMSP-OLS (see Section 4.2), spatial resolution mismatches, and derived phenology products. These limitations affect temporal comparability and the interpretation of fine-scale processes, while vegetation structure and phenology can also modulate radiometric signals, indicating that part of the observed variability is ecologically mediated rather than purely anthropogenic. Overall, a major gap remains the absence of integrated multi-sensor frameworks that jointly capture radiance dynamics, vegetation processes, and climate variability within a consistent analytical approach.
These interlinked patterns position ALAN alongside urbanization, land-use change, and climate change as a global-change driver in its own right [67]. This methodological gap has broader implications for NBS, which emphasize context-dependent interactions between biodiversity, climate, and ecosystem functioning [8]. Consistently, the reviewed evidence suggests that urban vegetation acts both as a receptor of environmental pressures and as a regulator of radiative and climatic processes. The bidirectional relationships among vegetation, nighttime light dynamics, and urban climate therefore reflect core NBS principles, in which ecosystem structure and biodiversity jointly shape ecosystem functions and resilience. Addressing this complexity requires multi-scale, multi-stressor research agendas that integrate biologically relevant light measurements with broader global change drivers [68], supporting the need for integrated socio-ecological approaches that consider both daytime and nighttime processes and extend the role of NBS beyond climate mitigation and adaptation toward the maintenance of ecological integrity in increasingly urbanized and illuminated environments.

4.7. Limitations and Opportunities

Despite rapid advances, evidence remains constrained by three main issues. First, the literature is geographically concentrated in China, limiting its global transferability because urban form, lighting systems, and vegetation structures vary widely across regions. This concentration should be interpreted with caution: with only 22 studies remaining after six strict eligibility criteria, the observed geographic distribution may partly reflect the selectivity of our filtering process rather than an unbiased picture of global research activity in this field. A comprehensive bibliometric characterization of geographic concentration would require a substantially larger and more inclusive corpus, which falls outside the scope of the present structured review. Second, strong methodological heterogeneity persists across NTL sensors (i.e., DMSP-OLS vs. VIIRS), vegetation indices, and threshold choices, with no standardized framework for ALAN quantification, reflecting a broader absence of a single measurement approach capable of meeting all objectives in light pollution research [19], compounded by known cross-sensor inconsistencies requiring harmonization [54]. Third, most studies focus on NDVI-based structural metrics, while phenology and biodiversity responses remain underexplored, limiting ecological interpretation. The same gap is present in climate-driven phenology research, where the underlying mechanisms remain poorly resolved, multi-driver interactions complicate prediction, and quantifying the resulting feedbacks to ecosystem carbon cycles remains genuinely difficult [4]. In addition, ALAN is still rarely integrated as a primary explanatory variable in ecological or phenological models, which continue to prioritize climate drivers, particularly temperature, reducing the ability to isolate its independent effects. From a review design perspective, this study is also subject to limitations related to data collection and screening. For instance, keyword-based retrieval may have introduced selection bias by excluding relevant studies that use alternative terminology. Moreover, the screening process was conducted manually by the first author and subsequently discussed with all co-authors to reach consensus, which, while allowing for contextual interpretation, may introduce subjectivity and reduce reproducibility, as it was not independently cross-validated by multiple raters. Furthermore, the relatively small and heterogeneous sample (22 studies), combined with variation in spatial scale, sensors, and vegetation metrics, limits comparability and broader generalization. These limitations highlight a clear methodological transition point for remote sensing of urban ecosystems. The growing availability of VIIRS, Black Marble, and new sensors such as Luojia-1 and SDGSAT-1 enables finer-scale monitoring of artificial light, but their potential is constrained by the lack of harmonized multi-sensor calibration frameworks.
Future progress requires moving beyond NDVI-only approaches toward integrated vegetation metrics that capture structure and function, alongside consistent time-series designs rather than static analyses. Expanding studies beyond China is essential to improve external validity, as is the explicit coupling of ALAN with climate and socio-economic drivers within unified analytical models. Evidence already shows that incorporating vegetation phenology improves NTL model performance and reduces error, reinforcing the value of coupled ecological–remote sensing frameworks. Overall, NTL should be treated not only as an urban proxy but as an interacting environmental variable within urban climate–vegetation systems, requiring interdisciplinary approaches that link remote sensing, ecology, and urban science. Moreover, the transboundary nature of artificial light at night, which can extend far beyond its sources [11], represents both a methodological challenge and an opportunity, as it limits local-scale interpretations while supporting the use of NTL data to quantify ALAN propagation across ecological and administrative boundaries in multi-scale frameworks, in line with calls for dark-infrastructure planning that explicitly considers nocturnal connectivity at the landscape scale [69].

5. Conclusions

Over the past decade, the evidence consistently shows that combining NTL with vegetation metrics is essential to understanding the ecological consequences of urbanization. First, NTL is a robust proxy for urban expansion and socio-environmental pressure, showing a consistent inverse relationship with vegetation greenness. Across highly heterogeneous study areas—from local urban contexts (e.g., Lianyungang, Changsha, Jinan, Beijing), to broader scale analyses (China, Saudi Arabia, Europe, CONUS), and global multi-city datasets,—NDVI generally declines with increasing radiance, reflecting structural land transformation and cumulative environmental stress, particularly in rapidly urbanizing regions. Second, vegetation is not only a passive indicator but an active regulator of urban light environments. Canopy structure reduces light propagation, while vegetation phenology modulates seasonal and temporal variability in observed radiance, indicating that part of the NTL signal is ecologically mediated rather than purely anthropogenic. Third, NTL-based estimates of ALAN reveal measurable ecological effects, particularly on plant phenology, as it modifies seasonal timing by advancing spring and delaying autumn. These responses are context-dependent and interact with temperature and vegetation structure, indicating a multi-driver system rather than a single causal pathway. Fourth, NTL patterns are strongly shaped by urban morphology, socio-economic activity, and lighting practices, indicating that light pollution is embedded within broader urban systems. Importantly, artificial light is not a single phenomenon: it includes multiple components such as direct emissions, skyglow, glare, and light trespass, each with different ecological and observational implications. Remote sensing products primarily capture upward radiance or skyglow proxies, which do not necessarily reflect actual organism-level light exposure. Nighttime light remote sensing is still evolving toward a more quantitative and process-based discipline. Compared with daytime optical and microwave remote sensing, it remains constrained by a limited understanding of light propagation mechanisms from source to atmosphere to sensor. Although VIIRS has significantly improved radiometric consistency and calibration, there is still a need for improved physically based and process-explicit models. From a measurement perspective, the light field is intrinsically complex and multi-dimensional, varying with angle, spectrum, atmosphere, and surface properties. Current satellite systems (e.g., VIIRS DNB) provide global coverage but are limited by coarse spatial resolution, single spectral bands, angular effects, and sensitivity constraints to blue light. Moreover, vegetation, clouds, snow cover, and aerosols can significantly alter observed radiance, introducing non-anthropogenic variability into NTL signals [70]. Despite these constraints, integrating NTL with vegetation structure, phenology, and climate variables provides a more comprehensive framework for assessing urban environmental change across scales although current approaches remain limited by sensor heterogeneity, NDVI-centric methodologies, and the lack of standardized ALAN modeling frameworks. Future progress depends on explicitly treating ALAN as an independent ecological driver within coupled urban climate–vegetation systems, supported by multi-sensor integration and finer-scale radiance exposure data. Urban vegetation, as a multifunctional NBS, can further mitigate nocturnal light exposure while simultaneously contributing to thermal regulation and biodiversity conservation. In this context, NTL data can provide actionable information for urban planning decisions and help identify priority areas for interventions in nighttime environments, such as dark infrastructures, aimed at preserving nocturnal habitat connectivity, in relation to identified green/blue infrastructure [69]. From a broader perspective, the diversity of reviewed spatial scales and study areas highlights both the strength and limitations of existing evidence: while general patterns are increasingly consistent, context dependency remains strong. This raises important questions for future integration with governance and planning frameworks, including emerging discussions in environmental law and international urban sustainability policy, where light pollution is increasingly considered alongside other transboundary environmental pressures [71]. Such integration is essential to better quantify actual light exposure and monitoring technologies, disentangle anthropogenic and ecological signals, and reposition ALAN as a key driver within urban socio-ecological systems. This perspective enables the integration of NTL models, ALAN and light pollution mitigation into spatial planning and governance frameworks, supporting the development of light-sensitive urban strategies for regulation, green infrastructure design, biodiversity conservation, and climate adaptation.

Author Contributions

Conceptualization, C.B., S.F. and G.C.; methodology, C.B., S.C. and S.F.; investigation, S.C. and C.B.; writing—original draft preparation, S.C.; writing—review and editing, S.C., C.B., E.V., S.F., G.D.L., S.M. and G.C.; supervision, G.C. All authors have read and agreed to the published version of the manuscript.

Funding

This research received no external funding.

Institutional Review Board Statement

Not applicable.

Informed Consent Statement

Not applicable.

Data Availability Statement

These data were derived from the following resources available in the public domain: www.scopus.com (last accessed on 31 July 2026) and www.webofscience.com (last accessed on 31 July 2026).

Acknowledgments

This study was partially supported by the following projects: FORWARDS. H2020 project funded by the European Commission, number 101084481 call HORIZON-CL6-2022-CLIMATE-01-05. NextGenCarbon. H2020 project funded by the European Commission, number 101184989 call HORIZON-CL5-2024-D1-01-07; SUPERB. H2020 project funded by the European Commission, number 101036849 call LC-GD-7-1-2020; Space It Up! project funded by the Italian Space Agency, ASI, and the Ministry of University and Research, MUR, under contract n. 2024-5-E.0—CUP n. I53D24000060005.

Conflicts of Interest

The authors declare no conflicts of interest.

References

  1. Zhuang, Q.; Shao, Z.; Li, D.; Huang, X.; Li, Y.; Altan, O.; Wu, S. Impact of Global Urban Expansion on the Terrestrial Vegetation Carbon Sequestration Capacity. Sci. Total Environ. 2023, 879, 163074. [Google Scholar] [CrossRef] [PubMed]
  2. Borghi, C.; Francini, S.; Chiesi, L.; Mancuso, S.; Tupikina, L.; Caldarelli, G.; Moi, J.; Vangi, E.; D’Amico, G.; De Luca, G.; et al. Integrating Earth Observation and Graph Theory to Evaluate Urban Green Spaces Connectivity Across European Capitals. Landsc. Ecol. 2026. [Google Scholar] [CrossRef]
  3. Francini, S.; Chirici, G.; Chiesi, L.; Costa, P.; Caldarelli, G.; Mancuso, S. Global Spatial Assessment of Potential for New Peri-Urban Forests to Combat Climate Change. Nat. Cities 2024, 1, 286–294. [Google Scholar] [CrossRef]
  4. Piao, S.; Liu, Q.; Chen, A.; Janssens, I.A.; Fu, Y.; Dai, J.; Liu, L.; Lian, X.; Shen, M.; Zhu, X. Plant Phenology and Global Climate Change: Current Progresses and Challenges. Glob. Change Biol. 2019, 25, 1922–1940. [Google Scholar] [CrossRef] [PubMed]
  5. Chen, X.; Zhang, Y. The Impact of Vegetation Phenology Changes on the Relationship between Climate and Net Primary Productivity in Yunnan, China, under Global Warming. Front. Plant Sci. 2023, 14, 1248482. [Google Scholar] [CrossRef] [PubMed]
  6. Zhang, L.; Yang, L.; Zohner, C.M.; Crowther, T.W.; Li, M.; Shen, F.; Guo, M.; Qin, J.; Yao, L.; Zhou, C. Direct and Indirect Impacts of Urbanization on Vegetation Growth across the World’s Cities. Sci. Adv. 2022, 8, abo0095. [Google Scholar] [CrossRef] [PubMed]
  7. Anderson, S.J.; Kubiszewski, I.; Sutton, P.C. The Ecological Economics of Light Pollution: Impacts on Ecosystem Service Value. Remote Sens. 2024, 16, 2591. [Google Scholar] [CrossRef]
  8. Ghaedi, Z.; Santos, C.; Monteiro, C. Nature-Based Solutions, Climate Change, and Biodiversity: A Systematic Review of Opportunities and Risks. Nat.-Based Solut. 2026, 9, 100302. [Google Scholar] [CrossRef]
  9. Yakushina, Y. The Endangered Night: The Challenge of Light Pollution within the International Environmental Legal Context. J. Environ. Law 2025, 37, 467–491. [Google Scholar] [CrossRef]
  10. Gaston, K.J.; Ackermann, S.; Bennie, J.; Cox, D.T.C.; Phillips, B.B.; Sánchez de Miguel, A.; Sanders, D. Pervasiveness of Biological Impacts of Artificial Light at Night. Integr. Comp. Biol. 2021, 61, 1098–1110. [Google Scholar] [CrossRef] [PubMed]
  11. Bará, S.; Lima, R.C. Photons without Borders: Quantifying Light Pollution Transfer between Territories. Int. J. Sustain. Light. 2018, 20, 51–61. [Google Scholar] [CrossRef]
  12. Friulla, L.; Varone, L. Artificial Light at Night (ALAN) as an Emerging Urban Stressor for Tree Phenology and Physiology: A Review. Urban Sci. 2025, 9, 14. [Google Scholar] [CrossRef]
  13. Lo Piccolo, E.; Lauria, G.; Guidi, L.; Remorini, D.; Massai, R.; Landi, M. Shedding Light on the Effects of LED Streetlamps on Trees in Urban Areas: Friends or Foes? Sci. Total Environ. 2023, 865, 161200. [Google Scholar] [CrossRef] [PubMed]
  14. Wei, Y.; Li, Z.; Zhang, J.; Hu, D. Effects of Artificial Light at Night and Drought on the Photosynthesis and Physiological Traits of Two Urban Plants. Front. Plant Sci. 2023, 14, 1263795. [Google Scholar] [CrossRef] [PubMed]
  15. Bará, S.; Falchi, F. Artificial Light at Night: A Global Disruptor of the Night-Time Environment. Philos. Trans. R. Soc. B Biol. Sci. 2023, 378, 20220352. [Google Scholar] [CrossRef] [PubMed]
  16. Knop, E.; Zoller, L.; Ryser, R.; Gerpe, C.; Hörler, M.; Fontaine, C. Artificial Light at Night as a New Threat to Pollination. Nature 2017, 548, 206–209. [Google Scholar] [CrossRef] [PubMed]
  17. Gaston, K.J.; Sánchez de Miguel, A. Environmental Impacts of Artificial Light at Night. Annu. Rev. Environ. Resour. 2022, 47, 373–398. [Google Scholar] [CrossRef]
  18. Jimenez, R.B.; Lane, K.J.; Hutyra, L.R.; Fabian, M.P. Spatial Resolution of Normalized Difference Vegetation Index and Greenness Exposure Misclassification in an Urban Cohort. J. Expo. Sci. Environ. Epidemiol. 2022, 32, 213–222. [Google Scholar] [CrossRef] [PubMed]
  19. Mander, S.; Alam, F.; Lovreglio, R.; Ooi, M. How to Measure Light Pollution—A Systematic Review of Methods and Applications. Sustain. Cities Soc. 2023, 92, 104465. [Google Scholar] [CrossRef]
  20. Noor, N.M.; Azmi, N.I.; Mohd Din, S.A. Bibliometric Analysis of Evolution of Night-Time Light Data in Urban Planning Studies. J. Umm Al-Qura Univ. Eng. Archit. 2025, 16, 854–868. [Google Scholar] [CrossRef]
  21. Zheng, Q.; Seto, K.C.; Zhou, Y.; You, S.; Weng, Q. Nighttime Light Remote Sensing for Urban Applications: Progress, Challenges, and Prospects. ISPRS J. Photogramm. Remote Sens. 2023, 202, 125–141. [Google Scholar] [CrossRef]
  22. Zhao, M.; Zhou, Y.; Li, X.; Cao, W.; He, C.; Yu, B.; Li, X.; Elvidge, C.D.; Cheng, W.; Zhou, C. Applications of Satellite Remote Sensing of Nighttime Light Observations: Advances, Challenges, and Perspectives. Remote Sens. 2019, 11, 1971. [Google Scholar] [CrossRef]
  23. Levin, N. Challenges in Remote Sensing of Night Lights—A Research Agenda for the next Decade. Remote Sens. Environ. 2025, 328, 114869. [Google Scholar] [CrossRef]
  24. Liu, Z.; Zhou, Y.; Feng, Z. Response of Vegetation Phenology to Urbanization in Urban Agglomeration Areas: A Dynamic Urban–Rural Gradient Perspective. Sci. Total Environ. 2023, 864, 161109. [Google Scholar] [CrossRef] [PubMed]
  25. Zhou, R.; Wen, G.; Li, H.; Zhu, S.; Li, Y.; Wang, X. Evolution of Vegetation Phenology Research under Climate Change: A Comprehensive Bibliometric Study. Front. For. Glob. Change 2025, 8, 1688384. [Google Scholar] [CrossRef]
  26. Meng, L.; Zhou, Y.; Román, M.O.; Stokes, E.C.; Wang, Z.; Asrar, G.R.; Mao, J.; Richardson, A.D.; Gu, L.; Wang, Y. Artificial Light at Night: An Underappreciated Effect on Phenology of Deciduous Woody Plants. PNAS Nexus 2022, 1, pgac046. [Google Scholar] [CrossRef] [PubMed]
  27. Lian, X.; Jiao, L.; Zhong, J.; Jia, Q.; Liu, J.; Liu, Z. Artificial Light Pollution Inhibits Plant Phenology Advance Induced by Climate Warming. Environ. Pollut. 2021, 291, 118110. [Google Scholar] [CrossRef] [PubMed]
  28. Zheng, Q.; Teo, H.C.; Koh, L.P. Artificial Light at Night Advances Spring Phenology in the United States. Remote Sens. 2021, 13, 399. [Google Scholar] [CrossRef]
  29. Gilbert, K.M.; Shi, Y. Nighttime Lights and Urban Expansion: Illuminating the Correlation between Built-Up Areas of Lagos City and Changes in Climate Parameters. Buildings 2023, 13, 2999. [Google Scholar] [CrossRef]
  30. Li, X.; He, H.; Wang, D.; Sun, Y.; Qin, Y.; Wang, K.; Han, Y.; Tang, J.; Qiao, W. Spatiotemporal Dynamics of the Normalized Difference Vegetation Index and Its Multidimensional Drivers in a Rapidly Urbanizing Coastal City: A Case Study of Lianyungang, China (2000–2023). Ecol. Inform. 2025, 91, 103397. [Google Scholar] [CrossRef]
  31. Tan, J.; Wei, Q.-J.; Liao, Z.-Y.; Kuang, W.-J.; Deng, H.-T.; Yu, D. Relationship between Urban Form and Surface Temperature Based on XGBoost SHAP Interpretable Machine Learning Model. Ying Yong Sheng Tai Xue Bao = J. Appl. Ecol. 2025, 36, 659–670. [Google Scholar] [CrossRef] [PubMed]
  32. Li, Y.; Feng, Z.; Ma, C.; Yang, T.; Qiao, F.; Kang, P.; Sun, Y.; Wang, L. Intra-Annual Variations and Determinants of Canopy Layer Urban Heat Island in China Using Remotely Sensed Air Temperature and Apparent Temperature. Ecol. Indic. 2024, 166, 112512. [Google Scholar] [CrossRef]
  33. Wang, X.; Bai, T.; Yang, Y.; Wang, G.; Tian, G.; Kollányi, L. A Multi-Scenario Analysis of Urban Vitality Driven by Socio-Ecological Land Functions in Luohe, China. Land 2024, 13, 1330. [Google Scholar] [CrossRef]
  34. Almulhim, A.I.; Al Kafy, A.; Ferdous, M.N.; Fattah, M.A.; Morshed, S.R. Harnessing Urban Analytics and Machine Learning for Sustainable Urban Development: A Multidimensional Framework for Modeling Environmental Impacts of Urbanization in Saudi Arabia. J. Environ. Manag. 2024, 357, 120705. [Google Scholar] [CrossRef] [PubMed]
  35. Alamgir Hossen Bhuiyan, M.; Inostroza, L.; Nihei, T.; Sultana, M.; Louw, A.S.; Supe, H.; Chen, X.; Alsulamy, S.; Avtar, R. The Differential Impacts of the Spatiotemporal Vertical and Horizontal Expansion of Megacity Dhaka on Ecosystem Services. Curr. Res. Environ. Sustain. 2024, 7, 100252. [Google Scholar] [CrossRef]
  36. Wang, N.; Du, Y.; Liang, F.; Wang, H.; Yi, J. The Spatiotemporal Response of China’s Vegetation Greenness to Human Socio-Economic Activities. J. Environ. Manag. 2022, 305, 114304. [Google Scholar] [CrossRef] [PubMed]
  37. Zhang, Y.; Zhao, L.; Zhao, H.; Gao, X. Urban Development Trend Analysis and Spatial Simulation Based on Time Series Remote Sensing Data: A Case Study of Jinan, China. PLoS ONE 2021, 16, e0257776. [Google Scholar] [CrossRef] [PubMed]
  38. Cui, Y.; Jiang, L.; Zhang, W.; Bao, H.; Geng, B.; He, Q.; Zhang, L.; Streets, D.G. Evaluation of China’s Environmental Pressures Based on Satellite NO2 Observation and the Extended STIRPAT Model. Int. J. Environ. Res. Public Health 2019, 16, 1487. [Google Scholar] [CrossRef] [PubMed]
  39. Li, L.; Zha, Y. Satellite-Based Spatiotemporal Trends of Canopy Urban Heat Islands and Associated Drivers in China’s 32 Major Cities. Remote Sens. 2019, 11, 102. [Google Scholar] [CrossRef]
  40. Han, X.; Huang, X.; Liang, H.; Ma, S.; Gong, J. Analysis of the Relationships between Environmental Noise and Urban Morphology. Environ. Pollut. 2018, 233, 755–763. [Google Scholar] [CrossRef] [PubMed]
  41. Chen, W.; Zhang, Y.; Pengwang, C.; Gao, W. Evaluation of Urbanization Dynamics and Its Impacts on Surface Heat Islands: A Case Study of Beijing, China. Remote Sens. 2017, 9, 453. [Google Scholar] [CrossRef]
  42. Liu, Y.; Yang, Y.; Jing, W.; Yao, L.; Yue, X.; Zhao, X. A New Urban Index for Expressing Inner-City Patterns Based on MODIS LST and EVI Regulated DMSP/OLS NTL. Remote Sens. 2017, 9, 777. [Google Scholar] [CrossRef]
  43. Li, J.; Li, X.; Li, D. Impact of Vegetation Phenology on Anisotropy of Artificial Light at Night—Evidence from Multi-Angle Satellite Observations. Remote Sens. Environ. 2025, 317, 114525. [Google Scholar] [CrossRef]
  44. Sung, C.Y.; Kim, Y.-J. Tree Removal Regulation Mitigates Light Pollution in Suburban Communities. J. Environ. Plan. Manag. 2025, 68, 2479–2493. [Google Scholar] [CrossRef]
  45. Li, J.; Lu, L.; Li, X. Estimating City Emission Function with VIIRS/DNB Data and Vegetation Phenology. IEEE J. Sel. Top. Appl. Earth Obs. Remote Sens. 2025, 18, 24331–24341. [Google Scholar] [CrossRef]
  46. Levin, N.; Zhang, Q. A Global Analysis of Factors Controlling VIIRS Nighttime Light Levels from Densely Populated Areas. Remote Sens. Environ. 2017, 190, 366–382. [Google Scholar] [CrossRef]
  47. Katz, Y.; Levin, N. Quantifying Urban Light Pollution—A Comparison between Field Measurements and EROS-B Imagery. Remote Sens. Environ. 2016, 177, 65–77. [Google Scholar] [CrossRef]
  48. Dong, B.; Zhang, R.; Li, S.; Ye, Y.; Huang, C. A Meta-Analysis for the Nighttime Light Remote Sensing Data Applied in Urban Research: Key Topics, Hotspot Study Areas and New Trends. Sci. Remote Sens. 2025, 11, 100186. [Google Scholar] [CrossRef]
  49. Withanage, N.C. Application of the Nighttime Light Remote Sensing Data for Urban Mapping in China During 2010–2022: A Comprehensive Review. J. Geospat. Surv. 2025, 5, 29–36. [Google Scholar] [CrossRef]
  50. Nurkin, T.; Le Miere, C.; Eusebi, C.; Rodriguez, S.; Almaala, H.; Gonzales, A.; Wasser, B. China’s Remote Sensing; U.S.-China Economic and Security Review Commission: Washington, DC, USA, 2024.
  51. Lin, Y.; He, X. Integrating Climate Change into Environmental Impact Assessment: China’s Pilot Policy and Practice. Clim. Law 2026, 1, 1–32. [Google Scholar] [CrossRef]
  52. Wei, C. NPC 2026: A First Look at China’s New Environmental Code. NPC Observer, 12 March 2026; pp. 1–9.
  53. Chen, Z.; Yu, B.; Song, W.; Liu, H.; Wu, Q.; Shi, K.; Wu, J. A New Approach for Detecting Urban Centers and Their Spatial Structure with Nighttime Light Remote Sensing. IEEE Trans. Geosci. Remote Sens. 2017, 55, 6305–6319. [Google Scholar] [CrossRef]
  54. Li, X.; Zhou, Y.; Zhao, M.; Zhao, X. A Harmonized Global Nighttime Light Dataset 1992–2018. Sci. Data 2020, 7, 168. [Google Scholar] [CrossRef] [PubMed]
  55. Román, M.O.; Wang, Z.; Sun, Q.; Kalb, V.; Miller, S.D.; Molthan, A.; Schultz, L.; Bell, J.; Stokes, E.C.; Pandey, B.; et al. NASA’s Black Marble Nighttime Lights Product Suite. Remote Sens. Environ. 2018, 210, 113–143. [Google Scholar] [CrossRef]
  56. Pettorelli, N.; Vik, J.O.; Mysterud, A.; Gaillard, J.-M.; Tucker, C.J.; Stenseth, N.C. Using the Satellite-Derived NDVI to Assess Ecological Responses to Environmental Change. Trends Ecol. Evol. 2005, 20, 503–510. [Google Scholar] [CrossRef] [PubMed]
  57. Xu, Y.; Yang, Y.; Chen, X.; Liu, Y. Bibliometric Analysis of Global NDVI Research Trends from 1985 to 2021. Remote Sens. 2022, 14, 3967. [Google Scholar] [CrossRef]
  58. Huete, A.; Didan, K.; Miura, T.; Rodriguez, E.; Gao, X.; Ferreira, L. Overview of the Radiometric and Biophysical Performance of the MODIS Vegetation Indices. Remote Sens. Environ. 2002, 83, 195–213. [Google Scholar] [CrossRef]
  59. Jiang, Z.; Huete, A.R.; Didan, K.; Miura, T. Development of a Two-Band Enhanced Vegetation Index without a Blue Band. Remote Sens. Environ. 2008, 112, 3833–3845. [Google Scholar] [CrossRef]
  60. Liu, Y.; Wang, Y.; Peng, J.; Du, Y.; Liu, X.; Li, S.; Zhang, D. Correlations between Urbanization and Vegetation Degradation across the World’s Metropolises Using DMSP/OLS Nighttime Light Data. Remote Sens. 2015, 7, 2067–2088. [Google Scholar] [CrossRef]
  61. Deng, P.; Hu, Q.; Wang, Y.; Lv, S.; Zhang, D. Use of the DMSP-OLS Nighttime Light Data to Study Urbanization and Its Influence on NDVI in Taihu Basin, China. J. Urban Plan. Dev. 2016, 142, 04016018. [Google Scholar] [CrossRef]
  62. Bennie, J.; Davies, T.W.; Cruse, D.; Gaston, K.J. Ecological Effects of Artificial Light at Night on Wild Plants. J. Ecol. 2016, 104, 611–620. [Google Scholar] [CrossRef]
  63. Gaston, K.J.; Davies, T.W.; Nedelec, S.L.; Holt, L.A. Impacts of Artificial Light at Night on Biological Timings. Annu. Rev. Ecol. Evol. Syst. 2017, 48, 49–68. [Google Scholar] [CrossRef]
  64. Wang, L.; Meng, L.; Richardson, A.D.; Hölker, F.; Li, H.; Mao, J.; Longcore, T.; Xia, J.; She, D. Artificial Light at Night Outweighs Temperature in Lengthening Urban Growing Seasons. Nat. Cities 2025, 2, 506–517. [Google Scholar] [CrossRef]
  65. Bennie, J.; Davies, T.W.; Cruse, D.; Bell, F.; Gaston, K.J. Artificial Light at Night Alters Grassland Vegetation Species Composition and Phenology. J. Appl. Ecol. 2018, 55, 442–450. [Google Scholar] [CrossRef]
  66. Czaja, M.; Kołton, A. How Light Pollution Can Affect Spring Development of Urban Trees and Shrubs. Urban For. Urban Green. 2022, 77, 127753. [Google Scholar] [CrossRef]
  67. Davies, T.W.; Smyth, T. Why Artificial Light at Night Should Be a Focus for Global Change Research in the 21st Century. Glob. Change Biol. 2018, 24, 872–882. [Google Scholar] [CrossRef] [PubMed]
  68. Hölker, F.; Bolliger, J.; Davies, T.W.; Giavi, S.; Jechow, A.; Kalinkat, G.; Longcore, T.; Spoelstra, K.; Tidau, S.; Visser, M.E.; et al. 11 Pressing Research Questions on How Light Pollution Affects Biodiversity. Front. Ecol. Evol. 2021, 9, 767177. [Google Scholar] [CrossRef]
  69. Sordello, R.; Busson, S.; Cornuau, J.H.; Deverchère, P.; Faure, B.; Guetté, A.; Hölker, F.; Kerbiriou, C.; Lengagne, T.; le Viol, I.; et al. A Plea for a Worldwide Development of Dark Infrastructure for Biodiversity—Practical Examples and Ways to Go Forward. Landsc. Urban Plan. 2022, 219, 104332. [Google Scholar] [CrossRef]
  70. Levin, N.; Kyba, C.C.M.; Zhang, Q.; Sánchez de Miguel, A.; Román, M.O.; Li, X.; Portnov, B.A.; Molthan, A.L.; Jechow, A.; Miller, S.D.; et al. Remote Sensing of Night Lights: A Review and an Outlook for the Future. Remote Sens. Environ. 2020, 237, 111443. [Google Scholar] [CrossRef]
  71. Yakushina, Y.; Klenke, R.; Fletcher, D.; Jones, L.; Amaral Nascimento, A.T.; Teixeira, C.; Lima Rodrigues Goulart, V.D.; Maggi, E.; Hölker, F.; Barnett, C.; et al. Restoring the Night: A Policy Agenda for Light Pollution Mitigation in Europe; Zenodo: Geneva, Switzerland, 2025. [Google Scholar]
Figure 1. Study selection flow diagram, where selection steps are reported in blue (i.e., identification, screening and inclusion) and sources in orange (i.e., identification via database or via other sources). First, the Scopus search identified 121 records, of which 82 remained after the application of publication filters. Following eligibility assessment, 63 studies were excluded and 19 were included. The supplementary Web of Science search identified 73 records, of which 9 were removed before screening; among the remaining 64 records, 44 overlapped with the Scopus search and 20 unique records were assessed against the same eligibility criteria, with no additional studies included. Three further studies addressing the ecological effects of artificial light at night on plant phenology were identified through citation-based literature searching. Overall, 22 studies were included in the review.
Sustainability 18 07998 g001
Figure 2. Main geographic Area of Interest (AOI, see Table 1, Table 2 and Table 3) investigated in the considered papers, grouped by thematic category: Lights Track Urbanization (LTU), Vegetation Modulates Light (VML), and ALAN Shapes Ecology (ASE).
Sustainability 18 07998 g002
Figure 3. Evolution of nighttime lights (NTL) satellite sensors utilized across peer-reviewed studies from 2014 to 2025, stratified by thematic category (see Table 1, Table 2 and Table 3): Lights Track Urbanization (LTU), Vegetation Modulates Light (VML), and ALAN Shapes Ecology (ASE).
Sustainability 18 07998 g003
Figure 4. Distribution of specific vegetation indices and traits identified in the literature, stratified by thematic category (see Table 1, Table 2 and Table 3): Lights Track Urbanization (LTU), Vegetation Modulates Light (VML), and ALAN Shapes Ecology (ASE).
Sustainability 18 07998 g004
Table 1. Summary of the studies in the Lights Track Urbanization (LTU) category, integrating NTL satellite data and vegetation indicators as proxies of urbanization and anthropogenic pressure. Studies are ordered by publication year in descending chronological order. The table reports the bibliographic reference (Ref), publication year (Year), area of interest (AOI), type of NTL satellite-based dataset, data source, temporal coverage (NTL period), radiance or pixel-selection thresholds applied to NTL data (Threshold), vegetation indices and traits used, vegetation dataset source, vegetation-related variables, and vegetation species considered (where applicable). Abbreviations: NTL (Nighttime Lights), DMSP-OLS (Defense Meteorological Satellite Program Operational Linescan System), VIIRS DNB (Visible Infrared Imaging Radiometer Suite Day/Night Band), NDVI (Normalized Difference Vegetation Index), EVI (Enhanced Vegetation Index), HNDVI (Harmonized Normalized Difference Vegetation Index), RSEI (Remote Sensing Ecological Index), LERNCI (Corrected Night Lights Index), EOG (Earth Observation Group), NOAA (National Oceanic and Atmospheric Administration), MODIS (Moderate Resolution Imaging Spectroradiometer), PLAND (Percentage of Landscape), LPI (Largest Patch Index), MPS (Mean Patch Size). Among the 22 reviewed studies, most examined NTL as a proxy for urbanization and anthropogenic pressure on vegetation and urban ecosystems (Table 1). Several studies report that NTL intensity has increased over the past two decades in association with urban expansion, population growth, and economic development, while vegetation has declined due to the expansion of built-up areas [29].
Lights Track Urbanization—LTU
RefYearAOINTL Satellite Based DataNTL SourceNTL PeriodThreshold (NTL)Vegetation Indices and TraitsVegetation Dataset SourceVegetation VariablesVegetation Species
[30]2025Lianyungang (urban area, China)DMSP-OLS, VIIRS DNB (DMSP-OLS-like-data)Harmonized DMSP-OLS-like data (1992–2024) China2000–2023/NDVIChina regional 250 m fractional vegetation covervegetation cover, growth and dynamics/
[31]2025Changsha (urban area, China)multi-source remote sensing data/2020/NDVI/vegetation cover/
[32]2024Chinese urban agglomerations (917 regions, national scale)VIIRS DNBEarth Observation Group 2016/EVIMODIS MOD13A3.006vegetation greenness and density /
[33]2024Luohe City (urban area, China)VIIRS DNB/2023/NDVI/EVI (RSEI, LERNCI)/vegetation cover and density/
[34]2024Saudi Arabia (national scale)DMSP-OLSNOAA, Earth Observation Group 1992–2022/EVI/vegetation cover and health/
[35]2024Dhaka (urban area, Bangladesh)VIIRS DNBEarth Observation Group 2021/NDVI/vegetation cover/
[29]2023Lagos City (urban area, Nigeria)DMSP-OLS, VIIRS DNBNOAA2000, 2010, 2020/NDVIMODIS/Terra Vegetation Indices 16-Day L3 Global 250 m.vegetation cover, dynamics and health /
[36]2022Major Chinese urban agglomerations (7 regions, China)DMSP-OLS, VIIRS DNBNOAA1998–2018NTLI value greater than 0 for at least three consecutive years from 1998 to 2018HNDVISPOT/VEGETATION NDVI from Resources and Environmental Science Data Center of the Chinese Academy of Sciences vegetation greenness/
[37]2021Jinan region (urban area, China)DMSP-OLSNOAA2000–2015/NDVISPOT/VEGETATION NDVI from Resources and Environmental Science Data Center of the Chinese Academy of Sciences vegetation cover/
[38]2019Prefectural cities (China, national urban dataset)DMSP-OLS/2005–2012/NDVIMODIS Version 5 NDVI Level 3 monthly product vegetation cover/
[39]2019Major Chinese cities (32 cities, national urban sample)DMSP-OLSNOAA2009/EVIMODIS MOD13A3vegetation cover and activity/
[40]2018Shenzhen metropolitan region (China)VIIRS DNB/2015/landscape metrics
PLAND
LPI
MPS
Map World China vegetation cover /
[41]2017Beijing (urban area, China)DMSP-OLSNOAA1992–2013/NDVILandsat 5 TMvegetation cover/
[42]2017Major global cities + intra-urban sites (multi-scale)DMSP-OLS, VIIRS DNBNOAA, EOG2013/NDVI/EVI (LERNCI)MODIS
MOD13A3
MOD11A2
vegetation cover /
Table 2. Summary of the studies in the Vegetation Modulates Light (VML) category, examining the role of vegetation structure and phenology in modulating artificial light propagation and urban light pollution patterns. Studies are ordered by publication year in descending chronological order. The table reports the bibliographic reference (Ref), publication year (Year), area of interest (AOI), type of NTL satellite-based dataset, data source, temporal coverage (NTL period), radiance or pixel-selection thresholds applied to NTL data (Threshold), vegetation indices and traits used, vegetation dataset source, vegetation-related variables, and vegetation species considered (where applicable). Abbreviations: NTL (Nighttime Lights), VIIRS DNB (Visible Infrared Imaging Radiometer Suite Day/Night Band), NDVI (Normalized Difference Vegetation Index), EOG (Earth Observation Group), NOAA (National Oceanic and Atmospheric Administration).
Vegetation Modulates Light—VML
RefYearAOINTL Satellite Based DataNTL SourceNTL PeriodThreshold (NTL)Vegetation Indices and TraitsVegetation Dataset SourceVegetation VariablesVegetation Species
[43]2025Major North American cities (multi-city USA/Canada)VIIRS DNBNASA Black Marble2016–2018/NDVIVIIRS VNP13A1 vegetation phenology, growthurban trees (mixed)
[44]2025Houston ETJ suburban communities (USA)VIIRS DNB/2020–2023Average monthly light intensity of pixels within 10 km buffer observed by VIIRS DNB (nW m−2 sr−1)NDVISentinel-2 Level 2 A images vegetation cover and density/
[45]2025Major North American cities (multi-city USA/Canada)VIIRS DNBNASA Black Marble, Earth Observation Group 2016–2018/NDVIVIIRS VNP13A1vegetation phenology/
[46]2017Global cities (multi-continental dataset)VIIRS DNBNOAA2014radiance classes: calculating the percent lit area of each city above the following light levels: 2, 5, 10, 25, 50, 100 and 250 nW/(cm2 ∗ sr)NDVIVersion 6 of the MODIS MOD13C2 vegetation cover/
[47]2016Jerusalem (urban area + green spaces, Israel)EROS-B, VIIRS DNB, ISS; in ground SQMEROS ImageSat, NOAA,2014SQM 24 magSQM arcsec− 2 Almost complete darkness
Percent lit area in the EROS-B and ISS images, as a function of threshold DN values
EROS-B image (DN > 1000, 2000, 4000) ISS image (DN > 15, 30 and 50)
NDVILandsat 8 imagevegetation cover/
Table 3. Summary of the studies in the ALAN Shapes Ecology (ASE) category, addressing the influence of artificial light at night on plant phenology and biodiversity. Studies are ordered by publication year in descending chronological order. The table reports the bibliographic reference (Ref), publication year (Year), area of interest (AOI), type of NTL satellite-based dataset, data source, temporal coverage (NTL period), radiance or pixel-selection thresholds applied to NTL data (Threshold), vegetation indices and traits used, vegetation dataset source, vegetation-related variables, and vegetation species considered (where applicable). Abbreviations: NTL (Nighttime Lights), DMSP-OLS (Defense Meteorological Satellite Program Operational Linescan System), VIIRS DNB (Visible Infrared Imaging Radiometer Suite Day/Night Band), ALAN (Artificial Light At Night), CONUS (Continental United States), SOS (Start of Season).
ALAN Shapes Ecology—ASE
RefYearAOINTL Satellite Based DataNTL SourceNTL PeriodThreshold (NTL)Vegetation Indices and TraitsVegetation Dataset SourceVegetation VariablesVegetation Species
[26]2022CONUS (continental United States)VIIRS DNBNASA Black Marble2012–2016Non-ALAN sites: radiance = 0 nW/cm2/sr
ALAN sites: ALAN values ≥ 75th percentile (75% quantile) of the distribution
phenologyUSA National Phenology Network dataset in the conterminous United States during 2011 to 2016breaking leaf buds in spring, colored leaves in autumnBreaking leaf buds:
Acer rubrum
Acer saccharum
Betula papyrifera
Cercis canadensis
Cornus florida
Cornus florida-appalachianspring
Fagus grandifolia
Liquidambar styraciflua
Liriodendron tulipifera
Populus tremuloides
Prunus serotina
Quercus alba
Quercus lobata
Quercus rubra
Syringa chinensis
Syringa vulgaris
Colored leaves in autumn:
Acer negundo
Acer rubrum
Acer saccharum
Betula alleghaniensis
Betula lenta
Betula papyrifera
Cercis canadensis
Cornus florida
Cornus florida-appalachianspring
Fagus grandifolia
Forsythia spp.
Liquidambar styraciflua
Liriodendron tulipifera
Populus tremuloides
Prunus serotina
Prunus virginiana
Quercus alba
Quercus gambelii
Quercus macrocarpa
Quercus rubra
Tilia americana
Viburnum lantanoides
[27]2021Europe (continental scale)DMSP-OLS, VIIRS DNBHarmonized NOAA1992–2015DN > 45 Define stable bright light sources/skyglow regions
DN > 9 Define “direct light region” (NL area)
Sky luminance atlas level 4–10 Range of moderate artificial light intensity affecting phenology
Sky luminance atlas level > 10 Strong artificial light/high sensitivity & phenological delay
phenologyPan European Phenology Project (PEP725)leaf out, floweringAesculus hippocastanum (AH, European horse chestnut),
Alnus glutinosa (AG, European alder),
Betula pendula (BP, European silver birch),
Fagus sylvatica (FS, European beech),
Fraxinus excelsior (FE, European ash),
Quercus robur (QR, oak)
Tilia cordata
[28]2021CONUS (United States)DMSP-OLS, VIIRS DNBHarmonized2001–2018DN ≤ 7 removed to exclude noise and pseudo-lightsphenologyMODIS MCD12Q2, Collection 6Start of the growing season (SOS)forest species
Disclaimer/Publisher’s Note: The statements, opinions and data contained in all publications are solely those of the individual author(s) and contributor(s) and not of MDPI and/or the editor(s). MDPI and/or the editor(s) disclaim responsibility for any injury to people or property resulting from any ideas, methods, instructions or products referred to in the content.