1. Introduction
The ocean serves as both the core carrier of the “blue economy” and a critical strategic space for global climate change mitigation and carbon neutrality goals [
1]. Within the global food security framework, marine aquatic products have become an indispensable source of animal protein for humanity [
2,
3]. Meanwhile, the marine economy must not only achieve a low-carbon ecological transition but also ensure increased fishery production and efficiency, as well as income growth for fishers, thereby achieving sustainable development. China has ranked first globally in total marine aquatic output for many consecutive years and maintains the world’s largest port scale. Promoting the high-quality development of China’s marine economy carries vital practical implications for the global economy. China has successively issued a series of policy documents, including the Outline of the 15th Five-Year Plan for National Economic and Social Development and the Opinions of the CPC Central Committee and the State Council on Anchoring Agricultural and Rural Modernization to Solidly Advance Comprehensive Rural Revitalization. These documents coordinate efforts to advance the green and low-carbon transformation of the marine economy, marine ecological protection and restoration, as well as the inclusive sharing of development achievements, thereby deeply integrating the goals of building a maritime power, fostering ecological civilization and realizing common prosperity. This raises an urgent question: Have China’s marine economic green development efficiency and inclusive growth achieved effective synergy? How can their coordinated improvement be promoted? Answering these questions is critical to unlocking the sustainable development potential of China’s marine economy.
Existing research on marine economic green development efficiency and inclusive growth is extensive, primarily unfolding along three dimensions: research frameworks, evaluation systems, and potential forecasting.
First, in terms of research frameworks, most existing literature measures marine economic green development efficiency or marine economic inclusive growth independently, rarely incorporating both into a unified synergy evolution analysis framework. For example, some studies separately measure marine economic green development efficiency [
4,
5,
6], while others separately measure marine economic inclusive growth [
7,
8,
9]. Recent studies have begun to focus on the linkages between the two systems, but the methods used are mostly limited to the coupling coordination degree model. For instance, Yang et al.’s measurements show that in 2020, the synergy level of most Chinese provinces and cities remained at the primary coordination stage [
10]; Pei et al. found that China’s synergy level rose from 0.25 in 2009 to 0.76 in 2020 [
11]; Yao et al.’s results indicate that China’s coupling synergy level was generally low in the early study period and gradually increased later [
12]. While these studies can characterize the long-term synergy evolution patterns, their core remains at the level of static coupling state analysis for individual years. This type of static analysis can only indicate whether the two systems are coordinated in a given year, but cannot clarify the mutual influence mechanisms between them. The Haken model, by contrast, can reveal the complete process of “who dominates, who responds, and how they evolve” among variables. Overall, existing achievements have not yet moved beyond the analytical framework of single-system, static coupling.
Second, in terms of evaluation systems, the indicator systems constructed by existing literature cover a relatively narrow scope, making it difficult to comprehensively reflect environmental costs, green governance effectiveness, and the risk resistance and sustainable support capacity of coastal regions under external disturbances. In the green development efficiency dimension, existing studies mainly select traditional factors such as labor, capital stock, energy consumption, and seawater aquaculture area as input indicators [
13], without incorporating front-end governance indicators such as environmental protection investment and green innovation. However, green low-carbon development and innovation-driven growth are core requirements for building a modern marine industrial system, making the consideration of such indicators indispensable. In the inclusive growth dimension, existing studies mostly select economic and livelihood indicators such as economic growth rate, per capita income, education enrollment rate, and medical bed numbers [
14,
15], rarely involving a development resilience module that measures the recovery capacity of economic systems after natural disasters or sudden public events. Yet, in the current context of frequent global marine disasters, intensifying climate change, and increasing external risks, such factors should be incorporated into the core connotation of marine economic inclusive growth. In response to these limitations, some scholars have further attempted to expand indicator systems and construct multidimensional evaluation frameworks for high-quality marine economic development [
16,
17]. However, these frameworks still focus on resource consumption and pollution emissions in the green development efficiency dimension, and continue to emphasize economic and livelihood indicators in the inclusive growth dimension.
Third, in terms of potential forecasting, existing studies that attempt to explore the synergy trend between marine economic green development efficiency and inclusive growth mostly adopt qualitative policy recommendations, with few studies quantitatively measuring the synergy trend. For example, Cheng et al. proposed directional strategies for future high-quality marine economic development [
18]; Guo et al. reviewed the development history of the marine economy and summarized future practical pathways [
19]; Sun et al. identified key directions for future quality and efficiency improvement based on the spatiotemporal evolution of high-quality marine economic development [
20]; Jin et al. constructed an evaluation system for high-quality marine economic development and proposed related recommendations [
21]; Pan et al. offered future marine economic policy implications from the perspective of synergy between high-quality development and green transition [
22]; Lin et al. proposed governance recommendations after quantitatively analyzing the impact of marine economic inclusive growth on green development efficiency [
23].
Therefore, this paper differs from existing research in the following ways: First, it breaks through the research paradigm of single-system or static coupling analysis by introducing the Haken model, incorporating marine economic green development efficiency and inclusive growth into a unified synergy evolution analysis framework, identifying the order parameters that play a dominant role in their evolution process, and measuring their synergy level. Second, it constructs a more comprehensive dual-system evaluation indicator framework for marine economic development, supplementing front-end governance indicators such as environmental protection investment and green innovation in the green development efficiency dimension, and adding a key development resilience module in the inclusive growth dimension. Third, it employs the ARIMA time series model to quantitatively forecast the synergy level of China’s three major marine economic circles and 11 coastal provinces from 2025 to 2029, clarifying future spatiotemporal evolution trends and providing decision-making references for high-quality marine economic development.
2. Theoretical Analysis
Clarifying the internal interactive mechanism between green development efficiency and inclusive growth of the marine economy serves as the theoretical prerequisite for constructing scientific evaluation indicators and conducting empirical measurement. Synergetics theory mainly explains how a complex system composed of multiple subsystems gradually evolves toward order and ultimately forms a self-organized system under the interaction of its subsystems [
24,
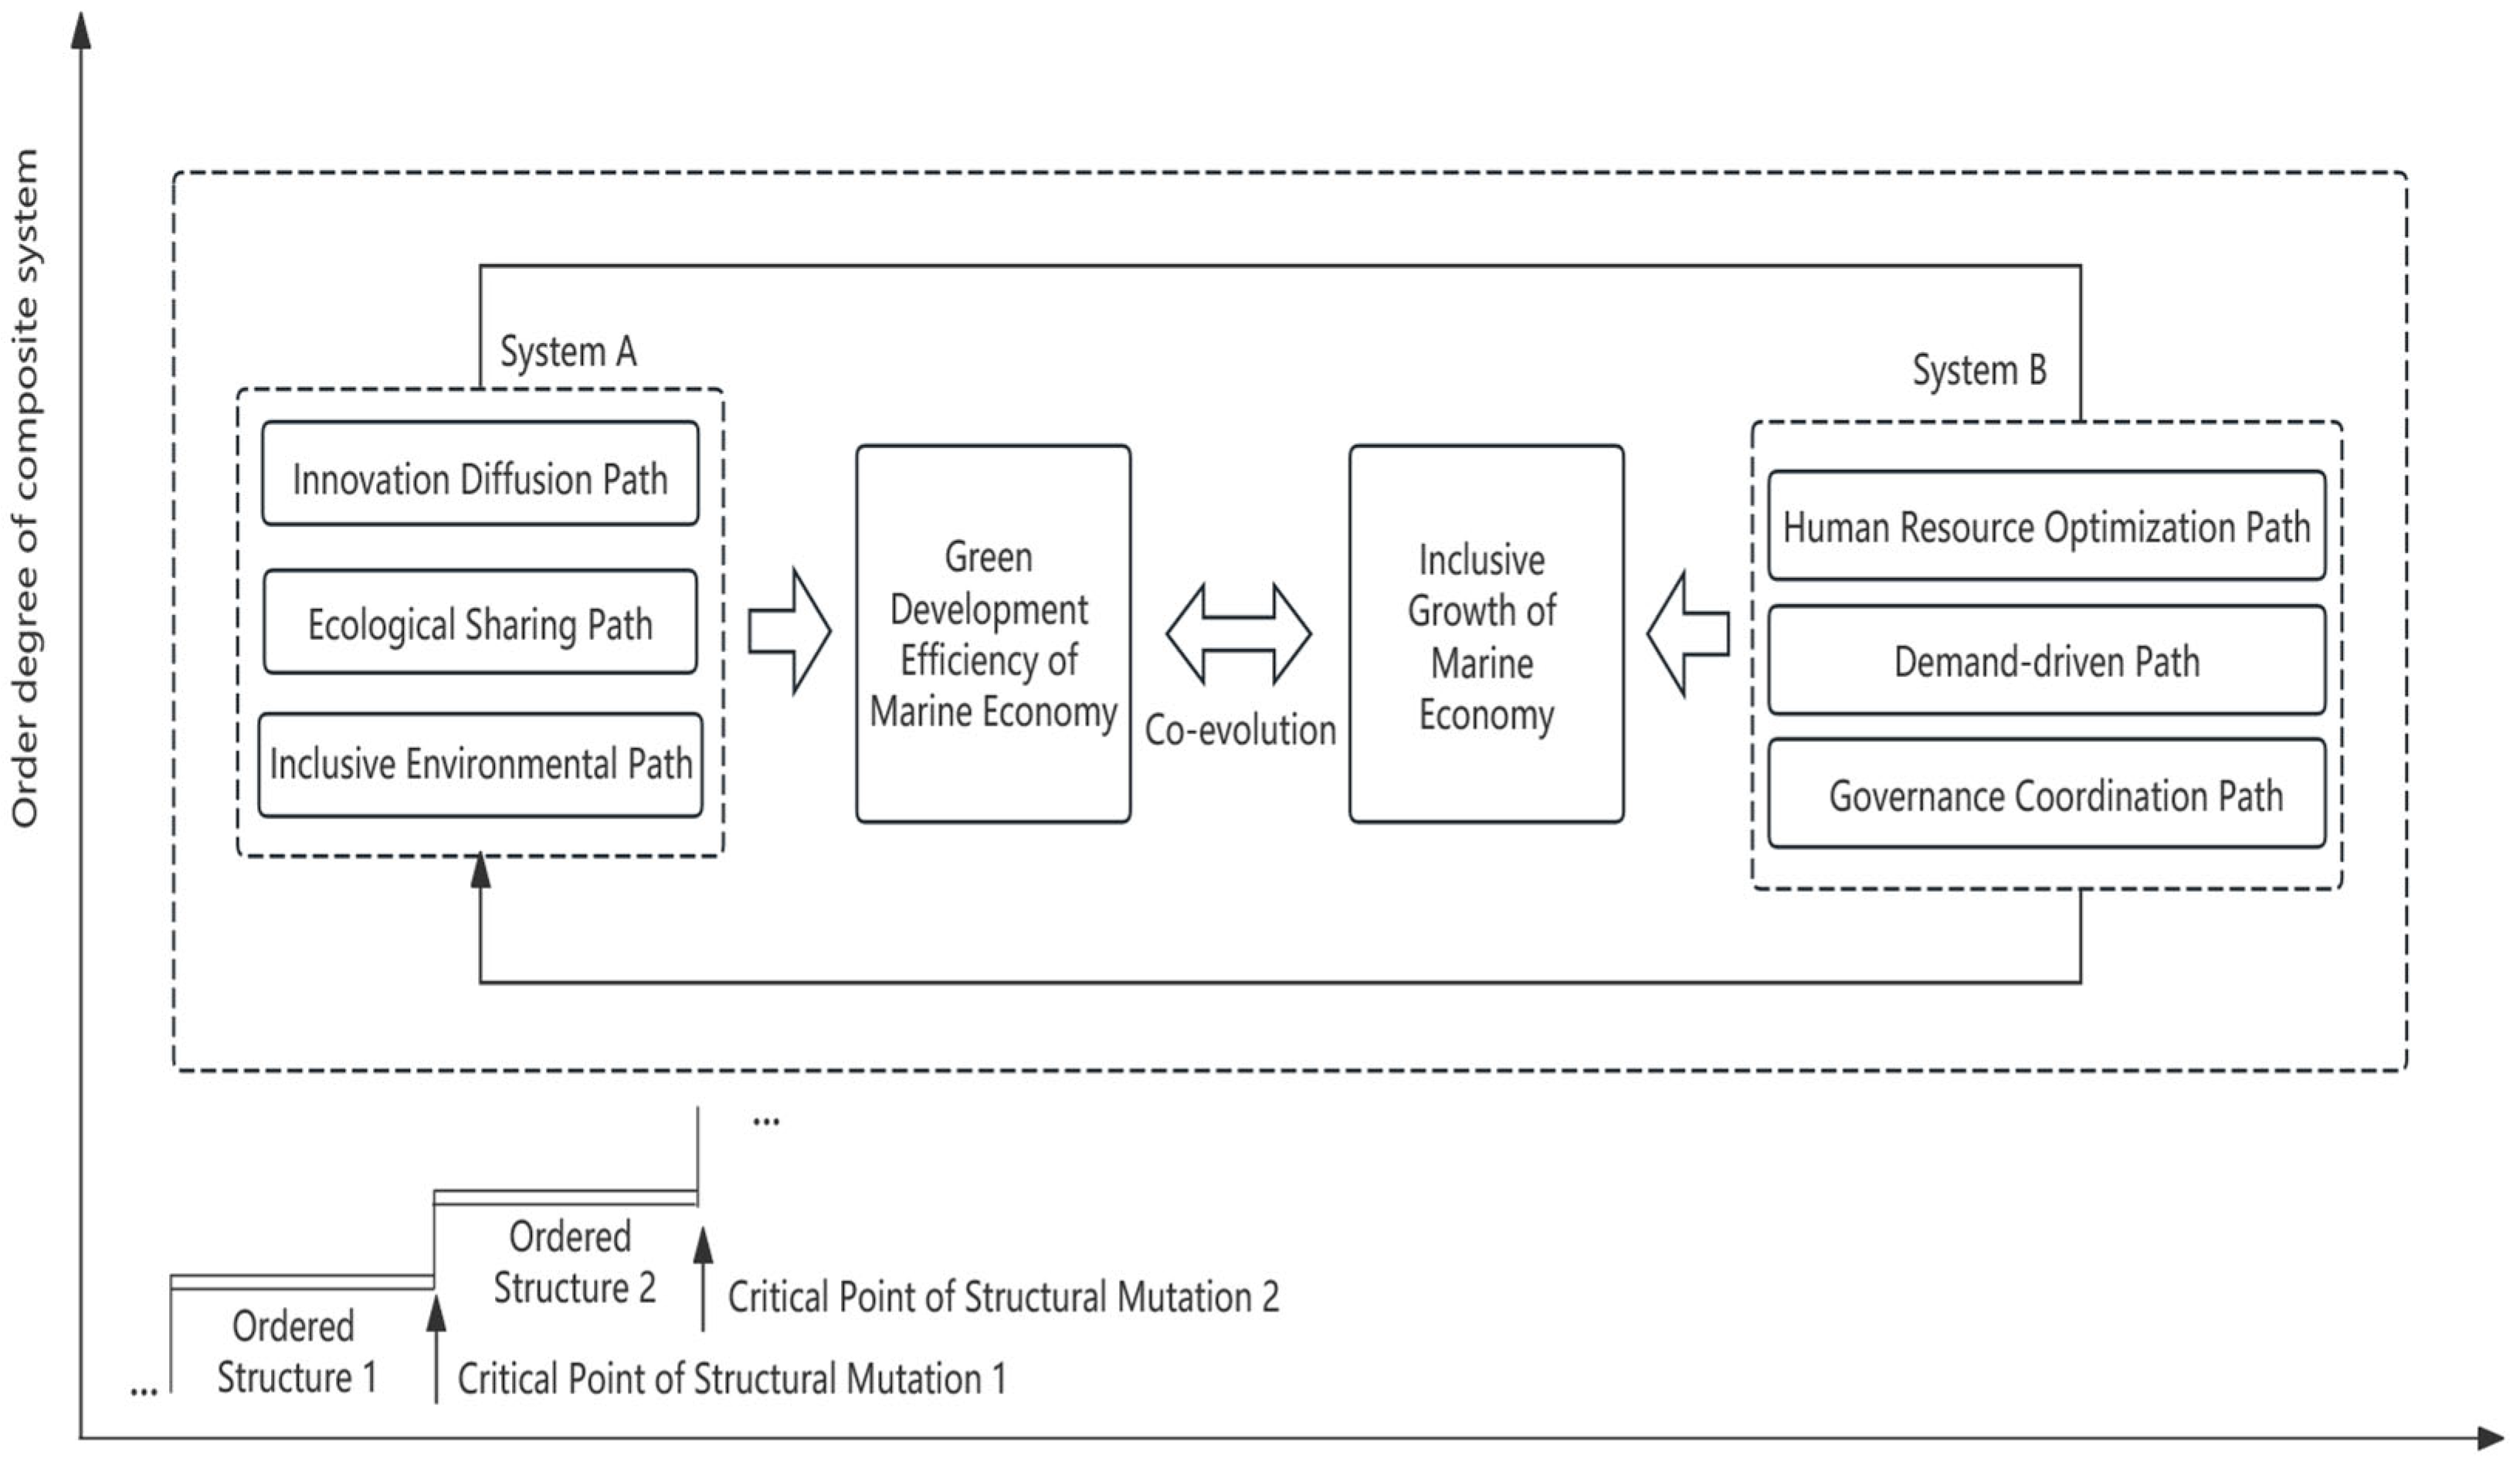
25]. Green development efficiency and inclusive growth of the marine economy precisely constitute such a self-organized system. Driven by factors including resource endowments, industrial layout, environmental governance, and coordinated land-marine development, the two subsystems shift from mutual restriction to coordinated mutual promotion, fostering a virtuous cycle among economic growth, ecological conservation and social welfare, while the overall orderliness of the system keeps rising.
- (1)
Green development efficiency empowers inclusive growth through three pathways: innovation diffusion, ecological sharing, and environmental inclusiveness.
Innovation diffusion reshapes the operational landscape of marine industries via the renewal of green technologies. Continuous output of green patents cuts the technical costs of marine-related production, thereby lowering the entry barriers for small and medium-sized marine operators. Industrial expansion generates substantial employment opportunities, and the overall scale of marine employment among coastal residents directly mirrors the inclusive welfare dividends brought by technology spillovers [
26].
Ecological sharing acts as the core channel converting marine ecological value into residents’ income. Sufficient mariculture areas and marine fry reserves lay a resource foundation for market-oriented ecological industries such as blue carbon trading and marine ranches, while the carbon sequestration scale of marine fisheries intuitively reflects the stock of regional marine ecological assets. The total output value of marine fisheries represents the overall scale of ecological industries. Economic gains derived from ecological resources steadily raise the per capita disposable income of coastal zone residents and narrow internal income gaps within coastal regions [
26].
Environmental inclusiveness safeguards the basic livelihood of disadvantaged coastal groups through ecological governance. The proportion of fiscal environmental expenditure reflects local governments’ investment in marine pollution abatement, and total carbon emissions from marine fisheries indicate ecological losses caused by fishery production. Sustained pollution prevention and coastal ecological restoration reduce environmental health risks faced by marginalized groups. Indicators such as the number of medical beds per ten thousand people and pension insurance participation rate indirectly reflect a public welfare security system supported by ecological improvements [
27].
- (2)
Inclusive growth in turn boosts green development efficiency via three reverse pathways: human capital optimization, demand-driven transformation, and collaborative governance.
Human capital optimization consolidates the human capital foundation for marine green transition through equitable development. Equal access to education and popularization of vocational skills optimize coastal residents’ knowledge structure and labor competencies. Accumulated human capital strengthens society’s capacity to absorb and reinnovate green technologies: it supplies sufficient operators and maintainers for green technology promotion, and reserves innovative talents for localized adaptation and iterative upgrading of technologies. Its effects are embodied in expanded marine employment, higher resident income, and improved social security, including medical care and pensions [
7].
Demand-driven transformation accompanies rising income and shifting consumption concepts. Coastal residents’ growing preference for high-quality marine ecological environments and green aquatic products incentivizes marine enterprises to voluntarily phase out high-energy and high-emission production modes for profit, reallocating resources toward low-carbon and clean production. The resulting closer land-marine economic linkages, higher per capita output, and advanced, rationalized industrial structure jointly realize green growth of total marine economic output [
23].
Collaborative governance evolves marine environmental management from exclusive government regulation to multi-stakeholder consultation and joint participation, supported by growing grassroots forces such as community organizations and environmental NGOs. Improved information transparency eliminates regulatory blind spots, and public participation reduces social resistance to policy implementation, lowering the institutional costs of green regulations and lifting governance efficiency. Such optimized institutional environments are manifested in better information infrastructure, strengthened marine scientific research capacity and improved industrial supply security, collectively forming the institutional foundation for development resilience [
28]. The mechanism is illustrated in
Figure 1.
4. Results
4.1. Measurement and Characteristic Analysis of Marine Economic Green Development Efficiency
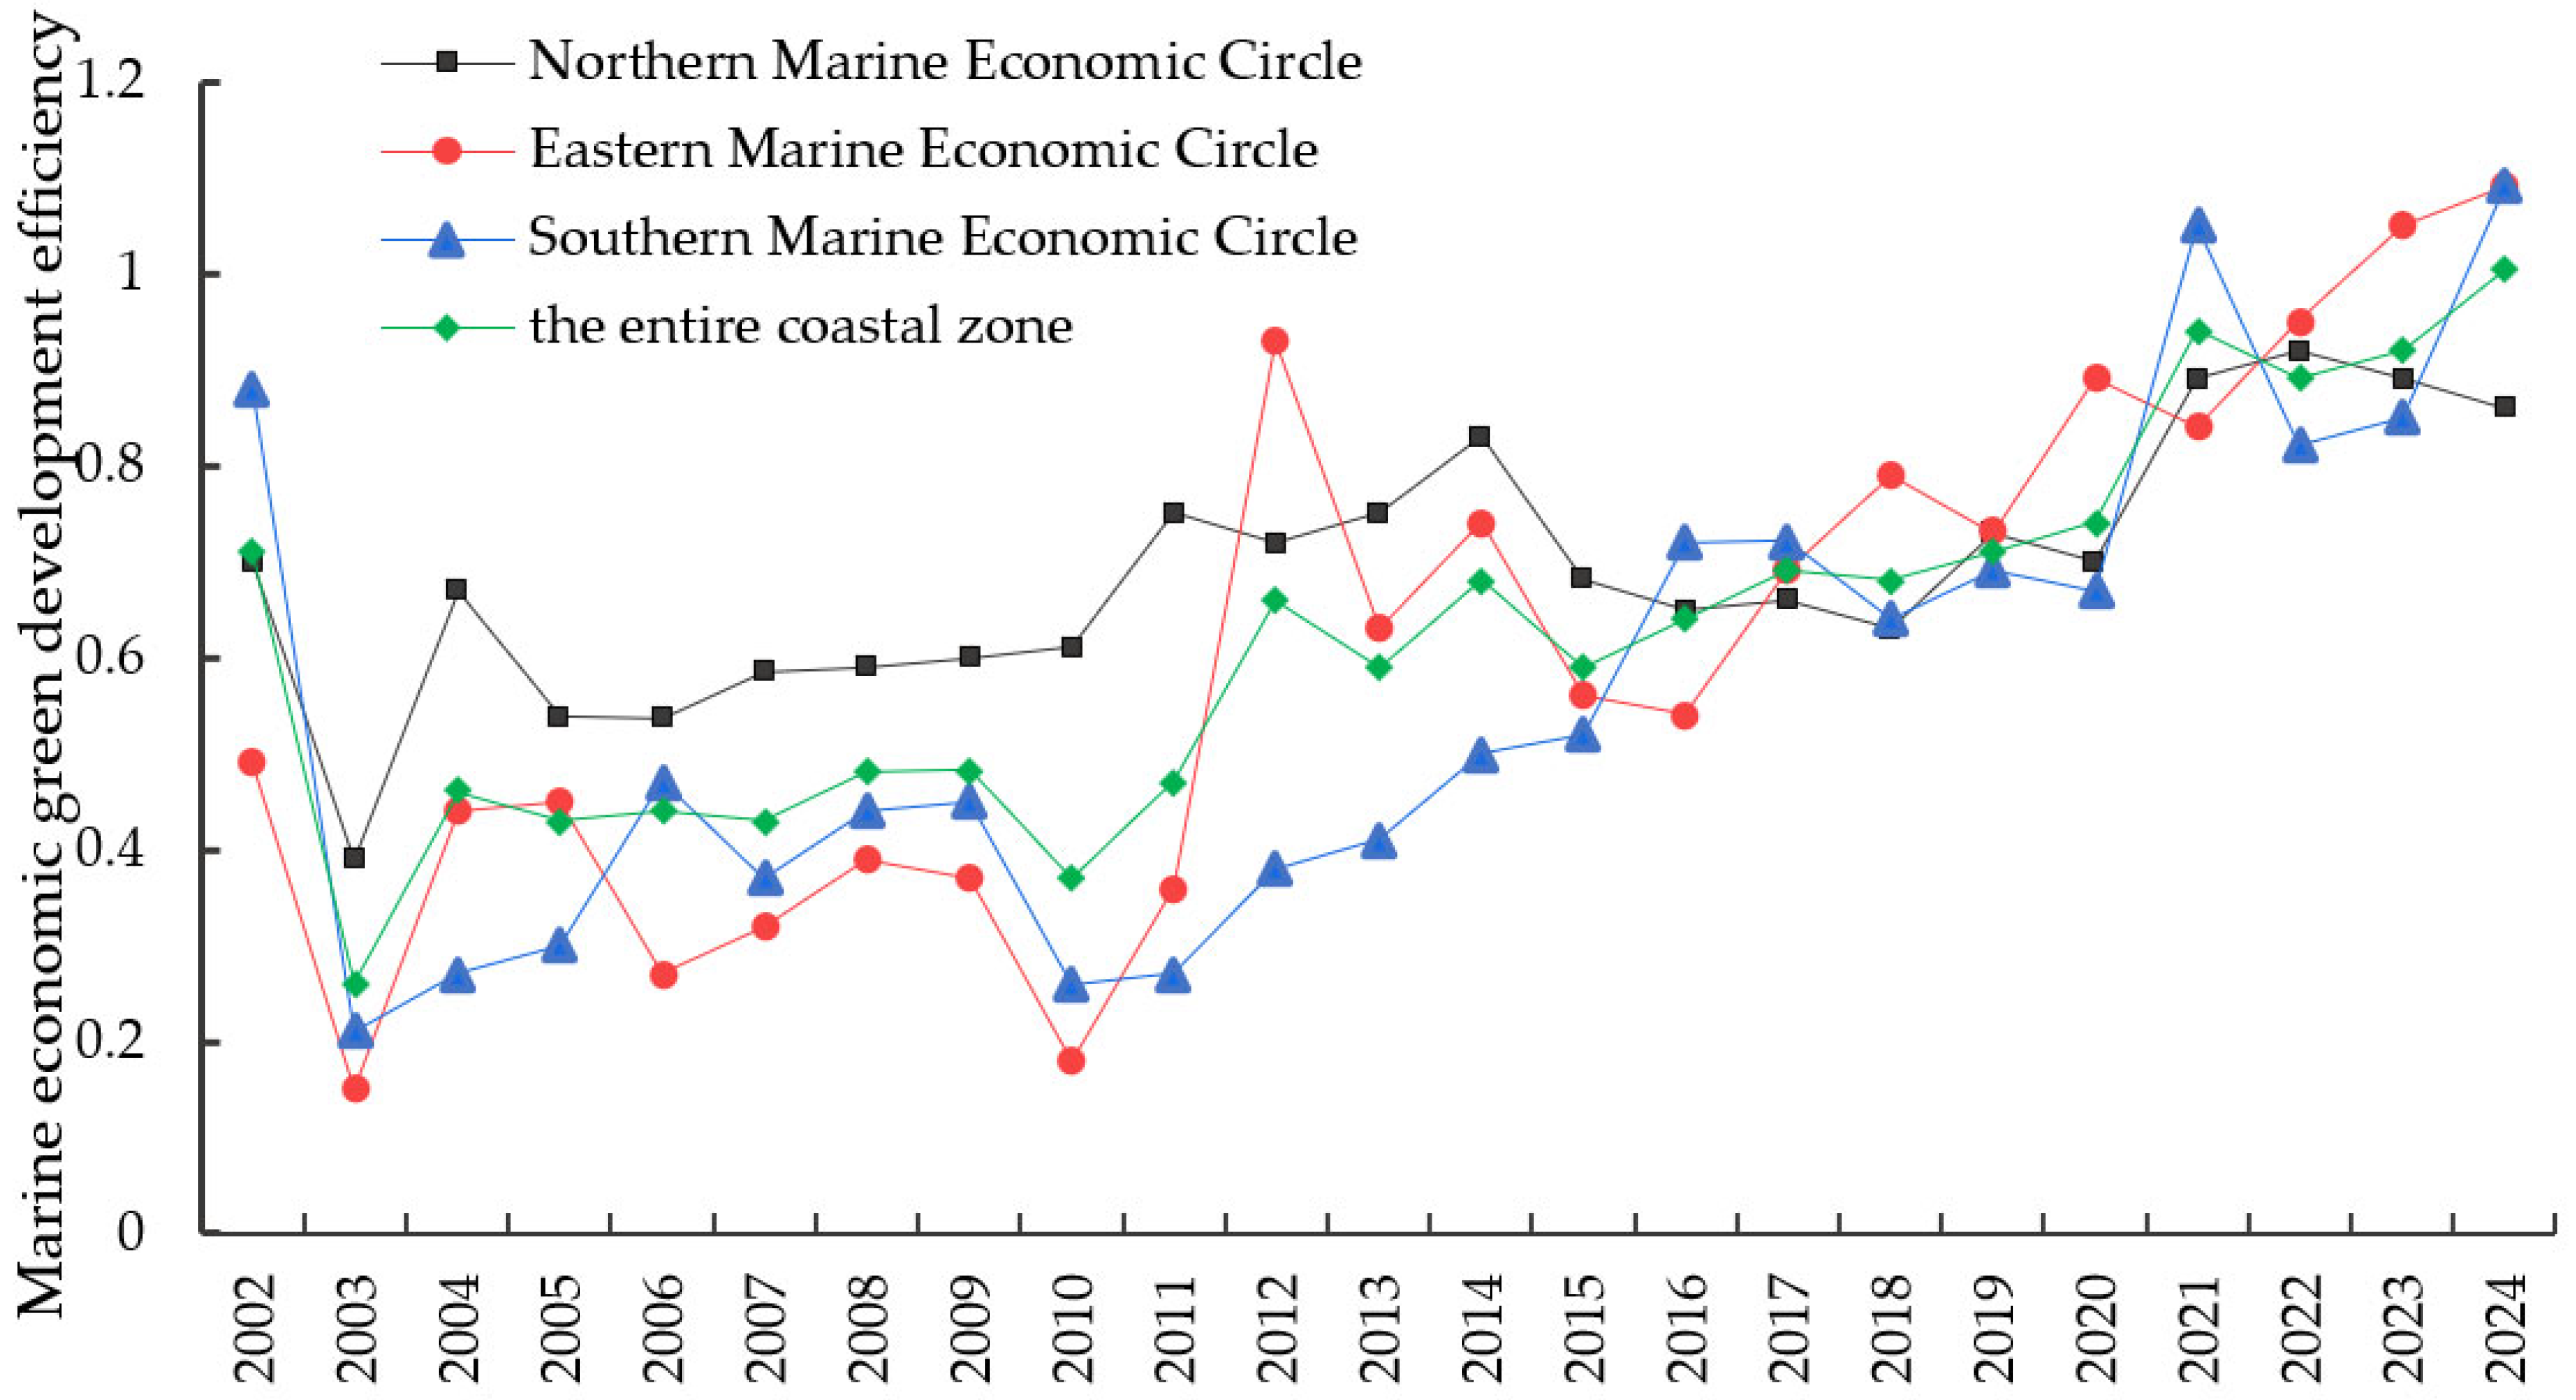
From 2002 to 2024, the green development efficiency of the marine economy along the entire coastal zone exhibited a fluctuating upward trend that first declined and then rose. The average value fell from 0.71 in 2002 to 0.26 in 2003, a year-on-year drop of 63.38%, before rising steadily to 1.004 in 2024. During 2002–2003, the fishery sector prioritized scale expansion, accompanied by extensive exploitation of marine resources and inadequate pollution control, which triggered a short-term slump in efficiency. Afterwards, green efficiency rebounded progressively as marine ecological conservation and fishery resource restoration were continuously intensified.
At the regional level, the pattern of green development efficiency diverged year by year across the three major marine economic circles. From 2002 to 2014, the Northern Marine Economic Circle maintained a stable efficiency range of 0.53–0.83, taking the lead in the early stage supported by standardized aquaculture and fishing moratorium policies. Relying on green fishery technologies and carbon sink pilot projects, the Eastern Marine Economic Circle saw its efficiency surge to 0.93 in 2012, marking a striking year-on-year increase of 158.33% compared with 2011 and overtaking other regions; its efficiency reached 1.09 in 2024, ranking first nationwide. The Southern Marine Economic Circle accelerated its development after launching blue bay renovation initiatives in 2016. Its efficiency climbed from 0.72 to 1.09 between 2016 and 2024, with a cumulative growth rate of 51.39%, and cross-regional gaps narrowed persistently over time. The temporal evolution trend is illustrated in
Figure 2.
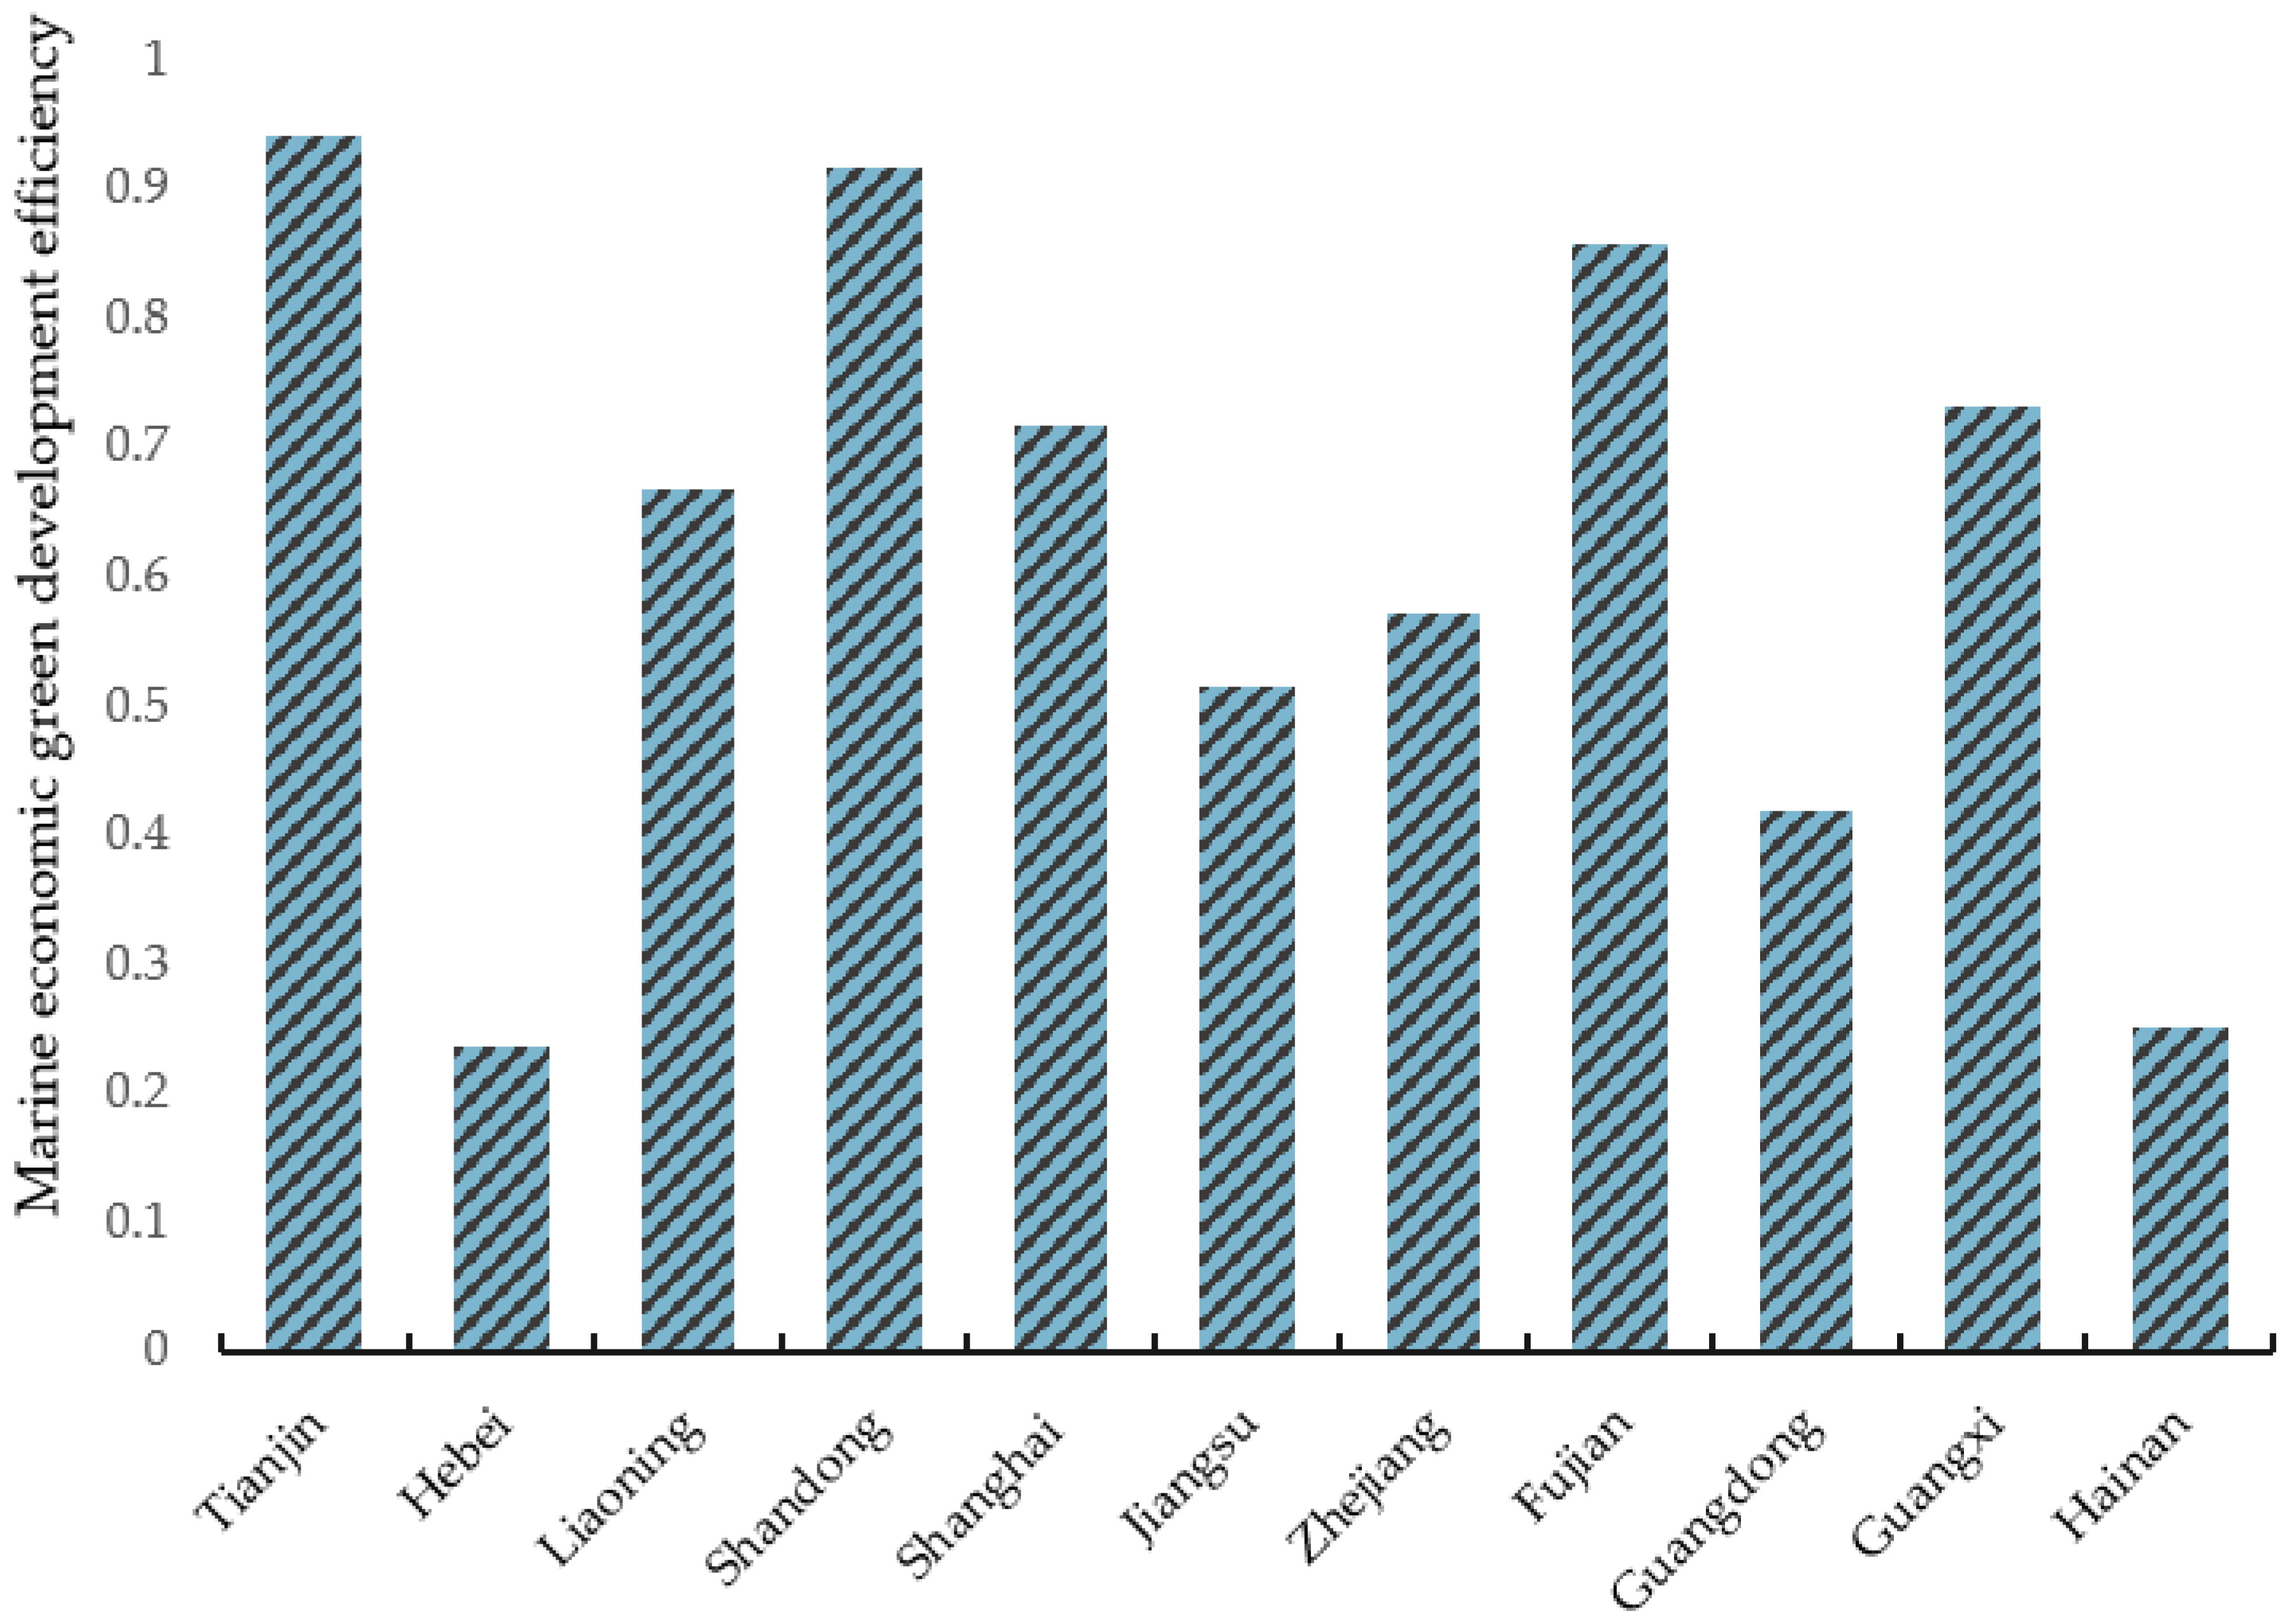
At the provincial level, the green development efficiency of the marine economy differs substantially among China’s 11 coastal provinces and municipalities, forming an overall spatial pattern featuring higher efficiency in the north and lower efficiency in the south with obvious internal disparities within each region.
First tier: Tianjin (0.94), Shandong (0.91) and Fujian (0.86). Benefiting from abundant marine science and education resources, these regions have carried out projects of recirculating mariculture and marine carbon sinks, achieving remarkable results in intensive resource utilization and pollutant abatement.
Second tier: Shanghai (0.72), Guangxi (0.73), Liaoning (0.67) and Zhejiang (0.57). Ecological aquaculture projects have been steadily implemented, driving continuous improvement in green development efficiency.
Third tier: Jiangsu (0.52), Guangdong (0.42), Hainan (0.25) and Hebei (0.24), which rank at the bottom of the efficiency list. Hebei (0.24) and Hainan (0.25) record the two lowest efficiency values across all samples. Hebei is constrained by extensive coastal aquaculture and lagging supporting facilities for wastewater treatment. Hainan suffers from a small marine economic scale, insufficient coverage of green technologies and a weak industrial foundation. The provincial-level measurement results are illustrated in
Figure 3.
4.2. Measurement and Characteristic Analysis of Inclusive Growth Level of Marine Economy
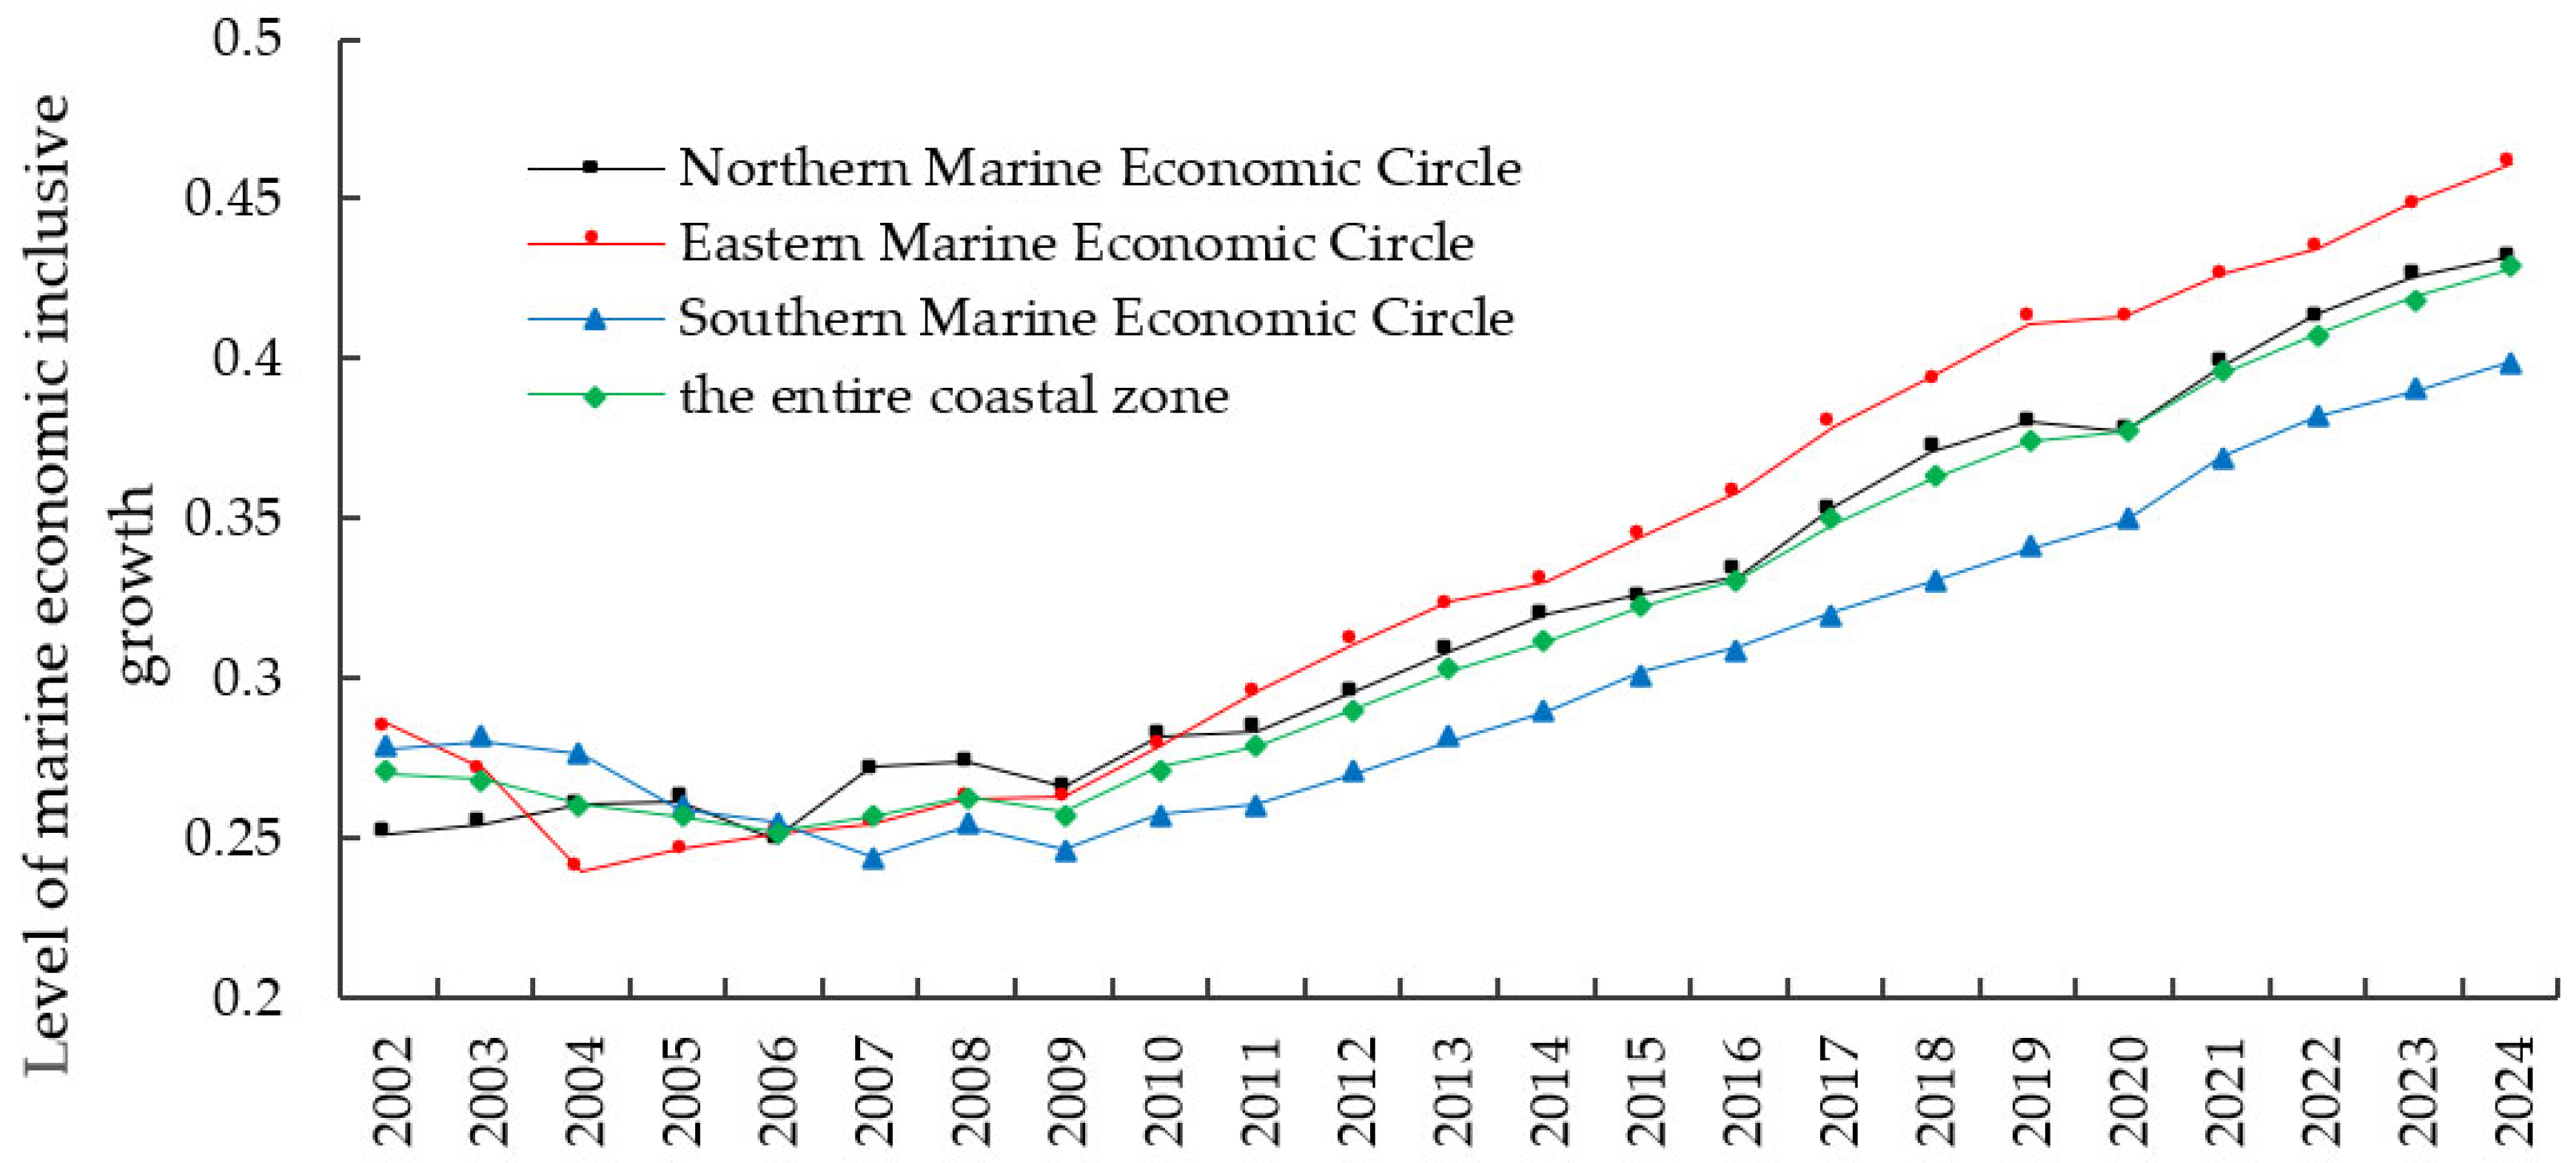
The inclusive growth level of the marine economy across the entire coastal zone maintained a sustained upward trend, rising from 0.27 in 2002 to 0.43 in 2024, with a cumulative growth rate of 59.26% over the 22 years. During 2002–2010, the marine economy was characterized by extensive expansion, while supporting inclusive facilities related to marine industries and policies for income distribution adjustment were insufficient. After the launch of the Maritime Power Strategy in 2012, supportive policies for marine-related employment and equalization of public services in fishing villages were accelerated across coastal regions.
The Eastern Marine Economic Circle remained the leading region throughout the study period, with its index climbing from 0.29 in 2002 to 0.46 in 2024, representing a cumulative increase of 58.62%. It has formed sustainable growth advantages driven by the expansion of port-side marine industrial clusters and the improvement of inclusive fishery subsidy systems. The inclusive growth index of the Northern Marine Economic Circle increased from an initial value of 0.25 to 0.43 at the end of the period, and its growth rate accelerated remarkably after the implementation of the 14th Five-Year Plan coordinated development policies for the Bohai Rim. The Southern Marine Economic Circle saw its index rise from 0.28 to 0.40, steadily catching up, fueled by livelihood-benefiting programs for coastal ecological aquaculture. The temporal evolution trend is illustrated in
Figure 4.
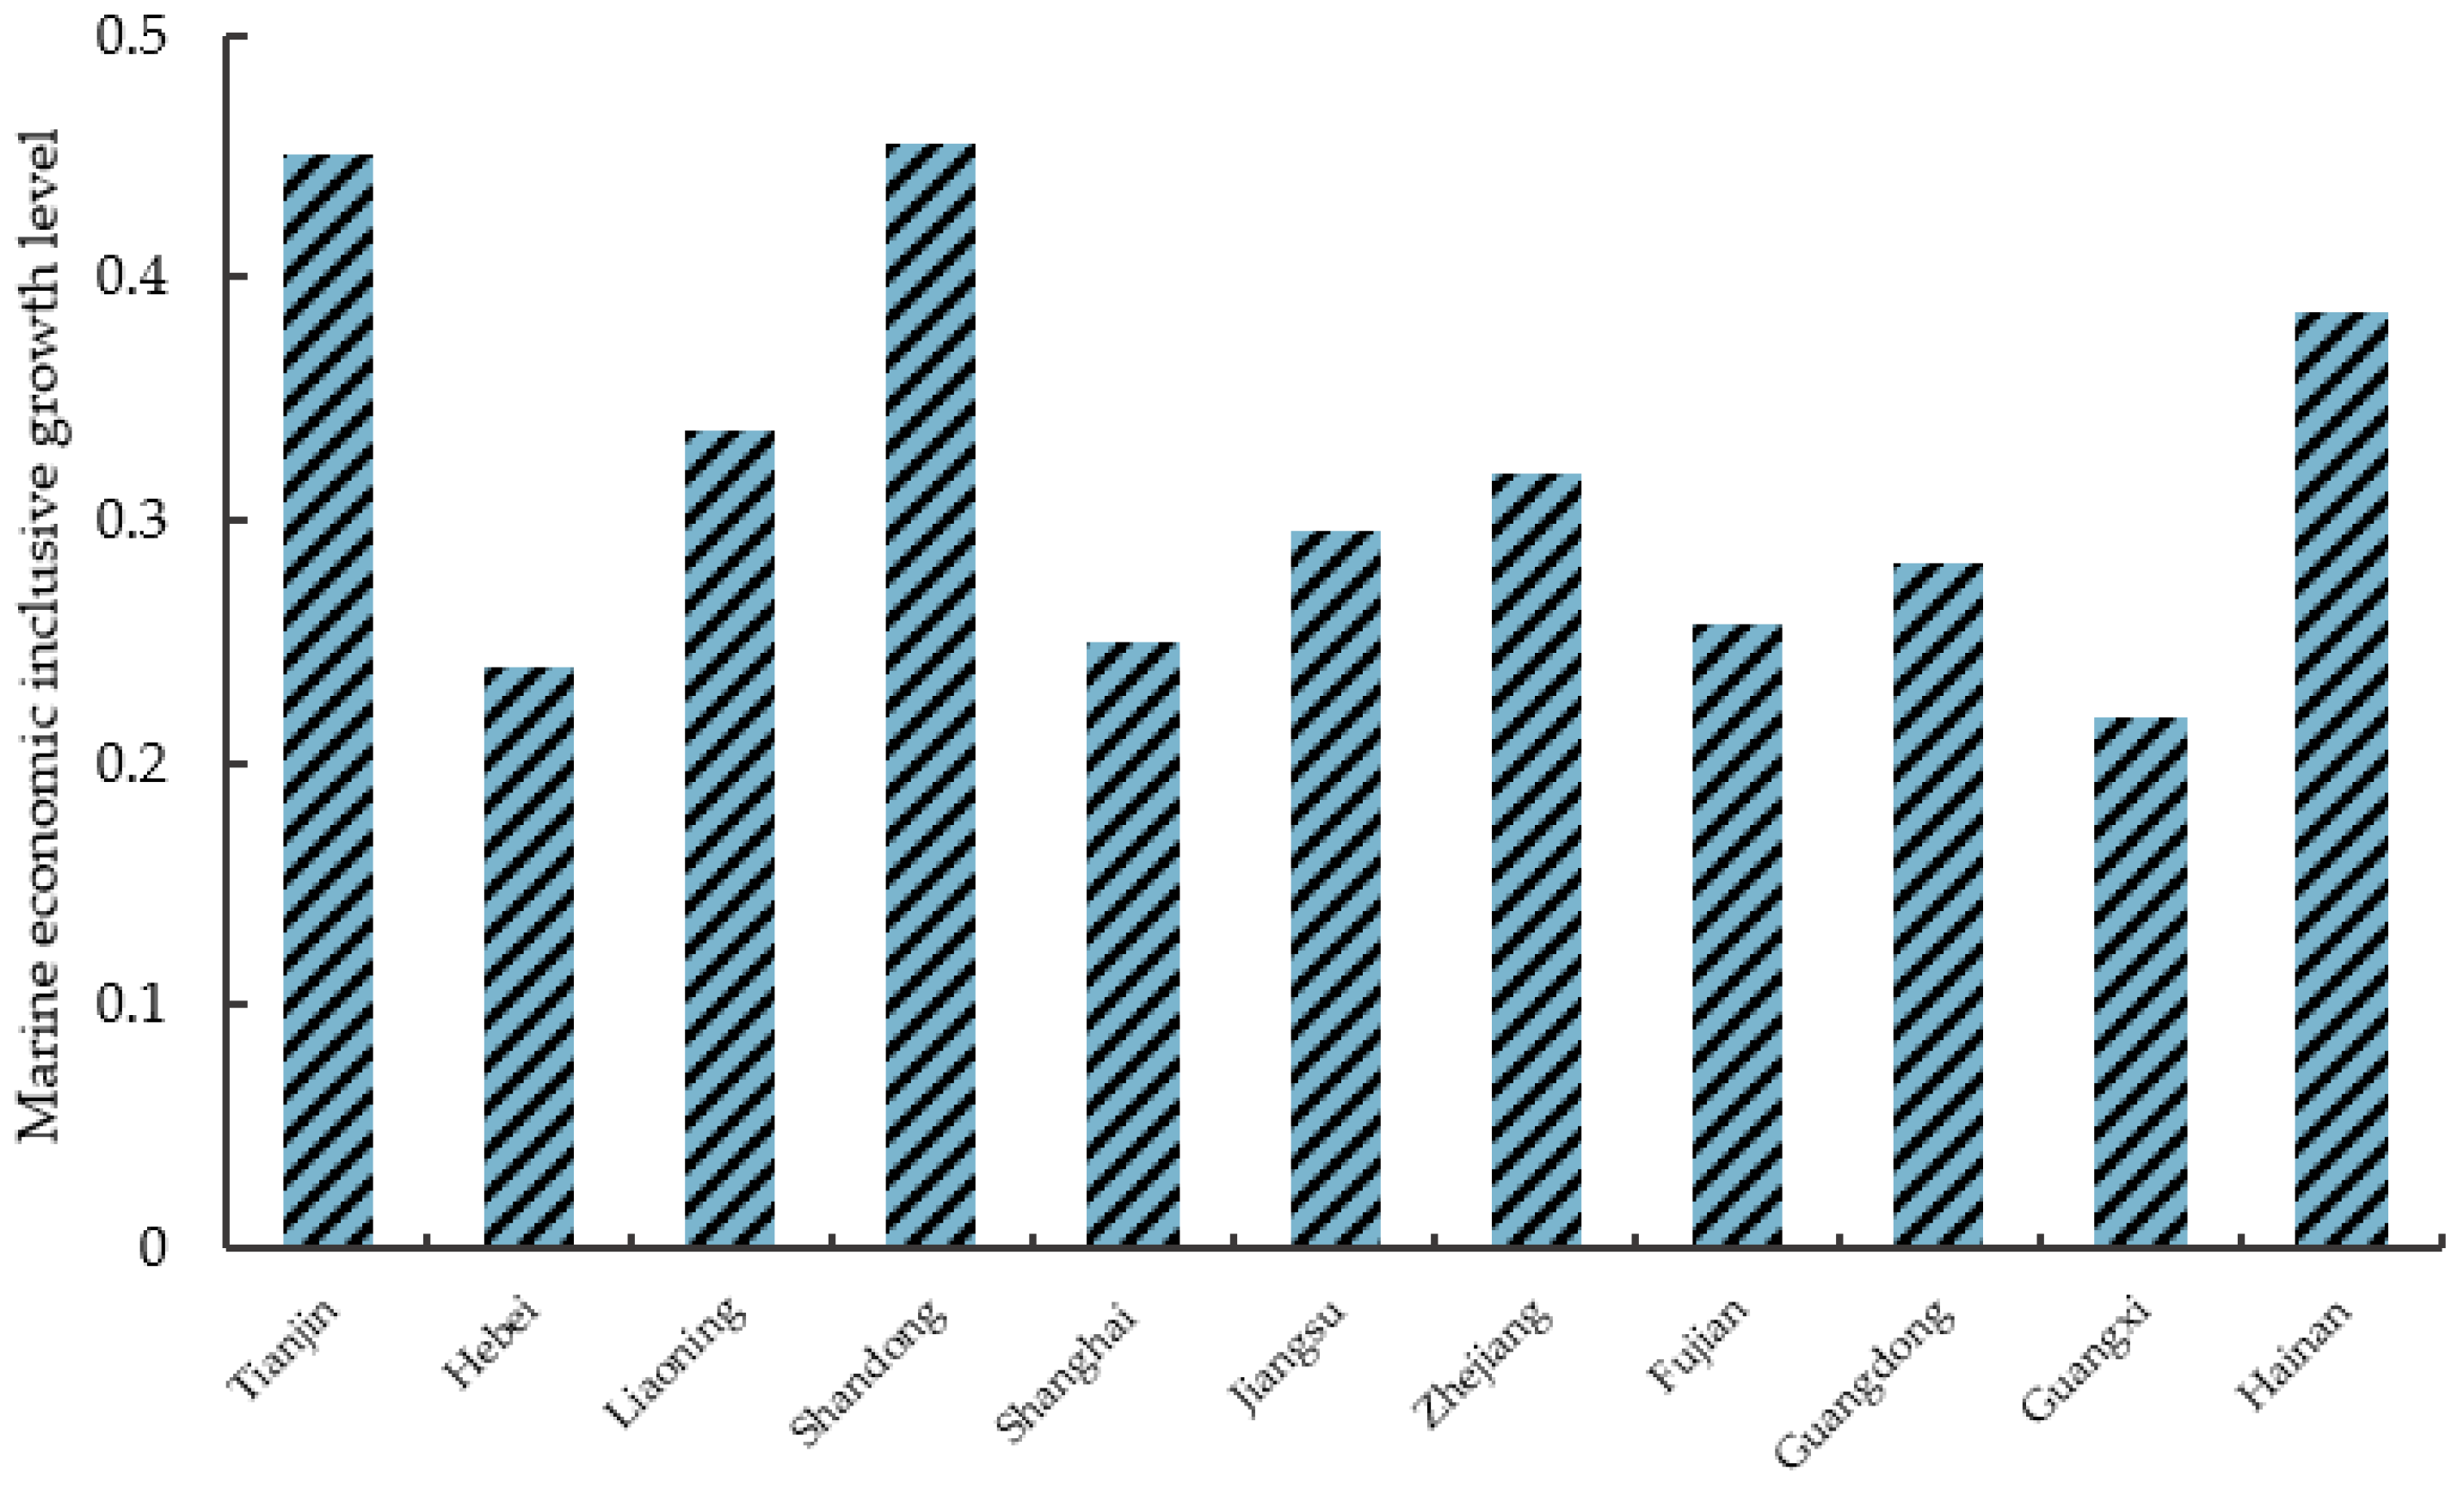
At the provincial level, the inclusive growth level of marine economy in China’s 11 coastal provinces and municipalities presents a pattern where municipalities directly under the Central Government take the lead, developed coastal provinces show prominent internal differentiation, and border coastal provinces lag relatively behind. Shanghai (0.46) and Tianjin (0.45) stably occupy the first tier by virtue of abundant public resources and sound livelihood security systems. Hainan (0.39) ranks in the upper-middle range, realizing inclusive development with a small marine economic scale relying on coastal tourism and recreational fisheries. Liaoning (0.34), Fujian (0.32), Zhejiang (0.30), Guangdong (0.28), Shandong (0.26) and Jiangsu (0.25) fall in the medium range. Notably, although Guangdong is a major province with a large marine economy, its inclusive index only reaches 0.28, indicating an obvious mismatch between economic scale and inclusive development performance. Hebei (0.24) and Guangxi (0.22) remain at the bottom all year round. Their weak marine industrial foundation and inadequate public service supporting facilities restrict employment expansion and income growth. The provincial-level measurement results are illustrated in
Figure 5.
4.3. Characteristic Analysis of Coordination Level Between Green Development Efficiency and Inclusive Growth of Marine Economy
4.3.1. Regression Results of Haken Model
This study conducts empirical regression via the Haken model, successively taking marine economic green development efficiency (gde) and marine economic inclusive growth (ig) as candidate order parameters. The regression outcomes are presented in
Table 7, and all regression coefficients are statistically significant at the 1% significance level.
When marine economic green development efficiency is set as the assumed order parameter, the estimated coefficients are = 0.336 and = 0.026. Since || > ||, the adiabatic approximation hypothesis fails to hold, which indicates that marine economic green development efficiency cannot serve as the order parameter dominating the co-evolution of the composite system.
Under the premise that marine economic inclusive growth is hypothesized as the order parameter, the control parameters of the composite system derived from Equations (8) and (9) are = 0.042 and = 0.237. It satisfies both || ≫ || and > 0, meaning the adiabatic approximation assumption is valid. Therefore, within the composite system consisting of marine economic green development efficiency and inclusive growth, marine economic inclusive growth acts as the slowly varying order parameter that dominates the evolutionary process of the whole system.
The identification of inclusive growth as the order parameter can be further interpreted economically. Driven by short-term adjustments like mariculture technology upgrades and pollution abatement investment, marine green development efficiency fluctuates sharply year by year and constitutes a fast variable vulnerable to external shocks. In contrast, inclusive growth covers long-term institutional arrangements such as income distribution, equal public services, industrial resilience and social security, evolving slowly alongside socioeconomic transformation as a typical slow variable. The co-evolution mechanism of the dual system further supports this view: green efficiency merely delivers temporary ecological and income gains, while inclusive growth persistently improves human capital, market demand and multi-party governance to steadily advance marine green efficiency. Together with the distinct gap between Haken model damping coefficients, we robustly confirm inclusive growth as the core order parameter dominating the co-evolution of the two systems.
Notably, the precondition of the adiabatic approximation lies in the obvious gap between the two damping coefficients, with no mandatory requirement for the original time series to be stationary or detrended in advance. The large disparity between = 0.042 and = 0.237 fully satisfies the theoretical threshold, so discretizing the non-stationary annual original sequences through Equations (21) and (22) will not bias the order parameter judgment and co-evolution analysis.
4.3.2. Temporal Dynamic Evolution
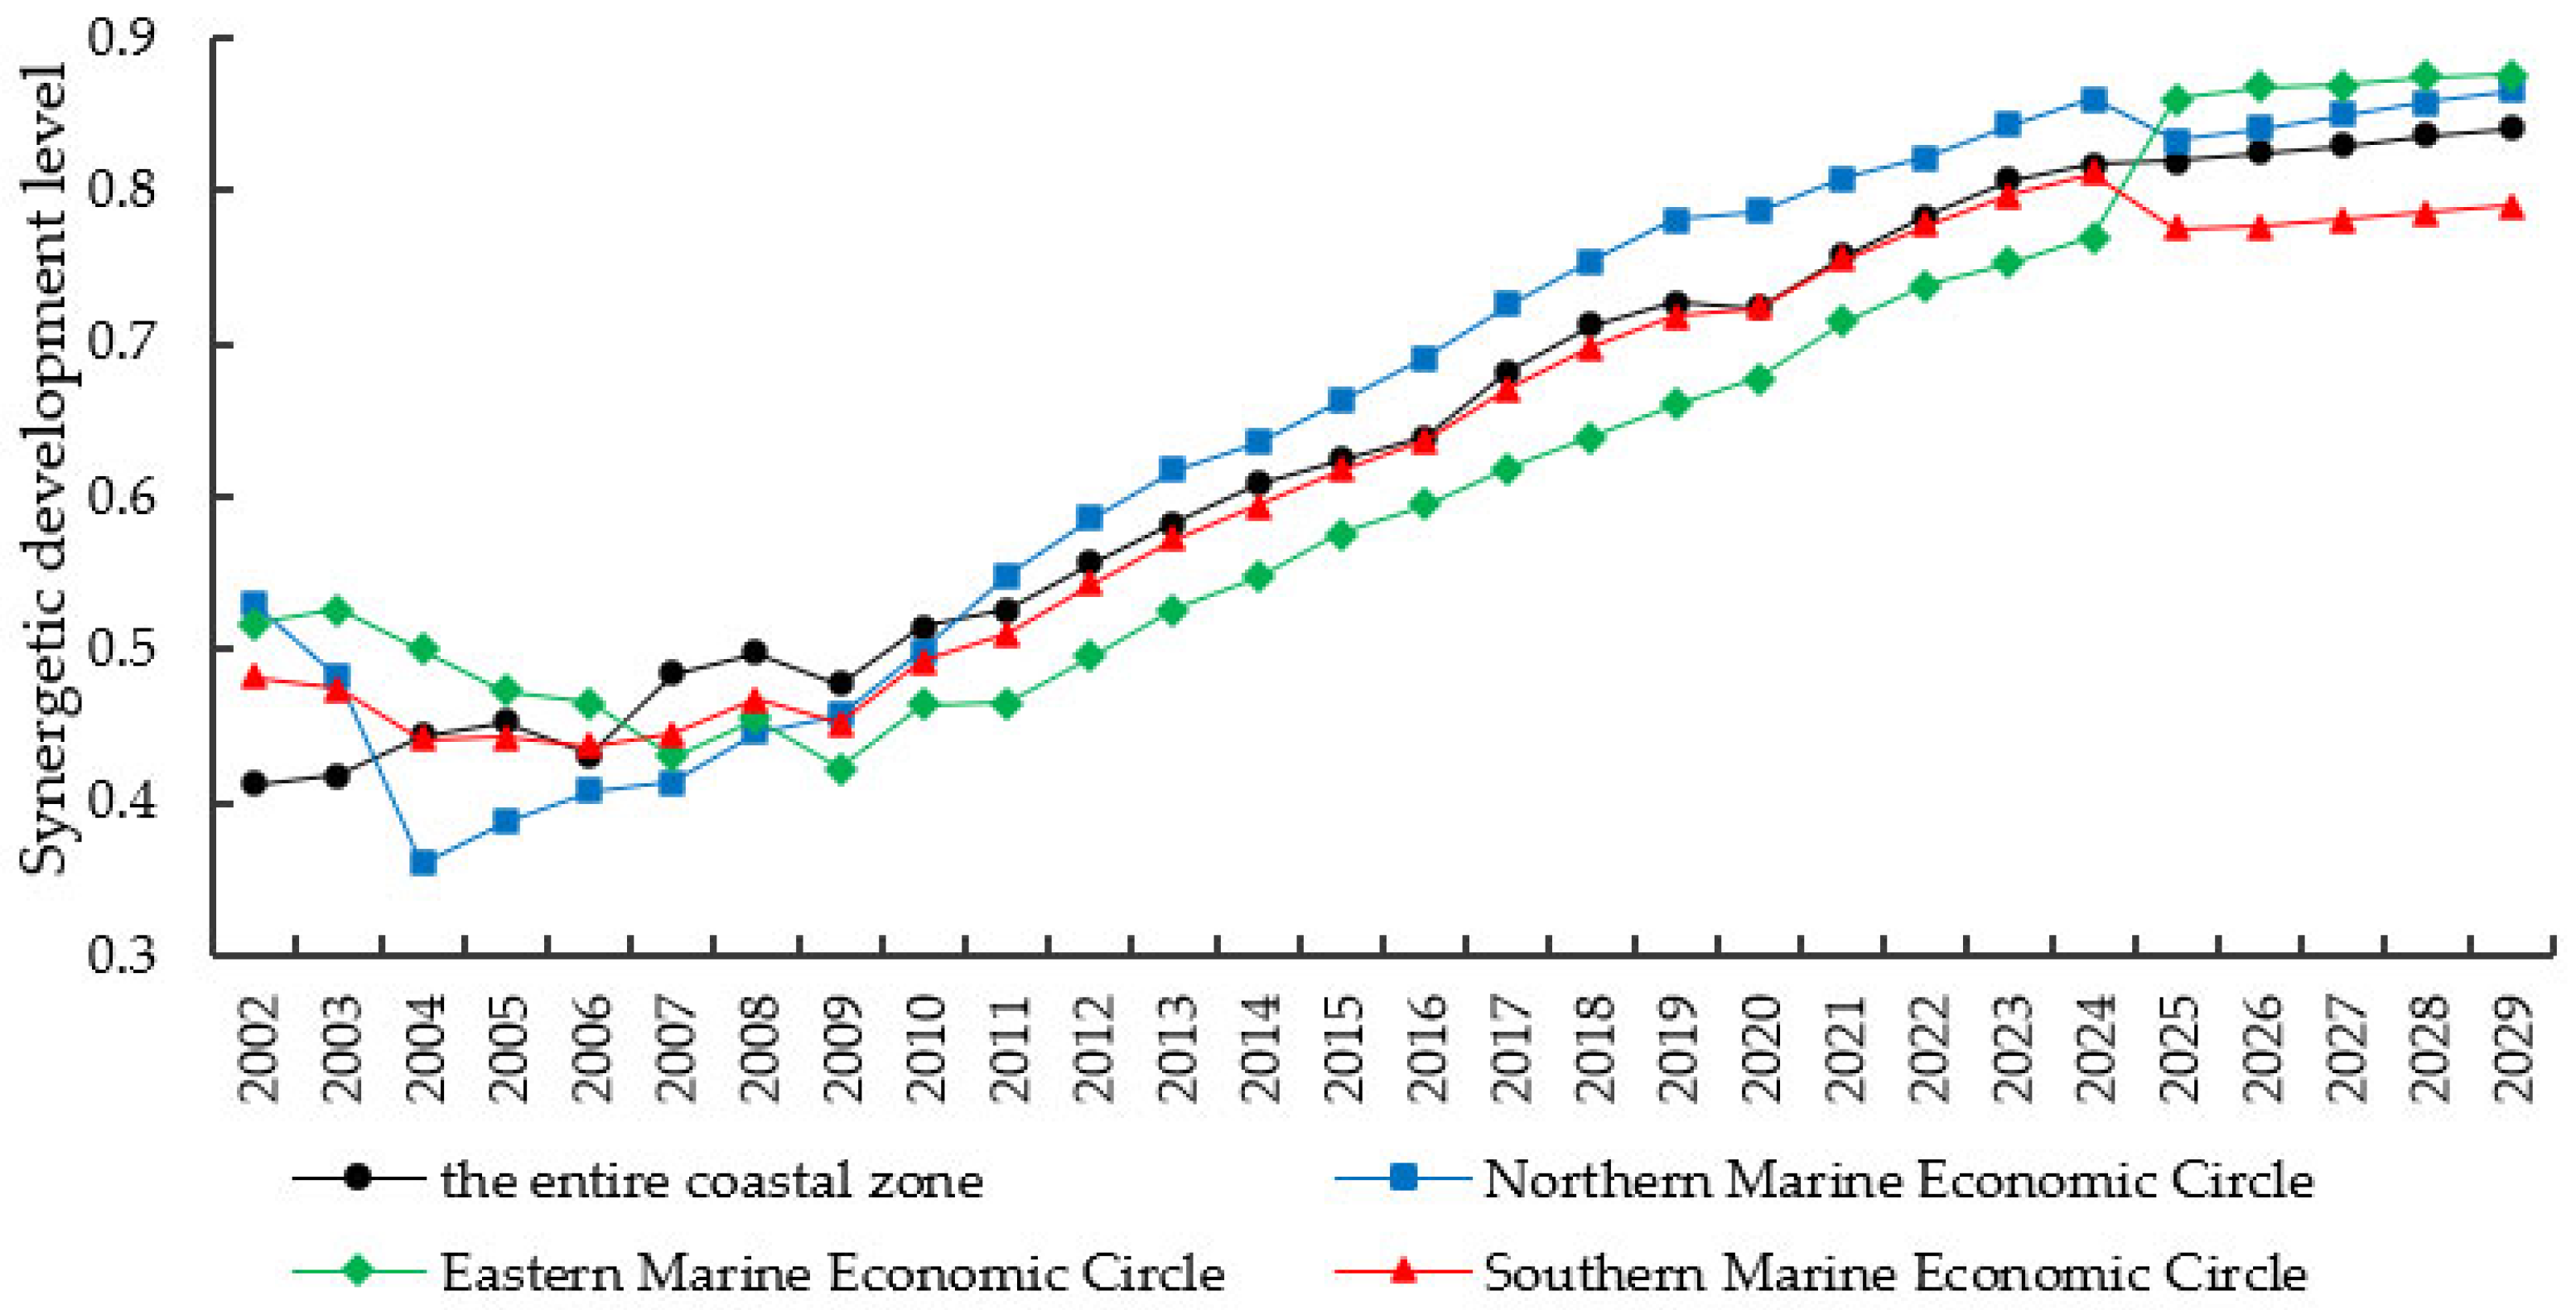
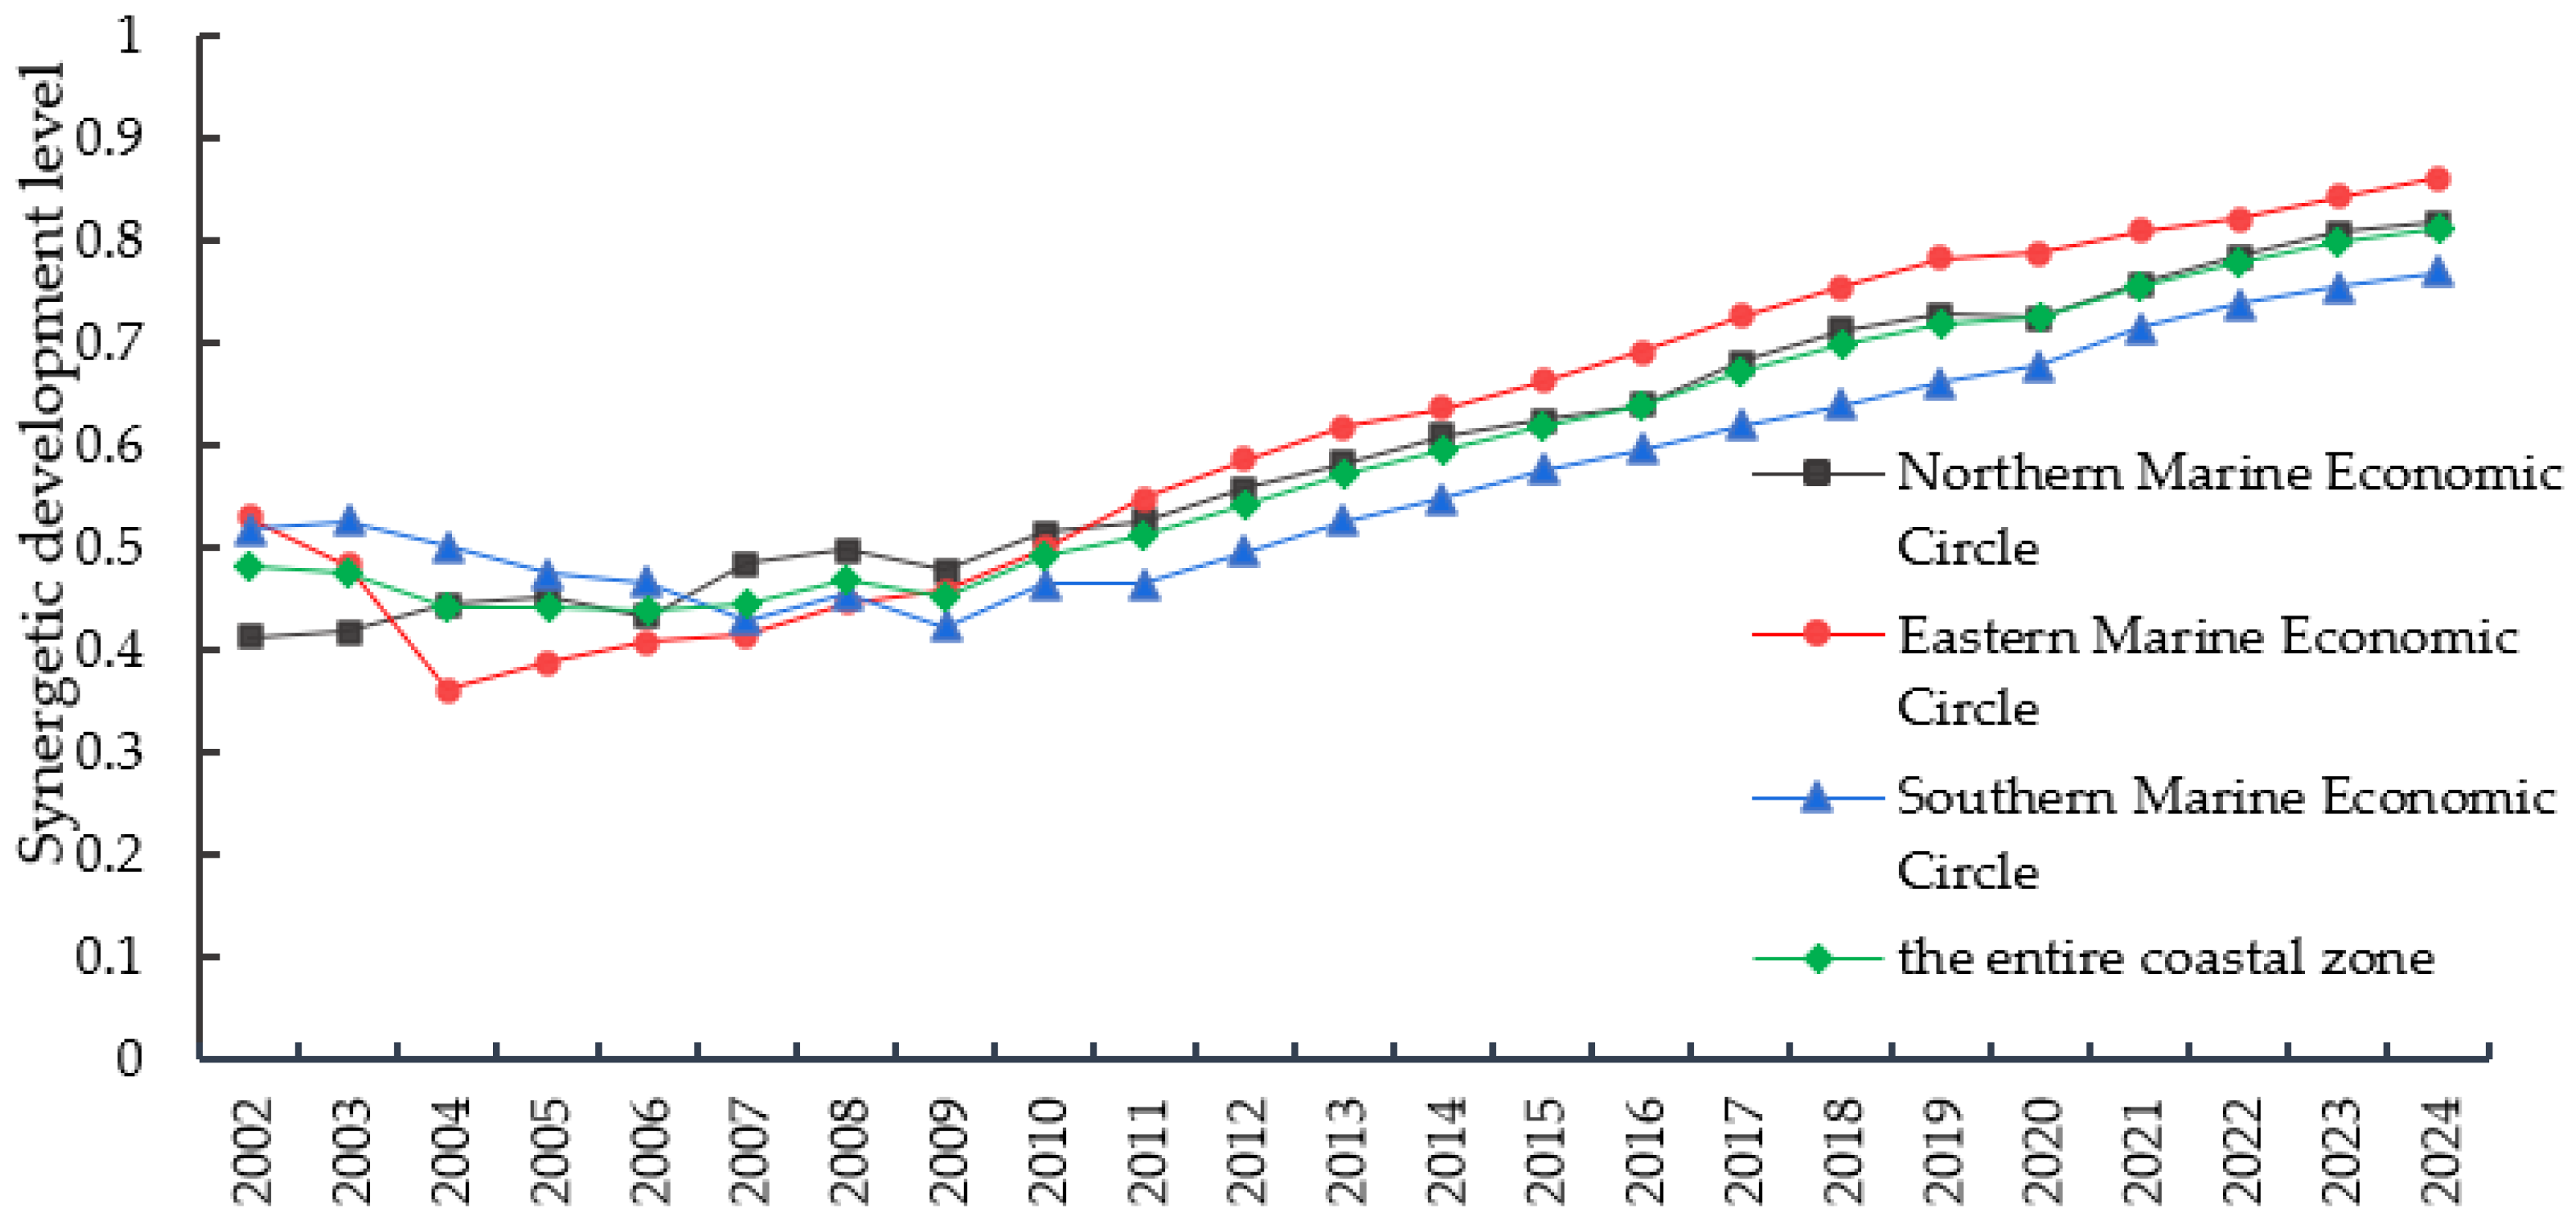
Based on the above regression results, the Haken model is further applied to measure the coordination level between marine economic green development efficiency and inclusive growth of China’s three major marine economic circles from 2002 to 2024. From 2002 to 2024, the coordination relationship between the two subsystems kept improving continuously. The overall coordination level of the entire coastal zone rose from an initial value of 0.48 to 0.81 at the end of the research period, representing a total growth rate of 68.75%.
At the regional level, the coordination levels of all three marine economic circles witnessed year-on-year growth. The Eastern Marine Economic Circle maintained the leading position throughout the sample period, with its coordination level increasing from 0.53 in 2002 to 0.86 in 2024. The Northern Marine Economic Circle followed with steady growth, climbing from 0.41 in 2002 to 0.82 in 2024. The Southern Marine Economic Circle ranked last among the three regions, yet its coordination level still grew from 0.52 in 2002 to 0.77 in 2024. The temporal evolution trend is illustrated in
Figure 6.
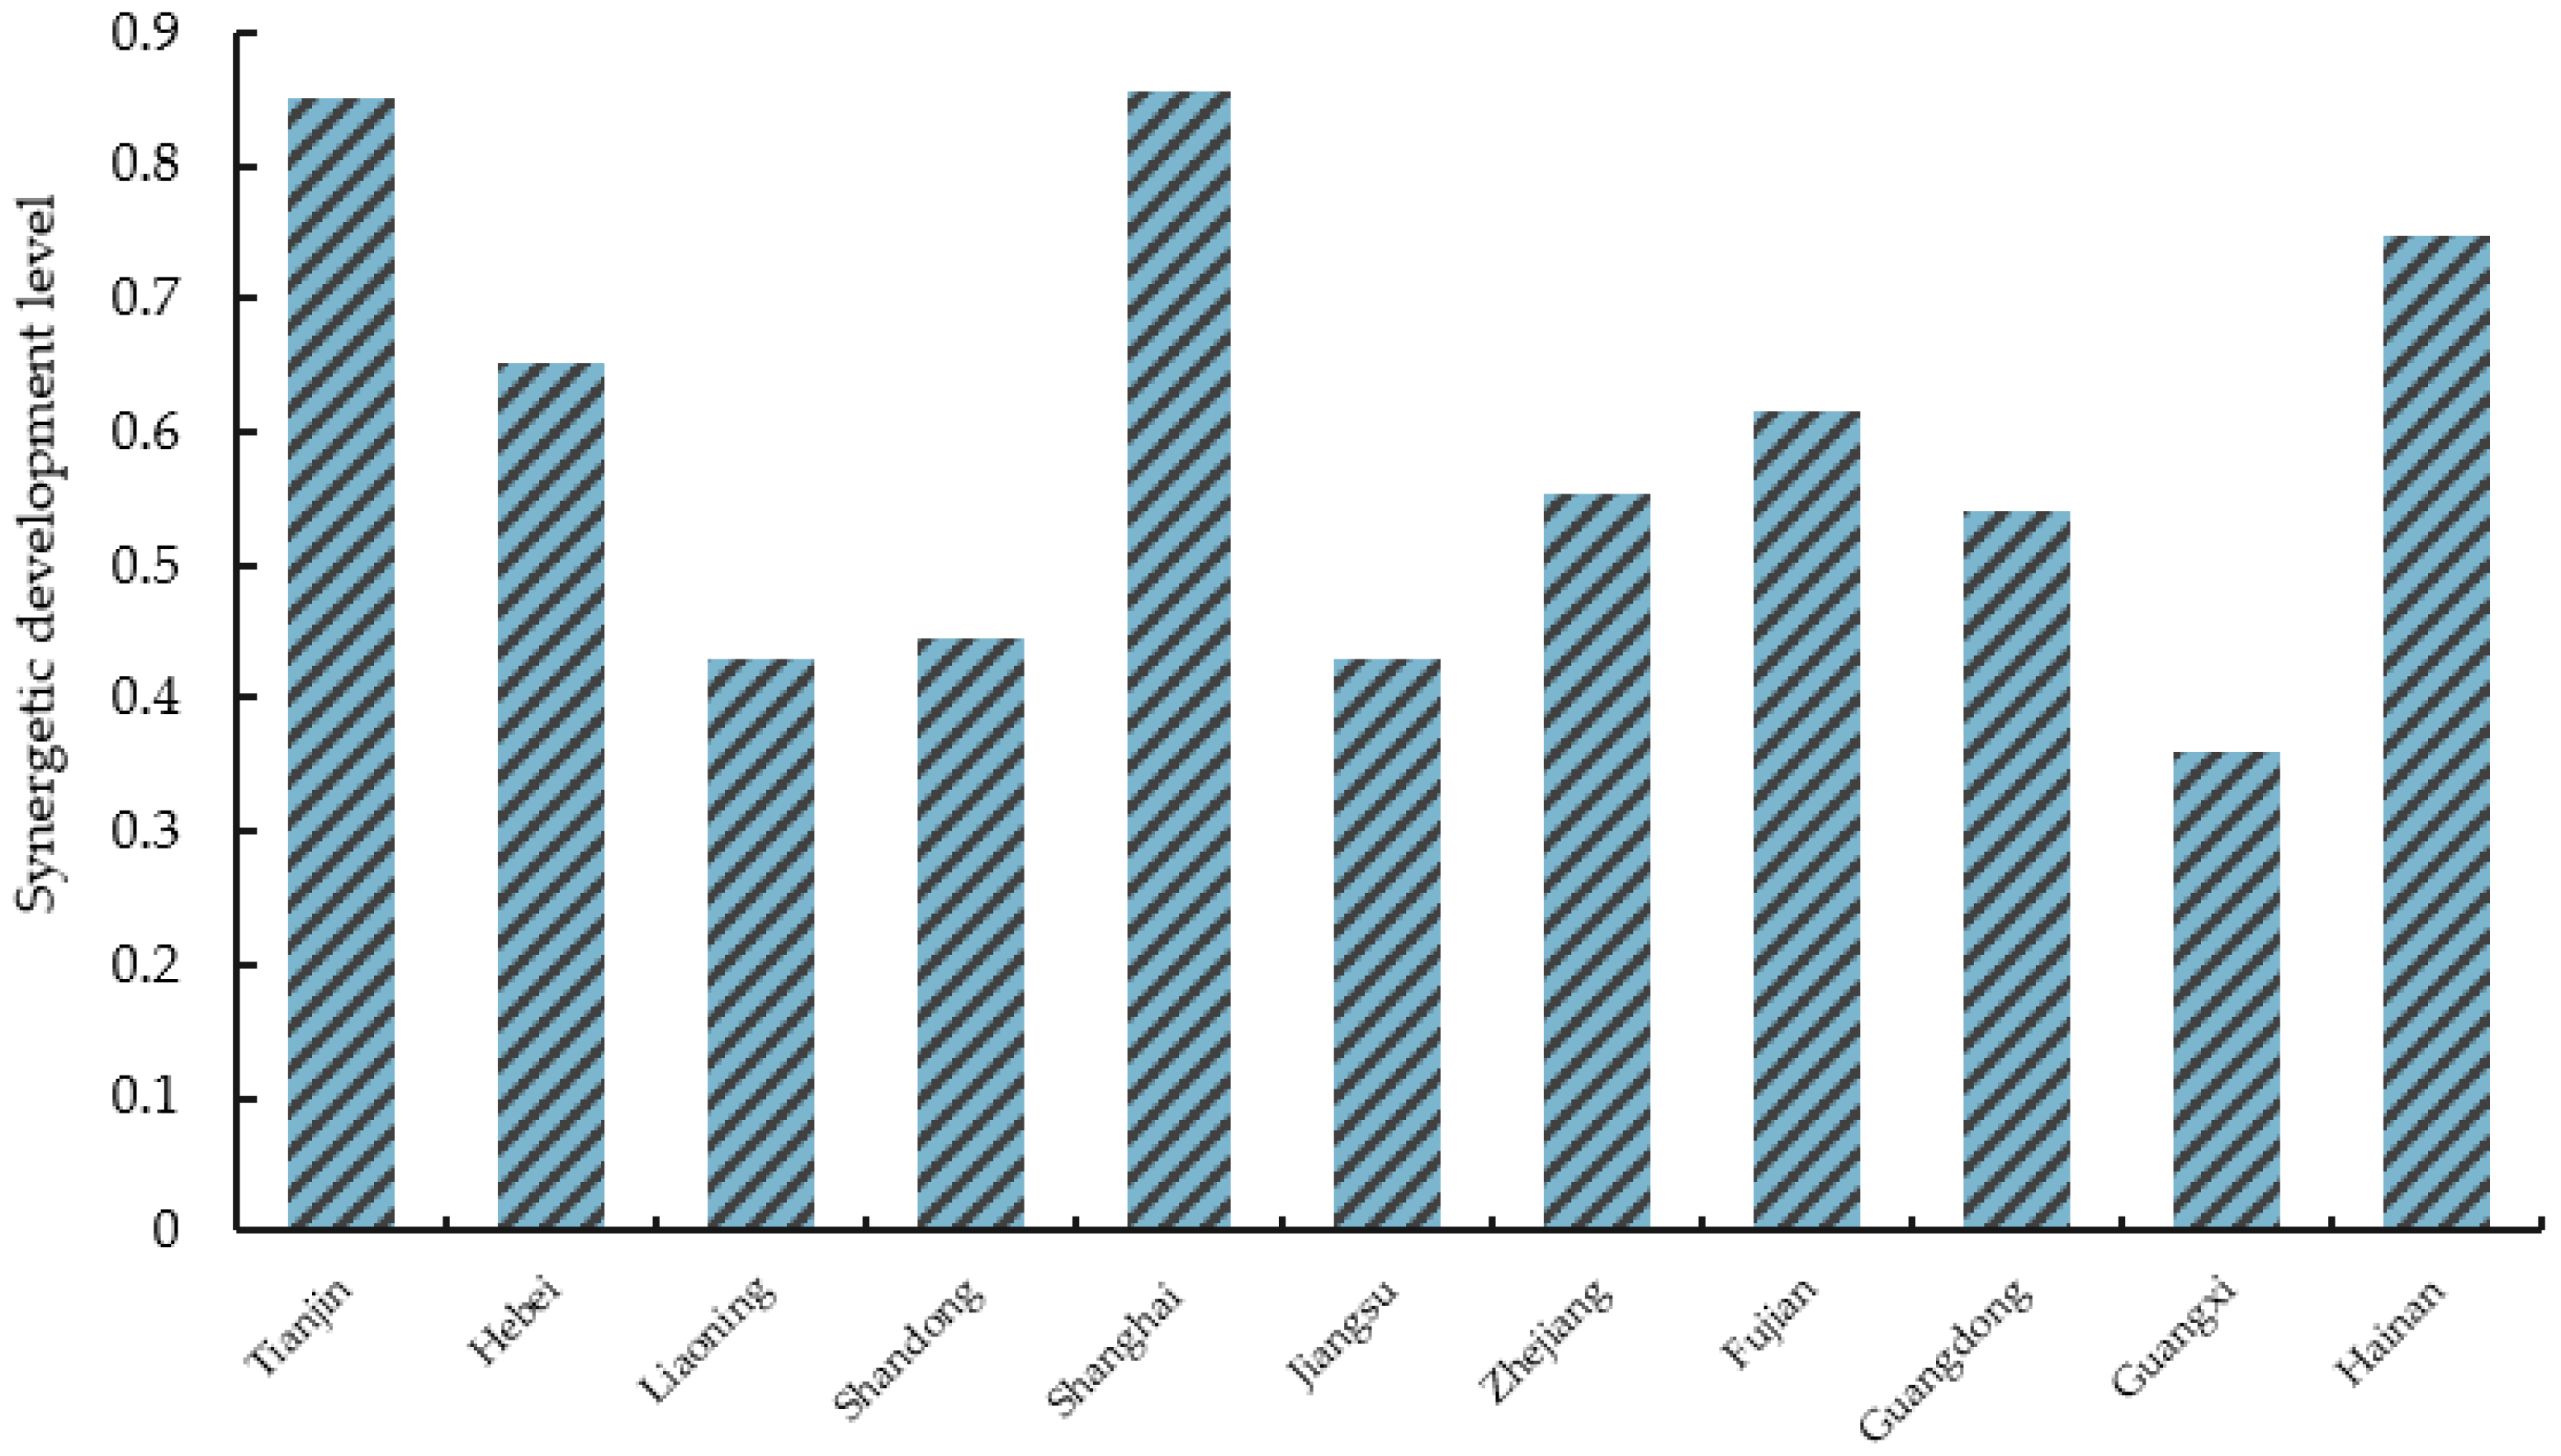
At the provincial level, all regions are classified into three tiers according to their coordination levels. First tier: Shanghai (0.86) and Tianjin (0.85). Endowed with abundant marine scientific, technological and public service resources, these two municipalities achieve the optimal synergistic linkage between the two subsystems. Second tier: Hainan (0.75), Liaoning (0.65) and Fujian (0.62). Relying on ecological aquaculture and coastal tourism, they realize steady coordination between ecological improvement and fishermen’s income growth. Third tier: Zhejiang (0.55), Guangdong (0.54), Shandong (0.45), Jiangsu (0.43), Hebei (0.43) and Guangxi (0.36). Among them, although Zhejiang and Guangdong take the lead in marine economic scale, their ecological governance fails to advance in tandem with economic growth. Shandong and Jiangsu are dominated by traditional resource-dependent industries, resulting in slow progress in green transformation. Hebei faces severe offshore pollution, and its marine-related industries are predominantly heavy chemical industries. Guangxi is constrained by a weak marine economic foundation and relative shortages of public services and marine resources. The provincial-level measurement results are illustrated in
Figure 7.
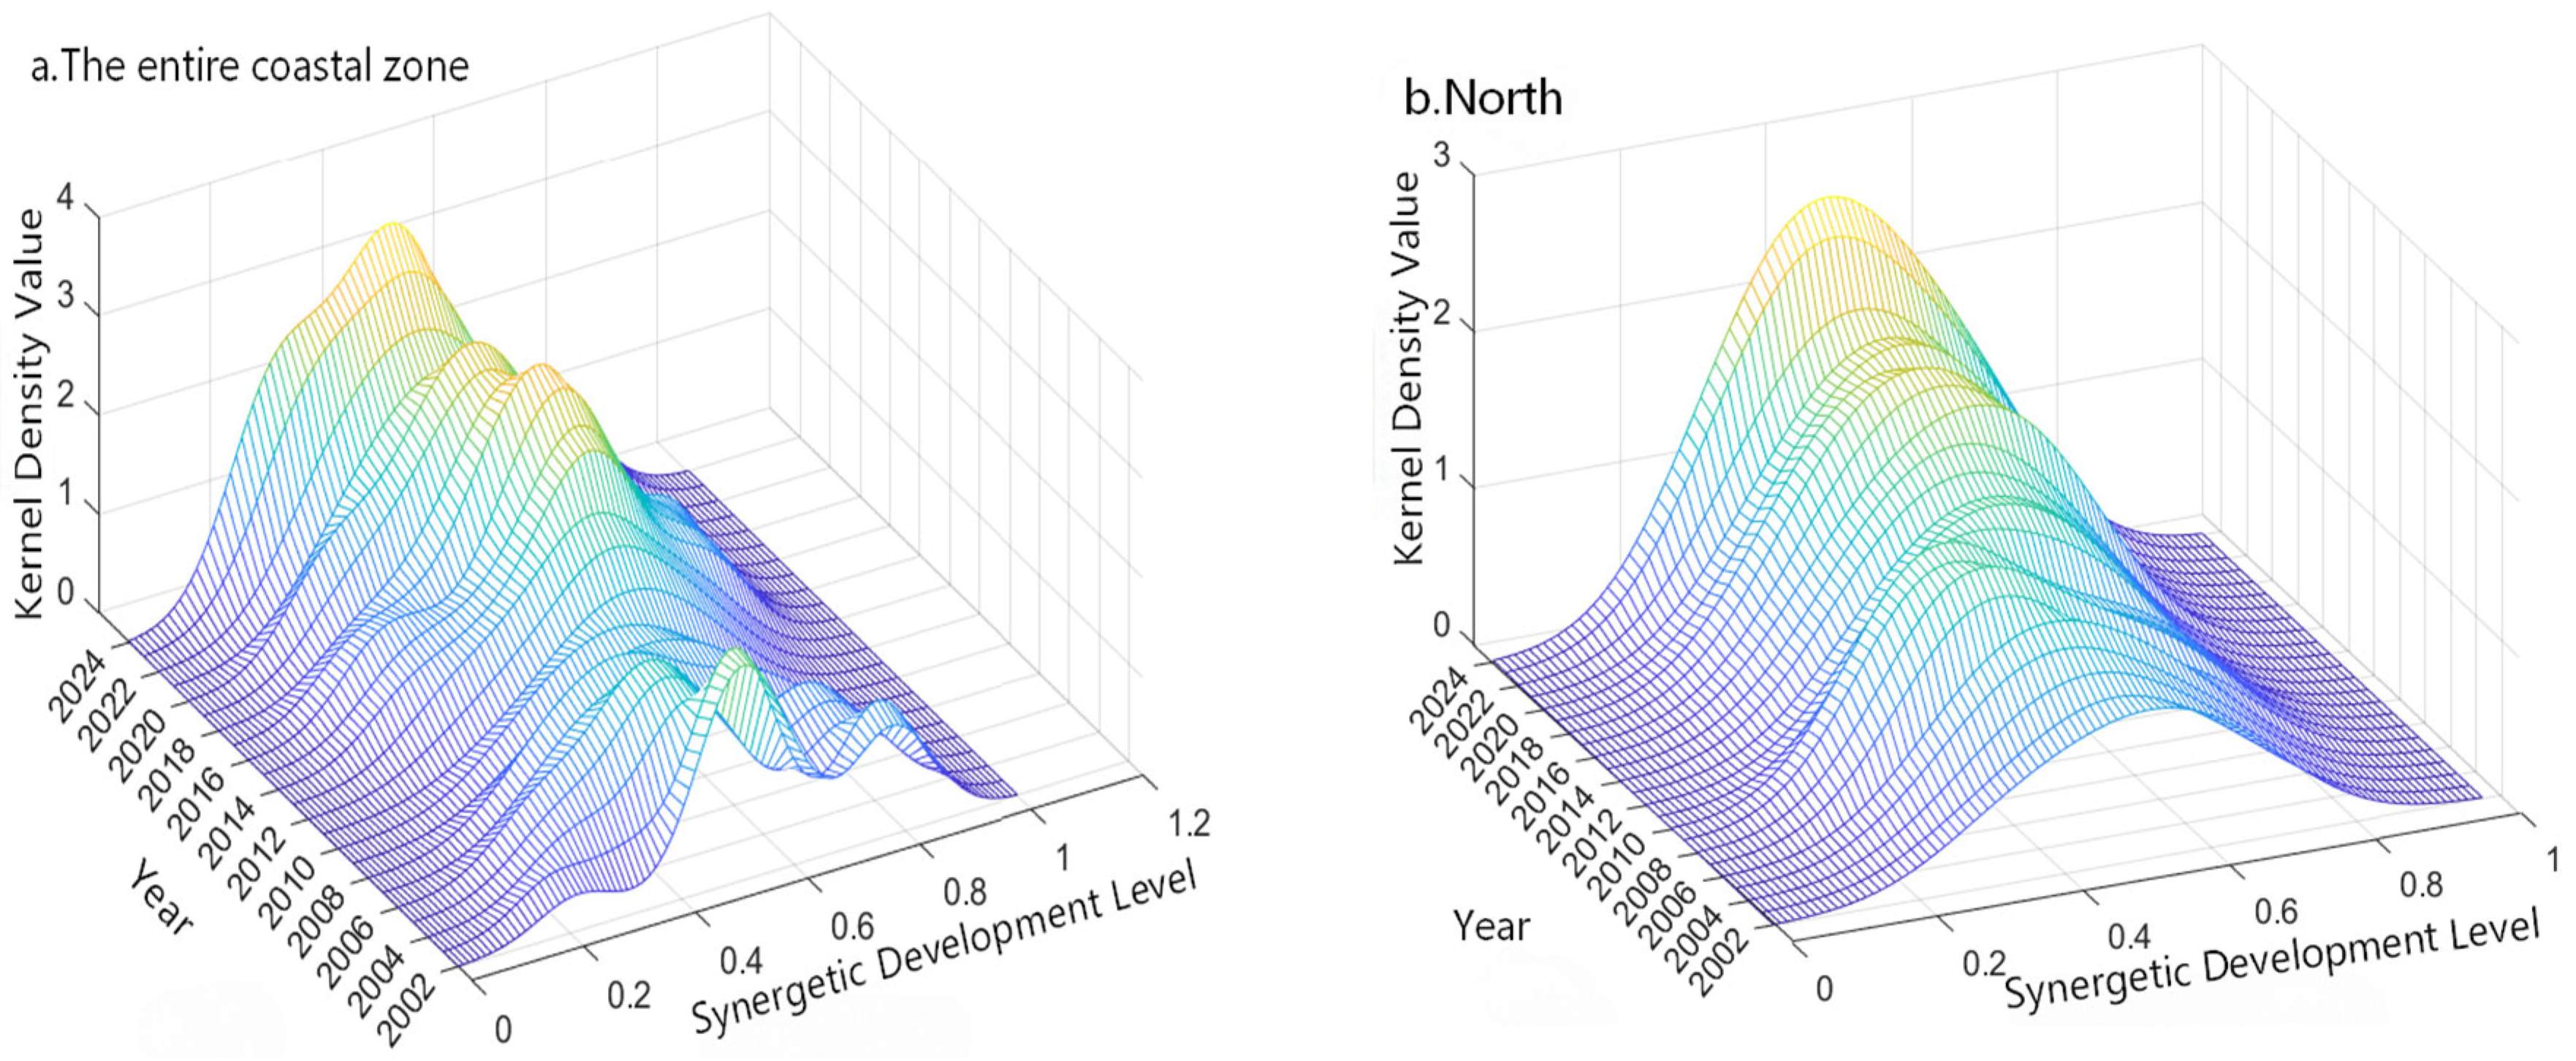
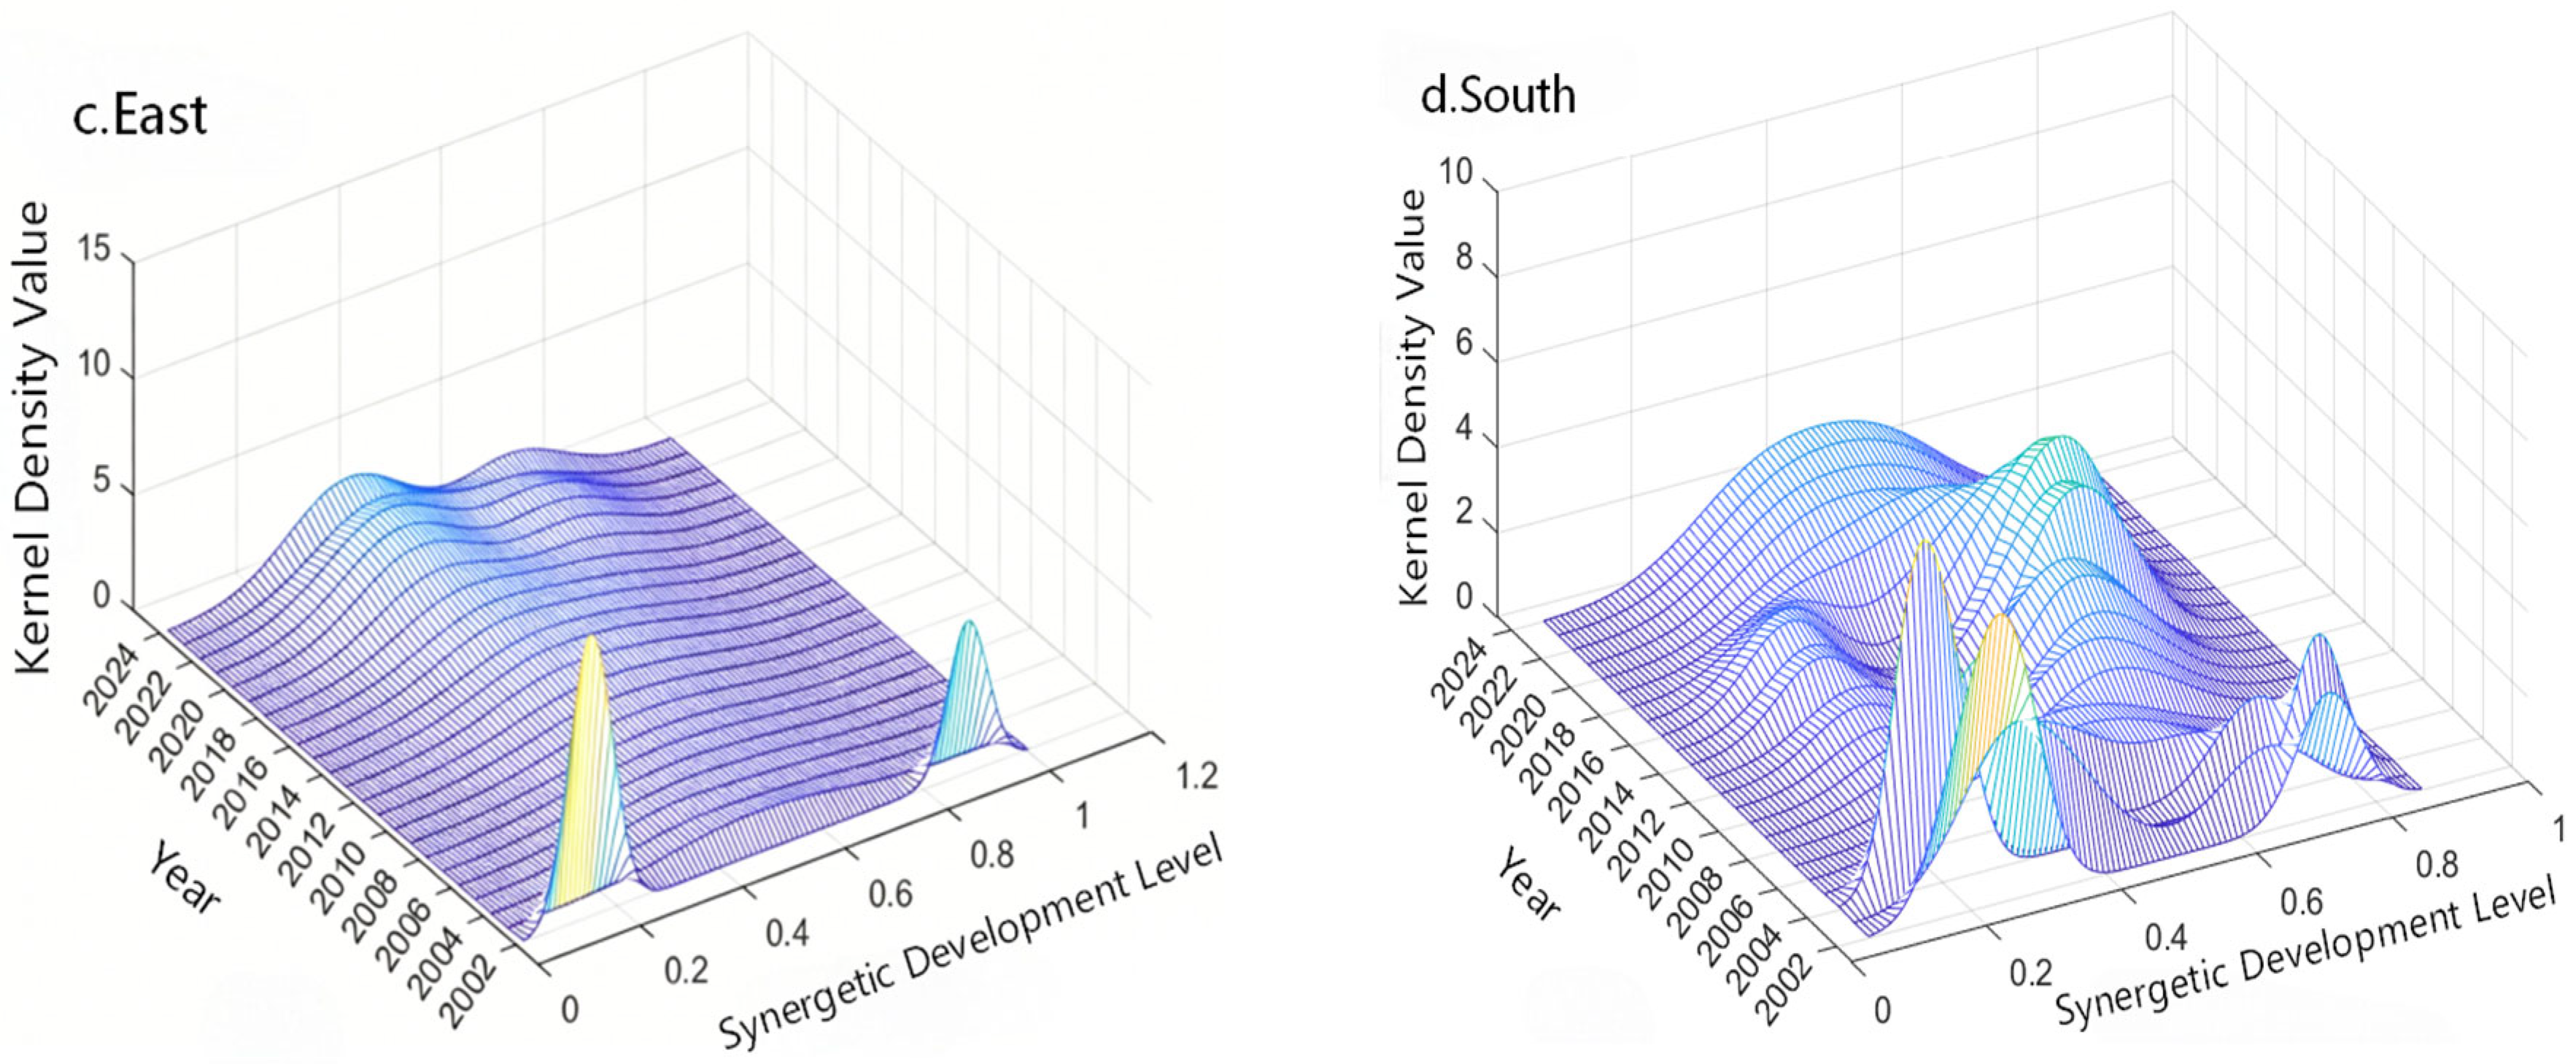
On this basis, kernel density estimation is adopted to analyze the dynamic evolutionary characteristics of the coordination level between marine economic green development efficiency and inclusive growth in each region. The kernel density distribution of the entire coastal zone generally evolves from multi-peak differentiation to single-peak agglomeration. The main peak coordination level shifts continuously rightward from the range of 0.2–0.3 in 2002 to 0.5–0.6 in 2024. The trailing distribution in the low-coordination interval keeps shortening, while the height of the main peak rises from 2.0 in 2002 to 3.0 in 2024 alongside a continuous contraction of distribution width. Such morphological changes indicate that the coordination level across the whole coastal zone increases year by year as a whole. Nevertheless, the unbalanced development stemming from low-level agglomeration in the early stage cannot be eliminated in the short run, and effective policy support remains essential for the whole region to reach high-level coordination.
In terms of the three major marine economic circles, the kernel density surface of the Northern Marine Economic Circle maintains a single-peak evolutionary pattern over the long term. Its main peak stably stays within the coordination level range of 0.4–0.6 and shows a steady upward trend with a continuously narrowed peak interval. The height of the main peak rises from approximately 0.8 in 2002 to around 2.5 in 2024, which demonstrates that the coordination levels of all provincial regions within this circle achieve synchronous improvement.
The Eastern Marine Economic Circle presents a typical bimodal evolutionary feature. In the early stage of development, widely distributed peak clusters form within the coordination level interval of 0.1–0.3, and the separation of high-value and low-value peaks highlights obvious disparities among provinces and municipalities. In the later stage, the low-value peak fades away gradually, and production factors keep converging in the coordination level range of 0.4–0.6. This indicates a stark tiered gap between regions at high and low development levels in the initial phase; as ecological governance and fishery livelihood-benefiting policies are implemented, intra-regional development gaps narrow progressively.
The Southern Marine Economic Circle evolves from an early scattered multi-peak divergent pattern centered on the coordination level of 0.2 into a single-peak structure concentrated around 0.4–0.5. The multi-polar differentiation pattern fades as provinces with low coordination levels keep catching up. The kernel density evolutionary characteristics are illustrated in
Figure 8.
4.3.3. Regional Disparities and Source Decomposition
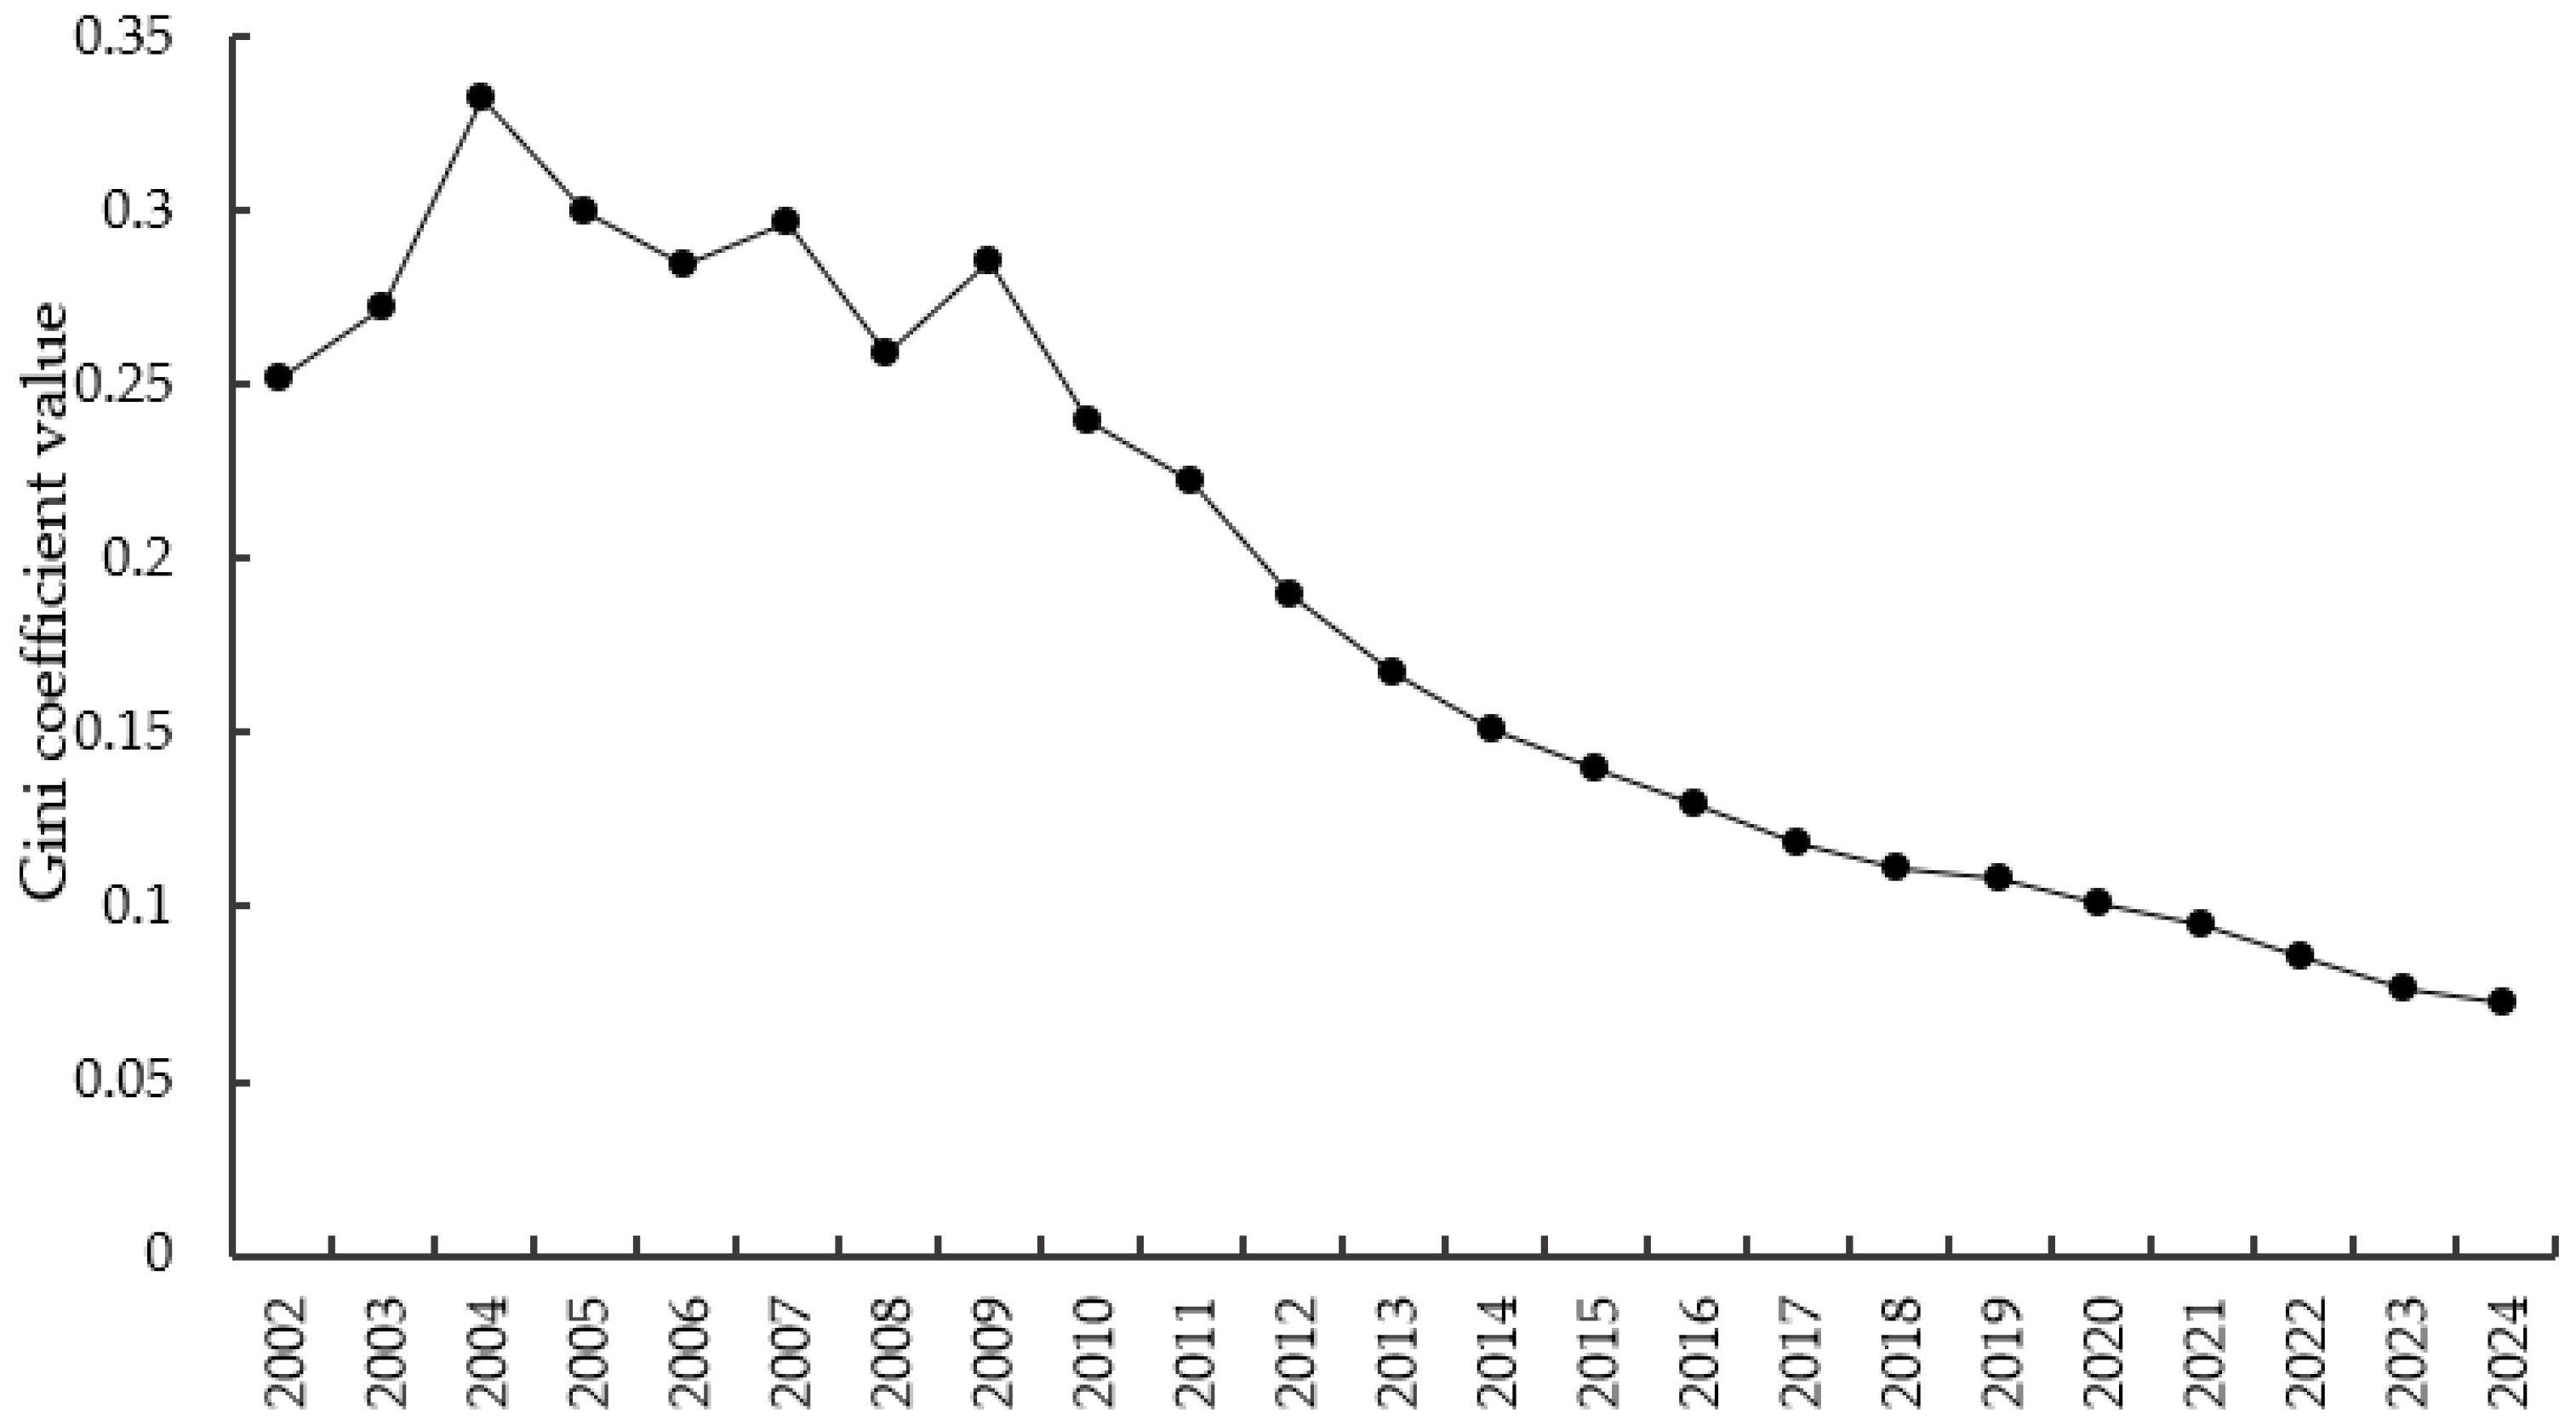
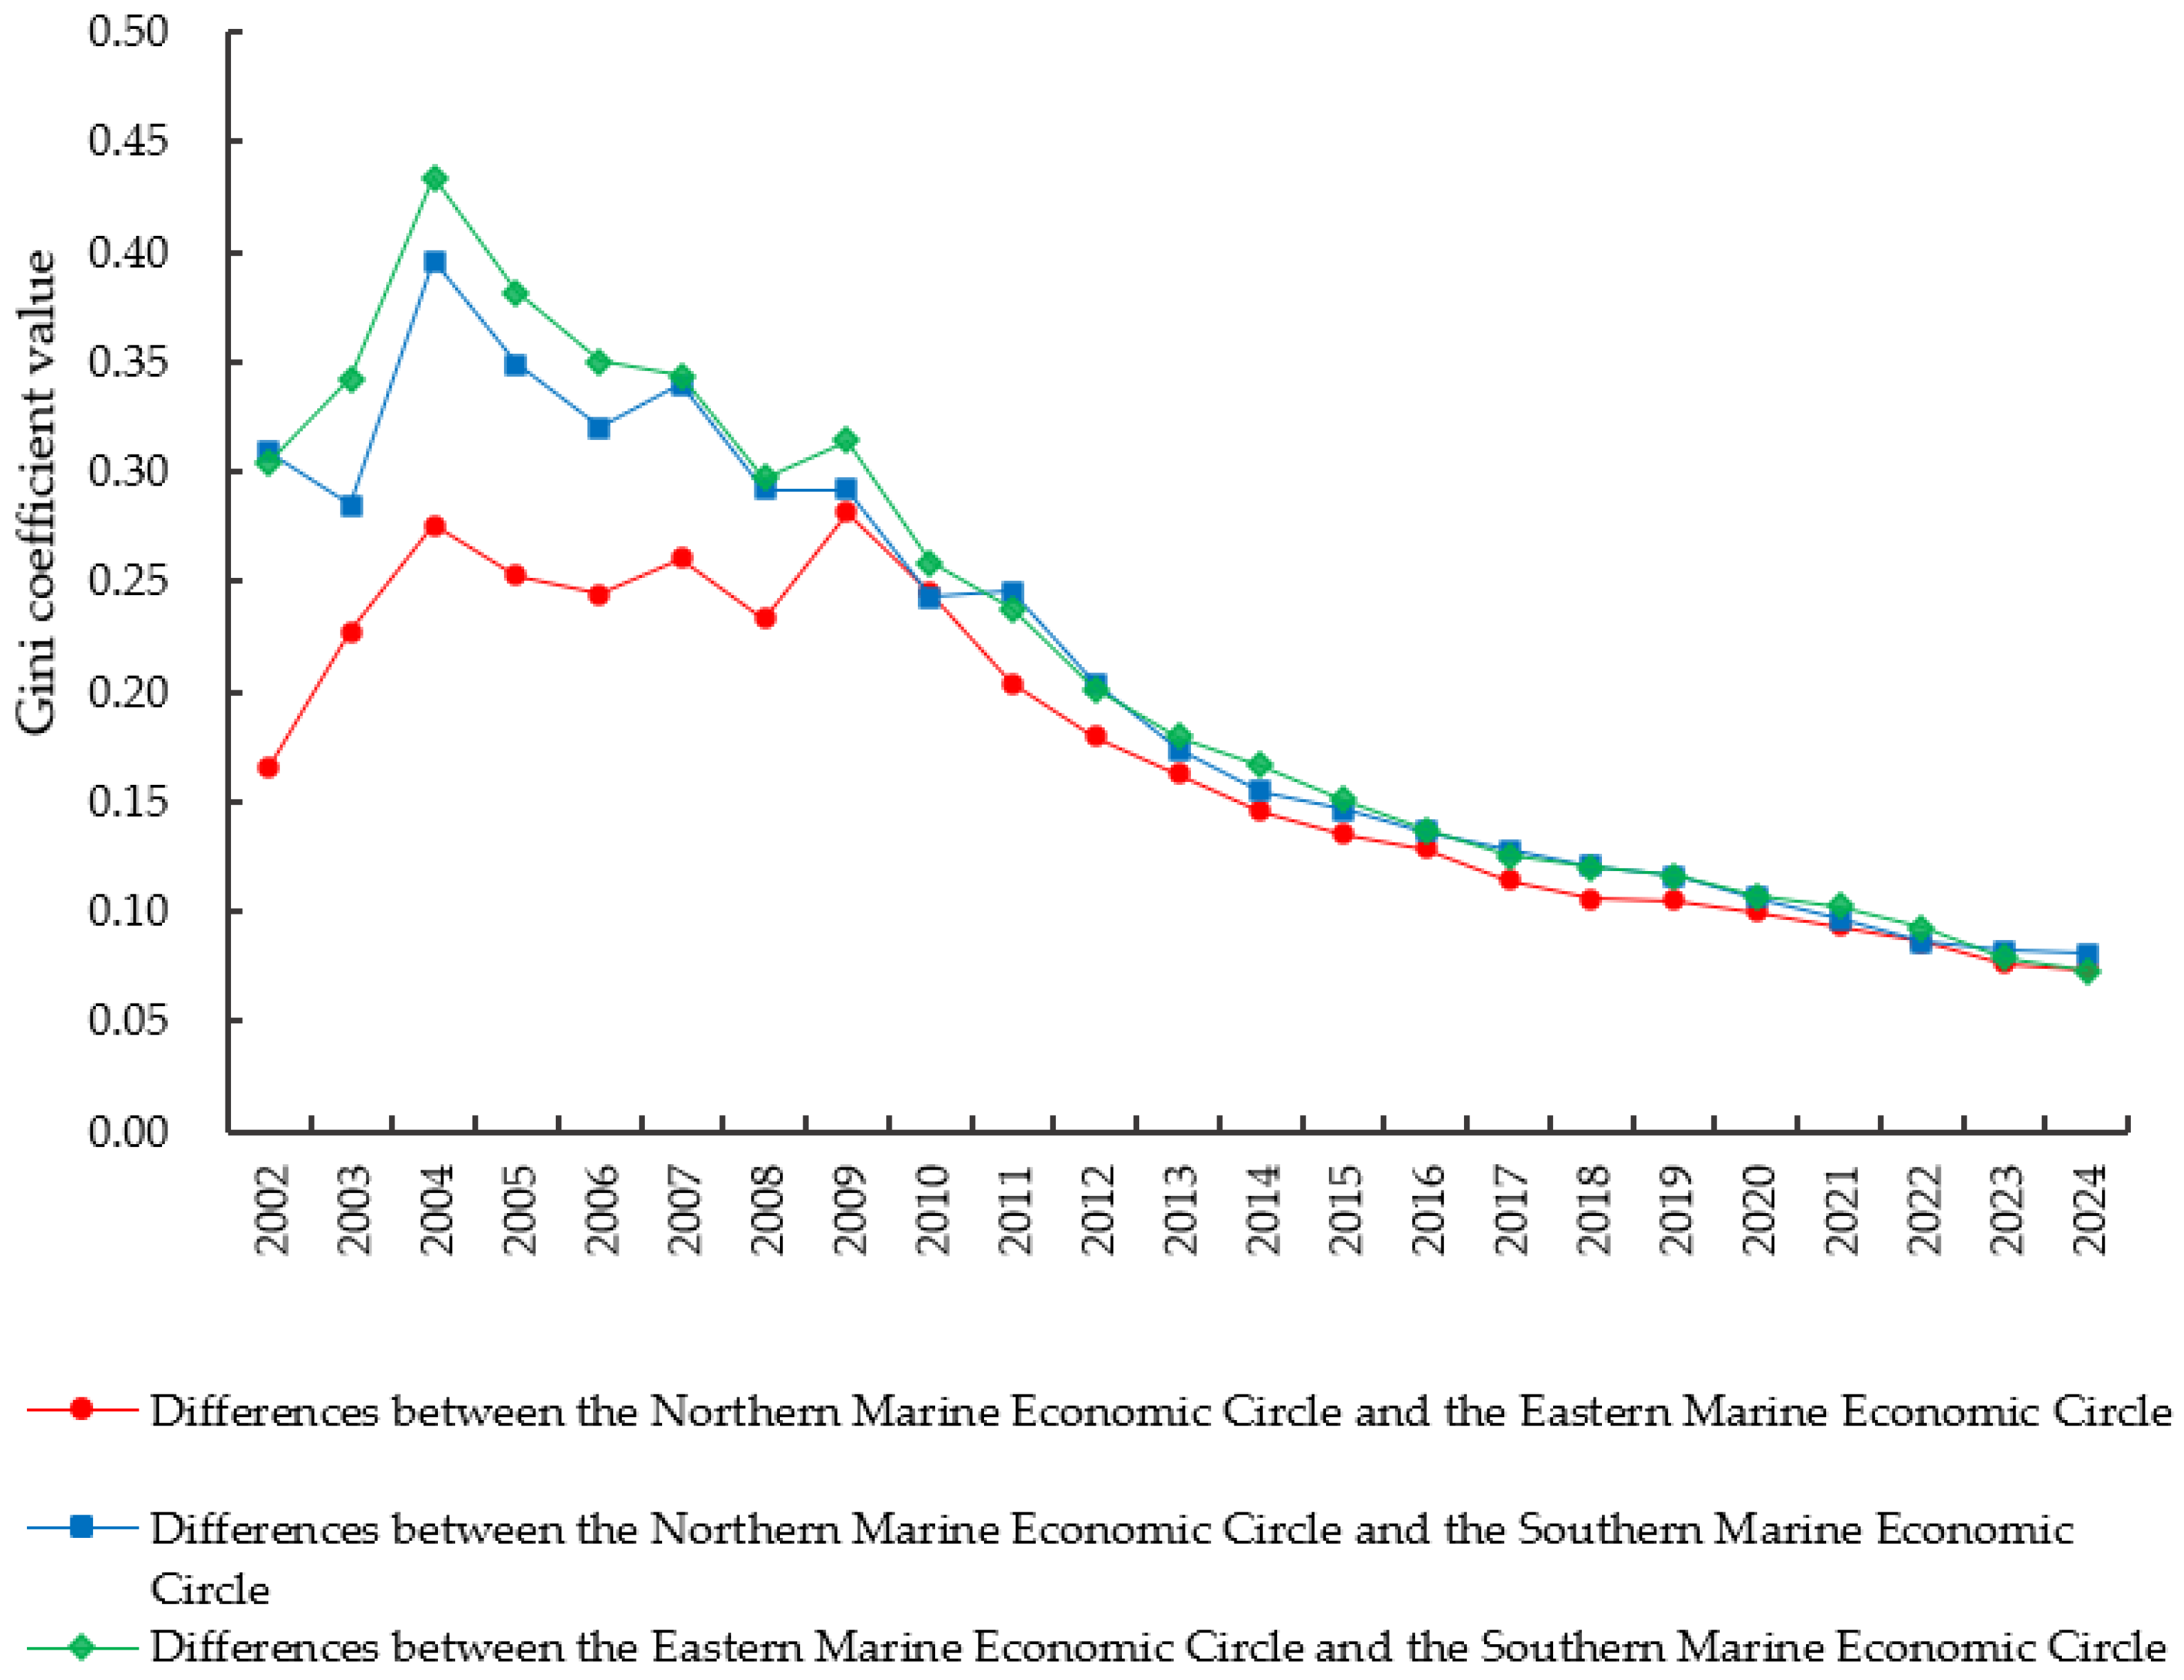
The Dagum Gini coefficient is employed to measure the regional disparities in the coordination level between marine economic green development efficiency and inclusive growth across China. The corresponding results are illustrated in the figure. From 2002 to 2024, the overall disparities of coordination levels among China’s three major marine economic circles exhibit a remarkable convergence trend. The Gini coefficient drops from 0.252 to 0.072, the inter-regional dispersion degree keeps declining, and the balance of coordination levels improves steadily. The temporal evolution trend is illustrated in
Figure 9.
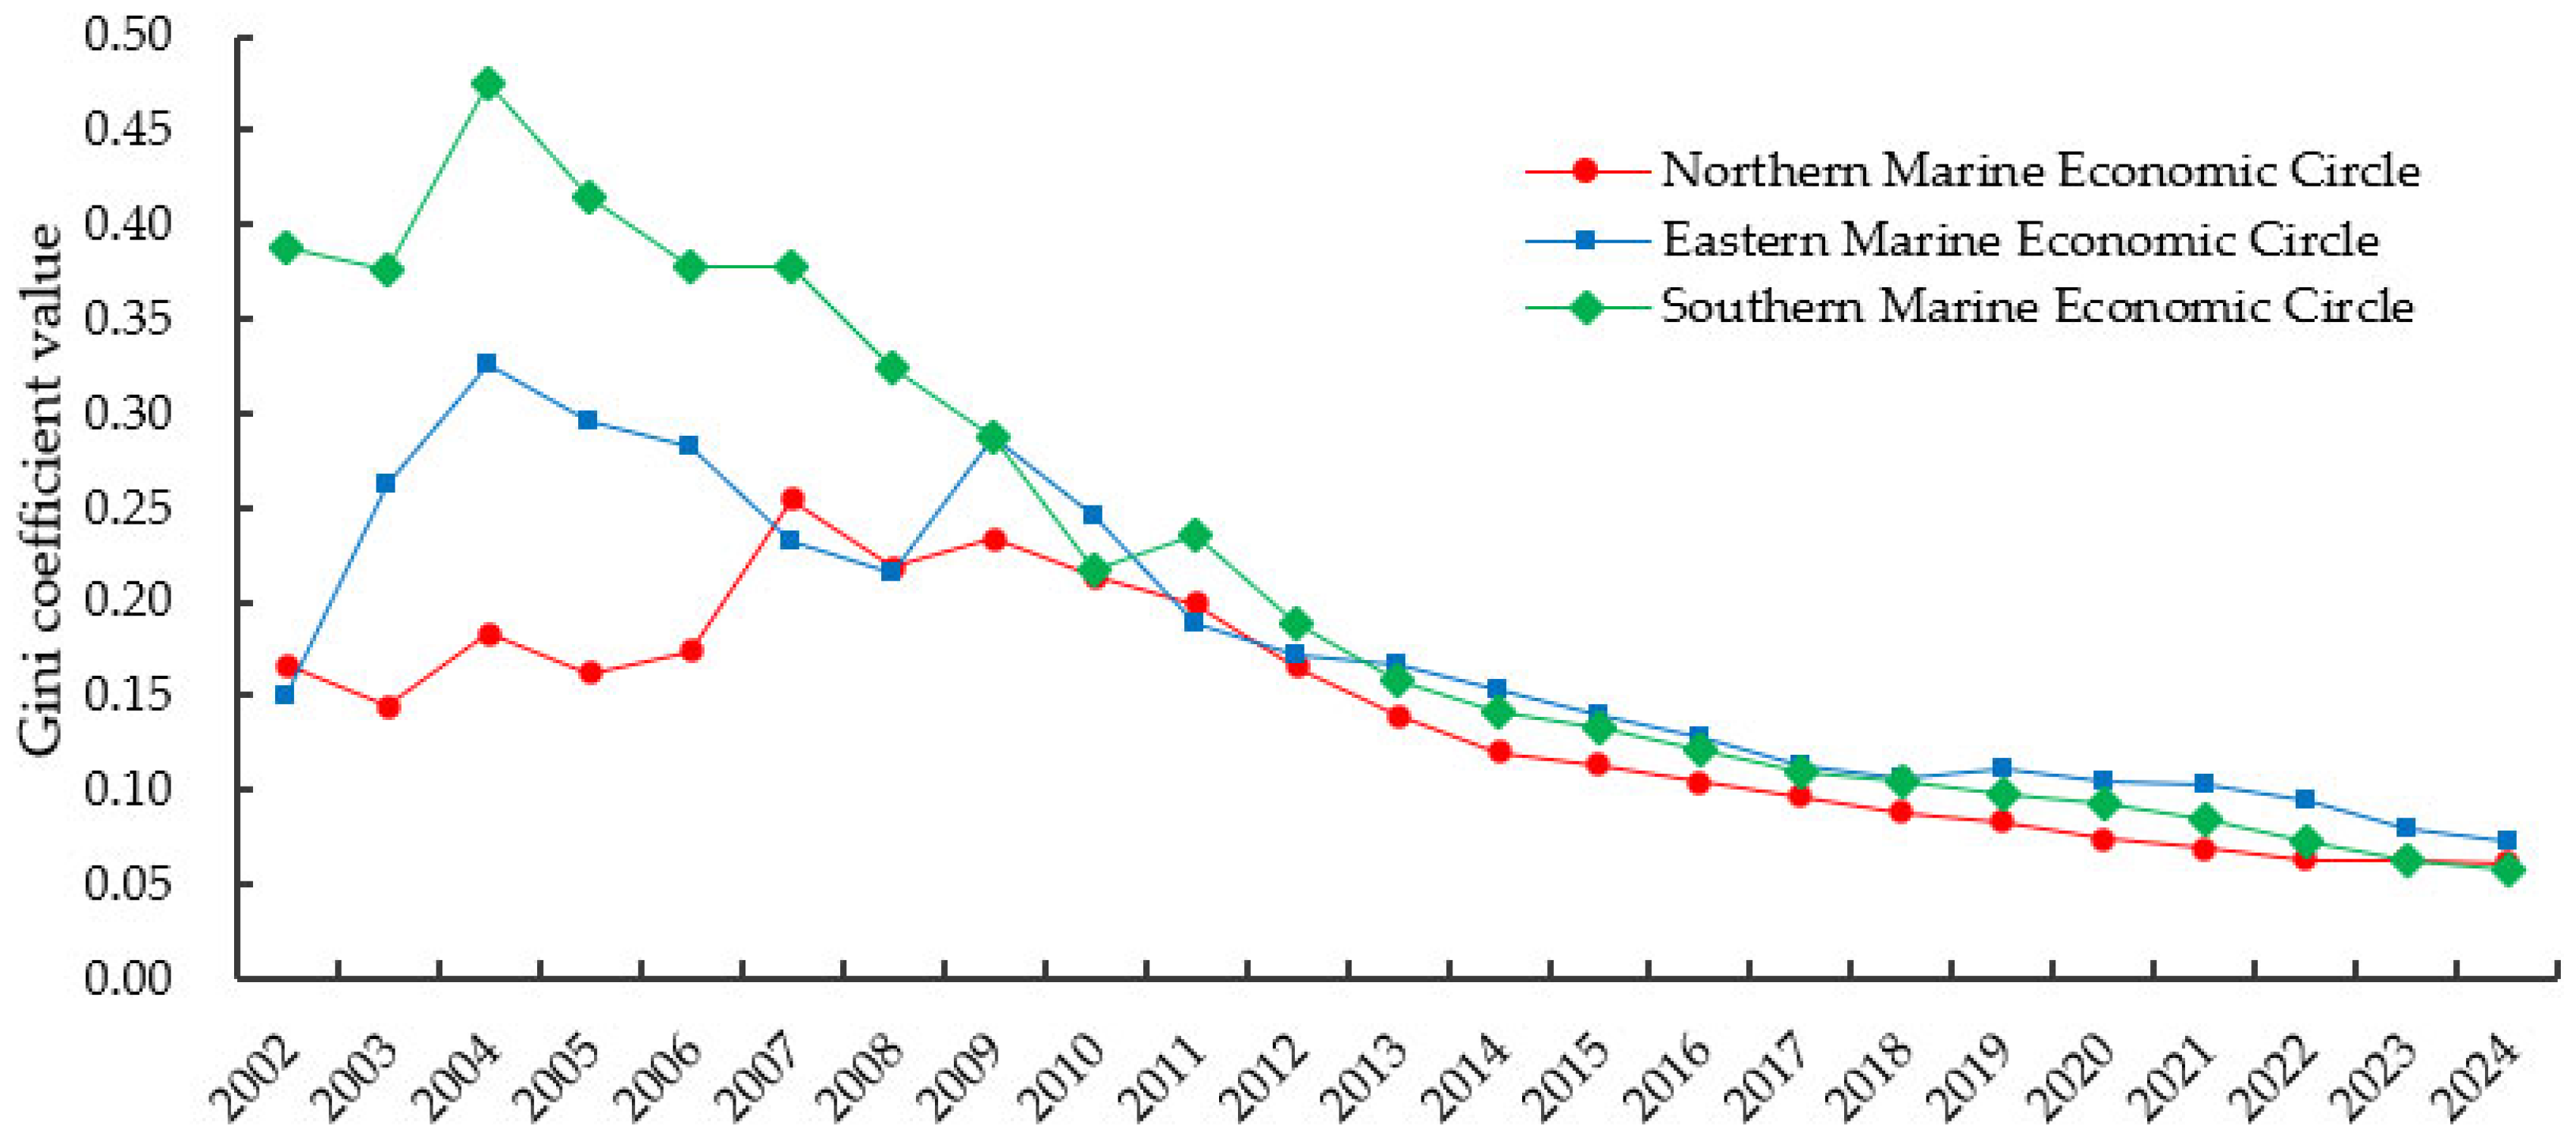
In terms of intra-regional disparities, the Dagum Gini coefficients of the three major marine economic circles all show an overall downward trend. Nevertheless, the average intra-regional Gini coefficient of the Southern Marine Economic Circle stands at 0.213, markedly higher than those of the Northern (0.139) and Eastern (0.175) Marine Economic Circles, which implies more prominent developmental differentiation among cities within the southern region. The temporal evolution trend is illustrated in
Figure 10.
In terms of inter-regional disparities, the gap between the Southern and Eastern Marine Economic Circles is the largest, with an average value of 0.214, followed by the gap between the Southern and Northern Marine Economic Circles (average value = 0.205). The disparity between the Northern and Eastern Marine Economic Circles is relatively minor, with an average of 0.169. This reveals that the prominent gaps in the coordinated evolutionary process mainly exist between the Southern Marine Economic Circle and the other two marine economic circles. The temporal evolution trend is illustrated in
Figure 11.
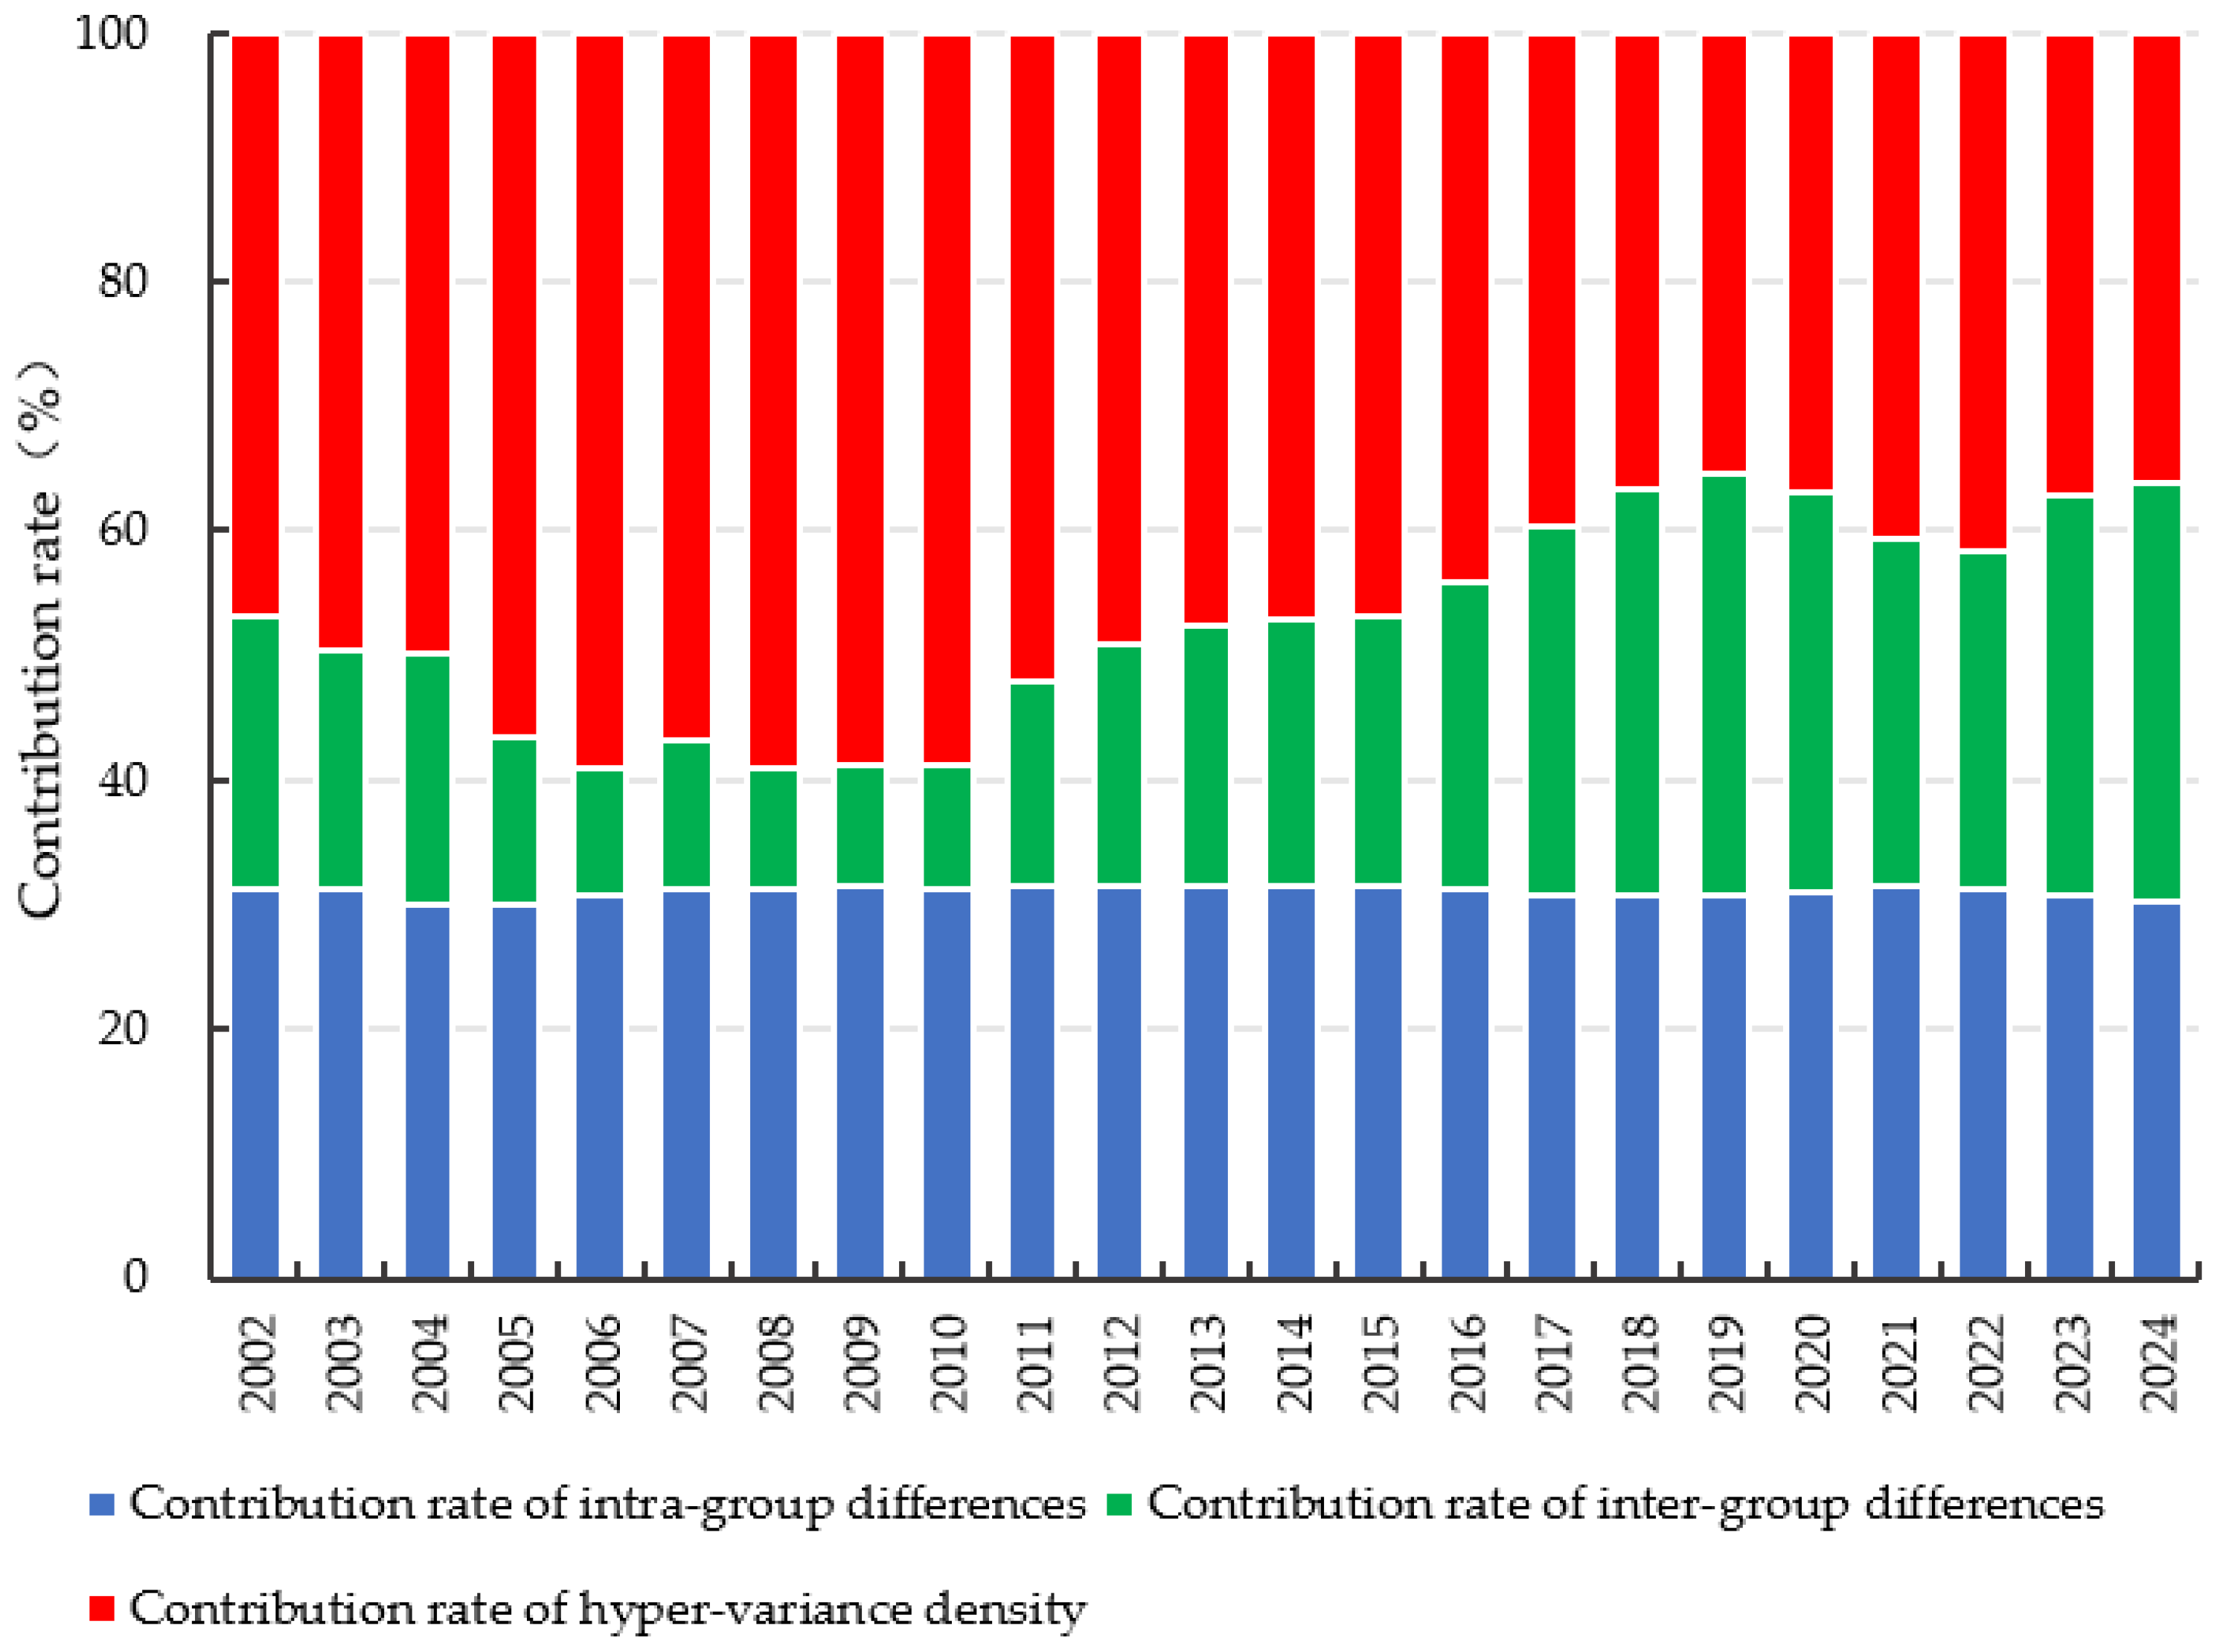
In terms of disparity sources, hypervariable density contributes the largest share (47.22%), far exceeding intra-regional (31.05%) and inter-regional (21.73%) disparities. This reflects intra-circle reversals: each circle contains both high- and low-performing provinces, and economic scale does not align with synergy performance. These reversals are further amplified by divergent coastal-inland characteristics within the same circle: provinces with longer coastlines and deeper port integration (Guangdong, Shandong) tend to prioritize scale-driven growth, while provinces with more constrained marine space or distinct resource endowments (Hainan’s tourism, Tianjin’s municipal-scale governance) have adopted niche strategies that align more naturally with green-inclusive synergy. Such intra-circle heterogeneity generates extensive cross-distribution overlap across circles, driving up transvariation density. Moreover, intra-regional disparities remain stable around 30%, while inter-regional gaps have widened in the later period. The contribution rates of the Gini coefficient decomposition items are illustrated in
Figure 12.
Policy implications: the dominance of hypervariable density suggests inequality is primarily driven by imbalances within each circle, not a simple north–south divide. This calls for: (1) at the provincial level, lagging provinces pursue intra-circle catch-up, learning from frontrunners in the same circle; (2) at the regional level, cross-circle pairing mechanisms to transfer green technologies and inclusive policies from the Eastern Circle to lagging provinces in the Southern and Northern Circles.
4.4. Forecast of Coordination Level Between Marine Economic Green Development Efficiency and Inclusive Growth
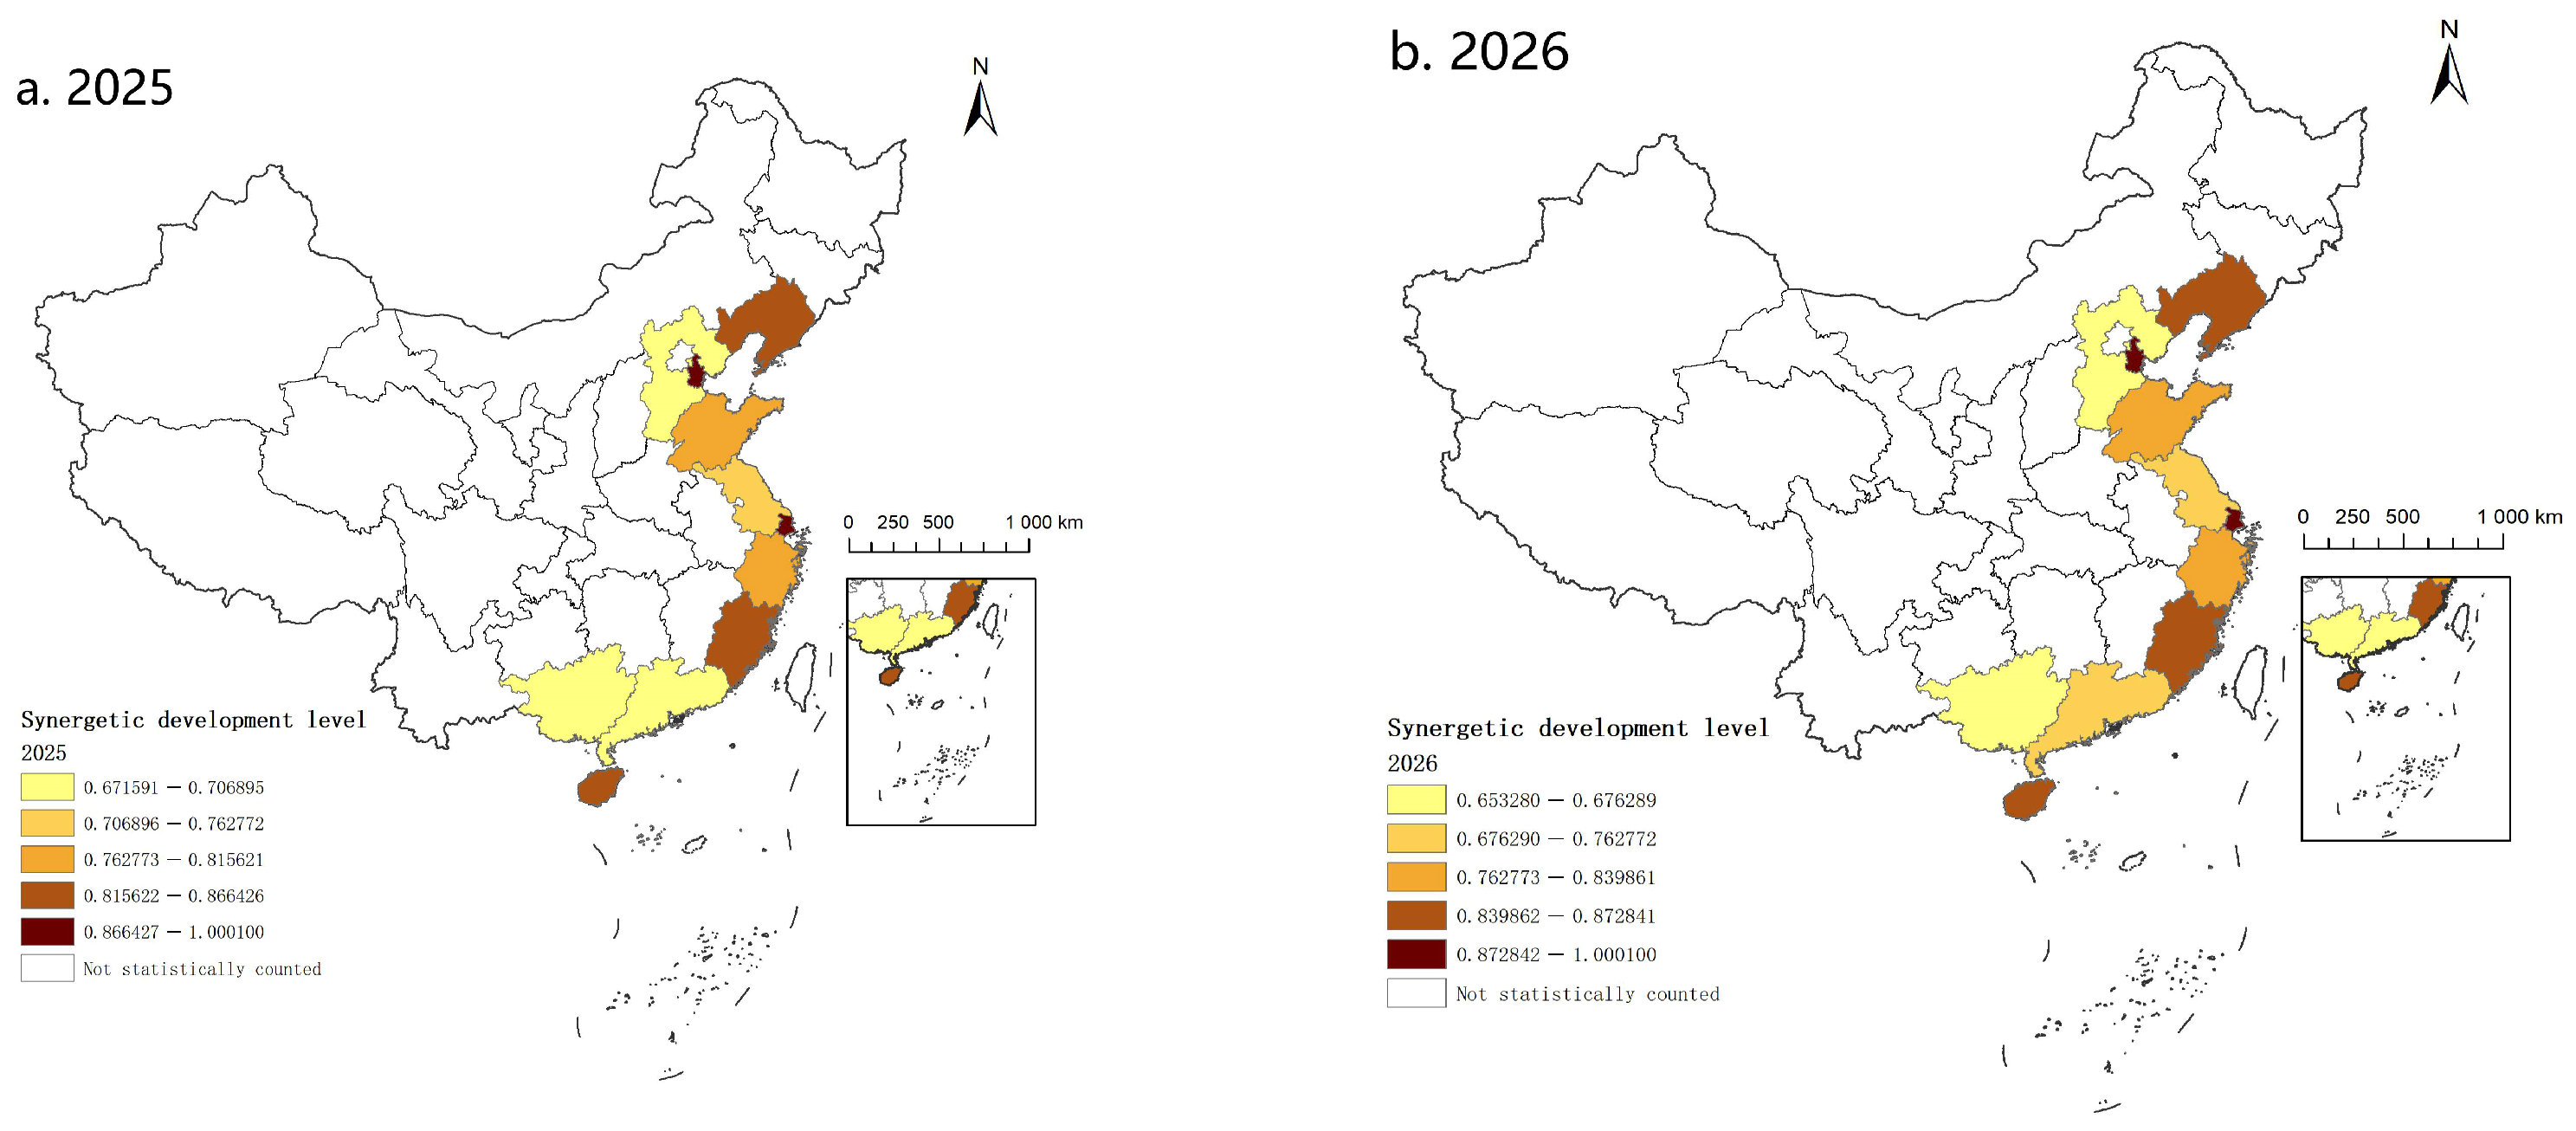
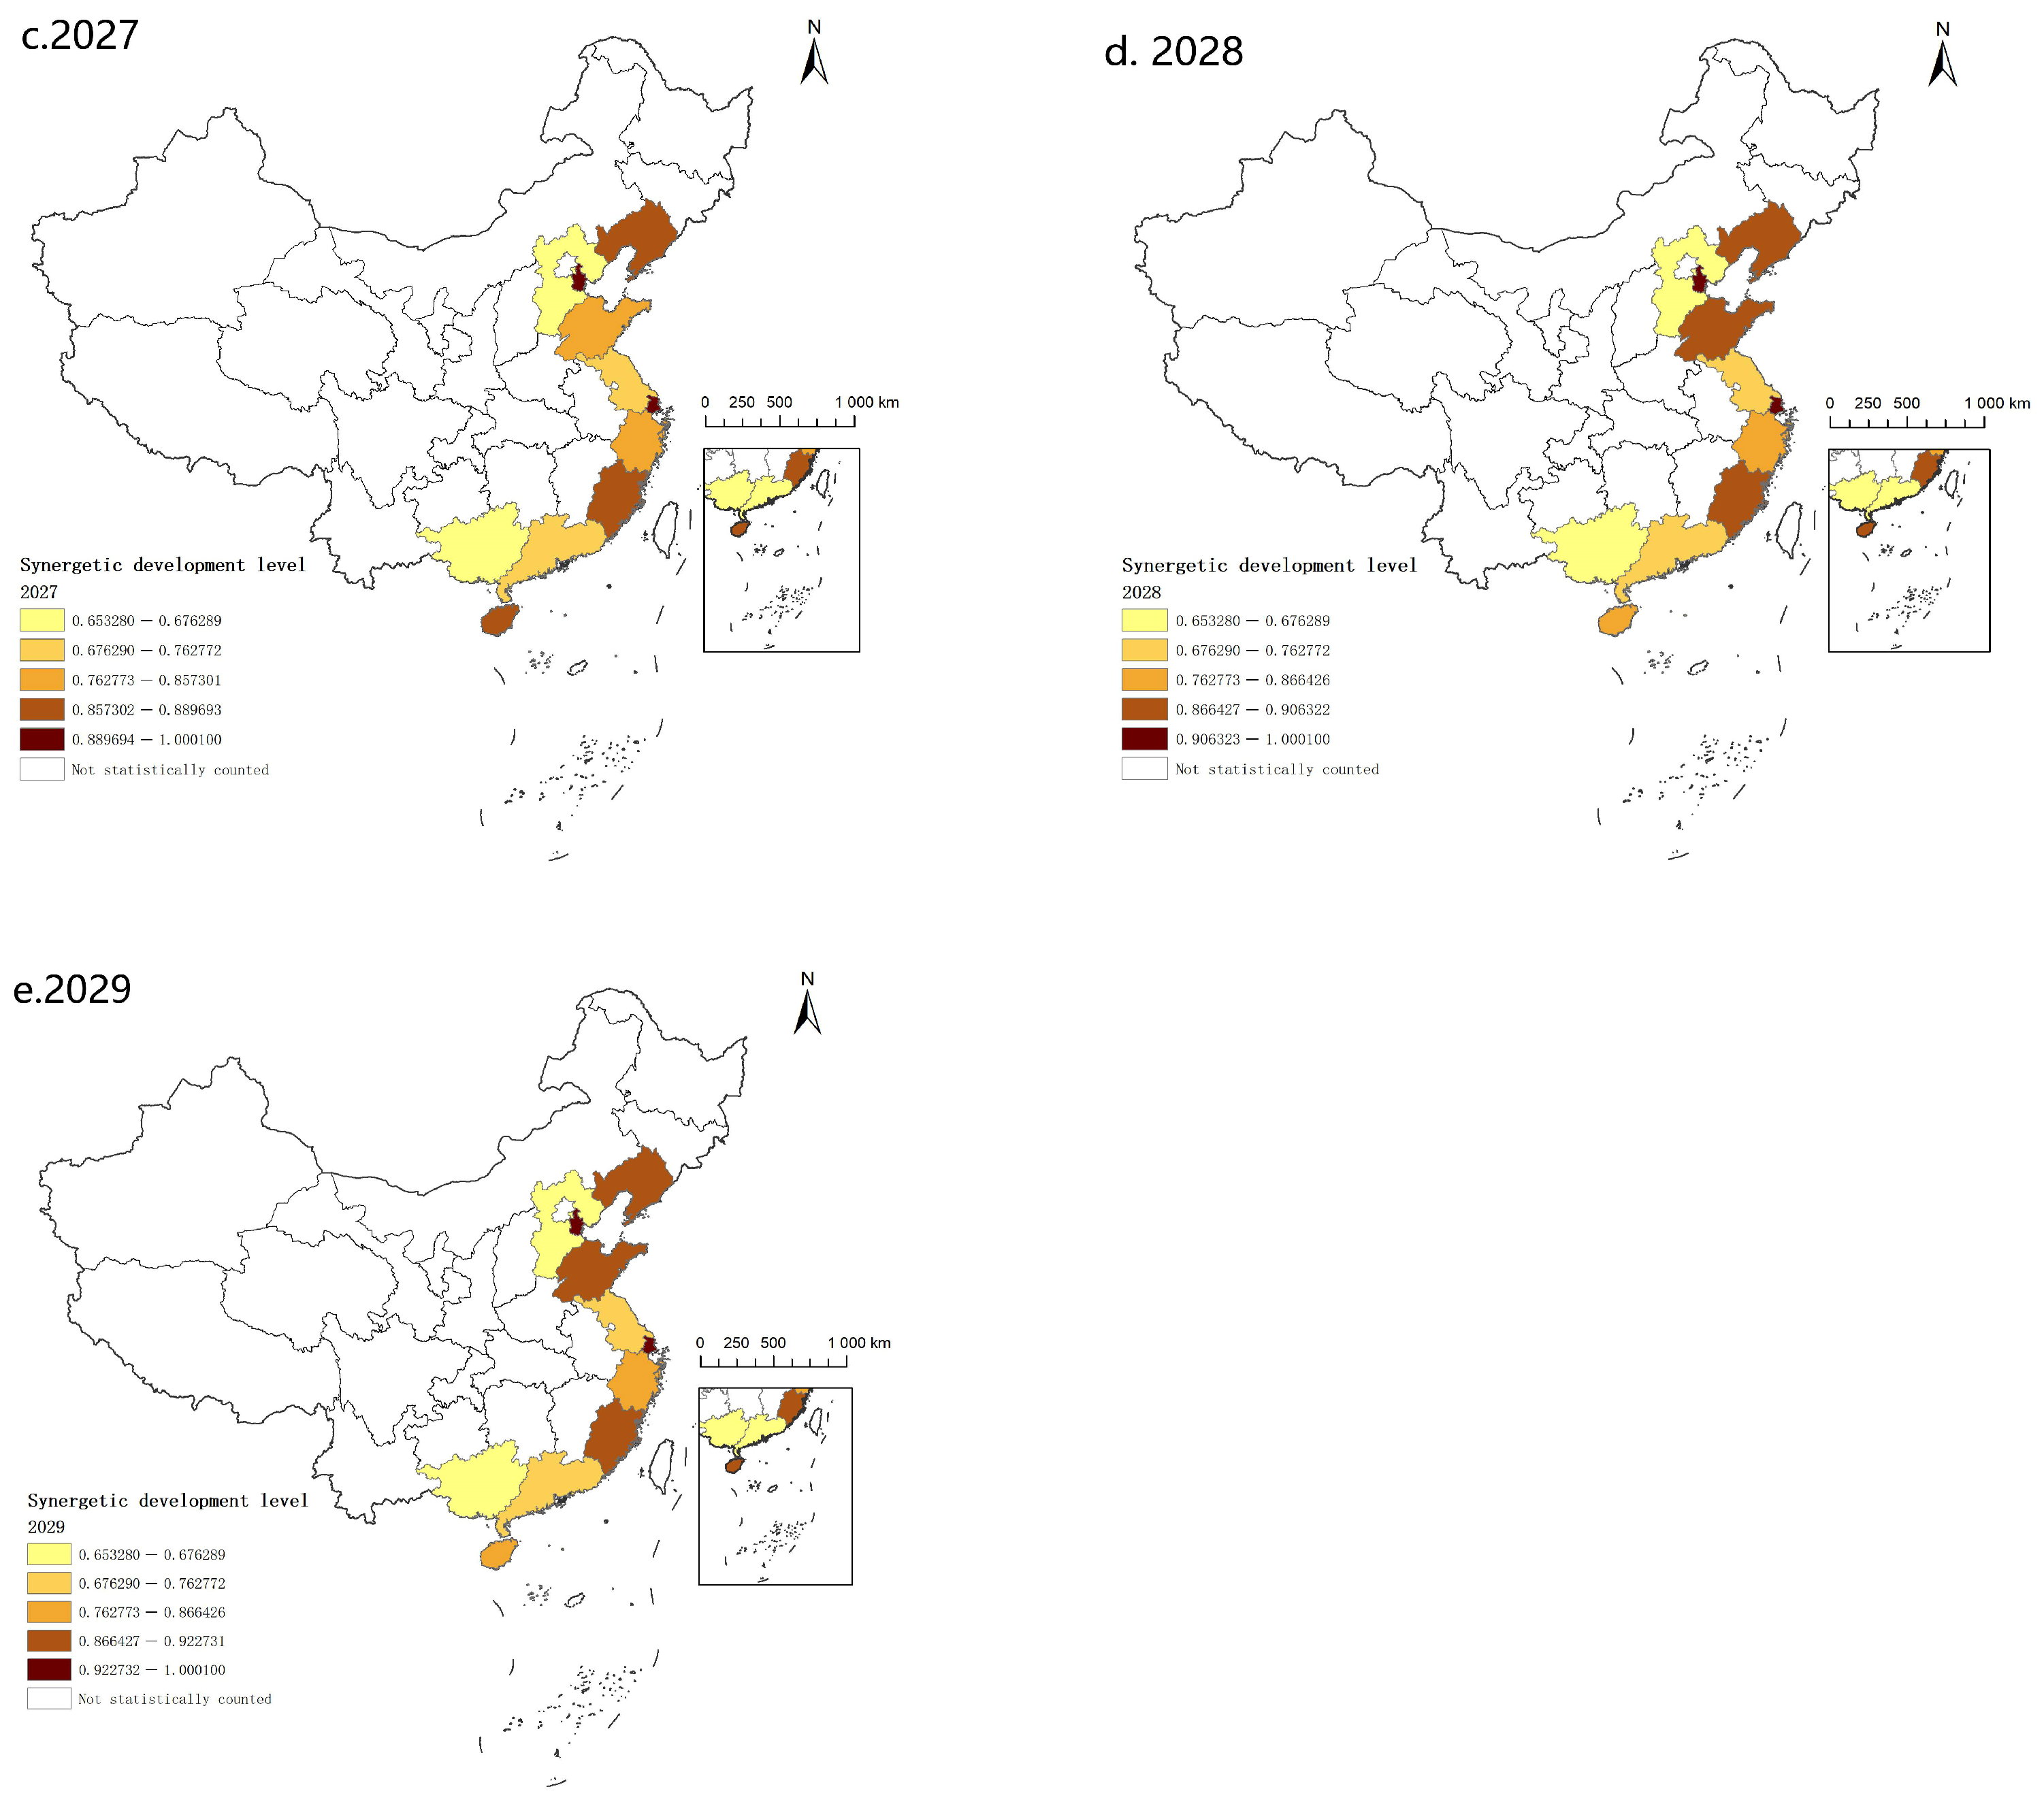
The ARIMA time series model is adopted to predict the coordination level between marine economic green development efficiency and inclusive growth of China’s 11 coastal provinces during 2025–2029. The prediction results are as follows:
The national overall coordination level will maintain a steady upward trend in the next five years. The Eastern Marine Economic Circle will retain its leading position, with its coordination level rising from 0.859 to 0.875. Within this region, Shanghai will sustain the highest level nationwide; Zhejiang will witness a rapid improvement in coordination level, while Jiangsu will see a relatively moderate growth rate. The coordination level of the Northern Marine Economic Circle will increase from 0.832 to 0.865. Tianjin will stay at a high level all the time, Shandong and Liaoning will enjoy robust growth momentum, whereas Hebei will remain within the low-level range for a long time. The coordination level of the Southern Marine Economic Circle will climb from 0.775 to 0.790. Despite steady growth, its growth rate is relatively slow, and inter-provincial differentiation remains prominent.
Judging from the overall trend, the coordinated evolution path of marine economic green development efficiency and inclusive growth in China will be clear in the future. The dominant effect of the order parameter will keep strengthening, and the whole system will develop toward higher quality and greater balance. The predicted temporal trends and spatial patterns for 2025–2029 are illustrated in
Figure 13 and
Figure 14.
5. Discussion
5.1. Similarities and Differences from Existing Studies
The conclusions of this paper concerning the evolutionary characteristics and regional disparities of marine economic green development efficiency and inclusive growth in China are largely consistent with existing literature. In terms of the internal mechanism of mutual promotion between the two dimensions, the empirical findings of this study also provide mutual corroboration with established academic arguments.
Prior research yields consistent evidence: Zhao confirms that the overall marine economic green development efficiency of China follows a fluctuating upward trajectory accompanied by obvious regional disparities [
13]; Gao documents a steady improvement in inclusive growth levels [
7]; Han and Sun both identify a statistically significant positive correlation between green development efficiency and inclusive growth [
9,
16]. This paper further validates these viewpoints: marine economic green development efficiency and inclusive growth rise synchronously across the full coastal zone, alongside continuous growth in coordination levels. The internal logic behind such coordinated development reveals that sound interaction between green efficiency and inclusive growth can integrate environmental sustainability, production efficiency and equitable benefit distribution within the productive activities of the blue granary.
At the provincial level, provinces including Guangxi (coordination level = 0.36), Hebei (0.43) and Hainan (0.75) remain at low or medium coordination levels over the sample period, yet possess substantial potential for fishery output expansion and late-development advantages. These regions deserve priority policy support. Cross-regional technology transfer and inclusive fishery policies can accelerate their catch-up progress. Meanwhile, the demonstration effects of the Eastern and Northern Marine Economic Circles can drive lagging provinces in the southern region to achieve coordinated advancement.
From a global perspective, China’s governance path that takes inclusive growth as the order parameter to boost marine green efficiency offers a replicable paradigm for other coastal nations. This model balances marine food supply security, fishermen’s livelihood welfare and marine ecological integrity, realizing multi-objective coordination of marine economic expansion, fishermen’s income growth and seafood output increase. It carries particular reference value for developing countries confronted with the dual challenges of food insecurity and marine ecosystem degradation.
This paper differs from previous studies in three core aspects.
First, with respect to identifying the dominant mechanism of system coordination, most existing studies adopt the coupling coordination degree model to measure coordination levels [
10,
11,
12]. In contrast, this paper applies the Haken model and calculates that the coordination level of the full coastal zone rose steadily from 0.48 to 0.81 during 2002–2024. The coordination levels of the Eastern, Northern and Southern Marine Economic Circles reach 0.86, 0.82 and 0.77 respectively, and inclusive growth serves as the core order parameter throughout the period. This finding clarifies the priority of policy intervention: prioritizing the improvement of inclusive livelihood security in coastal areas can effectively drive marine green transformation. Meanwhile, inclusive growth and the supporting evaluation system established in this paper can function as one set of evaluation indicators for the Chinese government to design sustainable marine economic development policies. It enables clear differentiation of the synergistic performance across China’s marine economic circles in balancing economic progress, ecological green development and fishermen’s income growth, and provides a sound benchmark for cross-region comparison and experience exchange among these marine economic circles. Furthermore, the complete indicator framework developed in this research can serve as a valuable reference for other coastal countries facing similar marine development challenges globally.
Second, in decomposing the sources of regional disparities, previous studies adopting the Dagum Gini coefficient mainly focus on the contribution of intra-group and inter-group gaps while ignoring the effect of hypervariable density [
36]. This paper estimates that the average contribution rate of hypervariable density is as high as 47.22%, far exceeding the contribution rates of intra-regional and inter-regional disparities. It indicates that the primary source of regional gaps lies in unbalanced development among provinces within each marine economic circle, which provides new empirical evidence for a policy shift from intra-circle regulation to cross-circle collaboration.
Third, existing research rarely quantitatively explores the future development trend of the marine economy and only puts forward qualitative policy prospects [
18,
19,
20,
21,
22,
23]. The prediction results based on the ARIMA model show that the overall coordination level of the coastal zone will increase moderately from 0.82 to 0.84; the Eastern Marine Economic Circle will rise from 0.86 to 0.88, the Northern Marine Economic Circle from 0.83 to 0.86, and the Southern Marine Economic Circle from 0.78 to 0.79. Such results demonstrate that the coordination level between marine economic green development efficiency and inclusive growth will maintain an upward trend. Future marine economic planning should attach greater importance to the quantitative arrangement of cross-circle collaboration mechanisms and inclusive policies, so as to promote the composite system to evolve steadily toward high-level coordination.
5.2. Research Shortcomings of This Paper
From a macro provincial perspective, this paper explores the evolutionary laws, spatial distribution and future trends of the coordination level between marine economic green development efficiency and inclusive growth, yet several limitations remain.
First, the dataset is mainly derived from fishery statistical yearbooks and provincial statistical yearbooks. Statistical calibers for marine industries and environmental protection expenditures differ slightly across provinces, and missing values are filled via interpolation, leading to minor errors in indicator calculation.
Second, the research fails to drill down to prefecture-level and county-level units, nor does it conduct heterogeneous analysis on segmented marine industries such as marine fisheries and coastal tourism.
Third, this study concentrates on the measurement and evolutionary characteristics of coordination levels, without introducing econometric models to empirically test the driving effects of external factors including environmental governance policies and blue finance. The impact channels and constraint conditions of various factors on the dual-system coordination remain to be further examined.
5.3. Possible Future Research Directions of This Paper
Future research can be further deepened from the following three dimensions.
First, expand data sources. Integrate multi-source information including statistical bulletins of coastal prefecture-level cities, special industrial survey data and satellite remote sensing data, conduct cross-verification for abnormal years, and extend the research scale down to county-level units to improve the accuracy of indicator measurement.
Second, refine industrial and spatial dimensions. Focus on typical marine industries such as marine fisheries and coastal tourism, construct industry-specific evaluation systems, and reveal the heterogeneous laws of coordinated evolution.
Third, adopt econometric methods including the Spatial Durbin Model and mediation effect model. Empirically test the impact paths, transmission mechanisms and constraint conditions of external factors such as environmental policies and blue finance on the coordination of the dual systems, so as to make up for the deficiencies in the current mechanism analysis.
6. Conclusions
6.1. Main Empirical Findings
Based on the panel data of 11 coastal provinces in China from 2002 to 2024, this paper takes the dual systems of marine economic green development efficiency and inclusive growth as the research entry point to measure their coordinated evolution levels and spatial distribution characteristics, and carries out trend prediction. Against the practical background of blue granary construction and national food security, the main conclusions are summarized as follows:
First, the coordination level between green development efficiency and inclusive growth in China’s coastal areas keeps rising, and the evolutionary stability of the overall composite system is continuously strengthened. Estimation results of the Haken model indicate that inclusive growth acts as the core order parameter. The overall coordination level of all coastal regions rises from 0.48 in 2002 to 0.81 in 2024, with coordination levels of the three major marine economic circles growing synchronously. The continuous improvement of dual-system coordination effectively promotes stable fishery output and efficiency growth, as well as increasing fishermen’s income in coastal zones, providing solid marine support for diversifying food supply and alleviating the pressure of food supply and demand.
Second, in terms of sources of regional disparities, the average annual contribution rate of hypervariable density reaches 47.22%, significantly higher than that of intra-regional disparities (31.05%) and inter-regional disparities (21.73%), making it the dominant contributor to regional imbalance. This reveals that the unbalanced coastal development mainly stems from the staggered distribution of provinces with high and low development levels within each marine economic circle.
Third, the prediction results for 2025–2029 show that the overall coordination level of the entire coastal zone will increase from 0.82 to 0.84; the Eastern Marine Economic Circle will rise from 0.86 to 0.88, the Northern Marine Economic Circle from 0.83 to 0.86, and the Southern Marine Economic Circle from 0.78 to 0.79.
6.2. Theoretical Implications
First, the finding that inclusive growth functions as the core order parameter aligns with its three reverse driving paths proposed in the theoretical analysis. By optimizing human capital, driving industrial transformation via market demand and advancing collaborative governance, inclusive growth consistently improves regional innovation environments and lifts marine green development efficiency.
Second, the shrinking gaps in synergy levels across the whole coastal zone and three major marine economic circles validate the effectiveness of innovation diffusion, ecological sharing and environmental inclusiveness. Cross-regional factor mobility and green technology sharing break inter-regional development barriers and narrow synergy disparities both within and between marine economic circles.
Third, the forecast of steady growth in future synergy levels for the entire coastal area and three marine economic circles reflects the self-reinforcing virtuous cycle between green development efficiency and inclusive growth.
6.3. Policy Implications
Policymakers may take improving inclusive welfare for coastal residents and advancing marine green technological innovation as core priorities, and roll out differentiated regional governance to mitigate spatial imbalances in marine economic development. Cross-provincial paired support mechanisms can be constructed to narrow inter-regional gaps largely attributed to hypervariable density. In addition, more fiscal funding, industrial incentives and public service resources could be allocated to the southern marine economic circle to comprehensively accelerate its coordinated progress between marine green development and inclusive growth.