Article

Grey Relational Analysis of Sustainable Marine Economic Development Performance in Indonesia

1
Rural and Regional Development Planning Science, Faculty of Economics and Management, IPB University, Bogor 16680, Indonesia
2
Department of Economics, Faculty of Economics and Business, Universitas Negeri Padang, Padang 25132, Indonesia
*
Author to whom correspondence should be addressed.
Sustainability 2026, 18(10), 4624; https://doi.org/10.3390/su18104624
Submission received: 16 February 2026 / Revised: 2 April 2026 / Accepted: 30 April 2026 / Published: 7 May 2026
(This article belongs to the Special Issue Marketing and Sustainability in the Blue Economy)

Abstract

Marine economic development serves as a key pillar for achieving sustainable development in Indonesia, supported by the nation’s vast marine resource potential that can significantly drive long-term economic growth. However, progress in this sector is hindered by persistent challenges, including overfishing, coastal and marine urbanization, environmental degradation, limited infrastructure, climate change impacts, high logistics costs, and weak institutional coordination. Addressing these issues is essential to realizing sustainable marine development. Evaluating the performance of marine economic development is therefore critical to understanding the extent to which the sector is progressing sustainably. This study assesses Indonesia’s marine economic development from a sustainability perspective across three dimensions—economic, social, and environmental—using the Grey Relational Analysis (GRA) method in 15 provinces. GRA is employed to handle uncertainty and incomplete data and to evaluate the relational closeness among indicators in a complex, multidimensional system. The results show that Bali Province demonstrates the highest performance in marine economic development among the 15 provinces, while East Nusa Tenggara records the lowest performance. These findings can inform policy making aimed at promoting sustainable marine economic development in Indonesia.

1. Introduction

Marine economic development is increasingly recognized as a central component of sustainable development, particularly in relation to Sustainable Development Goal (SDG) 14 (Life Below Water). It has become a major focus in global and regional policy forums, including the G20, UN Ocean Conference, World Economic Forum, Our Ocean Conference, and High-Level Panel for a Sustainable Ocean Economy. Contemporary perspectives emphasize that marine economic development should not be understood solely in terms of economic growth, but rather as a process that balances economic performance with social welfare and environmental protection [1,2].
Sustainable marine economic development has the potential to enhance regional economic performance, generate employment, and improve the welfare of coastal communities, while simultaneously preserving marine and coastal ecosystems [3]. The marine economy is a key driver of growth in coastal regions, fueled by increasing demand for marine-based food, energy, transportation, tourism, and other ecosystem services [1,4,5]. However, the expansion of marine-based activities—such as capture fisheries, aquaculture, marine tourism, and maritime transport—can also intensify environmental degradation and social inequality if not properly managed [6].
Indonesia is a maritime country with approximately 70% of its territory consisting of marine areas. Its blue economy is valued at USD 1334 trillion (IDR 19,371 trillion), contributing approximately 7.6% to national gross domestic product (GDP), with fisheries and mariculture accounting for nearly 29.1% of this contribution [7,8]. Despite this significant potential, Indonesia’s marine economic development faces persistent challenges, including overfishing across most Fishery Management Areas (WPPNRI), degradation of marine and coastal ecosystems, limited infrastructure, climate change impacts, high logistics costs, and weak inter-institutional coordination [9,10].
These challenges are further exacerbated by the rapid expansion of economic and urban activities into coastal and marine spaces, often described as the “urbanization of the sea” [11]. This process has contributed to land subsidence, increased risks of flooding and coastal abrasion, and the loss of critical ecosystems, such as mangroves. Between 2009 and 2019, Indonesia lost more than 182,000 hectares of mangroves, with the most severe losses occurring in Sumatra and Kalimantan [9].
From a social perspective, coastal areas remain among the most vulnerable regions in Indonesia. In 2022, approximately one-quarter of the national poor population lived in coastal areas, with around 3.9 million people experiencing extreme poverty, particularly in eastern Indonesia. Provinces endowed with abundant marine resources often continue to experience high poverty rates, indicating that marine economic potential has not been translated into inclusive social outcomes. These conditions underscore the need for a comprehensive assessment of marine economic development performance that integrates economic, social, and environmental dimensions.
Previous studies have employed a variety of methods to evaluate marine economic development, including composite indices, entropy-based approaches, and grey system theory [12,13,14,15]. However, much of the existing literature focuses on single dimensions or specific regions, limiting its ability to provide holistic and comparative assessments of sustainability across subnational units. Moreover, empirical evidence on the interrelationships between economic, social, and environmental dimensions of marine economic development remains limited, particularly in developing countries such as Indonesia. This indicates a critical gap in the literature regarding the extent to which marine economic development reflects a balanced and integrated approach to sustainability. In the Indonesian context, multidimensional and interprovincial analysis of sustainable marine economic development remain limited.
In response to these gaps, this study seeks to address the following research question:
  • How does the performance of marine economic development vary across provinces in Indonesia when evaluated using economic, social, and environmental dimensions?
  • How does marine economic development in Indonesia reflect a balanced integration of economic, social, and environmental sustainability?
  • How are there significant disparities in sustainable marine economic development across provinces with different coastal characteristics and resource endowment?
This study addresses this gap and contributes to the literature in two ways. First, it develops an outcome-based assessment framework aligned with the three pillars of sustainable development—economic, social, and environmental—enabling a more holistic approach to evaluate marine economic development performance. Second, it provides a comparative interprovincial analysis of 15 Indonesian provinces with significant coastal characteristics, offering evidence-based policy-relevant insights at the subnational level.

2. Literature Review

The marine economy refers to economic activities that occur in the ocean and coastal areas, utilize marine resources, and generate goods and services related to the sea [16]. Marine economic development encompasses a wide range of activities, including fisheries, aquaculture, marine tourism, maritime transport, offshore energy, and other ocean-related industries that create added value for regional economies [15]. As demand for marine resources continues to grow, marine economic development has become an increasingly important driver of regional and national economic growth, particularly in coastal regions [4].
However, the expansion of marine activities has also intensified pressure on marine ecosystems, highlighting the need for development pathways that prioritize sustainability. Fauzi [17] emphasizes that sustainability should ensure long-term human well-being by improving quality of life, fulfilling basic needs, and promoting equity. Within this framework, sustainable marine economic development refers to the use and management of marine and coastal resources in ways that support long-term economic growth, enhance community welfare, and preserve the integrity of marine ecosystems [18].
This concept of sustainable development is commonly understood as the balanced integration of economic growth, social inclusion, and environmental protection [19]. Barbier and Burgess [20] contend that sustainable development can only be achieved when these three dimensions are pursued simultaneously. In the marine context, this implies that success should not be measured solely by increases in output or income from marine industries, but also by improvements in environmental quality and social well-being in coastal communities.
The blue economy has emerged as a key framework for operationalizing sustainable marine economic development. It emphasizes the sustainable use of marine resources to generate economic and social benefits while maintaining ocean health and ecosystem services [21,22,23]. The blue economy approach integrates economic productivity with environmental conservation and social equity across marine sectors, including fisheries, aquaculture, renewable energy, tourism, and maritime transport [24,25].
While the blue economy provides a normative framework, its successful implementation is highly dependent on governance arrangements. Marine and coastal governance plays a central role in shaping how marine resources are accessed, managed, and conserved. Governance encompasses regulatory quality, institutional capacity, enforcement mechanisms, and stakeholder participation [26]. These elements determine the extent to which marine resource utilization can achieve sustainable outcomes.
Regions with stronger institutional capacity and effective policy coordination will achieve better development performance across economic, social, and environmental dimensions [27]. An effective governance allows for optimal resource use, minimizes environmental degradation, and promotes equitable distribution of benefits [28]. Conversely, weak governance can lead to overexploitation of marine resources, ecological damage, and social inequality.
Sustainable marine economic development involves a trade-off between extraction-driven growth and environmental sustainability. While the expansion of fisheries, marine tourism, and other marine-based industries can drive regional economic growth, inadequate governance can increase pressure on marine ecosystems, leading to resource depletion and environmental degradation. Therefore, adaptive governance systems are crucial to balance short-term economic gains with long-term sustainability goals.
Furthermore, variations in development performance across regions cannot be explained solely by differences in resource endowment but are strongly influenced by institutional factors such as governance quality, policy effectiveness, and local capacity [29]. Regions with stronger governance frameworks tend to achieve more balanced outcomes across economic, social, and environmental dimensions, while weaker institutional capacity often constrains sustainable development.
Empirical studies on marine economic development have applied diverse methodological approaches. Liu et al. [12] used Grey Relational Analysis (GRA) to evaluate marine economic development quality and found that coordinated economic growth and environmental protection are essential for sustainability. Song et al. [13] developed the Ocean Economic Development Index (OEDI) to assess China’s marine economic development across multiple dimensions, while Liu et al. [14] applied set pair analysis to evaluate the quality of marine economic growth and identified mismatches between economic expansion and environmental improvement. Despite these advances, existing studies remain fragmented, often focusing on single dimensions or specific regions, and thus provide limited guidance for integrated, subnational sustainability assessment.
Therefore, this study addresses this gap by evaluating the performance of marine economic development using a multidimensional approach that combines economic, social, and environmental dimensions, while implicitly recognizing the role of governance in shaping regional development performance.

3. Materials and Methods

The unit of analysis comprises 15 Indonesian provinces whose proportion of coastal villages exceeds the national average of 15.94%. This criterion was applied to exclude provinces with relatively low proportions of coastal villages, which are less comparable to provinces with substantially higher concentrations. Provinces with low coastal exposure generally have fundamentally different economic structures, making them less relevant for comparison in the context of marine economic development. Therefore, this study focused on regions with strong coastal characteristics, making the analysis more valid and relevant. However, this study has limitations in its coverage area, so future research should expand the analysis to include all provinces to test the consistency of the findings. These provinces are Bangka Belitung Islands, Riau Islands, Bali, West Nusa Tenggara, East Nusa Tenggara, North Sulawesi, Central Sulawesi, South Sulawesi, Southeast Sulawesi, Gorontalo, West Sulawesi, Maluku, North Maluku, West Papua, and Papua. All selected provinces are coloured brown as can be seen in Figure 1.
This study uses secondary data for 2024 obtained from Statistics Indonesia (BPS), the Ministry of Marine Affairs and Fisheries (KKP), the Ministry of Environment and Forestry (KLHK), and the Village Potential Statistics (PODES). Eighteen indicators were selected to represent economic, social, and environmental dimensions of sustainable marine economic development, based on relevance to sustainability outcome and data availability. The selection of indicators in this study is based on a sustainable development framework, specifically the triple bottom line approach, which integrates economic, social, and environmental dimensions. This approach is used to ensure that the measurement of marine economic development is not partial but rather adequately represents the link between economic performance, community well-being, and the sustainability of marine and coastal ecosystems. Furthermore, the selection of indicators also considers the availability and comparability of data across provinces, ensuring that the indicators used are consistent, empirically measurable, and allow for reliable comparative analysis. The list of indicators and their description is presented in Table 1.

3.1. Grey Relational Analysis

Grey Relational Analysis (GRA), developed by Deng Julong in 1982, is a multi-criteria decision-making method suitable for evaluating complex systems under conditions of limited and incomplete information [30,31]. It operates by aggregating multiple, often incomparable, attribute values into a single relational grade for each alternative [32]. As a core component of grey system theory, GRA is particularly effective for handling poor, incomplete, and uncertain information. Within this theoretical framework, a state of no information is termed “black,” while perfect information is termed “white”; real-world situations typically fall between these extremes and are therefore described as “grey,” reflecting partial or uncertain information.
In this study, GRA is adopted due to the limited and incomplete information available on marine conditions. Such data constraints make GRA appropriate for evaluating the performance of marine economic development. Specifically, GRA is used to construct a grey relational matrix between selected case studies and indicators, thereby clarifying the relationships among these variables in the context of environmental sustainability, with a focus on marine economic development in Indonesia. In the Indonesian context, the analysis of the marine and fishery sector tends to focus on the contribution through GDP. Studies related to the sector Beyond GDP still do not exist. This paper is the first to analyze the performance of the Beyond GDP sector through GRA measurement using a multidimensional framework.
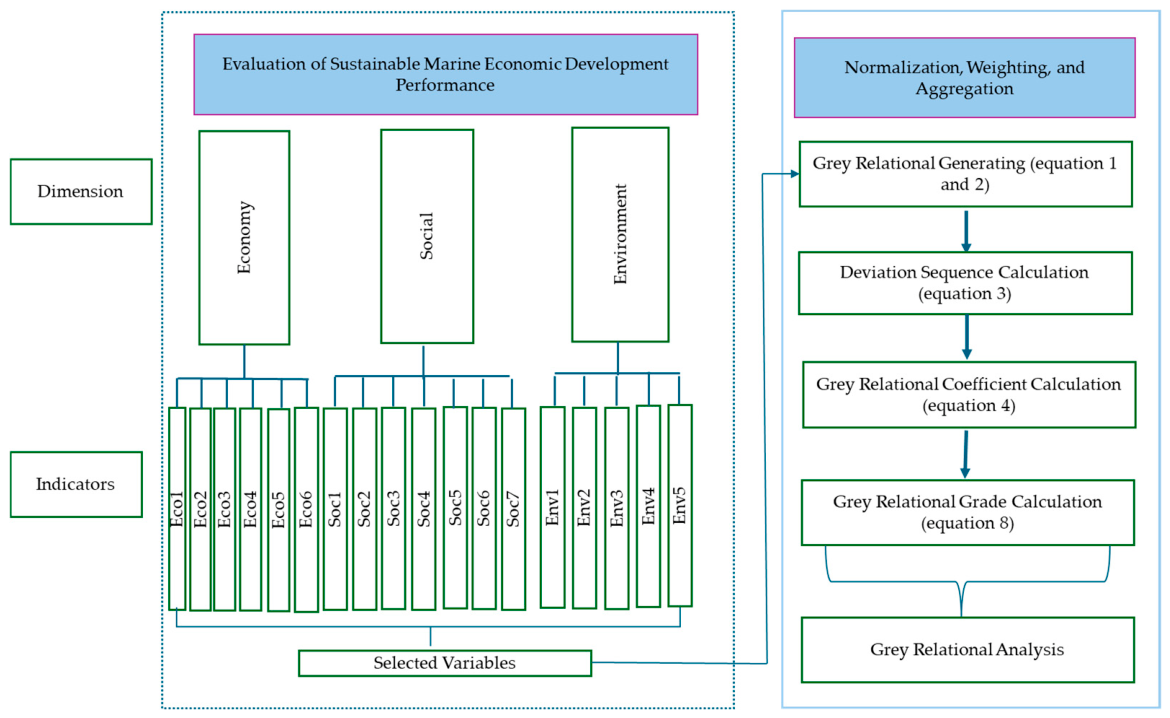
An important advantage of GRA is its ability to generate robust results from relatively small or limited datasets without requiring normal data distribution [33]. It is widely used to assess correlations and relationships between variables, making it suitable for measuring the degree of association between selected case studies and indicators given the available data. GRA has been successfully applied in various areas, including organizational performance evaluation, relational analysis, simulation, and assessment, demonstrating its reliability for environmental sustainability research. Additionally, GRA offers several further benefits: it is efficient for small samples, capable of processing “grey” (incomplete) values, and able to produce optimal and reliable outcomes [34]. The steps in using the GRA method [33] are presented in Figure 2 and explained in more detail as follows:
  • Step 1. Grey Relational Coefficient Generation
This stage, also referred to as data processing preparation, involves normalizing the data for the selected indicators. Normalization is carried out to standardize the data using the min–max technique, which is expressed by the following formula:
x i j * = x i j m i n x i m a x x i m i n x i
x i j * = m a x x i x i j m a x x i m i n x i
where x i j * denotes the normalized value; xij is the original data; min(xi) and max(xi) are the minimum and maximum values of the data, respectively; i represents the ith indicator (1, 2, 3, …, m); and j represents the jth province (1, 2, 3, …, n). In this model, Equation (1) corresponds to benefit-type indicators, where larger values are preferable, while Equation (2) corresponds to cost-type indicators, where smaller values are preferable.
  • Step 2. Deviation Sequence Calculation
The deviation sequence is used to measure the absolute difference between a series and a reference series. It is calculated using the following formula:
i j = x 0 j * x i j *
where i j is the deviation sequence, x 0 j * is the reference sequence, and x i j * is the comparability sequence. At this stage, all indicators are converted to a scale between 0 and 1. This process aims to facilitate comparison between alternatives by means of normalization.
  • Step 3. Grey Relational Coefficient Calculation
The next step in measuring GRA is to calculate the grey relational coefficient. At this stage, the closeness between indicators is analyzed: a larger grey relational coefficient indicates a higher degree of similarity between indicators, while greater deviation between sequences results in a smaller coefficient. The grey relational coefficient is computed using the following formula:
γ x 0 j * , x i j * = m i n + ζ Δ m a x i j + ζ Δ m a x
where γ x 0 j * , x i j * is the grey relational coefficient between xij, i j is x 0 j * x i j * , m i n is min( i j , i = 1,2 , 3 , . . . , m ; j = 1,2 , 3 , . . . , n ) , m a x is max( i j , i = 1,2 , 3 , . . . , m ; j = 1,2 , 3 , . . . , n ) , and ζ are differentiating coefficients, where ζ ε (0,1). ζ is used for the enlargement or compression of the grayscale relational coefficient range. In this study, the value of ζ is 0.5 based on existing studies [33,35].
  • Step 4. Grey Relational Grade Calculation
After obtaining the grey coefficient value, the next step is to calculate the grey relational grade using the following formula. Before computing the overall grey coefficient, the grey relational value for each dimension is first determined using the following formula:
E c o j = j = 1 n γ e c o ( x 0 j * , x i j * ) × W e c o i
where E c o j is the grey coefficient value for the economic dimension for the j-th province, γ x 0 j * , x i j * is the grey relational coefficient, and W e c o i are indicator weights for the economic dimension.
S o c = j = 1 n γ s o c ( x 0 j * , x i j * ) × w s o c i
where S o c j denotes the grey coefficient value of the social dimension for the j-th province, γ x 0 j * , x i j * represents the grey relational coefficient, and W s o c i denotes indicator weights for the social dimension.
E n v = j = 1 n γ e n v ( x 0 j * , x i j * ) × w e n v i
where E n v j denotes the grey coefficient for the environmental dimension of the j-th province, γ x 0 j * , x i j * is the grey relational coefficient, and W e n v i represents the indicator weights for the environment dimension.
Based on Equations (5)–(7), the overall correlation coefficient can be calculated using the following formula:
Γ x 0 * , x j * = 1 3 ( j = 1 n γ e c o x 0 j * , x i j * × W e c o i + j = 1 n γ s o c x 0 j * , x i j * × w s o c i + j = 1 n γ e n v x 0 j * , x i j * × w e n v i )
Equation (8) presents the grey relational grade between xi and x0 representing the correlation between the reference sequence and each comparable sequence. A higher grey relational coefficient indicates a stronger correlation between a given indicator and marine economic development. When the grey relational grade between the quality of marine economic development and an indicator exceeds 0.5, the correlation is considered close. Indicators with a grey relational grade above 0.7 are regarded as key factors influencing the quality of marine economic development [36,37].
In standard GRA applications, equal weights are typically assigned to all attributes of each alternative. In this study, equal weights were assigned to all dimensions and indicators, reflecting the assumption that economic, social, and environmental dimensions are equally important in the absence of strong theoretical justification for differential weighting [38,39]. Thus, assigning equal weights reflects the assumption that no single dimension is prioritized over others in evaluating the performance of sustainable marine economic development.
In addition, the use of equal weighting aims to minimize subjectivity in the weighting process, particularly in situations where robust empirical evidence is lacking to justify differential importance among indicators. In the context of complex and multidimensional systems such as sustainable marine economic development, this approach is widely adopted as baseline assessment to provide an initial, neutral, and transparent evaluation.

3.2. Sensitivity Analysis

However, this assumption may be problematic, as each alternative can have distinct characteristics and preferences that warrant differential weighting. To assess the robustness of the results, sensitivity analysis was conducted by comparing the baseline equal-weight GRA results with those obtained using the Centroidous method and CRITIC method. Robustness was evaluated using Spearman’s rank correlation coefficient, Mean Absolute Percentage Error (MAPE), and Mean Squared Error (MSE) [40].
The Centroidous method is a weighting technique commonly used in multi-criteria decision making [41]. This technique is an objective weighting technique that determines the weight of criteria based on their proximity to the centre of the cluster (centroid). This technique is an objective weighting technique that determines the weight of criteria based on their proximity to the centre of the cluster (centroid) [42]. The closer a criterion is to the centre of its group, the greater the weight given. The stages include data normalization, determining the centre point, calculating the Euclidean distance of each criterion to the center, and minimizing the distance between criteria, which is then used to generate weights through a normalization process. The steps are as follows:
  • Data normalization, using the following formula:
x i j ~ = x i j j = 1 n x i j  
where x i j ~ is normalized data and x i j is the data value for i-th indicators and j-th provinces.
2.
Calculating the centre of gravity:
c i = 1 n i = 1 n x i j ~
where c i is the centre of the group of m elements, which is calculated as the average of corresponding criteria i for all j provinces of the matrix x i j ~ .
3.
Calculating the Euclidean distance:
d i = j = 1 m x i j ~ c j 2  
In case the i-th vector x i j ~ in an m-dimensional space exactly matches the centroid vector ci, which represents the centre of the criteria group, the proximity index attains its maximum value (di = 1).
4.
Calculating the Euclidean distance normalization:
d i ~ = i min ( d i ) d i
where i = 1,…,n, d i ~     0,1 . That is, the smaller the distance to the centre of the group, the greater the criterion weight.
5.
Criteria weight:
w i = d i ~ i = 1 n d i ~  
where wi is the weight of each criterion obtained from the distance to the centre of the group.
Furthermore, another objective weighting method used in this study is the CRITIC (criterion importance through inter-criterion correlation) method. The CRITIC method emphasizes both the contrast intensity among alternatives under each criterion and the degree of conflict arising from inter-criteria correlations. Originally proposed by Diakoulaki et al. [43], this method determines criterion weights by integrating the variability of each criterion with the extent of its correlation with other criteria. In this context, criteria with higher variability and lower correlation with others are assigned greater weights, as they provide more distinctive and less redundant information for decision making. Thus, CRITIC effectively captures both the informative contribution and the conflicting nature of criteria within a multi-criteria decision-making framework. The detailed procedure of this method is summarized as follows [44]:
  • A decision matrix is constructed consisting of the values of each alternative (j) for each criterion (i), denoted as xij, as applied in the Grey Relational Analysis (GRA) calculation.
  • Data normalization: Data normalization here uses min-max as in equations 1 and 2 above.
  • Calculating standard deviation:
σ i = 1 n 1 i = 1 n x i j * x ¯ i j * 2    
where σ i is the standard deviation, x i j * are the normalized data, x ¯ i j * is the mean of the normalized data, and n is the number of provinces.
4.
Calculating correlation coefficients:
The calculation of the correlation coefficient for each pair of criteria is carried out as a measure of conflict between criteria, using Equation ( 15). From a set of correlation coefficients for a symmetric matrix (Rik) with dimension mxm and the general element of the correlation coefficient (rik),
R i k = r i k m × m
5.
Calculating degree of conflict:
The degree of conflict among criteria is calculated using the following formula:
C i =   k = 1 m 1 r i k
where C j represents the total conflict value of criterion i relative to the other criteria. A C i value approaching zero (or when r i k approaches +1) indicates minimal conflict, suggesting that the criteria provide similar or redundant information. In contrast, a negative value of r i k implies that the two criteria are inversely related, reflecting opposing directions. The larger the value of C i , the greater the level of conflict between a given criterion and the others, indicating higher informational uniqueness. Consequently, criteria with higher C i values are considered more important and are assigned greater weights.
6.
Calculating the total information:
At this stage, the total information conveyed by each criterion (Ii) is calculated using the aggregation formula, by multiplying the standard deviation by the complementary number of the correlation coefficient.
I i = σ j × C i
Criteria with higher I i values indicate a greater ability to discriminate among alternatives, thereby exerting a stronger and more significant influence on the decision-making process. Conversely, criteria with lower I i values contribute less to distinguishing between alternatives and, therefore, have a relatively minor impact on the final decision, resulting in lower assigned weights.
7.
Criteria weight
Next, the weight of each criterion is calculated by dividing the amount of information possessed by each criterion by the total information from all criteria according to Equation (18).
w i = I i k = 1 n I i

4. Results and Discussion

4.1. Overall and Dimensional Performance of Sustainable Marine Economic Development

In conducting GRA, there are several stages carried out, including data normalization, calculating deviation sequences, calculating correlation coefficients, and calculating grey relational grade. The first stage in conducting GRA is to normalize the data. The goal of data normalization is to equalize scales and units so that the data can be compared proportionally. The range of values after normalization to 0 to 1, where it is getting closer to 1, indicates that the performance of the indicator is getting closer to ideal conditions. The data normalization process ensures that each indicator has an equal contribution or is in accordance with a predetermined weight, so the comparison between indicators is fair. The normalization results can be seen in Table 2.
In the economic dimension, the fisher‘’y GRDP indicator per capita, Southeast Sulawesi Province is a province with a normalization value of 1.00, which means that this province has the ideal or highest indicator performance compared to other provinces. Meanwhile, East Nusa Tenggara Province with a normalization value of 0.00 shows that the performance of the per capita fishery GDP indicator in this province is far from ideal, or the lowest compared to other provinces. Likewise, for other indicators in the economic dimension, the closer you are to 1, the closer you are to the ideal condition; on the other hand, the closer you are to 0, the farther away you will be from the ideal condition.
There are seven indicators in the social dimension. The average indicator of the number of malnourished people per village shows that East Nusa Tenggara Province has a normalization value of 0.00, which means that this indicator in East Nusa Tenggara Province shows a value that is far from ideal, or the average malnutrition is high. Meanwhile, West Nusa Tenggara Province has a normalization value of 1.00, which means that the average number of people with malnutrition in this region is lowest compared to other provinces. Likewise, for other indicators in the social dimension, if the normalization value is closer to 1, the closer it is to the ideal level, and the closer it is to zero, the farther it is from the ideal level.
In the environmental dimension, the normalization value that is getting closer to 1 also indicates that the indicator is getting closer to ideal. For the water pollution indicator, Bali Province has a normalization value of 0.000, which means that this province is the province with the highest level of water pollution, or is the percentage of seaside villages that experience the highest water pollution compared to other provinces.
After normalization, the next stage is to calculate the deviation sequence. The deviation sequence calculation shows the difference between the normalized actual value and the reference value (ideal condition). The smaller the deviation value, the closer the actual condition will be to the ideal condition. Table 3 shows the results of the deviation sequence calculation for the economic, social, and environmental dimensions.
After obtaining the deviation value of the sequence, the next stage is to calculate the value of the correlation coefficient of each indicator. This correlation coefficient indicates the degree of relative proximity between the actual conditions and the ideal conditions. The value of the coefficient that is closer to 1 indicates a better performance. The results of the calculation of the correlation coefficient can be seen in Table 4 for each dimension.
After calculating the value of the correlation coefficient, the next stage is to calculate the Grade Relational Grade by adding the results of the multiplication of the value of the correlation coefficient with its weight. Table 5 shows the results of the calculation of the grey relational grade for each dimension in evaluating the performance of sustainable marine economic development.
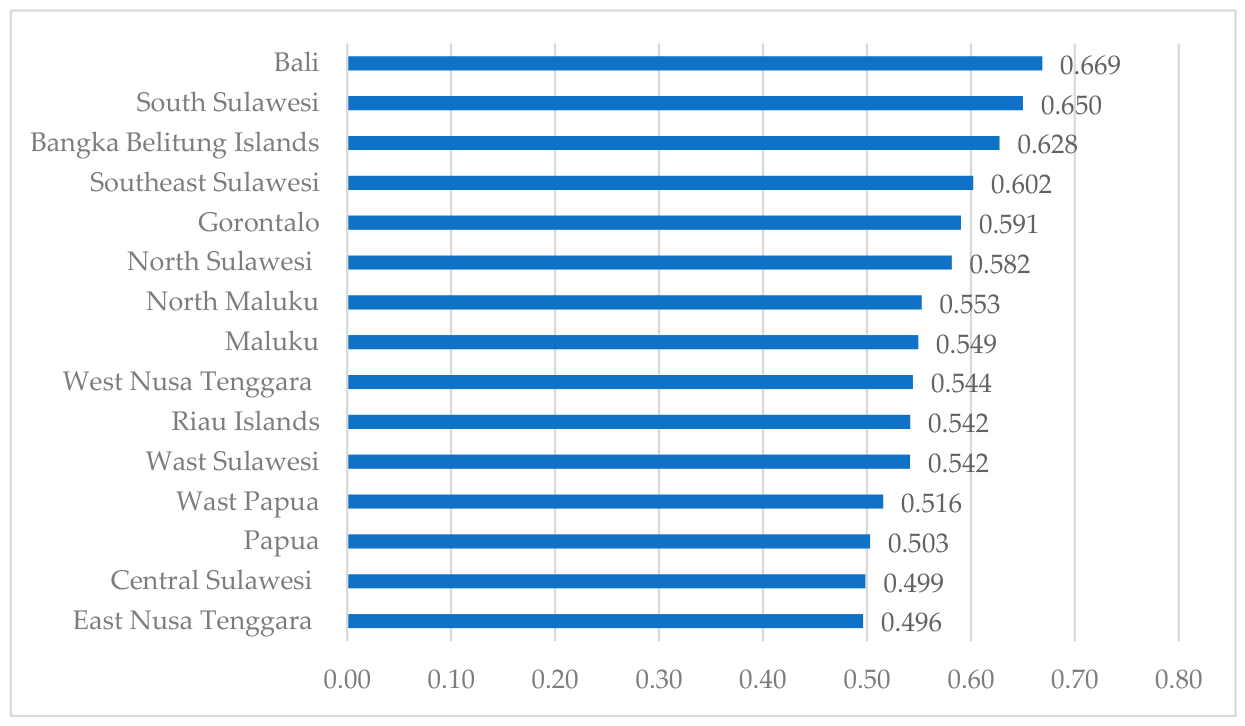
The assessment of sustainable marine economic development across Indonesian provinces using GRA shows that grey relational grade (GRG) values range from 0.503 to 0.669, indicating varying levels of sustainability among regions (Figure 3). In the context of GRA, a higher GRG value indicates greater proximity to ideal conditions, thus indicating more optimal development performance in integrating economic, social, and environmental dimensions.
Spatially, the analysis results show a clear performance grouping. Bali has one of the highest GRG scores at 0.669, followed by South Sulawesi (0.650) and Bangka Belitung Islands (0.628), suggesting a strong alignment with sustainable marine economic development in these provinces. The high GRG values in these provinces indicate a relatively better ability to utilize marine and coastal resources productively and sustainably. In contrast, Papua (0.503), Central Sulawesi (0.499), and East Nusa Tenggara (0.496) record the lowest GRG values, indicating that marine economic activities in these areas remain suboptimal and continue to face challenges in the management and utilization of marine and coastal resources.
Dimensional analysis shows that Bali’s GRG score of 0.669 is largely supported by strong social performance (0.838). The province ranks first in the social dimension and fifth in the economic and environmental dimension. The combination of a dominant social dimension and stable performance in other dimensions makes Bali the province with the most optimal level of development integration. This reinforces the indication that Bali’s success rests not solely on economic exploitation but also on solid social support within a framework of sustainable development.
Socially, Bali has relatively better access to basic services—such as education, clean water, adequate sanitation, and telecommunications—compared with other provinces, indicating that marine economic development has generated positive social outcomes. Based on data, the province of Bali has an average of six schools per village, 100 percent of its coastal villages have access to proper sanitation, 98.87 percent of coastal villages have internet access, and 74.58 percent of its coastal villages have access to proper water sources. Environmentally, 28.81 percent of its villages process waste at the source, reflecting relatively strong public awareness of environmental protection and contributing to an improved quality of life. Meanwhile, 21.47 percent of its coastal villages experience water pollution, the highest percentage among other provinces. Furthermore, only 17.51 percent of mangroves are in good condition in this region, the lowest percentage compared to other provinces. Economically, Bali excels in the percentage of industries in coastal areas, at 40.75 percent.
Marine economic development is thus not solely aimed at enhancing economic performance but also at improving the quality of life of coastal communities while preserving marine and coastal ecosystems. Liang et al. [18] highlight that the sustainable use of marine resources should foster economic growth, enhance livelihoods and employment, and maintain marine ecosystem health. Similarly, Chen [45] stresses that sustainable marine economic development requires balancing resource utilization with ecological protection. This is consistent with Jie et al. [4], who argue that resource availability forms the foundation of marine economic development. In Indonesia, the diversity and availability of marine resources at the provincial level offer substantial potential for economic growth that can generate benefits across economic, social, and environmental dimensions, thereby supporting sustainable marine economic development. Bali, for instance, leverages its marine resources through the development of marine tourism, reflected in tourist arrivals with a ranking of fourth in other provinces, while simultaneously strengthening the contribution of the marine sector to the regional economy.
Unlike Bali, South Sulawesi Province, with a GRG score of 0.650 (Second Rank), performs strongly in the economic dimension (ranked first), while its environmental and social dimensions are both ranked sixth. South Sulawesi Province has the highest average growth of fishery GRDP (5.11 percent) and fishery productivity per village (IDR 102.93 billion/village) among other provinces. As noted by Liu et al. [14], higher fishery GRDP growth rates tend to further increase a region’s competitiveness in the marine sector.
However, the strong performance in the economic dimensions is not accompanied by equally strong outcomes in the social and environmental dimensions. This pattern indicates that, although the province has been highly effective in generating value added from marine resources, it has not fully translated this economic success into equitable social welfare and optimal environmental quality. In the social dimension, South Sulawesi ranks among the highest in terms of crime rate (35.0 percent), suggesting that the benefits of marine resource utilization may not be evenly distributed across coastal communities.
From an environmental perspective, approximately 31.68 percent of coastal villages are affected by flood/tidal waves/coastal abrasion. This condition is closely related to the degradation of mangrove ecosystems in the region. Based on village-level data (Podes 2024 [45]), only 39.12 percent of mangrove areas are in good condition, indicating substantial ecological damage. The high level of mangrove degradation reduces the natural coastal protection function, thereby increasing the risk of shoreline erosion and coastal hazards.
In contrast, East Nusa Tenggara Province records the lowest performance in sustainable marine economic development, with a GRG of 0.496. The province ranks 15th in the social dimension, 11th in the economic dimension, and 7th in environmental dimension. Although East Nusa Tenggara is rich in marine resources but had a per capita fishery GRDP of IDR 0.78 million in 2024 (BPS) and a low Fisherman’s Terms of Trade (NTN) of only 89.49, fishery productivity per village is also relatively low, at IDR 7.90 billion per village, far below that of other provinces. This indicates that the fishery sector has not yet generated sufficient economic value to improve the welfare of fishing communities. This condition reflects low productivity, limited value-added activities, and weak bargaining power of fishermen within the value chain, ultimately leading to economic vulnerability in coastal areas. In the social dimension, based on the 2024 Podes data, an average of six children per coastal village suffer from malnutrition, representing the highest figure among all provinces. The phenomenon of the resource curse refers to a paradox in which regions endowed with abundant natural resources tend to experience slower economic growth and lower welfare outcomes. In line with a study by Rahma [46], its concluded that regions endowed with abundant natural resources tend to experience the phenomenon of the natural resource curse. In the context of marine-based economies, this condition may arise when fishery resources are not effectively transformed into value-added economic activities, leading to low productivity, weak income generation, and persistent poverty among coastal communities.
Environmentally, East Nusa Tenggara demonstrates relatively strong performance, as reflected in its environmental ranking compared to other provinces. However, this apparent strength masks underlying structural constraints related to basic service provision and ecosystem quality. Only 33.66 percent of coastal villages have access to clean water, indicating limited environmental health infrastructure. In addition, merely 29.33 percent of coastal villages possess mangrove ecosystems in good condition, suggesting ongoing degradation of critical coastal habitats. From a sustainability perspective, these conditions weaken the ecological resilience of coastal systems and may undermine the long-term viability of marine-based economic activities. In the context of the blue economy, this implies that environmental performance has not yet been fully translated into sustainable resource management, highlighting the need for improved coastal governance and ecosystem restoration efforts.
Overall, the analysis reveals an imbalance among dimensions in the marine economic development performance of Indonesian provinces, as reflected in the GRG rankings for each dimension of sustainable marine economic development. South Sulawesi, for instance, ranks first in the economic dimension but only sixth in environmental dimensions. This suggests that current development patterns may prioritize short-term economic gains over ecological sustainability, highlighting the need for more integrated and balanced policy approaches in achieving sustainable marine economic development. Similarly, West Nusa Tenggara ranks high in the social dimension but falls behind in the economic and environmental dimensions, at 12th and 14th, respectively. These disparities highlight persistent weaknesses in marine resource governance in Indonesia and a development paradigm that remains largely driven by resource extraction [47].
Sustainable marine economic development can only be realized when economic growth goes hand in hand with an equitable distribution of social benefits and the protection of marine ecosystems [48]. An imbalance among the economic, social, and environmental dimensions reflects a trade-off between growth and ecological sustainability that, in the long run, can undermine the productivity of marine resources. In Indonesia, the Ministry of Maritime Affairs and Fisheries’ policies initially tended to standardize policies despite the geographically distinct characteristics of coastal areas across provinces, resulting in a land-based political economy. Consequently, there has been an imbalance between dimensions in the context of sustainable marine economic development.
The OECD [49] also notes that marine economic expansion often triggers environmental degradation and social inequality in coastal areas. Consequently, a marine development strategy grounded in sustainable development principles is essential. Such a strategy must balance development dimensions by strengthening marine resource governance, empowering coastal communities, and enhancing marine environmental quality. This aligns with UNEP [50] and OECD [49], which stress that progress toward a blue economy requires ensuring that economic gains from marine resources do not come at the expense of social and environmental objectives. In this context, sustainable marine economic development becomes a strategic priority for coastal regions seeking long-term competitive advantage in the marine economy [1].
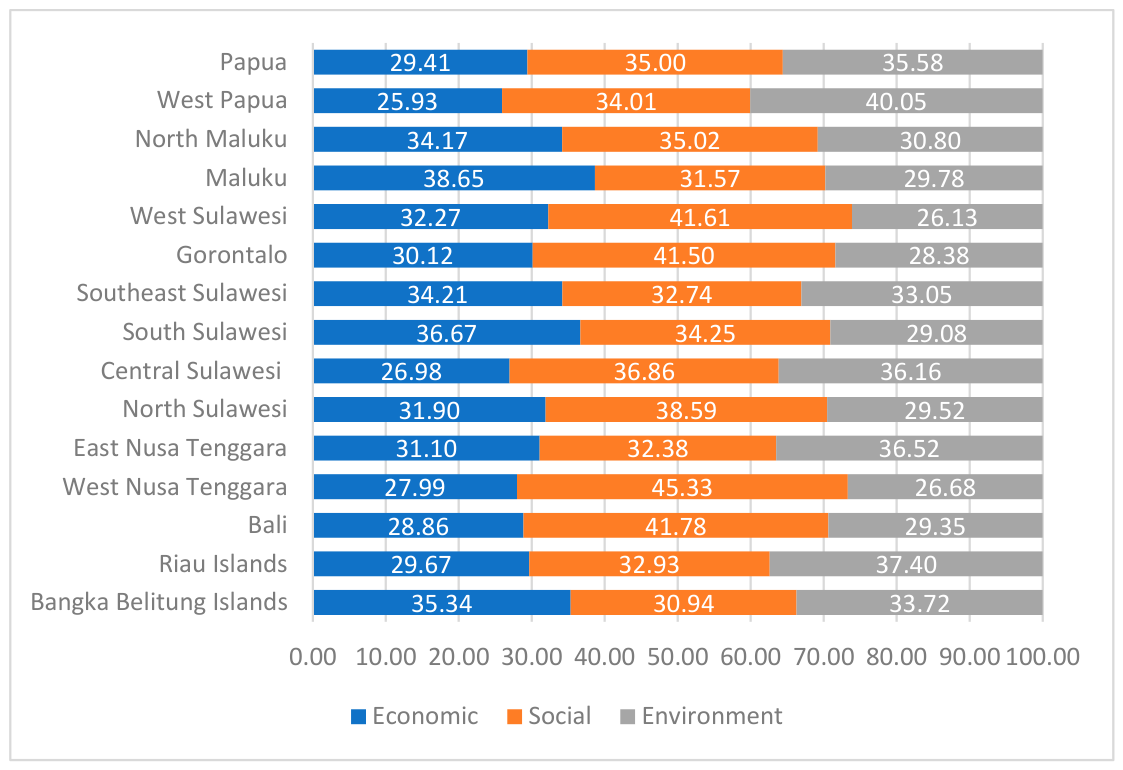
Analysis of the contribution of each dimension to marine economic development performance across Indonesian provinces reveals notable imbalances (Figure 4). West Papua (40.05 percent) and Riau Islands (37.40 percent) are dominated by the environmental dimension, indicating relatively strong environmental capacity that is not yet matched by optimal economic utilization. This is reflected in the relatively low shares of the economic dimensions, 25.93 percent in West Papua and 29.67 percent in Riau Islands. By contrast, Maluku (38.65 percent) and South Sulawesi (36.67 percent) show the highest dominance of the economic dimension compared with other provinces. Meanwhile, West Nusa Tenggara (45.33 percent), Bali (41.78 percent), and West Sulawesi (41.61 percent) are characterized by a predominance of the social dimension in their marine economic development. Overall, this pattern points to an imbalance among dimensions in shaping sustainable marine economic development.
Provinces with strong economic performance are likely to impose mounting pressures on the environment if development is not guided by sustainability principles. Conversely, provinces dominated by the social dimension suggest that improvements in coastal community welfare are occurring more rapidly than the growth of value added in the marine economy. These results underscore the urgency of a more integrated, regionally grounded marine economic development policy that can simultaneously boost economic growth, improve community welfare, and preserve the integrity of marine and coastal ecosystems to achieve sustainable marine economic development.

4.2. Pattern of Performance

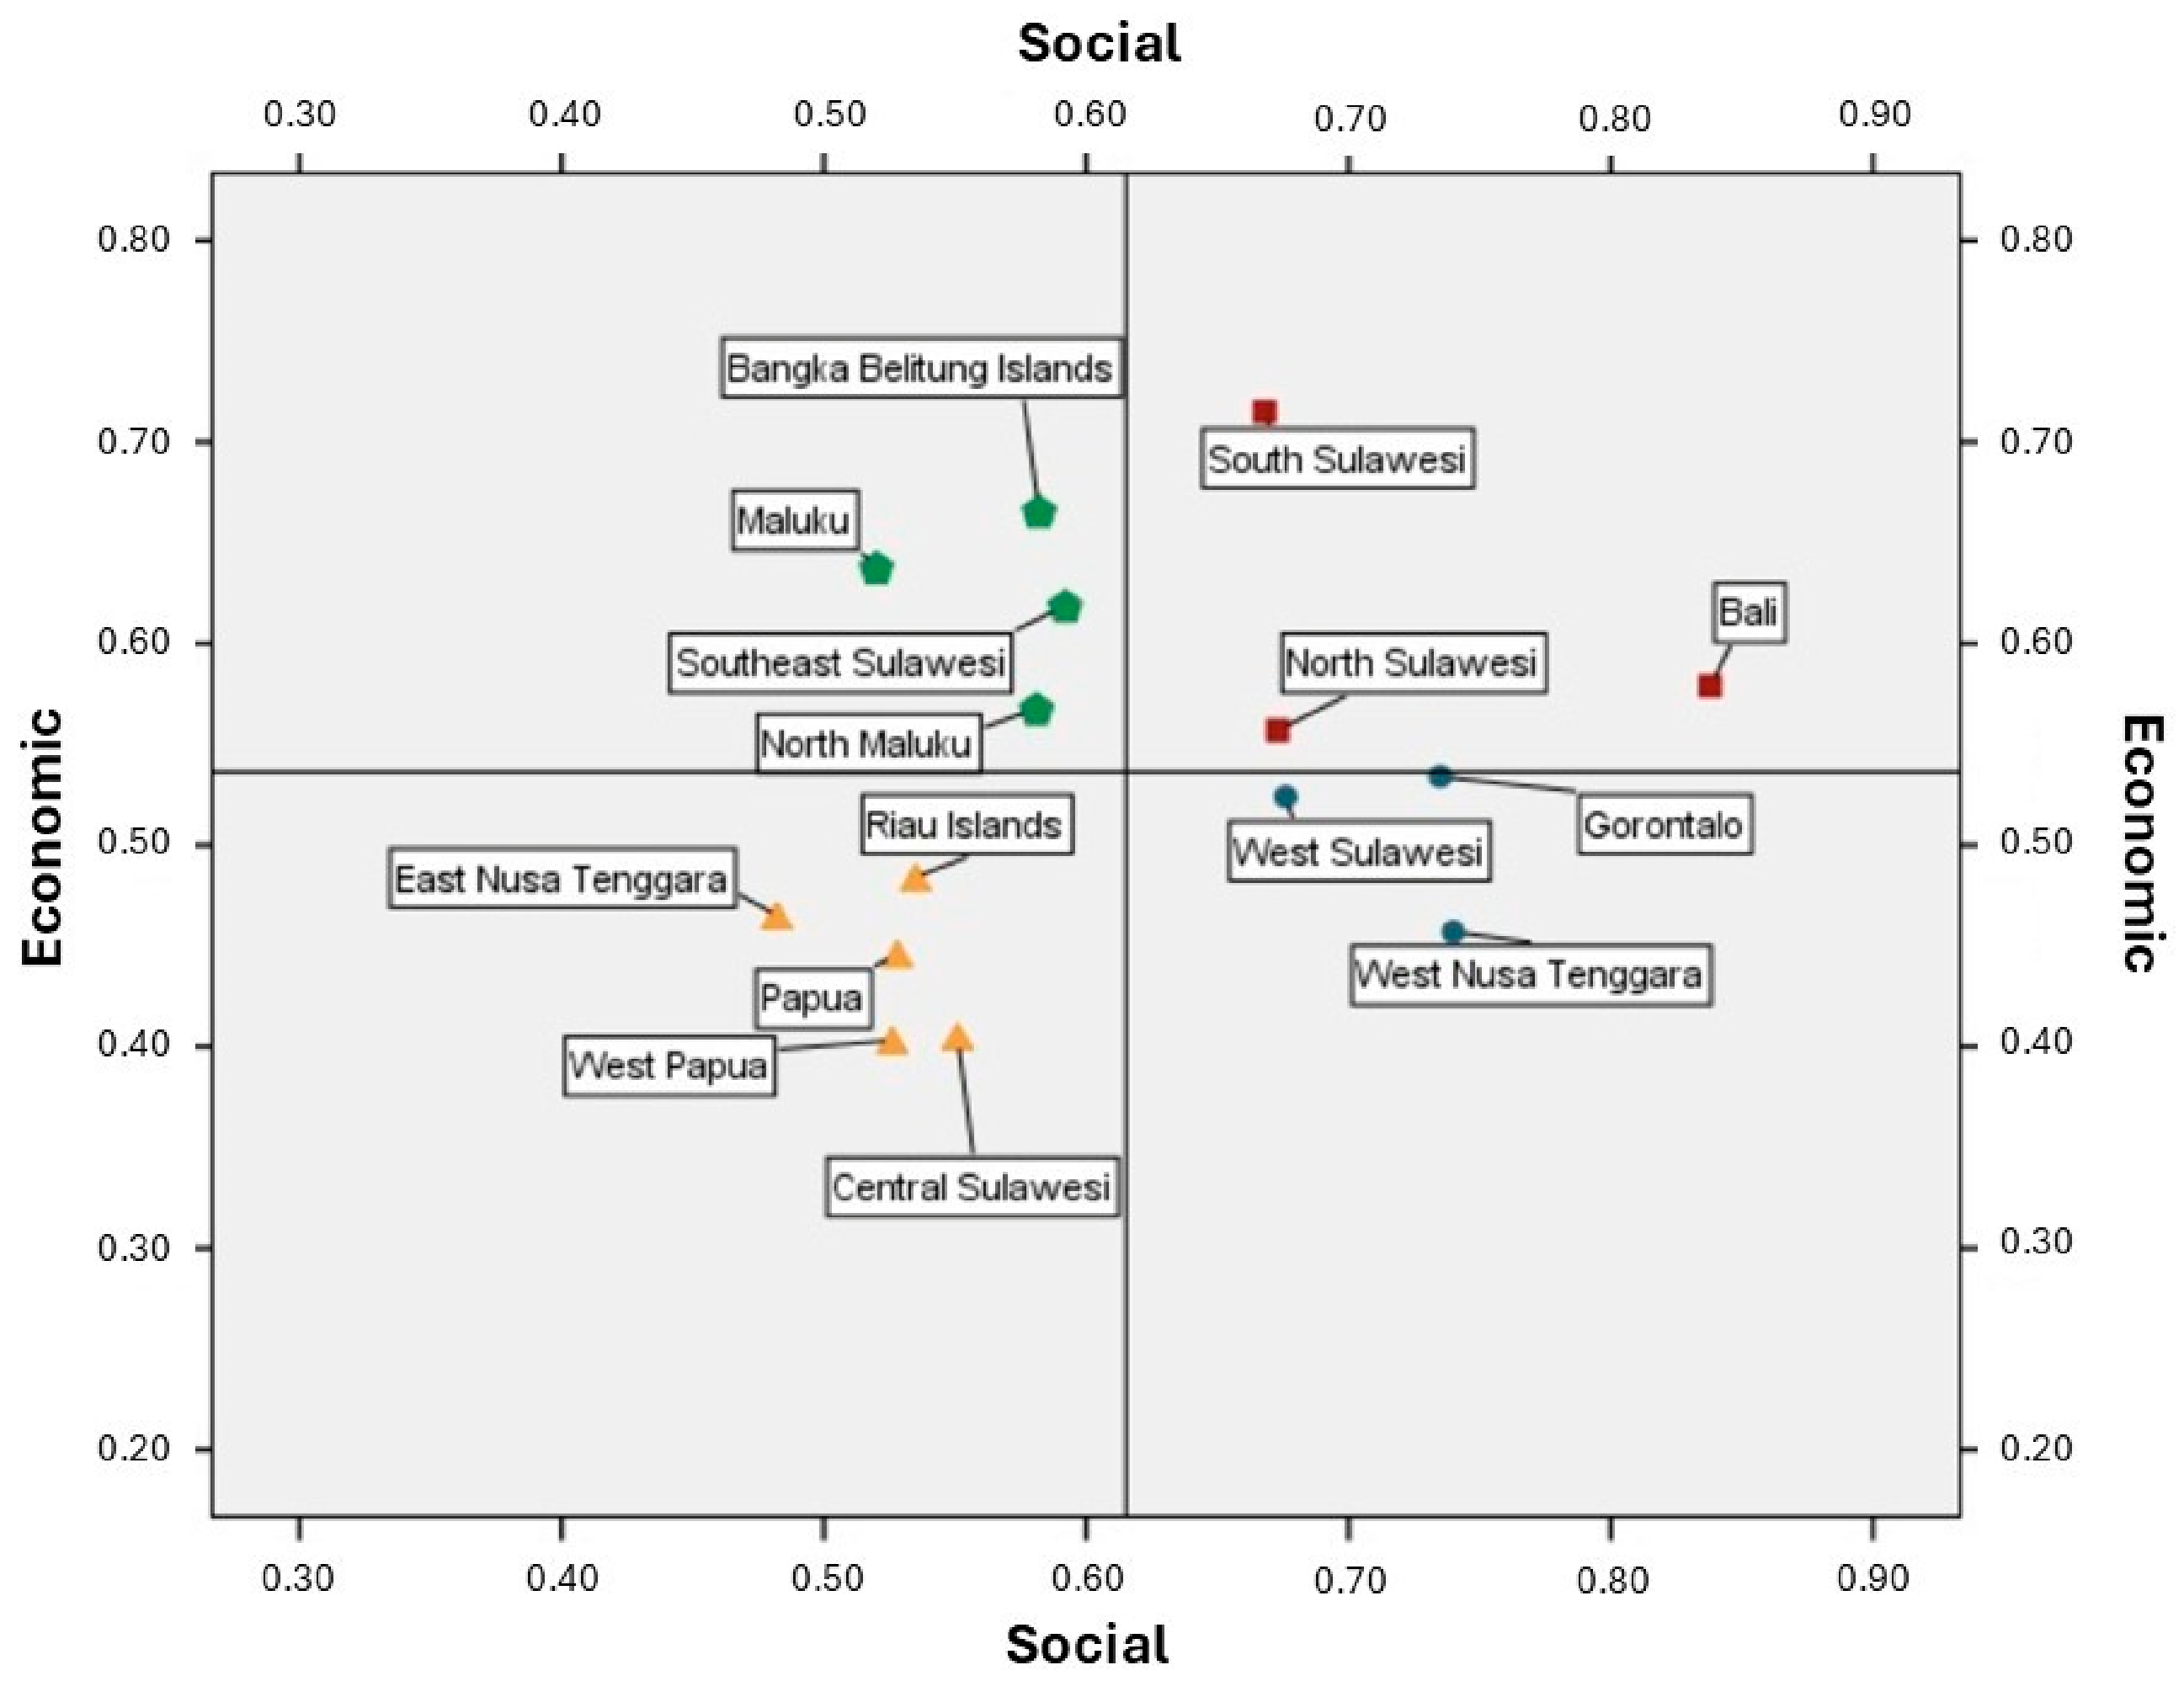
Figure 5 presents a map of performance of marine economic development based on economic and social dimensions. The results show that 3 of the 15 provinces in Indonesia—South Sulawesi, North Sulawesi and Bali—exhibit high performance on both dimensions. This suggests that marine economic development in these areas has generated positive economic and social impacts, with marine resources contributing to improved community welfare.
In contrast, 5 of the 15 provinces perform poorly on both dimensions. Central Sulawesi records the lowest performance in marine economic development for both economic and social aspects. Despite its considerable fishery potential, due to its location in WPP 713 and 716, utilization and management remain suboptimal, limiting the positive effects on economic and social outcomes [51]. Most fishers in this province are small-scale, and data from Statistics Indonesia (BPS) indicate that 11.77 percent of Central Sulawesi’s population were living in poverty in 2023. In addition, limited port infrastructure has contributed to low fishery productivity.
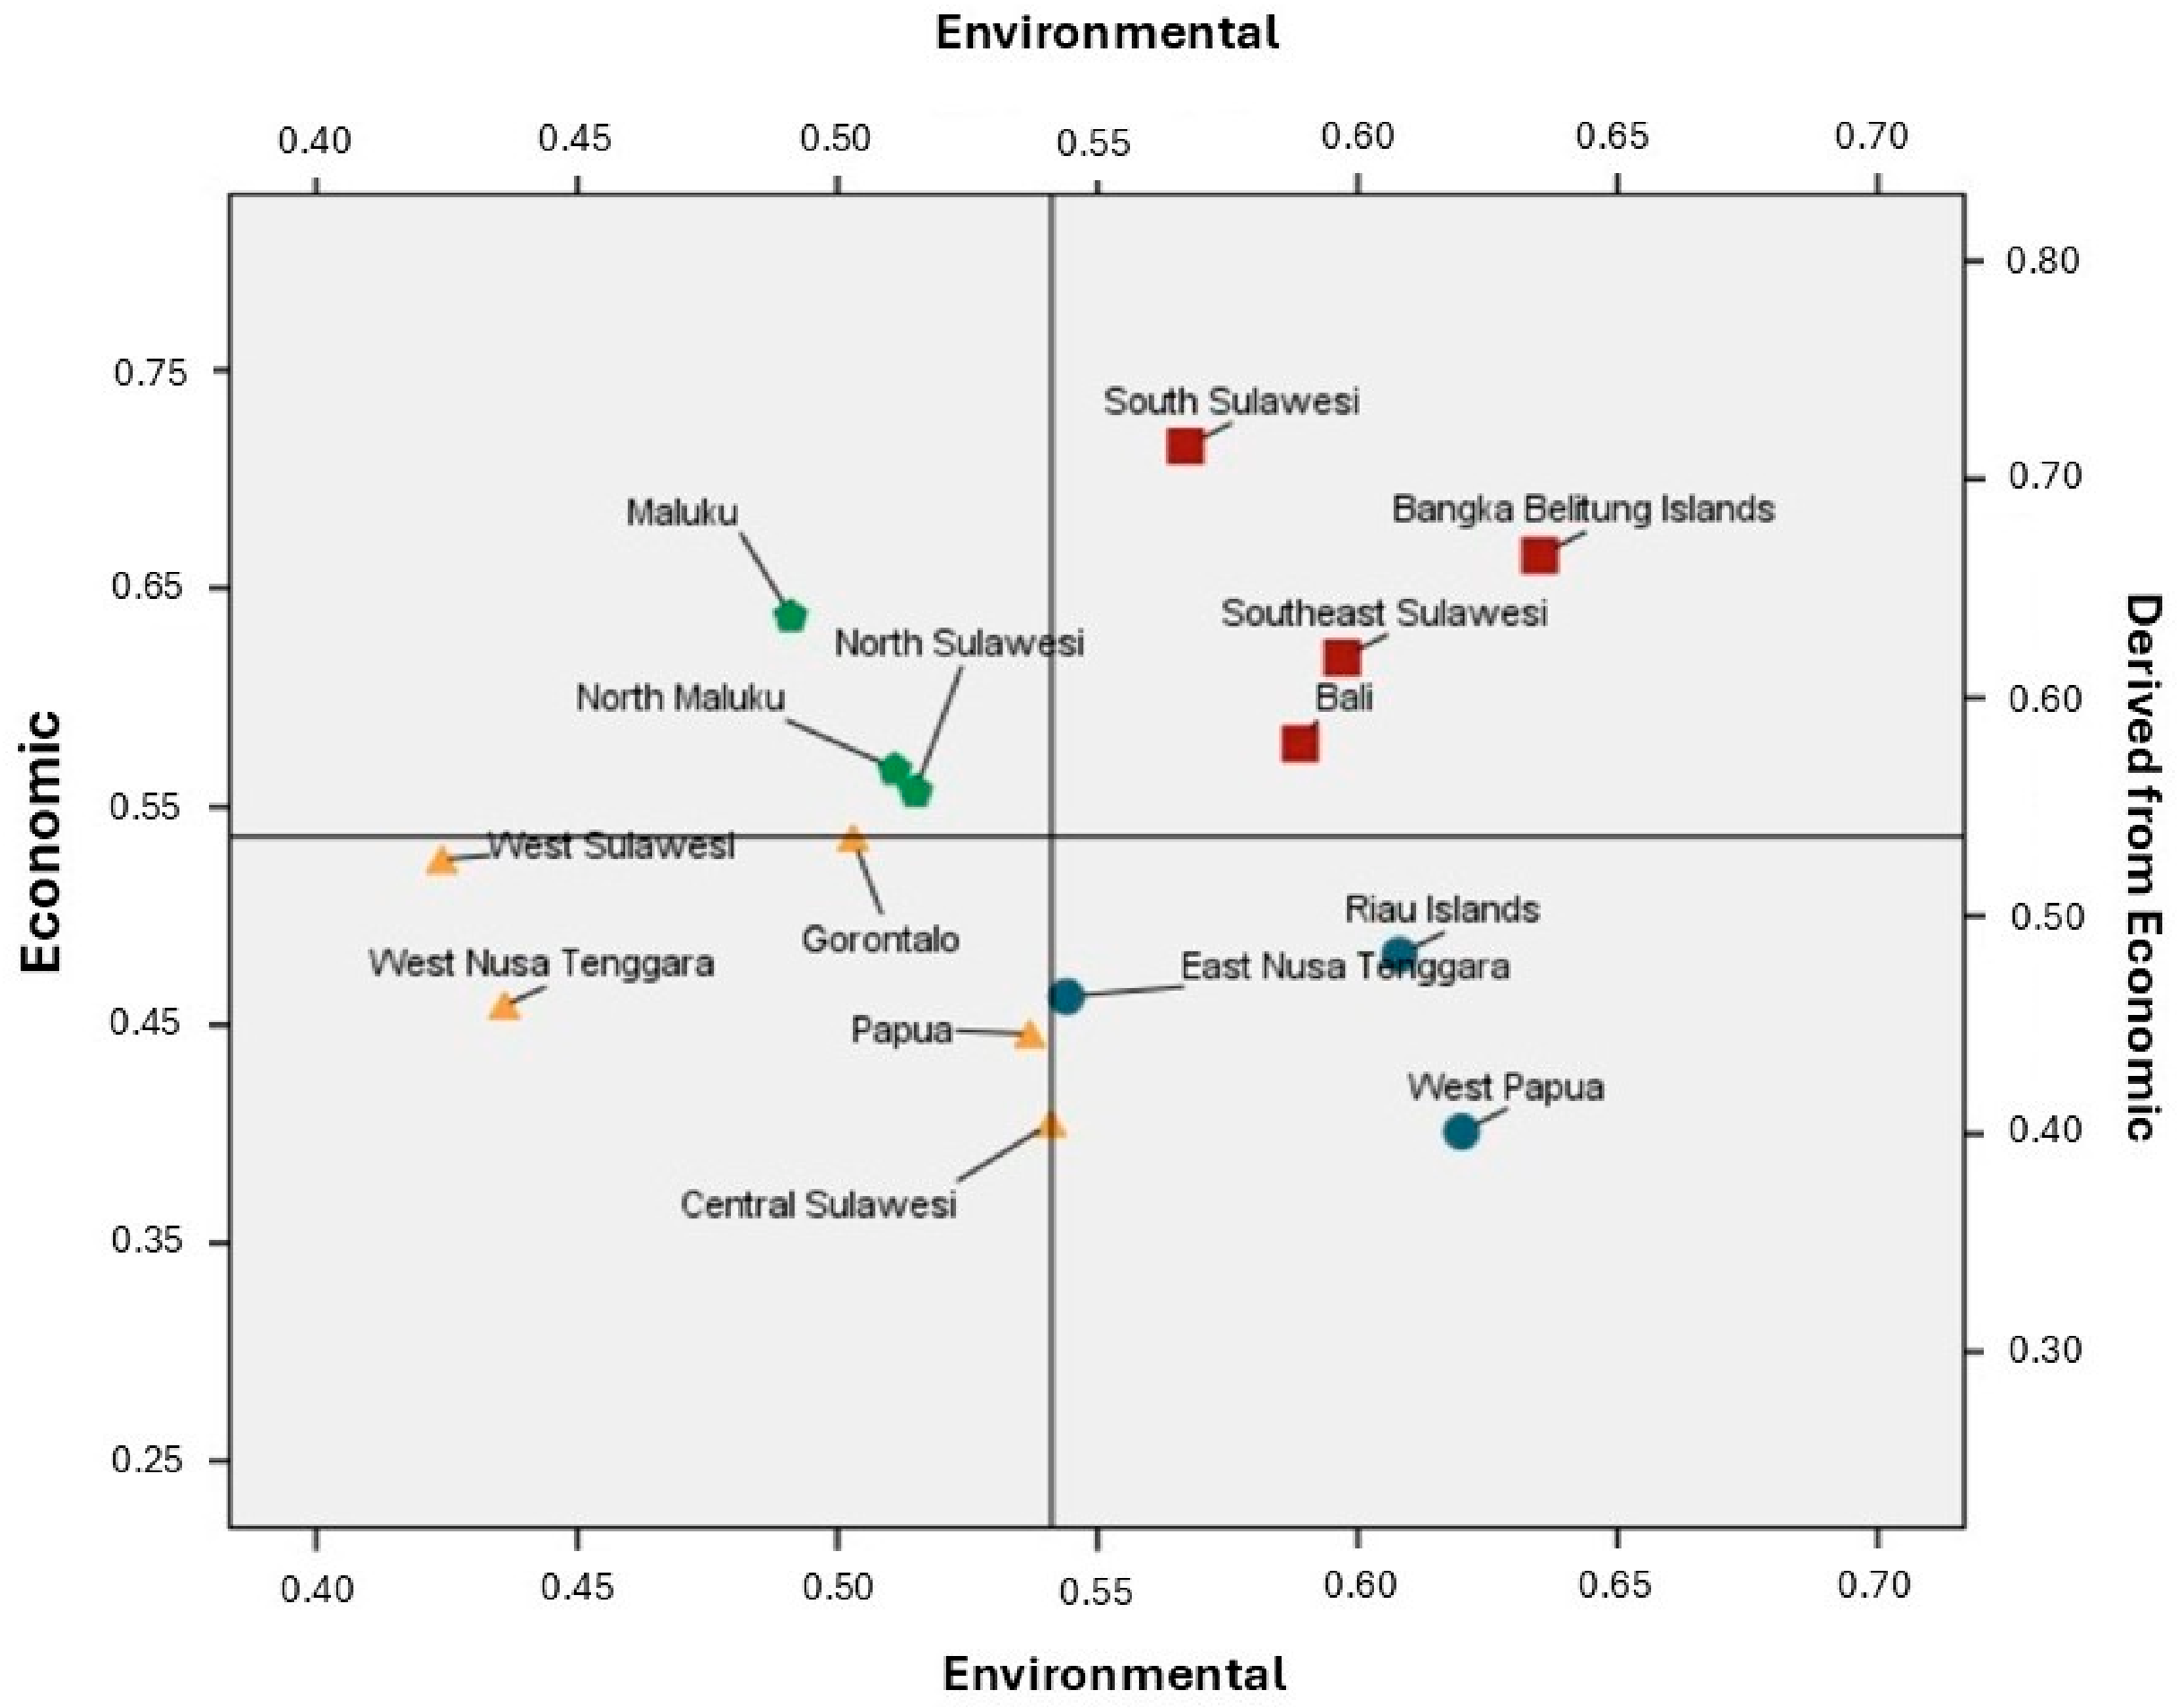
When mapping economic and environmental performance (Figure 6), the provinces of Bangka Belitung Islands, Southeast Sulawesi, Bali, and South Sulawesi perform relatively well in both dimensions, as they are above the average of the 15 provinces analyzed. This suggests that marine resource use in these regions still takes environmental sustainability into account. In contrast, Maluku, North Sulawesi, and North Maluku show relatively strong economic performance but weaker environmental performance. Notably, these provinces are mining areas, including nickel and gold extraction. A report by CELIOS in North Maluku [52] concluded that the expansion of the nickel industry has contributed to the degradation of coastal areas. Moreover, the excessive exploitation of marine resources accelerates the decline in coastal ecosystem quality. The overexploitation of marine resources significantly contributes to the degradation of coastal ecosystems [53].
In contrast, Central Sulawesi Province exhibits relatively poor performance in both the economic and environmental dimensions. The region possesses abundant marine resource potential, particularly in the fishery sector, including capture fisheries (skipjack tuna, tuna, mackerel tuna, anchovies, and squid) and aquaculture (seaweed, shrimp, and grouper), which are distributed across strategic areas such as the Makassar Strait, Tolo Bay, Tomini Bay, and the Sulawesi Sea. However, despite this potential, its productivity remains low. Based on 2024 data from BPS, the growth of fishery GRDP in the region is only 0.45 percent.
From an environmental perspective, access to basic services such as safe drinking water remains limited (55.87 percent), and approximately 6.95 percent of coastal villages are affected by pollution. These findings suggest that regions endowed with abundant natural resources may still experience weak economic performance due to unsustainable exploitation practices, which in turn generate adverse environmental impacts [54]. Central Sulawesi Province is also one of the largest nickel mines in Indonesia, which has an impact on the coastal environment with the presence of smelters in this region.
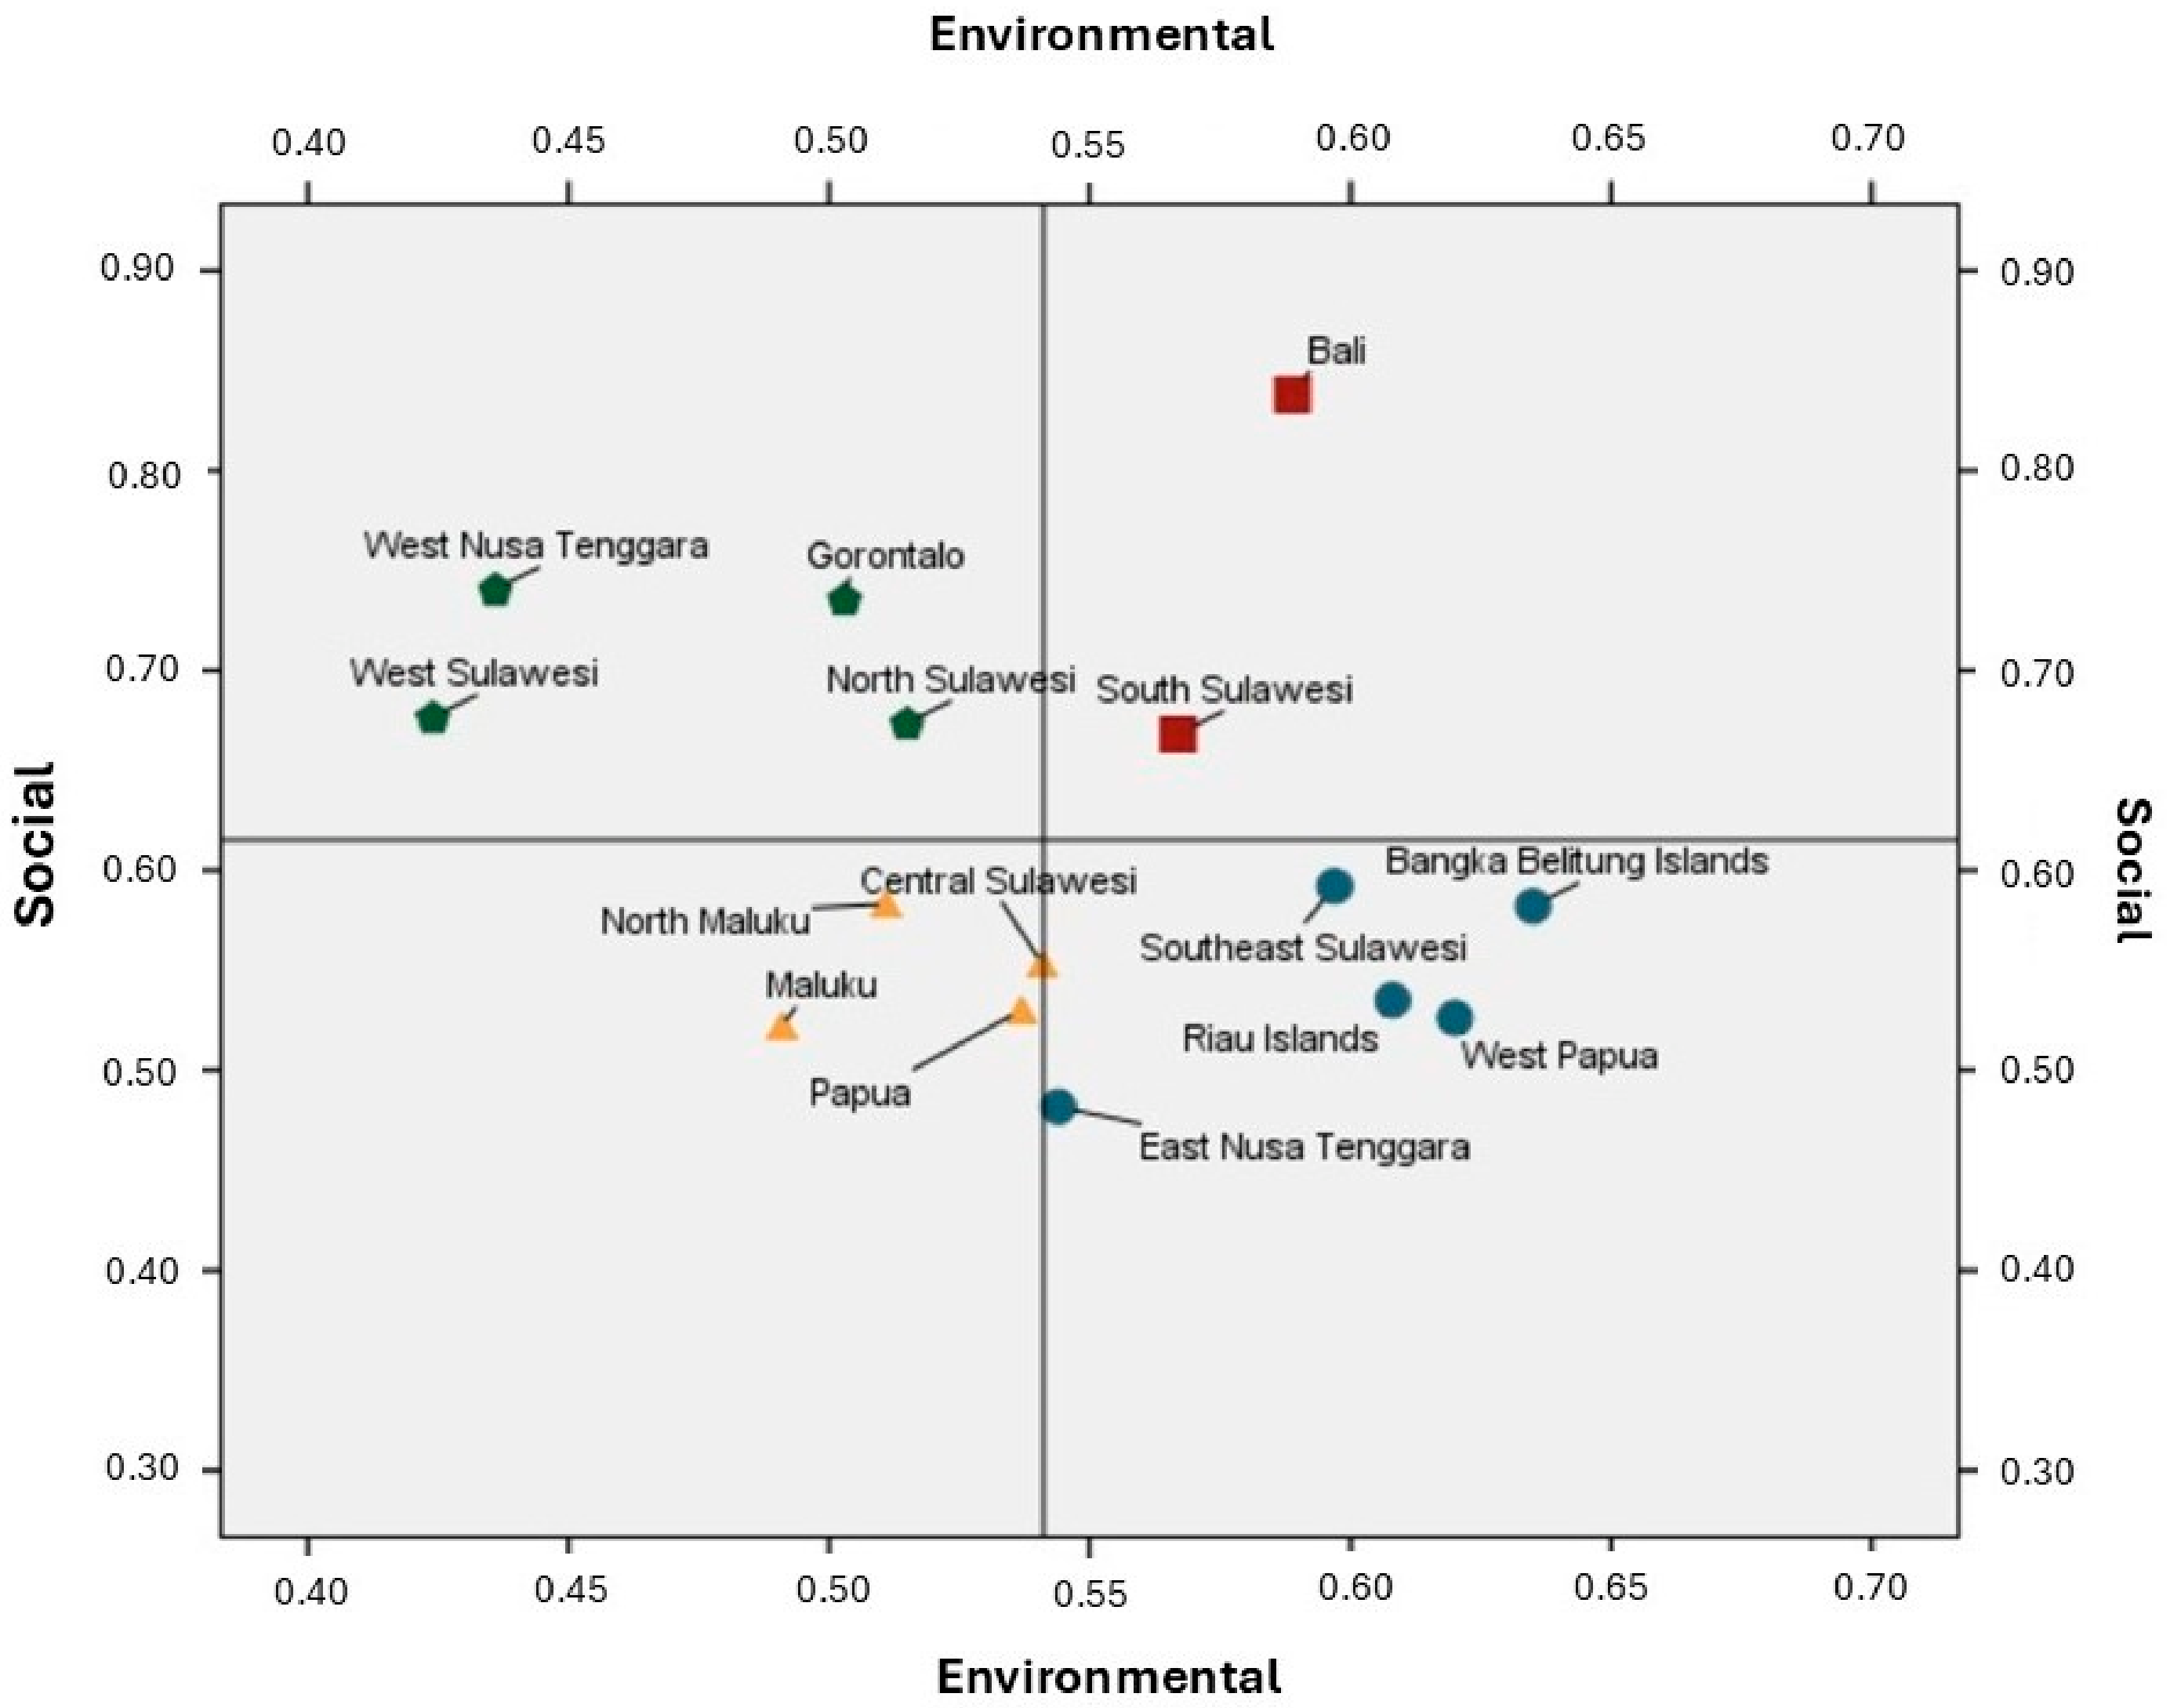
In terms of social and environmental performance (Figure 7), 2 of the 15 provinces—Bali and South Sulawesi—score highly on both dimensions, indicating that resource use there has a positive impact on social conditions and the environment. Conversely, four provinces—Central Sulawesi, North Maluku, Maluku, and Papua—exhibit relatively low performance in both social and environmental dimensions. These are also mining regions, where such activities have not contributed positively to community well-being and have instead caused environmental degradation in coastal areas. The rapid expansion of nickel mining activities in coastal areas has exerted significant pressure on coastal ecosystems, leading to environmental degradation. Such degradation reduces the availability of fishing grounds, thereby constraining fishermen’s ability to harvest marine resources and ultimately undermining their livelihoods. A growing body of evidence indicates that the nickel industry adversely affects marine catch yields [52]. This is further corroborated by data from Statistics Indonesia (BPS), which report that the Fishermen’s Terms of Trade (NTN) in Central Sulawesi Province in 2024 stood at only 93.61. This relatively low figure reflects the vulnerability and limited welfare of coastal communities, highlighting the socio-economic consequences of environmentally unsustainable resource exploitation. These findings align with Rahma et. al. [55], who found that there is a trade-off between social and environmental dimensions, particularly in mining areas.

4.3. Policy Implication

This study’s results indicate unequal performance in marine economic development among Indonesian provinces, driven by varying contributions across economic, social, and environmental dimensions. This implies that sustainable marine economic development cannot be achieved through sea-based economic growth alone, but requires a balance between economic productivity, the social resilience of coastal communities, and the health of marine ecosystems. Consequently, national policies must ensure that each province not only increases value added in the marine sector but also strengthens social protection for coastal communities—particularly fishers; improves access to basic services in coastal areas; and mitigates pressure on marine resources through a blue economy approach.
The findings also show that the relative contribution of each dimension varies by province, underscoring the need for marine economic development policies that are contextual and tailored to regional conditions. Provinces that are economically strong but socially or environmentally weak should be guided to rebalance their development strategies by strengthening the capacity of coastal communities and promoting the responsible use of marine resources. Conversely, provinces with strong environmental performance but weaker economic and social outcomes need support through downstream development of marine products, improved market access, and sustainable investment. Based on the GRA results, policy priorities should be aligned with each province’s dimensional profile so that the transformation of marine economic development proceeds in an inclusive, non-exploitative, and sustainable manner over the long term, for the welfare of Indonesia’s people and marine ecosystems.

4.4. Sensitivity Test

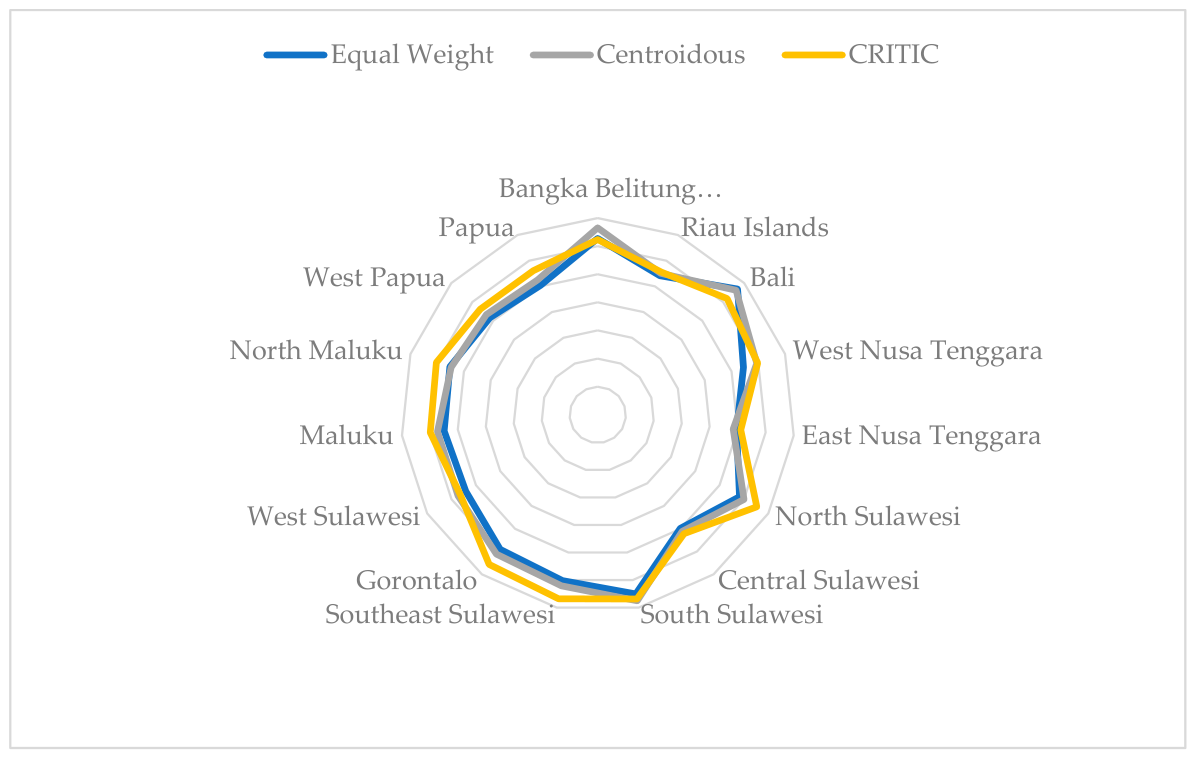
Sensitivity analysis was carried out to evaluate the robustness of the proposed framework by testing the stability of results under alternative weighting assumptions. In general, robustness can be assessed through several approaches, including modifying weighting schemes, adding or removing variables, changing the observation period, or applying different normalization techniques [38,55]. In this study, robustness was examined by comparing Grey Relational Analysis (GRA) outcomes obtained from two weighting methods. The baseline model applied an equal-weight scheme (EW), as discussed in the previous section, and was then re-estimated using the Centroidous method and CRITIC method. The resulting grey relational grades (GRGs) are shown in Figure 8.
Figure 8 indicates that the Centroidous method, CRITIC Method and equal-weight methods yield highly consistent performance patterns across provinces, with only minor differences in GRG values for South Sulawesi, Gorontalo, and North Maluku. Overall, the close similarity in GRG patterns across the two weighting schemes suggests that the evaluation is stable with respect to changes in weighting assumptions, indicating that the model is robust (unbiased).
A comparison of the weighting results using the Centroidous and CRITIC methods (Table 6) shows a high degree of consistency at the dimension level. Both methods identified the social dimension as the most important (0.377 and 0.378), followed by the economic dimension (0.344 and 0.352), while the environmental dimension received the lowest weighting (0.279 and 0.270). This similarity indicates that the relative importance of the key dimensions is robust and not significantly influenced by the choice of weighting method, suggesting a stable underlying data structure at the aggregate level.
Conversely, differences become more pronounced at the indicator level, particularly within the social dimension. The Centroidous method tends to provide more balanced weighting and emphasizes representative indicators such as Soc6 and Soc5, while the CRITIC method prioritizes indicators with higher variability and lower correlation, such as Soc1 and Soc2. A similar, though less pronounced, pattern is observed for the economic and environmental dimensions. These findings highlight that although both methods produce consistent results at the macro level, the choice of weighting technique plays a crucial role in determining the relative importance of each indicator, which may ultimately influence the evaluation results.
The consistency of provincial rankings under the two weighting methods was assessed using Spearman’s rank correlation coefficient. The Spearman coefficient was 0.94 (EW-Centroidous), 0.91 (EW-CRITIC), and 0.88 (Centoridous-CRITIC), indicating a strong positive relationship between provincial rankings across three weighting schemes. This result implies that the interprovincial ranking structure is largely preserved despite changes in weights, supporting the robustness of the evaluation.
Robustness was further examined using Mean Absolute Percentage Error (MAPE) and Mean Squared Error (MSE) to quantify the relative and absolute differences in GRG values between the three weighting approaches. The MAPE was 3.70% and the MSE was 0.000057 for SW-Centroidous; the MAPE was 7.21% and the MSE was 0.00210 for EW-CRITIC; and the MAPE was 5.01% and the MSE was 0.00116 for Centroidous-CRITIC, showing that the average discrepancy in GRG scores between same weighting, Centroidous, and CRITIC are relatively small. With MAPE below 10% and MSE close to zero, the model demonstrates a high degree of robustness and limited sensitivity to changes in the weighting scheme. The detailed results of the robust analysis under different weighting methods are presented in Table 7.
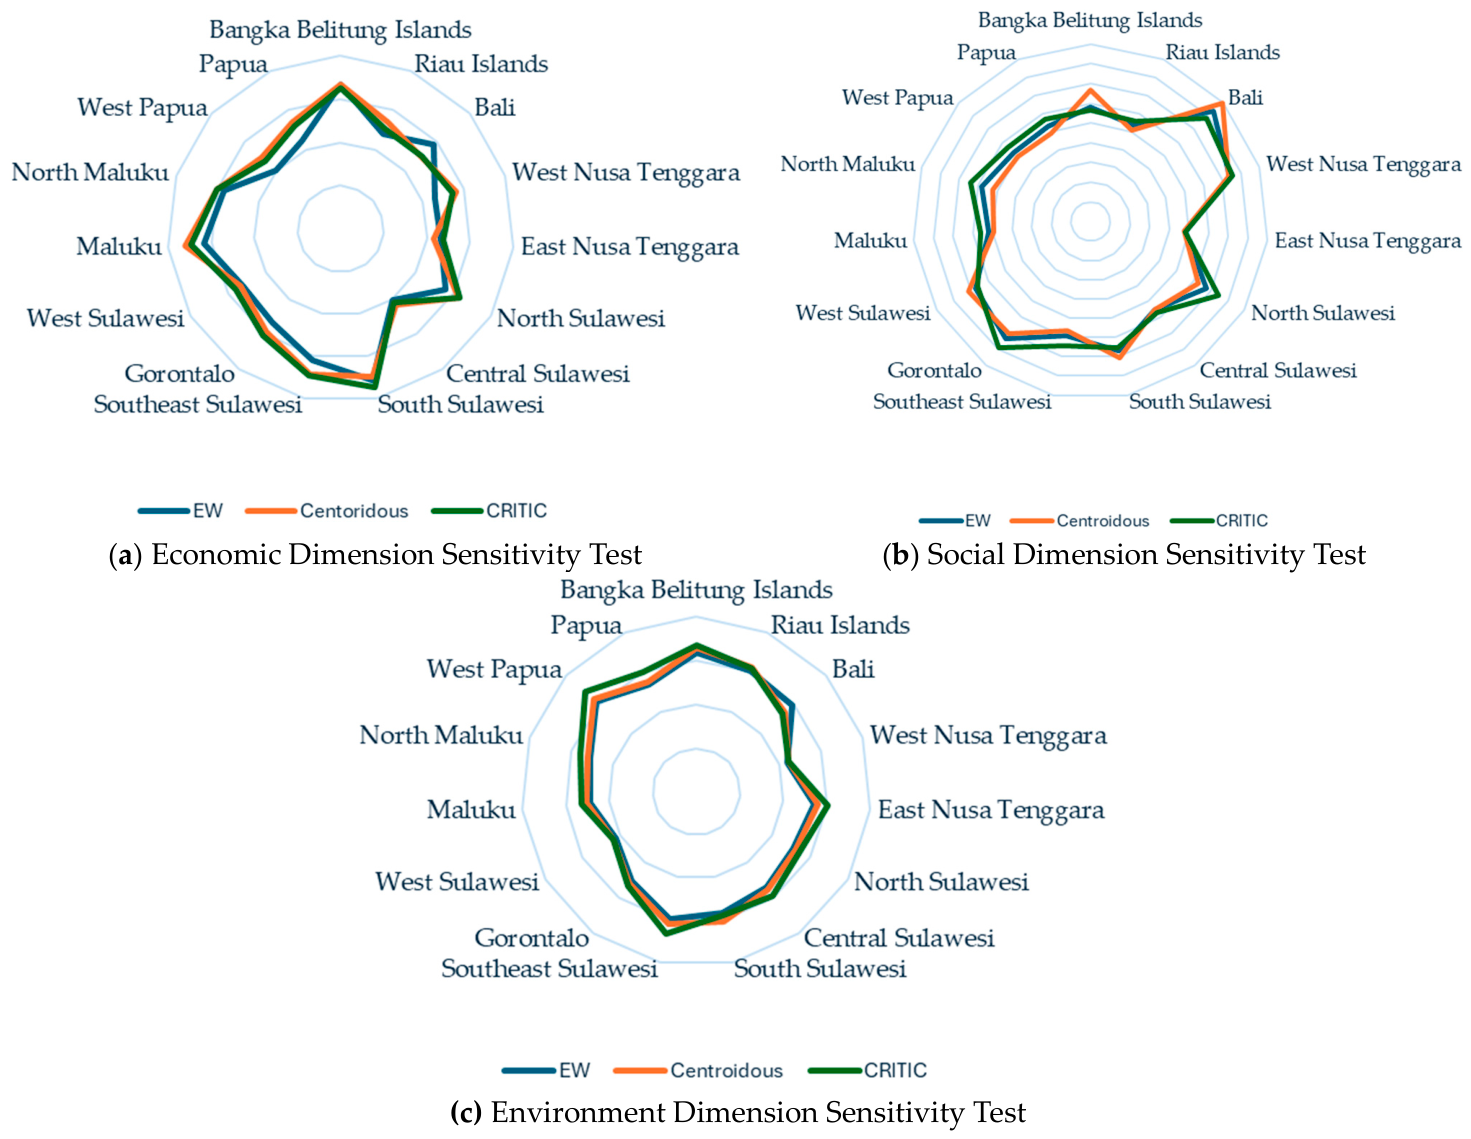
The sensitivity test results for the economic dimension show that provincial performance patterns are broadly similar under both the same-weight, Centroidous, and CRITIC approaches (Figure 9a). This indicates that the marine economic performance index for the economic dimension is generally robust to changes in indicator weights. Nonetheless, several provinces—such as Bali—achieve higher scores under the same-weight method. In particular, South Sulawesi experiences a notable score increase with CRITIC compared to same weighting and Centroidous. This divergence reflects the high variability in economic indicators in that province, which leads to greater weights under the CRITIC scheme.
For the social dimension, the sensitivity analysis likewise reveals that provincial performance patterns are largely consistent across both weighting methods, suggesting that the social dimension index of marine economic development is stable with respect to changes in indicator weights (Figure 9b). However, differences in index values are observed in several regions, particularly Bali, Bangka Belitung Islands, South Sulawesi, and West Sulawesi, which achieve higher scores with CRITIC than same weighting and Centroidous. This indicates that the social indicators that represent strengths in these regions exhibit high interprovincial variation and therefore receive larger weights under the CRITIC method. Overall, these findings confirm that the social dimension performance index is robust.
For the environmental dimension, the sensitivity test shows that the distribution of values obtained from the same weight, Centroidous, and CRITIC are generally similar, indicating that the environmental performance index is also relatively stable with respect to changes in indicator weights (Figure 9c). Even so, several provinces experience marked shifts in scores. Bali, for example, scores higher under same-weight than other weighting methods, implying that its strong environmental indicators have substantial discriminating power across provinces and therefore obtain higher weights in the same-weight framework. Overall, these results underscore the robustness of the environmental index while highlighting that sensitivity in specific provinces should be carefully considered by researchers and policy makers when interpreting regional performance in the environmental dimension of marine economic development in Indonesia.

5. Conclusions

This study concludes that marine economic development in Indonesia exhibits significant disparities across provinces when assessed from a sustainability perspective. Using the Grey Relational Analysis (GRA) method, the findings reveal that Bali Province demonstrates the highest level of performance, indicating a relatively balanced achievement across economic, social, and environmental dimensions. In contrast, East Nusa Tenggara shows the lowest performance, reflecting persistent structural challenges and imbalances in sustainable marine development. These variations highlight the unequal capacity of regions in managing and utilizing marine resources sustainably.
These results demonstrate that successful marine economic development cannot be achieved solely by expanding marine-based economic activities; it also requires simultaneous strengthening of coastal communities’ social capacity and improvement in marine ecosystem quality. This study offers a robust framework for sustainable marine economic development, promoting the use of marine resources that consistently prioritize environmental sustainability while delivering tangible benefits to coastal communities. This insight is valuable for informing decision-making and policy-making processes related to marine resource management. Overall, the findings underscore the importance of adopting a blue economy approach that integrates economic productivity, social equity, and environmental conservation to ensure an inclusive and sustainable transformation of marine economic development over the long term.
Future research could employ panel data and longitudinal data to capture performance dynamics over time and incorporate additional evaluation methods such as Data Envelopment Analysis (DEA) to measure efficiency, system dynamics, or spatial analysis to examine interregional linkages, thereby enhancing assessment accuracy. Further studies may also focus on specific marine subsectors, such as marine aquaculture and marine tourism, and integrate institutional, policy, and technological variables into the evaluation of marine economic development in Indonesia. In addition, future research could develop more context-specific weighting schemes by incorporating participatory approaches or other multi-criteria decision-making methods.

Author Contributions

D.Z.P. initiated the research; collected, processed, and interpreted the data; and wrote the manuscript. A.F. contributed to the interpretation of the data and provided critical interpretation and manuscript writing. H.R. contributed to the design, computation, interpretation, and manuscript writing. B.J. supervised the work and provided additional comments on the results and interpretations. All authors have read and agreed to the published version of the manuscript.

Funding

This research received no external funding.

Informed Consent Statement

Not applicable.

Data Availability Statement

The original contributions presented in this study are included in the article. Further inquiries can be directed to the corresponding author.

Acknowledgments

This research was supported by The Center for Financing and Assessment of Higher Education (PPAPT), Indonesian Education Scholarship Program (BPI), Ministry of Higher Education, Science, and Technology of the Republic of Indonesia (Kemendiktisaintek RI), and the Indonesia Endowment Funds for Education (LPDP RI) for supporting the doctoral study at IPB University under the Indonesian Education Scholarship scheme (Scholarship ID: 202209091409; Contract Number: 00929/J5.2.3/BPI.06/9/2022, dated 9 September 2022).

Conflicts of Interest

The authors declare no conflicts of interest.

References

  1. Ni, X.; Quan, Y. Measuring the Sustainable Development of Marine Economy Based on the Entropy Value Method: A Case Study in the Yangtze River Delta, China. Sustainability 2023, 15, 6719. [Google Scholar] [CrossRef]
  2. Fei, P.; Caizhi, S.; Tianbao, L.; Ying, L.; Wei, H. Temporal and Spatial Evolution of Vulnerability and Coordination of Marine Eco-Economic System in Coastal Area of China. Econ. Geogr. 2018, 38, 165–174. [Google Scholar]
  3. Elston, J.; Pinto, H. Tides of Change for a Sustainable Blue Economy: A Systematic Literature Review of Innovation in Maritime Activities. Sustainability 2024, 16, 11141. [Google Scholar] [CrossRef]
  4. Ji, J.; Chi, Y.; Yin, X. Research on the driving effect of marine economy on the high-quality development of regional economy–Evidence from China’s coastal areas. Reg. Stud. Mar. Sci. 2024, 74, 103550. [Google Scholar] [CrossRef]
  5. Winther, J.-G.; Dai, M.; Rist, T.; Hoel, A.H.; Li, Y.; Trice, A.; Morrissey, K.; Juinio-Meñez, M.A.; Fernandes, L.; Unger, S.; et al. Integrated ocean management for a sustainable ocean economy. Nat. Ecol. Evol. 2020, 4, 1451–1458. [Google Scholar] [CrossRef]
  6. Hong, K.; Guan, X. The Effects of Ocean Governance on Marine Economic Development from an Environmental Optimization Perspective. Water 2024, 16, 1900. [Google Scholar] [CrossRef]
  7. Bappenas. Blue Economy Development Framework for Indonesia’s Economic Transformation; Bappenas: Jakarta, Indonesia, 2021; Volume 1.
  8. BPS. Laporan Hasil Perhitungan Produk Domestik Bruto Maritim Indonesia 2017–2021. 2023. Available online: https://www.bps.go.id/subject/171/produk-domestik-regional-bruto--pengeluaran-.html#subjekViewTab2 (accessed on 3 July 2024).
  9. BPS. Statistik Sumber Daya Laut dan Pesisir 2023; Badan Pusat Statistik: Jakarta, Indonesia, 2023; Volume 20.
  10. KKP. Estimasi Potensi, Jumlah Tangkapan Yang Diperbolehkan, dan Tingkat Pemanfaatan Sumber Daya Ikan di WPPNRI. 2025. Available online: https://portaldata.kkp.go.id/portals/data-statistik/jtb-potensi-sdi/tbl-dinamis (accessed on 3 July 2024).
  11. Kementerian Kelautan dan Perikanan. Bijak Mengelola Laut Untuk Ekonomi Biru; Kementerian Kelautan dan Perikanan Republik Indonesia: Jakarta, Indonesia, 2024.
  12. Liu, P.; Liu, X.; Yang, H. Evaluation of the marine economic development quality in Qingdao based on entropy and grey relational analysis. Mar. Econ. Manag. 2019, 2, 29–38. [Google Scholar] [CrossRef]
  13. Song, W.; Guo, J.; Wang, Y.; Li, L. An evaluation of the development of the Ocean Economy in China using an Ocean Economic Development Index. Mar. Policy 2021, 132, 104691. [Google Scholar] [CrossRef]
  14. Liu, B.; Xu, M.; Wang, J.; Wang, Z.; Zhao, L. Evaluation of China’s marine economic growth quality based on set pair analysis. Mar. Policy 2021, 126, 104405. [Google Scholar] [CrossRef]
  15. Zhang, Q. Regional marine economic development and gray prediction based on comprehensive evaluation system. J. Coast. Res. 2020, 112, 191–194. [Google Scholar] [CrossRef]
  16. Park, D.K.S.; Kildow, D.J.T. Rebuilding the Classification System of the Ocean Economy. J. Ocean Coast. Econ. 2015, 2014, 4. [Google Scholar] [CrossRef]
  17. Fauzi, A. Teknik Analisis Keberlanjutan; PT Gramedia Pustaka Utama: Jakarta, Indonesia, 2019. [Google Scholar]
  18. Liang, J.; Yin, Z.; Yang, J.; Li, Y.; Xu, M.; Li, J.; Yang, M.; Niu, L. Bibliometrics and visualization analysis of research in the field of sustainable development of the blue economy (2006–2021). Front. Mar. Sci. 2022, 9, 1–16. [Google Scholar] [CrossRef]
  19. Purvis, B.; Mao, Y.; Robinson, D. Three pillars of sustainability: In search of conceptual origins. Sustain. Sci. 2019, 14, 681–695. [Google Scholar] [CrossRef]
  20. Barbier, E.B.; Burgess, J.C. The sustainable development goals and the systems approach to sustainability The Sustainable Development Goals and the systems approach to sustainability. Econ. Open-Assesssment E-J. 2017, 11, 1–23. [Google Scholar] [CrossRef]
  21. World Bank and UN DESA. The Potential of the Blue Economy; World Bank: Washington, DC, USA, 2017. [Google Scholar] [CrossRef]
  22. Prayuda, R.; Sary, D.V.; Riau, U.I. Strategi Indonesia Dalam Implementasi Konsep Blue Economy Terhadap Pemberdayaan Masyarakat Pesisir Di Era Masyarakat Ekonomi Asean. Indones. J. Int. Relat. 2019, 3, 46–64. [Google Scholar] [CrossRef]
  23. Evans, T.; Fletcher, S.; Failler, P.; March, A.; Potts, J. Journeys of change towards the blue economy: Evaluating process in transformational change. Reg. Environ. Change 2024, 24, 1–15. [Google Scholar] [CrossRef]
  24. Geng, B.; Wu, D.; Zhang, C.; Xie, W.; Mahmood, M.A.; Ali, Q. How Can the Blue Economy Contribute to Inclusive Growth and Ecosystem Resources in Asia? A Comparative Analysis. Sustainability 2024, 16, 429. [Google Scholar] [CrossRef]
  25. Mistri, P.; Mistry, A.K. Blue Economy: A Sustainable Development Paradigm. In Sustainable Roadmap Development Strategies in India: Paving the Way for a Better Future; Lincoln University College: Petaling Jaya, Malaysia, 2023; pp. 58–70. [Google Scholar] [CrossRef]
  26. Alhowaish, A.K. Governing the blue economy in arid coastal regions: Opportunities, constraints, and stakeholder perspectives from the Eastern Province coast of Saudi Arabia. Front. Mar. Sci. 2026, 13, 1–19. [Google Scholar] [CrossRef]
  27. Zhang, Z.; Zhang, C. Revisiting the importance of forest rents, oil rents, green growth in economic performance of China: Employing time series methods. Resour. Policy 2023, 80, 103140. [Google Scholar] [CrossRef]
  28. Nguyen, N.B. How does a sustainable ocean economy affect national GDP ? Cogent Econ. Financ. 2024, 12, 2435926. [Google Scholar] [CrossRef]
  29. Alhowaish, A.K. The hidden currents of marine economies: Assessing informal market behavior across fi sheries, tourism, and logistics in Saudi Arabia’ s Eastern Province. Front. Mar. Sci. 2026, 13, 1750173. [Google Scholar] [CrossRef]
  30. Pakkar, M.S. An integrated approach to grey relational analysis, analytic hierarchy process and data envelopment analysis. J. Cent. Cathedra 2016, 9, 71–86. [Google Scholar] [CrossRef]
  31. Kuo, M.S.; Liang, G.S. Combining VIKOR with GRA techniques to evaluate service quality of airports under fuzzy environment. Expert Syst. Appl. 2011, 38, 1304–1312. [Google Scholar] [CrossRef]
  32. Alshuwaikhat, H.M.; Adenle, Y.A.; Alotaishan, T.N. The development of a grey relational analysis-based composite index for environmental sustainability assessment: Towards a net-zero emissions strategy in Saudi Arabia. Heliyon 2023, 9, e18192. [Google Scholar] [CrossRef]
  33. Abid, N.; Ceci, F.; Ikram, M. Green growth and sustainable development: Dynamic linkage between technological innovation, ISO 14001, and environmental challenges. Environ. Sci. Pollut. Res. 2022, 29, 25428–25447. [Google Scholar] [CrossRef]
  34. Ertugrul, I.; Oztas, T.; Ozcil, A.; Oztas, G.Z. Grey Relational Analysis Approach In Academic Performance Comparison of University: A Case Study of Turkish Universities. Eur. Sci. J. 2016, 12, 1857–7881. [Google Scholar]
  35. Zhu, J.; Zhang, S.; Chen, Y.; Zhang, L. A Hierarchical Clustering Approach Based on Three-Dimensional Gray Relational Analysis for Clustering a Large Group of Decision Makers with Double Information. Gr. Decis. Negot. 2016, 25, 325–354. [Google Scholar] [CrossRef]
  36. Singh, U.K.; Kumar, M.; Chauhan, R.; Jha, P.K.; Ramanathan, A.L.; Subramanian, V. Assessment of the impact of landfill on groundwater quality: A case study of the Pirana site in western India. Environ. Monit. Assess. 2008, 141, 309–321. [Google Scholar] [CrossRef] [PubMed]
  37. Joint Research Centre. Handbook on Constructing Composite Indicators; OECD Publishing: Paris, France, 2008; Available online: https://www.oecd.org/en/publications/handbook-on-constructing-composite-indicators-methodology-and-user-guide_9789264043466-en.html (accessed on 3 July 2024).
  38. Greco, S.; Ishizaka, A.; Tasiou, M.; Torrisi, G. On the Methodological Framework of Composite Indices: A Review of the Issues of Weighting, Aggregation, and Robustness. Soc. Indic. Res. 2019, 141, 61–94. [Google Scholar] [CrossRef]
  39. Zhu, Y.; Tian, D.; Yan, F. Effectiveness of Entropy Weight Method in Decision-Making. Math. Probl. Eng. 2020, 2020, 3564835. [Google Scholar] [CrossRef]
  40. Rasoanaivo, R.G. Decision Support System Using Centroidous and CoCoFISo Methods for Analyzing Resource Availability in High Schools. J. Oper. Intell. 2025, 3, 202–231. [Google Scholar] [CrossRef]
  41. Vinogradova-Zinkevič, I. Centroidous Method for Determining Objective Weights. Mathematics 2024, 12, 2269. [Google Scholar] [CrossRef]
  42. Uyala, S.B.; Uyala, S.; Jannu, S.; Gadakh, V.S. Multi-Objective Optimization OF Machining Parameters for EDM of Magnesium ALLOY- ZE41 Using Marcos Algorithm and Different Weighing Methods: SD, CRITIC and MEREC. Int. J. Mod. Manuf. Technol. 2024, XVI, 124–140. [Google Scholar] [CrossRef]
  43. Abirami, M.; Das, D. Multi-criteria evaluation of green microalgal variants for biodiesel using an integrated CRITIC–BWM–CoCoSo screening framework. Biomass Bioenergy 2026, 210, 109063. [Google Scholar] [CrossRef]
  44. Chen, Y. Exploring Sustainable Development Paths for Marine Resources and the Marine Economy. Sci. Technol. Eng. Chem. Environtmental Prot. 2025, 1, 1–5. [Google Scholar] [CrossRef]
  45. Hania, R.; Akhmad, F.; Bambang, J.; Bambang, W. Fenomena Natural Resiurce Curse dalam Pembangunan Wilayah di Indonesia. J. Ekon. Pembang. Indones. 2021, 21, 2. [Google Scholar] [CrossRef]
  46. Kementerian Kelautan dan Perikanan. Laporan Kinerja Tahun 2022 Kementerian Kelautan dan Perikanan; Kementerian Kelautan dan Perikanan: Jakarta, Indonesia, 2022.
  47. Barbier, E.B. Marine ecosystem services. Curr. Biol. 2017, 27, R507–R510. [Google Scholar] [CrossRef]
  48. OECD. Sustainable Ocean for All: Harnessing the Benefits of Sustainable Ocean Economies for Developing Countries, the Development Dimension; OECD Publishing: Paris, France, 2020. [Google Scholar] [CrossRef]
  49. UNEP. Transformations for a Sustainable Ocean Economy; UNEP: Nairobi, Kenya, 2021. [Google Scholar]
  50. Hadijah, S. Kajian Perumusan Permasalahan dan Isu Strategis Pembangunan Provinsi Sulawesi Tengah Tahun 2025–2029. J. Sos. Teknol. 2025, 5, 981–997. [Google Scholar] [CrossRef]
  51. Kusumo, P.; Fikri, B. Potensi Diversifikasi Ekonomi Maluku Utara; CELIOS (Center of Economic and Law Studies): Jakarta, Indonesia, 2025. [Google Scholar]
  52. Ayyam, V.; Palanivel, S.; Chandrakasan, S. Balancing Development and Environmental Impact in the Coastal Regions BT-Coastal Ecosystems of the Tropics-Adaptive Management; Ayyam, V., Palanivel, S., Chandrakasan, S., Eds.; Springer: Singapore, 2019; pp. 579–595. [Google Scholar] [CrossRef]
  53. De Vantier, L.; Wilkinson, C.; Souter, D.; South, R.; Skelton, P.; Lawrence, D. Sulu-Celebes (Sulawesi) Sea GIWA Regional Assessment 56; University of Kalmar: Kalmar, Sweden, 2005. [Google Scholar]
  54. Freudenberg, M. Composite Indicators of Country Performance: A Critical Assessment; OECD Publishing: Paris, France, 2003. [Google Scholar]
  55. Rahma, H.; Akhmad, F. Beyond Growth: A Provincial-Level Assessment of the Doughnut Economy’s Potential in Indonesia. Eur. J. Sustain. Dev. 2024, 13, 117–130. [Google Scholar] [CrossRef]
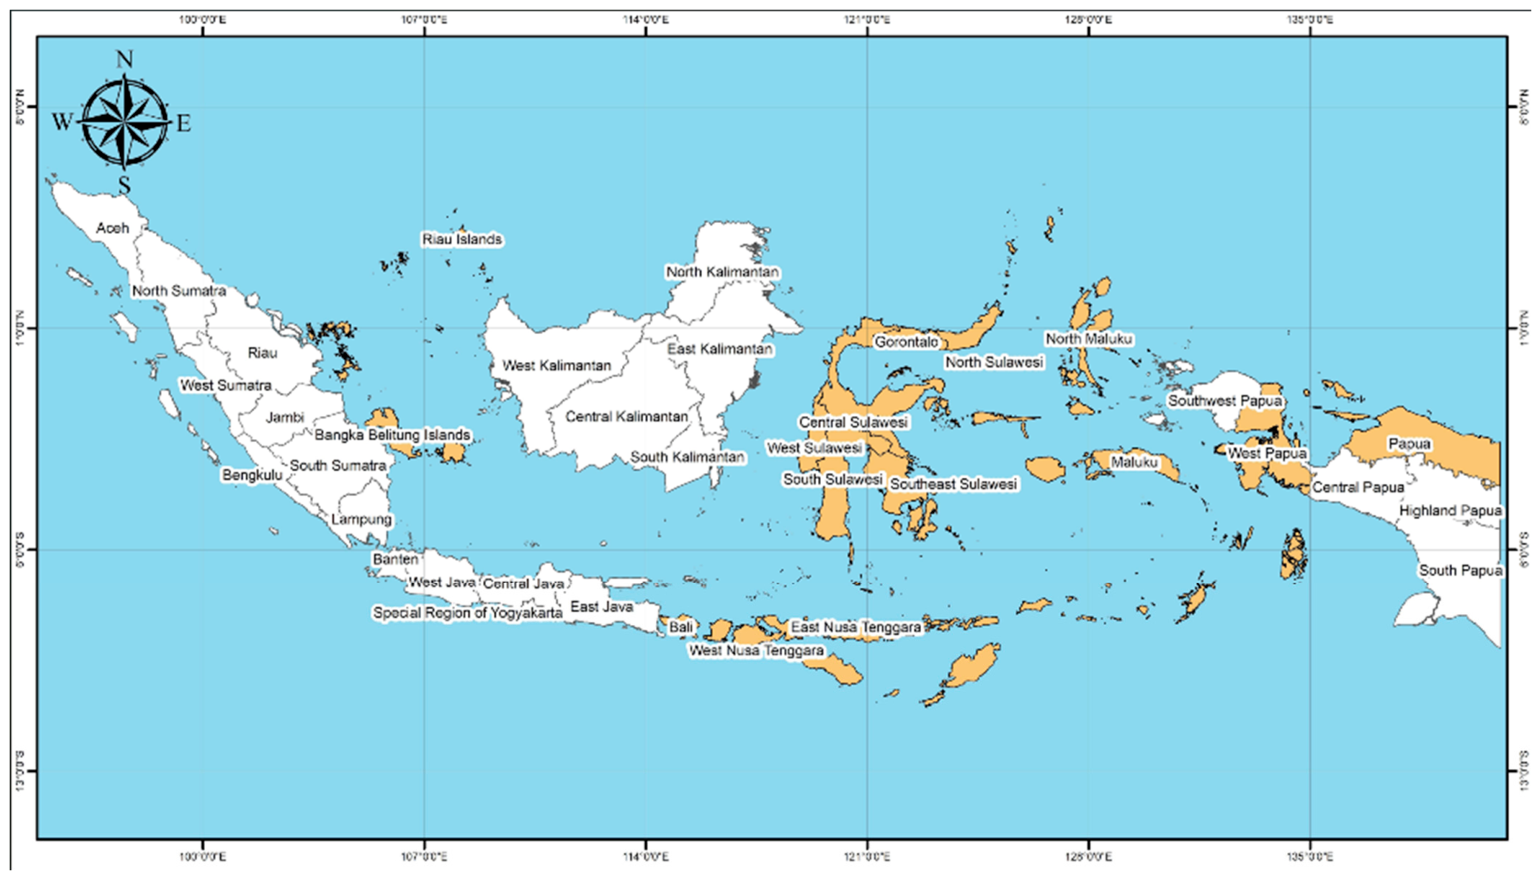
Figure 1. Map of study area. Source: Author’s elaboration based on data from Badan Informasi Geospasial (BIG) and Badan Pusat Statistik (BPS), processed using ArcGis 10.8.
Sustainability 18 04624 g001
Figure 2. Criteria and GRA steps.
Sustainability 18 04624 g002
Figure 3. Grey relational values of 15 provinces in Indonesia.
Sustainability 18 04624 g003
Figure 4. Share of dimensions on marine economic development performance.
Sustainability 18 04624 g004
Figure 5. Performance mapping of economic and social dimensions.
Sustainability 18 04624 g005
Figure 6. Performance mapping of economic and environmental dimensions.
Sustainability 18 04624 g006
Figure 7. Performance mapping of social and environmental dimensions.
Sustainability 18 04624 g007
Figure 8. Sensitivity test to GRG value using 3 different weighting methods.
Sustainability 18 04624 g008
Figure 9. Dimension sensitivity test to GRG value using 2 different weighting methods.
Sustainability 18 04624 g009
Table 1. Indicators for evaluating the performance of sustainable marine economic development.
Indicators aDescriptionAttributesSource
Economic Dimension
Per capita GRDP of fishery sector
(Eco1)
Aggregate income from the fishery sector per
capita (IDR million/cap)
+BPS
Growth rate of the fishery sector
(Eco2)
Average potential growth of the provincial
fishery sector (%)
+KKP Statistics
Productivity of fishery sector
(Eco3)
GRDP of the fishery sector divided by the
number of coastal villages (IDR billion/village)
+BPS
Fisherman’s exchange rate
(Eco4)
Ratio of the price index received (It) to the price
index paid by fishermen (Ib)
+BPS
Marine tourism visits
(Eco5)
Percentage of marine tourism visits to total
tourism visits (%)
+BPS
Industry levels
(Industry)
Average number of industries per coastal village (unit/village)+Podes
Social Dimension
Malnutrition levels
(Soc1)
Average number of malnutrition sufferers per coastal village (people/village)Podes
Level of slum settlements
(Soc2)
Percentage of coastal households living in slums (%)Podes
Access to education
(Soc3)
Average number of schools per village
(units/village)
+Podes
Access to safe water
(Soc4)
Percentage of coastal villages that have access to safe water sources (%)+Podes
Access to sanitation
(Soc5)
Percentage of coastal villages with proper
sanitation (%)
+Podes
Internet access
(Soc6)
Percentage of coastal villages able to access
the internet (%)
+Podes
Crime rate
(Soc7)
Percentage of coastal villages with crime (%)Podes
Environmental Dimension
Pollution
(Env1)
Percentage of coastal villages experiencing water pollution (%)Podes
Mangrove condition
(Env2)
Percentage of coastal villages with mangroves in good condition (%)+Podes
Waste management
(Env3)
Percentage of coastal villages that manage waste
at the source level (%)
+Podes
Disaster
(Env4)
Percentage of coastal villages experiencing natural disasters such as floods/tidal waves/erosion (%)Podes
Cooking fuel
(Env5)
Percentage of coastal villages where the majority
of the population uses kerosene or charcoal or
briquettes or firewood for cooking
Podes
Note: a source: [12,13,14]. “+” is for benefit indicators, and “−” is for cost indicators.
Table 2. Data normalization.
NoProvinceEconomic DimensionSocial DimensionEnvironmental Dimension
Eco1Eco2Eco3Eco4Eco5Eco6Soc1Soc2Soc3Soc4Soc5Soc6Soc7Env1Env2Env3Env4Env5
1Bangka Belitung Islands0.490.730.460.821.000.700.430.480.430.390.970.940.150.041.000.070.960.62
2Riau Islands0.250.070.120.650.770.500.780.590.510.530.180.470.680.841.000.150.260.51
3Bali0.230.320.690.090.771.000.680.761.001.001.001.000.630.000.001.000.740.69
4West Nusa Tenggara0.010.530.230.560.600.271.000.530.950.870.970.770.000.390.390.150.370.42
5East Nusa Tenggara0.000.960.040.000.330.280.000.760.290.260.420.380.721.000.250.120.700.00
6North Sulawesi0.470.920.140.730.280.590.990.910.120.430.890.520.800.760.510.220.630.33
7Central Sulawesi0.310.130.060.170.400.410.670.590.270.660.740.530.550.770.550.090.830.22
8South Sulawesi0.691.001.000.910.180.370.590.570.530.990.970.750.460.520.460.300.331.00
9Southeast Sulawesi1.000.980.180.300.500.370.950.530.150.470.800.410.770.750.440.211.000.41
10Gorontalo0.460.970.240.280.540.370.911.000.180.890.970.650.600.740.570.030.450.50
11West Sulawesi0.470.900.430.310.490.370.640.680.780.690.970.830.560.620.250.000.000.47
12Maluku0.470.890.041.000.720.550.860.380.290.000.600.230.800.910.330.080.470.00
13North Maluku0.210.880.000.440.850.710.860.850.200.310.720.000.810.870.340.130.710.00
14West Papua0.530.000.040.240.460.010.890.000.020.220.240.251.000.900.690.260.950.00
15Papua0.270.510.130.800.000.000.890.280.000.300.000.250.990.730.340.090.950.00
Table 3. Deviation sequence.
ProvinceEconomic DimensionSocial DimensionEnvironmental Dimension
Eco1Eco2Eco3Eco4Eco5Eco6Soc1Soc2Soc3Soc4Soc5Soc6Soc7Env1Env2Env3Env4Env5
1Bangka Belitung Islands0.510.270.540.180.000.300.570.520.570.610.030.060.850.960.000.930.040.38
2Riau Islands0.750.930.880.350.230.500.220.410.490.470.820.530.320.160.000.850.740.49
3Bali0.770.680.310.910.230.000.320.240.000.000.000.000.371.001.000.000.260.31
4West Nusa Tenggara0.990.470.770.440.400.730.000.470.050.130.030.231.000.610.610.850.630.58
5East Nusa Tenggara1.000.040.961.000.670.721.000.240.710.740.580.620.280.000.750.880.301.00
6North Sulawesi0.530.080.860.270.720.410.010.090.880.570.110.480.200.240.490.780.370.67
7Central Sulawesi0.690.870.940.830.600.590.330.410.730.340.260.470.450.230.450.910.170.78
8South Sulawesi0.310.000.000.090.820.630.410.430.470.010.030.250.540.480.540.700.670.00
9Southeast Sulawesi0.000.020.820.700.500.630.050.470.850.530.200.590.230.250.560.790.000.59
10Gorontalo0.540.030.760.720.460.630.090.000.820.110.030.350.400.260.430.970.550.50
11West Sulawesi0.530.100.570.690.510.630.360.320.220.310.030.170.440.380.751.001.000.53
12Maluku0.530.110.960.000.280.450.140.620.711.000.400.770.200.090.670.920.531.00
13North Maluku0.790.121.000.560.150.290.140.150.800.690.281.000.190.130.660.870.291.00
14West Papua0.471.000.960.760.540.990.111.000.980.780.760.750.000.100.310.740.051.00
15Papua0.730.490.870.201.001.000.110.721.000.701.000.750.010.270.660.910.051.00
Table 4. Grey relational coefficient.
NoProvinceEconomic DimensionSocial DimensionEnvironmental Dimension
Eco1Eco2Eco3Eco4Eco5Eco6Soc1Soc2Soc3Soc4Soc5Soc6Soc7Env1Env2Env3Env4Env5
1Bangka Belitung Islands0.500.650.480.741.000.620.470.490.470.450.940.890.370.340.990.350.920.57
2Riau Islands0.400.350.360.590.690.500.700.550.510.520.380.490.610.761.000.370.400.51
3Bali0.390.430.610.350.681.000.610.681.001.001.001.000.580.330.331.000.660.62
4West Nusa Tenggara0.330.520.390.530.560.411.000.520.910.790.950.680.330.450.450.370.440.46
5East Nusa Tenggara0.330.930.340.330.430.410.330.670.410.400.460.450.641.000.400.360.620.33
6North Sulawesi0.490.870.370.650.410.550.980.850.360.470.830.510.710.680.500.390.570.43
7Central Sulawesi0.420.360.350.370.450.460.600.550.410.600.660.510.530.690.530.360.750.39
8South Sulawesi0.621.001.000.840.380.440.550.540.520.970.950.660.480.510.480.420.431.00
9Southeast Sulawesi1.000.960.380.420.500.440.910.520.370.480.710.460.680.670.470.391.000.46
10Gorontalo0.480.940.400.410.520.440.851.000.380.820.950.590.550.660.540.340.480.50
11West Sulawesi0.480.830.470.420.490.440.580.610.700.620.940.750.530.570.400.330.330.49
12Maluku0.490.820.341.000.640.530.780.450.410.330.560.390.720.850.430.350.490.33
13North Maluku0.390.800.330.470.770.630.790.770.380.420.640.330.720.800.430.370.630.33
14West Papua0.510.330.340.400.480.330.820.330.340.390.400.401.000.830.620.400.920.33
15Papua0.410.500.370.710.330.330.820.410.330.420.330.400.980.650.430.350.920.33
Table 5. Grey relational grade.
NoProvinceGRG of Economic DimentionGRG of Social DimentionGRG of Environmental DimensionGRG
1Bangka Belitung Islands0.6650.5820.6350.628
2Riau Islands0.4820.5350.6080.542
3Bali0.5790.8380.5890.669
4West Nusa Tenggara0.4570.7400.4360.544
5East Nusa Tenggara0.4630.4820.5440.496
6North Sulawesi0.5570.6730.5150.582
7Central Sulawesi0.4030.5510.5410.499
8South Sulawesi0.7150.6680.5670.650
9Southeast Sulawesi0.6180.5920.5970.602
10Gorontalo0.5340.7350.5030.591
11West Sulawesi0.5240.6760.4240.542
12Maluku0.6370.5200.4910.549
13North Maluku0.5670.5810.5110.553
14West Papua0.4010.5260.6200.516
15Papua0.4440.5280.5370.503
Table 6. Comparison of dimension weighting results and indicators.
DimensionDimensional WeightIndicatorsIndicator Weight
CentroidousCRITICCentroidousCRITIC
Economy0.3440.352Eco10.1750.149
Eco20.1330.208
Eco30.0880.154
Eco40.2430.186
Eco50.2000.166
Eco60.1610.137
Social0.3770.378Soc10.0600.250
Soc20.0620.187
Soc30.1140.073
Soc40.1370.122
Soc50.1940.145
Soc60.2910.092
Soc70.1420.130
Environmental0.2790.270Env10.2210.257
Env20.1970.174
Env30.0960.064
Env40.2190.290
Env50.2660.214
Table 7. Results of robustness test of GRA models with different weighting methods.
NoProvinceGRGRankSW-CentroidousSW-CRITICCentroidous-CRITIC
SWCentroidousCRITICSWCentroidousCRITIC∆RankAPESE∆RankAPESE∆RankAPESE
1Bangka Belitung Islands0.6280.6650.62432515.990.0014−20.620.0000−36.230.0017
2Riau Islands0.5420.5510.55610101301.650.0001−32.560.0002−30.900.0000
3Bali0.6690.6620.618136−21.040.0000−57.530.0025−36.560.0019
4West Nusa Tenggara0.5440.5940.59797929.090.002409.700.0028−20.560.0000
5East Nusa Tenggara0.4960.4840.51115151502.530.000202.980.000205.650.0007
6North Sulawesi0.5820.6000.65366403.220.0004212.250.005128.740.0028
7Central Sulawesi0.4990.5110.52214141402.580.000204.670.000502.030.0001
8South Sulawesi0.6500.6750.66821113.870.000612.800.000301.030.0000
9Southeast Sulawesi0.6020.6210.66844203.070.0003210.970.004427.660.0023
10Gorontalo0.5910.6120.65755303.650.0005211.240.004427.330.0020
11West Sulawesi0.5420.5740.5641181035.940.001014.230.0005−21.620.0001
12Maluku0.5490.5730.599898−14.360.000609.000.002414.440.0006
13North Maluku0.5530.5480.6037117−40.850.000009.030.002549.970.0030
14West Papua0.5160.5330.56212121103.260.000318.940.002115.500.0009
15Papua0.5030.5250.56213131204.420.0005111.630.003416.910.0013
Disclaimer/Publisher’s Note: The statements, opinions and data contained in all publications are solely those of the individual author(s) and contributor(s) and not of MDPI and/or the editor(s). MDPI and/or the editor(s) disclaim responsibility for any injury to people or property resulting from any ideas, methods, instructions or products referred to in the content.