Article

Pathways Toward Carbon Peaking and Deep Decarbonization in the Yellow River Basin: Evidence from Tapio Decoupling, GTWR, and Scenario Analysis

1
School of Civil Engineering and Geomatics, Shandong University of Technology, Zibo 255000, China
2
Business School, Shandong University of Technology, Zibo 255000, China
*
Authors to whom correspondence should be addressed.
Sustainability 2026, 18(15), 7606; https://doi.org/10.3390/su18157606
Submission received: 20 June 2026 / Revised: 13 July 2026 / Accepted: 22 July 2026 / Published: 27 July 2026

Abstract

In the context of China’s carbon peaking and carbon neutrality goals, clarifying whether the Yellow River Basin can achieve a decoupling of economic growth from carbon emissions and sustain regional development through deep decarbonization is critical to both ecological protection and high-quality development of the region. This study integrates the Tapio decoupling model, the geographically and temporally weighted regression (GTWR) model, and an author-developed LEAP-YRB v5 macro-sectoral hybrid model to examine 95 prefecture-level cities from 2010 to 2022 and to project energy consumption and carbon emissions for the nine YRB provincial-level regions from 2022 to 2060. The results show that: (1) the urban decoupling status fluctuated among expansive coupling, strong decoupling, and weak decoupling, with weak decoupling becoming dominant and increasing to 62 cities in 2022; (2) per capita GDP and urbanization tended to increase the decoupling index and therefore inhibited decoupling, whereas more intensive construction-land use promoted decoupling, and industrial structure upgrading and green patents showed context-dependent effects; and (3) the basin cannot peak its emissions under the business-as-usual scenario, while the policy-driven scenario peaks at approximately 3.357 billion tons of CO2 around 2030. Under the carbon-neutrality-oriented scenario, net emissions decline substantially to 825 million tons by 2060, indicating deep decarbonization but not full carbon neutrality. Full neutrality would require additional carbon sinks, cross-regional clean-electricity integration, stronger power-sector decarbonization, or negative-emission technologies beyond the endogenous measures represented in the model.

1. Introduction

As global climate change intensifies, posing enormous threats to the environment on which human survival depends [1,2,3], achieving carbon neutrality is increasingly becoming a consensus among nations and represents a core initiative for implementing the United Nations Sustainable Development Goals (SDGs). Through the evolution of thirty United Nations Climate Change Conferences, global carbon emission governance has formally transitioned from the “target-setting” stage into the deep-water zone of “implementation.” According to statistics from the International Energy Agency (IEA), China’s CO2 emissions reached 10.62 billion tons in 2022, accounting for 31.06% of the global total CO2 emissions, representing a 134% increase since 2000, making China the world’s largest carbon emitter. China has pledged to achieve peak carbon emissions before 2030 and carbon neutrality before 2060 [4,5].
The YRB is endowed with superior mineral resource endowments, and the exploitation of coal, oil, and natural gas plays a critical role in China’s energy supply, chemical industry, raw material production, and basic industrial system. Ecological protection and high-quality economic development in the YRB require adhering to the concept of green development, taking “economic growth with declining carbon emissions” as the ideal objective, and achieving asynchronous changes between the two [6]. If economic expansion remains highly dependent on fossil fuel consumption, resulting in synchronous growth of carbon emissions, it will lead to multiple adverse consequences: energy-intensive industries are prone to technological lock-in, technological upgrading lags behind, enterprises face trade barriers such as carbon tariffs, and international competitiveness is continuously eroded; the deterioration of air quality induces respiratory diseases, and extreme climate events increase the medical burden, with more pronounced impacts on low-income groups; sustained carbon emissions exceed the carbon sink capacity of ecosystems, exacerbating global warming and triggering irreversible changes such as glacier melting and sea-level rise, directly threatening the safety of coastal cities; climate anomalies cause uneven precipitation and frequent high temperatures in the YRB, leading to yield reductions in wheat and corn and jeopardizing national grain reserves. Therefore, promoting the coordinated development of economic growth and ecological protection in the YRB is crucial for achieving China’s “30–60” dual carbon goals and will exert a profound influence on the global process of addressing climate change [7].
Existing studies have primarily employed the Tapio decoupling model [8] to empirically investigate the spatiotemporal dynamic evolution characteristics of the decoupling relationship between economic growth and carbon emissions at the provincial level in China [9,10]. The majority of scholars have focused their research perspectives on the national level [11,12,13,14], taking the country as the overall unit of analysis; the provincial level [9,15,16,17,18], with particular attention to major carbon-emitting provinces such as Henan Province; and the sectoral level [19], with agricultural economies as the primary research focus. The findings of these studies indicate that China’s overall decoupling status has yet to maintain a stable pattern, that the decoupling states vary considerably across different provinces, and that weak decoupling constitutes the most prevalent decoupling type. Beyond the aforementioned research perspectives, this study contends that systematic attention to the river basin as a distinctive geographical unit is also of critical importance.
In terms of driving factor analysis, scholars have conducted extensive explorations using various methods to investigate the driving mechanisms underlying the decoupling of economic growth and carbon emissions. Regarding research content, Zhang et al. [20] measured the degree of decoupling between emissions and economic growth in China’s provincial capital cities from 2011 to 2021 and decomposed the driving factors of decoupling status based on panel data and the LMDI decomposition method. The study found that the influence degree of various factors followed the order of population > energy intensity > urbanization > per capita GDP > secondary industry > proportion of coal consumption. Yang et al. [21] employed the STIRPAT model to analyze the driving effects of factors such as population, energy intensity, and urbanization on the decoupling relationship between economic growth and carbon emissions in Chengdu. Gbadeyan et al. [12] applied the LMDI decomposition method to explore the main contributing and inhibiting factors of the decoupling effect, finding that energy intensity, R&D intensity, R&D efficiency, and sectoral carbon intensity contributed to promoting the decoupling of economic growth and carbon emissions, whereas investment intensity, population size, and sectoral energy structure made no contribution to decoupling. With respect to research methods, the commonly used LMDI [22,23] or STIRPAT [24,25] models, along with fixed indicator systems, predominantly emphasize the temporal dimension of analysis. While such research has been relatively well-developed and possesses guiding significance, the heterogeneity characteristics of driving factors across both temporal and spatial dimensions require further supplementation. Existing studies have fully confirmed that factors such as economic development level [26,27,28], urbanization level [29,30], industrial structure [31], technological progress [32], and land use [33,34] are associated with the spatiotemporal heterogeneity characteristics of the carbon emission decoupling effect; however, relevant discussions on green technology innovation factors remain relatively scarce [27,29,35].
Research on carbon peak prediction aims to provide scientific forecasting and assessment to guide emission reduction policies and low-carbon development. At present, domestic and international scholars exhibit notable commonalities in the methodology of carbon peak prediction, all adhering to a unified modeling logic of “driving force decomposition—scenario simulation—pathway deduction.” The research content primarily focuses on carbon emission accounting [2,36,37,38], the spatiotemporal evolution of carbon peak pathways [39], driving mechanisms and sensitivity analysis [40], carbon emission reduction policy recommendations [41], and carbon peak simulation and prediction [42,43,44], thereby providing decision-making foundations for regionally differentiated emission reduction policies and low-carbon development pathways. The majority of existing studies lack the in-depth incorporation of inter-provincial heterogeneity parameter design, and the assumptions of various models tend to be overly idealized, leaving the accuracy and authenticity of medium- and long-term predictions in need of improvement. Consequently, carbon emission simulation and prediction methods remain in a stage of continuous development and refinement.
Therefore, this study addresses the following three research questions: (1) How did the decoupling relationship between economic growth and carbon emissions evolve across cities in the YRB from 2010 to 2022? (2) Which socioeconomic, technological, and land-use factors drive or inhibit decoupling, and how do these influencing factors vary across space and over time? (3) Under which policy and technological scenarios can the YRB achieve carbon peaking and approach deep decarbonization by 2060? To address the above questions, this study constructs a systematic analytical framework based on a “diagnosis–attribution–projection” trinity, the core innovation of which lies in the progressive coupling of the Tapio decoupling model, the Geographically and Temporally Weighted Regression (GTWR) model, and the LEAP-YRB v5 model, thereby achieving a complete research loop that proceeds from historical fact identification to driving mechanism quantification and further to future scenario simulation. This systematic body of evidence provides a robust foundation for formulating differentiated and adaptive regional sustainable development strategies. Specifically, the Tapio decoupling model is employed to analyze the spatiotemporal evolutionary characteristics of decoupling at the city level within the YRB, thereby addressing the research gap concerning river basins as geographical units of analysis in existing literature. The GTWR model is applied to investigate the spatiotemporal driving mechanisms of the carbon emission decoupling index, which not only compensates for the limitation of conventional methods that tend to emphasize either temporal or spatial dimensions in non-stationarity analysis but also fills the lacuna in existing studies concerning the influencing factors of green innovation technologies. Moreover, given that many regional scenario exercises adopt common or highly aggregated assumptions that may obscure inter-provincial disparities in sectoral structure, energy endowment, and economic growth trajectories, the present study overcomes this constraint by incorporating inter-provincial heterogeneity parameters into the LEAP-YRB v5 model.

2. Materials and Methods

2.1. Overview of the Study Area

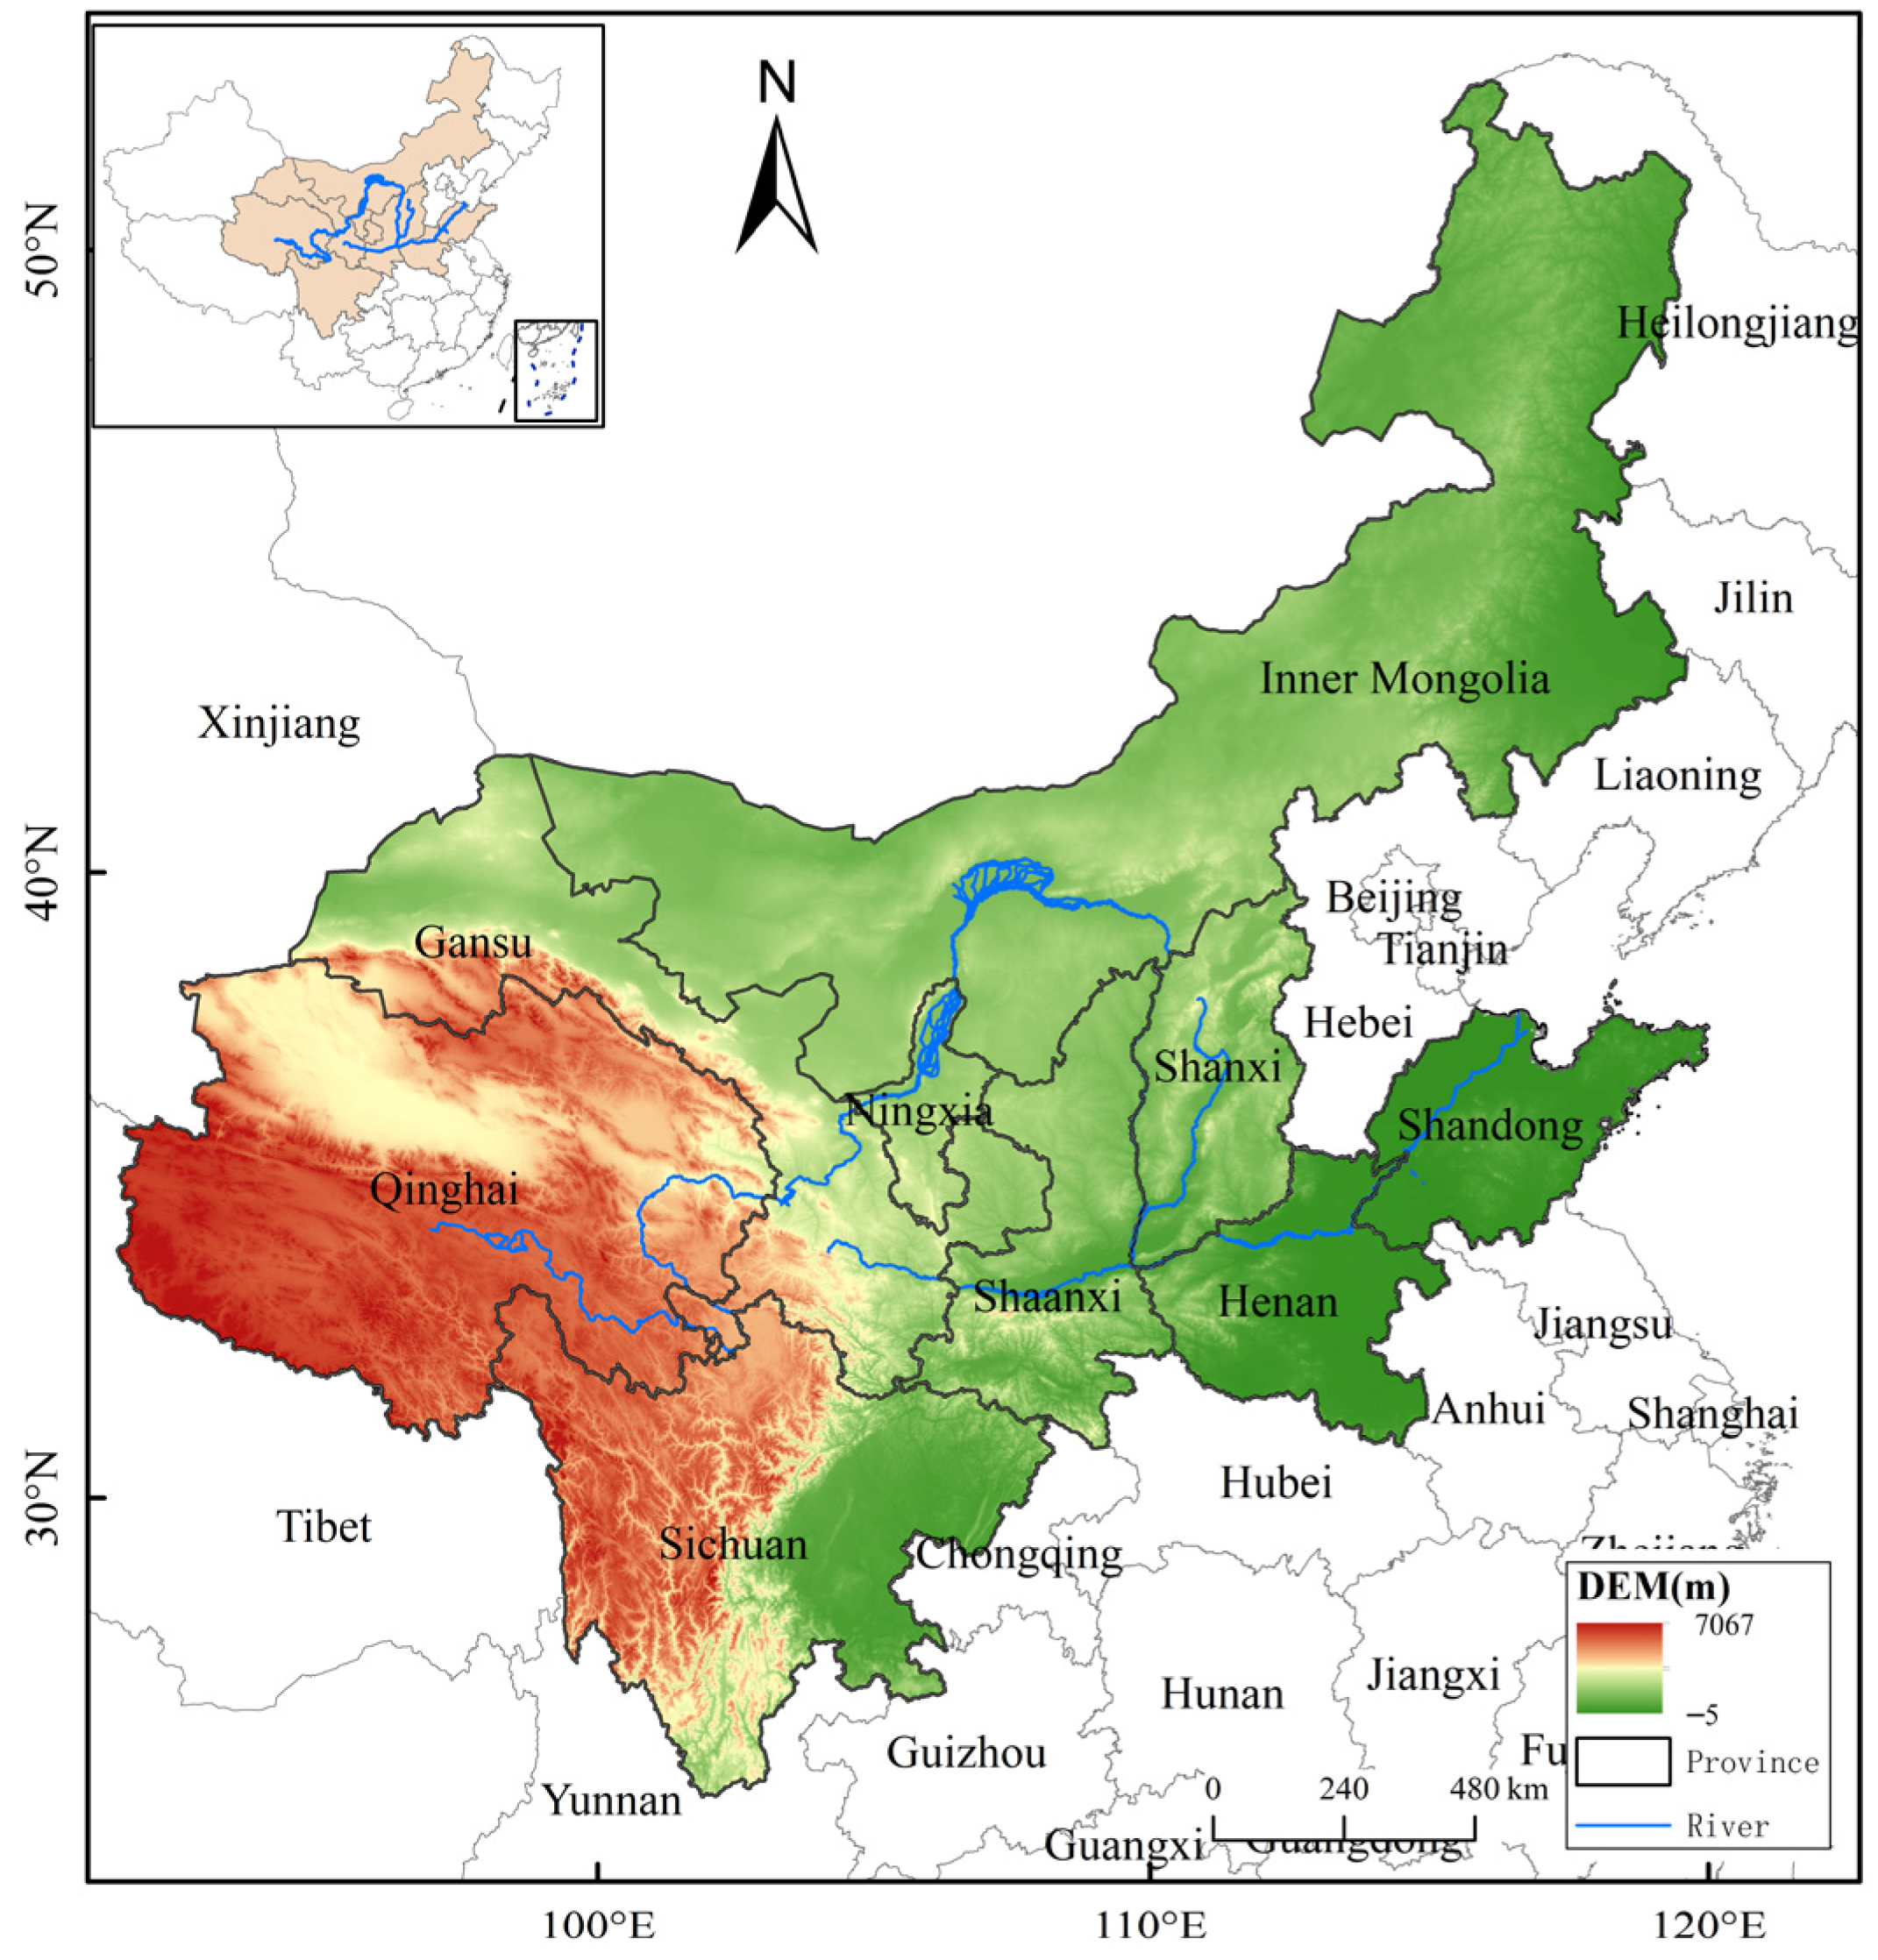
The YRB (96° E–119° E, 32° N–42° N) encompasses nine provincial-level administrative regions, namely Qinghai Province, Sichuan Province, Gansu Province, Ningxia Hui Autonomous Region, Inner Mongolia Autonomous Region, Shanxi Province, Shaanxi Province, Henan Province, and Shandong Province (Figure 1, Table 1). The YRB spans arid to semi-humid climatic zones, with an average annual temperature ranging from 1 °C to 14 °C and annual precipitation varying between 200 mm and 650 mm. The basin covers an area of approximately 750,000 km2, and the Yellow River ranks first nationwide in sediment concentration. The topography within the basin is complex, with the Loess Plateau region experiencing persistently severe soil erosion, rendering the ecological background relatively fragile. At present, the basin is making vigorous efforts to advance energy structure optimization, green industrial transformation, and energy utilization efficiency improvement, facing formidable tasks in low-carbon development and ecological conservation.

2.2. Technical Workflow

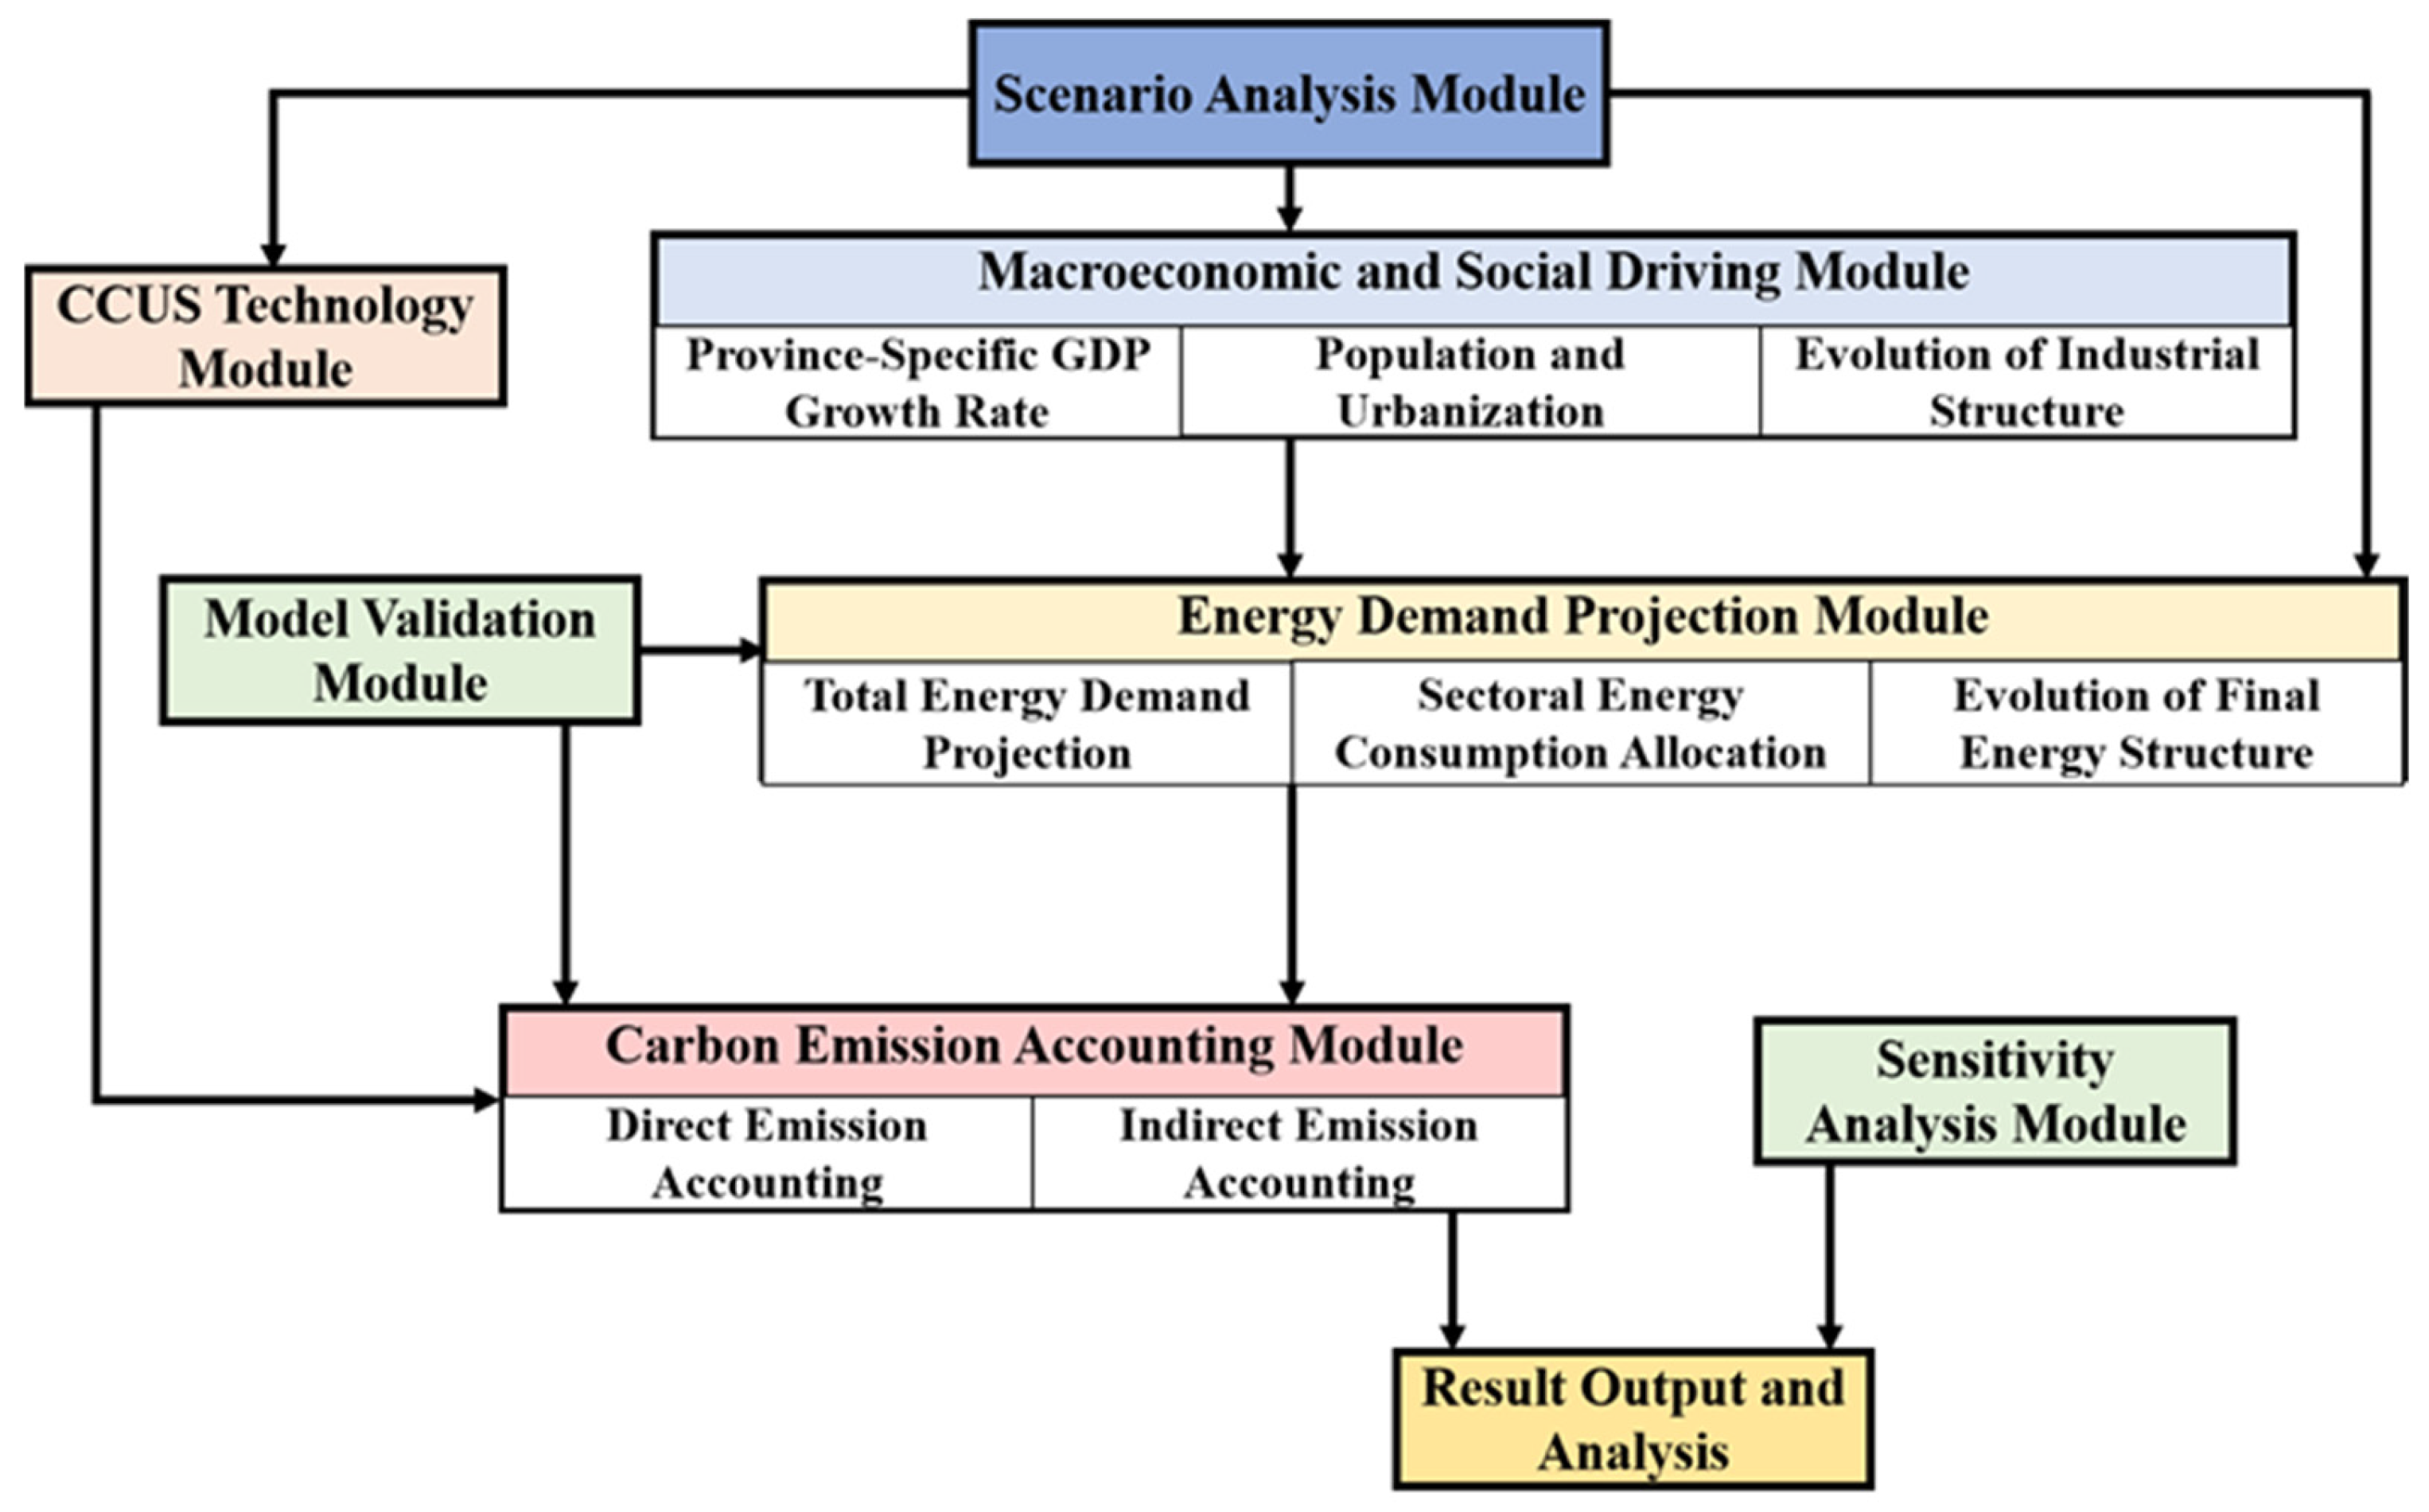
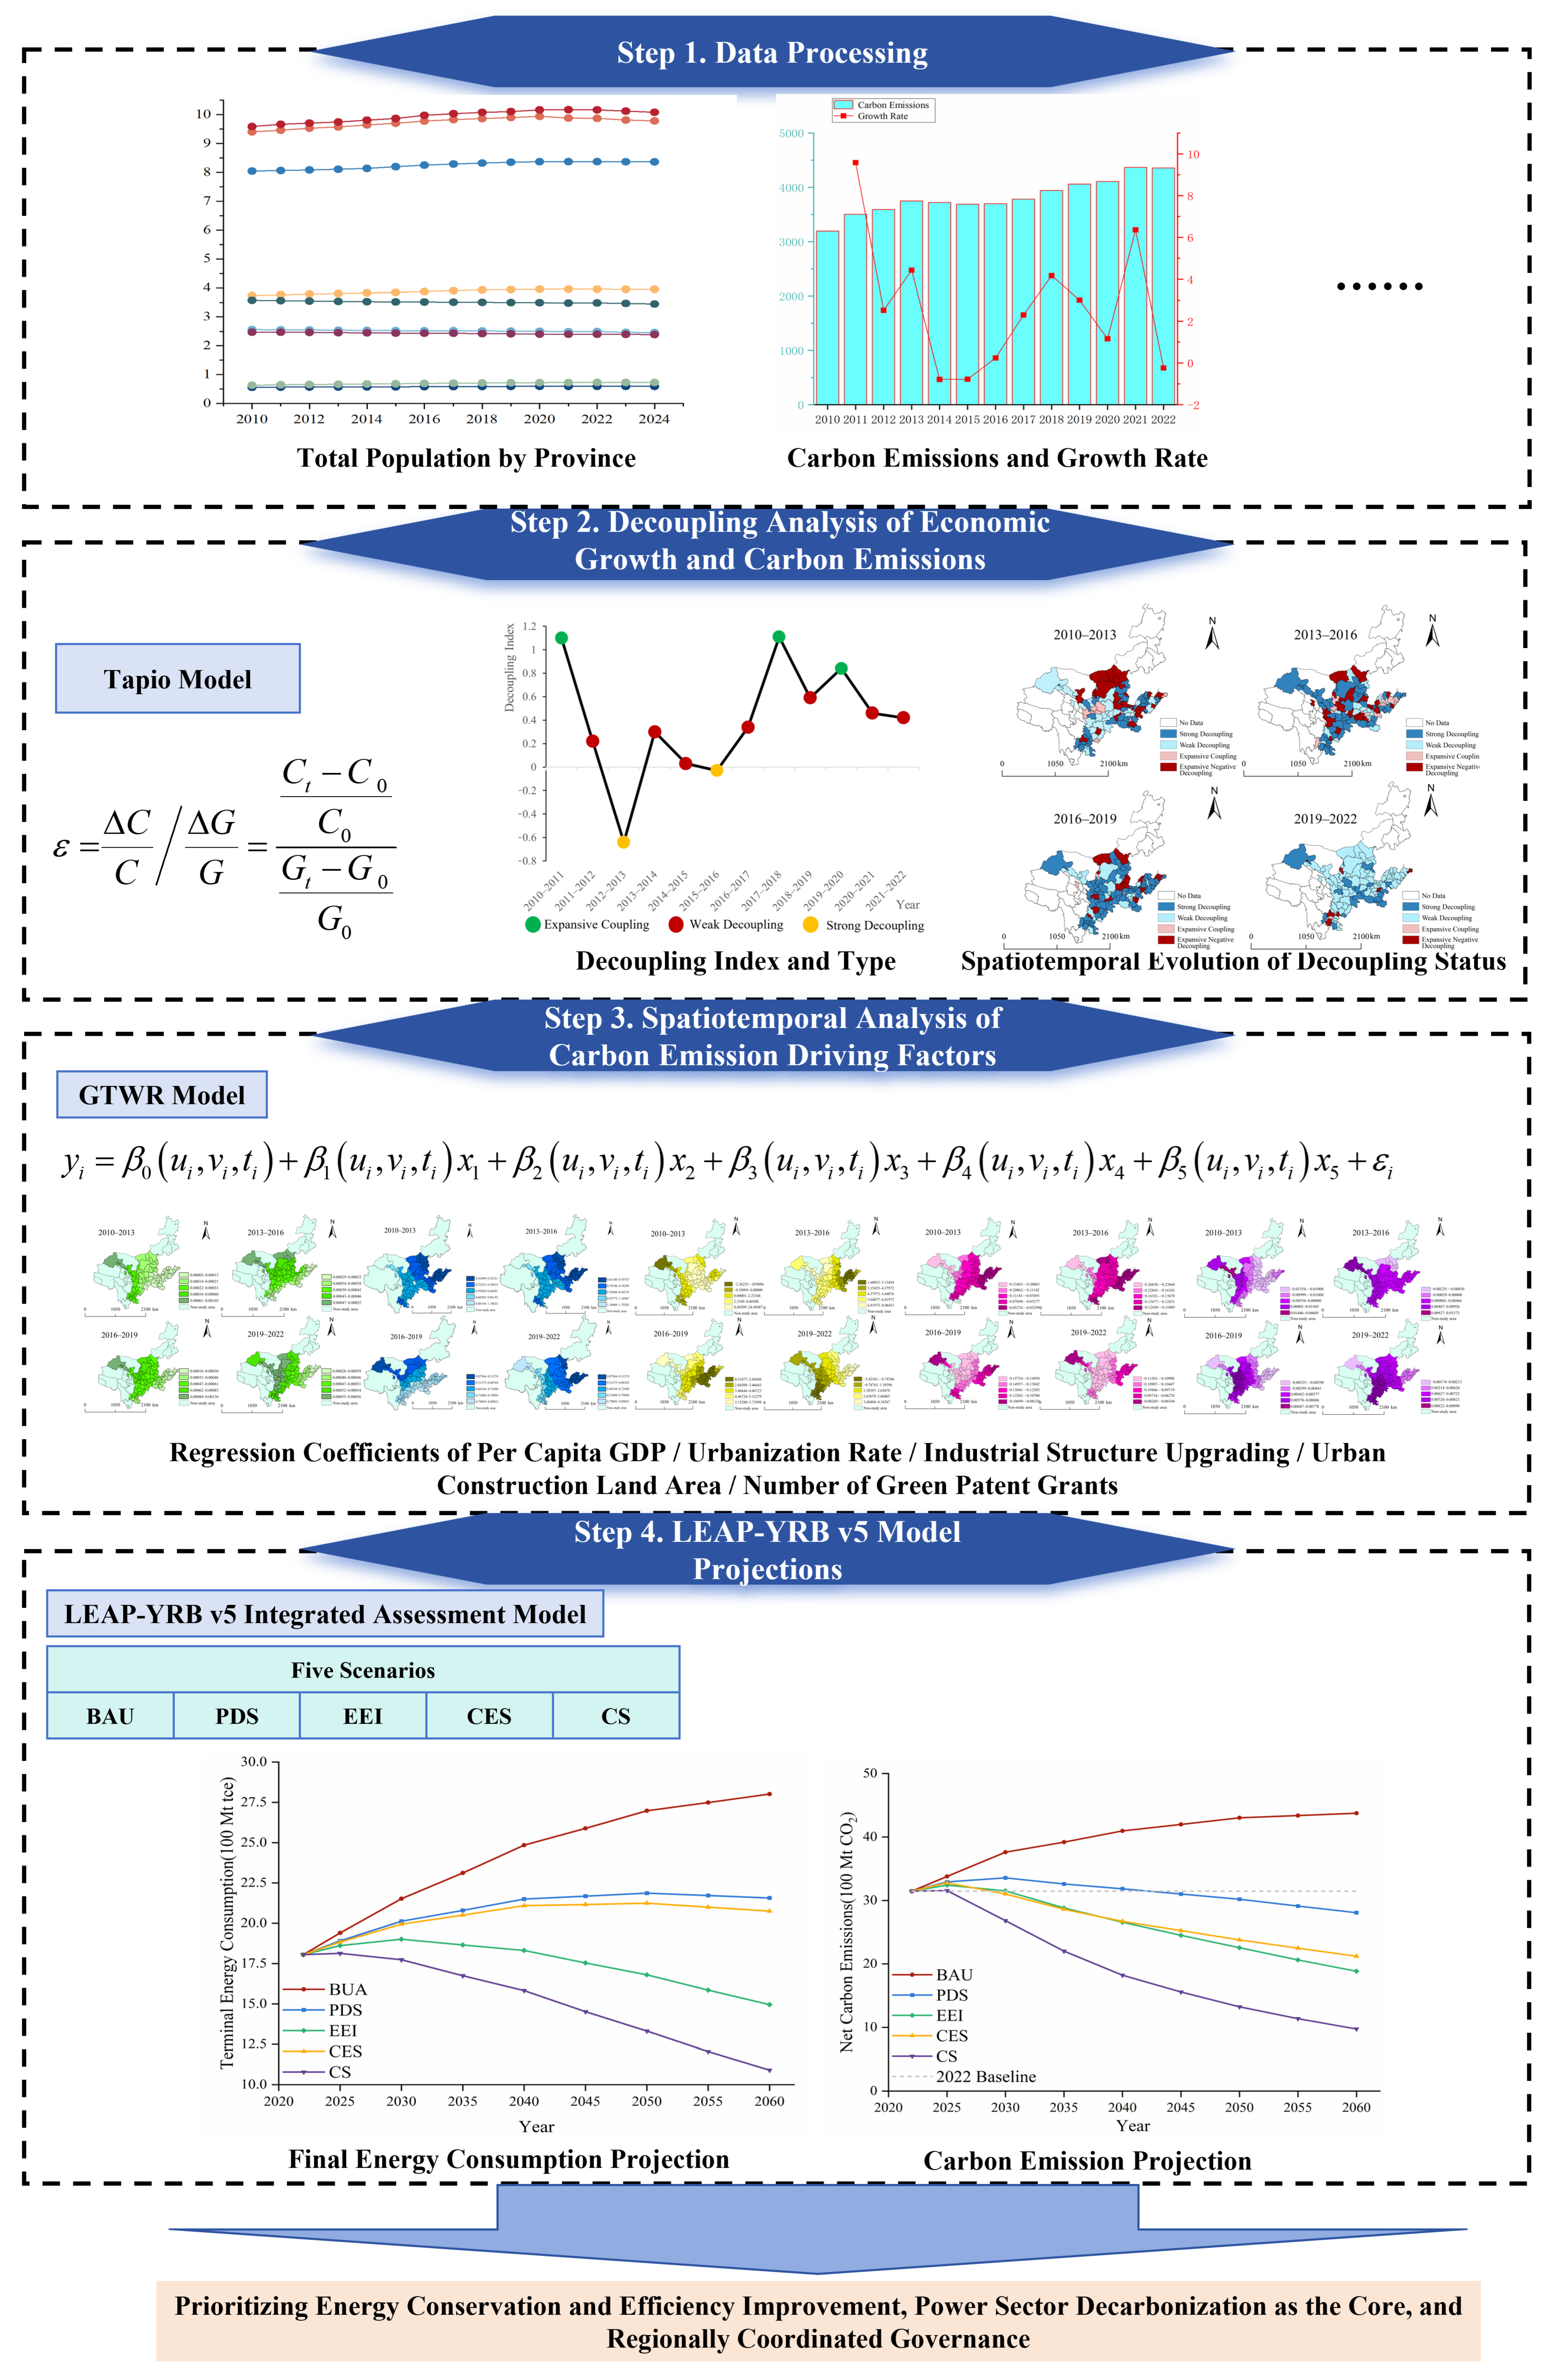
This study constructs a scientific research framework (Figure 2): based on the Tapio elastic decoupling model, the decoupling relationship between economic development and carbon emissions is quantified to clarify the degree of environmental impact exerted by economic growth. The GTWR model is employed to investigate the potential driving factors across five dimensions—economic development level, urbanization level, industrial structure upgrading, land use structure, and technological progress—on the decoupling index of economic growth and carbon emissions in the YRB. A LEAP-YRB v5 macro-sectoral hybrid driving model is constructed to conduct multi-scenario simulations of energy consumption and carbon emission trajectories for the nine provinces of the YRB over the period 2022–2060. Finally, the research findings are discussed and summarized. This study can provide references and a basis for advancing the construction of the YRB toward achieving a win-win outcome of economic development and ecological protection, and it also holds substantive practical and theoretical significance for formulating province-specific heterogeneous low-carbon policies.

2.3. Data Sources

All data used in this study are compiled from publicly available data sources (Table 2). All base maps in this paper are produced using standard maps downloaded from the Standard Map Service Platform of the National Geomatics Center of China, with no modifications made to the base maps. To ensure data integrity, missing values were imputed using interpolation techniques.

2.4. Research Methods

2.4.1. Construction of the Tapio Decoupling Model

The Tapio elastic decoupling model [8] is employed to measure the decoupling index between economic growth and carbon emissions in various regions of the YRB. To eliminate the effect of price fluctuations, the gross regional product for each year other than the base year was adjusted to constant 2010 price levels by applying the provincial GDP deflator index. The specific calculation formula for the decoupling elasticity index is as follows:
ε = Δ C C / Δ G G = C t C 0 C 0 G t G 0 G 0
In the formula, ε is the elastic decoupling index; Δ C is the difference between the carbon emissions in the current period and those in the base period; C t is the carbon emissions in the current period; C 0 is the carbon emissions in the base period; Δ C C is the rate of change in carbon emissions; and Δ G G is the rate of change in total economic growth. Tapio broadly classifies decoupling states into three categories—decoupling, coupling, and negative decoupling—which are further subdivided into eight specific states based on the range of the elastic decoupling coefficient values (Table 3).

2.4.2. Construction of the GTWR Model

In this study, the decoupling index between economic growth and carbon emissions in the YRB is adopted as the explained variable of the model, while five factors—per capita GDP, urbanization rate, industrial structure upgrading, urban construction land area, and the number of green patent grants—are selected as explanatory variables. Geographically and Temporally Weighted Regression (GTWR) models are constructed for four respective years: 2010, 2014, 2018, and 2022.
Prior to the implementation of the GTWR model, diagnostic tests for correlation and multicollinearity were performed on all candidate variables. The Pearson correlation coefficients (Table 4) indicate that each of the five selected explanatory variables is significantly correlated with the dependent variable. The variance inflation factor (VIF) estimates (Table 5) are all below the threshold of 7.5, suggesting the absence of severe multicollinearity among the independent variables. These preliminary diagnostics confirm that the dataset satisfies the necessary preconditions for the subsequent GTWR estimation. In addition, the Gaussian kernel was selected as the kernel function, with the fixed bandwidth determined as 0.115 based on the cross-validation (CV) criterion. The standard Euclidean distance was employed as the distance metric, and local weighted least squares was applied for coefficient estimation.
To determine whether the GTWR model is more appropriate than alternative regression specifications for analyzing the drivers of the decoupling index, this study constructs three models based on the selected variables using SPSS 26.0 and ArcGIS 10.8: ordinary least squares (OLS), geographically weighted regression (GWR), and geographically and temporally weighted regression (GTWR). The parameter estimates of the three models are then compared to identify the specification that yields the best fit. In the regression analysis, the coefficient of determination (R2), adjusted R2, and the Akaike information criterion (AICc) are employed as indicators of model goodness-of-fit. The estimation results (Table 6) show that the GTWR model outperforms the other two across all these metrics, indicating its superior explanatory power for the driving factors and greater reliability of the estimated coefficients. Accordingly, this study adopts the GTWR model to examine the spatiotemporal heterogeneity of the effects of each independent variable on the carbon emission decoupling index.
The specific expression of the model is as follows:
y i = β 0 u i , v i , t i + β 1 u i , v i , t i x 1 + β 2 u i , v i , t i x 2 + β 3 u i , v i , t i x 3 + β 4 u i , v i , t i x 4 + β 5 u i , v i , t i x 5 + ε i
In the formula, i represents the i-th sample city; y i represents the carbon emission decoupling index of the i-th sample city; β 0 u i , v i , t i is the intercept term, u i , v i , t i denotes the spatiotemporal coordinates of the i-th sample city; x 1 , x 2 , x 3 , x 4 , x 5 represent per capita GDP, urbanization rate, industrial structure upgrading, urban construction land area, and the number of green patent grants, respectively; β 1 u i , v i , t i β 5 u i , v i , t i are the regression coefficients corresponding to the above independent variables for the i-th sample city, in that order; and ε i is the random error term of the i-th sample city.

2.4.3. Construction of the LEAP-YRB v5 Integrated Assessment Model

This study constructs the LEAP-YRB v5 integrated assessment model to conduct medium- and long-term projections of energy consumption and carbon emissions for the nine provinces of the YRB over the period from 2022 to 2060. The model draws upon the conceptual framework of the Long-range Energy Alternatives Planning (LEAP) system but adopts a hybrid macro-sectoral-driven approach that is more suitable for regional macro-level forecasting. This approach treats macroeconomic indicators (GDP) as the core driving force of total energy demand, while incorporating the dynamic evolution of sectoral structures and inter-provincial heterogeneity parameters to achieve a refined simulation of the complex energy system.
The core framework of the LEAP-YRB v5 model consists of multiple interrelated modules (Figure 3).
  • Energy Demand
This model adopts the macroeconomic energy intensity method to forecast total energy demand. Based on the dynamically changing share of energy consumption in each sector, the total energy demand is allocated to six end-use sectors. For any province p in year t, the calculation formula for total energy demand is as follows:
E p , t   =   GDP p , t   ×   E I p , t   ×   S p , t
In the formula, E p , t is the total energy demand of province p in year t; GDP p , t is the gross regional product of province p in year t; E I p , t is the energy intensity per unit GDP of province p in year t; and S p , t is the industrial structure adjustment factor.
Total demand is then allocated to six end-use sectors—industry, transportation, residential life, construction, commercial and services, and primary industry—using province-specific baseline shares and dynamic adjustment parameters. The sectoral demand is further allocated to ten energy types: raw coal, coke, crude oil, gasoline, diesel, fuel oil, natural gas, liquefied petroleum gas, electricity, and heat. Inter-provincial adjustment coefficients modify the national sector-energy matrix to reflect coal dependence in Shanxi and Inner Mongolia and hydropower advantages in Sichuan and Qinghai.
2.
Carbon Emission Accounting Method
Total carbon emissions consist of direct final-energy emissions from fossil fuel combustion and indirect emissions from electricity and heat consumption (Table 7).
In the formula, E f is the consumption of fuel f; NCV f is the lower heating value; CEF f is the carbon content per unit calorific value; COF f is the carbon oxidation rate; and 44/12 is the molecular weight ratio for converting carbon to carbon dioxide.
3.
Inter-Provincial Heterogeneity Design
Economic Growth Pathway: Differentiated GDP growth rates are set for each province under different scenarios.
Sectoral Energy Consumption Structure: Based on provincial statistical data, a unique sectoral energy consumption share structure is established for each province.
Energy Type Structure: Inter-provincial adjustment coefficients are introduced to adjust the baseline national average sector-energy type matrix, so as to reflect the high dependence on coal in provinces such as Shanxi and Inner Mongolia, as well as the abundant hydropower resource characteristics of provinces such as Sichuan and Qinghai.
4.
Model Validation and Evaluation
Taking 2022 as the base point, the parameters under the baseline scenario are used to backcast energy consumption and carbon emissions from 2016 to 2021, which are then compared with historical statistical data. The Mean Absolute Percentage Error (MAPE) is adopted as the evaluation indicator:
MAPE   =   1 n t = 1 n | A t F t A t | × 100 %
In the formula, A t is the historical actual value, and F t is the model predicted value.
5.
Key Parameter Assumptions and Scenario Settings
To explore the energy transition and carbon emission trajectories of the YRB under different development pathways, this study designs five scenarios (Table 8): the Business-as-Usual scenario (BAU), the Policy-Driven Scenario (PDS), the Energy Efficiency Improvement scenario (EEI), the Clean Energy Scenario (CES), and the Carbon-Neutrality-Oriented Scenario (CS). These scenarios are characterized by different settings of key driving parameters, primarily encompassing macroeconomic conditions, energy efficiency, energy structure, power system decarbonization, and CCUS technology application.
The assumptions underlying all scenario parameters in this study are supported by national top-tier low-carbon and energy policies as well as authoritative domestic and international research reports. The policy benchmarks draw on the Action Plan for Carbon Dioxide Peaking Before 2030 (https://app.www.gov.cn/govdata/gov/202110/26/477466/article.html, accessed on 12 March 2026), the 14th Five-Year Plan for a Modern Energy System (https://zfxxgk.nea.gov.cn/2022-01/29/c_1310524241.htm, accessed on 12 March 2026), and the Notice on Greenhouse Gas Emission Reporting and Management for the Power Generation Industry, 2023–2025 issued by the Ministry of Ecology and Environment (https://www.mee.gov.cn/xxgk2018/xxgk/xxgk06/202302/t20230207_1015569.html, accessed on 12 March 2026), which provide official policy guidance for core constraint indicators including industrial restructuring, energy intensity control, coal consumption substitution and low-carbon power transformation. The technical pathways and medium-to-long-term transition potentials are quantified and validated against the China Carbon Capture, Utilization and Storage Annual Report 2023 (https://www.acca21.org.cn/trs/000100170002/, accessed on 12 March 2026), the IEA’s An Energy Sector Roadmap to Carbon Neutrality in China (https://www.iea.org/reports/an-energy-sector-roadmap-to-carbon-neutrality-in-china/executive-summary, accessed on 12 March 2026), and the report Towards Carbon Neutrality: A Study on China’s Long-Term Low-Carbon Transition Pathways and Strategies released by the Institute of Climate Change and Sustainable Development, Tsinghua University (https://lce.tsinghua.edu.cn/info/1010/1307.htm, accessed on 12 March 2026). These studies offer quantitative evidence for exploratory scenario parameters covering energy efficiency improvement, electrification expansion, large-scale CCUS deployment and long-term evolution of the energy system. All scenario configurations fully align with China’s established dual-carbon targets, industrial regulatory standards and state-of-the-art quantitative research on low-carbon transitions, ensuring the rationality of policy orientation and academic robustness of all parameter settings.
6.
Multi-temporal Sensitivity and Monte Carlo Simulation
This study adopts an uncertainty assessment framework combining multi-temporal single-factor sensitivity analysis and Monte Carlo simulation. The two methods complement each other with distinct functions: sensitivity analysis reveals the mechanism of parameter impacts, while Monte Carlo simulation quantifies the probabilistic fluctuation of outputs, jointly achieving a comprehensive uncertainty evaluation of the carbon emission prediction model.
The multi-temporal single-factor sensitivity analysis individually perturbs key parameters—including GDP, energy intensity, coal share, power emission factors, and CCUS—with gradient disturbance ratios, and calculates the percentage changes in carbon emissions across multiple periods from 2030 to 2060, thereby identifying the core variables that exert the most prominent impacts on emission outputs and clarifying the temporal evolution characteristics of the independent effect of each single parameter. Nevertheless, this method can only examine local single-variable effects and fails to reflect the comprehensive risks induced by simultaneous fluctuations of multiple parameters.
The Monte Carlo simulation assigns triangular probability distributions to all parameters and performs 1000 independent random samplings for each scenario. It then uses the 2.5th–97.5th percentile ranges and median values derived from the sampling results to quantify the global uncertainty range of carbon emissions under the coupling of all parameters.


3. Results

3.1. Spatiotemporal Evolution of the Decoupling Relationship Between Economic Growth and Carbon Emissions in the YRB

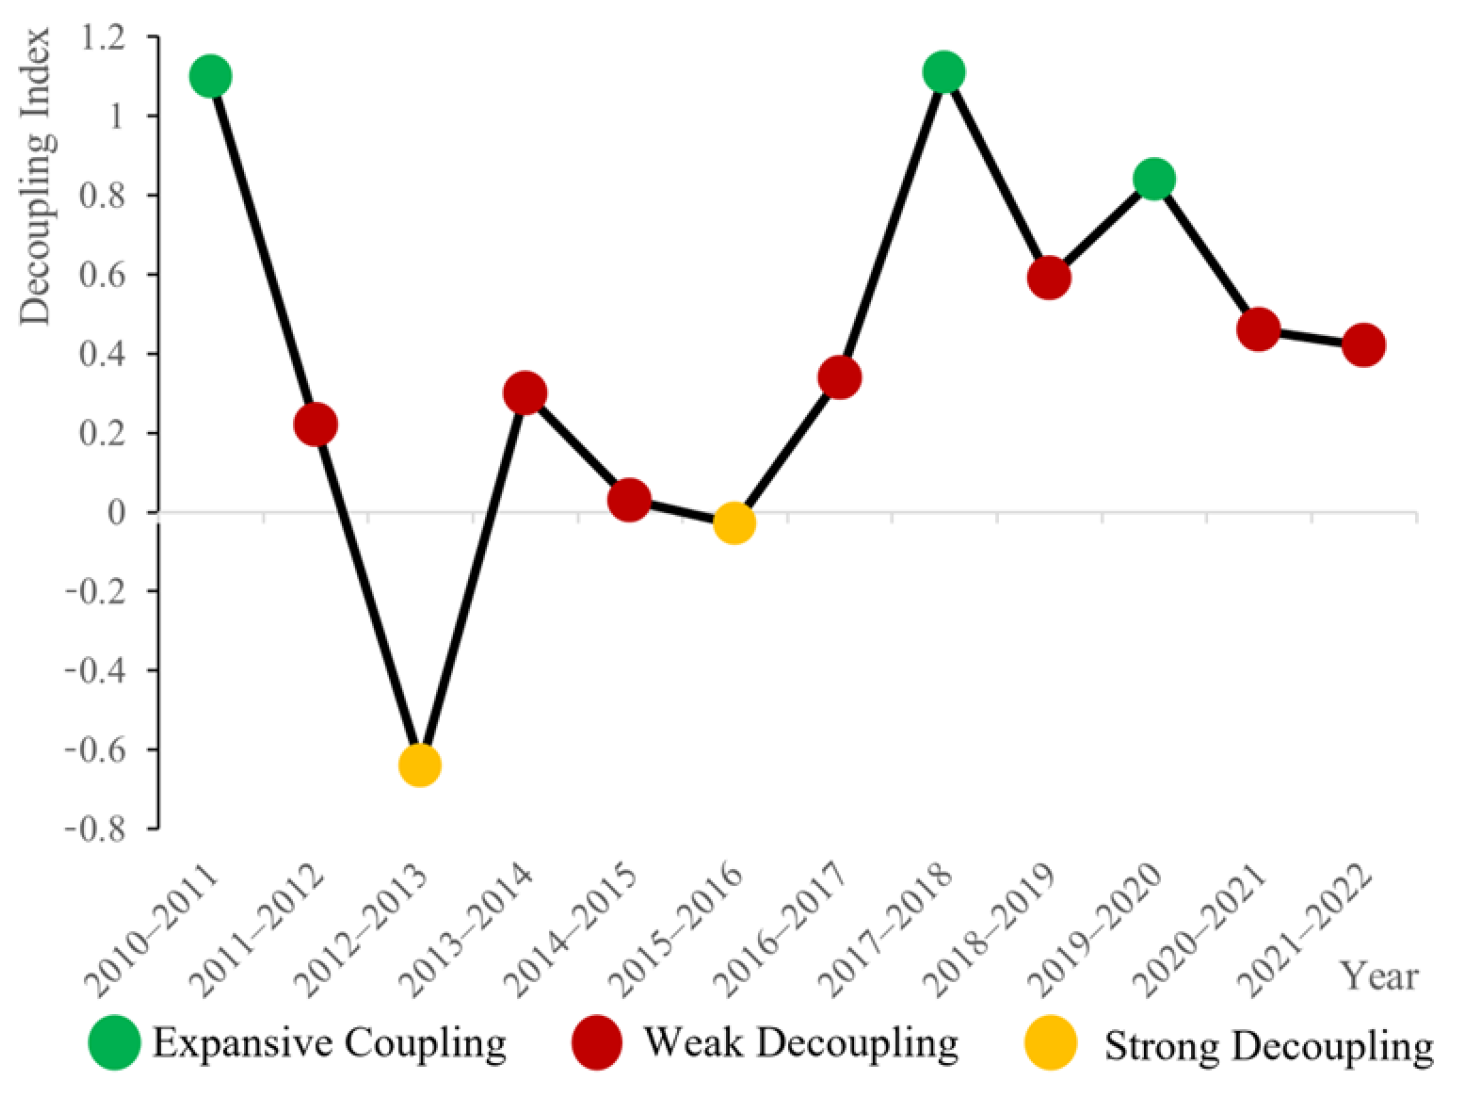
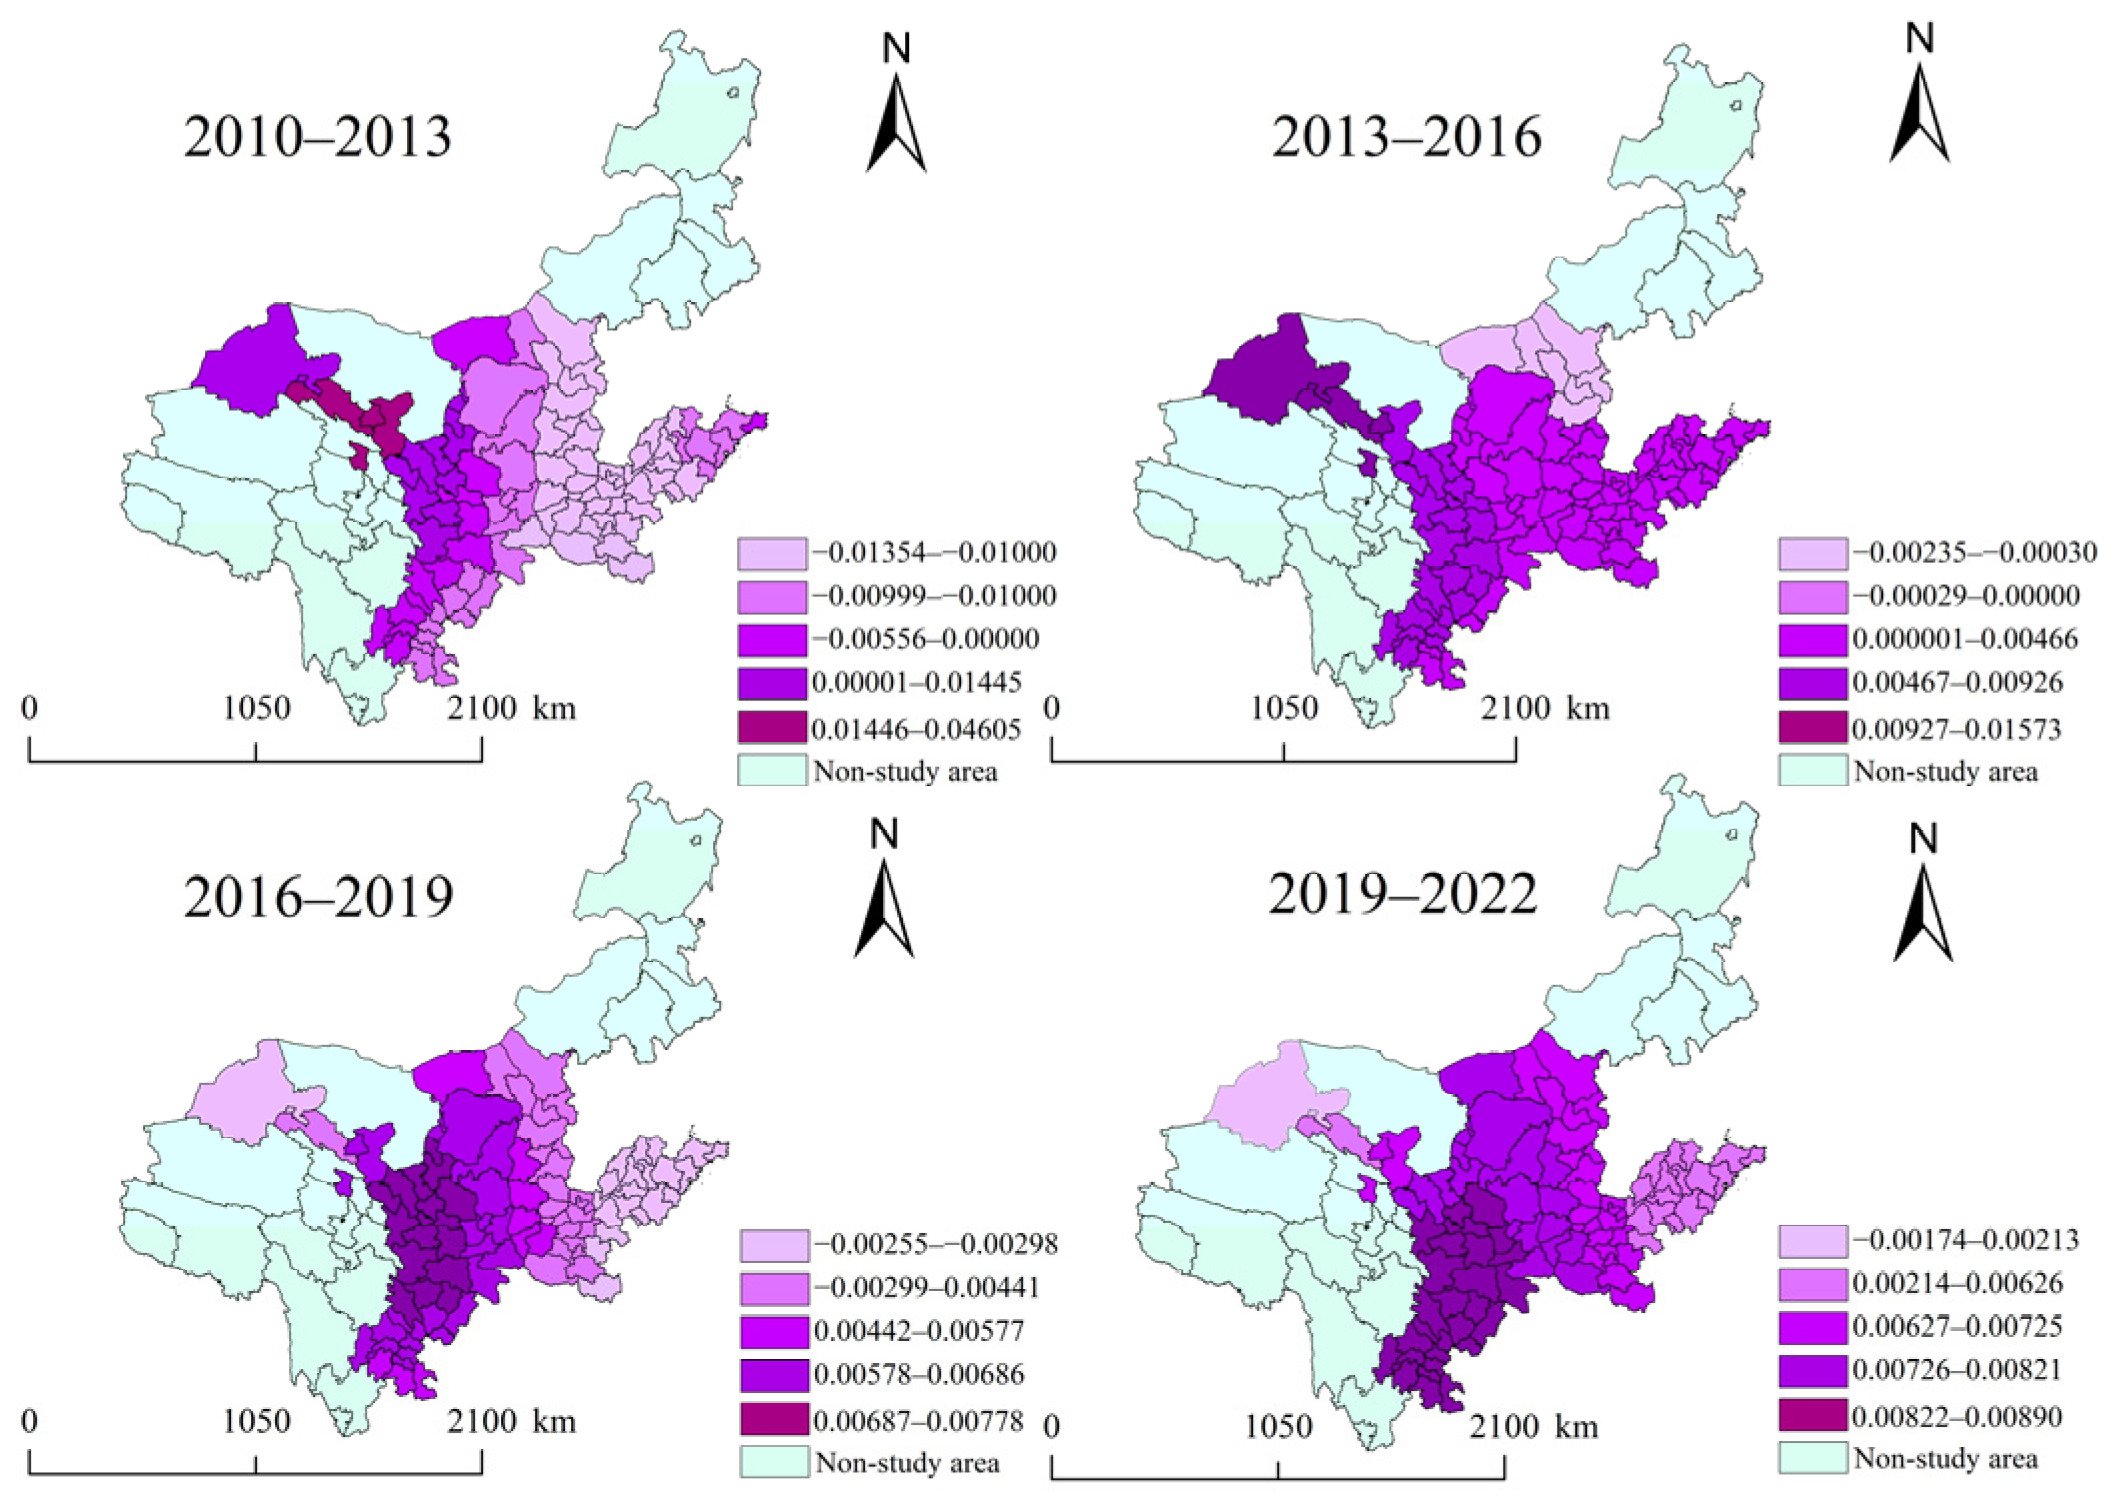
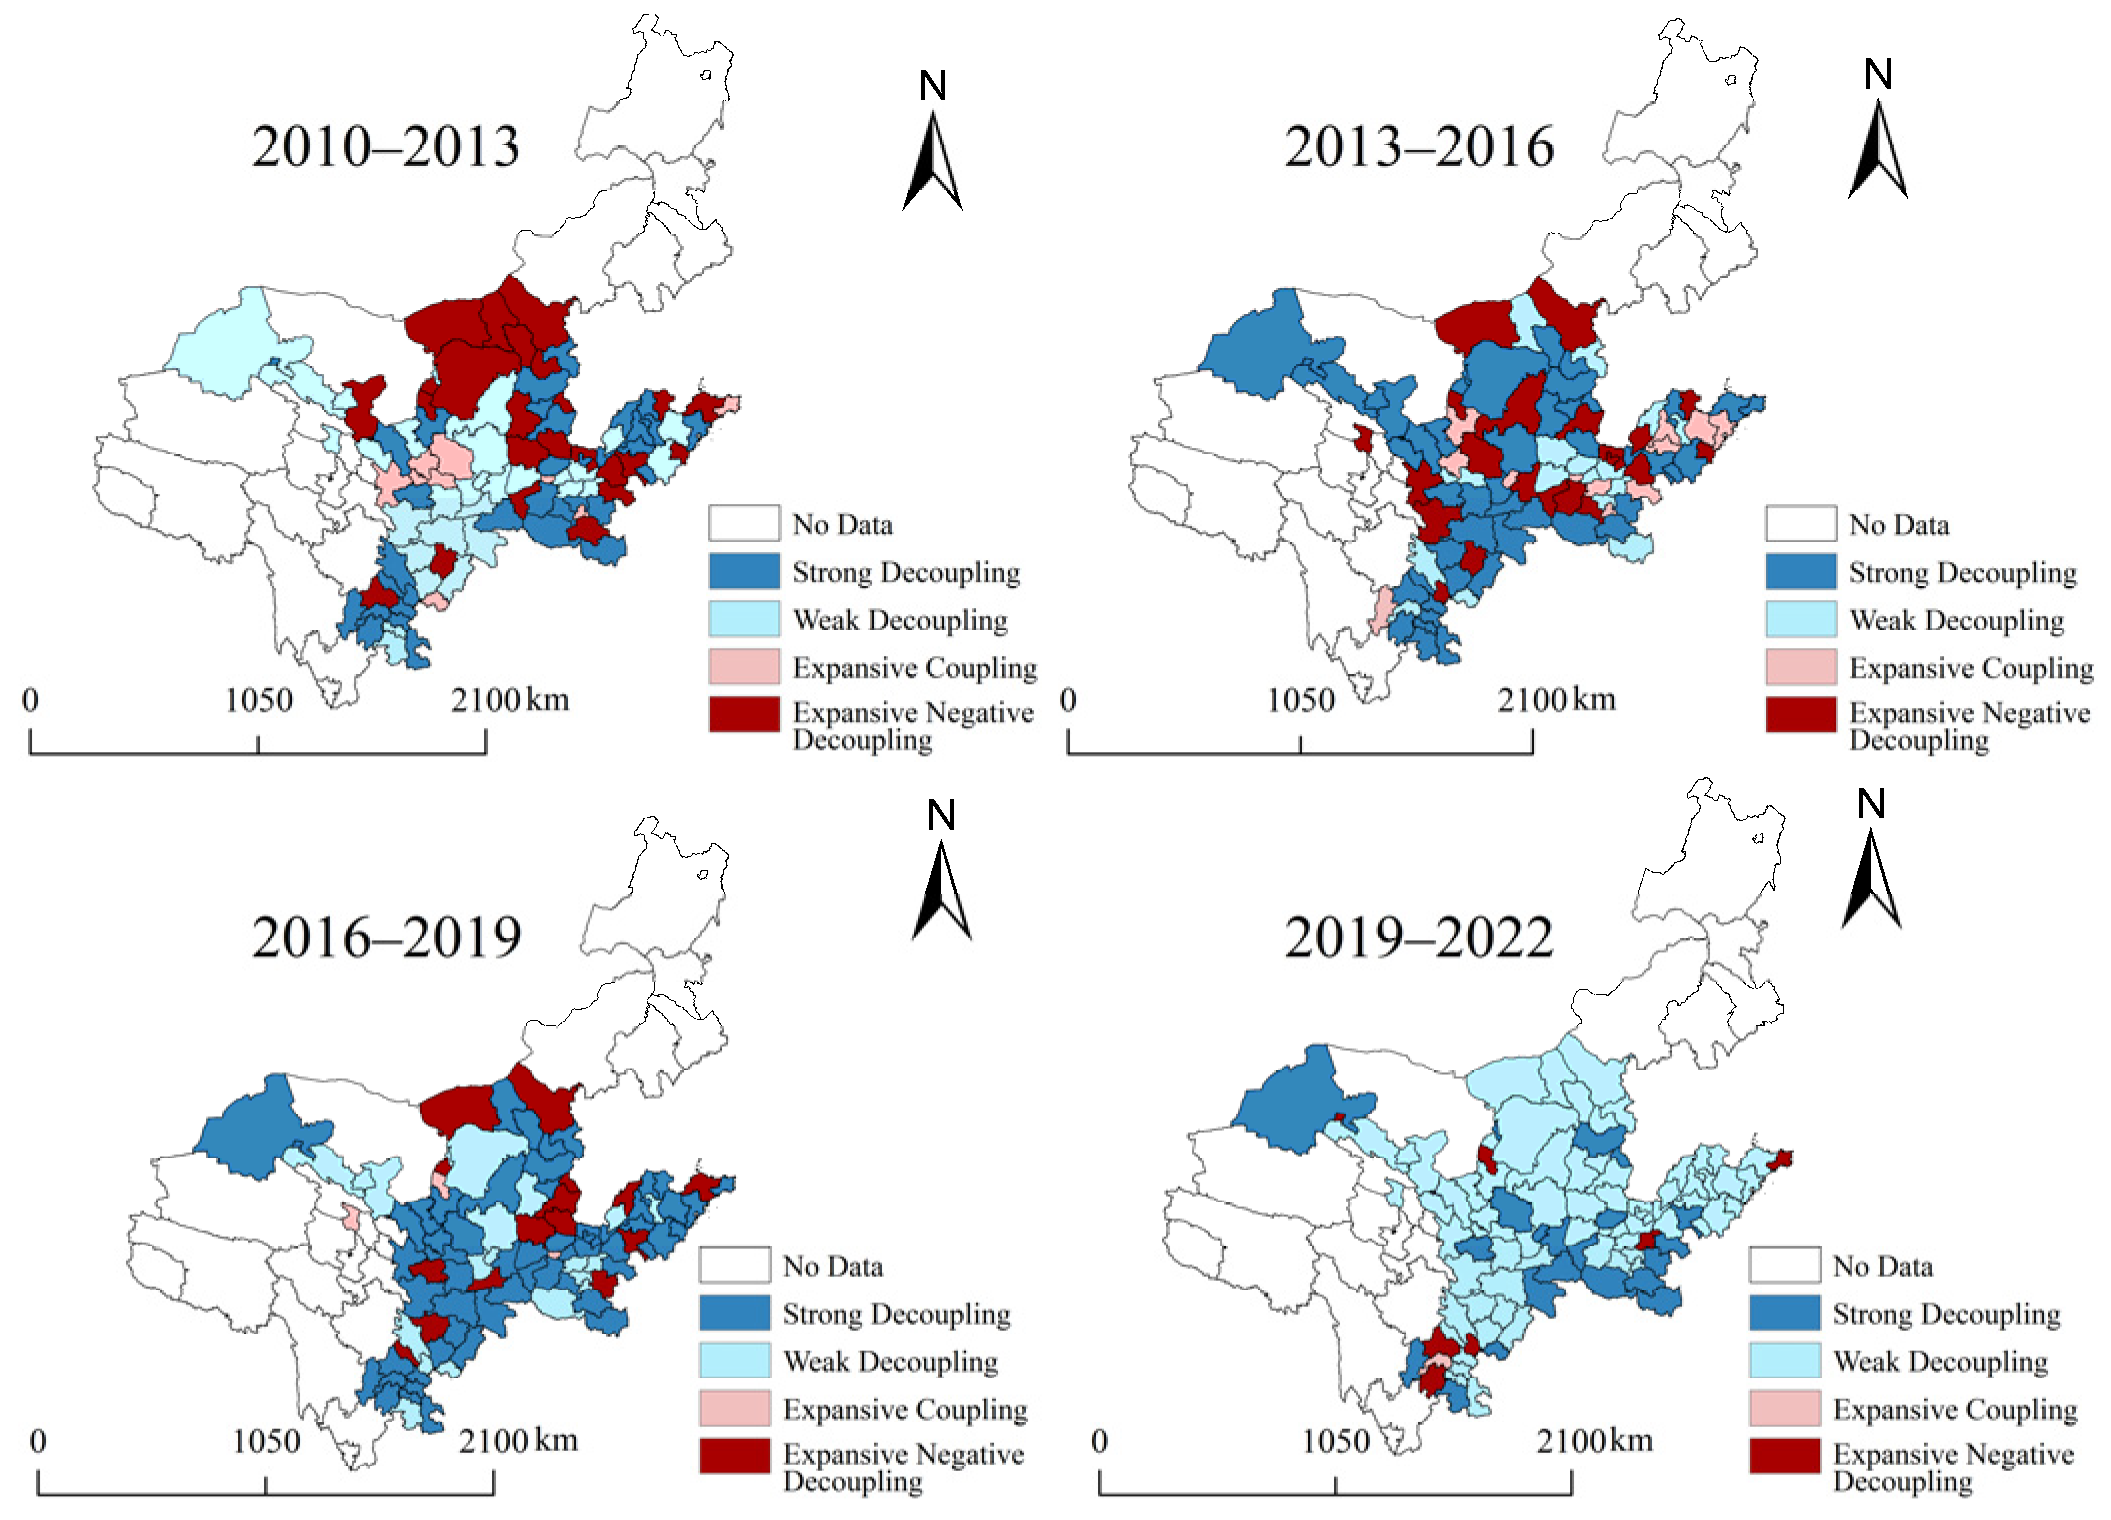
In terms of the overall evolutionary trend (Figure 4 and Figure 5), the decoupling index between economic growth and carbon emissions in the YRB exhibits a fluctuating declining trend, with the value decreasing from 1.10 in 2010–2011 to 0.42 in 2021–2022. The carbon emission decoupling status fluctuates dynamically, with strong decoupling, weak decoupling, and expansive coupling alternating over time, generally following an evolutionary pattern of “expansive coupling—strong decoupling—expansive coupling—weak decoupling,” with weak decoupling being the dominant decoupling type in the basin. At the provincial level, significant regional differences exist in the decoupling states of the nine provinces in the YRB, with decoupling types alternating dynamically and remaining unstable across provinces; among them, Qinghai and Sichuan exhibit relatively higher degrees of decoupling, while the decoupling level of Inner Mongolia is comparatively weak. Regarding the urban spatial pattern, the decoupling of carbon emissions in the YRB demonstrates temporal dynamic changes and pronounced spatial differentiation, with insufficient overall decoupling stability and prominent spatiotemporal disparity characteristics.

3.2. Spatiotemporal Driving Mechanisms of the Carbon Emission Decoupling Index in the YRB

In this study, the explained variable of the GTWR model is the decoupling index, for which a larger value indicates a weaker decoupling status. Accordingly, a positive regression coefficient implies that an increase in the explanatory variable leads to a rise in the decoupling index, thereby inhibiting decoupling, whereas a negative coefficient implies that an increase in the explanatory variable leads to a decline in the decoupling index, thereby promoting decoupling.
The GTWR model results indicate that the driving factors of carbon emission decoupling in the YRB exhibit substantial spatiotemporal heterogeneity. Among them, per capita GDP and urbanization rate are the dominant factors inhibiting the decoupling process, whereas urban construction land area exerts a promoting effect on decoupling. In addition, the influence direction of industrial structure upgrading and the number of green patent grants exhibits duality due to differences in regional development stages. The intensity of each factor’s impact on decoupling follows the order of industrial structure upgrading > urbanization rate > urban construction land area > number of green patent grants > per capita GDP.

3.2.1. The “Dual-Wheel Inhibitory” Effect of Economic Development and Urbanization

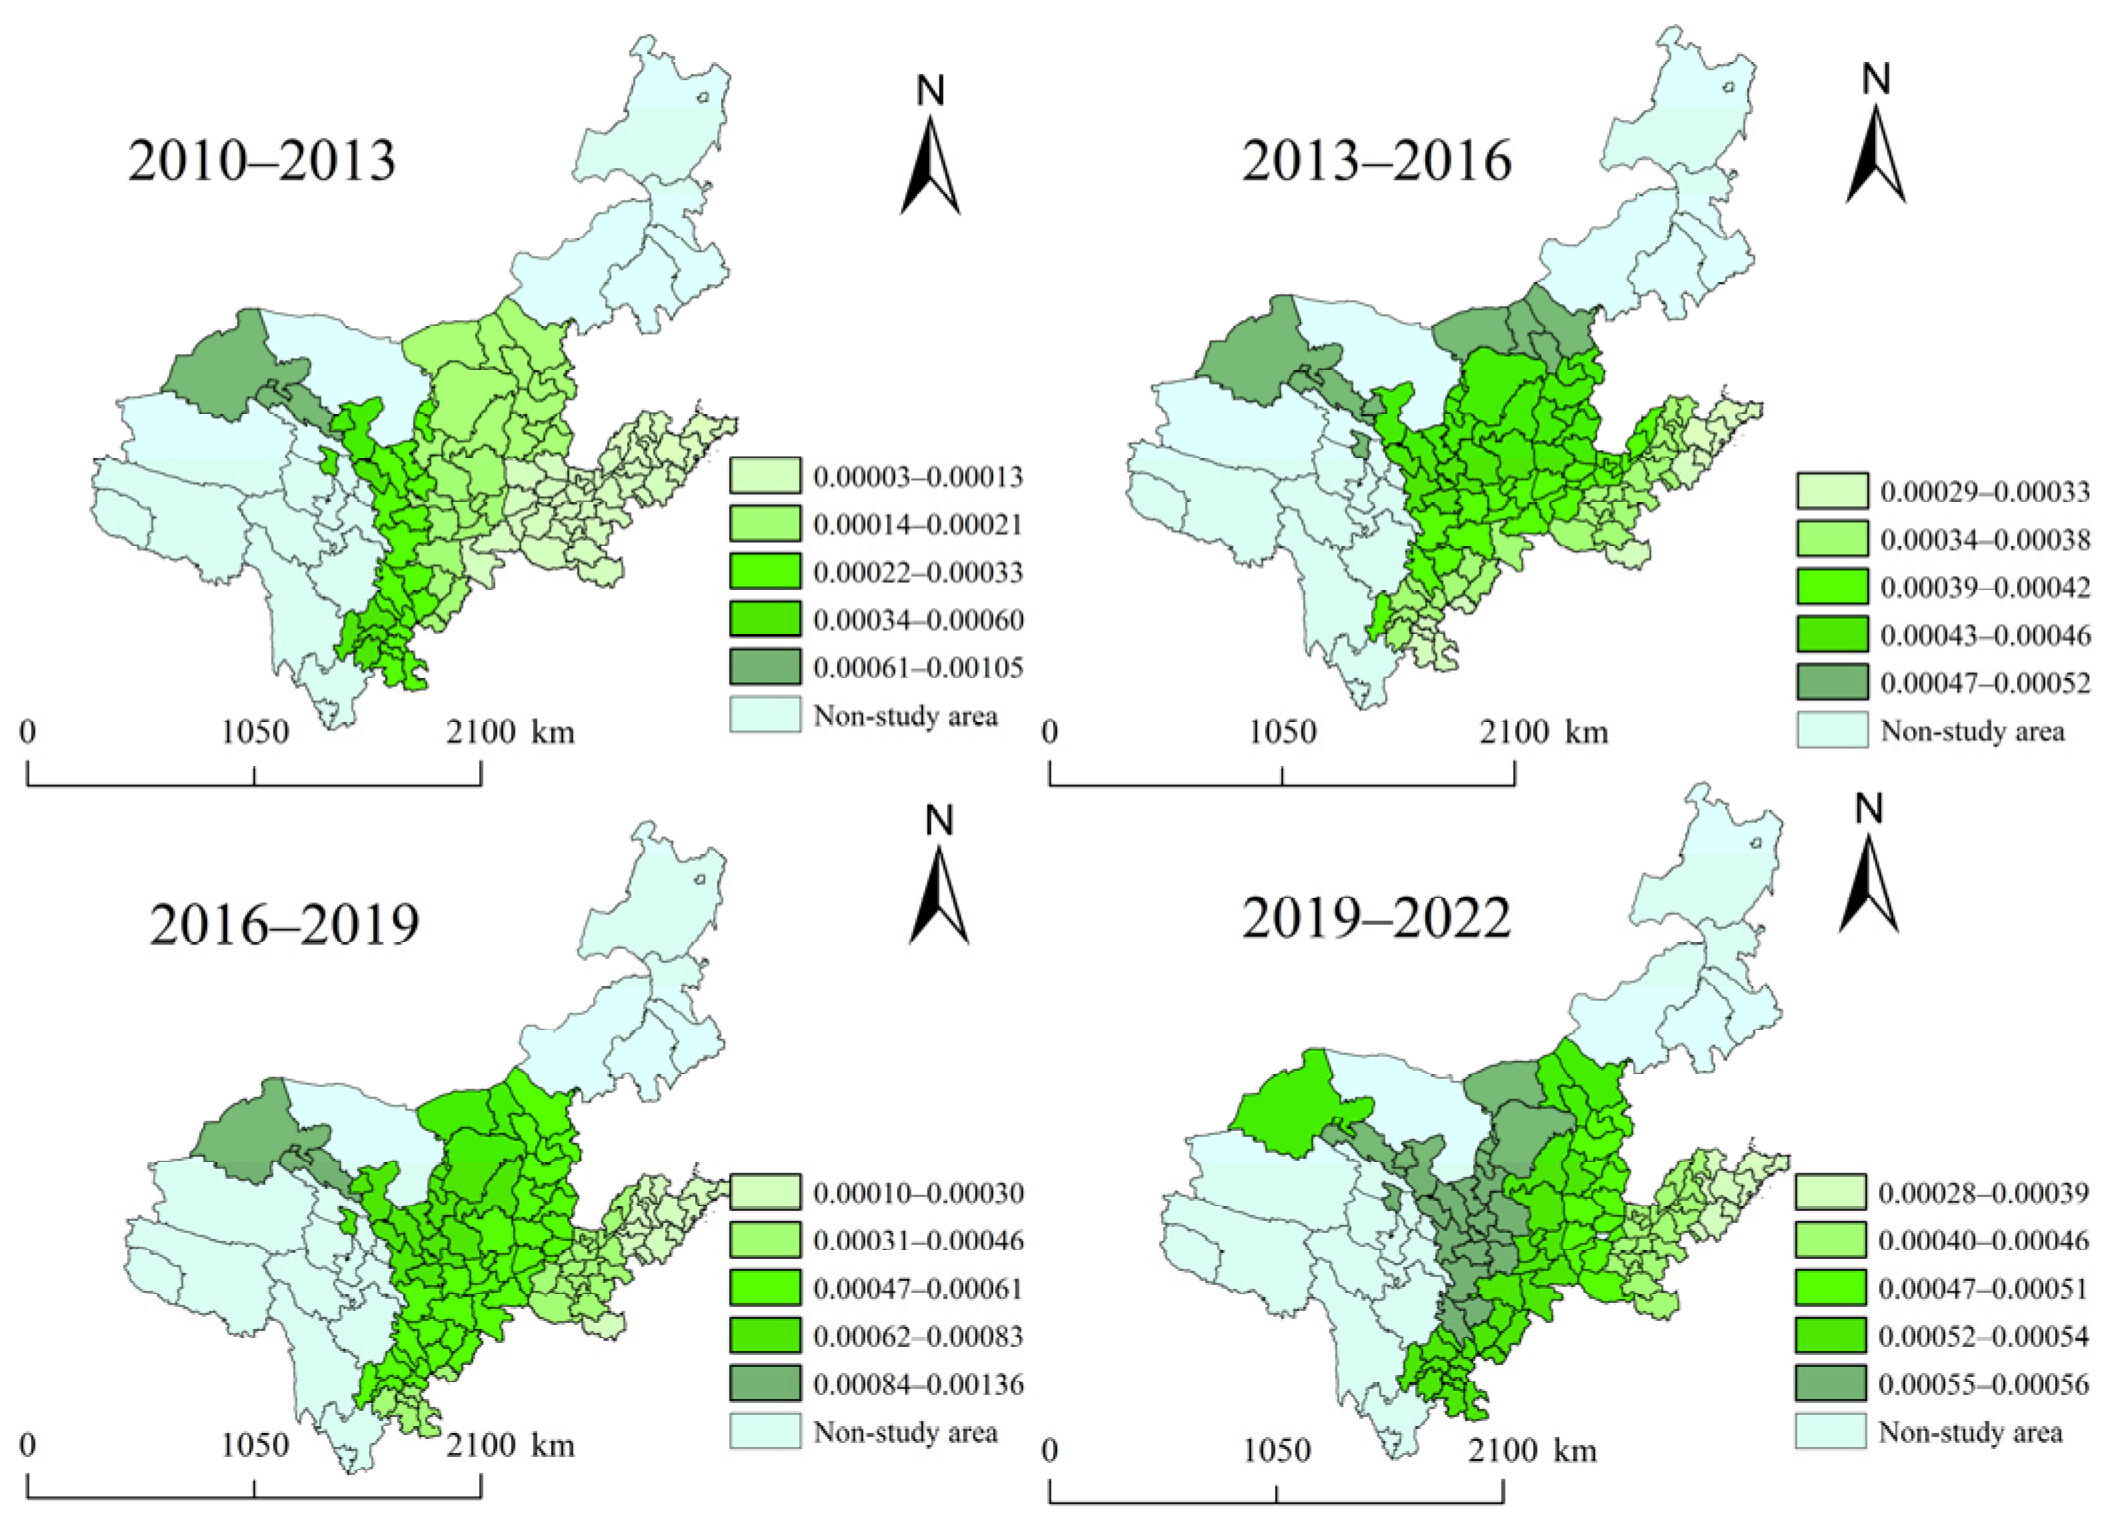
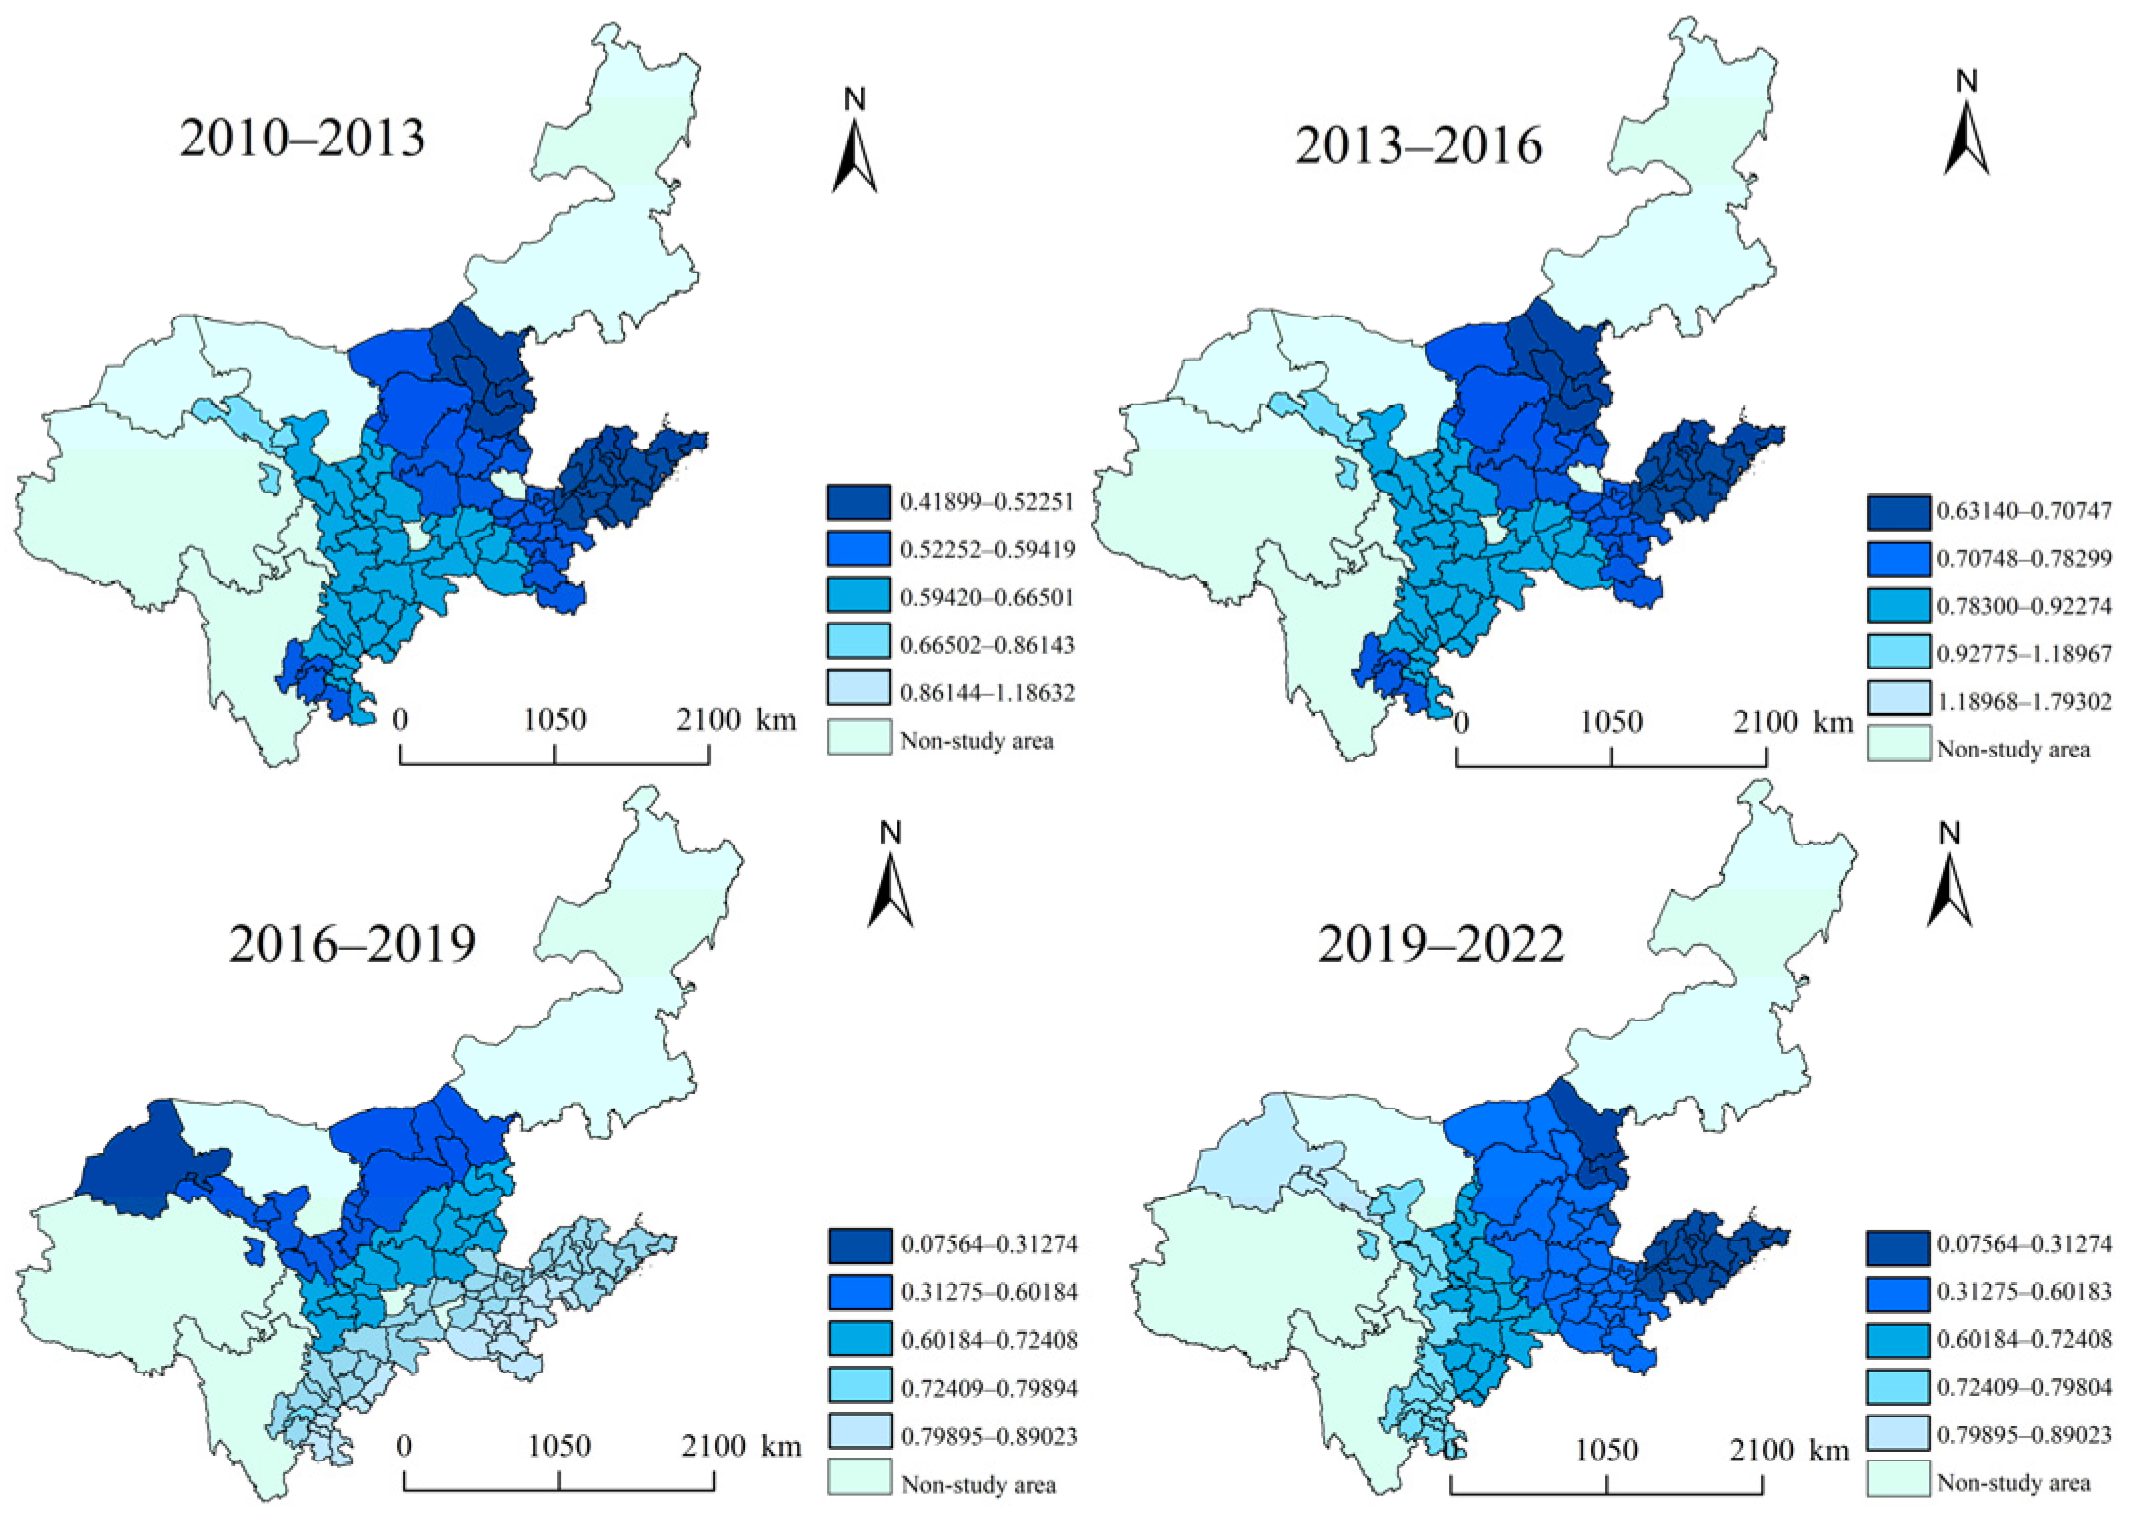
Per capita GDP ( x 1 ) and urbanization rate ( x 2 ) both exhibit a positive driving effect on the decoupling index (with mean regression coefficients of 0.0005 and 0.68, respectively), indicating that increases in these two factors inhibit the decoupling process. This effect demonstrates a spatial pattern of “strong in the west and weak in the east” (Figure 6 and Figure 7).
At the economic development level, the western regions (e.g., Gansu, Ningxia) are still in the middle stage of industrialization, with a high proportion of energy-intensive industries. The growth of per capita GDP directly drives up energy consumption and carbon emissions, leading to an increase in the decoupling index. In contrast, the eastern regions (e.g., Shandong, Henan) have achieved diminishing marginal effects of economic growth on carbon emissions through technological upgrading and industrial transformation, thus exhibiting a weaker inhibitory effect.
At the urbanization level, during the initial stage of rapid urbanization (2010–2016), population agglomeration and infrastructure construction drove up energy demand. In resource-based regions (e.g., Inner Mongolia, Shaanxi), every 1% increase in the urbanization rate led to a 0.82 increase in the decoupling index. In the later stage (2019–2022), eastern cities weakened the inhibitory effect of urbanization on decoupling through the optimization of land use and public services, with the regression coefficient decreasing to 0.31.

3.2.2. The “Differentiated Moderating” Effect of Land Use and Technological Progress

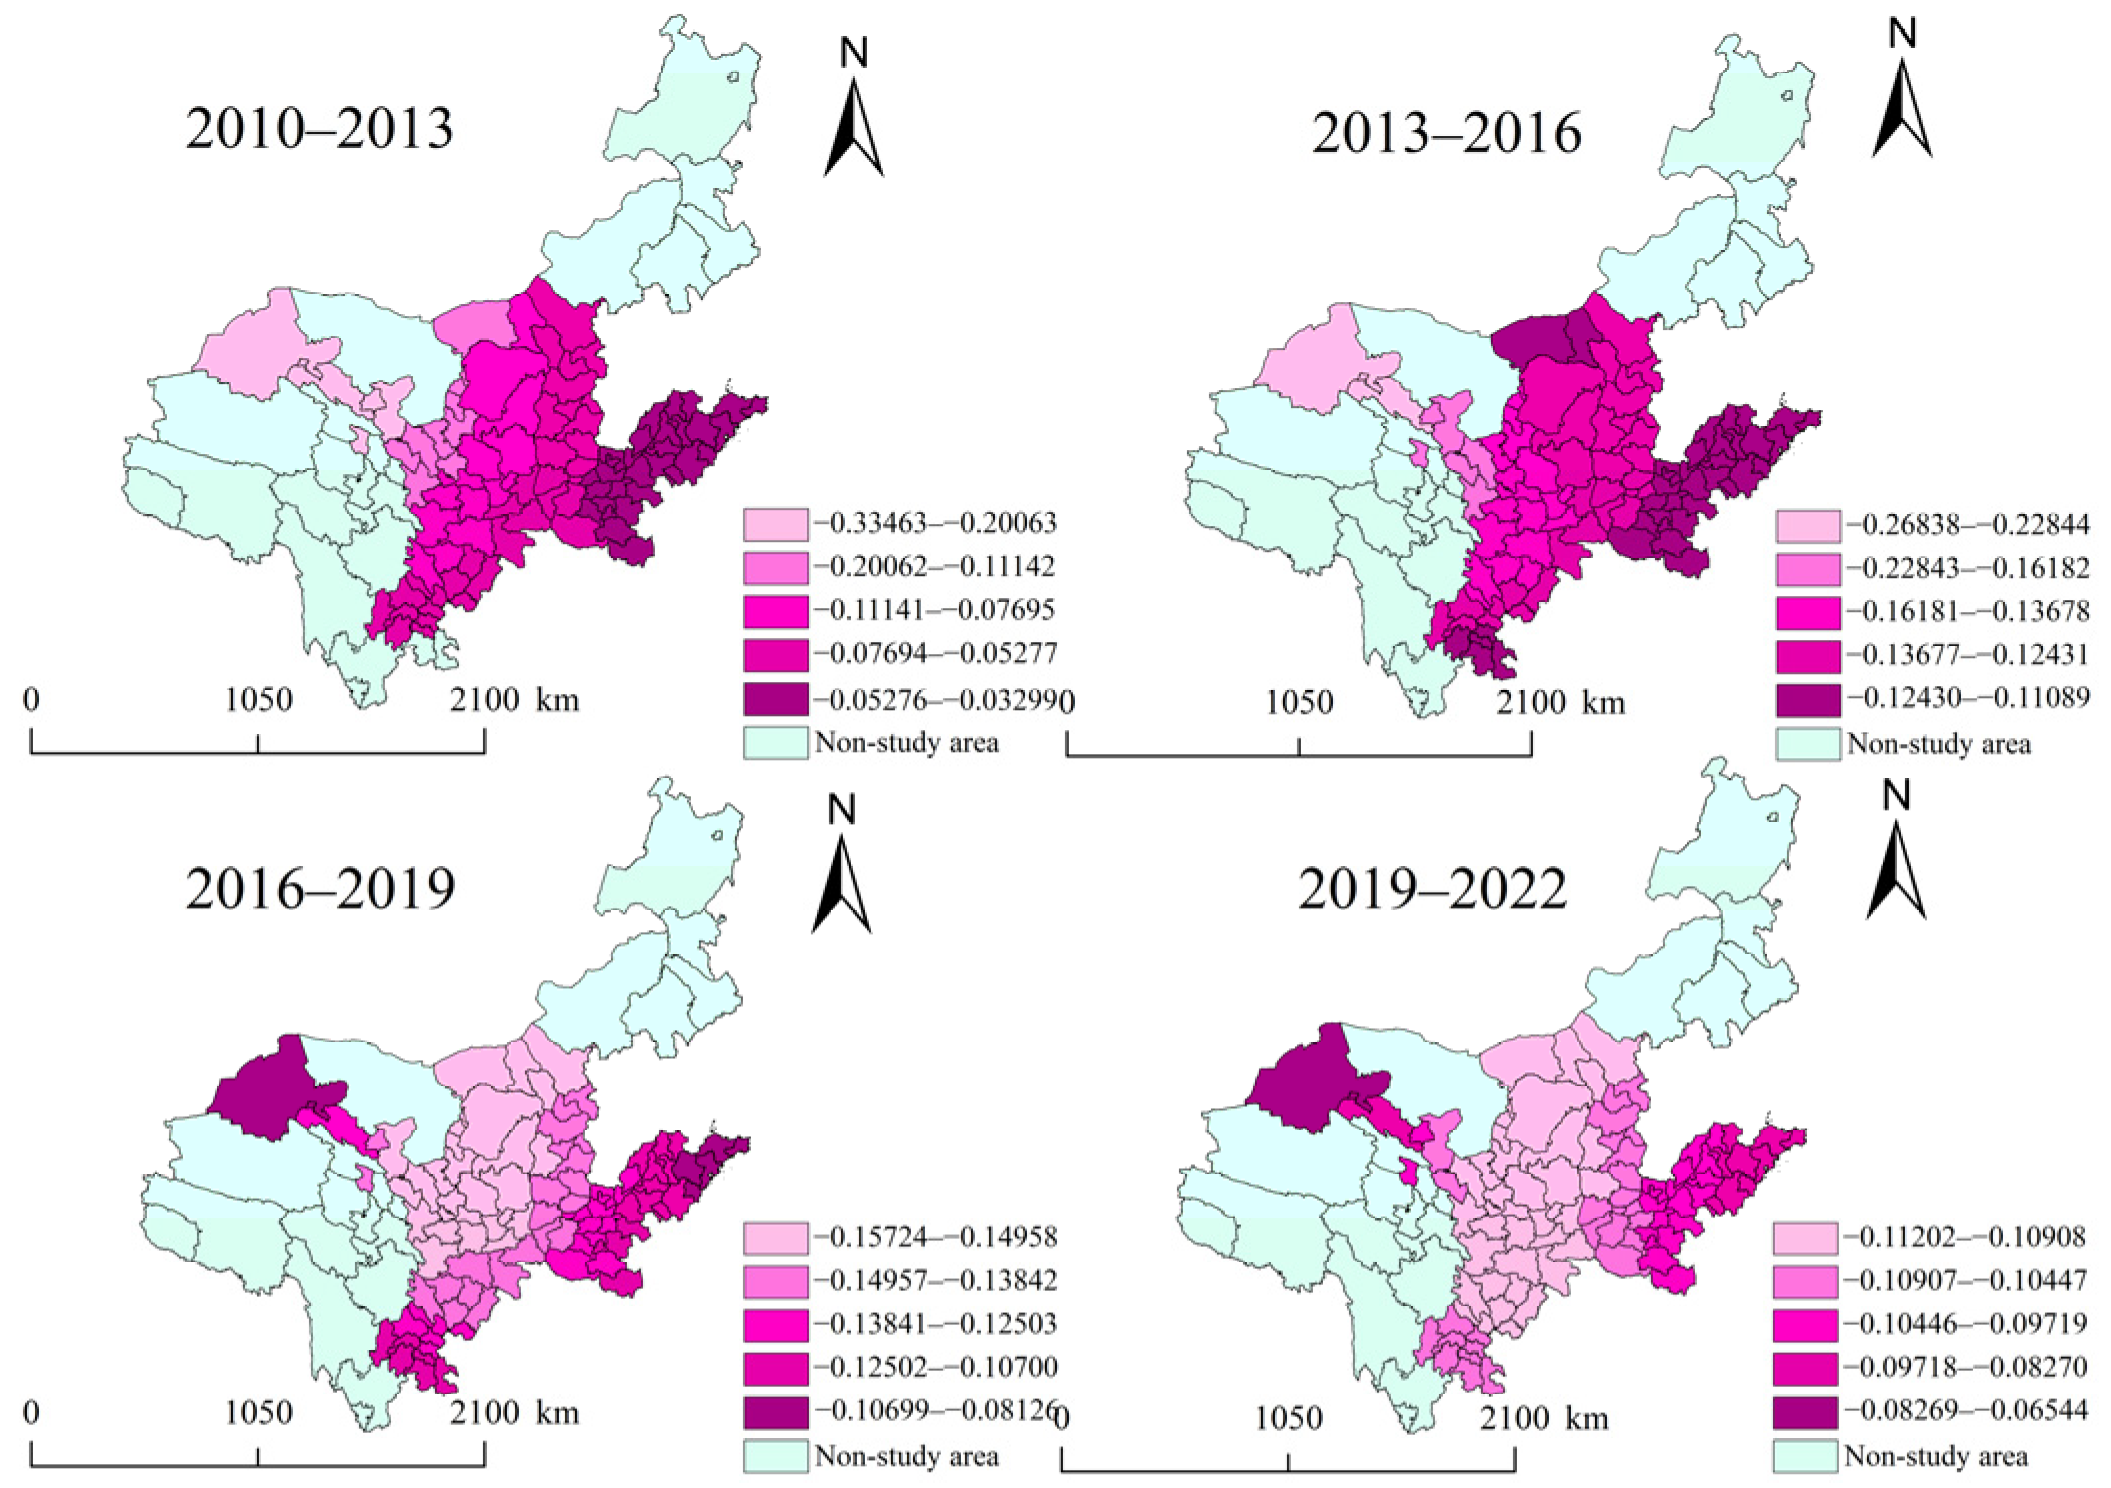
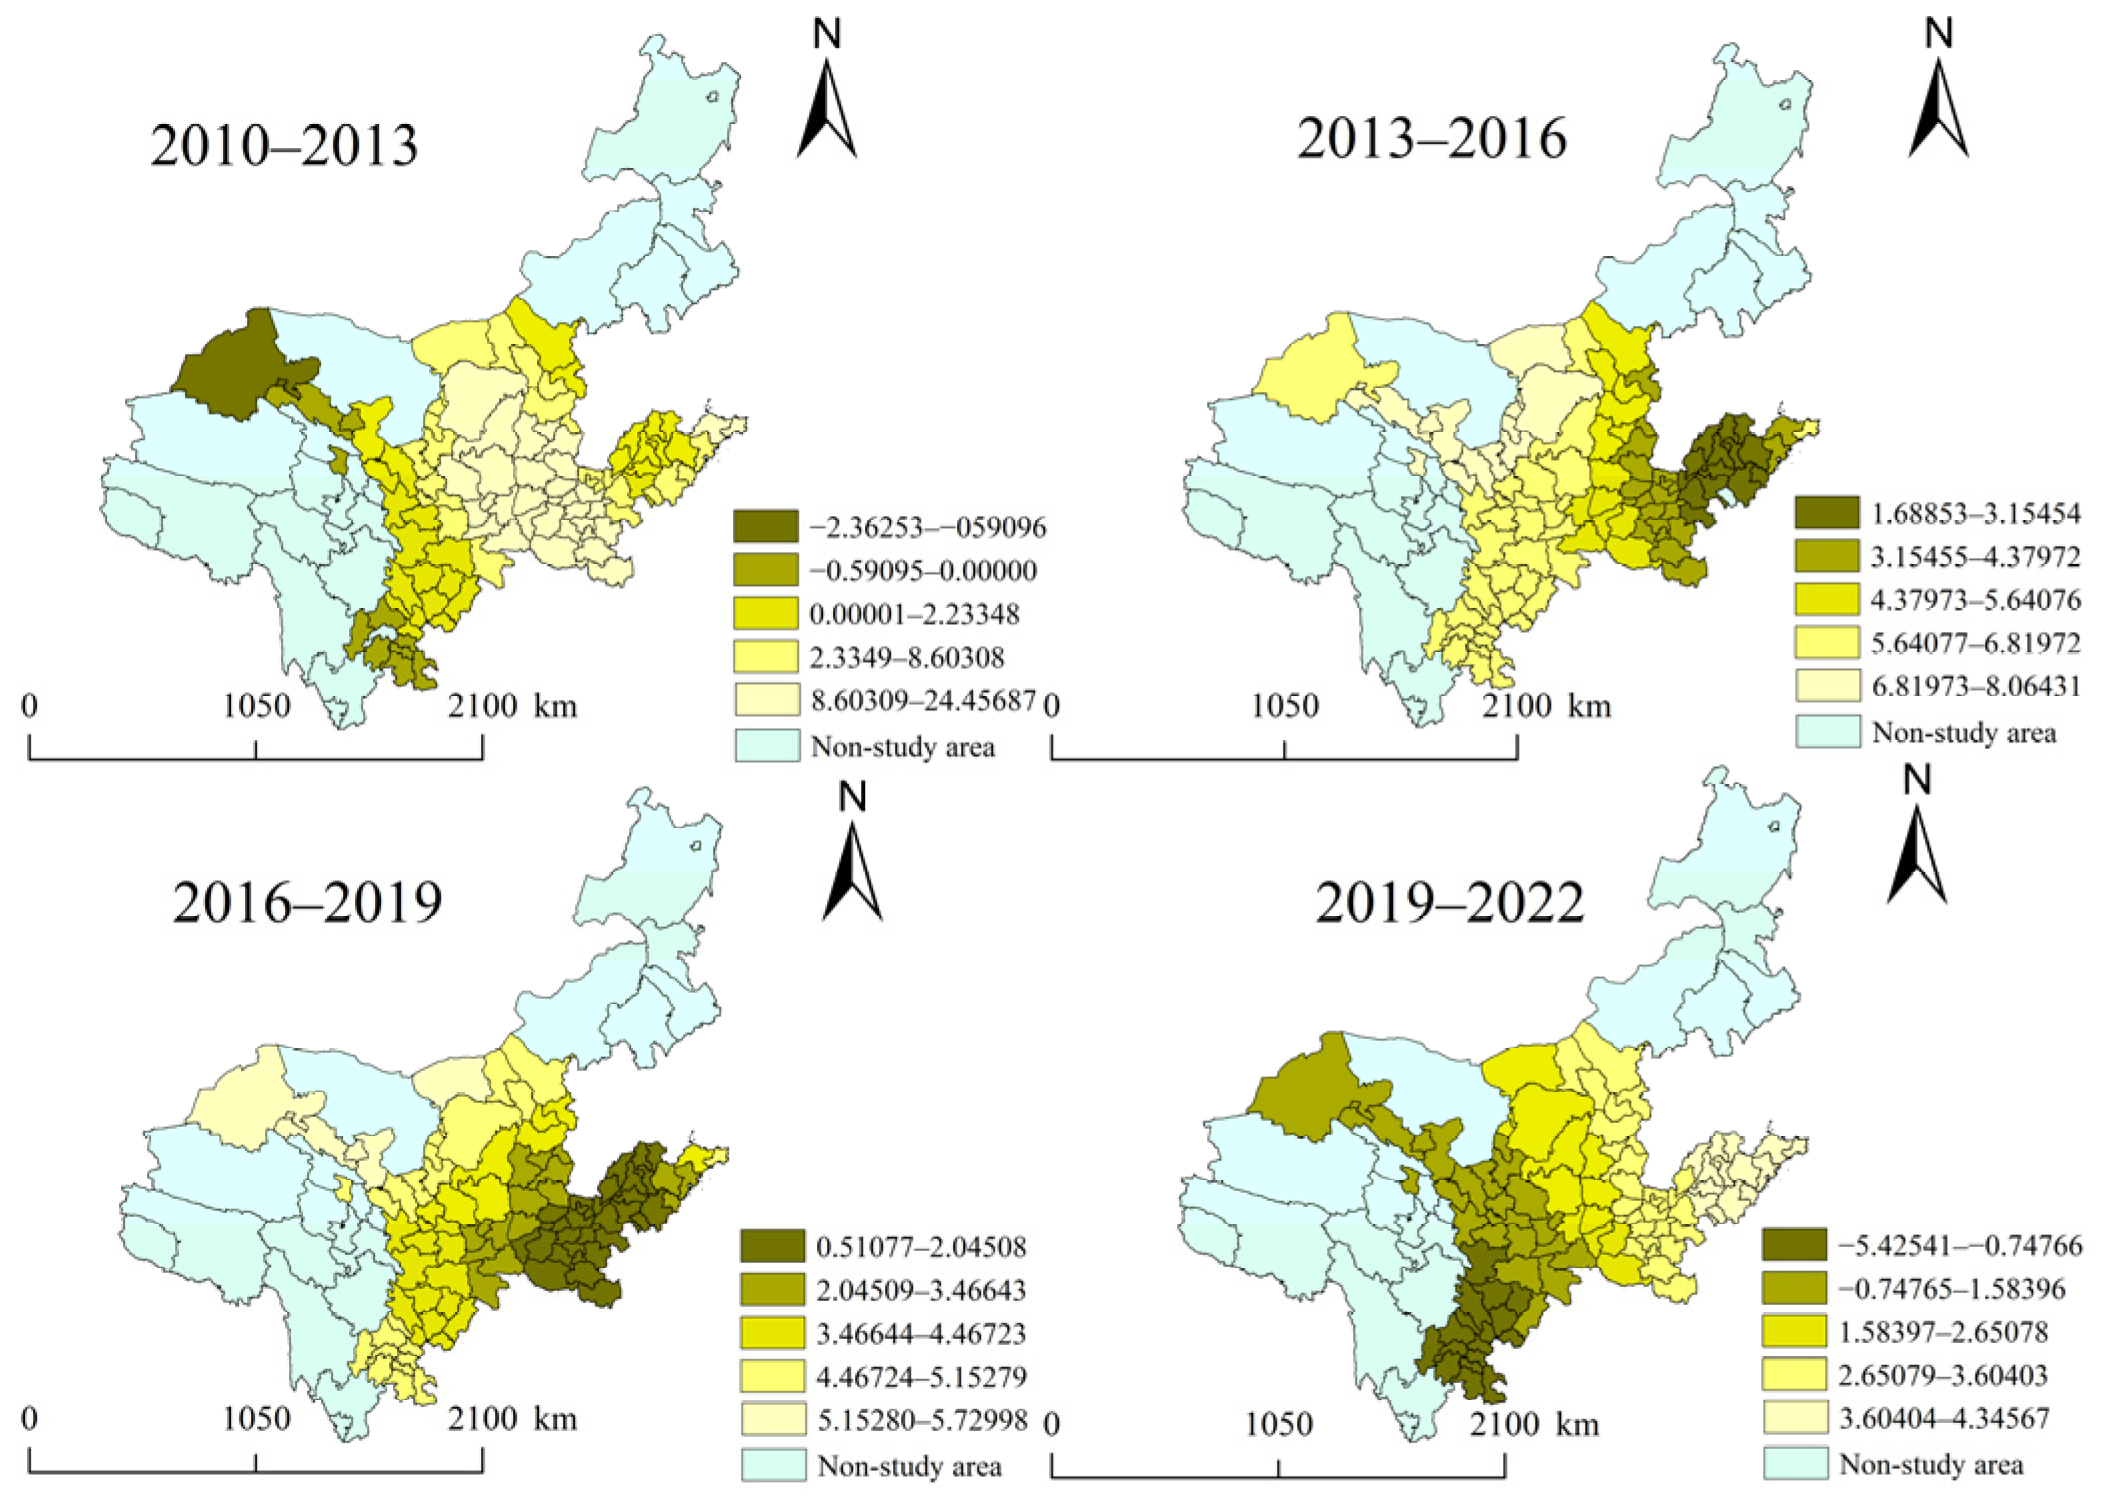
Urban construction land area ( x 4 ) and the number of green patent grants ( x 5 ) exhibit a negative inhibitory effect and a bidirectional influence on the decoupling index, respectively (Figure 8 and Figure 9).
Regarding the land intensification effect, the mean regression coefficient of urban construction land area is −0.18, indicating that improvements in land use efficiency can promote decoupling. Spatially, central urban agglomerations (e.g., Xi’an, Zhengzhou) significantly reduce carbon emission intensity per unit of GDP through the “compact city” model, with a pronounced inhibitory effect (regression coefficient < −0.25); in contrast, western cities (e.g., Jiuquan, Jiayuguan) exhibit a weaker inhibitory effect (regression coefficient > −0.10) due to extensive land expansion.
The regression coefficient of the number of green patent grants fluctuates between −0.01 and 0.02, exhibiting significant spatial heterogeneity. In eastern cities represented by Jinan and Qingdao, the regression coefficient is negative (<0), indicating that technological transformation has effectively promoted carbon emission reduction; whereas in western cities, the regression coefficient is positive (>0), suggesting that technological progress has instead inhibited decoupling. This phenomenon can be attributed to the “rebound effect,” whereby technological improvements stimulate energy consumption, thereby offsetting part of the emission reduction effect. This spatial differentiation pattern profoundly reflects the dual effect of technological progress on carbon decoupling.

3.2.3. The “Stage-Dependent” Effect of Industrial Structure Upgrading

The mean regression coefficient of industrial structure upgrading ( x 3 ) is 1.24, indicating an overall inhibitory effect on decoupling; however, significant spatiotemporal differences exist (Figure 10).
In the temporal dimension, from 2010 to 2013, the proportion of the tertiary industry increased in central and western cities such as Chengdu and Xi’an, with the servitization of industrial structure exerting a strong inhibitory effect on decoupling, yielding coefficients greater than 2.0. From 2019 to 2022, eastern cities notably weakened this inhibitory effect—with coefficients declining to between 0.5 and 1.0—through internal structural optimization of the service sector, including finance and technology services.
In the spatial dimension, in traditional industrial provinces such as Shanxi and Shaanxi, the proportion of the secondary industry has long exceeded 50%, and the inhibitory effect of industrial structure upgrading on decoupling is relatively pronounced, with coefficients greater than 1.5. In contrast, Shandong Province has effectively reduced the share of heavy industry through strategies that promote economic structural optimization and upgrading via industrial transfer and labor mobility, resulting in a relatively weaker inhibitory effect, with coefficients below 0.8.

3.3. Predictive Analysis of Final Energy Consumption

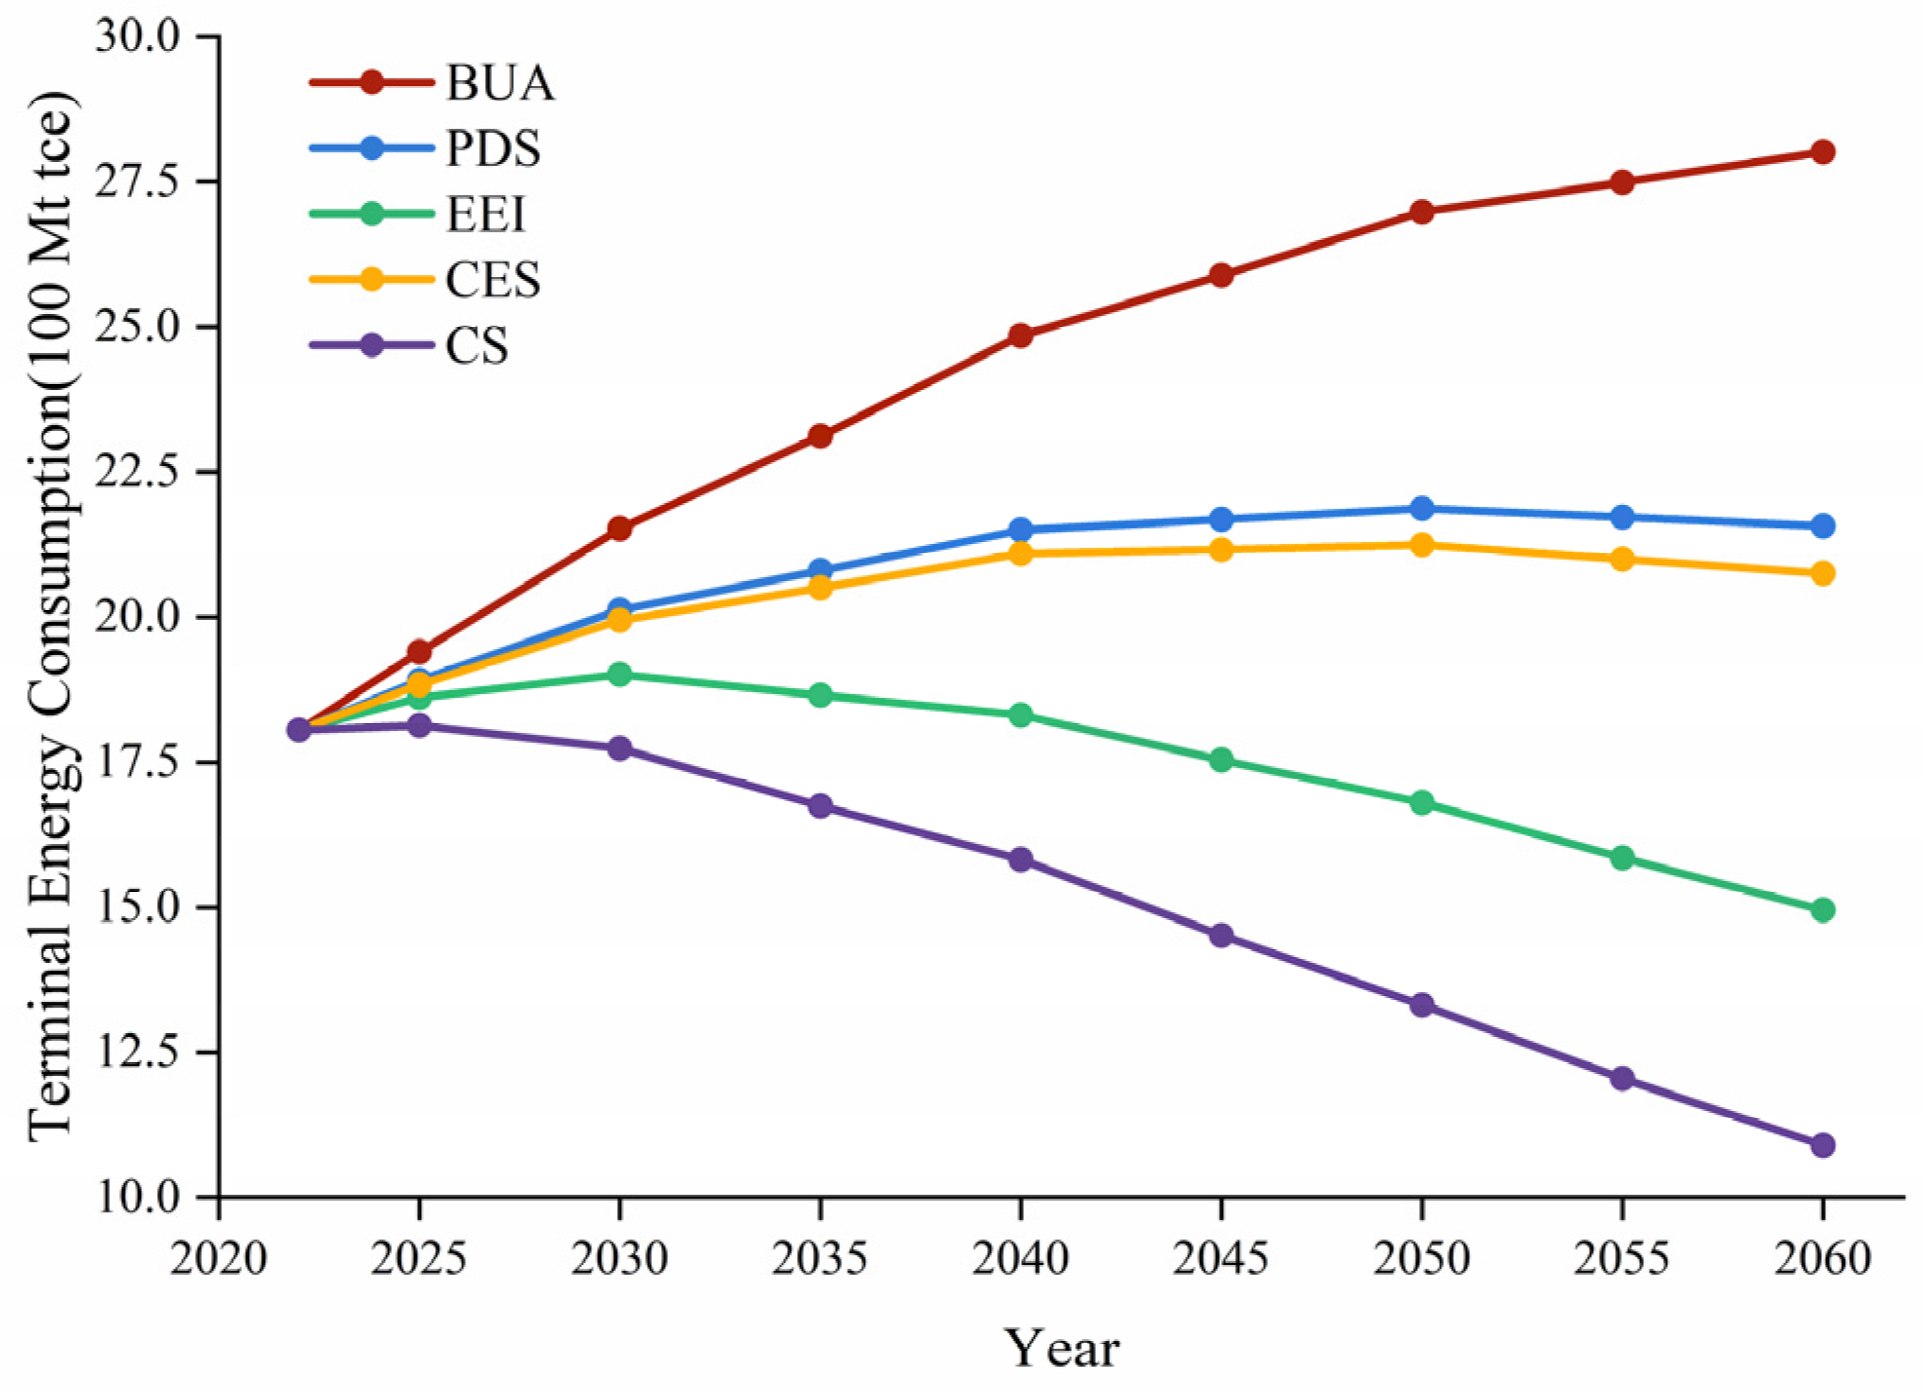
The projection results of total final energy consumption in the YRB under the five scenarios indicate (Figure 11): Under the BAU scenario, driven by the combined effects of sustained economic growth and relatively slow energy efficiency improvements, total energy consumption will continue to rise, increasing from 1.805 billion tons of coal equivalent (tce) in 2022 to 2.801 billion tce in 2060. This trend suggests that in the absence of stronger intervention measures, energy demand in the YRB will exert enormous pressure on both resources and the environment.
The remaining four emission reduction scenarios all exhibit a trend in which total energy consumption is effectively curbed. Among them, the CS scenario demonstrates the most pronounced effect: benefiting from the most aggressive energy-saving measures and industrial structure upgrading, total energy consumption peaks around 2030 at approximately 1.77 billion tce and declines to 1.090 billion tce by 2060, equivalent to only 39% of the BAU scenario in the same period. The EEI scenario also achieves significant energy-saving results, with total energy consumption in 2060 reaching 1.495 billion tce, a reduction second only to the CS scenario, thereby underscoring the central role of energy efficiency improvement in regional sustainable development.
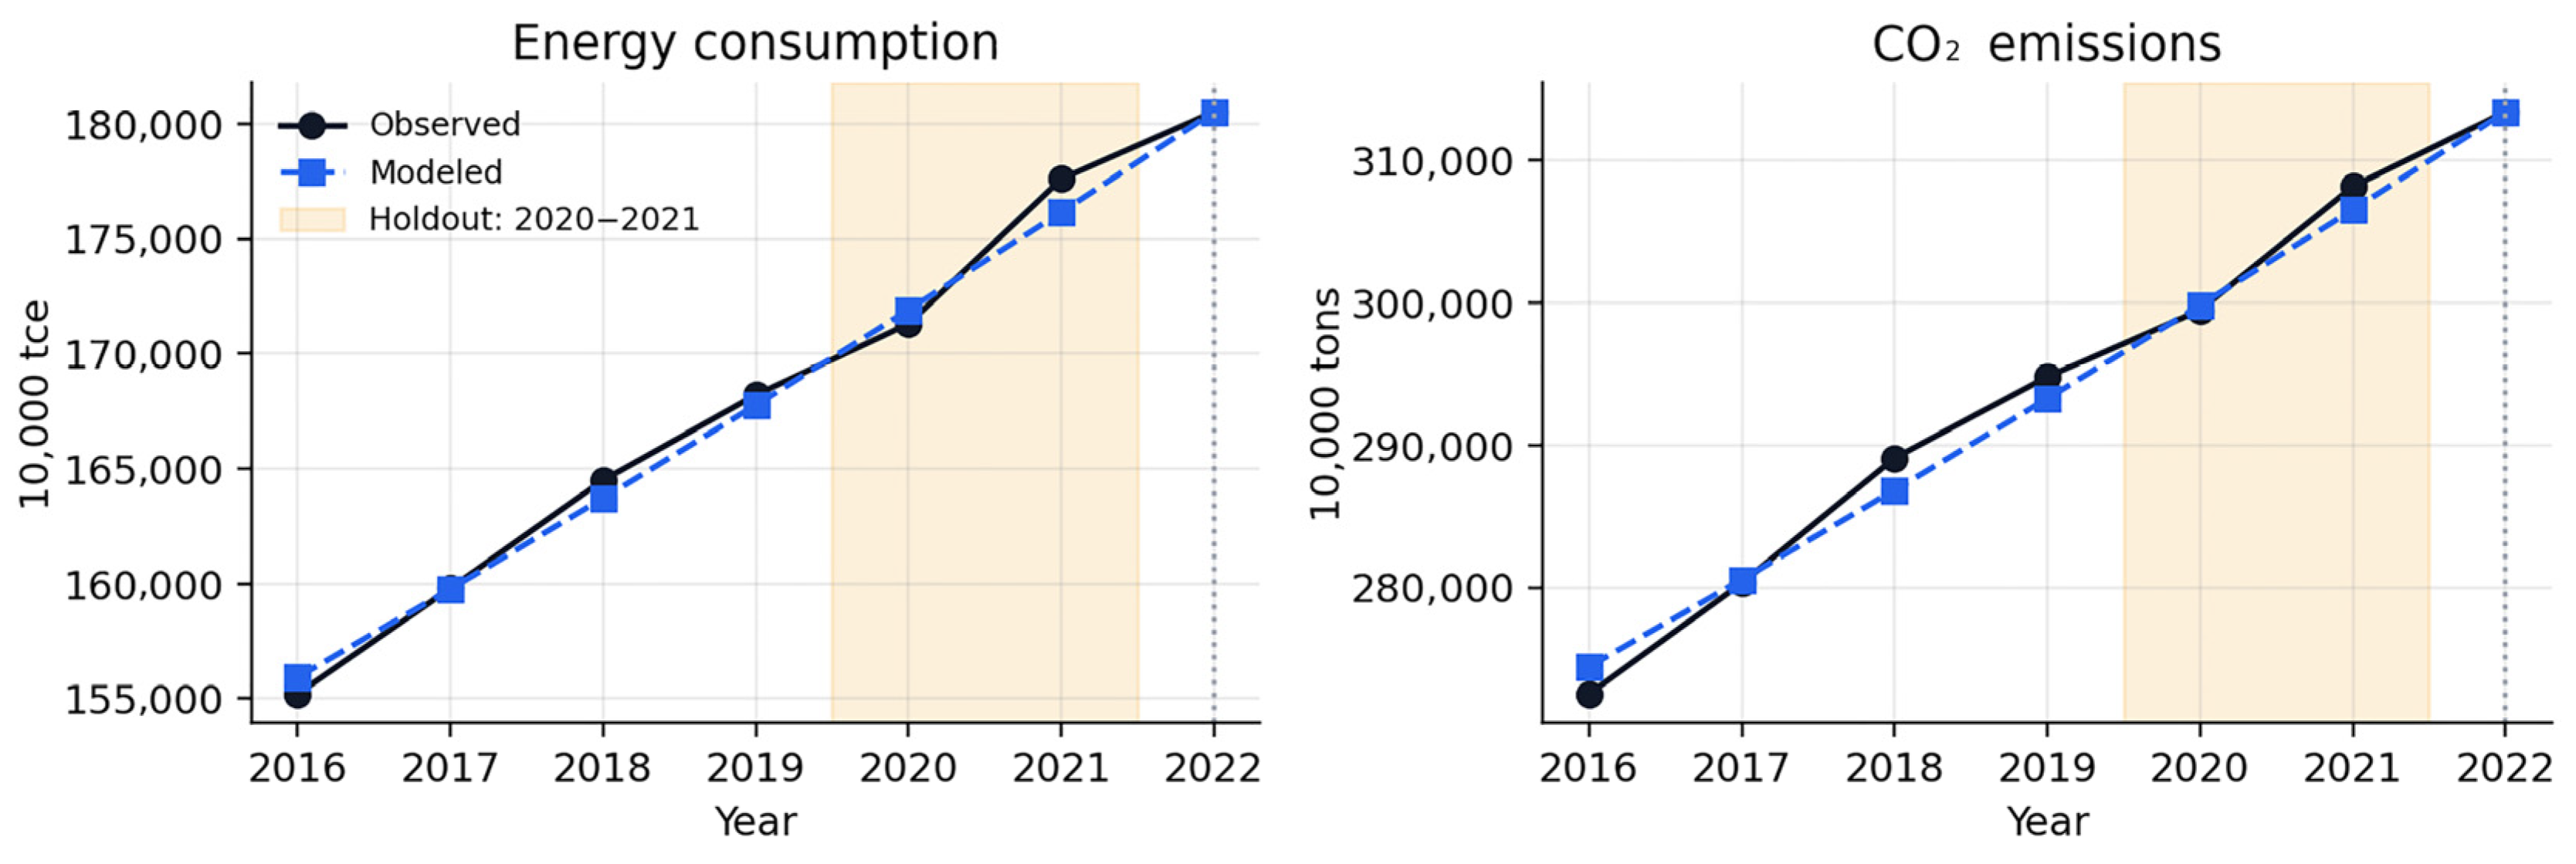
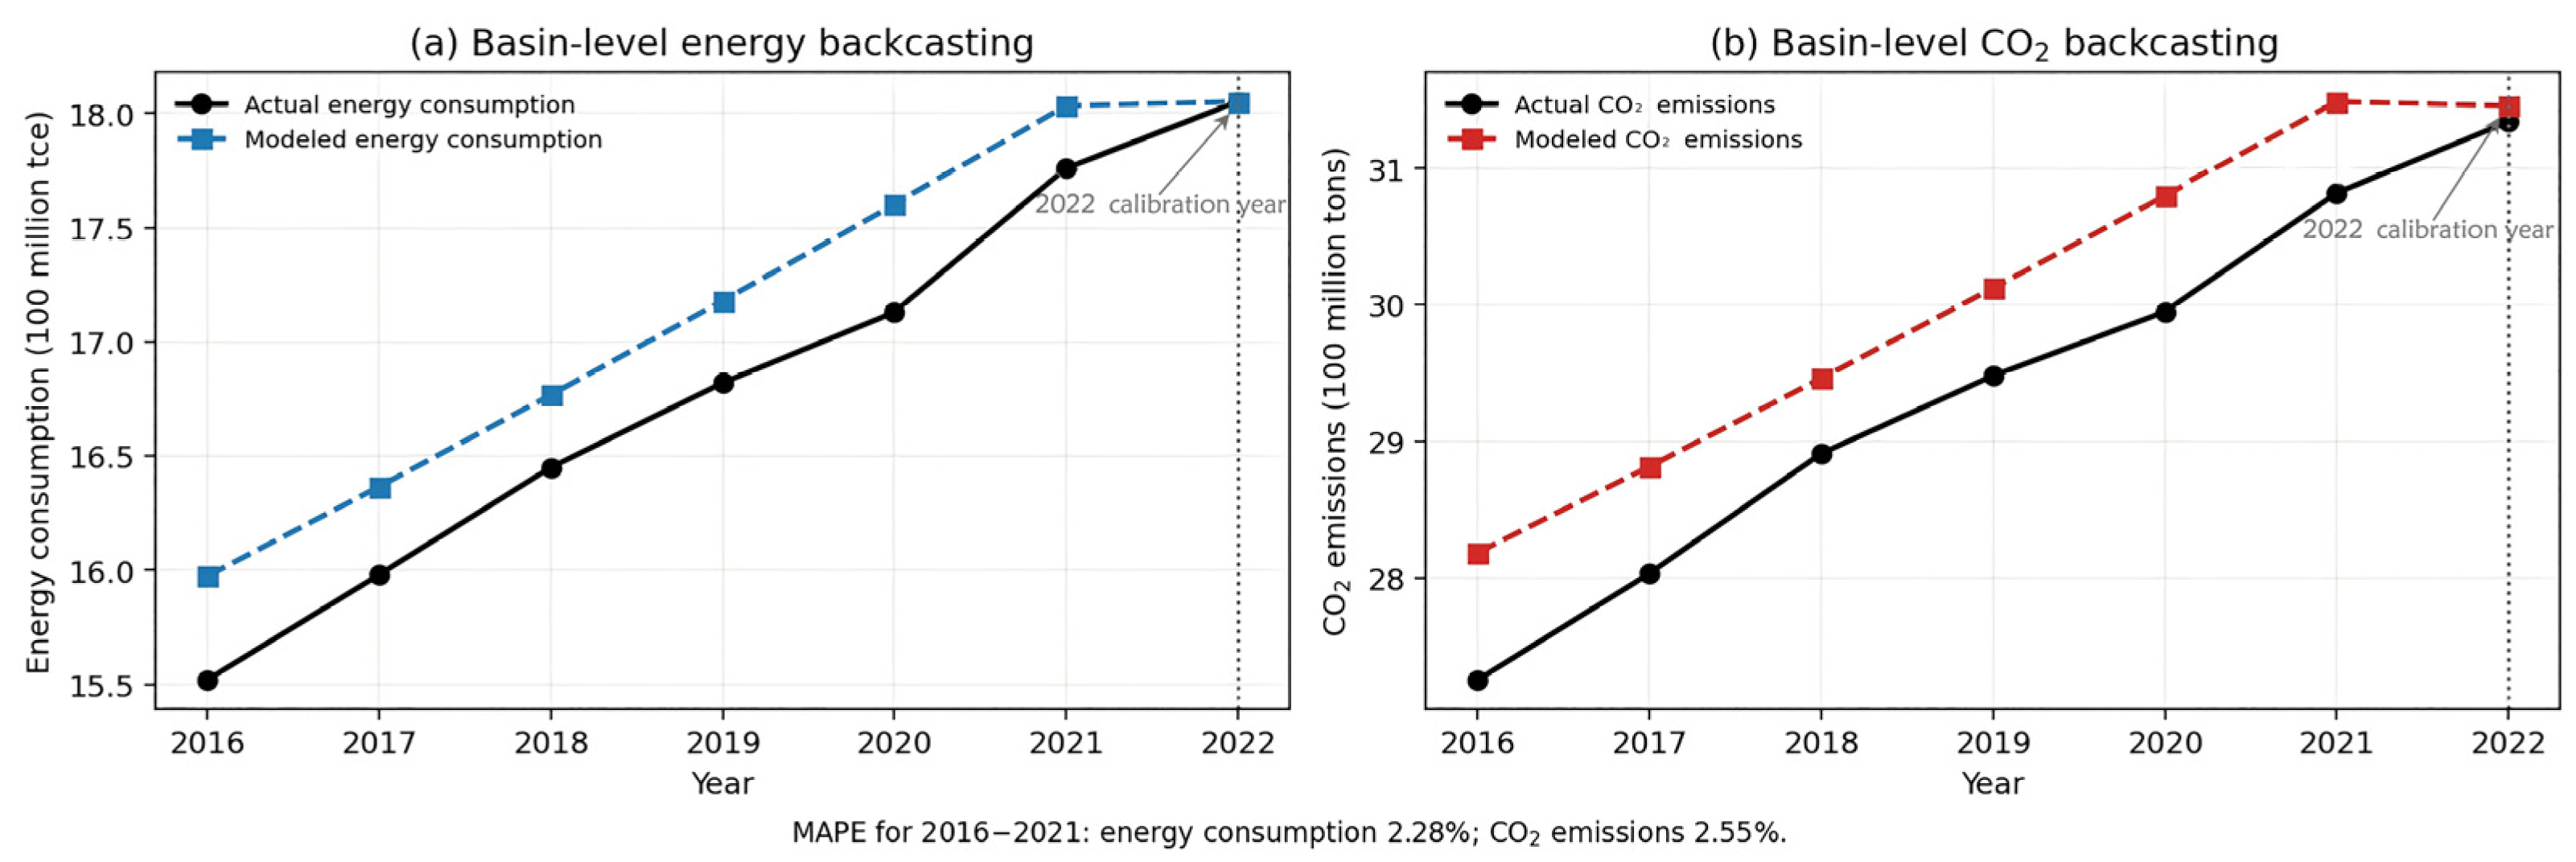
The basin-level backcasting check compares modeled and historical series for 2016–2021, while 2022 is retained as the calibration year (Figure 12). Excluding the calibration year, MAPE is 2.28% for total energy consumption and 2.55% for total CO2 emissions; the largest single-year error remains below 3.5%. These values describe historical consistency at the aggregate basin scale and do not constitute province-level or out-of-sample validation.
The aggregate backcast is complemented by a calibration-conditioned temporal holdout (Table 9 and Figure 13). Parameters are fitted on 2016–2019, while 2020–2021 are excluded from fitting. Holdout MAPE is 0.58% for energy consumption and 0.32% for CO2 emissions. This check is more demanding than reporting only the full-period historical fit, but it remains a backward calculation anchored to the 2022 calibration point and therefore is not equivalent to an external forward forecast. Province-level validation remains unavailable.

3.4. Multi-Scenario Predictive Analysis of Total Carbon Emissions

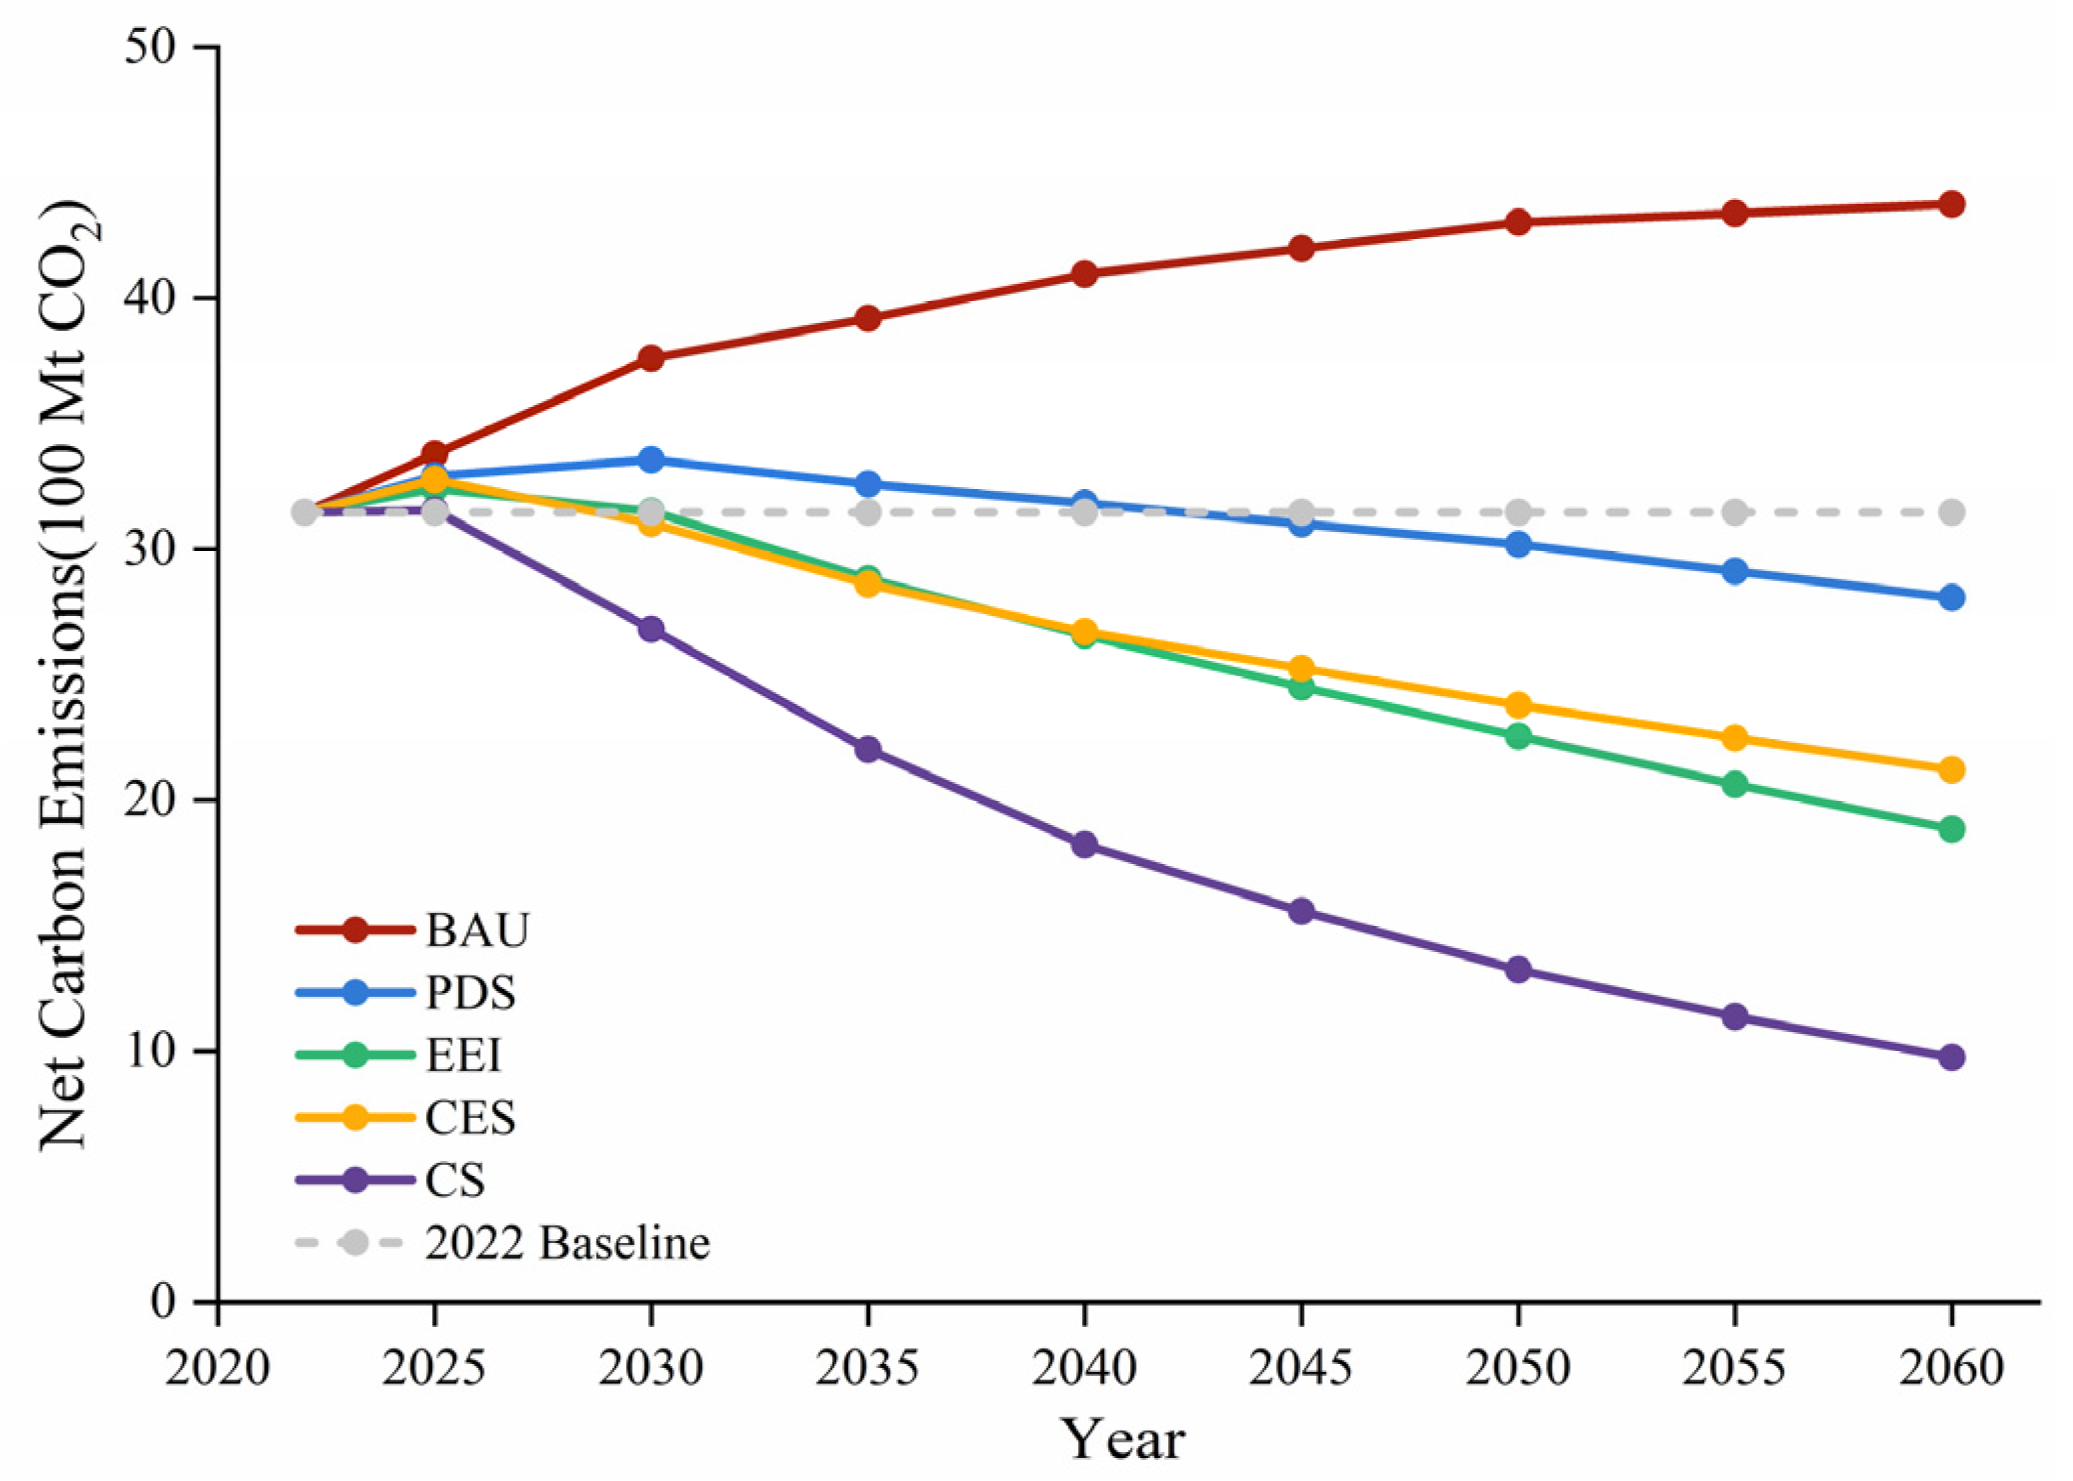
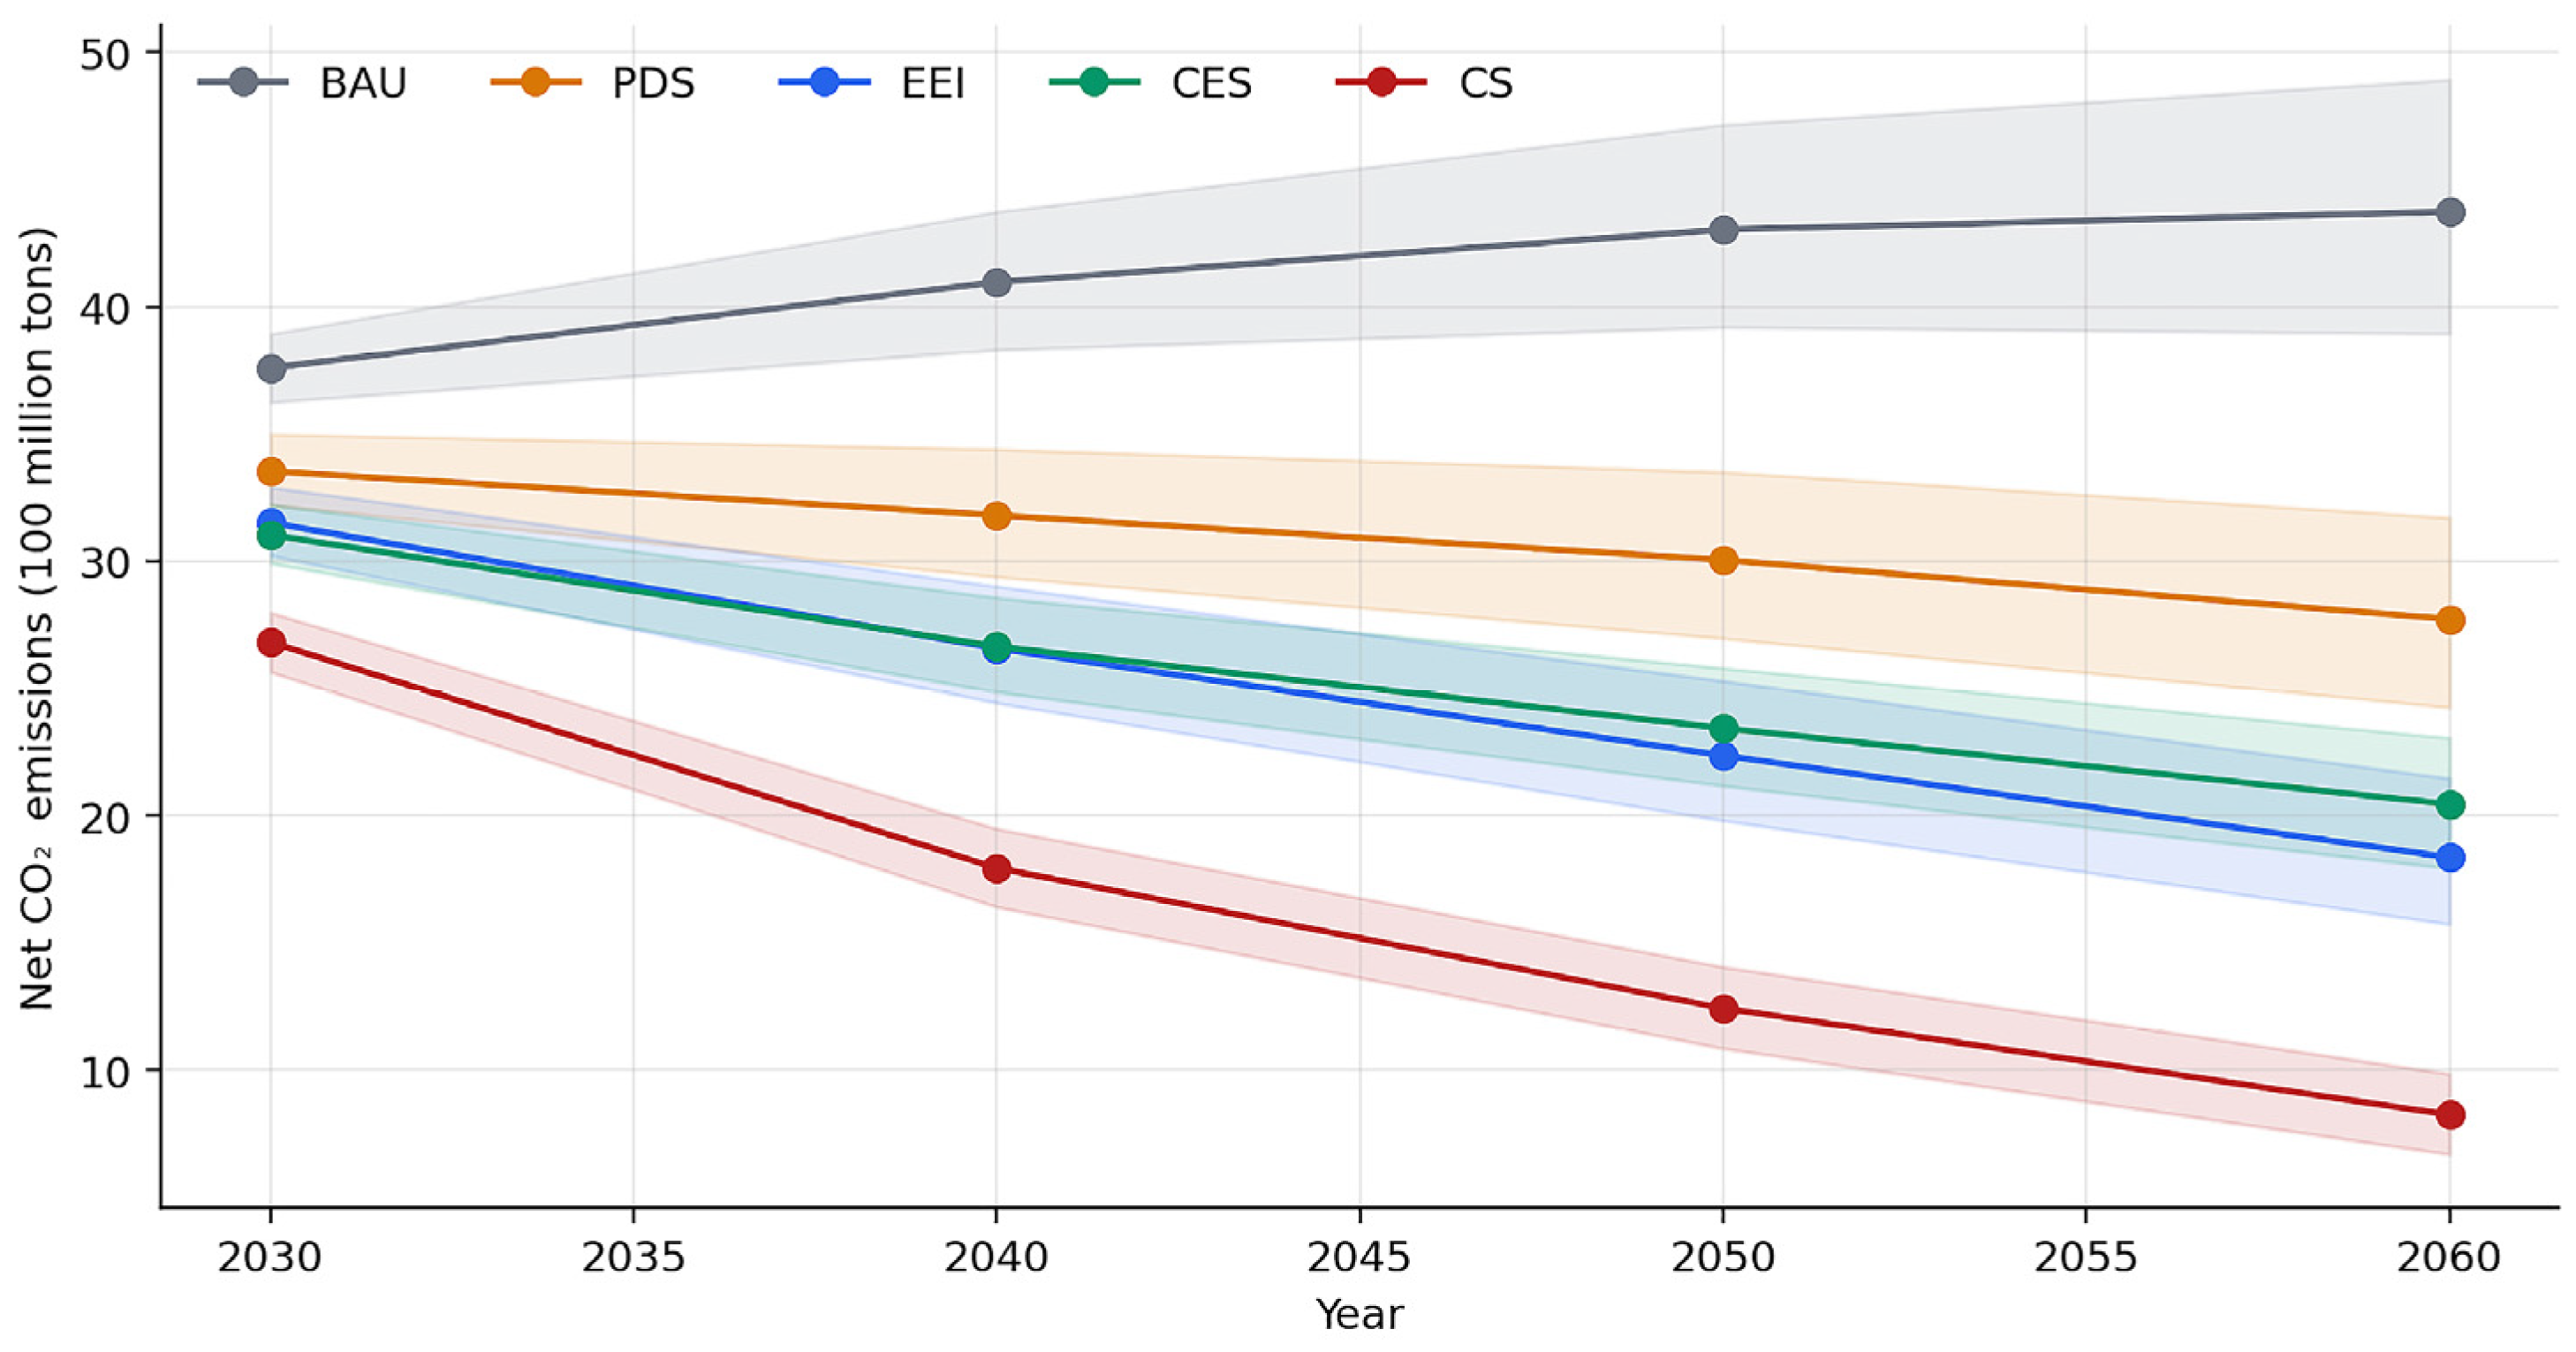
The projected total net carbon emissions of the YRB under the five scenarios are presented in Figure 14. The simulation results under different development scenarios exhibit markedly divergent carbon emission evolution trajectories.
The simulation results of the BAU scenario indicate that regional carbon emissions exhibit a sustained upward trend, with total carbon emissions increasing from 3.146 billion tons in 2022 to 4.374 billion tons in 2060, without an inflection point for peak carbon emissions during this period. This result fully demonstrates that, in the absence of high-intensity control policies, the carbon emission reduction process in the YRB will be significantly delayed, rendering it a prominent constraining factor for the implementation of the national “dual carbon” strategy.
The simulation results of the PDS scenario indicate that, relying on the existing emission reduction policy framework, regional carbon emissions can peak around 2030 at approximately 3.357 billion tons, followed by a gradual decline post-peak. This demonstrates that the current policy framework is both rational and directionally appropriate; however, the existing emission reduction intensity is insufficient to support the deep decarbonization development requirements in the medium to long term.
Both the EEI scenario and the CES scenario can bring forward the peak carbon emission timeline. Specifically, under the EEI scenario, carbon emissions peak in 2026 at 3.247 billion tons, while the CES scenario reaches its peak in 2025 with a peak volume of 3.278 billion tons. A comparative analysis of the two scenarios confirms that, during the critical phase of achieving peak carbon emissions, energy efficiency retrofitting yields faster emission reduction effects and greater benefits compared to the pathway of clean energy structure transition.
The CS scenario represents the optimal emission reduction pathway under the region’s endogenous abatement potential. The calculation results show that regional net carbon emissions can be reduced to 825 million tons by 2060. This pathway relies solely on endogenous emission reduction measures such as local energy conservation, carbon reduction, and industrial optimization, without depending on large-scale external clean energy imports. Although absolute net-zero emissions have not been achieved, the basin’s local emission reduction potential has been fully realized.

4. Discussion

4.1. Analysis of the Decoupling Relationship Between Economic Growth and Carbon Emissions in the YRB

This study selects the YRB as the research sample to systematically examine the evolutionary patterns of the decoupling relationship between economic growth and carbon emissions in this nationally critical economic carrying zone and core ecological barrier area. From the perspective of temporal evolution, the decoupling relationship among cities within the basin exhibits an overall positive trajectory: although the number of cities achieving strong decoupling has experienced a slight decline, the number of weakly decoupled cities has continued to expand and has become the dominant decoupling type in the basin. This finding is consistent with the conclusions of Zhang [45] and Du [46] regarding the decoupling patterns of urban agglomerations in the YRB. Concurrently, the number of cities exhibiting two inefficient development states—expansive coupling and expansive negative decoupling—has decreased year by year, a trend significantly associated with the implementation of China’s environmental regulatory policies. From the perspective of spatial evolutionary differentiation, the decoupling status between economic development and carbon emissions in the YRB exhibits pronounced regional heterogeneity, a finding that corroborates the conclusions of Wu et al. [47].
Over the study period, the overall decoupling index of the YRB exhibited a fluctuating downward trend, with decoupling status alternating among expansive coupling, strong decoupling, and weak decoupling. This instability can be attributed to uneven economic development across the basin: upstream provinces (e.g., Qinghai and Gansu) remain in the early stage of industrialization, while downstream Shandong and Henan have entered the late-industrialization or post-industrialization phase. The asynchronous transition of industrial structures across provinces has led to markedly divergent decoupling trajectories. Furthermore, the basin’s energy system remains heavily locked into coal dependence, and despite incremental efficiency improvements, total carbon emissions have not yet peaked. This implies that the fundamental condition for stable decoupling—namely, achieving absolute emission reductions amid sustained economic growth—has not been consistently realized in most cities.

4.2. Analysis of the Spatiotemporal Driving Mechanisms of the Carbon Emission Decoupling Index in the YRB

The GTWR results show that the regression coefficients of both per capita GDP and urbanization rate are positive, identifying them as the primary factors inhibiting decoupling. The underlying mechanism lies in the “scale effect” of economic expansion: in provinces dominated by energy-intensive industries, such as Shanxi and Inner Mongolia, GDP growth remains tightly coupled with coal-based industrial output, so that rising per capita income directly drives proportional or even faster growth in energy consumption and carbon emissions. Meanwhile, urbanization exerts pressure through spatial expansion and consumption upgrading, with the concurrent expansion of urban construction land not only weakening carbon sink capacity but also increasing energy demand in the construction, transportation, and residential sectors. This inhibiting effect is most pronounced in the western basin (Gansu and Ningxia), where urbanization remains infrastructure-driven, and gradually weakens eastward as cities mature and the marginal energy demand per unit of newly added urban population declines.
Industrial structure upgrading has, in most periods and regions, inhibited rather than promoted decoupling. This counterintuitive result can be attributed to two factors. First, the tertiary sector in the basin is dominated by traditional services such as wholesale, retail, and catering, with a relatively low share of high-value-added, low-carbon services such as finance, the digital economy, and green technology consulting. Second, in provinces such as Shanxi and Shaanxi, heavy industry has formed a persistent “lock-in” effect, whereby modest growth in the service sector has been insufficient to offset the continued carbon emission increments from the coal-chemical and heavy manufacturing sectors. Only in developed eastern areas of the basin, such as Shandong Province, has structural emission reduction been achieved through industrial structure upgrading. Furthermore, the intensive management and control of urban construction land in the YRB has yielded notable results, with improvements in land use efficiency effectively curbing the expansion of carbon emissions. This pattern corroborates the theoretical deduction of the pollution haven inhibition effect [48].
This study is largely consistent with the findings of Wang et al. [49], which indicate that economic development, industrial structure, and technological progress exert sustained positive impacts on carbon emissions in the YRB. Notably, however, this paper proposes that the regression coefficient of the number of green patent grants is not unidirectionally positive; rather, technological progress exerts a bidirectional influence on changes in the carbon emission decoupling index, a finding that differs from existing research. This may be attributable to the pronounced “rebound effect” of this factor on carbon emission growth: as green technologies are promoted, energy utilization efficiency is significantly improved, which in turn stimulates consumers and producers to increase their energy consumption, thereby driving up energy use and accelerating the growth rate of carbon emissions. Consequently, technological progress shifts from promoting carbon emission decoupling to exerting an inhibitory effect on it.

4.3. Analysis of Carbon Peak Pathways in the YRB

Based on the projected total carbon emissions, the key indicators of carbon peak under each scenario are summarized (Table 10). The results indicate that whether and when the YRB can achieve peak carbon emissions is highly dependent on policy ambition and implementation intensity. From “peaking before 2030” under the PDS scenario to “peaking in 2025” under the CS scenario, the peaking time can be advanced by five years, and the peak level can be reduced by approximately 6%.
Notably, under the CS, carbon emissions in 2030 (2.680 billion tons) will decrease by approximately 14.8% compared with the baseline level in 2022 (3.146 billion tons), a finding consistent with certain optimistic projections of China achieving substantial emission reductions before 2030. The conclusion that the YRB as a whole cannot achieve carbon peak before 2030 under the BAU scenario aligns with the research findings of Guo [50], Deng [51], and Wang [52].
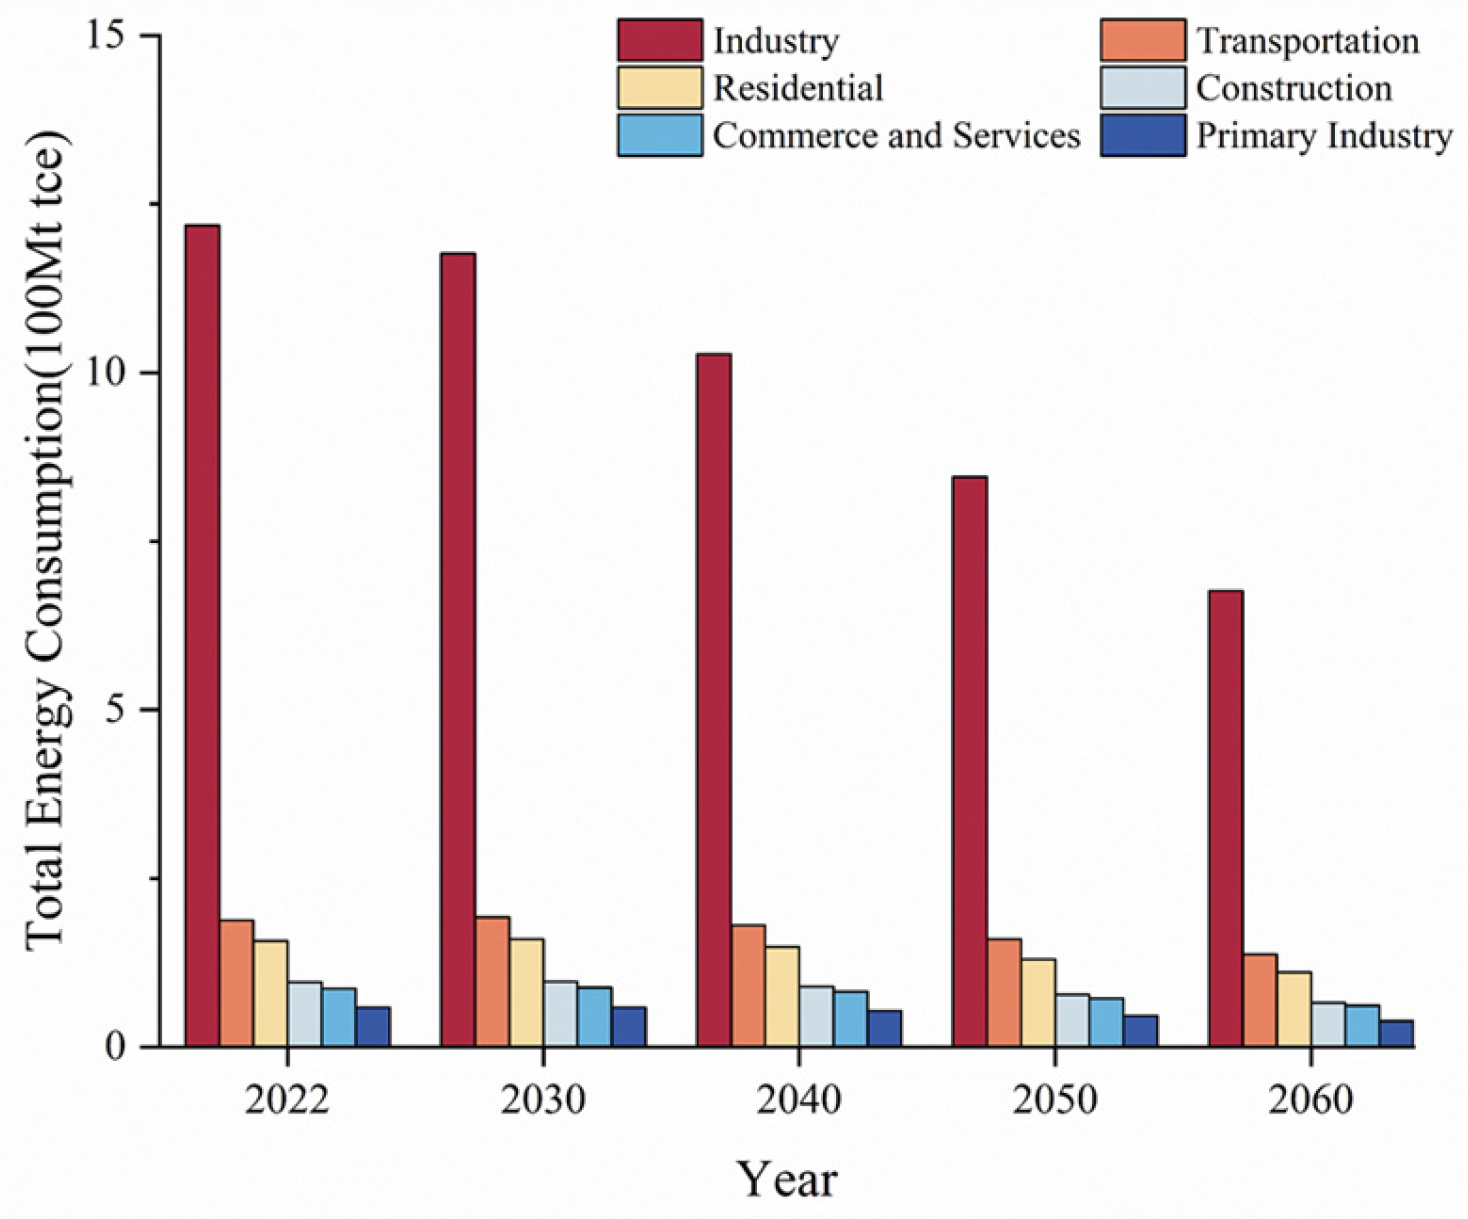
Achieving the deep transition from “peaking” to “neutrality” hinges critically on the fundamental transformation of the energy structure and emission reductions in key sectors. In terms of energy structure transformation, deep electrification of final energy consumption constitutes the core feature under the CS scenario. By 2060, the share of electricity in final energy consumption will reach 64.7%, while the share of coal will account for only 8.0%. This “high-electricity, low-coal” structure serves as the cornerstone for achieving deep decarbonization. Regarding sectoral emission reductions (Figure 15), the industrial sector remains the core sector for both energy consumption and emission reduction throughout the process. Under the CS scenario, although the total industrial energy consumption declines significantly, its share remains the highest. The energy consumption of the transportation sector exhibits a growth trend before 2040, reflecting sustained demand for motorization, and its emission reduction task is arduous, urgently requiring solutions through electrification and hydrogen energy technologies. One of the core innovations of this model lies in the introduction of inter-provincial differentiation parameters in both sectoral energy consumption and energy type structure. This enables the model to more faithfully reflect the vast disparities in energy endowments and development stages within the basin, avoiding the biases introduced by adopting national average parameters, thereby rendering the projection results more regionally specific.

4.4. Analysis of Carbon Emission Reduction Potential in the YRB

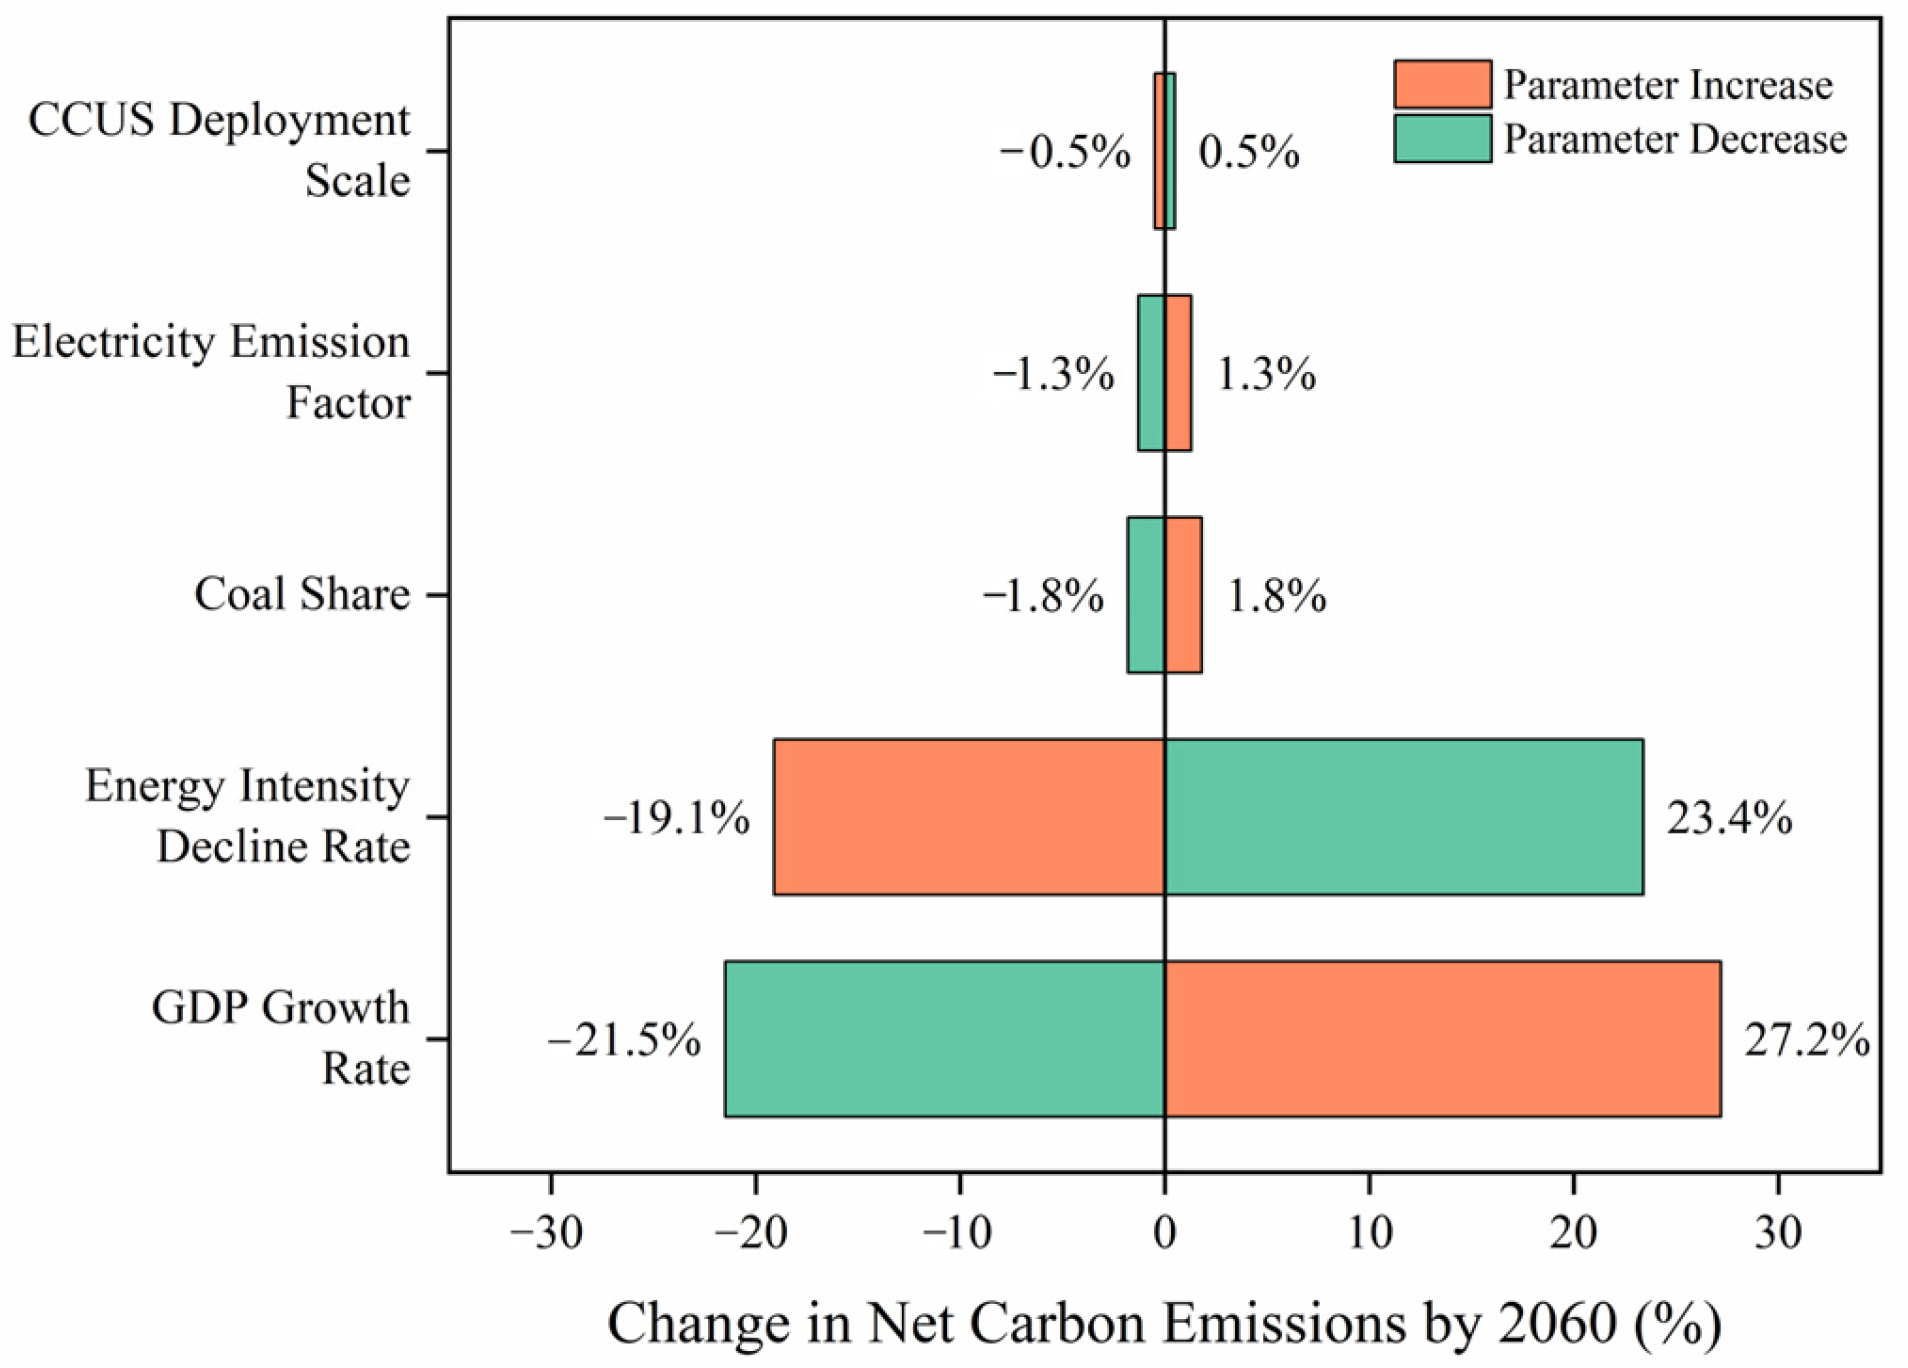
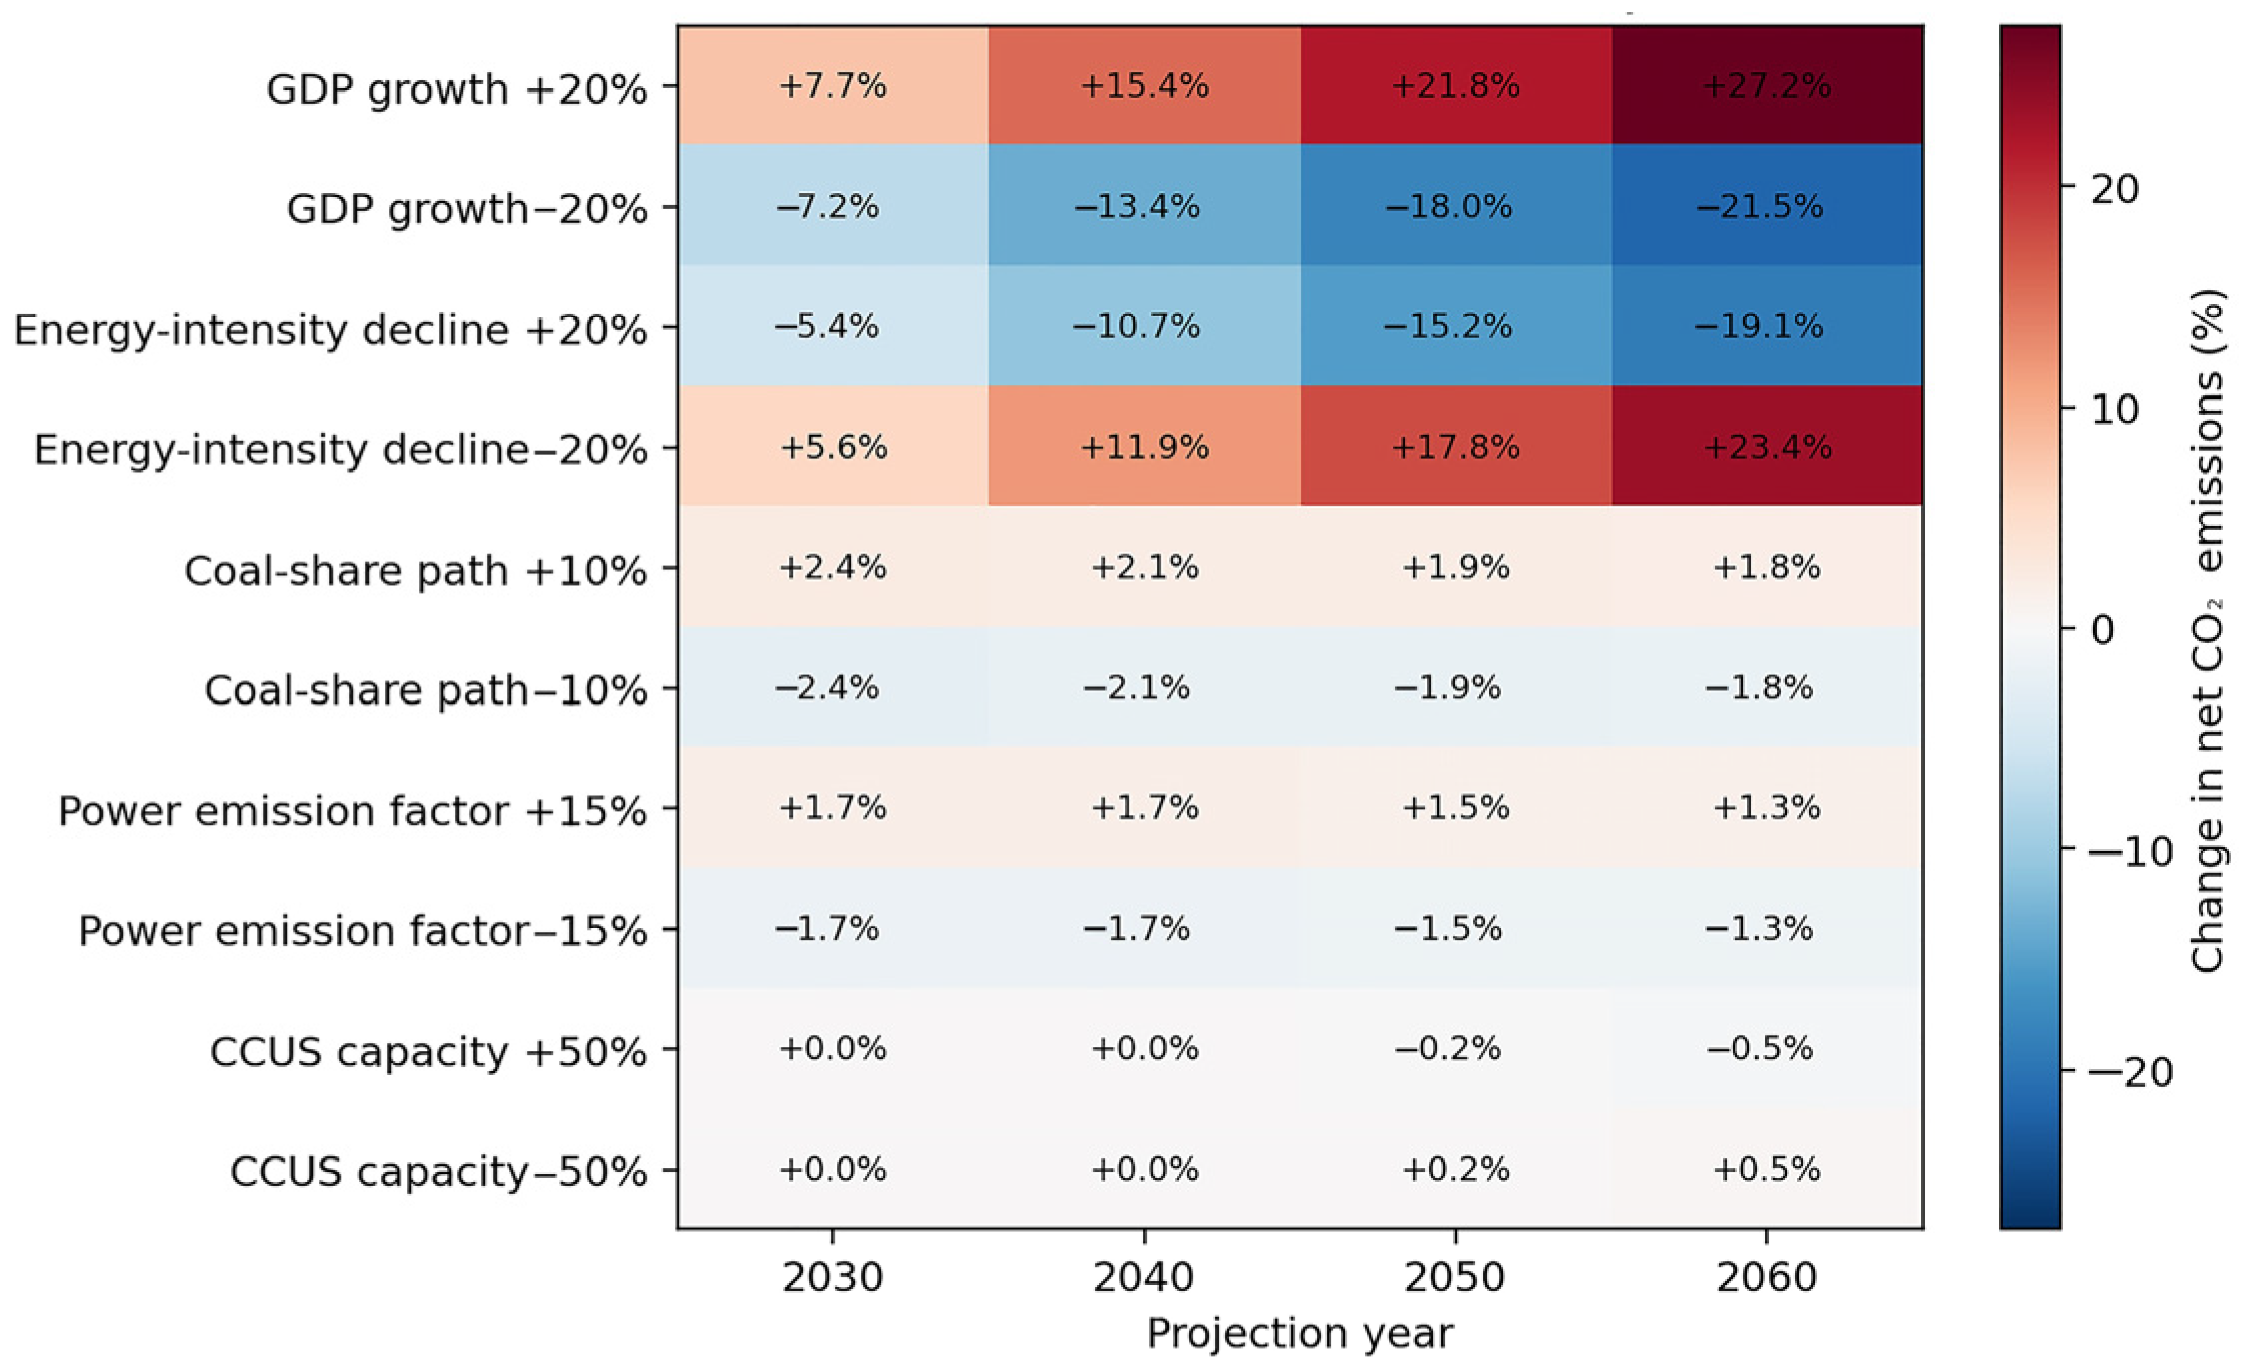
Taking the PDS scenario as the baseline, the impacts of five key parameters—GDP growth rate, energy intensity reduction rate, coal share pathway, power sector emission factor, and CCUS scale—on net carbon emissions in 2060 were analyzed within a certain fluctuation range. Using PDS as the reference pathway, one-factor perturbations were evaluated at 2030, 2040, 2050, and 2060, and a structured Monte Carlo analysis propagated joint parameter uncertainty across all five scenarios (Figure 16, Figure 17 and Figure 18).
GDP growth and the energy-intensity decline rate have the largest long-run effects. A 20% increase in the GDP growth path raises PDS emissions by 7.7%, 15.4%, 21.8%, and 27.2% in 2030, 2040, 2050, and 2060, respectively. A 20% acceleration in the energy-intensity decline path lowers emissions by 5.4%, 10.7%, 15.2%, and 19.1% at the same horizons. The widening effects show why a single 2060 sensitivity result understates how uncertainty accumulates over time.
Coal-share and power-emission-factor perturbations have smaller effects under PDS. A ±10% change in the coal-share path changes 2060 emissions by approximately ±1.8%, while a ±15% change in the power emission factor changes them by approximately ±1.3%. CCUS changes have no effect before deployment and change 2060 PDS emissions by approximately ±0.54% when 2060 capacity is varied by ±50%.
Across 1000 draws per scenario, the CS median net emission level in 2060 is 8.26 hundred million tons of CO2 (826 million tons), with a 2.5th–97.5th percentile range of 6.71–9.88 hundred million tons (671–988 million tons). None of the sampled CS outcomes reaches net zero. The range quantifies sensitivity to the stated parameter distributions; it does not measure all structural, policy, technology, or data uncertainty.
Using BAU as the baseline, the optimized scenarios show differentiated emission-reduction potential by 2060. PDS reduces emissions by approximately 1.60 billion tons relative to BAU, EEI by 2.54 billion tons, CES by 2.33 billion tons, and CS by 3.55 billion tons. The stronger performance of EEI relative to CES indicates that energy-efficiency improvements remain a foundational near- and long-term mitigation lever. The CS pathway delivers the largest reduction through the combined effects of stringent efficiency gains, energy-structure transformation, and CCUS deployment, but it still leaves residual net emissions of 825 million tons in 2060. Thus, the results demonstrate the feasibility of deep decarbonization rather than the achievement of full neutrality.
Based on the aforementioned parameter sensitivity analysis and the decomposition results of multi-scenario emission reduction potential, from the perspective of sustainable development, this study identifies the core strategic pathway for advancing carbon peak and carbon neutrality in the YRB: prioritizing the acceleration of technological progress and industrial structure upgrading as the key drivers to promote sustained and rapid reductions in energy intensity, and on this basis, synergistically advancing the deep electrification of end-use energy and the clean transition of the power system, thereby constructing a multi-dimensional coordinated decarbonization system. A comparison with existing research findings indicates that the conclusion drawn in this study—that technological progress and structural optimization are the core driving factors for carbon emission reduction in the basin—is consistent with the research results of Wang et al. [52] and Cui et al. [53].

5. Conclusions

The comprehensive energy utilization efficiency and carbon emission level of the YRB are key determinants of China’s ecological environment quality and the effectiveness of regional high-quality and sustainable development, directly bearing on the achievement of the nation’s overall emission reduction targets. The main research conclusions of this study are as follows: the decoupling of economic growth and carbon emissions in the YRB exhibits dynamic fluctuations and significant spatial heterogeneity, with eastern regions and provincial capitals demonstrating superior decoupling performance, whereas energy-rich areas such as Shanxi, Shaanxi, and Inner Mongolia display insufficient decoupling stability. Among the driving factors, per capita GDP and urbanization rate predominantly exert positive driving effects that inhibit decoupling; industrial structure upgrading is the core driving force; urban construction land promotes decoupling across the entire basin; and green technology exhibits a bidirectional effect, with the inhibitory effect predominating. The results indicate that the YRB can achieve carbon peaking under policy-driven and more ambitious scenarios. However, endogenous mitigation measures alone are insufficient to achieve full carbon neutrality by 2060. Even under the most ambitious scenario, substantial residual emissions remain. Therefore, additional carbon sinks, cross-regional clean electricity integration, stronger power-sector decarbonization, and negative emission technologies would be required to close the neutrality gap.
This study has made innovations in incorporating inter-provincial heterogeneity; however, several limitations remain, including insufficient consideration of lagged effects in green patent technologies, the inability of the backcasting model to report provincial-level errors, and simplifications in technological details and cross-regional energy flows, all of which point to directions for future research. Based on the above systematic analysis of the energy system and carbon emission trajectories of the YRB, and grounded in the principle of regional sustainable development, this study proposes the following policy recommendations: implement the most stringent energy efficiency standards and prioritize energy conservation; accelerate the decarbonization of the power system and construct a new-type power system; strengthen regionally coordinated governance and improve benefit-sharing mechanisms; and proactively deploy negative-carbon technologies to safeguard the achievement of carbon neutrality.

Author Contributions

Conceptualization, H.X. and X.R.; methodology, H.X., X.R. and W.Z.; software, H.X., K.L. and W.L.; validation, H.X., K.L. and H.Z.; formal analysis, H.X. and Z.D.; investigation, H.X. and K.L.; resources, H.X. and W.L.; data curation, H.X. and W.L.; writing—original draft preparation, H.X. and Z.D.; writing—review and editing, W.Z.; visualization, H.X., H.Z. and W.L.; supervision, W.Z. and X.R.; project administration, W.Z. and K.L.; funding acquisition, X.R. All authors have read and agreed to the published version of the manuscript.

Funding

This research was funded by the National Social Science Fund Project, grant number 19BGL276.

Institutional Review Board Statement

Not applicable.

Informed Consent Statement

Not applicable.

Data Availability Statement

The original contributions presented in the study are included in the article; further inquiries can be directed to the corresponding authors.

Acknowledgments

The authors thank the anonymous reviewers and editors for their helpful suggestions during the revision of the paper.

Conflicts of Interest

The authors declare no conflicts of interest.

Abbreviations

The following abbreviations are used in this manuscript:
YRBYellow River Basin
GTWRGeographically and Temporally Weighted Regression
LEAPLong-range Energy Alternatives Planning
GDPGross Domestic Product
LMDILogarithmic Mean Divisia Index
BAUBusiness-as-Usual scenario
PDSPolicy-Driven Scenario
EEIEnergy Efficiency Improvement scenario
CESClean Energy Scenario
CSCarbon-Neutrality-Oriented Scenario
CCUSCarbon Capture, Utilization, and Storage
MAPEMean Absolute Percentage Error

References

  1. Mudryk, L.R.; Dawson, J.; Howell, S.E.L.; Derksen, C.; Zagon, T.A.; Brady, M. Impact of 1, 2 and 4 °C of global warming on ship navigation in the Canadian Arctic. Nat. Clim. Change 2021, 11, 673–679. [Google Scholar] [CrossRef]
  2. Regnier, P.; Resplandy, L.; Najjar, R.G.; Ciais, P. The land-to-ocean loops of the global carbon cycle. Nature 2022, 603, 401–410. [Google Scholar] [CrossRef] [PubMed]
  3. Shen, W.; Li, Y.; Qin, Y.; Cheng, J. Influencing mechanism of climate and human activities on ecosystem health in the middle reaches of the Yellow River of China. Ecol. Indic. 2023, 150, 110191. [Google Scholar] [CrossRef]
  4. Abbasi, K.R.; Shahbaz, M.; Zhang, J.; Irfan, M.; Alvarado, R. Analyze the environmental sustainability factors of China: The role of fossil fuel energy and renewable energy. Renew. Energy 2022, 187, 390–402. [Google Scholar] [CrossRef]
  5. Chen, M.; Zhang, J.; Xu, Z. Does the setting of local government economic growth targets promote or hinder urban carbon emission performance? Evidence from China. Environ. Sci. Pollut. Res. 2023, 30, 117404. [Google Scholar] [CrossRef] [PubMed]
  6. Li, Y.Y.; Zhao, G.L. The Empirical Study on the Relationship between Carbon Emissions and Economic Growth in Megacity Behemoths. J. Ind. Technol. Econ. 2016, 35, 138–147. [Google Scholar] [CrossRef]
  7. Zhang, Y.; Yu, Z.; Zhang, J. Spatiotemporal evolution characteristics and dynamic efficiency decomposition of carbon emission efficiency in the Yellow River Basin. PLoS ONE 2022, 17, e0264274. [Google Scholar] [CrossRef] [PubMed]
  8. Tapio, P. Towards a theory of decoupling: Degrees of decoupling in the EU and the case of road traffic in Finland between 1970 and 2001. Transp. Policy 2005, 12, 137–151. [Google Scholar] [CrossRef]
  9. Wei, Z.; Wei, K.; Liu, J. Decoupling relationship between carbon emissions and economic development and prediction of carbon emissions in Henan Province: Based on Tapio method and STIRPAT model. Environ. Sci. Pollut. Res. 2023, 30, 52679–52691. [Google Scholar] [CrossRef] [PubMed]
  10. Guo, W.Q.; Yu, Z.P.; Lei, M.; Shi, R.X.; Wei, X.Y. Dynamic Evolution and Convergence Analysis of China’s Carbon Emission Decoupling. Areal Res. Dev. 2025, 44, 166–172+180. [Google Scholar] [CrossRef]
  11. Liu, C.; Lyu, W.; Zang, X.; Zheng, F.; Zhao, W.; Xu, Q.; Lu, J. Exploring the factors effecting on carbon emissions in each province in China: A comprehensive study based on symbolic regression, LMDI and Tapio models. Environ. Sci. Pollut. Res. 2023, 30, 87071–87086. [Google Scholar] [CrossRef] [PubMed]
  12. Gbadeyan, O.J.; Muthivhi, J.; Linganiso, L.Z.; Deenadayalu, N. Decoupling Economic Growth from Carbon Emissions: A Transition toward Low-Carbon Energy Systems—A Critical Review. Clean Technol. 2024, 6, 1076–1113. [Google Scholar] [CrossRef]
  13. Peng, D.; Liu, H. Measurement and driving factors of carbon emissions from coal consumption in China based on the Kaya-LMDI model. Energies 2023, 16, 439. [Google Scholar] [CrossRef]
  14. Zhou, Y.K.; Wu, J.G. Analysis of influencing factors of carbon emissions and exploration of carbon neutrality path in China. Nat. Resour. Econ. China 2025, 38, 12–24. [Google Scholar] [CrossRef]
  15. Liu, Q.T. An Empirical Study on Decoupling Relation Between Carbon Emissions and Economic Growth—A Case Study of Henan Province. Econ. Surv. 2014, 31, 132–136. [Google Scholar] [CrossRef]
  16. Song, J.; Yang, D.; E, D.J.; Song, T.T.; Han, S. Carbon Emission Research Based on Tapio-LMDI-LEAP Model. J. Glob. Energy Interconnect. 2025, 8, 580–593. [Google Scholar] [CrossRef]
  17. Liu, Y.; Jiang, Y.; Liu, H.; Li, B.; Yuan, J. Driving factors of carbon emissions in China’s municipalities: A LMDI approach. Environ. Sci. Pollut. Res. 2022, 29, 21789–21802. [Google Scholar] [CrossRef] [PubMed]
  18. Zhang, H.; Guo, S.D.; Qian, Y.B.; Liu, Y.; Lu, C.P. Dynamic analysis of agricultural carbon emissions efficiency in Chinese provinces along the Belt and Road. PLoS ONE 2020, 15, e0228223. [Google Scholar] [CrossRef] [PubMed]
  19. Yang, B.; Wang, Y.; Dunya, R.; Yuan, X. Study on the driving factors and decoupling effect of carbon emission from pig farming in China—Based on LMDI and Tapio model. Environ. Dev. Sustain. 2025, 27, 3145–3175. [Google Scholar] [CrossRef]
  20. Zhang, Z.; Sharifi, A. Analysis of decoupling between CO2 emissions and economic growth in China’s provincial capital cities: A Tapio model approach. Urban Clim. 2024, 55, 101885. [Google Scholar] [CrossRef]
  21. Yang, F.; Shi, L.; Gao, L. Probing CO2 emission in Chengdu based on STIRPAT model and Tapio decoupling. Sustain. Cities Soc. 2023, 89, 104309. [Google Scholar] [CrossRef]
  22. Zou, X.; Li, J.; Zhang, Q. CO2 emissions in China’s power industry by using the LMDI method. Environ. Sci. Pollut. Res. 2023, 30, 31332–31347. [Google Scholar] [CrossRef] [PubMed]
  23. Chen, J.; Jia, J.; Wang, L.; Zhong, C.; Wu, B. Carbon reduction countermeasure from a system perspective for the electricity sector of Yangtze River Delta (China) by an extended logarithmic mean divisia index (LMDI). Systems 2023, 11, 117. [Google Scholar] [CrossRef]
  24. Li, C.; Zhang, Z.; Wang, L. Carbon peak forecast and low carbon policy choice of transportation industry in China: Scenario prediction based on STIRPAT model. Environ. Sci. Pollut. Res. 2023, 30, 63250–63271. [Google Scholar] [CrossRef] [PubMed]
  25. Yang, X.; Li, Y.; Zhang, X.; Nan, F.; Yang, A. Prediction of carbon emission peak and selection of development path in Gansu Province based on the constructed STIRPAT model. Acad. J. Environ. Earth Sci. 2022, 4, 56–61. [Google Scholar] [CrossRef]
  26. Sun, X.; Zhang, H.; Ahmad, M.; Xue, C. Analysis of influencing factors of carbon emissions in resource-based cities in the Yellow River basin under carbon neutrality target. Environ. Sci. Pollut. Res. 2022, 29, 23847–23860. [Google Scholar] [CrossRef] [PubMed]
  27. Jiang, P.; Gong, X.; Yang, Y.; Tang, K.; Zhao, Y.; Liu, S.; Liu, L. Research on spatial and temporal differences of carbon emissions and influencing factors in eight economic regions of China based on LMDI model. Sci. Rep. 2023, 13, 7965. [Google Scholar] [CrossRef] [PubMed]
  28. Liu, R.; Fang, Y.R.; Peng, S.; Benani, N.; Wu, X.; Chen, Y.; Wang, T.; Chai, Q.; Yang, P. Study on Factors Influencing Carbon Dioxide Emissions and Carbon Peak Heterogeneous Pathways in Chinese Provinces. J. Environ. Manag. 2024, 365, 121667. [Google Scholar] [CrossRef] [PubMed]
  29. Lee, C.C.; Zhao, Y.N. Heterogeneity analysis of factors influencing CO2 emissions: The role of human capital, urbanization, and FDI. Renew. Sustain. Energy Rev. 2023, 185, 113644. [Google Scholar] [CrossRef]
  30. Xu, J. Study on spatiotemporal distribution characteristics and driving factors of carbon emission in Anhui Province. Sci. Rep. 2023, 13, 14400. [Google Scholar] [CrossRef] [PubMed]
  31. Li, Y.; Zhang, Z.Q.; Wen, H.; Cai, Z.; Guo, Y.L.; Li, T.T.; Wang, J.C.; Zhang, L.M.; Xu, L.X. Analysis of the influencing factors of China’s carbon emissions and simulation of peak scenarios based on machine learning. Environ. Sci. 2025, 46, 6097–6109. [Google Scholar] [CrossRef] [PubMed]
  32. Yang, L.Q.; Zhao, R.F.; Kang, L.F.; Liu, F.S.; Ren, X.T. Multi-scale spatial and temporal evolution of carbon emissions and influencing factors in Gansu Province. Environ. Sci. 2025, 46, 4900–4910. [Google Scholar] [CrossRef] [PubMed]
  33. Wu, J.S.; Jin, X.R.; Wang, H.; Feng, Z.; Zhang, D.N.; Li, X.C. Analysis of carbon emissions and influencing factors in China based on city scale. Environ. Sci. 2023, 44, 2974–2982. [Google Scholar] [CrossRef] [PubMed]
  34. Zhang, C.Y.; Zhao, L.; Zhang, H.T.; Chen, M.N.; Fang, R.Y.; Yao, Y.; Zhang, Q.P.; Wang, Q. Spatial-Temporal Characteristics of Carbon Emissions from Land Use Change in Yellow River Delta Region, China. Ecol. Indic. 2022, 136, 108623. [Google Scholar] [CrossRef]
  35. Borowiec, J.; Papież, M.; Śmiech, S. The Impact of Environmental Regulations on Carbon Emissions in Countries with Different Levels of Emissions. Environ. Sci. Pollut. Res. 2024, 31, 66759–66779. [Google Scholar] [CrossRef] [PubMed]
  36. Han, M.Y.; Liu, W.D.; Yang, M.Y. Carbon risk transmission of China’s energy-intensive industries under low-carbon transition: From the embodied carbon network perspective. Geogr. Res. 2022, 41, 79–91. [Google Scholar] [CrossRef]
  37. Yan, H.; Guo, X.; Zhao, S.; Yang, H. Variation of net carbon emissions from land use change in the Beijing-Tianjin-Hebei region during 1990–2020. Land 2022, 11, 997. [Google Scholar] [CrossRef]
  38. Tan, Y.; Liu, Y.; Chen, Y.; Zhang, Z.; Wu, D.; Chen, H.; Han, Y. The Impact of Urban Construction Land Change on Carbon Emissions—A Case Study of Wuhan City. Int. J. Environ. Res. Public Health 2023, 20, 922. [Google Scholar] [CrossRef] [PubMed]
  39. Jiang, W.B.; Liu, W.D. Effect of Change of the Spatial Pattern of Economic Activities on CO2 Emissions in China. Resour. Sci. 2021, 43, 722–732. [Google Scholar] [CrossRef]
  40. Mo, H.B.; Wang, S.J. Spatio-temporal evolution and spatial effect mechanism of carbon emission at county level in the Yellow River Basin. Sci. Geogr. Sin. 2021, 41, 1324–1335. [Google Scholar] [CrossRef]
  41. Peng, W.; Xin, B.; Xie, L. Optimal strategies for production plan and carbon emission reduction in a hydrogen supply chain under cap-and-trade policy. Renew. Energy 2023, 215, 118960. [Google Scholar] [CrossRef]
  42. Ma, X.; Jiang, P.; Jiang, Q. Research and application of association rule algorithm and an optimized grey model in carbon emissions forecasting. Technol. Forecast. Soc. Change 2020, 158, 120159. [Google Scholar] [CrossRef]
  43. Wang, S.; Gao, S.; Huang, Y.; Shi, C. Spatiotemporal evolution of urban carbon emission performance in China and prediction of future trends. J. Geogr. Sci. 2020, 30, 757–774. [Google Scholar] [CrossRef]
  44. Zhang, C.; Luo, H. Research on carbon emission peak prediction and path of China’s public buildings: Scenario analysis based on LEAP model. Energy Build. 2023, 289, 113053. [Google Scholar] [CrossRef]
  45. Zhang, Z.; Wang, W.; Chen, J.; Han, C.; Zhang, L.; Lv, X.; Yang, L.; Cui, G. Spatial association and driving factors of the carbon emission decoupling effect in urban agglomerations of the Yellow River Basin. Land 2025, 14, 1838. [Google Scholar] [CrossRef]
  46. Du, Z.; Ren, X.; Zhao, W.; Zhang, C. Spatiotemporal characteristics of carbon emissions from construction land and their decoupling effects in the Yellow River Basin, China. Land 2025, 14, 320. [Google Scholar] [CrossRef]
  47. Wu, H.; Yang, Y.; Li, W. Analysis of spatiotemporal evolution characteristics and peak forecast of provincial carbon emissions under the dual carbon goal: Considering nine provinces in the Yellow River basin of China as an example. Atmos. Pollut. Res. 2023, 14, 101828. [Google Scholar] [CrossRef]
  48. Zhong, S.C.; Wang, W.Z.; Yan, C.L. Research on the response of spatial allocation of urban construction land in China’s provinces under the goal of carbon emission reduction. J. Nat. Resour. 2023, 38, 1896–1918. [Google Scholar] [CrossRef]
  49. Wang, C.; Wu, F.; Ibrahim, H.; Chang, W. The spatiotemporal evolution and influencing factors of carbon emissions in the Yellow River Basin based on nighttime light data. Humanit. Soc. Sci. Commun. 2025, 12, 387. [Google Scholar] [CrossRef]
  50. Guo, W. A study on carbon emissions in the Yellow River Basin of China based on an unbiased prediction model. Front. Ecol. Evol. 2025, 13, 1674626. [Google Scholar] [CrossRef]
  51. Deng, G.; Zhu, Q.; Shen, Y. Research on the prediction and realization path of urban carbon peak along the Yellow River Basin. Heliyon 2024, 10, e38883. [Google Scholar] [CrossRef] [PubMed]
  52. Chuanhui, W.; Yuyao, W.; Zhenyue, F.; Wenwen, L.; Weifeng, G. The peak path of provincial carbon emissions in the Yellow River Basin of China based on scenario analysis and Monte Carlo simulation method. Glob. NEST J. 2023, 25, 56–69. [Google Scholar] [CrossRef]
  53. Cui, Y.F.; Zhang, G.X. Research on the influencing factors and peak prediction of carbon emission of resources-based cities in the Yellow River Basin. Yellow River 2023, 45, 9–14. [Google Scholar] [CrossRef]
Figure 1. Map of the study area overview.
Sustainability 18 07606 g001
Figure 2. Technical roadmap.
Sustainability 18 07606 g002
Figure 3. Schematic diagram of the LEAP-YRB v5 model framework.
Sustainability 18 07606 g003
Figure 4. Decoupling index and decoupling types in the YRB.
Sustainability 18 07606 g004
Figure 5. Spatiotemporal evolution of decoupling states in the YRB.
Sustainability 18 07606 g005
Figure 6. Regression coefficients of per capita GDP.
Sustainability 18 07606 g006
Figure 7. Regression coefficients of urbanization rate.
Sustainability 18 07606 g007
Figure 8. Regression coefficients of urban construction land area.
Sustainability 18 07606 g008
Figure 9. Regression coefficients of the number of green patent grants factor.
Sustainability 18 07606 g009
Figure 10. Regression coefficients of industrial structure upgrading.
Sustainability 18 07606 g010
Figure 11. Projected final energy consumption in the nine provinces of the YRB: Comparison of five scenarios (2022–2060).
Sustainability 18 07606 g011
Figure 12. Basin-level historical backcasting check for final energy consumption and CO2 emissions.
Sustainability 18 07606 g012
Figure 13. Calibration-conditioned temporal holdout backcasting.
Sustainability 18 07606 g013
Figure 14. Projected carbon emissions in the nine provinces of the YRB: Comparison of five scenarios (2022–2060).
Sustainability 18 07606 g014
Figure 15. Evolution of sectoral energy consumption structure under the CS scenario.
Sustainability 18 07606 g015
Figure 16. Sensitivity analysis: Impacts of key parameters on carbon emissions in 2060 (PDS scenario).
Sustainability 18 07606 g016
Figure 17. Single-factor sensitivity analysis at multiple time points under the PDS scenario.
Sustainability 18 07606 g017
Figure 18. Monte Carlo parameter ranges for all scenarios (2.5th–97.5th percentiles).
Sustainability 18 07606 g018
Table 1. Definition of spatial units used in the analysis.
Analytical ModuleSpatial UnitCoverageInclusion CriterionMain Purpose
Tapio decoupling95 prefecture-level cities2010–2022 city panelCities within/intersecting/administratively associated with the YRB policy areaUrban decoupling-state classification
GTWR95 prefecture-level cities2010, 2014, 2018, and 2022Same city sample as Tapio analysisSpatiotemporal driver identification
LEAP-YRB v5Nine provincial-level regions2022–2060Complete provincial administrative regions with consistent energy-balance dataScenario simulation of energy and emissions
Table 2. Summary of data sources.
Variable/FileSpatial ScaleYearsUnit/ConstructionSource/Processing
CO2 emissionsPrefecture-level city; province2010–202210,000 tons CO2; harmonized by city/province panelCEADs; checked against statistical yearbooks where needed
PopulationPrefecture-level city; province2010–202210,000 persons; permanent resident population where availableChina Statistical Yearbook and provincial/city statistical yearbooks
GDPPrefecture-level city; province2010–2022Real GDP, 2010 constant price; deflated from nominal GDP using official indicesChina Statistical Yearbook and provincial/city statistical yearbooks
Per capita GDPPrefecture-level city2010–2022Real GDP divided by permanent resident populationCalculated by authors
Urbanization ratePrefecture-level city2010–2022Share of permanent residents in urban areas (%)Statistical yearbooks; harmonized by authors
Industrial structure upgradingPrefecture-level city2010–2022Tertiary-to-secondary industry value-added ratioStatistical yearbooks; calculated by authors
Urban construction land areaPrefecture-level city2010–2022km2 of urban construction/built-up landStatistical yearbooks and land-use bulletins
Green patent grantsPrefecture-level city2010–2022Granted green patents; robustness check uses lagged valueCNIPA; matched by city and year
Table 3. Determination of the decoupling relationship between economic growth and carbon emissions.
Decoupling StatesΔCΔG ε
DecouplingStrong Decoupling+(−∞, 0)
Weak Decoupling++[0, 0.8)
Recessive Decoupling(1.2, +∞)
CouplingExpansive Coupling++[0.8, 1.2]
Recessive Coupling[0.8, 1.2]
Negative DecouplingStrong Negative Decoupling+(−∞, 0)
Weak Negative Decoupling[0, 0.8)
Expansive Negative Decoupling++(1.2, +∞)
Table 4. Pearson correlation coefficient test.
YX1X2X3X4X5
Y1
X10.534 **1
X20.527 **0.769 **1
X3−0.177 **0.0090.106 **1
X4−0.066 *0.461 **0.527 **0.278 **1
X5−0.092 **0.376 **0.384 **0.278 **0.885 **1
Note: ** and * indicate significance at the 5% and 10% levels, respectively.
Table 5. Multicollinearity diagnostics of driving factors.
X1X2X3X4X5
VIF2.5572.8431.1175.7234.894
1/VIF0.3910.3520.8950.1750.204
Table 6. Estimation results of OLS, GWR, and GTWR models.
ModelR2Adjusted R2AICc
OLS0.6780.618800.424
GWR0.7430.728796.891
GTWR0.7750.762727.820
Table 7. Composition details of total carbon emissions.
Emission TypeCalculation RuleBoundary/Key Parameters
Direct final-energy emissions C direct , f = E f   ×   NCV f   ×   CEF f   ×   COF f   ×   44 12 Includes raw coal, coke, crude oil, gasoline, diesel, fuel oil, natural gas, and LPG consumed as final energy
Indirect electricity emissionsElectricity consumption × power-grid emission factor2022 factor: 0.5703 tCO2/MWh; scenario-specific decline path used after 2022 (https://www.mee.gov.cn/xxgk2018/xxgk/xxgk06/202302/t20230207_1015569.html, accessed on 12 March 2026)
Indirect heat emissionsHeat consumption × heat emission factorBase-year heat factor: approximately 3800 tCO2 per 10,000 tce; adjusted by scenario
Net emissionsNet emissions are calculated by subtracting the emission reductions achieved through CCUS technology from the total emissionsNon-energy industrial process emissions are excluded because consistent long-run data are unavailable
Note: fossil fuels used in power/heat generation are not simultaneously counted as final fuel consumption.
Table 8. Summary of key parameter settings by scenario.
ParameterUnit/BenchmarkBAUPDSEEICESCS
GDP growth2022–2025/2026–2030/2031–2040/2041–2050/2051–2060; province-specific5.0–6.0%; 4.0–5.5%; 3.0–4.5%; 2.5–3.5%; 2.0–2.5%4.8–6.0%; 3.8–5.5%; 2.8–4.3%; 2.3–3.3%; 1.8–2.4%4.8–6.0%; 3.8–5.5%; 2.8–4.3%; 2.3–3.3%; 1.8–2.4%4.5–6.0%; 3.5–5.5%; 2.5–4.3%; 2.0–3.3%; 1.5–2.4%4.2–5.8%; 3.2–5.2%; 2.2–4.0%; 1.8–3.0%; 1.5–2.2%
Energy intensity declineAnnual decline by period2.8%; 2.5%; 2.2%; 2.0%; 1.8%3.5%; 3.2%; 2.8%; 2.5%; 2.2%4.0%; 4.0%; 3.8%; 3.5%; 3.2%3.5%; 3.2%; 2.8%; 2.5%; 2.2%4.5%; 4.5%; 4.2%; 4.0%; 3.8%
Industrial structure2060 secondary-industry share relative to 20220.920.850.850.820.75
Coal share in final energy2025/2030/2035/2040/2050/206041.0; 39.0; 37.0; 35.5; 34.0; 33.539.0; 35.0; 31.0; 28.0; 25.0; 22.539.0; 35.0; 31.0; 28.0; 25.0; 22.537.0; 30.0; 24.0; 20.0; 16.0; 12.836.0; 28.0; 21.0; 16.0; 12.0; 9.5
Electricity share in final energy2025/2030/2035/2040/2050/206026.5; 28.0; 29.5; 31.0; 32.5; 33.527.5; 30.0; 33.0; 35.5; 38.0; 40.028.0; 31.0; 35.0; 38.0; 41.0; 43.028.5; 33.0; 38.0; 42.0; 46.0; 48.529.0; 34.0; 40.0; 45.0; 50.0; 53.0
Power-sector emission factorShare of 2022 value in 2025/2030/2035/2040/2050/20600.95; 0.88; 0.82; 0.76; 0.68; 0.620.92; 0.82; 0.72; 0.62; 0.48; 0.380.92; 0.82; 0.72; 0.62; 0.48; 0.380.88; 0.72; 0.58; 0.45; 0.28; 0.180.85; 0.68; 0.50; 0.35; 0.20; 0.10
CCUS deploymentStart year; annual capture in 2060 (100 million tons CO2/year)Not deployed; 02040; 0.32038; 0.52035; 0.82030; 1.5
Sectoral sharesDynamic adjustmentIndustry declines with structural factor; transport +0.3%/yr; residential +0.2%/yr; construction +0.1%/yr; services +0.2%/yr; primary industry fixedSame ruleSame ruleSame ruleSame rule
Main policy basisReferences/policy documentsHistorical continuationCurrent carbon-peaking and energy-policy direction Policy direction plus exploratory efficiency gains Exploratory clean-energy and power-decarbonization pathway Exploratory high-ambition efficiency, electrification, power, and CCUS pathway
Table 9. Temporal holdout test under calibration constraints (Unit: 10,000 tce; 10,000 tCO2).
YearSampleActual Energy ConsumptionModeled Energy ConsumptionEnergy Error (%)Actual CO2 EmissionsModeled CO2 EmissionsCO2 Error (%)
2016train155,200155,9170.46272,500274,4060.70
2017train159,800159,7660.02280,300280,5530.09
2018train164,500163,7120.48289,100286,8390.78
2019train168,200167,7580.26294,800293,2680.52
2020holdout171,300171,9060.35299,500299,8430.11
2021holdout177,600176,1580.81308,200306,5670.53
2022calibration180,519180,5190.00313,445313,4450.00
Table 10. Key indicators of carbon peak by scenario.
ScenarioPeak YearPeak Emissions (100 Million Tons CO2)2030 Emissions (100 Million Tons CO2)2060 Net Emissions (100 Million Tons CO2)Achieves Carbon Peak?Achieves Carbon Neutrality?
BAUNo peak>43.7437.6043.74NoNo
PDS203033.5733.5727.76YesNo
EEI202632.4731.5118.35YesNo
CES202532.7831.0320.41YesNo
CS202531.5526.808.25YesNo; residual 825 million tons remain
Disclaimer/Publisher’s Note: The statements, opinions and data contained in all publications are solely those of the individual author(s) and contributor(s) and not of MDPI and/or the editor(s). MDPI and/or the editor(s) disclaim responsibility for any injury to people or property resulting from any ideas, methods, instructions or products referred to in the content.