Article

Development of Lightweight Alkali-Activated Foams from Roof Tile and Marble Wastes: Pore Structure Evolution and Thermal Performance Optimization


by
Kübra Ekiz Barış
Faculty of Architecture and Design, Kocaeli University, 41300 Kocaeli, Türkiye
Sustainability 2026, 18(14), 7458; https://doi.org/10.3390/su18147458
Submission received: 19 June 2026 / Revised: 18 July 2026 / Accepted: 19 July 2026 / Published: 21 July 2026
(This article belongs to the Section Sustainable Materials)

Abstract

The growing demand for sustainable construction materials has encouraged the development of waste-based alkali-activated foams (AAFs) with enhanced thermal performance. This study investigates the use of roof tile waste (RTW) and marble waste (MW) for producing lightweight AAFs and evaluates the influence of aluminum (Al) powder on material performance. The novelty of this study lies in combining binder optimization, systematic evaluation of Al-induced pore evolution, and quantitative sustainability assessment within a single experimental framework. RTW was partially replaced with MW to optimize the binder, followed by the incorporation of Al powder (0–0.20 wt%) as a foaming agent. In an alkaline medium, metallic Al released H2 gas, generating the porous structure of the AAFs. Physical, mechanical, thermal, microstructural, and material-based environmental properties were evaluated. In the binder optimization stage, 30% MW increased the compressive strength from 5.57 to 15.50 MPa. During AAF production, increasing Al content reduced dry-state thermal conductivity from 0.99 to 0.09 W/m·K, although excessive Al promoted pore coalescence and strength loss. The optimum 70RTW:30MW:0.15Al mixture exhibited a unit weight of 0.56 g/cm3, a dry-state thermal conductivity of 0.15 W/m·K, a compressive strength of 3.12 MPa, 79.9% waste incorporation, and 65.9% lower material-based embodied carbon than an ordinary Portland cement (OPC)-based reference binder, demonstrating its suitability for lightweight non-loadbearing wall applications.

1. Introduction

Cement production is one of the major contributors to global greenhouse gas emissions owing to its energy-intensive manufacturing process. During ordinary Portland cement (OPC) production, limestone and clay are heated to approximately 1450 °C to produce clinker, generating substantial CO2 emissions from both limestone calcination and fuel combustion [1]. Consequently, increasing efforts to mitigate climate change have accelerated the development of alternative binding materials with lower carbon footprints [2]. Among these, alkali-activated binders (AABs), which are produced from industrial and agricultural by-products activated with alkaline solutions, have emerged as promising alternatives. Aluminosilicate-rich wastes such as fly ash (FA), ground granulated blast furnace slag (GGBS), silica fume (SF), and rice husk ash (RHA) can be used as precursors for AAB production, reducing dependence on conventional raw materials and promoting sustainable waste management [3,4,5]. Previous studies have reported that AABs can reduce CO2 emissions by up to 80% compared with OPC while maintaining comparable engineering performance, although the achievable reduction depends on the precursor type, activator composition, and system boundaries considered in the assessment [3,4,5,6,7].
Construction and demolition waste (CDW) represents one of the largest solid waste streams generated worldwide, with an annual production of approximately 2.24 billion tons. Despite its enormous resource potential, a considerable proportion of CDW is still utilized in low-value applications, such as road sub-base materials and general fill, or is ultimately disposed of in landfills [8]. Transforming these wastes into value-added construction materials rather than using them solely as low-grade aggregates has therefore become an important objective in sustainable construction and circular economy strategies. In Türkiye, this issue has become even more significant due to the substantial increase in roof tile waste (RTW) generated during urban transformation projects and following the Kahramanmaraş earthquakes, highlighting the need for more efficient and higher-value recycling approaches [9].
Among ceramic-based CDWs, RTW is particularly attractive as a precursor because of its high silica and alumina contents, which enable participation in geopolymerization reactions after alkaline activation. In contrast to conventional recycling routes, where this waste is mainly used as an inert aggregate, utilizing RTW as a precursor enables it to contribute directly to the formation of the aluminosilicate binding gel, thereby producing construction materials with significantly higher added value. This approach not only diverts this waste from landfills but also promotes resource efficiency by replacing virgin aluminosilicate raw materials required for AAB production.
Another abundant construction-related waste is marble waste (MW), which is generated during both demolition activities and stone-processing operations. Owing to its high calcium content, fine particle size, and relatively large specific surface area, MW has attracted increasing attention as a secondary raw material for AABs [10]. The incorporation of MW into AABs has the potential to improve material performance while simultaneously contributing to the valorization of another major waste stream. The combined utilization of RTW and MW therefore represents a promising strategy for simultaneously reducing landfill disposal, conserving natural resources, and producing sustainable value-added construction materials.
In AABs, ceramic-based CDW has been investigated through two fundamentally different approaches, namely its use as an aggregate replacement and its use as an aluminosilicate precursor. These applications involve different reaction mechanisms and therefore should not be directly compared in terms of mechanical performance. When ceramic tile waste is used as an aggregate, it primarily acts as an inert granular material replacing natural aggregates, and the engineering performance is governed mainly by the surrounding binder matrix. Previous studies have demonstrated that natural aggregates can be completely replaced with ceramic tile waste while maintaining comparable mechanical performance, highlighting its suitability as a sustainable aggregate alternative [11].
In contrast, when these wastes are employed as aluminosilicate precursors, they actively participate in alkali activation by supplying reactive silica and alumina for gel formation. Consequently, the reported mechanical properties depend not only on the waste characteristics but also on the activator composition, curing regime, and reaction conditions. Previous studies reported compressive strengths of 20–48 MPa for ceramic waste- and metakaolin-based AABs [12,13], 11–22 MPa for AABs based on ceramic waste, metakaolin, and rice husk ash [14], and approximately 35 MPa for brick waste-based AABs [15]. Although these studies collectively demonstrate the feasibility of utilizing these wastes as an alkali-activated precursors, the reported strengths originate from fundamentally different binder types and therefore cannot be directly compared. Instead, they collectively indicate that these wastes possess considerable potential as precursor materials when appropriately combined with complementary aluminosilicate sources and suitable activation conditions.
Beyond mechanical performance, RTW-based AABs have also demonstrated favorable durability characteristics. Previous investigations have reported improved resistance to elevated temperatures, freeze–thaw cycles, and abrasion, indicating that recycled ceramic wastes can produce durable construction materials suitable for demanding service environments [16,17]. These findings further support the potential of RTW as a high-value precursor rather than merely a recycled aggregate.
Compared with conventional AABs, relatively limited attention has been devoted to the development of alkali-activated foams (AAFs) produced from these wastes. Owing to their highly porous cellular structures, AAFs combine low density with low thermal conductivity while maintaining sufficient mechanical integrity for non-loadbearing applications [18]. Their pore structure can be generated using several techniques, including mechanical foaming, chemical foaming, sacrificial template extraction, and additive manufacturing. Among these methods, chemical foaming has become the most widely adopted approach because gas-generating agents, such as aluminum (Al) powder, hydrogen peroxide (H2O2), or sodium perborate, react within the alkaline environment to generate gas bubbles that become entrapped within the matrix, thereby producing the characteristic porous structure of AAFs [19].
Although several studies have successfully demonstrated the feasibility of producing ceramic waste-based AAFs, their reported engineering performance varies considerably. For example, ceramic waste- and metakaolin-based AAFs produced using H2O2 as a foaming agent and olive oil as a surfactant achieved unit weights of 0.72–0.80 g/cm3, porosities of 56–68%, and compressive strengths ranging from 3.64 to 7.60 MPa [20]. Similarly, green ceramic wastes were successfully converted into AAFs using different chemical foaming agents, producing unit weights of approximately 0.70–0.80 g/cm3 and compressive strengths between 1.7 and 5.1 MPa [21]. Another study utilized ceramic tile waste together with expanded perlite, H2O2, and sodium dodecyl sulfate, resulting in an AAF with a unit weight of approximately 0.75 g/cm3, water absorption of 71.6%, compressive strength of 1.7 MPa, and thermal conductivity of 0.26 W/m·K [22].
Collectively, these studies confirm the technical feasibility of manufacturing lightweight AAFs from various ceramic wastes. However, direct comparison among the reported results remains challenging because each study used different precursor systems, foaming agents, activator compositions, surfactants, and curing regimes, all of which strongly influence pore generation and final material performance. Consequently, it is difficult to distinguish whether the observed differences in mechanical and thermal properties originate primarily from the waste precursor itself or from variations in mixture design and processing parameters. Moreover, most existing studies have reported individual physical or mechanical properties, whereas comparatively limited attention has been devoted to establishing systematic relationships between pore structure evolution and multifunctional engineering performance.
Recent review studies have further emphasized that ceramic waste-based AAFs require more systematic, performance-oriented mixture design approaches capable of linking fresh-state behavior, pore evolution, microstructure, and engineering performance to facilitate practical implementation [23]. Despite the encouraging progress reported in previous studies, several research gaps remain. First, the utilization of RTW as the primary precursor in high-performance porous AAFs is still limited. Second, the performance contribution of MW when combined with RTW in alkali-activated binders and foams has not yet been systematically evaluated. Third, although pore structure is known to govern both mechanical and thermal performance, the relationships between pore characteristics (e.g., pore size distribution, morphology, and interconnectivity) and multifunctional engineering properties have not been comprehensively established for RTW-based AAFs. To address these gaps, this study systematically investigates the co-utilization of RTW and MW for the production of lightweight AAFs through a two-stage experimental approach. The first stage identifies the optimum RTW-MW binder composition, while the second stage evaluates the influence of Al powder content on pore evolution, engineering performance, and thermal insulation characteristics.
The novelty of this study lies in two main aspects: (i) the development of RTW-MW-based AAFs through a two-stage experimental design, enabling optimization of the binder composition prior to foaming; and (ii) a comprehensive investigation of Al-induced pore structure evolution and its effects on the physical, mechanical, and thermal performance of the developed AAFs using complementary characterization methods. In addition, regression analyses were used to describe the relationships between dry-state thermal conductivity and selected engineering properties within this dataset. These findings provide new insights into the design of eco-efficient lightweight AAFs for non-loadbearing wall applications.

2. Materials and Methods

2.1. Raw Materials

RTW and MW were obtained from a construction and demolition waste disposal site in Türkiye. They were placed in an oven at 105 °C for at least 24 h and then ground in a ball mill before being sieved through a 125 μm sieve. The specific gravity values of RTW and MW were 2.44 and 2.63, respectively. The chemical compositions of RTW and MW were determined by X-ray fluorescence (XRF) analysis, and the results are presented in Table 1. RTW is mainly composed of SiO2, Al2O3, and Fe2O3, whose total content (89.87%) exceeds 70% by weight, confirming its suitability as an aluminosilicate precursor [24]. On the other hand, MW is predominantly composed of CaO (55.8% by weight), while the contents of SiO2 and Al2O3 (0.51%) are very low, confirming its carbonate-rich nature.
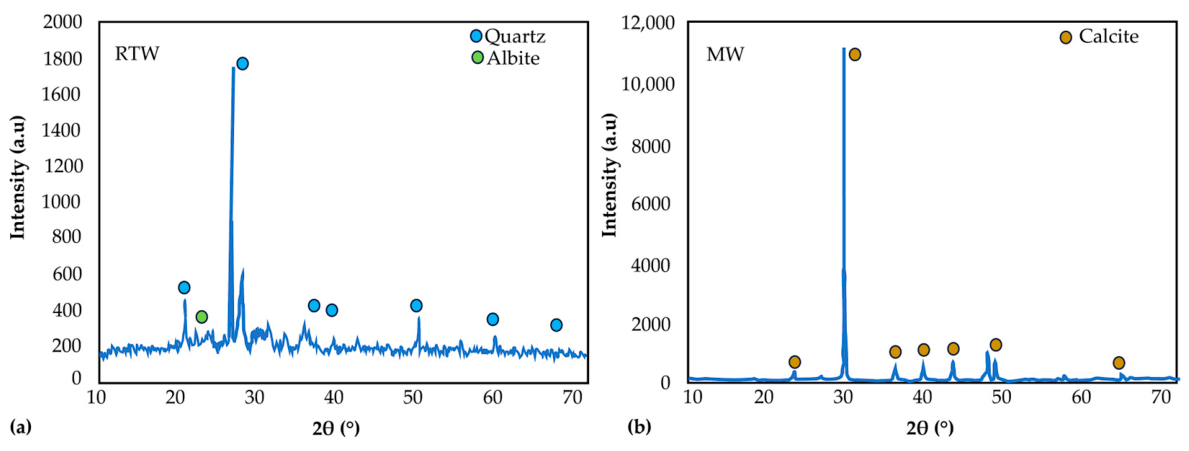
X-ray diffraction (XRD) analysis identified quartz and albite as the principal crystalline phases of RTW, whereas MW was predominantly composed of calcite (Figure 1). Minor reflections were also observed in the diffraction patterns. However, because these reflections could not be uniquely assigned using the available XRD data and raw material chemistry, they were not attributed to specific crystalline phases.
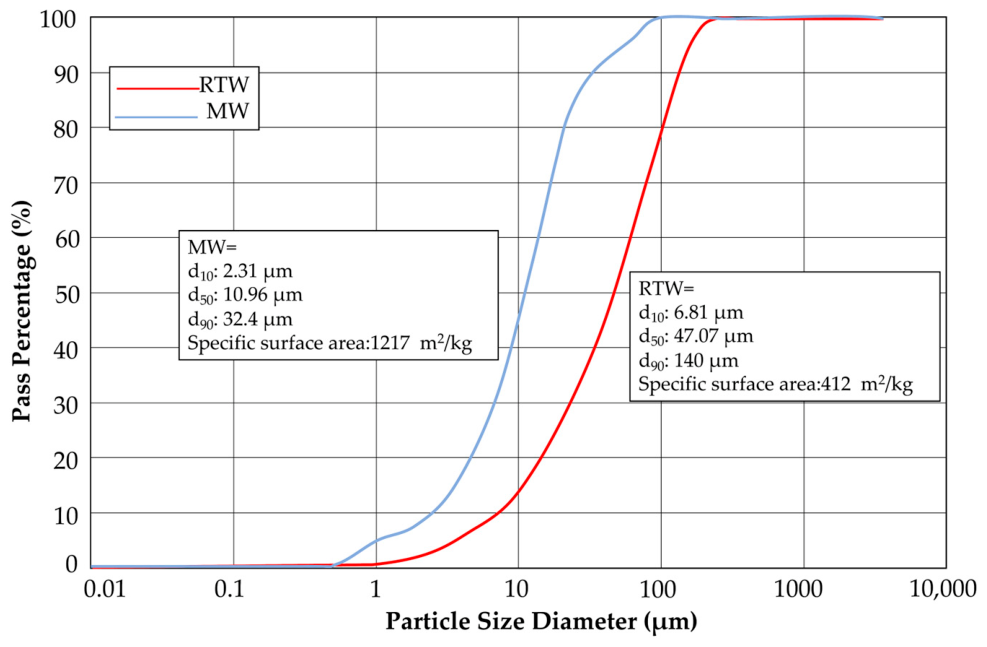
The particle size distributions of RTW and MW, analyzed using a laser particle size analyzer, are shown in Figure 2. MW has significantly finer particles than RTW. For MW, the d10, d50, and d90 values were determined as 2.31 µm, 10.96 µm, and 32.4 µm, respectively, while for RTW, these values were measured as 6.81 µm, 47.07 µm, and 140 µm. Additionally, the specific surface area of MW was 1217 m2/kg, which was approximately three times higher than that of RTW (412 m2/kg).
Solid sodium hydroxide (NaOH) with a purity of 98% and a molecular weight of 40 g/mol was supplied by Merck Chemicals. The concentration of the NaOH solution was expressed in molarity (M). A 7.5 M NaOH solution was prepared by dissolving 300.0 g of solid NaOH (7.5 × 40 = 300 g) in deionized water to make a final volume of 1 L. The solution was then allowed to cool at ambient temperature (approximately 23 °C) for 24 h before use. A commercial-grade sodium silicate solution, also supplied by Merck Chemicals, was used directly as received without further modification. This solution had a silicate modulus (SiO2/Na2O) of 3.4 and consisted of 25.5 wt.% SiO2, 7.5 wt.% Na2O, and 67.0 wt.% H2O, with a density of 1.29 g/mL at 20 °C.
Al powder, obtained from Ytong A.Ş., was used as a foaming agent to reduce unit weight and improve thermal performance. It had a purity of 99% and a particle size ranging from 5 to 50 μm. Deionized water was used throughout the experiments.

2.2. Mixture Design

A two-stage experimental design was adopted to first identify the optimal binder composition and subsequently evaluate the effect of the foaming agent content on the physical, mechanical, and thermal performance of the AAFs. In the first stage, the impact of replacing RTW with MW at varying proportions in RTW-based AABs on phase characteristics, chemical bonding, and physical and mechanical properties was assessed. In the second stage, Al powder was incorporated at different ratios into the AAB with the optimum composition obtained from the previous stage, focusing on the production of AAFs with lower unit weight and enhanced thermal performance.
Several preliminary trial mixtures were prepared before the main experimental program to check the suitability of the selected mix parameters. The selected MW replacement ratios (0%, 10%, 15%, 20%, 25%, and 30%) were intentionally broad. This replacement range was selected to investigate the feasibility of using MW as a high-volume addition and to determine the level at which its influence becomes critical. Some previous studies used MW as a partial binder replacement, usually within the range of 10–30% [25,26]. In all formulations, the total liquid-to-binder ratio was fixed at 0.30 based on preliminary trials to ensure adequate workability and pore stability [9].
The molarity of NaOH in the reaction medium is an important factor governing the dissolution of any aluminosilicate precursor used in alkali activation. As the alkalinity of the reaction medium increases, more Si and Al-containing components dissolve from the precursor, and subsequent polycondensation reactions are promoted. Previous studies have shown that NaOH concentrations in the range of approximately 6–10 M generally provide sufficient alkalinity to promote stable geopolymerization kinetics while maintaining adequate workability of AABs [27,28]. In this study, a 7.5 M NaOH solution was used to promote RTW dissolution without causing excessively rapid reactions that could adversely affect workability and pore stability.
In the design of AABs consisting of two different alkali activators, the mixing ratio between these activators has a significant impact on the development of AAB properties. While NaOH regulates the alkalinity of the matrix and particularly enhances the development of dissolution reactions, sodium silicate provides additional silicate species to the reaction environment, facilitating the development of a three-dimensional aluminosilicate gel structure and, thus, enabling the production of AABs with improved mechanical performance. According to the literature, the NaOH-to-sodium silicate ratios in the range of approximately 1:1–1:2 are commonly adopted in AAB design, as they generally provide a suitable balance between reaction development, workability, and mechanical performance [29,30]. Therefore, in this study, the NaOH-to-sodium silicate ratio was kept constant at 1:2. Based on preliminary trials, the total alkali activator-to-binder ratio was fixed at 1:4 throughout the experimental program.
The reported liquid-to-binder ratio of 0.30 refers to the total liquid phase, including the 7.5 M NaOH solution, commercial sodium silicate solution, and additional deionized water. For clarity, the corresponding effective total water-to-binder ratio, calculated by considering the water contained in both alkaline activator solutions and the additional deionized water, was approximately 0.23. The effective water content consisted of the water associated with the NaOH solution, the 67 wt.% water contained in the commercial sodium silicate solution, and the additional deionized water added during mixture preparation.
In the second stage of the experimental research, Al powder was incorporated at contents of 0.05, 0.10, 0.15, and 0.20 wt.% based on the total binder mass (RTW + MW). These contents were selected to evaluate how increasing hydrogen gas generation affects the physical, mechanical, and thermal behavior of the AAFs, as well as pore size distribution and interconnectivity. The specimen codes and raw material quantities used at different stages of this study are presented in Table 2.

2.3. Specimen Fabrication

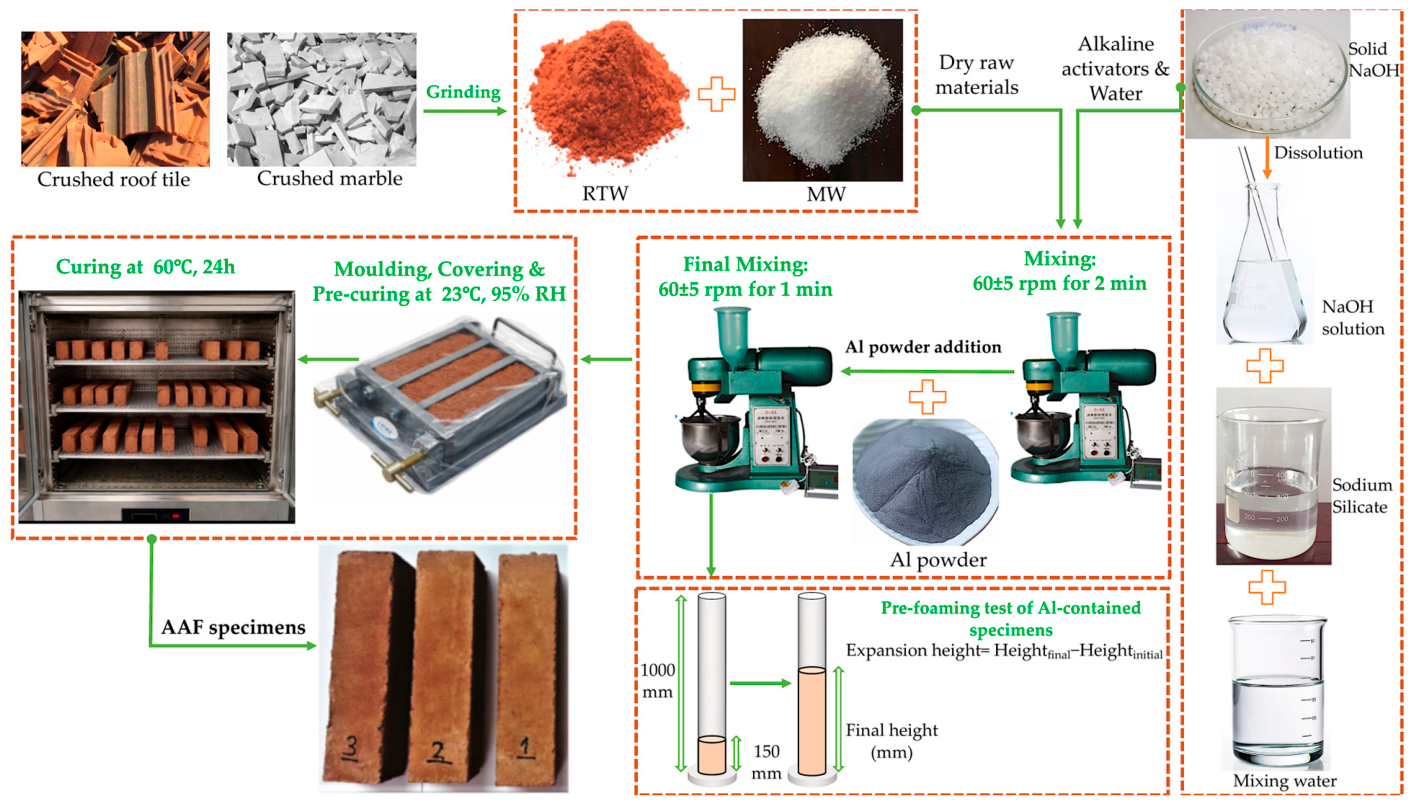
The specimen fabrication process, shown in Figure 3, was carried out in eight main steps: (i) preparation of the alkali activator, (ii) dry mixing of the raw materials, (iii) production of the AAB mixture, (iv) a pre-foaming trial, (v) casting into molds, (vi) expansion of the mixture, (vii) pre-curing, and (viii) final curing. In the first stage, RTW and MW were mixed for 2 min using a mixer operating at 60 ± 5 rpm to ensure a homogeneous distribution of the dry particles. Then, the previously prepared and cooled NaOH solution, sodium silicate solution, and additional deionized water were added to the dry mixture. Mixing was continued at the same speed for another 2 min until a homogeneous AAB was obtained.
For the production of AAFs, Al powder was subsequently introduced into the mixture and mixed for a further 1 min to allow sufficient interaction with the paste. After the addition of Al powder, the reactive aluminum particles interacted with the alkaline solution in the presence of water and produced hydrogen gas, as shown in Equation (1) [31]. The released hydrogen bubbles became entrapped within the paste, generating a cellular pore structure that reduced unit weight and improved thermal insulation. Foaming began immediately, and volume expansion was completed within approximately 10–12 min.
2Al + 2NaOH + 6H2O → 2Na(Al(OH)4) + 3H2
To prevent material waste and improve the efficiency of the foaming process, the AAF mixtures were filled to approximately one-third of the mold capacity. Because the expansion ratio of the AAF mixtures with different Al contents varied, a pre-foaming test was conducted using a 1000 mL graduated cylinder. The fresh AAF mixtures were poured into the cylinders to an initial volume of 150 mL, and the expansion heights were recorded at thirty-second intervals.
The fresh mixtures were poured into 40 × 40 × 160 mm molds. To prevent surface drying and cracking, the molded specimens were sealed with polyethylene (PE) film and maintained under ambient conditions (~23 °C and 50–55% relative humidity (RH)) for 24 h. The initial pre-curing stage was applied to allow the early alkali activation reactions to initiate gradually and to stabilize the foamed structure before exposure to elevated temperatures. This stage played a critical role in AAF production because rapid gas formation and volume increase can lead to pore collapse or structural instability if the matrix does not gain sufficient early strength. Heat-curing temperatures of 40–80 °C have been reported to accelerate AAB reaction kinetics and improve mechanical performance without causing excessive drying or microcracking [31]. In this study, after pre-curing, the specimens were cured at 60 °C for 24 h to allow effective alkali activation while maintaining the stability of the porous AAF structure. Once the curing period was completed, the specimens were allowed to cool to room temperature inside the oven before being removed from the molds and kept under laboratory conditions (~23 °C and 50–55% RH) until they reached an age of 28 days.
The specimens were labeled in the form of “xRTW:yMW:zAl”, where “x” and “y” indicate the proportions of RTW and MW, respectively, and “z” denotes the Al powder content relative to the total binder mass.

2.4. Applied Experimental Tests

The experimental tests were performed under controlled laboratory conditions at different stages of the experimental program, according to the purpose of each analysis. XRF, XRD, and particle size distribution analyses were performed only on the raw materials (RTW and MW) to determine their chemical composition, mineralogical and physical characteristics. XRD and Fourier-transform infrared spectroscopy (FTIR) analyses were carried out on selected AAB specimens obtained in the first experimental stage to investigate phase evolution and chemical bonding associated with increasing MW replacement. The physical and mechanical tests, including unit weight, water absorption ratio, porosity, ultrasound pulse velocity, flexural strength, and compressive strength, were performed on the AAB and AAF specimens according to the objectives of each experimental stage. Thermal conductivity, mercury intrusion porosimetry (MIP), and optical microscopy analyses were performed exclusively on AAF specimens to evaluate their thermal insulation performance, pore structure, and internal pore morphology.
For each mixture, six prism specimens (40 × 40 × 160 mm) were prepared for the physical and mechanical tests. Thermal conductivity was determined using six disc-shaped specimens measuring 100 mm in diameter and 10 mm in thickness. Microstructural observations were carried out on three polished epoxy-impregnated thin sections prepared from each of the three selected AAF mixtures. The thin sections measured 40 × 40 mm with a final thickness of approximately 30 μm. Representative optical micrographs were obtained from each thin section.
The chemical compositions of the RTW and MW were determined using a Philips PW-2404 wavelength-dispersive XRF spectrometer (Philips Analytical B.V., Almelo, The Netherlands). Prior to analysis, the powdered specimens were dried, homogenized, and prepared as pressed pellets for elemental oxide determination. The oxide compositions are reported as weight percentages of the corresponding oxides. The XRD analyses were carried out using an XRD-6000 X-ray diffractometer (Shimadzu, Kyoto, Japan). Prior to analysis, the specimens were ground into powder. Diffraction patterns were collected using Cu Kα radiation (λ = 1.5406 Å), with the instrument operated at 40 kV and 30 mA, over a 2θ range of 10–70° with a scan rate of 2°/min and a step size of 0.02°. The particle size distributions of the RTW and MW were analyzed using a Mastersizer 3000 (Malvern Panalytical, Malvern, UK) laser particle size analyzer, which features a measurement range of 0.01–3500 μm. FTIR analyses were performed using a Bruker ALPHA II FTIR spectrometer (A250/DII, Bruker Optics GmbH, Ettlingen, Germany). The spectra were recorded over the wavenumber range of 400–4000 cm−1 with a spectral resolution of 4 cm−1 using an attenuated total reflectance (ATR) diamond sampling module at room temperature.
Prior to all physical property measurements, the specimens were dried in an oven at 100 °C until they attained a constant weight, which required approximately 24 h, to determine the dry specimen mass (md). To determine the saturated mass (ms), the same specimens were then stored for 48 h in a container filled with water. The immersed mass (mh) was measured while the specimens were suspended in water. The unit weight (ρ, g/cm3) was calculated using Equation (2) in accordance with TS EN 1015-10 [32]:
ρ = md/(ms − mh)
The water absorption ratio (WAR, %) of the specimens at atmospheric pressure was determined using Equation (3) in accordance with TS EN 13755 [33]:
WAR = [(ms − md)/md] × 100
The porosity (P, %) of the specimen was determined using Equation (4):
P = [1 − (ρ/ρsw)] × 100
where (ρ) is the unit weight and (ρsw) is the specific weight of the specimen (g/cm3). The specific weight is the mass of the unit volume of the dried material in the void-free state and was determined according to TS 699 [34].
The dynamic ultrasound pulse velocity (UPV, km/s) was determined using portable ultrasonic nondestructive testing equipment (Proceq) in compliance with TS EN 14579 [35] and calculated using Equation (5):
UPV = l/t
where (l) is the length of the specimen and (t) is the time required for the pulse to traverse that length.
The compressive and flexural strength tests were performed according to TS EN 196-1 [36] using a UTEST 2000 kN testing machine (UTEST Material Testing Equipment, Ankara, Türkiye) at a loading rate of 50 N/s. Compressive strength (Cs, MPa) and flexural strength (Fs, MPa) were calculated using Equations (6) and (7), respectively:
Cs = Fc/A
Fs = (1.5 × Ff × l)/(b × h2)
where (Fc) and (Ff) are the maximum compressive and flexural loads applied to the specimen, respectively, in N; (A) is the cross-sectional area of the specimen (mm2); (l) is the distance between the support cylinders (mm); (b) is the edge length of the square cross-section of the specimen (mm); and (h) is the height of the specimen (mm).
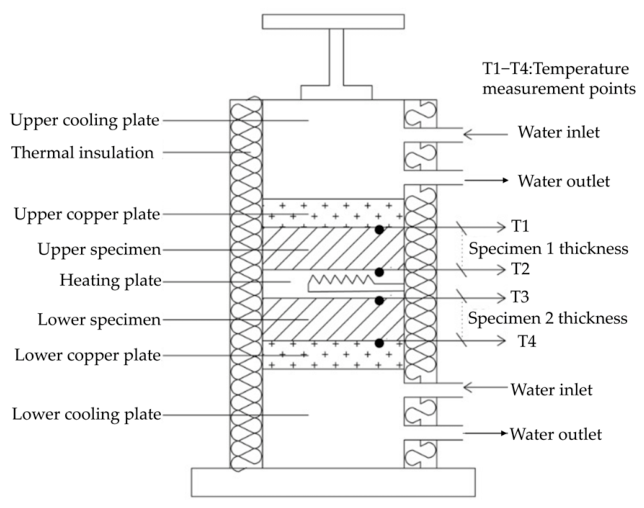
Thermal conductivity was measured under steady-state conditions in accordance with ASTM C518-17 [37] using a custom-built heat flow meter apparatus developed at the Heat and Mass Transfer Laboratory, Faculty of Mechanical Engineering, Istanbul Technical University (Istanbul, Türkiye). A schematic illustration of the experimental setup is provided in Figure 4. The apparatus consisted of upper and lower cooling plates, a centrally positioned heater, two copper plates, and a thermally insulated enclosure to minimize heat loss. During each measurement, two disc-shaped specimens (100 mm in diameter and 10 mm in thickness) were placed symmetrically on both sides of the heater between the copper plates. The system was allowed to reach steady-state conditions (approximately 40 min) before data acquisition. Temperatures at the heater and copper plates were continuously monitored using a Keithley 2700 Multimeter/Data Acquisition System (Keithley Instruments, Cleveland, OH, USA) using Keithley ExceLINX-1A software (Version C05). The thermal conductivity was subsequently calculated according to Fourier’s law using the measured heat flux and temperature gradients across the specimens. Prior to testing, all specimens were dried to constant mass at 60 °C to eliminate the influence of moisture on the thermal conductivity measurements; therefore, the reported thermal conductivity values correspond to the dry state of the materials. The measurements were performed at a mean test temperature of 25 °C with a plate temperature difference (ΔT) of 20 °C.
An MIP test was performed to quantitatively determine the pore size distribution and total pore volume of the AAFs. Prior to testing, the specimens were oven-dried to constant mass and small representative fragments were used for analysis. Measurements were carried out using an AutoPore IV 9500 mercury porosimeter (Micromeritics, Norcross, GA, USA) over a pore diameter range of 0.005–500 μm. A mercury surface tension of 485 dyn/cm and a contact angle of 130° were used for pore size calculations based on the Washburn equation.
To characterize the internal pore morphology, three representative specimens from the reference mixture and the mixtures containing 0.05% and 0.20% Al were prepared as polished thin sections at the Thin Section Preparation Laboratory, Faculty of Mining, Istanbul Technical University. The specimens were first cut to approximately 40 × 40 × 10 mm using a rock-cutting machine. The cut surfaces were subsequently ground on a lapping wheel to obtain a smooth and clean finish. Each specimen was then bonded onto a 1 mm thick glass slide using a transparent two-component epoxy resin and progressively ground with 600-grit SiC abrasive paper until a final thickness of approximately 30 μm was achieved. The prepared thin sections were examined under transmitted polarized light using a Nikon Eclipse LV100POL optical microscope (Nikon Corporation, Tokyo, Japan), and three representative micrographs were acquired from each specimen to evaluate the internal pore morphology and qualitative variations in pore size.
Measurement results were statistically analyzed to evaluate the reliability and reproducibility of experimental data. Chauvenet’s criterion was applied to identify possible outliers [38]. According to this approach, if the probability of a measurement deviating from the mean is less than 1/(2 N), the relevant data point is considered an outlier. In this study, six replicate measurements (N = 6) were obtained for the physical, mechanical, and thermal tests. According to the Chauvenet criterion, the maximum acceptable coefficient of deviation for this specimen size was determined to be 1.73. Therefore, only measurements exceeding the maximum acceptable deviation limit specified by the Chauvenet criterion were excluded from the analysis. After removing outliers, the arithmetic mean was recalculated from the remaining data. Additionally, the coefficient of variation was calculated to assess the distribution of measurements relative to the mean, and the resulting values remained below 5% for all parameters. This indicates that the experimental results have high reproducibility.

3. Results and Discussion

3.1. Properties of Alkali-Activated Binders

3.1.1. Physical and Mechanical Properties of AABs

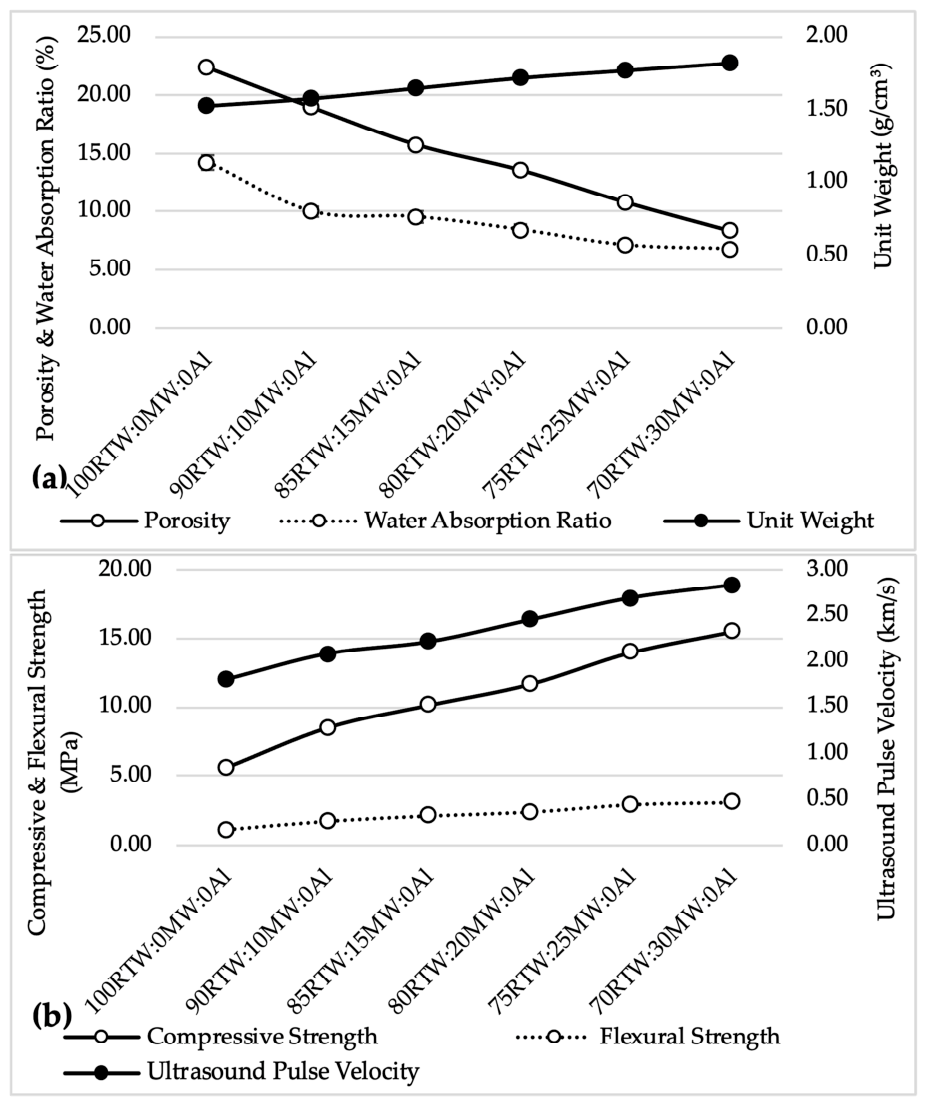
In AABs, unit weight, porosity, and water absorption ratio are closely interrelated, and their combined effects determine the mechanical properties, such as ultrasound pulse velocity, compressive strength, and flexural strength. In the first stage of this study, the changes in the physical properties of AABs produced with different RTW and MW contents are presented in Figure 5a, whereas the corresponding mechanical properties are shown in Figure 5b.
The reference mixture (100RTW:0MW:0Al) showed porosity, unit weight, and water absorption values of 22.36%, 1.53 g/cm3, and 14.23%, respectively. With the partial replacement of RTW by MW at 10%, 15%, 20%, 25%, and 30% (by weight), a systematic reduction in porosity was observed, with decreases of 15%, 29%, 39%, 51%, and 62%, respectively. As expected, porosity showed a negative correlation with unit weight. A decrease in pore volume increased the solid fraction of the AAB, which in turn led to a gradual rise in unit weight. With increasing MW content, the unit weight gradually increased, reaching 1.58, 1.65, 1.72, 1.77, and 1.82 g/cm3, respectively. The reference AAB had a water absorption ratio of 14.23%, but the specimens with MW had water absorption values ranging from 6.82% to 10.00%. This behavior can be attributed to a refined pore structure and fewer interconnected pores, which limited water penetration into the AAB matrix.
The addition of MW resulted in a noticeable enhancement in the mechanical properties of RTW-based AAB, as shown in Figure 5b. For the reference mixture (100RTW:0MW:0Al), the measured ultrasound pulse velocity, compressive strength, and flexural strength were 1.80 km/s, 5.57 MPa, and 1.11 MPa, respectively. As the MW content increased, these parameters also increased. For mixtures containing 10%, 15%, 20%, 25%, and 30% MW, the ultrasound pulse velocity increased by approximately 15–57%, reaching 2.08, 2.21, 2.45, 2.69, and 2.83 km/s, respectively. A similar trend was observed in the strength results. The compressive and flexural strengths increased by 52–178% and 55–175%, respectively. The mixture with the highest MW content (30%) exhibited the best mechanical properties, with an ultrasound pulse velocity of 2.83 km/s, a compressive strength of 15.50 MPa, and a flexural strength of 3.06 MPa. These improvements may be attributed to the role of MW in the matrix. The observed improvements are likely associated with the finer particle size and relatively high specific surface area of MW, which improve particle packing, reduce pore volume, and contribute to matrix densification, thereby contributing to a micro-filling effect. In addition, the relatively cohesive nature of MW may have supported the stability of the AAB, further contributing to the strength improvement. These findings are consistent with previously reported results in the literature [39,40], where similar improvements were associated with pore refinement and matrix densification in AAMs.
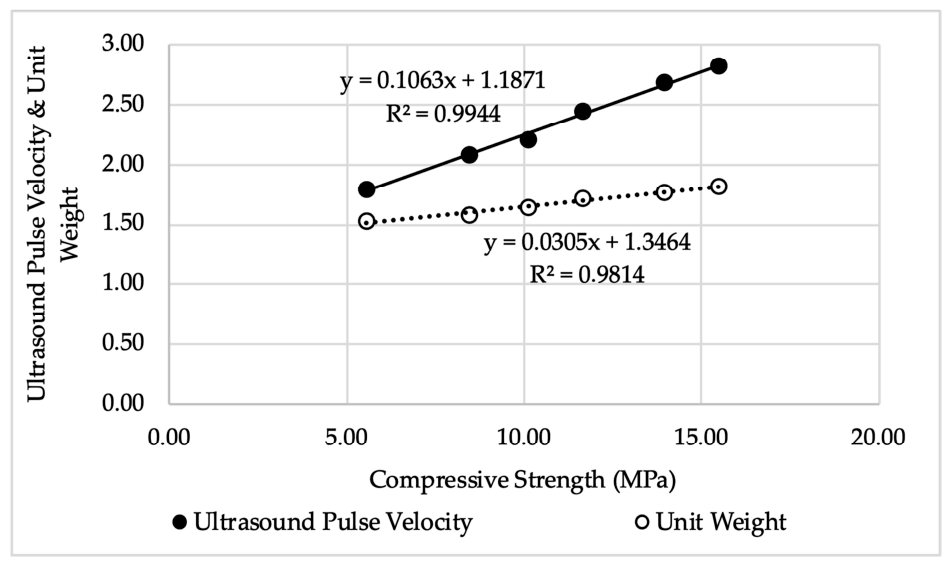
Figure 6 shows the relationship between compressive strength, ultrasound pulse velocity, and unit weight in RTW-MW-based AABs.
The strong linear relationship between compressive strength and ultrasound pulse velocity indicates the existence of a more pronounced microstructural refinement that cannot be explained solely by the increase in unit weight. The propagation of ultrasonic waves depends on the unit weight of the material as well as the continuity of the solid phase, the degree of pore interconnectivity, and the distribution of discontinuities in the internal structure. The high correlation coefficient (R2 = 0.9944) obtained in this study suggests that the incorporation of MW may have promoted a more continuous matrix, allowing ultrasonic waves to propagate with fewer interruptions. This result suggests that ultrasound pulse velocity measurement can serve as a practical non-destructive method for assessing microstructural integrity in AABs [41]. In contrast, the relatively weaker relationship between unit weight and compressive strength indicates that unit weight alone is insufficient to explain mechanical performance and that parameters related to microstructural continuity may also play an important role.

3.1.2. Microstructural and Phase Analysis of AABs

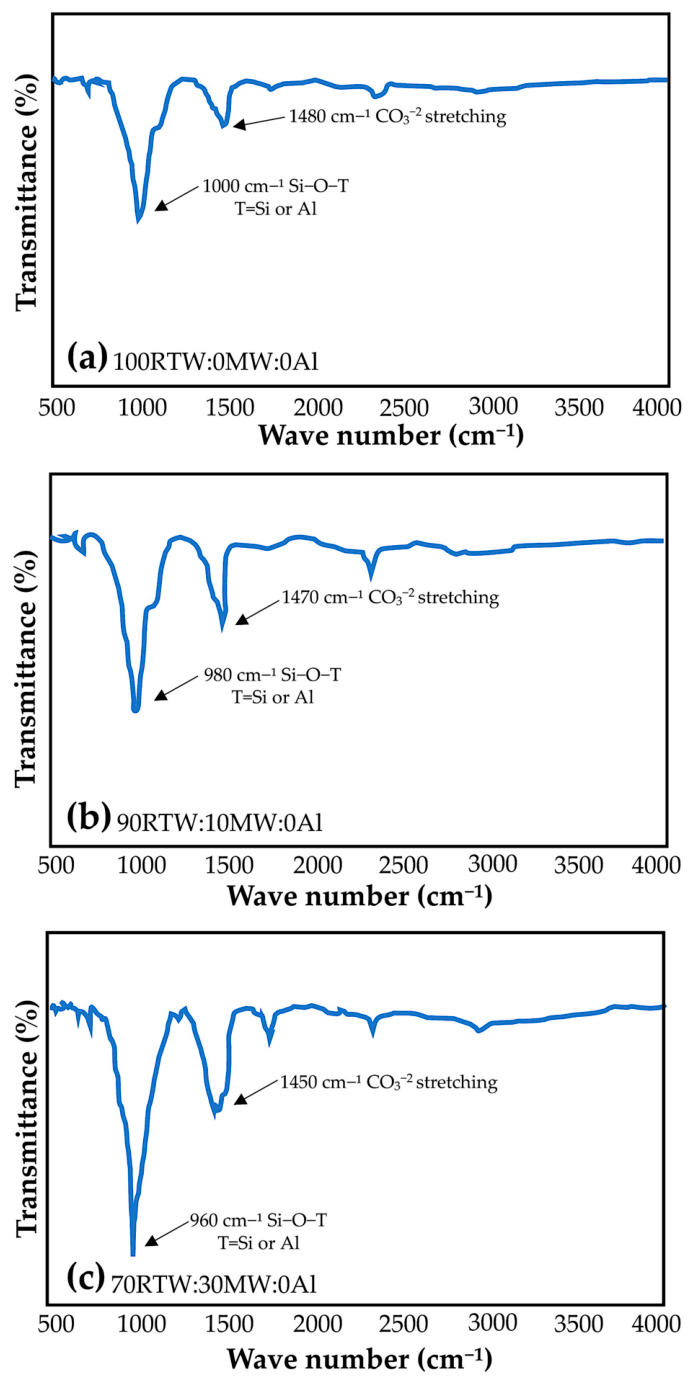
The FTIR spectra of the mixtures with different MW contents are shown in Figure 7. A distinct absorption band was observed around 950–1000 cm−1. This band is generally associated with the asymmetric stretching vibrations of Si–O–T (T = Si or Al) bonds and is considered characteristic of the aluminosilicate gel structure formed during alkali activation [42]. The specimen containing 30% MW exhibited a slightly sharper Si–O–T band. However, the observed spectral change was relatively limited and was interpreted as a modification of the local bonding environment within the existing aluminosilicate matrix rather than clear evidence of additional geopolymerization or the formation of new reaction products [43]. Furthermore, an increase in band intensity was observed in the 1400–1500 cm−1 region, corresponding to carbonate (CO32−) vibrations. This increase became more pronounced with increasing MW content, which is consistent with the calcium carbonate-rich composition of MW [44]. When considered together with the physical and mechanical results, these observations suggest that MW predominantly contributes to matrix densification through its role as a low-reactivity carbonate-rich micro-filler.
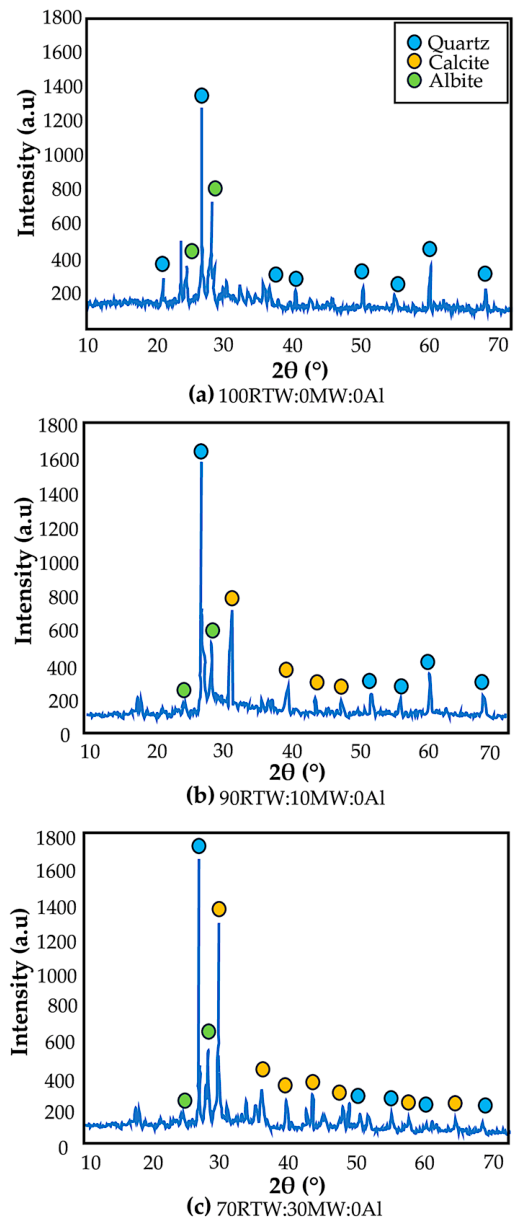
The XRD patterns presented in Figure 8 were mainly characterized by residual crystalline phases inherited from the raw materials. Quartz and albite remained the dominant crystalline phases in all specimens, while the intensity of the calcite reflections increased with increasing MW content due to the incorporation of the carbonate-rich marble waste. Several minor reflections were also observed; however, these peaks could not be uniquely assigned to additional crystalline reaction products based on the available XRD data. Therefore, no new crystalline phases associated with the incorporation of MW were identified with sufficient confidence. The results suggest that MW predominantly contributed to matrix densification through its role as a low-reactivity carbonate-rich micro-filler rather than by forming detectable crystalline reaction products.
When the XRD and FTIR results are considered together, the incorporation of MW did not permit confident identification of new crystalline reaction products. Instead, the increased intensity of the carbonate-related FTIR band together with the higher calcite peak intensity observed in the XRD patterns reflects the greater carbonate content introduced by MW. The slight sharpening of the Si–O–T band is interpreted as a modification of the existing aluminosilicate gel structure rather than evidence of additional geopolymerization. Combined with the improvements in physical and mechanical properties, these findings suggest that MW primarily acts as a low-reactivity carbonate-rich micro-filler, contributing mainly to particle packing, matrix densification, and pore refinement. Although the present XRD and FTIR results support this interpretation, complementary characterization techniques such as SEM-EDS, NMR, and TGA would be required to fully elucidate the reaction mechanism and to verify the contribution of MW within the alkali-activated matrix.
In this study, specimens containing different ratios of MW showed porosity ranging from 8.35 to 18.95%, water absorption from 6.82 to 10.00%, 28-day compressive strength from 8.47 to 15.50 MPa, and flexural strength from 1.72 to 3.06 MPa. The obtained results are consistent with those reported in the literature for AAMs containing MW. For example, although lower porosity (4.63–8.70%) and water absorption (3.13–5.22%) were reported in AAMs containing tile powder and MW, the compressive strength values (11.63–15.83 MPa) were within a similar range to those obtained in the present study [45]. These differences are likely related to the incorporation of aggregates, which resulted in a denser mortar structure. In another study, the compressive strength of specimens produced from a mixture of metakaolin, red mud, and slag containing 25–75% MW ranged from 21.9 to 28.0 MPa [40]. Similarly, specimens produced from a mixture of metakaolin and slag containing 25–75% MW exhibited compressive strengths of 50–65 MPa and a flexural strengths of 8–10 MPa [39]. The higher mechanical properties observed in these studies may be due to both the use of different aluminosilicate precursors and the addition of aggregates to the mortar composition at a binder/aggregate ratio of 1/2–1/3. In contrast, the use of aggregates was deliberately avoided in the present study, and the main purpose of this approach was to limit factors that may negatively affect pore formation during the subsequent AAF production stage. In this context, the obtained physical and mechanical properties provide sufficient initial performance in terms of the targeted lightweight and porous internal structure design. Based on these evaluations, the 70RTW:30MW:0Al mixture was selected as the initial binder matrix for the second stage AAF production. Although the addition of MW leads to an increase in unit weight, achieving a low initial unit weight alone is not sufficient in the development of foam-based AAMs. In order to protect the hydrogen gas bubbles formed during chemical foaming, the fresh matrix must have sufficient integrity and early structural stability. In this context, it was considered that the 70RTW:30MW:0Al mixture, which exhibited the lowest porosity and the highest mechanical strength, could provide a more stable initial matrix capable of limiting pore collapse and uncontrolled pore coalescence during Al-induced gas formation. Thus, in the second stage, the effects of Al content on pore development, unit weight, mechanical behavior, and thermal performance were investigated through a more stable binder system.

3.2. Properties of Alkali-Activated Foams

3.2.1. Pre-Foaming Behavior and Expansion Performance of AAFs

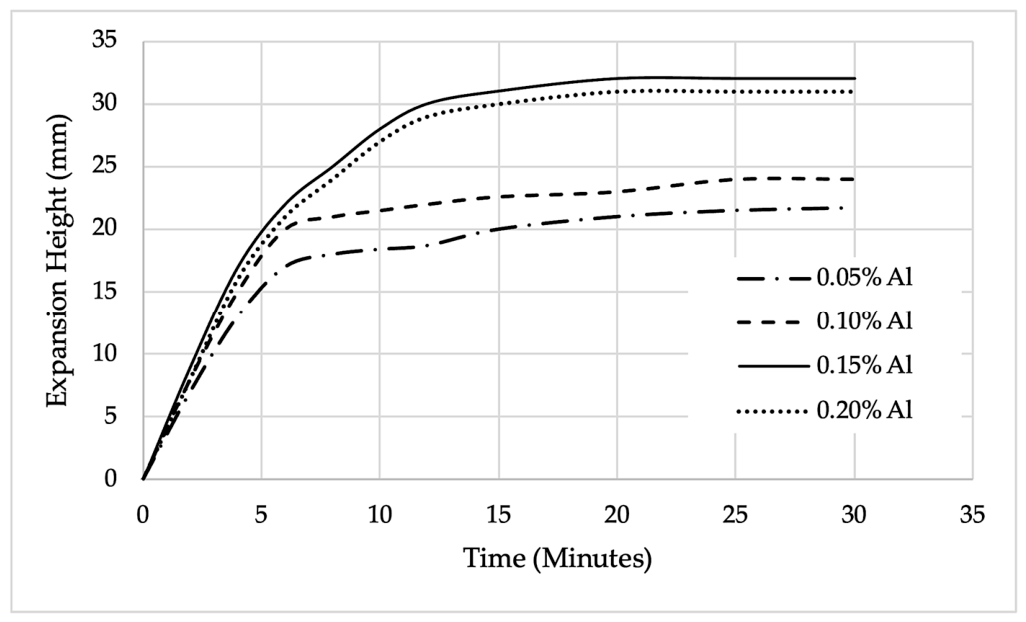
Figure 9 shows the time-dependent expansion behavior of AAFs with different Al contents. In all mixtures, the expansion height initially showed a rapid increase. This behavior can be attributed to H2 gas generation through the reaction of Al powder in the alkaline environment and the subsequent entrapment of the gas within the fresh matrix. As time progressed, the rate of increase in height decreased, forming a plateau region. Increasing the Al content significantly affected the expansion behavior, but this effect did not show a linear trend. At the lowest Al content (0.05%), the expansion remained limited due to restricted gas generation, whereas the mixture containing 0.10% Al exhibited a significant increase in expansion. The highest expansion height was recorded in the specimen containing 0.15% Al. This suggests that a favorable balance was achieved between gas generation and the pore-stabilizing capacity of the fresh matrix. In contrast, the expansion height remained limited in the specimen containing 0.20% Al despite the greater amount of Al available for gas generation. This behavior indicates that at high Al contents, gas generation may have exceeded the capacity of the fresh matrix to retain the gas bubbles and stabilize the resulting pore structure. Similar behavior has been reported in the literature [46,47]. Although the volume of gas generated and the rheological properties of the fresh mixtures were not directly measured in this study, the observed behavior appears to result from the interaction between gas generation and the structural development of the fresh matrix.
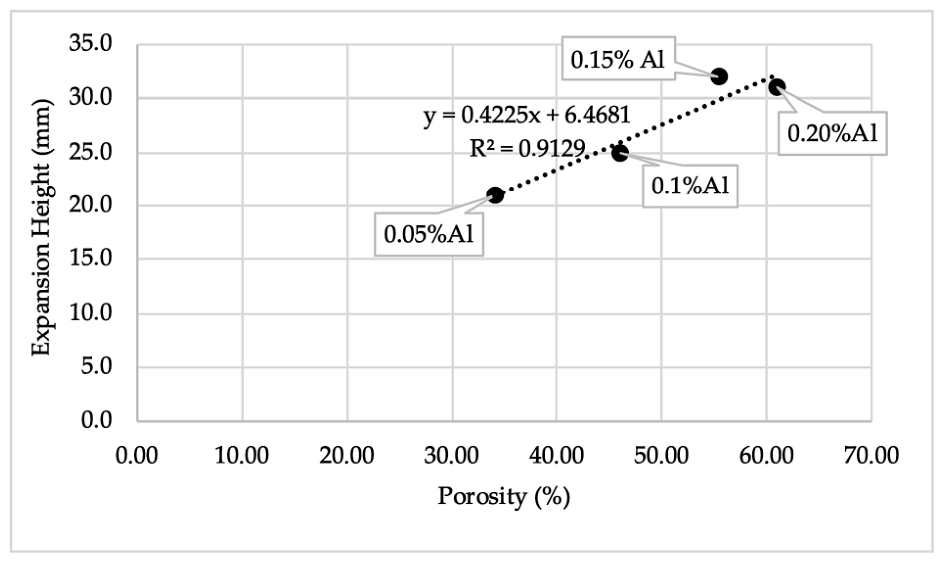
Figure 10 shows the relationship between the expansion height obtained from pre-foaming tests and the final porosity of the hardened AAF specimens.
The results show a strong linear relationship between expansion height and porosity (R2 = 0.9129). This indicates that the expansion occurring within the fresh matrix plays an important role in the formation of the final pore structure. As the Al content increased, both the expansion height and porosity increased. While mixtures with the lowest Al content (0.05%) exhibited more restricted expansion and lower porosity, specimens containing 0.10% and 0.15% Al exhibited significant increases in both parameters. In particular, the mixture containing 0.15% Al exhibited the greatest expansion, indicating a better balance between gas generation and matrix stability. In contrast, while porosity continued to increase in the specimen containing 0.20% Al, the expansion height showed only a limited increase. This behavior may be related to mechanisms such as pore coalescence, possible gas escape, and local structural instabilities at high Al contents. The findings show that the expansion height is an important parameter in predicting the final porosity, and that the pore structure is influenced not only by the expansion behavior but also by the microstructural transformations that occur during the hardening process. These findings suggest that the expansion data obtained during the pre-foaming stage provide a practical and predictive approach for designing the pore structure of AAFs. Since pore volume and pore connectivity directly influence heat transfer mechanisms in porous materials, the pre-foaming behavior may also provide an initial indication of the potential thermal insulation performance of the final AAF structure.

3.2.2. Physical and Mechanical Properties of AAFs

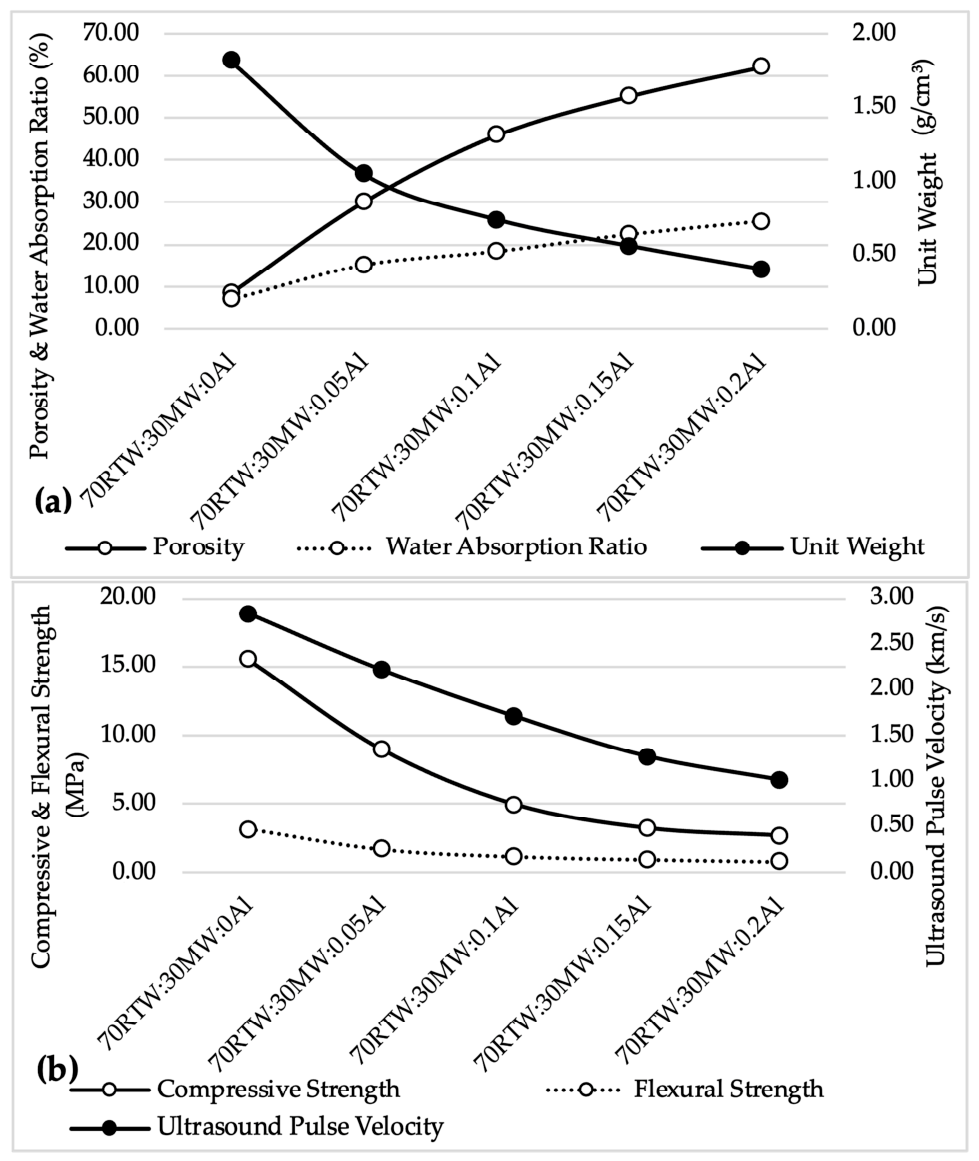
The changes in the physical and mechanical properties of AAF specimens with different Al powder contents are presented in Figure 11.
As shown in Figure 11a, increasing the amount of Al powder resulted in a significant increase in the porosity and water absorption of the specimens, while the unit weight decreased systematically. This behavior can be explained by the reaction of Al powder with the alkaline solution, which produces hydrogen gas, followed by the entrapment of the resulting gas bubbles within the matrix. With increasing gas formation, the total pore volume in the matrix increased and, consequently, the solid fraction decreased [48].
In Figure 11b, a significant decrease in compressive strength, flexural strength, and ultrasound pulse velocity was observed with increasing Al content. This reduction can be attributed to the reduced load-bearing solid fraction of the AAF due to the increasing porosity. However, the results obtained point to a more complex microstructural transformation that cannot be explained solely by the increase in total porosity. In this study, with the increase in Al content, not only did the total pore volume increase, but the pores also grew larger, became more irregular in shape, and formed a more interconnected structure. This transformation weakened the load transfer mechanism by reducing solid-phase continuity and, thus, led to a significant decrease in mechanical strength. These findings suggest that the performance evaluation of AAFs should consider not only total porosity but also the morphological characteristics of the pore structure. These characteristics are discussed in the following sections. The decrease in ultrasound pulse velocity further supports this microstructural transformation and can be attributed to the increase in porosity and the development of a more irregular and interconnected pore network [41]. From a thermal-performance perspective, this transformation of the pore structure may reduce thermal conductivity by disrupting continuous heat-transfer pathways and decreasing the effective solid-phase conduction area.
Although increasing the Al content effectively reduced the unit weight of AAFs and promoted the development of a porous structure, the results showed that the optimum mixture design should consider not only porosity but also the balance between thermal efficiency and mechanical integrity. For non-loadbearing wall applications, the primary objective is not to achieve high mechanical strength, but to maintain sufficient structural integrity while providing low unit weight and low thermal conductivity. Previous studies have reported a wide range of mechanical properties for AAFs, with compressive strengths of approximately 1–10 MPa commonly observed for non-load-bearing wall applications [19]. In this study, the specimen containing 0.15% Al achieved a favorable balance between low unit weight, low thermal conductivity, and acceptable mechanical performance. In contrast, although the mixture containing 0.20% Al exhibited a lower thermal conductivity, its lower mechanical performance suggests that excessive gas generation may promote pore coalescence and interconnectivity, thereby reducing matrix continuity. Therefore, the results suggest that performance optimization of AAFs depends not only on maximizing pore volume but also on controlling pore morphology, pore size distribution, and the degree of interpore connectivity.

3.2.3. Optical Microstructure of AAFs

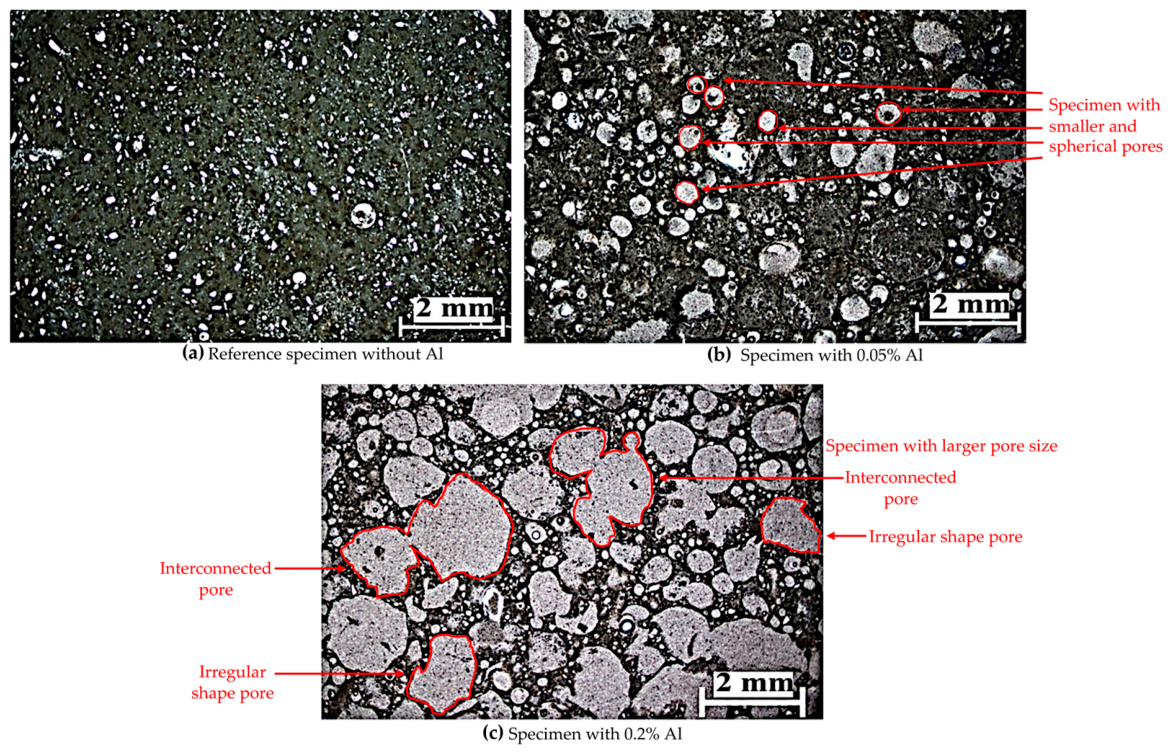
Figure 12 illustrates the changes in pore morphology of AAFs with increasing Al powder content, as observed in the optical microscopy images. In the reference specimen without Al powder (Figure 12a), a relatively compact matrix was observed, with a limited number of small pores that were relatively homogeneously distributed. This morphology may primarily be attributed to air voids entrapped during mixing, because no Al-induced gas-generation mechanism was present. With the addition of a small amount of Al (0.05%, Figure 12b), pore formation increased substantially because of gas evolution during the reaction of Al in the alkaline medium. In this specimen, the pores were predominantly small and approximately spherical and exhibited a more regular and relatively homogeneous distribution. This morphology may result from the relatively limited gas generation at low Al content, which allowed the fresh matrix to retain the gas bubbles and stabilize the developing pores more effectively. With the increase in Al content to 0.20% (Figure 12c), a substantial change occurred in the pore structure. Larger, irregular-shaped, and interconnected pores were observed. This indicates that increased gas generation may have promoted pore coalescence while reducing the stability of the pore walls. Greater interpore connectivity was associated with an increased macropore fraction and greater matrix heterogeneity.
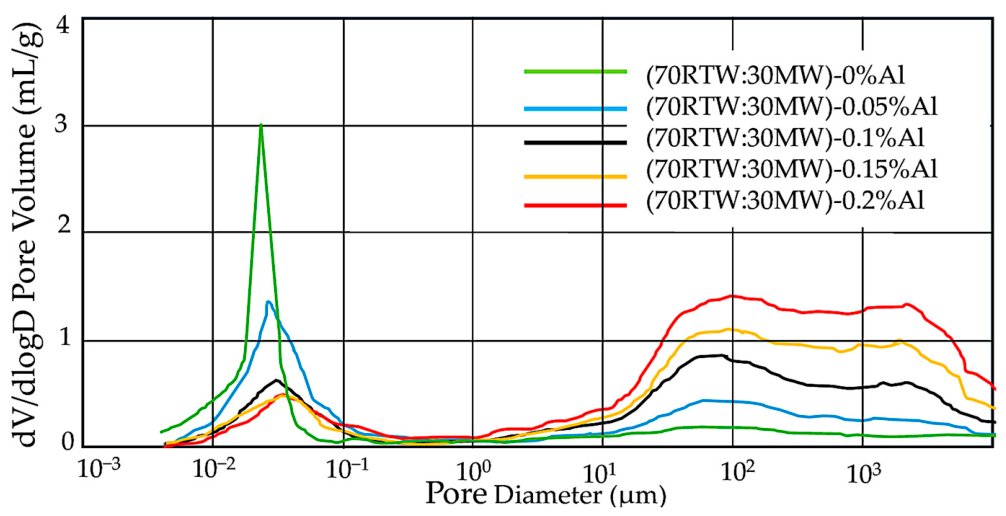
The optical microscopy observations are consistent with the pore size distribution results obtained from the MIP analyses. The smaller and more spherical pore structure observed at low Al contents is supported by the higher nanopore fraction indicated by the MIP results, while the larger and interconnected pore morphology observed at high Al contents is consistent with the marked increase in the macropore fraction measured by MIP. Together, these observations provide complementary qualitative and quantitative evidence of pore coarsening with increasing Al content.

3.2.4. Pore Structure Analysis of AAFs

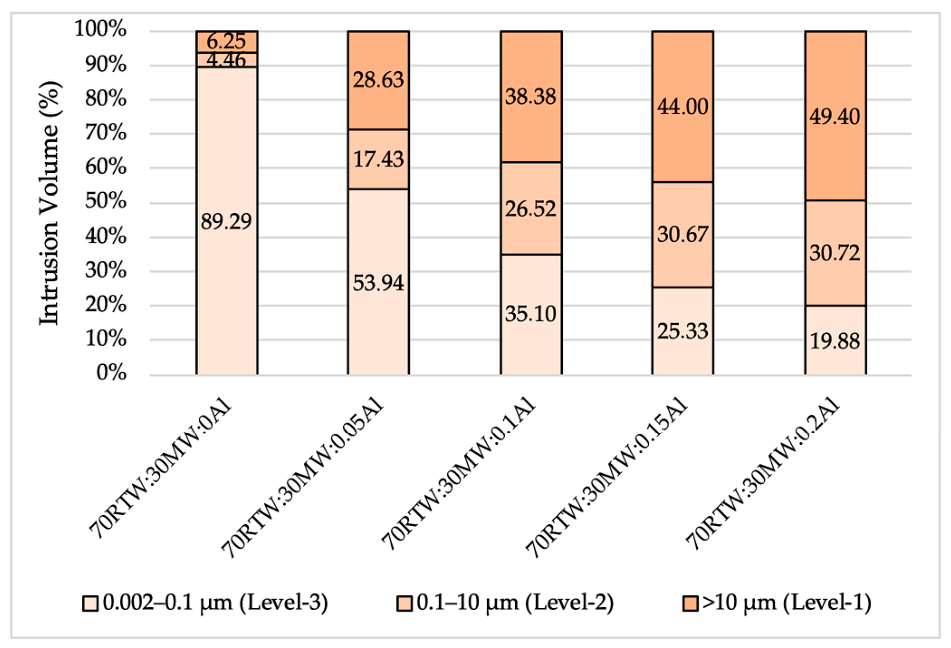
The pore types in AAFs can be classified into four groups: macropores larger than 10 μm (air bubbles intentionally created during production) (Level-1); mesopores between 0.1 μm and 10 μm (formed within or around partially reacted particles) (Level-2); nanopores between 0.002 μm and 0.1 μm (consisting of gel voids in the matrix) (Level-3); and molecular pores smaller than 0.002 μm (associated with the aluminosilicate network) (Level-4) [49]. The pore size distribution given in Figure 13 shows that with increasing Al content, the pore structure not only expands volumetrically but also changes in character. While the pore structure in the Al-free specimen largely consisted of fine pores distributed within the gel matrix, the distribution shifted toward larger pore diameters with the addition of Al. This observation is reflected in the decrease in the nanopore fraction from 89.29% to 19.88% and the corresponding increase in the macropore fraction from 6.25% to 49.40% (Figure 14).
It should be noted that MIP mainly represents accessible pore volume, whereas total porosity measurements include both accessible and partially closed pores. Therefore, differences between absolute values obtained from different measurement techniques may occur. Nevertheless, both approaches consistently confirm the same trend, indicating a progressive increase in pore volume and pore coarsening with increasing Al content.
This significant change suggests that the dominant process in pore formation may have changed. This behavior may be attributed to the tendency of hydrogen gas bubbles formed in an alkaline environment, especially at high Al contents, to grow and coalesce before the fresh matrix gains sufficient stability. This process leads to the formation of larger, irregular, and heterogeneous macropores, thus weakening solid-phase continuity and interrupting the ultrasonic wave propagation. Therefore, the observed decrease in mechanical properties should be attributed not only to the increase in porosity but also to pore growth, pore coalescence, and the development of a more discontinuous pore structure. This finding is consistent with previous studies highlighting the decisive role of pore size in the mechanical performance of AAFs. Zhang et al. [50] and Chen et al. [49] reported that macropores substantially reduce mechanical performance in geopolymer foam concretes. Therefore, the thermal insulation performance of AAFs should not be evaluated solely based on total porosity, but also by considering pore morphology, pore size distribution, and the degree of pore interconnectivity.
Total pore volume values also support this trend. As shown in Table 3, the total pore volume, which was 0.336 mL/g in the reference specimen, reached 0.482, 0.641, 0.750, and 0.830 mL/g in specimens containing 0.05%, 0.10%, 0.15%, and 0.20% Al, respectively. This increase is consistent with the porosity results and further supports the foaming effect of Al powder.

3.2.5. Thermal Properties of AAFs

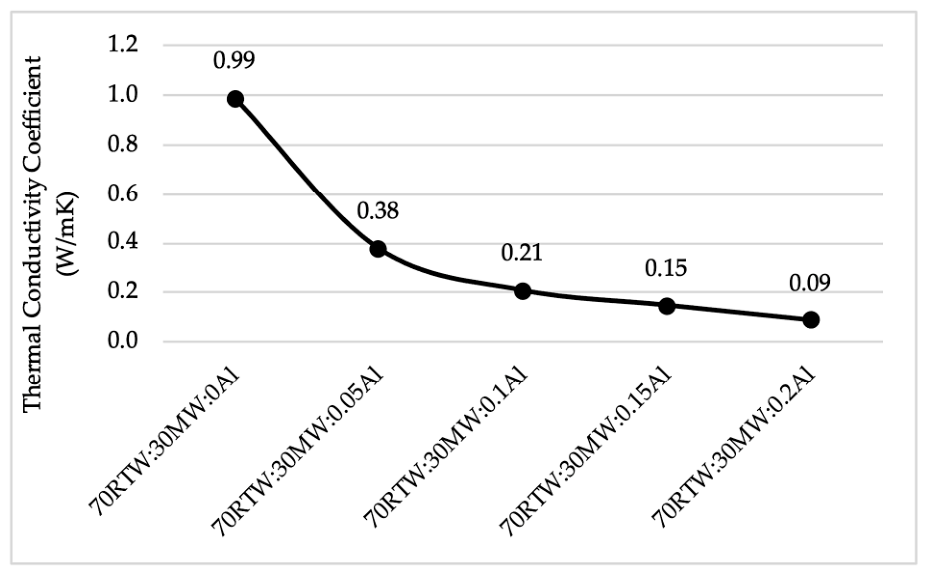
The dry-state thermal conductivities of specimens with different Al contents are given in Figure 15. The dry-state thermal conductivity decreased significantly with increasing Al powder content. The thermal conductivity, which was 0.99 W/m·K in the reference specimen, decreased sharply to 0.38 W/m·K with the addition of 0.05% Al. This decreasing trend continued with increasing Al content, reaching 0.21, 0.15, and 0.09 W/m·K for the 0.10%, 0.15%, and 0.20% Al mixtures, respectively. This behavior can be attributed to the increase in pore volume, particularly the increase in the macropore fraction, with increasing Al content. With the development of the foam structure, the solid-phase continuity decreases, and heat transfer occurs mostly through the air phase, which has low thermal conductivity. Furthermore, the increase in porosity disrupts continuous heat-transfer pathways within the solid skeleton and reduces the effective solid-phase heat conduction area, thereby resulting in a lower thermal conductivity [51].
The sharp decrease observed particularly following the addition of 0.05% Al can be attributed to rapid gas formation in the matrix and microstructural transformation occurring during the initial stages of pore formation. At higher Al contents, although the degree of pore coalescence and connectivity increases, the reduction in thermal conductivity becomes less pronounced because the porosity is already high.
It should be noted that the reported thermal conductivity values correspond to dry-state measurements obtained after drying the specimens to constant mass prior to testing. Although increasing Al content significantly improves the dry-state thermal insulation performance by generating a highly porous structure, the higher water absorption observed in the foamed mixtures indicates that moisture ingress under service conditions may partially replace air within the pore network, thereby increasing the effective thermal conductivity. Therefore, the reported thermal conductivity values should be interpreted as representative of dry-state properties rather than of in-service thermal performance. Additional investigations under different moisture conditions are required to quantify the long-term thermal behavior of these AAFs.
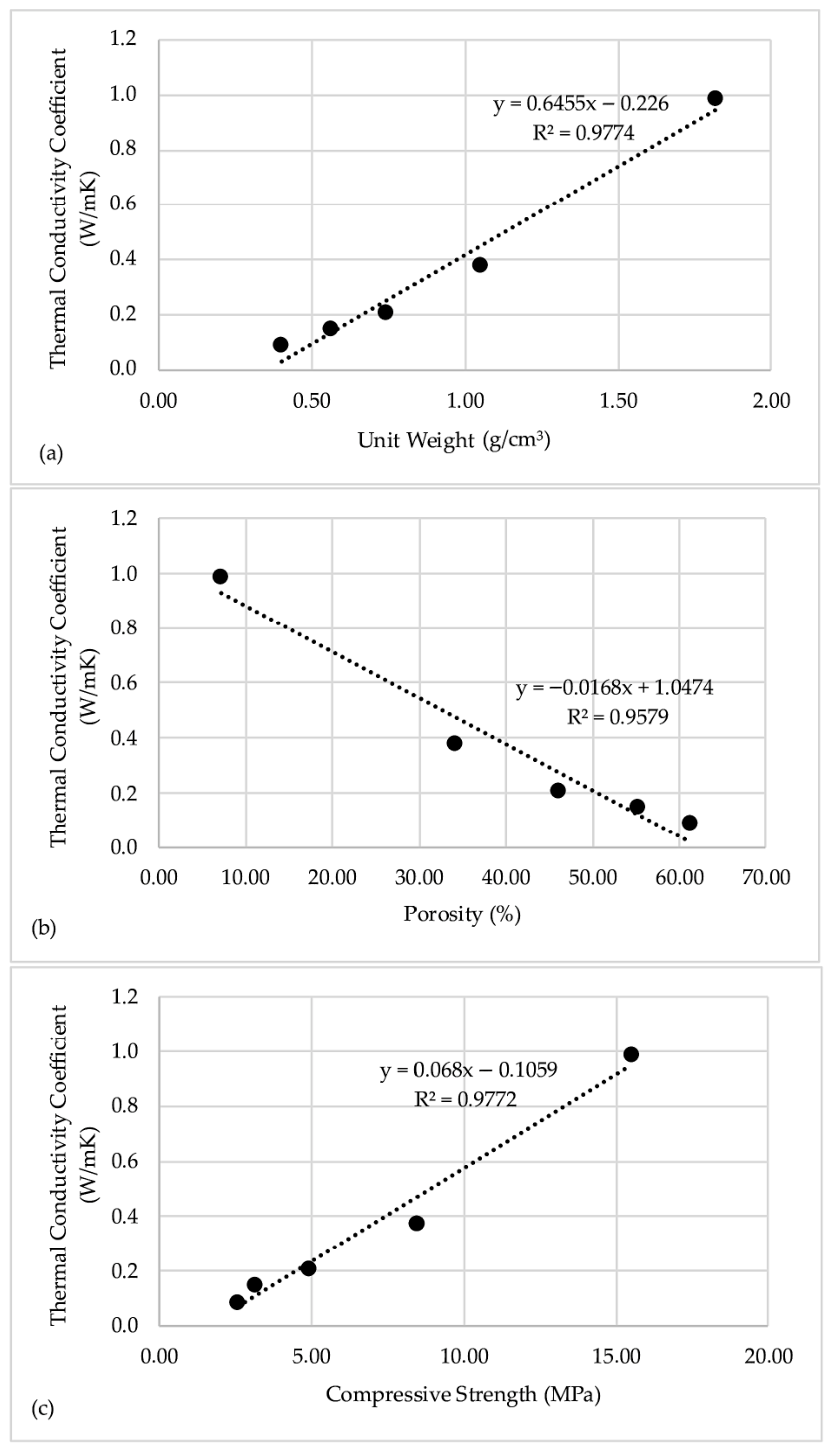
Figure 16 illustrates the relationships between the thermal conductivity of AAFs and unit weight, porosity, and compressive strength. As shown in Figure 16a, the experimental data exhibit a decreasing trend in thermal conductivity with decreasing unit weight, which is well described by a linear fit (R2 = 0.9774). This behavior can be attributed to the lower pore volume and greater solid-phase continuity at higher unit weight values. Increased solid-phase continuity leads to the formation of more continuous paths for heat transfer, thus increasing thermal conductivity. Considering the limited number of experimental mixtures, the regression is presented only to describe the observed trend within the investigated dataset rather than as an independent predictive relationship. Figure 16b shows an inverse relationship between thermal conductivity and porosity (R2 = 0.9579). Thermal conductivity decreased significantly with increasing porosity. This trend can be explained by the disruption of solid-phase continuity and interruption of heat flow paths with increasing pore volume.
Figure 16c shows a positive relationship between thermal conductivity and compressive strength, represented by a linear fit (R2 = 0.9772). The increase in compressive strength is associated with the microstructure becoming more compact and less porous. This microstructural densification creates a more efficient environment for heat transfer by increasing the unit weight and solid-phase continuity, thus leading to an increase in thermal conductivity. Although the regression analyses indicate consistent trends within the experimental dataset, they are intended to illustrate the observed relationships rather than to establish independent predictive models.
Overall, the regression analyses provide a quantitative description of the relationships observed among thermal conductivity, unit weight, porosity, and compressive strength within the investigated mixtures. These results suggest that pore structure plays an important role in governing the thermal performance of AAFs. Although the observed trends may provide useful guidance for mixture design within the investigated composition range, they should not be interpreted as universal predictive models.
Table 4 shows that AAFs produced with different precursor materials and foaming agents differ not only in performance but also in pore formation mechanism and dominant pore characteristics.
While materials based on O2 production, such as H2O2 and sodium perborate, generally develop finer and more homogeneous pore structures, AAFs using Al powder exhibit larger macropores due to H2 gas formation and pore coalescence at high Al contents. This study demonstrates that unit weight and thermal conductivity decrease with increasing porosity, consistent with previous studies. However, the findings suggest that pore formation is related not only to gas production but also to the balance between gas formation and the capacity of the fresh matrix to retain the gas bubbles and stabilize the developing pores. In particular, the limited volumetric increase observed despite the greater extend of gas generation expected at high Al contents indicates that mechanisms such as pore coalescence and gas escape become dominant. The findings indicate that the mixture with the lowest thermal conductivity value does not always provide the optimal performance. The specimen containing 0.20% Al exhibits high porosity and low thermal conductivity, while showing a significant loss of strength. In contrast, the mixture containing 0.15% Al offers an optimal balance between thermal and mechanical performance due to a more stable pore structure. This study demonstrates that AAF mixture design should consider not only total porosity but also controlled pore architecture and Al-induced microstructural evolution.
Compared with previously reported AAF systems, the RTW-MW-based AAF developed in this study provides a competitive balance between thermal insulation capacity and mechanical performance. Although some highly porous AAFs reported in the literature achieve very low thermal conductivity, this improvement is generally accompanied by a considerable reduction in compressive strength. The present results suggest that the combined use of aluminosilicate-rich RTW and carbonate-rich MW facilitates the formation of a sufficiently stable initial matrix, allowing controlled pore development during Al-induced foaming. Therefore, the proposed RTW-MW-based AAF provides not only an effective waste valorization route but also a balanced solution for lightweight non-loadbearing building applications.
Table 5 presents a comparative analysis of the unit weight, thermal conductivity, and compressive strength of traditional partition wall materials and the AAFs developed in this study.
Conventional non-loadbearing wall materials generally exhibit unit weight ranging from 0.4 to 2.2 g/cm3, thermal conductivity ranging from 0.10 to 1.60 W/m·K, and compressive strength ranging from approximately 2.5 MPa to 20 MPa, depending on the material type. These ranges represent typical performance limits for materials used in partition wall applications. In the 70RTW:30MW-based AAF mixtures developed in this study, a significant decrease in unit weight and thermal conductivity was observed with increasing Al powder content. Unit weight decreased from 1.82 g/cm3 to 0.40 g/cm3, and thermal conductivity decreased from 0.99 W/m·K to 0.09 W/m·K. In contrast, compressive strength decreased progressively, from 15.5 MPa to 2.58 MPa. Therefore, the findings indicate a significant interaction between unit weight, thermal conductivity, and mechanical strength. Considering this multi-parameter interaction, the performance of the mixtures should be evaluated not on the basis of a single property but on the balance between thermal performance, low unit weight, and mechanical performance. Mixtures with the highest Al content (0.20% Al) exhibited low unit weight and low thermal conductivity, but the decrease in compressive strength to 2.58 MPa suggests that this mixture may have a more limited range of mechanical applications. In contrast, the 70RTW:30MW:0.15Al mixture offers a more balanced performance profile with a unit weight of 0.56 g/cm3, a thermal conductivity of 0.15 W/m·K, and a compressive strength of 3.12 MPa. These values indicate that this mixture can be classified as a lightweight building material, has a thermal conductivity comparable to that of common partition wall materials, and remains within acceptable limits in terms of mechanical strength. In this context, the 70RTW:30MW:0.15Al specimen can be considered the optimum mixture, providing an optimal balance between thermal insulation, low unit weight, and adequate mechanical performance.

3.3. Quantitative Sustainability Assessment of AAF Mixtures

3.3.1. Waste Incorporation and Resource Efficiency Assessment

The utilization of CDWs as precursors in AAF production, thereby reducing natural resource consumption and transforming waste into high-value-added construction materials, represents a significant sustainability strategy [55]. In this study, the waste incorporation ratio (WIR) was determined to quantitatively assess the resource efficiency and circular economy potential of AAFs. The WIR was calculated based on the mass balance principle of the recycled content approach specified in ISO 14021 [56]. The waste incorporation ratio represents the mass fraction of waste-derived materials incorporated into the corresponding material. In this context, two distinct indicators were defined: (i) precursor-based waste incorporation ratio (WIRp), and (ii) total mixture-based waste incorporation ratio (WIRt). WIRp refers to the proportion of waste-derived materials in the solid precursor used to produce the AAF, whereas WIRt represents the overall proportion of waste-derived materials in the entire mixture, including the alkaline activators and the foaming agent. The calculated WIR values for the optimum 70RTW:30MW:0.15Al mixture, which exhibited the most balanced combination of physical, mechanical, thermal, and microstructural performance, are presented in Table 6.
As shown in Table 6, the entire precursor phase (100%) of the AAF mixture consists of secondary raw materials (RTW and MW), indicating that no virgin precursor was required for binder production. When the entire mixture, including alkaline activators and Al powder, is taken into account, the total waste incorporation ratio reaches 79.9%. This result demonstrates the high waste incorporation potential of the produced AAF. These results indicate that RTW and MW can be considered not merely as low-level mineral additives, but as primary raw materials for AAF production. Thus, the developed AAF demonstrates significant sustainability potential through the reuse of CDW, the reduction in natural raw material consumption, and the enhancement of material circularity.

3.3.2. Material-Based Embodied Carbon Assessment

To quantitatively compare the environmental performance of the developed AAF, a simplified material-based embodied carbon assessment was conducted. The objective of this assessment was to compare the embodied carbon of the constituent materials used in the optimized mixture rather than to perform a comprehensive cradle-to-gate life-cycle assessment (LCA). Accordingly, the system boundary of the present assessment was deliberately limited to the raw materials incorporated into the binder formulation, namely RTW, MW, NaOH, and sodium silicate.
Within this defined system boundary, only the embodied carbon of the constituent materials was considered. Process-related emissions arising from waste collection, crushing, grinding, drying, mixing, thermal curing, transportation, equipment operation, packaging, and other manufacturing activities were intentionally excluded from the assessment. Consequently, the reported values should be interpreted as a comparative material-based sustainability indicator rather than the total carbon footprint of the entire production process. This simplified approach was adopted to evaluate the environmental benefits of replacing ordinary Portland cement (OPC) with construction and demolition waste-derived precursor materials while maintaining a transparent and reproducible calculation procedure.
The material-based embodied carbon of the optimized AAF mixture (ECAAF, kg CO2-eq) was calculated according to Equation (8):
E C A A F = i = 1 n ( m i × E F i )
where mi is the mass of the i material (kg), and EFi is the corresponding material emission factor (kg CO2-eq/kg).
The environmental benefit of the optimized AAF was evaluated by comparing its material-based embodied carbon with that of a conventional OPC binder containing the same binder mass (400 g). The comparison was made on an equivalent binder-mass basis rather than an equivalent strength basis because the developed AAF was specifically designed as a lightweight, non-load-bearing wall material intended to prioritize thermal insulation performance over structural load-carrying capacity.
The emission factors used for OPC, NaOH, and sodium silicate were adopted from Yang et al. [57]. RTW and MW were treated as secondary raw materials using a waste-allocation approach; therefore, the environmental burdens associated with their primary production were not allocated to the developed AAF mixture. Consequently, only the embodied carbon of the alkaline activators contributed to the material-based embodied carbon of the optimized AAF within the adopted system boundary. The quantities of each constituent material, the corresponding emission factors, the calculation procedure, and the individual embodied carbon contributions are summarized in Table 7.
The relative material-based embodied carbon reduction in the optimized AAF relative to the OPC reference binder was determined using Equation (9), which expresses the percentage reduction in embodied carbon within the defined material-based system boundary.
[(ECOPC − ECAAF)/(ECOPC)] × 100
where ECOPC is the material-based embodied carbon of the OPC reference binder (kg CO2-eq), and ECAAF is the material-based embodied carbon of the optimized AAF mixture (kg CO2-eq).
Based on the embodied carbon values presented in Table 7, the optimized 70RTW:30MW:0.15Al mixture exhibited a material-based embodied carbon of 0.129 kg CO2-eq, whereas the equivalent OPC reference binder exhibited 0.378 kg CO2-eq. Accordingly, the material-based embodied carbon reduction was calculated as:
[(0.378 − 0.129)/(0.378)] × 100 = 65.9%
This result indicates a 65.9% reduction in material-based embodied carbon relative to the OPC reference within the defined assessment boundary. The reduction primarily results from the complete replacement of Portland cement with waste-derived precursor materials (RTW and MW), while the alkaline activators remain the main contributors to the embodied carbon of the developed AAF. Therefore, although the proposed mixture demonstrates a substantial environmental advantage in terms of constituent material selection, the reported reduction should not be interpreted as the total carbon footprint reduction in the overall production process because process-related emissions were intentionally excluded from the scope of the present assessment. These results nevertheless demonstrate that the combined utilization of RTW and MW enables the production of an eco-efficient alkali-activated foam with a high waste incorporation ratio and considerably lower material-based embodied carbon than a conventional OPC binder of equivalent mass.

3.3.3. Eco-Efficiency Performance Assessment

Reducing embodied carbon alone does not provide a comprehensive evaluation of the sustainability of construction materials. Therefore, environmental performance should be interpreted together with the material’s functional performance. Eco-efficiency assessments have consequently become a widely adopted approach for simultaneously considering environmental impact and engineering performance, thereby enabling more meaningful comparisons among alternative cementitious materials [58,59]. In particular, expressing embodied carbon per unit compressive strength provides an effective indicator for comparing materials with different levels of mechanical performances and has been widely applied in sustainability assessments of cement-based materials [60].
In the present study, the material-based embodied carbon of the optimized AAF was additionally normalized by its compressive strength to facilitate the interpretation of its environmental efficiency. Unlike the absolute material-based embodied carbon value, this normalization relates the environmental impact associated with the constituent materials to the mechanical performance of the developed AAF. Since the primary objective of the proposed material is the production of a lightweight non-load-bearing wall element with enhanced thermal insulation performance, the dry-state thermal conductivity was also considered alongside the environmental indicators to provide a more comprehensive assessment of its eco-efficiency.
The material-based embodied carbon per unit compressive strength (kg CO2-eq/MPa) was calculated according to Equation (11):
ECAAF/Cs
where Cs is the compressive strength of the specimen in MPa.
The material-based environmental indicators together with the principal functional properties of the optimized AAF are summarized in Table 8.
The results demonstrate that the developed RTW-MW-based AAF successfully combines high waste incorporation with improved material-level environmental performance while maintaining the functional properties required for its intended application. The optimized mixture incorporates 79.9% waste-derived materials and exhibits a material-based embodied carbon of 0.129 kg CO2-eq, corresponding to a 65.9% reduction in material-based embodied carbon relative to the OPC reference binder within the defined material-based system boundary. Furthermore, the normalized material-based embodied carbon (0.041 kg CO2-eq/MPa) indicates that the environmental benefit is achieved while maintaining adequate mechanical performance for lightweight non-load-bearing wall applications. When considered together with the measured dry-state thermal conductivity of 0.15 W/m·K, these results demonstrate that the proposed AAF offers an effective balance between resource efficiency, environmental performance, mechanical adequacy, and thermal insulation performance.

4. Conclusions

The principal conclusions of this study are as follows:
The first-stage results showed that MW addition improved the compactness and mechanical integrity of the RTW-based binder matrix. Increasing MW content reduced porosity and water absorption, while increasing unit weight, ultrasound pulse velocity, compressive strength, and flexural strength. FTIR and XRD results indicated that MW predominantly acted as a low-reactivity carbonate-rich micro-filler rather than forming new crystalline reaction products. Accordingly, the 70RTW:30MW:0Al mixture was selected as the most suitable starting matrix for AAF production.
In the second stage, Al powder addition effectively promoted pore formation and significantly reduced unit weight and the dry-state thermal conductivity. However, the effect of Al content was not linear. While increasing Al content enhanced porosity, excessive gas generation at higher Al contents promoted pore coalescence, irregular pore growth, and increased pore interconnectivity. This weakened solid-phase continuity and resulted in considerable reductions in ultrasound pulse velocity and mechanical strength.
The pre-foaming results showed a close relationship between expansion behavior and final porosity, indicating that pre-foaming measurements may serve as a practical indicator for assessing pore structure development in AAFs. Furthermore, correlations between dry-state thermal conductivity and unit weight, porosity, and compressive strength indicate that the dry-state thermal performance is controlled not only by total pore volume but also by pore size distribution and solid-phase continuity.
The 70RTW:30MW:0.15Al specimen exhibited the most balanced performance in terms of pore structure, physical and mechanical properties, and dry-state thermal insulation potential. Although the AAF containing 0.20% Al exhibited the lowest dry-state thermal conductivity, the significant loss of mechanical strength indicates that thermal conductivity alone should not be considered the sole criterion for optimal material selection. Therefore, the design of RTW-MW-based AAFs should aim not only to achieve high porosity but also to develop a controlled pore structure that maintains a balance between mechanical integrity and thermal performance.
In terms of quantitative sustainability performance, the optimized 70RTW:30MW:0.15Al mixture achieved a precursor-based waste incorporation ratio of 100% and a total mixture-based waste incorporation ratio of 79.9%, demonstrating its high resource efficiency and circular economy potential. Within the defined material-based system boundary adopted in this study, the optimized mixture exhibited a material-based embodied carbon of 0.129 kg CO2-eq, corresponding to a 65.9% reduction in material-based embodied carbon relative to an OPC reference binder of equivalent binder mass. This reduction reflects the environmental benefit associated with replacing Portland cement with waste-derived precursor materials and should be interpreted within the scope of the adopted material-based assessment rather than as the total carbon footprint of the complete production process. When normalized by compressive strength, the material-based embodied carbon was 0.041 kg CO2-eq/MPa, indicating that the environmental benefit was achieved while maintaining adequate functional performance for lightweight non-load-bearing wall applications.
In addition, the sustainability assessment presented in this study was intentionally limited to a material-based embodied carbon evaluation within a defined system boundary. Process-related emissions associated with waste processing, grinding, transportation, mixing, thermal curing, and equipment operation were beyond the scope of the present assessment. Future studies should extend the environmental evaluation by incorporating these process-related stages to develop a comprehensive cradle-to-gate LCA of RTW-MW-based AAFs.
Although the present study demonstrates the influence of aluminum powder content on pore development and the resulting mechanical and thermal performance, fresh-state rheological parameters (e.g., yield stress, plastic viscosity, and setting time) were not evaluated. Since these parameters govern hydrogen bubble retention, growth, and coalescence during chemical foaming, future studies should investigate the relationship between fresh-state rheology, pore evolution, and the properties of hardened AAFs.
RTW-MW-based AAFs show promise for use in lightweight non-loadbearing wall applications owing to their favorable dry-state thermal insulation performance and eco-efficient composition. It should be noted, however, that the reported thermal conductivity values correspond to dry-state measurements obtained after specimen drying. Since the foamed mixtures exhibited relatively high water absorption, moisture ingress during service may increase the effective thermal conductivity and reduce the insulation performance under practical operating conditions. Therefore, future studies should investigate the thermal behavior and durability of these materials under realistic moisture exposure, including wetting–drying cycles, freeze–thaw conditions, and long-term service environments.
Overall, this study demonstrates a novel and practical approach for simultaneously valorizing roof tile and marble wastes into lightweight insulating alkali-activated foams with balanced mechanical, thermal, and environmental performance, thereby contributing to the development of more resource-efficient construction materials.

Funding

This work has been supported by Kocaeli University Scientific Research Projects Coordination Unit under grant number FBA-2026-5074. The APC was funded by Kocaeli University Scientific Research Projects Coordination Unit.

Institutional Review Board Statement

Not applicable.

Informed Consent Statement

Not applicable.

Data Availability Statement

The original contributions presented in this study are included in the article. Further inquiries can be directed to the corresponding author.

Acknowledgments

The author gratefully acknowledges Merck Chemicals for providing the sodium hydroxide and sodium silicate used in this study. The author also thanks Ytong A.Ş. for supplying the aluminum powder foaming agent. The author also acknowledges the Kocaeli University Scientific Research Projects Coordination Unit for supporting the APC.

Conflicts of Interest

The author declares no conflicts of interest.

Abbreviations

The following abbreviations are used in this manuscript:
AABAlkali-activated binder
AAFAlkali-activated foam
AlAluminum powder
ATRAttenuated total reflectance
BWBrick waste
CCCalcined clay
CDWConstruction and demolition waste
FAFly ash
FTIRFourier-transform infrared spectroscopy
GGBSGround granulated blast furnace slag
LCALife cycle assessment
LOILoss on ignition
MMolarity
MIPMercury intrusion porosimetry
MKMetakaolin
MWMarble waste
OPCOrdinary Portland cement
PEPolyethylene
PSTPorcelain stoneware tile
RHRelative humidity
RHARice husk ash
RTWRoof tile waste
SFSilica fume
UPVUltrasound pulse velocity
WARWater absorption ratio
WGCWaste green ceramic
XRDX-ray diffraction
XRFX-ray fluorescence

References

  1. Georgiades, M.; Shah, I.H.; Steubing, B.; Cheeseman, C.; Myers, R.J. Prospective life cycle assessment of European cement production. Resour. Conserv. Recycl. 2023, 194, 106998. [Google Scholar] [CrossRef]
  2. Sbahieh, S.; McKay, G.; Al-Ghamdi, S.G. Comprehensive analysis of geopolymer materials: Properties, environmental impacts, and applications. Materials 2023, 16, 7363. [Google Scholar] [CrossRef] [PubMed]
  3. Liu, J.; Liu, B.; Li, Q.; Zhang, Q.; An, C.; Sun, Z.; Wei, S.; Fan, J. Review of solid waste-based geopolymers: Preparation, deterioration and durability. Mater. Today Commun. 2025, 43, 111820. [Google Scholar] [CrossRef]
  4. Sbi, S.; Aboulayt, A.; Ounacer, M.; Manoun, B.; Sajieddine, M.; Mansouri, S.; Samih, Y.; Semlal, N.; Kriven, W.M.; Tamraoui, Y.; et al. Assessing the long-term structural changes of metakaolin geopolymers encapsulating pyrite cinder: Environmental, microstructural and structure studies. Sustain. Mater. Technol. 2025, 45, e01459. [Google Scholar] [CrossRef]
  5. Ma, X.; Yang, Y. Single-component low-carbon sustainable geopolymer synthesis using calcium carbide residue, gypsum, sewage sludge ash, and ground granulated blast slag. Sustain. Mater. Technol. 2025, 43, e01314. [Google Scholar] [CrossRef]
  6. Pacheco-Torgal, F. Introduction to handbook of alkali-activated cements, mortars and concretes. In Handbook of Alkali-Activated Cements, Mortars and Concretes, 2nd ed.; Pacheco-Torgal, F., Labrincha, J.A., Leonelli, C., Palomo, A., Chindaprasirt, P., Eds.; Woodhead Publishing Limited: Cambridge, UK, 2015; Volume 1, pp. 1–16. [Google Scholar]
  7. Santos, A.; Andrejkovičová, S.; Řimnáčová, D.; Perná, I.; Almeida, F.; Rocha, F. Synthesis and characterization of lightweight foamed geopolymers from iron tailings for energy-efficient construction. J. Build. Eng. 2026, 120, 115414. [Google Scholar] [CrossRef]
  8. Soto-Paz, J.; Arroyo, O.; Torres-Guevara, L.E.; Parra-Orobio, B.A.; Casallas-Ojeda, M. The circular economy in the construction and demolition waste management: A comparative analysis in emerging and developed countries. J. Build. Eng. 2023, 78, 107724. [Google Scholar] [CrossRef]
  9. Faraji, M.F.; Türkel, I.; Ozkan, I.G.M.; Bayraktar, O.Y.; Kaplan, G.; Bayram, M.; Aydın, A.C.; Ozbakkaloglu, T. Fly ash and waste brick powder-based one-part geopolymer foam concrete with enhanced thermal performance: A circular approach to construction and demolition waste utilization. J. Build. Eng. 2026, 117, 114850. [Google Scholar] [CrossRef]
  10. Simão, L.; Hotza, D.; Ribeiro, M.J.; Novais, R.M.; Montedo, O.R.K.; Raupp-Pereira, F. Development of new geopolymers based on stone cutting waste. Constr. Build. Mater. 2020, 257, 119525. [Google Scholar] [CrossRef]
  11. Altheeb, A. Engineering attributes of alkali-activated mortars containing ceramic tiles waste as aggregates replacement: Effect of high-volume fly ash inclusion. Mater. Today Proc. 2023, 1–9. [Google Scholar]
  12. Sarkar, M.; Dana, K. Partial replacement of metakaolin with red ceramic waste in geopolymer. Ceram. Int. 2021, 47, 3473–3483. [Google Scholar] [CrossRef]
  13. Fugazzotto, M.; Cultrone, G.; Mazzoleni, P.; Barone, G. Suitability of ceramic industrial waste recycling by alkaline activation for use as construction and restoration materials. Ceram. Int. 2023, 49, 9465–9478. [Google Scholar] [CrossRef]
  14. Geraldo, R.H.; Ouellet-Plamondon, C.; Muianga, E.A.D.; Camarini, G. Alkali-activated binder containing wastes: A study with rice husk ash and red ceramic. Cerâmica 2017, 63, 44–51. [Google Scholar] [CrossRef]
  15. Khater, H.M.; Elnagar, A.M. Optimization of alkali activated grog/ceramic wastes geopolymer bricks. Int. J. Innov. Res. Sci. Eng. Technol. 2016, 5, 37–46. [Google Scholar]
  16. Bezerra, B.P.; Soares, G.; Morelli, M.R.; Da Luz, A.P. Recycling of roof tile waste in the manufacturing of high-temperature metakaolin-based geopolymer composites. Cerâmica 2023, 69, 242–247. [Google Scholar] [CrossRef]
  17. Abadel, A.A.; Alghamdi, H. Effect of high volume tile ceramic wastes on resistance of geopolymer mortars to abrasion and freezing-thawing cycles: Experimental and deep learning modelling. Ceram. Int. 2023, 49, 15065–15081. [Google Scholar] [CrossRef]
  18. Li, X.; Bai, C.; Qiao, Y.; Wang, X.; Yang, K.; Colombo, P. Preparation, properties and applications of fly ash-based porous geopolymers: A review. J. Clean. Prod. 2022, 359, 132043. [Google Scholar] [CrossRef]
  19. Novais, R.M.; Pullar, R.C.; Labrincha, J.A. Geopolymer foams: An overview of recent advancements. Prog. Mater. Sci. 2020, 109, 100621. [Google Scholar] [CrossRef]
  20. Lertcumfu, N.; Kaewapai, K.; Jaita, P.; Tunkasiri, T.; Sirisoonthorn, S.; Rujijanagul, G. Effects of olive oil on physical and mechanical properties of ceramic waste-based geopolymer foam. J. Reinf. Plast. Compos. 2019, 39, 111–118. [Google Scholar] [CrossRef]
  21. Horvat, B.; Ducman, V. Potential of green ceramics waste for alkali activated foams. Materials 2019, 12, 3563. [Google Scholar] [CrossRef] [PubMed]
  22. Masi, G.; Tugnoli, A.; Bignozzi, M.C. Lightweight alkali activated composites by direct foaming based on ceramic tile waste and fly ash. Ceram. Int. 2024, 50, 55410–55420. [Google Scholar] [CrossRef]
  23. Li, Z. Resource utilization of red mud in low-carbon binders: A review of reaction mechanisms, performance, and microstructure. Buildings 2026, 16, 2140. [Google Scholar] [CrossRef]
  24. ASTM C618; Standard Specification for Coal Fly Ash and Raw or Calcined Natural Pozzolan for Use in Concrete. ASTM International: West Conshohocken, PA, USA, 2023.
  25. Kaya, M.; Köksal, F.; Bayram, M.; Nodehi, M.; Gencel, O.; Ozbakkaloglu, T. The effect of marble powder on physico-mechanical and microstructural properties of kaolin-based geopolymer pastes. Struct. Concr. 2023, 24, 6485–6504. [Google Scholar]
  26. Alharthy, S.E.; Hodhod, O.A.; Abdelkadir, B.A. Developing a geopolymer pastes using marble dust. Water Sci. 2022, 36, 144–153. [Google Scholar] [CrossRef]
  27. Duxson, P.; Fernández-Jiménez, A.; Provis, J.L.; Lukey, G.C.; Palomo, A.; van Deventer, J.S.J. Geopolymer technology: The current state of the art. J. Mater. Sci. 2007, 42, 2917–2933. [Google Scholar] [CrossRef]
  28. Siyal, A.A.; Radin Mohamed, R.M.S.; Shamsuddin, R.; Ridzuan, M.B. A comprehensive review of synthesis kinetics and formation mechanism of geopolymers. RSC Adv. 2024, 14, 446–462. [Google Scholar] [CrossRef] [PubMed]
  29. Tayyab, S.; Ferdous, W.; Lokuge, W.; Ngo, T.; Gerdes, A.; Manalo, A. Influence of mix design parameters on fresh and hardened properties of geopolymer concrete: A state-of-the-art review. Polymers 2026, 18, 854. [Google Scholar] [CrossRef] [PubMed]
  30. Chen, G.; Luo, R.; Cai, Y.; Lin, J.X.; Guo, Y.C. Workability and mechanical properties of alkali-activated materials: Regulatory mechanisms dominated by composite alkali activator. Constr. Build. Mater. 2025, 505, 144672. [Google Scholar] [CrossRef]
  31. Zhang, Z.; Provis, J.L.; Reid, A.; Wang, H. Geopolymer foam concrete: An emerging material for sustainable construction. Constr. Build. Mater. 2014, 56, 113–127. [Google Scholar] [CrossRef]
  32. TS EN 1015-10; Methods of Test for Mortar for Masonry—Part 10: Determination of Dry Bulk Density of Hardened Mortar. Turkish Standards Institution: Ankara, Türkiye, 2001.
  33. TS EN 13755; Natural Stone Test Methods—Determination of Water Absorption at Atmospheric Pressure. Turkish Standards Institution: Ankara, Türkiye, 2008.
  34. TS 699; Natural Building Stones—Methods of Inspection and Laboratory Testing. Turkish Standards Institution: Ankara, Türkiye, 2009.
  35. TS EN 14579; Natural Stone Test Methods—Determination of Sound Speed Propagation. Turkish Standards Institution: Ankara, Türkiye, 2005.
  36. TS EN 196-1; Methods of Testing Cement—Part 1: Determination of Strength. Turkish Standards Institution: Ankara, Türkiye, 2016.
  37. ASTM C518-17; Standard Test Method for Steady-State Thermal Transmission Properties by Means of the Heat Flow Meter Apparatus. ASTM International: West Conshohocken, PA, USA, 2017.
  38. Statistical Rejection of “Bad” Data–Chauvenet’s Criterion. Available online: https://www.waterproperties.ca/osd_data_archive/Cruise_Data/2009/2009-020/DOC/Individual%20Reports/chauvenet.pdf (accessed on 12 April 2026).
  39. Kabirova, A.; Uysal, M.; Hüsem, M.; Aygörmez, Y.; Dehghanpour, H.; Pul, S.; Canpolat, O. Physical and mechanical properties of metakaolin-based geopolymer mortars containing various waste powders. Eur. J. Environ. Civ. Eng. 2023, 27, 437–456. [Google Scholar]
  40. Uysal, M.; Aygörmez, Y.; Canpolat, O.; Cosgun, T.; Kuranlı, O.F. Investigation of using waste marble powder, brick powder, ceramic powder, glass powder, and rice husk ash as eco-friendly aggregate in sustainable red mud-metakaolin based geopolymer composites. Constr. Build. Mater. 2022, 361, 129718. [Google Scholar] [CrossRef]
  41. Mahmood, A.Z.; Babaee, M.; Foster, S.J.; Castel, A. Capturing the early-age physicochemical transformations of alkali-activated fly ash and slag using ultrasonic pulse velocity technique. Cem. Concr. Compos. 2022, 130, 104529. [Google Scholar] [CrossRef]
  42. Krol, M.; Minkiewicz, J.; Mozgawa, W. IR spectroscopy studies of zeolites in geopolymeric materials derived from kaolinite. J. Mol. Struct. 2016, 1126, 200–206. [Google Scholar] [CrossRef]
  43. Vasić, M.V.; Terzić, A.; Radovanović, Ž.; Radojević, Z.; Warr, L.N. Alkali-activated geopolymerization of a low illitic raw clay and waste brick mixture. An alternative to traditional ceramics. Appl. Clay Sci. 2022, 218, 106410. [Google Scholar] [CrossRef]
  44. Xu, Z.; Jiang, Z.; Wu, D.; Peng, X.; Xu, Y.; Li, N.; Qi, Y.; Li, P. Immobilization of strontium-loaded zeolite A by metakaolin based-geopolymer. Ceram. Int. 2017, 43, 4434–4439. [Google Scholar] [CrossRef]
  45. Kaya, M.; Munir, M.J.; Kazmi, S.M.S.; Gencel, O. Valorization of tile waste in geopolymer mortars: A sustainable approach using marble powder, fly ash, and silica fume. Powder Technol. 2026, 469, 121866. [Google Scholar] [CrossRef]
  46. Hu, X.; Ge, X.; Zhou, M.; Zhang, Y.; Wang, Y.; Yang, H.; Zhang, Y. Recycling hazardous secondary aluminum dross as a functional foaming agent in fly ash/slag-based foamed geopolymer concrete. J. Build. Eng. 2026, 120, 115558. [Google Scholar] [CrossRef]
  47. Ramakrishnan, S.; Ramesh, A.; Pasupathy, K.; Manalo, A.C.; Sanjayan, J. Regulating the chemical foaming and pore distribution in aerated geopolymer concrete. Mater. Today Sustain. 2026, 33, 101276. [Google Scholar] [CrossRef]
  48. Provis, J.L.; van Deventer, J.S.J. Alkali Activated Materials: State-of-the-Art Report, RILEM TC 224-AAM, 1st ed.; Springer: Dordrecht, The Netherlands, 2014; pp. 34–69. [Google Scholar]
  49. Chen, S.; Ruan, S.; Zeng, Q.; Liu, Y.; Zhang, M.; Tian, Y.; Yan, D. Pore structure of geopolymer materials and its correlations to engineering properties: A review. Constr. Build. Mater. 2022, 328, 127064. [Google Scholar] [CrossRef]
  50. Zhang, Z.; Wang, H. The pore characteristics of geopolymer foam concrete and their impact on the compressive strength and modulus. Front. Mater. 2016, 3, 38. [Google Scholar] [CrossRef]
  51. Liu, J.; Liu, Y.; Ma, X.; Xu, H.; Wu, X.; Liu, M.; Zhuge, Y. Thermal performance optimisation of foam concrete for energy-efficient construction: A state-of-the-art review. J. Build. Eng. 2025, 112, 113899. [Google Scholar] [CrossRef]
  52. Pasupathy, K.; Ramakrishnan, S.; Sanjayan, J. Formulating eco-friendly geopolymer foam concrete by alkali-activation of ground brick waste. J. Clean. Prod. 2021, 325, 129180. [Google Scholar] [CrossRef]
  53. Dang, J.; Tang, X.; Xiao, J.; Han, A. Influence of alkaline activator and precursor on the foam characterization and alkali-activated foamed concrete properties. Cem. Concr. Compos. 2024, 145, 105341. [Google Scholar] [CrossRef]
  54. TS 825; Thermal Insulation Requirements for Buildings—Rules for Heat Insulation in Buildings. Turkish Standards Institution: Ankara, Türkiye, 2024.
  55. Bernal, S.A.; Rodríguez, E.D.; Kirchheim, A.P.; Provis, J.L. Management and valorisation of wastes through use in producing alkali-activated cement materials. J. Chem. Technol. Biotechnol. 2016, 91, 2365–2388. [Google Scholar] [CrossRef]
  56. ISO 14021:2016; Environmental Labels and Declarations—Self-Declared Environmental Claims (Type II Environmental Labelling). International Organization for Standardization: Geneva, Switzerland, 2016.
  57. Yang, K.H.; Song, J.K.; Song, K. Assessment of CO2 reduction of alkali-activated concrete. J. Clean. Prod. 2013, 39, 265–272. [Google Scholar] [CrossRef]
  58. Suarez-Riera, D.; Restuccia, L.; Falliano, D.; Ferro, G.A.; Tuliani, J.-M.; Pavese, M.; Lavagna, L. An overview of methods to enhance the environmental performance of cement-based materials. Infrastructures 2024, 9, 94. [Google Scholar] [CrossRef]
  59. Miller, S.A.; Juenger, M.; Kurtis, K.E.; Weiss, J. Cement and alternatives in the anthropocene. Annu. Rev. Environ. Resour. 2024, 49, 309–335. [Google Scholar] [CrossRef]
  60. Purnell, P.; Black, L. Embodied carbon dioxide in concrete: Variation with common mix design parameters. Cem. Concr. Res. 2012, 42, 874–877. [Google Scholar] [CrossRef]
Figure 1. XRD patterns of (a) RTW and (b) MW.
Sustainability 18 07458 g001
Figure 2. Particle size distributions of RTW and MW.
Sustainability 18 07458 g002
Figure 3. Flowchart of the AAF specimen fabrication.
Sustainability 18 07458 g003
Figure 4. Schematic illustration of the custom-built heat flow meter apparatus used for thermal conductivity measurements according to ASTM C518-17.
Sustainability 18 07458 g004
Figure 5. Changes in properties of AABs as a function of MW content: (a) Physical properties. (b) Mechanical properties.
Sustainability 18 07458 g005
Figure 6. Variation in ultrasound pulse velocity and unit weight as a function of compressive strength in RTW-MW-based AABs.
Sustainability 18 07458 g006
Figure 7. FTIR spectra of the selected specimens: (a) Reference specimen (100RTW:0MW:0Al). (b) 90RTW:10MW:0Al. (c) 70RTW:30MW:0Al.
Sustainability 18 07458 g007
Figure 8. XRD results of the selected specimens: (a) Reference specimen (100RTW:0MW:0Al). (b) 90RTW:10MW:0Al. (c) 70RTW:30MW:0Al.
Sustainability 18 07458 g008
Figure 9. Time-dependent expansion behavior of AAFs at different Al contents.
Sustainability 18 07458 g009
Figure 10. Relationship between pre-foaming expansion height and the final porosity of AAFs containing different amounts of Al powder.
Sustainability 18 07458 g010
Figure 11. Changes in properties of AAFs as a function of Al content: (a) Physical properties. (b) Mechanical properties.
Sustainability 18 07458 g011
Figure 12. Optical microstructure of AAFs with varying Al powder contents: (a) Reference specimen without Al. (b) 0.05% Al. (c) 0.20% Al. Illustrating the transition from relatively uniform, spherical pores to larger, irregular, and interconnected pore structures with increasing gas generation and pore coalescence.
Sustainability 18 07458 g012
Figure 13. Effect of Al content on the pore size distribution of AAFs.
Sustainability 18 07458 g013
Figure 14. Effect of Al content on the pore volume fractions of AAFs.
Sustainability 18 07458 g014
Figure 15. Changes in dry-state thermal conductivity of AAFs as a function of Al content.
Sustainability 18 07458 g015
Figure 16. Relationships between thermal conductivity and: (a) Unit weight. (b) Porosity. (c) Compressive strength of AAFs.
Sustainability 18 07458 g016
Table 1. The main chemical composition of the raw materials.
Chemical Composition (%)SiO2Al2O3Fe2O3CaOMgOK2ONa2OTiO2ZrO2LOI
RTW72.3316.401.141.670.621.872.830.750.362.03
MW0.340.17-55.800.26-- -43.43
Table 2. Experimental stages and mix proportions of the specimens.
StageSpecimen CodeRTW (g)MW (g)NaOH Solution (7.5 M) (g)Sodium Silicate Solution (g)Additional Water (g)Al Powder (g)Total Liquid: Binder RatioEffective Total Water: Binder RatioActivator: Binder Ratio
I100RTW:0MW:0Al400033.366.620.100.300.231:4
90RTW:10MW:0Al36040
85RTW:15MW:0Al34060
80RTW:20MW:0Al32080
75RTW:25MW:0Al300100
70RTW:30MW:0Al280120
II70RTW:30MW:0.05Al2801200.2
70RTW:30MW:0.10Al0.4
70RTW:30MW:0.15Al0.6
70RTW:30MW:0.20Al0.8
Note: The Al content was calculated as a percentage of the total binder mass (RTW + MW).
Table 3. Pore volumes of AAFs obtained from the MIP test.
SpecimensPore Volume (mL/g)Total Pore Volume (mL/g)
0.002–0.1 µm (Level-3)0.1–10 µm
(Level-2)
≥10 µm
(Level-1)
70RTW:30MW:0Al0.3000.0150.0210.336
70RTW:30MW:0.05Al0.2600.0840.1380.482
70RTW:30MW:0.10Al0.2250.1700.2460.641
70RTW:30MW:0.15Al0.1900.2300.3300.750
70RTW:30MW:0.20Al0.1650.2550.4100.830
Table 4. Comparison of physical performance and pore development mechanisms of AAFs produced using different foaming strategies.
Ref.PrecursorFoaming Agent
(wt%)
Unit Weight (g/cm3)Porosity (%)Thermal Conduct.
(W/m·K)
Compressive Strength (MPa)Pore-Forming MechanismDominant Pore Feature
[20]CC + MKH2O2 (0.24)0.73–0.8263–69-3.64–7.60O2 releaseClosed spherical pores
[21]WGCNa-perborate (5)0.80--1.70Hydrolysis-induced O2 generationUniform fine pore network
H2O2 (10)0.704.60O2 releaseFine and relatively homogeneous pores
Al (1)0.702.80H2 releaseLarge closed macropores
[22]FA + PSTH2O2 (0.5–2.5)1.05–1.20---O2 releaseUniform macropore distribution
Na-bicarbonate (5–10)1.07–1.28---CO2 generation by thermal decompositionElongated and unstable macropores
Al (0.2–1)1.09–1.29---H2 releaseNon-uniform localized macro voids
[52]BWAl (0.15)0.77–0.83-0.22–0.270.70–2.42H2 releaseFine spherical pores
[53]GGBS + BWPrecast foam (0.17)-650.11–0.121.33–3.34Bubble stability-controlled pore formationSpherical closed pores at low alkalinity; irregular interconnected pores at high alkalinity
This studyRTW + MWAl powder (0.05–0.2)0.40–1.0530.1–62.10.09–0.382.58–8.95H2 evolution; matrix stability controlledFine and spherical pores at low Al contents; larger, irregular, and partially interconnected macropores at high Al contents.
CC: Calcined clay; MK: Metakaolin; WGC: Waste green ceramic; FA: Fly ash; PST: Porcelain stoneware tile; BW: Brick waste.
Table 5. Comparative evaluation of unit weight, thermal conductivity, and compressive strength of conventional non-loadbearing wall materials and AAFs.
Non-loadbearing Wall MaterialsUnit Weight (g/cm3)Thermal Conduct.
(W/m·K)
Compressive Strength (MPa)
Lightweight aggregate concrete [54]0.8–2.00.39–1.6>4.0
Pumice concrete [54]0.4–1.30.11–0.462.5–7.5
Autoclaved aerated concrete [54]0.4–1.00.10–0.30>4.0
Clay-based perforated brick [54]0.6–1.00.33–0.452.5–5.0
Sand-lime brick [54]0.7–2.20.35–1.305.0–20.0
70RTW:30MW:0Al1.820.9915.5
70RTW:30MW:0.05Al1.050.388.95
70RTW:30MW:0.10Al0.740.214.89
70RTW:30MW:0.15Al0.560.153.12
70RTW:30MW:0.20Al0.400.092.58
Table 6. Quantitative waste utilization indicators for the 70 RTW:30 MW:0.15 Al specimen.
Waste Incorporation ParameterEquationCalculationResult (%)
WIRpWIRp = [(mRTW + mMW)/(mprecursor)] × 100WIRp = [(280 + 120)/(400)] × 100100
WIRtWIRt = [(mRTW + mMW)/(mtotal mixture)] × 100WIRt = [(280 + 120)/(280 + 120 + 33.3 + 66.6 + 0.6)] × 10079.9
Table 7. Material-based embodied carbon calculation for the optimized 70RTW:30MW:0.15Al mixture within the defined system boundary.
ComponentAmount (kg)Emission Factor (EF, kg CO2-eq/kg)CalculationCO2 Contribution (kg CO2-eq)
RTW0.28000.280 × 00
MW0.12000.120 × 00
NaOH0.0331.232 [57]0.033 × 1.2320.041
Na2SiO30.0661.320 [57]0.066 × 1.3200.088
ECAAF 0.129
ECOPC0.4000.944 [57]0.400 × 0.9440.378
EF = material emission factor. RTW and MW were treated as secondary raw materials; therefore, environmental burdens associated with their primary production were not allocated to the developed AAF. The present assessment was performed using a material-based system boundary that included only the constituent materials incorporated into the optimized mixture. Emissions associated with waste collection, crushing, grinding, drying, mixing, thermal curing, transportation, equipment operation, packaging, and other manufacturing activities were intentionally excluded. Accordingly, the reported values represent a simplified material-based embodied carbon assessment rather than a complete cradle-to-gate LCA.
Table 8. Summary of material-based environmental and functional sustainability indicators of the optimized 70RTW:30MW:0.15Al specimen.
Environmental/Functional IndicatorValueUnitInterpretation
WIRt79.9%High waste utilization capacity
Material-based embodied carbon (ECAAF)0.129kg CO2-eqMaterial-based embodied carbon within the defined system boundary
Material-based embodied carbon reduction65.9%Relative to the OPC reference binder (material-based assessment)
Material-based embodied carbon per unit compressive strength (EC/Cs)0.129/3.12 = 0.041kg CO2-eq/MPaEnvironmental efficiency normalized by compressive strength
Compressive strength3.12MPaSuitable for lightweight non-loadbearing wall
Thermal conductivity0.15W/m·KHigh thermal insulation performance under dry conditions
Disclaimer/Publisher’s Note: The statements, opinions and data contained in all publications are solely those of the individual author(s) and contributor(s) and not of MDPI and/or the editor(s). MDPI and/or the editor(s) disclaim responsibility for any injury to people or property resulting from any ideas, methods, instructions or products referred to in the content.