Skip to Content
SustainabilitySustainability
  • Article
  • Open Access

21 July 2026

29 Pages

Spatiotemporal Evolution and Driving Mechanisms of Rural Green Development in the Ecological Green Heart of the Chang-Zhu-Tan Urban Agglomeration, China

,
,
,
and
School of Civil and Environmental Engineering, Hunan University of Technology, Zhuzhou 412007, China
*
Author to whom correspondence should be addressed.

Abstract

Rural green development is essential for coordinating ecological protection, rural revitalisation and spatial governance in ecological spaces within urban agglomerations. Taking the Chang-Zhu-Tan Ecological Green Heart region in China as a case study, this study evaluates rural green development in 10 counties, county-level cities and districts from 2013 to 2022. A combined weighting–TOPSIS model is used to measure development levels, while Global Moran’s I, the Theil index and XGBoost–SHAP are applied to examine spatial patterns, regional disparities and key associated factors. The results show that rural green development improved overall, with the regional average index increasing from 0.315 in 2013 to 0.378 in 2022. High-value areas gradually expanded, and the Changsha group formed the main high-value core, but no statistically significant global spatial clustering was identified. Regional disparities narrowed during the study period, although intra-group disparities, especially within the Zhuzhou group, remained the main source of imbalance. Human capital, medical resources, income level, urbanisation level, PM2.5 concentration and pesticide use intensity were closely associated with rural green development, with socioeconomic factors generally contributing positively and environmental pressures acting as constraints. These findings suggest that rural green development in ecological green heart regions is a spatially differentiated and multi-factor process, providing empirical evidence for differentiated county-level governance, coordinated ecological protection and rural green transformation in urban agglomerations.

1. Introduction

Rural green development has become an important issue in sustainable development, ecological civilisation and rural revitalisation. With accelerating urbanisation and increasing ecological protection requirements, rural areas are no longer simply spaces of agricultural production and residential settlement. They also perform important functions in ecological conservation, resource regulation, landscape maintenance and regional environmental security [1]. In ecologically sensitive areas where urban–rural interactions are intensive, rural development is therefore not merely a matter of economic growth, but involves the coordination of industrial development, resource use, rural construction and ecological protection [2]. Rural green development should thus be understood as a multidimensional process shaped by socioeconomic conditions, ecological constraints, the rural built environment and spatial governance [3].
Existing studies have provided important foundations for understanding rural green development. Evaluation-oriented research has constructed multidimensional indicator systems to assess green development from the perspectives of economic development, resource utilisation, ecological environment, agricultural production and social welfare [4,5,6]. Spatially oriented research has examined regional heterogeneity through spatial visualisation, spatial autocorrelation analysis, inequality decomposition and spatial econometric models [4,7,8]. Mechanism-oriented research has further explored the effects of income level, industrial structure, urbanisation, technological progress, public service provision, environmental regulation and agricultural inputs on rural green development [9,10,11]. These studies have advanced the measurement and interpretation of rural green development. Nevertheless, existing research still tends to treat level measurement, spatial differentiation and driving mechanisms as relatively separate analytical issues [12]. As a result, rural green development is often understood as a measurable outcome, while the process through which ecological protection, resource allocation, rural construction and socioeconomic transformation jointly shape spatial differences remains insufficiently explained [13].
The Chang-Zhu-Tan Ecological Green Heart region provides a typical case for examining this issue. Located at the intersection of Changsha, Zhuzhou and Xiangtan, this region is an important ecological barrier and ecological hub within the Chang-Zhu-Tan urban agglomeration. It undertakes key ecological conservation and environmental regulation functions, while also containing rural settlements, agricultural production spaces and areas undergoing rural construction [14]. Unlike ordinary rural areas, this region is embedded in the interaction between urban expansion and ecological protection. Its rural green development is shaped not only by local economic and agricultural conditions but also by ecological functions, infrastructure networks, public service allocation, land-use regulation and regional coordination [15,16]. In recent years, rural construction and ecological protection in this region have continued to advance. However, counties and districts still differ considerably in economic foundation, resource endowment, public service provision, spatial environment and ecological constraints. These characteristics make it necessary to examine not only the overall level of rural green development but also its spatial differentiation, regional disparities and driving mechanisms.
Grounded in sustainable development theory, ecological resilience theory and the perspective of spatial governance, this study addresses three specific research gaps based on the above discussion. First, although rural green development has been widely evaluated, insufficient attention has been paid to ecological green heart regions within urban agglomerations, where rural development, ecological protection and urban expansion are closely intertwined. Second, existing studies have not adequately integrated level measurement, spatial pattern identification and regional disparity decomposition into a coherent analytical framework. Third, the nonlinear effects and interaction relationships among socioeconomic, ecological and agricultural factors remain underexplored. Accordingly, this study seeks to answer three research questions: How did rural green development in the Chang-Zhu-Tan Ecological Green Heart region evolve from 2013 to 2022? What spatial patterns and regional disparities can be identified among the Changsha, Zhuzhou and Xiangtan groups? Which factors are most closely associated with rural green development, and how do these factors interact in nonlinear ways? Guided by the theoretical framework, this study expects that rural green development in the region is spatially differentiated rather than evenly distributed and that such differentiation is associated with variations in socioeconomic capacity, ecological pressure, agricultural production conditions and spatial coordination across county-level units.
To answer these questions, this study constructs an evaluation index system for rural green development using panel data from 10 counties, county-level cities and districts in the Chang-Zhu-Tan Ecological Green Heart region from 2013 to 2022. The combined weighting–TOPSIS model is used to measure rural green development levels. The Theil index is applied to analyse regional disparities and decompose them into inter-group and intra-group components. Global Moran’s I is introduced as a supplementary test of global spatial autocorrelation. XGBoost–SHAP is then employed to identify the relative importance, nonlinear effects and interaction relationships of the main driving factors.
The contributions of this study are threefold. First, it extends rural green development research to an urban-agglomeration ecological green heart region, thereby enriching empirical understanding of rural green development in areas where ecological conservation, rural construction and urban–rural interaction are closely intertwined. Second, it integrates level measurement, spatial pattern identification, regional disparity decomposition and driving factor interpretation into a coherent analytical framework, offering a more systematic explanation of rural green development differences. Third, by applying XGBoost–SHAP, it identifies nonlinear effects and factor interactions that are difficult to capture using conventional linear approaches. The findings may provide empirical evidence for differentiated rural green development policies and coordinated ecological governance in the Chang-Zhu-Tan Ecological Green Heart region.

2. Study Area and Data Sources

2.1. Study Area

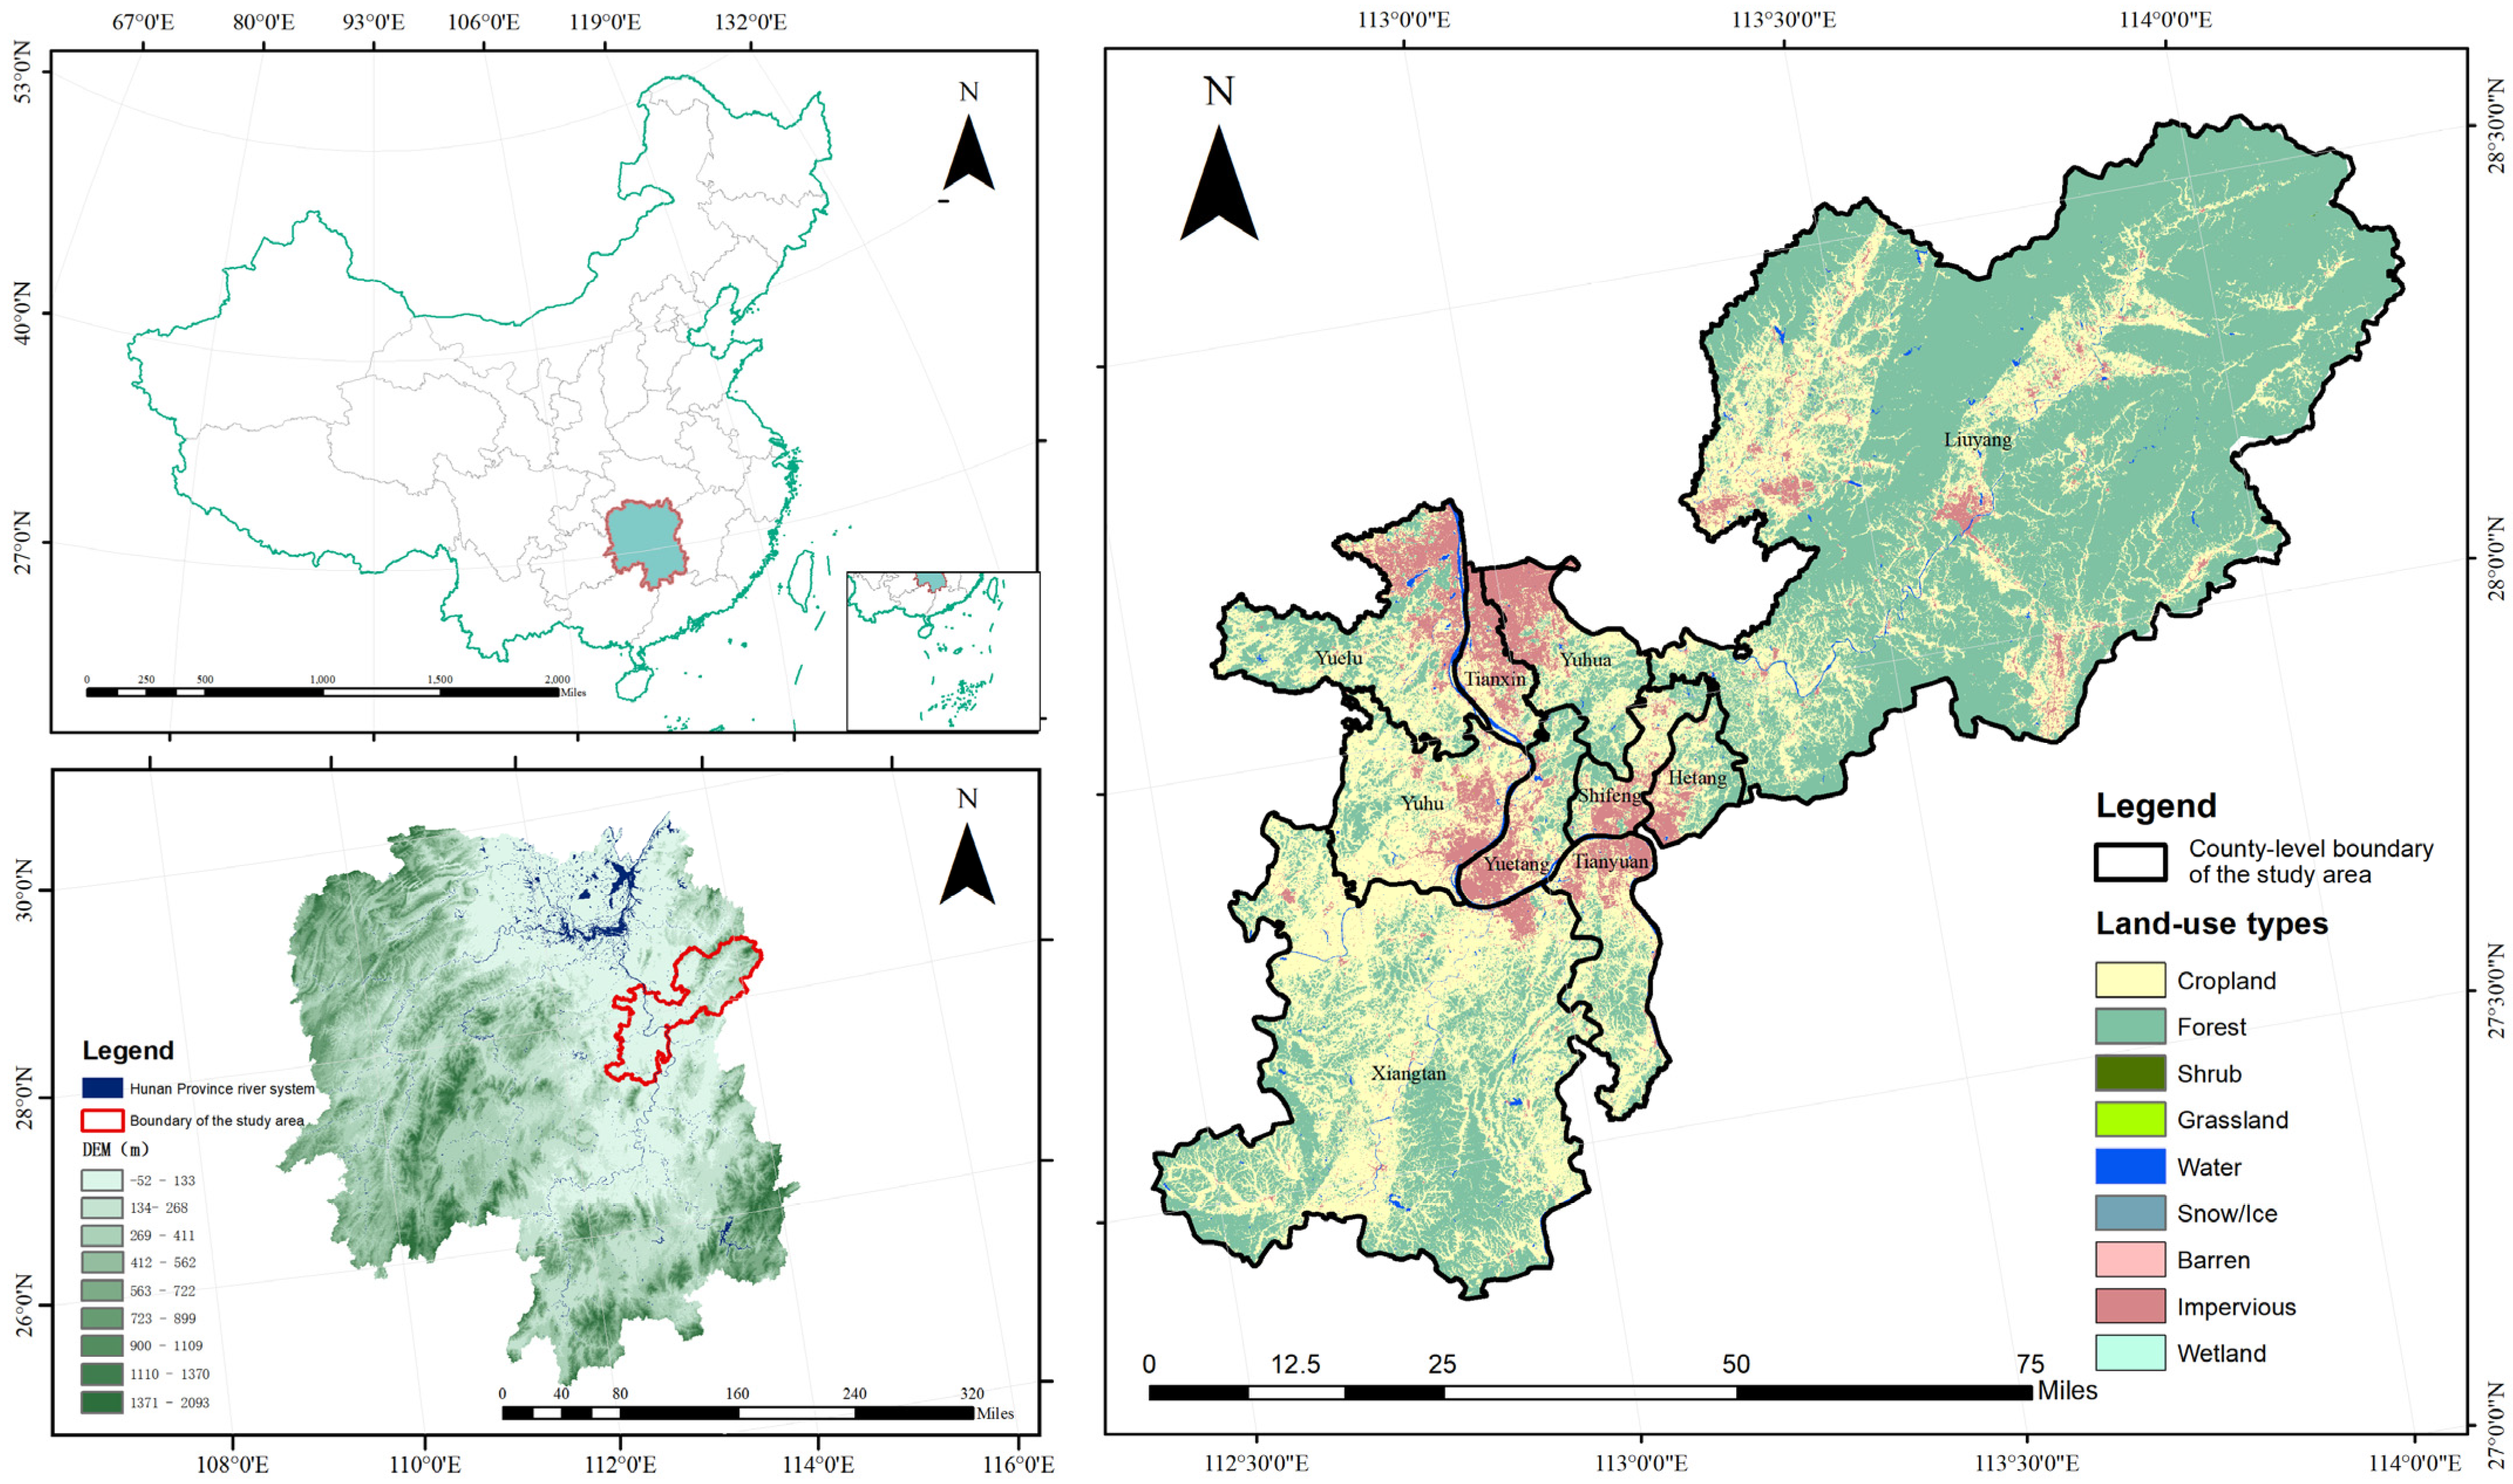
The Chang-Zhu-Tan Ecological Green Heart region is located at the intersection of Changsha, Zhuzhou and Xiangtan. It serves as an important ecological barrier and regional ecological hub connecting the three cities and is also a key ecological function area in the core zone of the Chang-Zhu-Tan urban agglomeration. The study area extends north to the Changsha Ring Expressway and the north bank of the Liuyang River, west to Pingtang Subdistrict in Yuelu District, Changsha, and Xiangshui Township in Yuhu District, Xiangtan, east to Zhentou Town in Liuyang, and south to Yisuhe Town in Xiangtan County and Qunfeng Town in Zhuzhou. Its geographical coordinates range from 112°52′36.23″ E to 113°17′50.90″ E and from 27°43′32.22″ N to 28°5′54.88″ N [14,17,18]. Considering the statistical scope of administrative units, this paper selects 10 counties, county-level cities and districts involved in the Green Heart region as the research units. The Changsha group includes Tianxin District, Yuhua District, Yuelu District and Liuyang City; the Zhuzhou group includes Shifeng District, Hetang District and Tianyuan District; and the Xiangtan group includes Xiangtan County, Yuhu District and Yuetang District.
Unlike many ecological function zones that are relatively distant from urban cores, the Chang-Zhu-Tan Ecological Green Heart region is located within the core area of an urban agglomeration and is closely connected with the spatial development, industrial adjustment and urban–rural integration of Changsha, Zhuzhou and Xiangtan [19]. Rural development in this region therefore does not take place in an isolated agricultural setting, but is shaped by the interaction of ecological conservation, urban growth and rural transformation. As one of the earliest regions in China to explore the protection and development of an ecological green heart within an urban agglomeration, the Chang-Zhu-Tan Ecological Green Heart has long been an important focus of national and provincial spatial governance. In March 2011, during his inspection visit to Hunan Province, General Secretary Xi Jinping noted that the construction of an ecological green heart is an important feature distinguishing the Chang-Zhu-Tan urban agglomeration from other urban agglomerations. In 2024, the State Council issued the Several Policies and Measures for Promoting the Accelerated Rise of the Central Region in the New Era, which explicitly supported the Chang-Zhu-Tan Ecological Green Heart in exploring new models of green transformation and development [20,21] (Figure 1). In the same year, Hunan Province revised the Regulations on the Protection of the Chang-Zhu-Tan Ecological Green Heart and released the Plan for High-Level Protection and High-Quality Development of the Chang-Zhu-Tan Ecological Green Heart Region (2024–2035), further strengthening the strategic position of the region in ecological protection and green development. Therefore, studying this region can help explain not only the local process of rural green development but also the broader challenge faced by urban agglomerations in coordinating ecological protection, rural revitalisation and spatial governance.
Figure 1. Location and land-use pattern of the Chang-Zhu-Tan Ecological Green Heart region.

2.2. Data Sources and Processing

This study uses panel data for the 10 county-level research units in the Chang-Zhu-Tan Ecological Green Heart region from 2013 to 2022. The data used in this study are mainly derived from official statistical sources, including the Hunan Statistical Yearbook, the Hunan Rural Statistical Yearbook, and the Statistical Communiqués on National Economic and Social Development issued by Changsha, Zhuzhou and Xiangtan. These sources are authoritative, and their statistical standards are generally consistent, which helps ensure the reliability and comparability of the data.
For indicators not directly reported in the statistical sources, relevant basic data are compiled and calculated to maintain the completeness of the evaluation index system. For a small number of missing indicator values in individual years, mean imputation is applied to ensure the continuity of the sample series and to reduce the influence of missing data on the results. To eliminate the effects of differences in measurement units and orders of magnitude among indicators, the raw data are standardised according to indicator attributes before further calculation, thereby improving comparability across indicators [22,23].

2.3. Research Framework and Technical Route

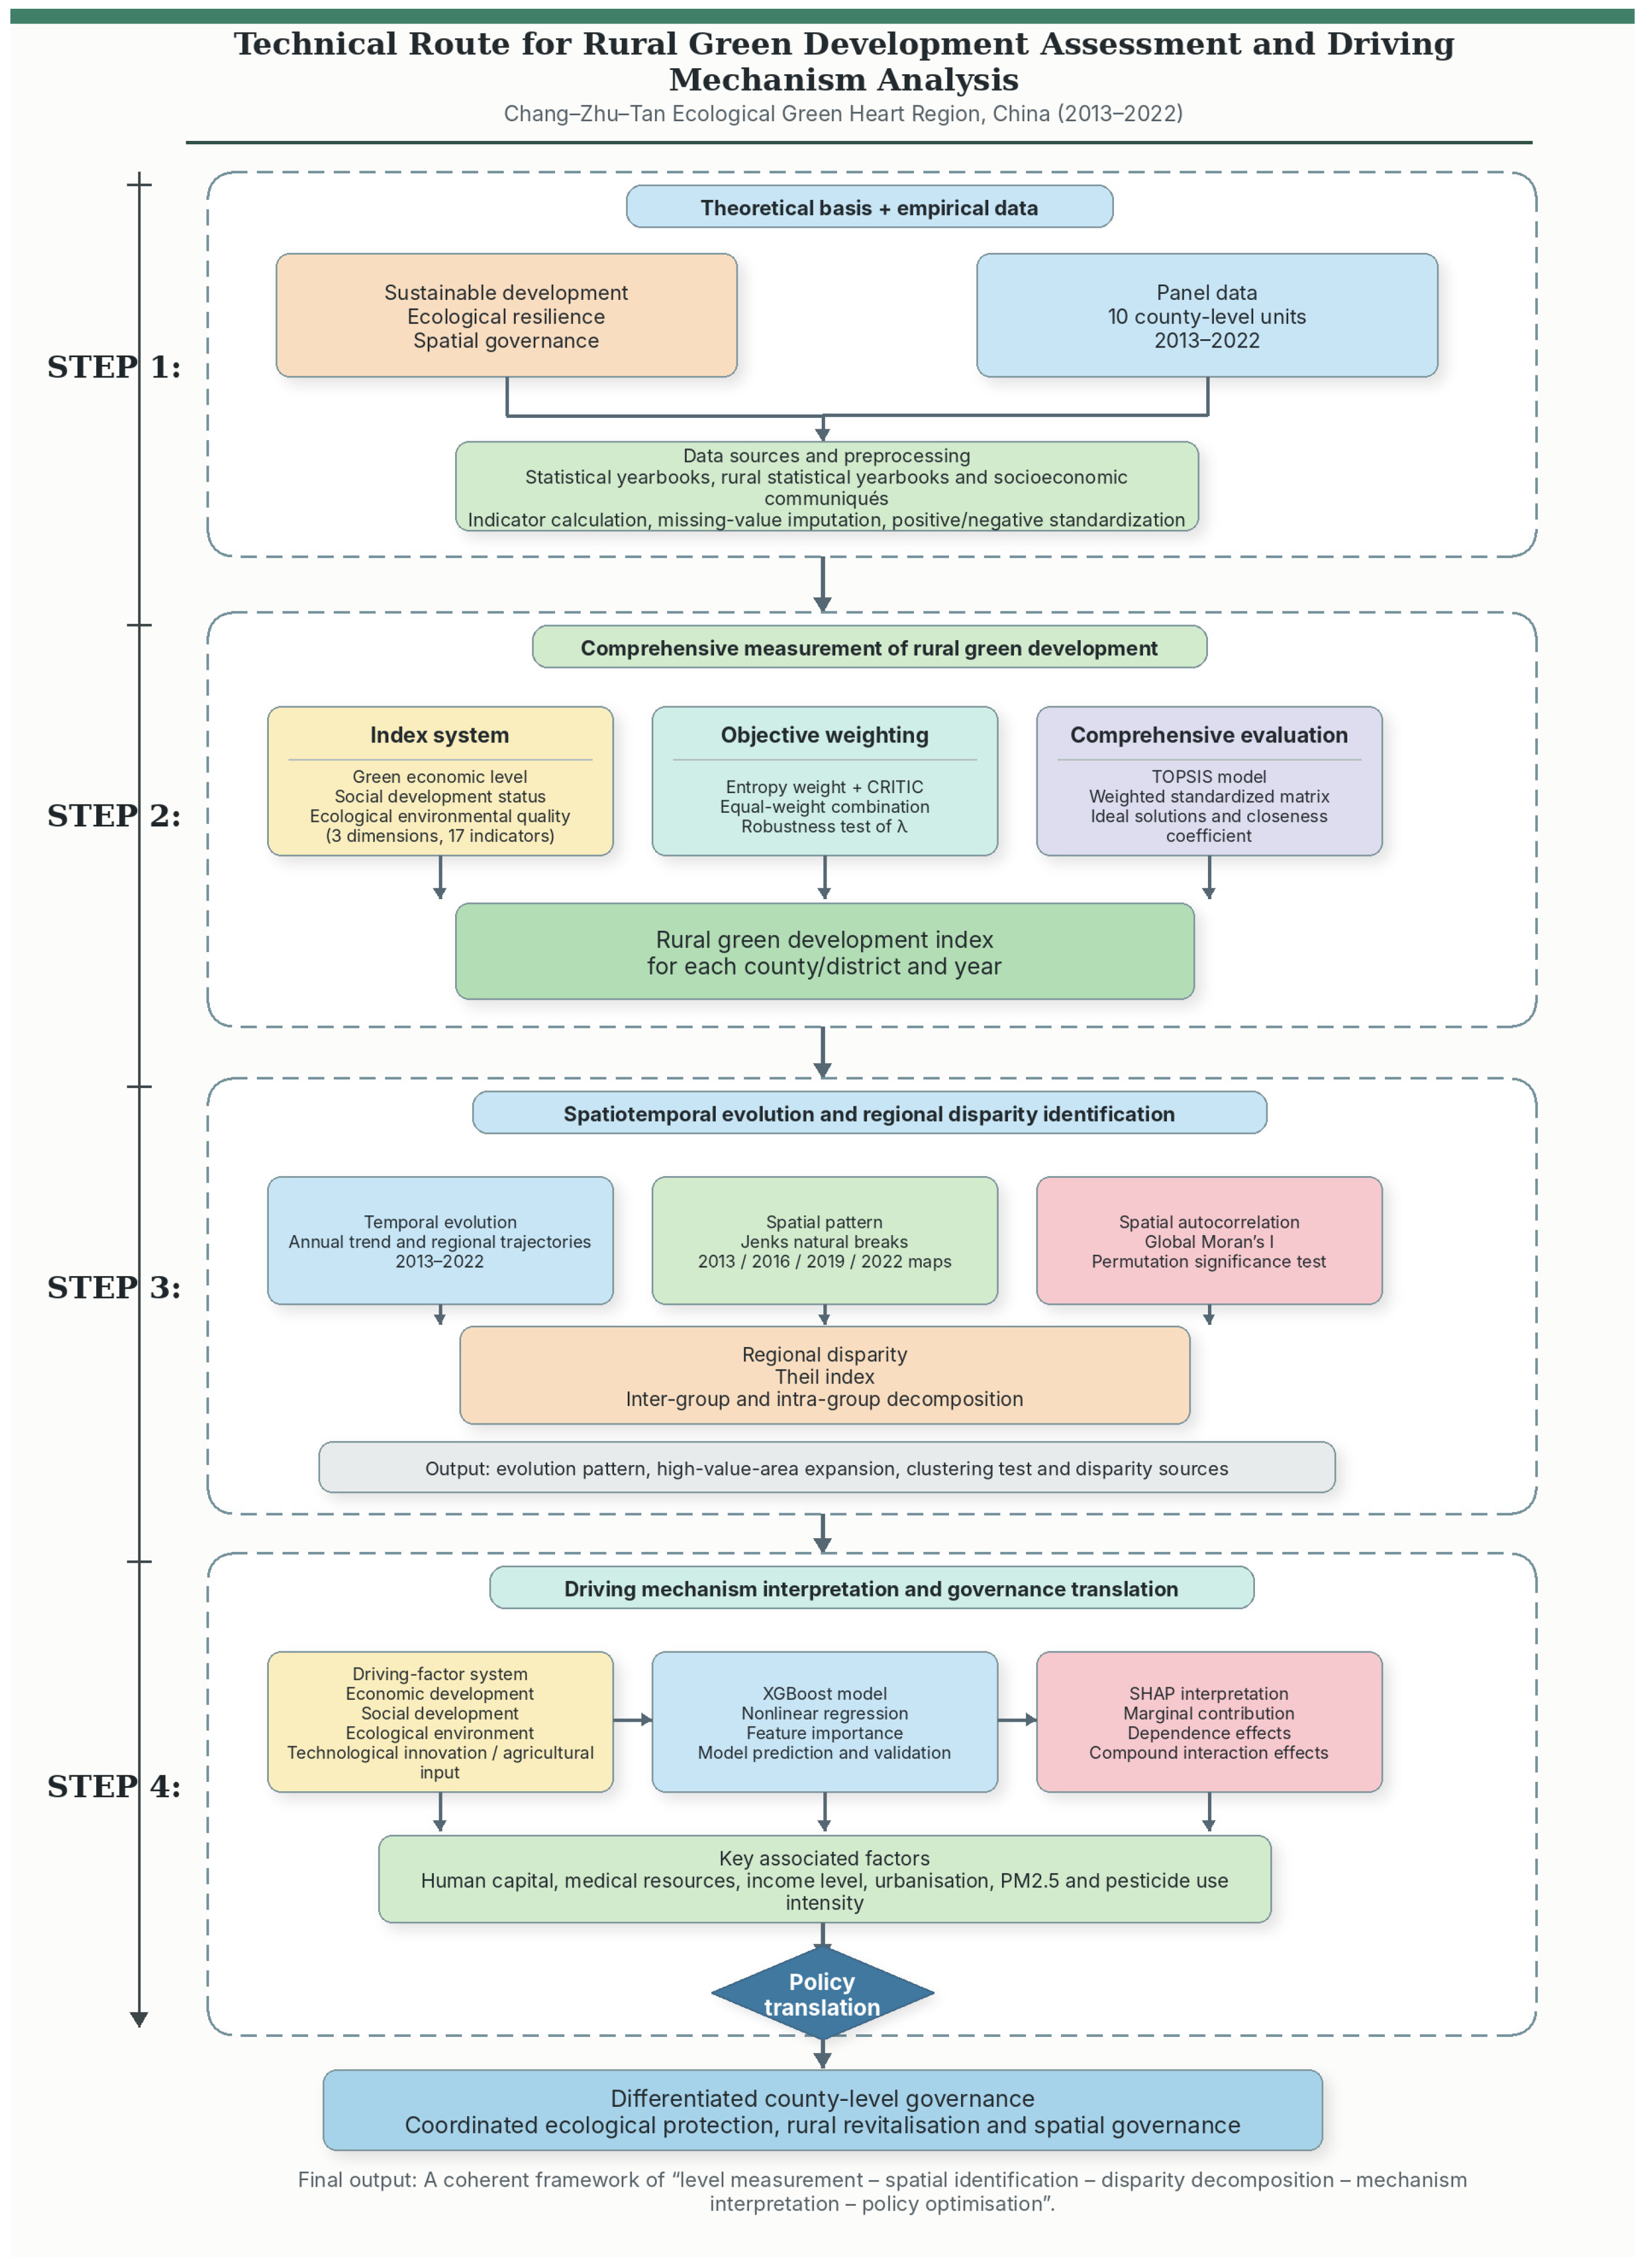
To present the analytical logic more clearly, this study developed a technical route that integrates data collection, indicator system construction, comprehensive evaluation, spatial pattern analysis, regional disparity decomposition, and driving mechanism identification. The overall technical route is shown in Figure 2.
Figure 2. Technical route of this study.

3. Research Methods

3.1. Construction of the Evaluation Index System for Rural Green Development

Rural green development is a multidimensional process that involves the coordinated improvement of agricultural production, rural living conditions and ecological protection. It refers not only to the reduction of resource consumption and environmental pollution but also to rural industrial transformation, residents’ welfare, public service provision and the maintenance of ecological functions. Based on this understanding, and drawing on previous studies on green development and rural sustainability, as well as on the Green Development Indicator System issued by the National Development and Reform Commission, this study constructs an evaluation index system for rural green development. The index system follows the principles of comprehensiveness, representativeness, scientific rigour and operability and is built around the coordination of economic development, social welfare and ecological environmental quality [24].
The evaluation index system consists of three dimensions: green economic level, social development status and ecological environmental quality. The green economic level reflects the efficiency and greening of rural production. Indicators such as effective irrigation rate, fertiliser application intensity, agricultural diesel use intensity, plastic film use intensity and pesticide use intensity are used to measure the resource and environmental impacts of agricultural production. Indicators related to agricultural mechanisation, industrial structure, agricultural output value and crop sown area are used to reflect production efficiency and industrial transformation. The social development dimension is included because rural green development should ultimately be reflected in improved living conditions and better access to basic public services. Therefore, rural residents’ income, housing area and electricity consumption are selected to represent living conditions, while hospital beds and compulsory education enrolment are used to reflect medical and educational service capacity. The ecological environmental quality dimension reflects the ecological foundation and environmental constraints of rural green development. Vegetation coverage is used to represent natural resource protection, while annual average PM2.5 concentration is used to reflect air pollution pressure [25,26]. It should be noted that the ecological environmental dimension includes a relatively limited number of indicators. This is mainly constrained by the availability and comparability of county-level panel data. Indicators such as water quality, soil pollution, biodiversity, carbon sequestration and ecosystem services can reflect ecological conditions more directly, but continuous and comparable data for all counties and districts in the study area during 2013–2022 are difficult to obtain. Including indicators with substantial missing values or inconsistent statistical standards may weaken the comparability and stability of the evaluation results. Future research may further incorporate more comprehensive ecological indicators when finer-scale and continuous data become available. Overall, the selected indicators link rural production, rural life and ecological protection, and are suitable for evaluating rural green development in the Chang-Zhu-Tan Ecological Green Heart region under the combined influence of ecological constraints and urban–rural interaction.
The specific indicators and their meanings are shown in Table 1. The expected contribution direction of each indicator is determined mainly according to its conceptual meaning in rural green development. Positive indicators are those for which a higher value generally indicates higher production efficiency, stronger public service capacity, improved living conditions or better ecological environmental quality. Negative indicators are those for which a higher value implies greater resource consumption or stronger pollution pressure [27,28].
Table 1. Evaluation index system, calculation methods, and weights for rural green development.

3.2. Entropy Weight–CRITIC Combined Weighting Method

In multi-indicator comprehensive evaluation, the determination of indicator weights directly affects the scientific rigour and robustness of the evaluation results. Since a single weighting method may not fully capture different types of information contained in the data, this study combines the entropy weight method and the CRITIC method to determine indicator weights. Both methods are objective weighting approaches, but they emphasise different aspects of data variation. The entropy weight method mainly reflects the dispersion of indicator values, while the CRITIC method takes into account both the contrast intensity of indicators and the conflict among them. Therefore, combining the two methods can make fuller use of the information contained in the indicator data and improve the objectivity and reliability of the weighting results. In this study, the final weight of each indicator is obtained by assigning equal importance to the entropy weight and the CRITIC weight [29].
Since the indicators differ in measurement units and value ranges, the raw data are first standardised using the range standardisation method. For positive indicators, the standardisation formula is:
y ij = x ij − min x j max x j − min x j
For negative indicators, the standardisation formula is:
y ij = max x j − x ij max x j − min x j
where x ij represents the raw value of the j -th indicator for the i -th region; min x j and max x j represent the minimum and maximum values of the j -th indicator, respectively; and y ij is the standardised value.

3.2.1. CRITIC Weight Calculation

The CRITIC method determines indicator weights by considering both the variability of indicators and the conflict among them. The calculation formula is as follows:
ω j 1 = C j ∑ j = 1 n C j ,   C j = σ j ∑ k = 1 n ( 1 − r jk )
where r jk represents the correlation coefficient between the j -th and k -th indicators; σ j is the standard deviation of the j -th indicator; C j is the amount of information contained in the j -th indicator; and ω j 1 is the weight obtained using the CRITIC method.

3.2.2. Entropy Weight Calculation

The entropy weight method determines indicator weights by using information entropy to reflect the dispersion degree of each indicator. The calculation formulas are as follows:
p ij   =   y ij ∑ i = 1 m y ij
e j = − 1 ln m ∑ i = 1 m p ij ln p ij
ω j 2 = 1 − e j ∑ j = 1 n ( 1 − e j )
where e j represents the information entropy of the j -th indicator; p ij represents the proportion of the i -th region under the j -th indicator; when p ij = 0, p ij ln p ij is defined as 0; and ω j 2 is the weight obtained using the entropy weight method.

3.2.3. Combined Weight Calculation

To integrate the advantages of the entropy weight method and the CRITIC method, this study adopts a combined weighting approach to determine the final indicator weights. Let ω j E and ω j C denote the weight of the j-th indicator obtained from the entropy weight method and the CRITIC method, respectively. The combined weight is calculated as follows:
ω j ( λ ) = λ ω j E + ( 1 − λ ) ω j C
where λ represents the proportion assigned to the entropy weight method, and ( 1 − λ ) represents the proportion assigned to the CRITIC method. Since there is no clear theoretical basis for prioritising either weighting method, ( λ = 0.5) is used as the baseline setting in this study. This means that the entropy weight method and the CRITIC method are assigned equal importance, thereby ensuring a balanced and transparent weighting procedure.
To examine whether the evaluation results are sensitive to the choice of the combination coefficient, this study further sets eleven alternative values of λ, namely 0.0, 0.1, 0.2, 0.3, 0.4, 0.5, 0.6, 0.7, 0.8, 0.9 and 1.0. For each setting, the combined weights, TOPSIS closeness coefficients and rankings of the evaluation units are recalculated and compared with the baseline scheme [30,31].
The results are presented in Table 2. Within the central range of ( λ = 0.3) to ( λ = 0.7), the Spearman rank correlation coefficients between the alternative schemes and the baseline scheme are all above 0.998. The maximum ranking change does not exceed six places, and the average ranking change remains no higher than 1.02 places. Even under the two extreme cases of using only the CRITIC method or only the entropy weight method, the Spearman rank correlation coefficients remain high, at 0.9932 and 0.9958, respectively. These results indicate that the evaluation rankings remain generally stable under different combination coefficients. Therefore, the main conclusions of this study are not sensitive to the 0.5/0.5 weighting setting, suggesting that the combined weighting results have good robustness.
Table 2. Robustness test of alternative weighting-combination coefficients.

3.3. TOPSIS Comprehensive Evaluation Model

After obtaining the combined indicator weights, this study applies the TOPSIS model to comprehensively evaluate the level of rural green development in each research unit [32]. First, the weighted standardised matrix is constructed as follows:
v ij   =   ω j y ij
Next, the positive ideal solution and the negative ideal solution are determined:
v j +   =   max i   v ij ,   v j −   = min i   v ij
Then, the distances between each evaluation object and the positive and negative ideal solutions are calculated:
D i + = ∑ j = 1 n v ij − v j + 2
D i − = ∑ j = 1 n v ij − v j − 2
where D i + represents the distance between the i -th region and the positive ideal solution, and D i − represents the distance between the i -th region and the negative ideal solution.
Finally, the comprehensive evaluation value is calculated as follows:
S i   =   D i − D i + + D i −
where S i represents the comprehensive evaluation value of rural green development in the i -th region, with a value range of 0 to 1. A larger S i value indicates a higher level of rural green development in the region.

3.4. Theil Index

The Theil index is an important measure of regional inequality. It can decompose overall disparities into inter-regional and intra-regional components, thereby identifying the contribution of different sources to total inequality. In this study, the Theil index is used to measure regional disparities in rural green development in the Chang-Zhu-Tan Ecological Green Heart region. To further examine the sources of these disparities, the study area is divided into three sub-regions: Changsha, Zhuzhou and Xiangtan. The Theil index decomposition method is then applied to analyse the contribution rates of inter-regional and intra-regional disparities [4].
The Theil index is calculated as follows:
T = 1 n ∑ i = 1 n y i y ¯ ln y i y ¯
where T represents the overall Theil index; y i represents the rural green development level of the i -th region; y represents the mean rural green development level of all regions; and n is the number of regions.
To further analyse the sources of regional disparities, the Theil index can be decomposed into inter-regional and intra-regional components:
T   =   T b   +   T w
where T b represents inter-regional disparities, and T w represents intra-regional disparities.

3.5. XGBoost–SHAP Model

To further identify the key driving factors influencing rural green development in the Chang-Zhu-Tan Ecological Green Heart region, this study uses a machine learning approach. Specifically, the XGBoost model is combined with the SHAP interpretation method to quantitatively analyse the importance and effects of different driving factors. This helps reveal the contribution of each factor to rural green development and the interaction relationships among factors [33,34].
XGBoost is an ensemble learning algorithm based on gradient boosting trees. It constructs multiple decision trees through iterative training and optimises each round of learning based on the residuals from the previous round, thereby gradually improving prediction accuracy. Compared with traditional GBDT, XGBoost introduces a regularisation term into the objective function and adopts optimisation strategies such as pruning and parallel computing. These features improve the model’s computational efficiency and generalisation ability, making it widely used in regression prediction and feature importance analysis.
The objective function of the XGBoost model can be expressed as:
O b j ( t ) = ∑ i = 1 N l y i , y ^ i ( t ) + ∑ k = 1 t Ω ( f k )
where l y i , y ^ i ( t ) represents the loss function, which measures the error between the predicted value and the actual value; f k denotes the k -th decision tree; and Ω ( f k ) is the regularisation term used to control model complexity.
To further interpret the results of the machine learning model, this study introduces the SHAP method to explain the XGBoost model. The SHAP method is based on Shapley value theory. It quantifies the influence of each driving factor on rural green development by calculating the marginal contribution of each feature variable to the model prediction under different feature combinations. The SHAP value is calculated as follows:
ϕ i = ∑ S ⊆ N ∖ { i } | S | ! ( | N | − | S | − 1 ) ! | N | ! f ( S ∪ { i } ) − f ( S )
where ϕ i represents the contribution value of the i -th feature variable; S represents a subset of features; N represents the set of all feature variables; and f ( S ) represents the model prediction based on the feature subset S .

4. Results and Analysis

4.1. Temporal Variation

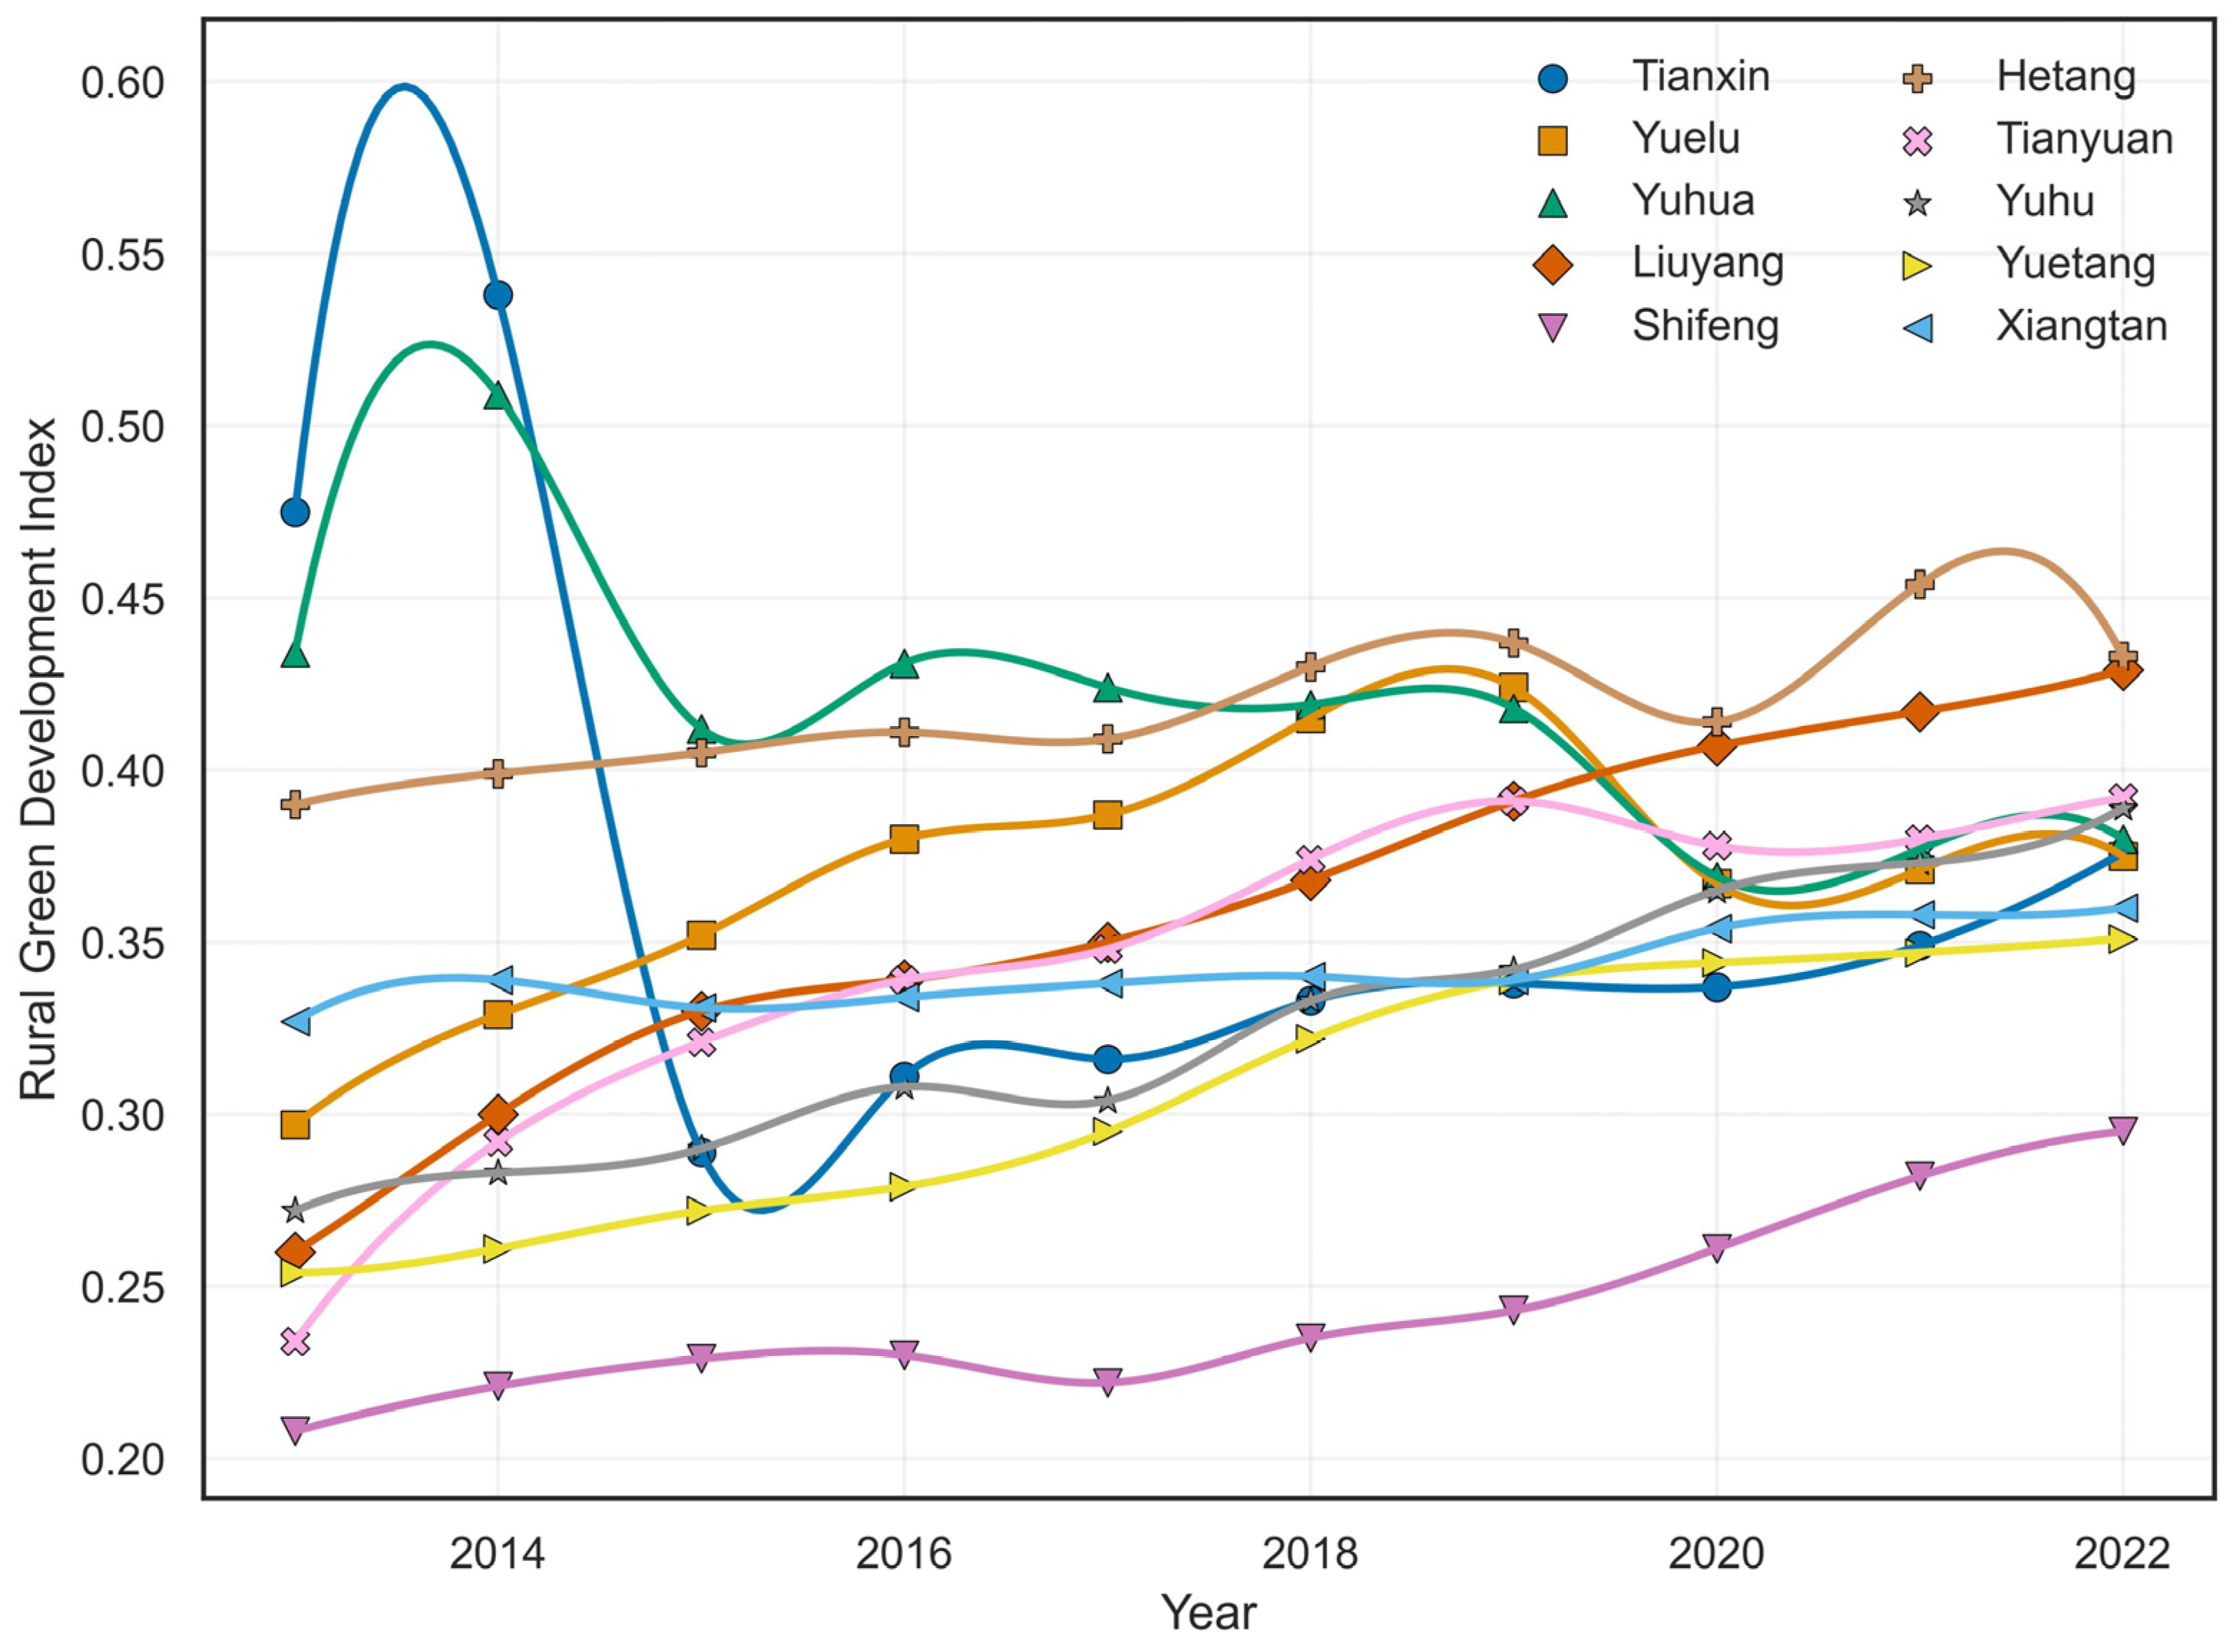
To measure rural green development in the Chang-Zhu-Tan Ecological Green Heart region, this study first standardises the raw data of 17 evaluation indicators for 10 counties, county-level cities and districts from 2013 to 2022 using the range standardisation method. The CRITIC–entropy weight combined weighting method is then used to determine indicator weights, and the TOPSIS model is applied to calculate the comprehensive evaluation value for each region. The resulting rural green development indices are reported in Table 3, and the overall temporal trend is shown in Figure 3.
Table 3. Rural green development index values in the Chang-Zhu-Tan Ecological Green Heart region, 2013–2022.
Figure 3. Temporal changes in rural green development index values in the Chang-Zhu-Tan Ecological Green Heart region, 2013–2022.
The results show that rural green development in the Chang-Zhu-Tan Ecological Green Heart region followed a fluctuating upward trend from 2013 to 2022. The regional average index increased from 0.315 in 2013 to 0.378 in 2022, representing a cumulative increase of 19.95% and an average annual growth rate of approximately 2.04%. This indicates that the overall level of rural green development in the region improved during the study period.
From the perspective of changes in the regional average, rural green development generally experienced a process of “growth–decline–steady and gradual improvement”. From 2013 to 2014, the index increased markedly from 0.315 to 0.347. In 2015, it declined temporarily to 0.323 but gradually recovered thereafter. Between 2016 and 2019, the index continued to rise, increasing from 0.336 to 0.366. In 2020, the regional average index decreased slightly to 0.360. It then recovered gradually, reaching 0.371 in 2021 and 0.378 in 2022. Overall, the region showed a trend of gradual improvement despite short-term fluctuations.
At the regional level, the growth rates of rural green development varied considerably across different areas. Liuyang City and Yuetang District maintained continuous growth throughout the ten-year study period. Among them, Liuyang City showed the most notable improvement, with its green development index increasing from 0.260 in 2013 to 0.429 in 2022. This represents a total growth rate of 65.0% and an average annual growth rate of 5.72%, indicating a transition from a relatively low level to a higher level of development. Tianyuan District also experienced rapid growth, with its index increasing from 0.234 to 0.392 over the ten-year period. This corresponds to a total growth rate of 67.5%, an absolute increase of 0.158 and an average annual growth rate of 5.91%, reflecting strong improvement momentum. By contrast, some areas with higher initial levels showed relatively limited growth. For example, Tianxin District experienced a sharp decline in 2015, resulting in an overall growth rate of −20.91%. Yuhua District reached a temporary peak in 2014 and then declined, with an overall growth rate of −12.44% over the study period.
Overall, from 2013 to 2022, rural green development in the Chang-Zhu-Tan Ecological Green Heart region improved as a whole, but the growth rates and evolutionary paths differed markedly among regions. The region therefore exhibited a development pattern characterised by overall improvement and regional differentiation.

4.2. Spatial Patterns

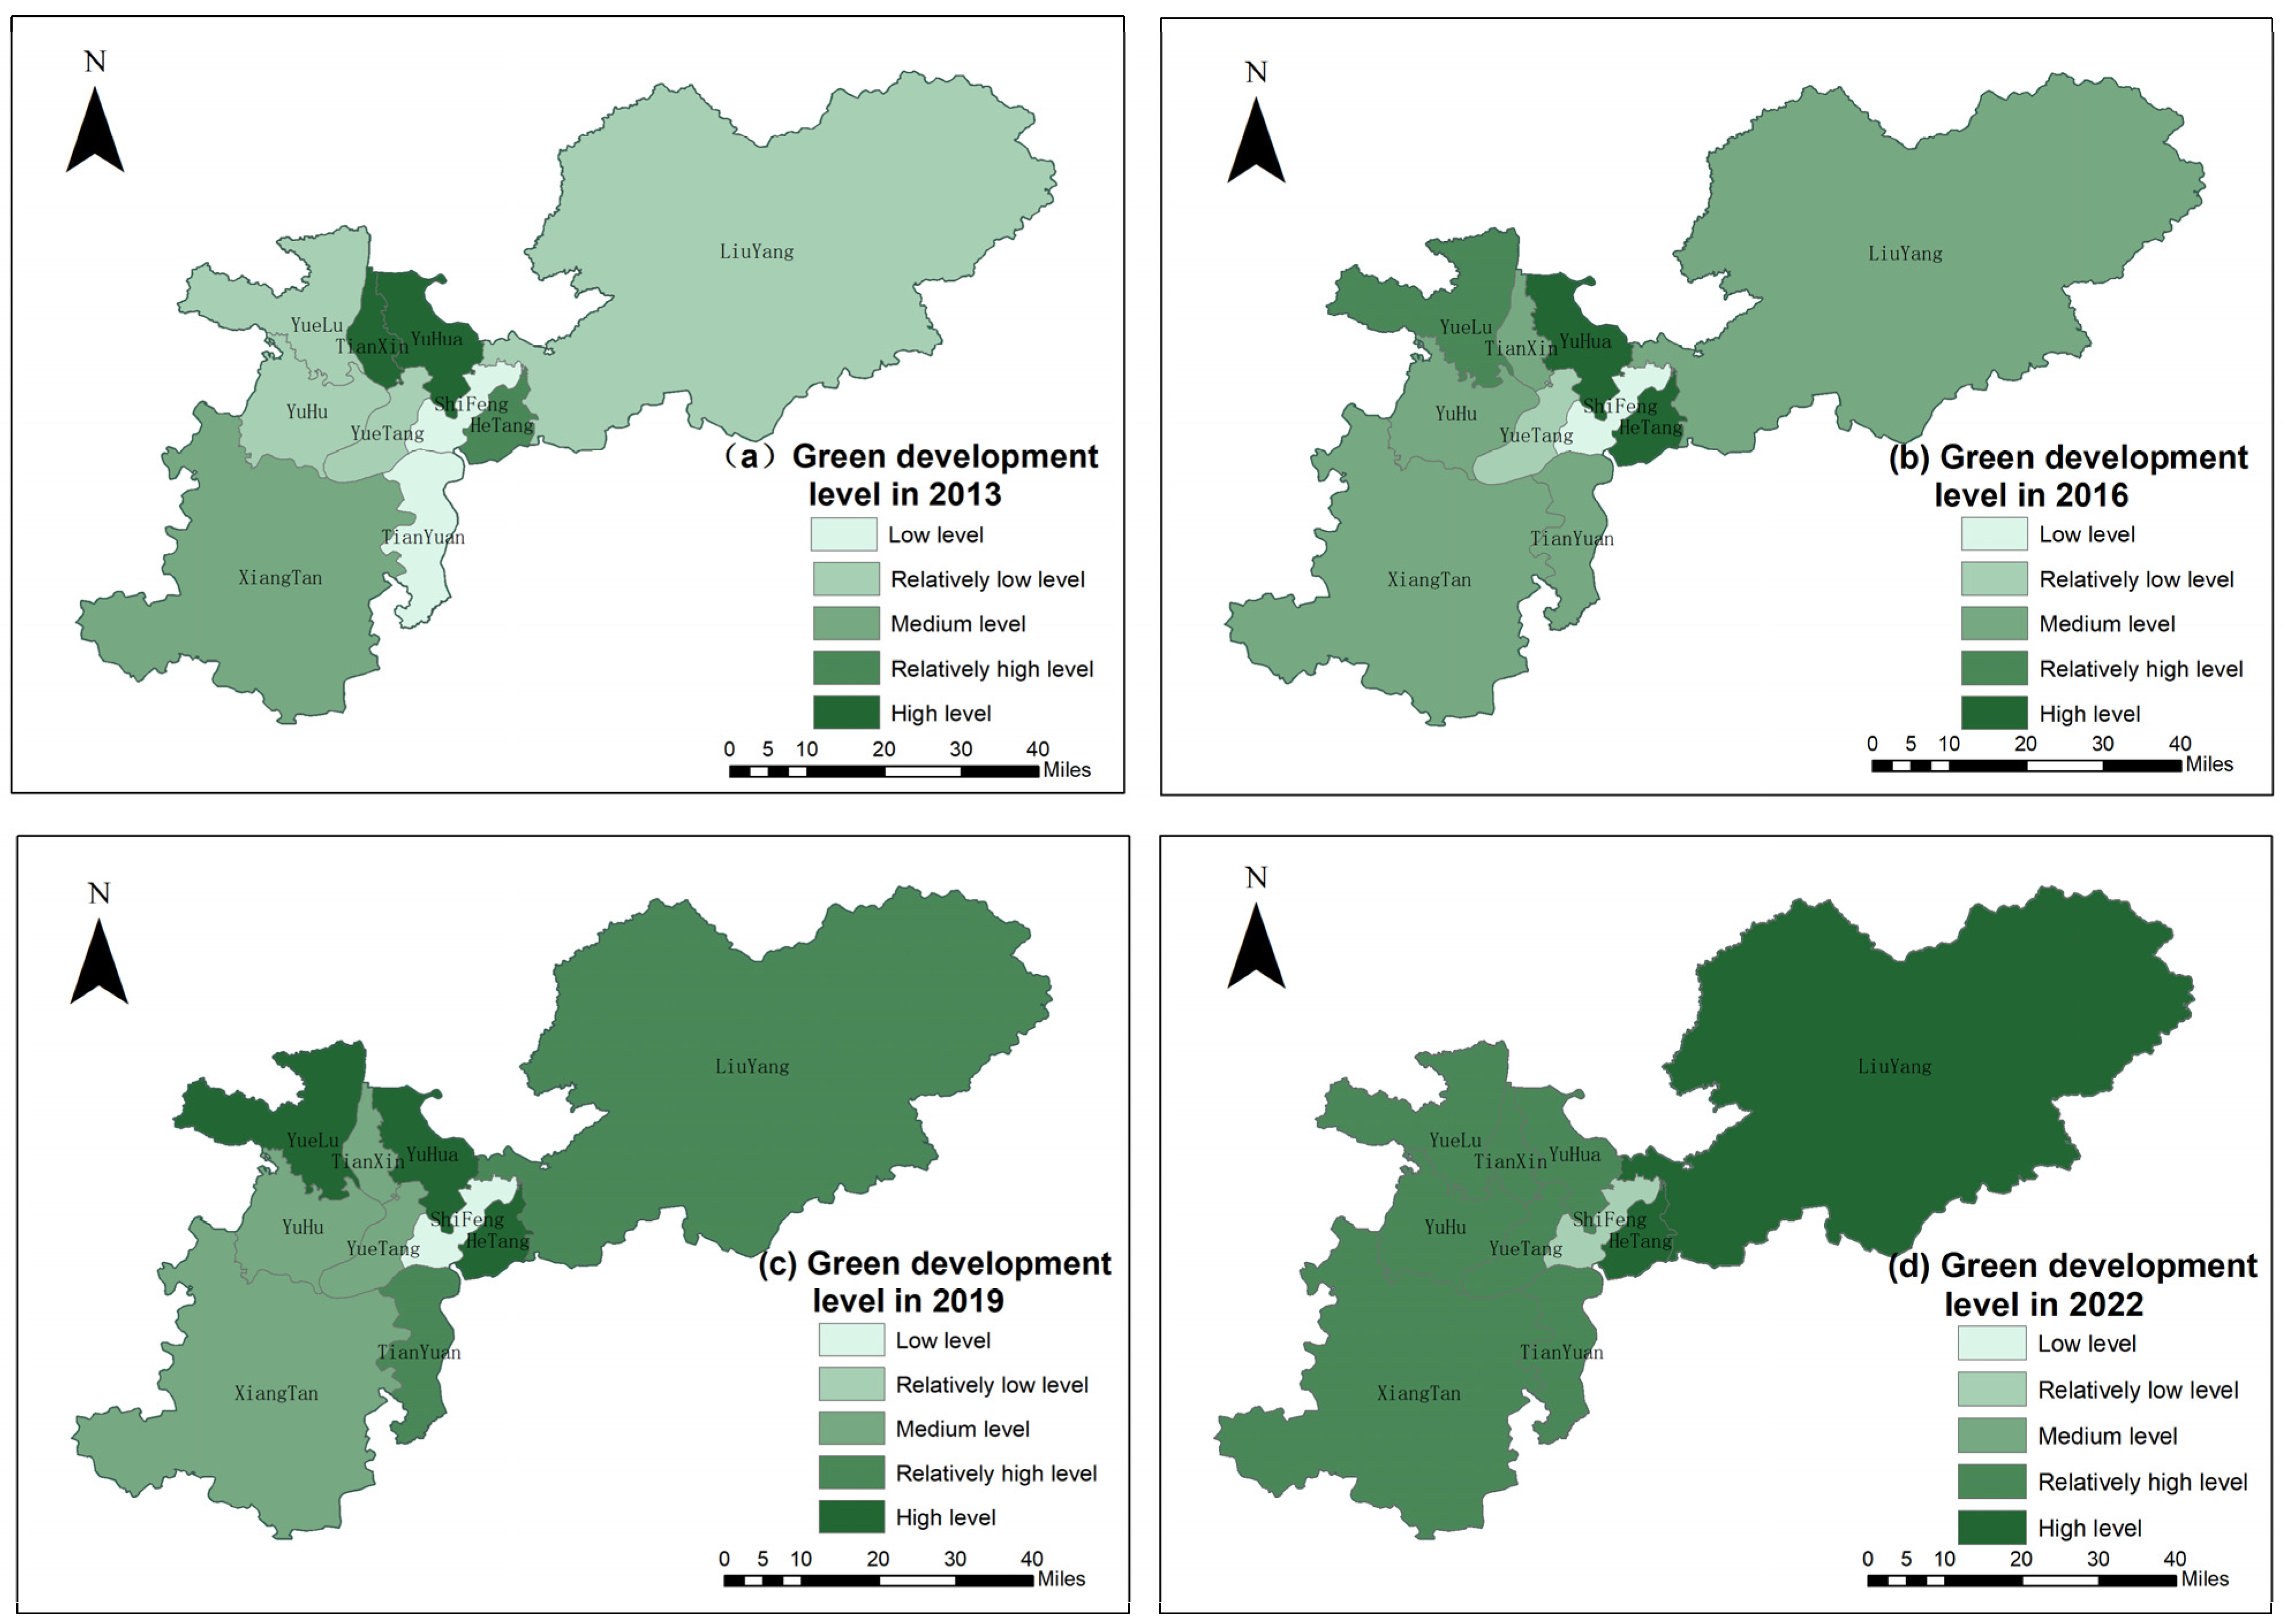
To reveal the spatial distribution characteristics of rural green development in the Chang-Zhu-Tan Ecological Green Heart region, this study selects 2013, 2016, 2019 and 2022 as representative years. The rural green development index was classified into five levels using the Jenks natural breaks classification method. This method identifies natural groupings in the data by minimising within-class variance and maximising between-class differences. To ensure comparability across different years, the classification thresholds were determined based on the pooled index values of all regions in the selected years, and the same classification standard was applied to each year. Accordingly, the rural green development index was divided into five levels: low, relatively low, medium, relatively high and high. A composite spatial distribution map with four subplots was then produced to show the spatial pattern of rural green development in the study area, as shown in Figure 4 [35,36].
Figure 4. Spatial distribution of rural green development levels in the Chang-Zhu-Tan Ecological Green Heart region in representative years.
The results show that the spatial pattern of rural green development in the Chang-Zhu-Tan Ecological Green Heart region from 2013 to 2022 was characterised by overall improvement, the expansion of high-value areas and clearer regional differentiation. In 2013, the overall level was relatively low, with most areas falling into the medium or lower categories. Only Tianxin District, Yuhua District and Hetang District reached relatively high levels, and high-value areas were relatively scattered. By 2016, relatively high-level areas had increased, and some areas in the Changsha group and parts of the Zhuzhou group began to show signs of local high-value concentration, although medium-level areas still dominated. In 2019, the number of relatively high- and high-level areas increased markedly, and Liuyang City, Tianxin District, Yuhua District and Hetang District gradually formed relatively stable high-value zones. By 2022, high-level areas had expanded further, with Liuyang City and the central districts of the Changsha group becoming the main high-value areas, while the overall spatial pattern became more stable.
From the perspective of regional differentiation, the spatial distribution also showed clear group-based characteristics. The Changsha group, including Tianxin District, Yuelu District, Yuhua District and Liuyang City, generally had a relatively high level of rural green development, with high-value areas mainly concentrated in Tianxin District, Yuhua District and Liuyang City. The Zhuzhou group, including Shifeng District, Hetang District and Tianyuan District, was generally at a medium-to-high level, but differences among districts remained evident. Hetang District and Tianyuan District showed notable improvement, whereas Shifeng District remained at a relatively low level. The Xiangtan group, including Yuhu District, Yuetang District and Xiangtan County, had a relatively low overall level, although Yuetang District improved more rapidly than the other areas in the group.
Overall, from 2013 to 2022, rural green development in the study area evolved from a relatively scattered spatial pattern to one characterised by the expansion of high-value areas and clearer regional differentiation. The Changsha group gradually formed the main high-value core area, the Zhuzhou group showed a medium-to-high but internally differentiated pattern, and the Xiangtan group remained relatively low overall.
Although Figure 4 reveals the expansion of high-value areas and clearer regional differentiation, the visual interpretation of spatial distribution does not necessarily indicate statistically significant spatial autocorrelation. To avoid overinterpreting the map-based results, this study further calculated Global Moran’s I as a supplementary test of global spatial autocorrelation. A binary contiguity spatial weight matrix was constructed based on the adjacency relationships among the 10 county-level study units, and permutation tests were used to assess statistical significance. The results are shown in Table 4.
Table 4. Global Moran’s I test results for rural green development index values, 2013–2022.
The results show that the Global Moran’s I values were negative during 2013–2022, but none passed the 5% significance test. This indicates that rural green development in the Chang-Zhu-Tan Ecological Green Heart region did not exhibit statistically significant global spatial autocorrelation during the study period. In other words, the distribution of rural green development levels did not show a stable pattern in which high-value areas were significantly adjacent to high-value areas or low-value areas were significantly adjacent to low-value areas [37].
Therefore, although the spatial distribution map reveals certain local concentration and regional differentiation, the overall spatial pattern should not be interpreted as significant global spatial clustering. This result also suggests that the regional imbalance of rural green development is better examined through regional disparity decomposition, such as the Theil index, rather than through global spatial clustering alone.

4.3. Regional Disparities

To reveal regional disparities in rural green development and their sources in the Chang-Zhu-Tan Ecological Green Heart region, this study uses the Theil index to measure the overall disparities and their decomposition results from 2013 to 2022. The results are shown in Table 5.
Table 5. Theil index decomposition of rural green development disparities in the Chang-Zhu-Tan Ecological Green Heart region, 2013–2022.
From the perspective of overall disparities, the Theil index of rural green development in the Chang-Zhu-Tan Ecological Green Heart region showed a general downward trend during the study period, decreasing from 0.03518 in 2013 to 0.00499 in 2022. This indicates that overall regional disparities narrowed substantially, and rural green development gradually moved towards a more balanced pattern despite fluctuations. Although the overall disparity fluctuated slightly in some years, the long-term trend suggests a general convergence in uneven development within the region. The decomposition results show that intra-group disparities were consistently the main source of overall disparities. During the study period, the contribution rate of intra-group disparities increased from 75.04% in 2013 to 92.91% in 2022, while that of inter-group disparities decreased from 24.96% to 7.21%. This indicates that the overall gap among the Changsha, Zhuzhou and Xiangtan groups continued to narrow, while disparities among different areas within each group gradually became the dominant factor shaping the imbalance in rural green development. This shift suggests that the imbalance in rural green development no longer mainly reflects differences among the three city groups but increasingly reflects differentiated development conditions among counties and districts within the same group.
Further differences can be observed within the three groups. The contribution rate of internal disparities within the Changsha group showed an overall downward trend, decreasing from 40.44% in 2013 to 13.64% in 2022, indicating that internal development gradually became more balanced. This may be associated with the relatively strong economic foundation, higher level of urban–rural integration, better public service provision and stronger resource allocation capacity within the Changsha group, which can help reduce differences in infrastructure, ecological governance and green transformation capacity among its counties and districts. By contrast, the contribution rate of internal disparities within the Zhuzhou group increased markedly, rising from 30.10% to 73.46%, and became the main source of intra-group disparities in the later stage. The widening of internal disparities may be related to the long-term relatively low level of rural green development in Shifeng District, alongside the rapid improvement of Hetang District and Tianyuan District. From a socioeconomic perspective, this pattern may reflect differences in industrial structure, ecological pressure, land-use intensity, infrastructure conditions and public service provision within the Zhuzhou group. Areas with stronger transformation capacity improved more rapidly, while relatively lagging areas remained constrained by weaker green development foundations. The contribution rate of internal disparities within the Xiangtan group remained generally low and fluctuated only slightly. However, low internal disparity does not necessarily imply a high level of development. Combined with the relatively low average index of the Xiangtan group, this pattern suggests that several areas within the group may still face similar constraints, such as weaker economic foundations, slower rural industrial transformation, limited resource agglomeration capacity and insufficient public service support.
Overall, from 2013 to 2022, overall disparities in rural green development in the Chang-Zhu-Tan Ecological Green Heart region continued to converge. However, intra-group disparities remained prominent and gradually became the main source of overall disparities.

4.4. Analysis of Driving Factors

4.4.1. Selection of Driving Factors and Model Training

To further identify the key factors associated with rural green development in the Chang-Zhu-Tan Ecological Green Heart region, this study uses the rural green development index calculated above as the dependent variable. Drawing on previous studies, regional development conditions and data availability, ten representative variables are selected from four dimensions: economic development, social development, ecological environment and technological innovation. These variables constitute the driving factor system, as shown in Table 6.
Table 6. Driving factors and selected variables for rural green development in the Chang-Zhu-Tan Ecological Green Heart region.
Before model training, multicollinearity among the explanatory variables was examined to reduce the potential influence of redundant information on model interpretation. Specifically, the variance inflation factor (VIF) and pairwise Pearson correlation coefficients were used for diagnostic testing. The results show that all VIF values are below 5, and no pairwise correlation coefficient exceeds the threshold of |r| = 0.8. This indicates that severe multicollinearity is not present among the explanatory variables. Therefore, all ten driving factors are retained for the subsequent XGBoost analysis [38].
To capture possible nonlinear relationships between rural green development and its driving factors, this study constructs an XGBoost regression model based on gradient boosting decision trees. The sample data are divided into a training set and a test set at a ratio of 75:25. Grid search is conducted on the training set to optimise key hyperparameters, and 10-fold cross-validation is applied during the model selection process. This procedure helps improve the stability of model training and reduce the risk of overfitting. The hyperparameters tuned in the grid search include maximum tree depth, learning rate, number of estimators, gamma and subsampling ratio, while the remaining parameters are kept at their default settings. The final XGBoost hyperparameters and model settings are reported in Table 7 [39].
Table 7. XGBoost model settings used for driving factor analysis.
Model performance is evaluated using the coefficient of determination (R2), root mean squared error (RMSE) and mean absolute error (MAE). A higher R2 value and lower RMSE and MAE values indicate better predictive performance. The complete model performance statistics are reported in Table 8 [40].
Table 8. Performance statistics of the XGBoost model.
As shown in Table 8, the XGBoost model shows high fitting accuracy on the training set and maintains good predictive performance on the test set. This provides a basis for the subsequent SHAP-based analysis of driving factor importance and potential influence mechanisms. It should be noted that the sample size used for the XGBoost analysis is relatively limited. Although the dataset includes 100 county-year observations, this sample size remains modest for machine learning modelling, especially when complex nonlinear relationships and interaction effects are considered. This may affect the stability and generalisability of the model results. To reduce this concern, several measures were adopted in this study. First, the driving factors were selected based on theoretical considerations, previous research and data availability, rather than through purely data-driven variable screening. Second, the number of explanatory variables was controlled to avoid constructing an overly complex model under a limited sample size. Third, grid search combined with 10-fold cross-validation was used for hyperparameter tuning, which helped improve the stability of model selection. Fourth, multicollinearity was examined using VIF and pairwise Pearson correlation diagnostics to reduce the potential influence of redundant information on model interpretation. Therefore, the XGBoost–SHAP results should be interpreted primarily as exploratory evidence of the relative importance and potential nonlinear effects of the driving factors, rather than as definitive causal evidence. Future research could further verify these relationships using larger samples, finer spatial-scale data and longer time-series observations [41,42].

4.4.2. SHAP Single-Factor Effect Analysis

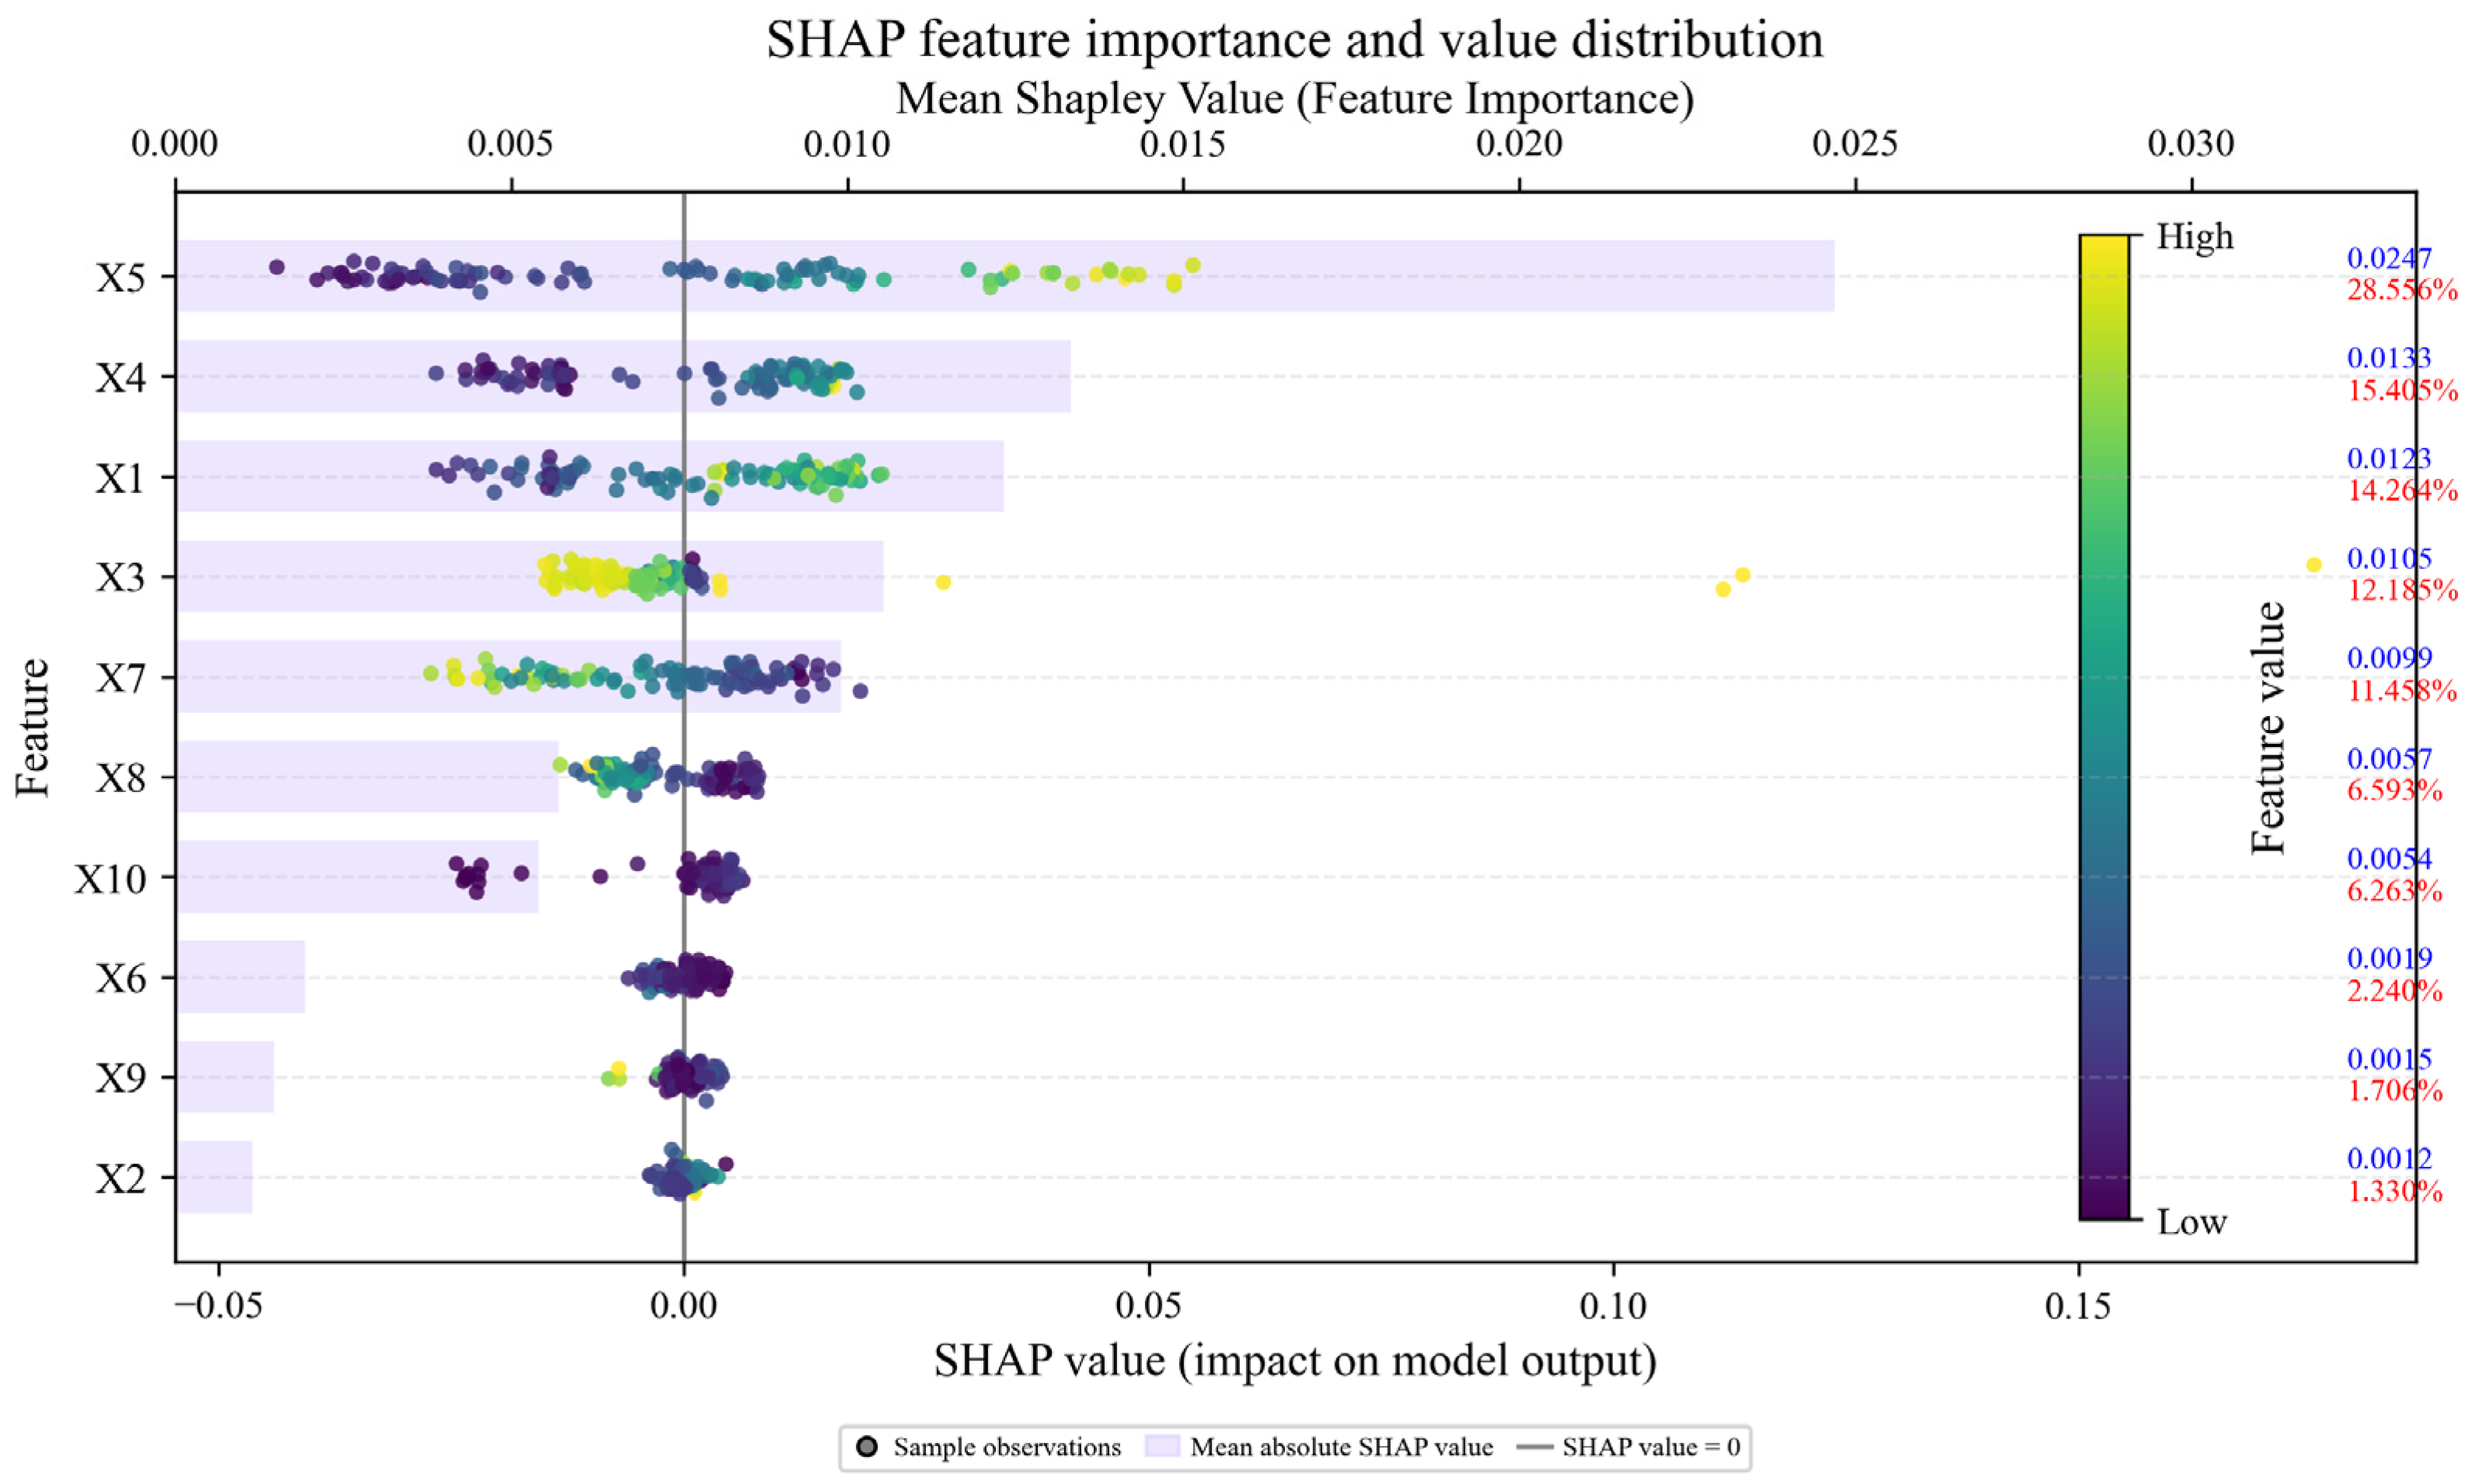
To further examine the relative importance and potential effects of different driving factors associated with rural green development in the Chang-Zhu-Tan Ecological Green Heart region, this study interprets the XGBoost model results using the SHAP method. The mean absolute SHAP value of each variable is calculated and normalised to quantify its relative contribution to the model output. The results are shown in Figure 5.
Figure 5. SHAP-based feature importance and value distribution of driving factors for rural green development in the Chang-Zhu-Tan Ecological Green Heart region.
In terms of variable importance, human capital (X5, the number of students enrolled in compulsory education per 10,000 people) was the most important driving factor, with a contribution rate of 28.556%. Medical resources (X4, the number of hospital beds per 10,000 people) ranked second, with a contribution rate of 15.405%, followed by income level (X1, per capita disposable income of residents), with a contribution rate of 14.264%. These results suggest that human capital, public service provision and residents’ income level constitute important foundations for improving rural green development. Urbanisation level (X3) and air quality, represented by annual average PM2.5 concentration (X7), also showed relatively strong explanatory power, with contribution rates of 12.185% and 11.458%, respectively. Pesticide use intensity (X8) and agricultural mechanisation (X10) had moderate effects, with contribution rates of 6.593% and 6.263%, respectively. By contrast, the effects of expenditure on energy conservation and environmental protection (X6), technological innovation (X9), and industrial upgrading (X2) were relatively weak, with contribution rates of 2.240%, 1.706%, and 1.330%, respectively.
Further analysis of the SHAP value distributions shows that the effects of different variables on rural green development differed markedly in both direction and magnitude. Human capital (X5), medical resources (X4), and income level (X1) generally showed positive effects, indicating that higher values of these variables tended to make larger positive contributions to the model predictions. By contrast, annual average PM2.5 concentration (X7) showed a clear negative effect, suggesting that air pollution may constrain rural green development. Pesticide use intensity (X8) also displayed a negative nonlinear effect, indicating that higher levels of agricultural chemical input may increase environmental pressure and weaken rural green development. Urbanisation level (X3) did not show a simple linear effect, as both the direction and magnitude of its effect changed with the value of the variable. This suggests that urbanisation may promote rural green development by improving infrastructure and public services, but excessive or uneven urbanisation may also generate land-use pressure and ecological constraints.
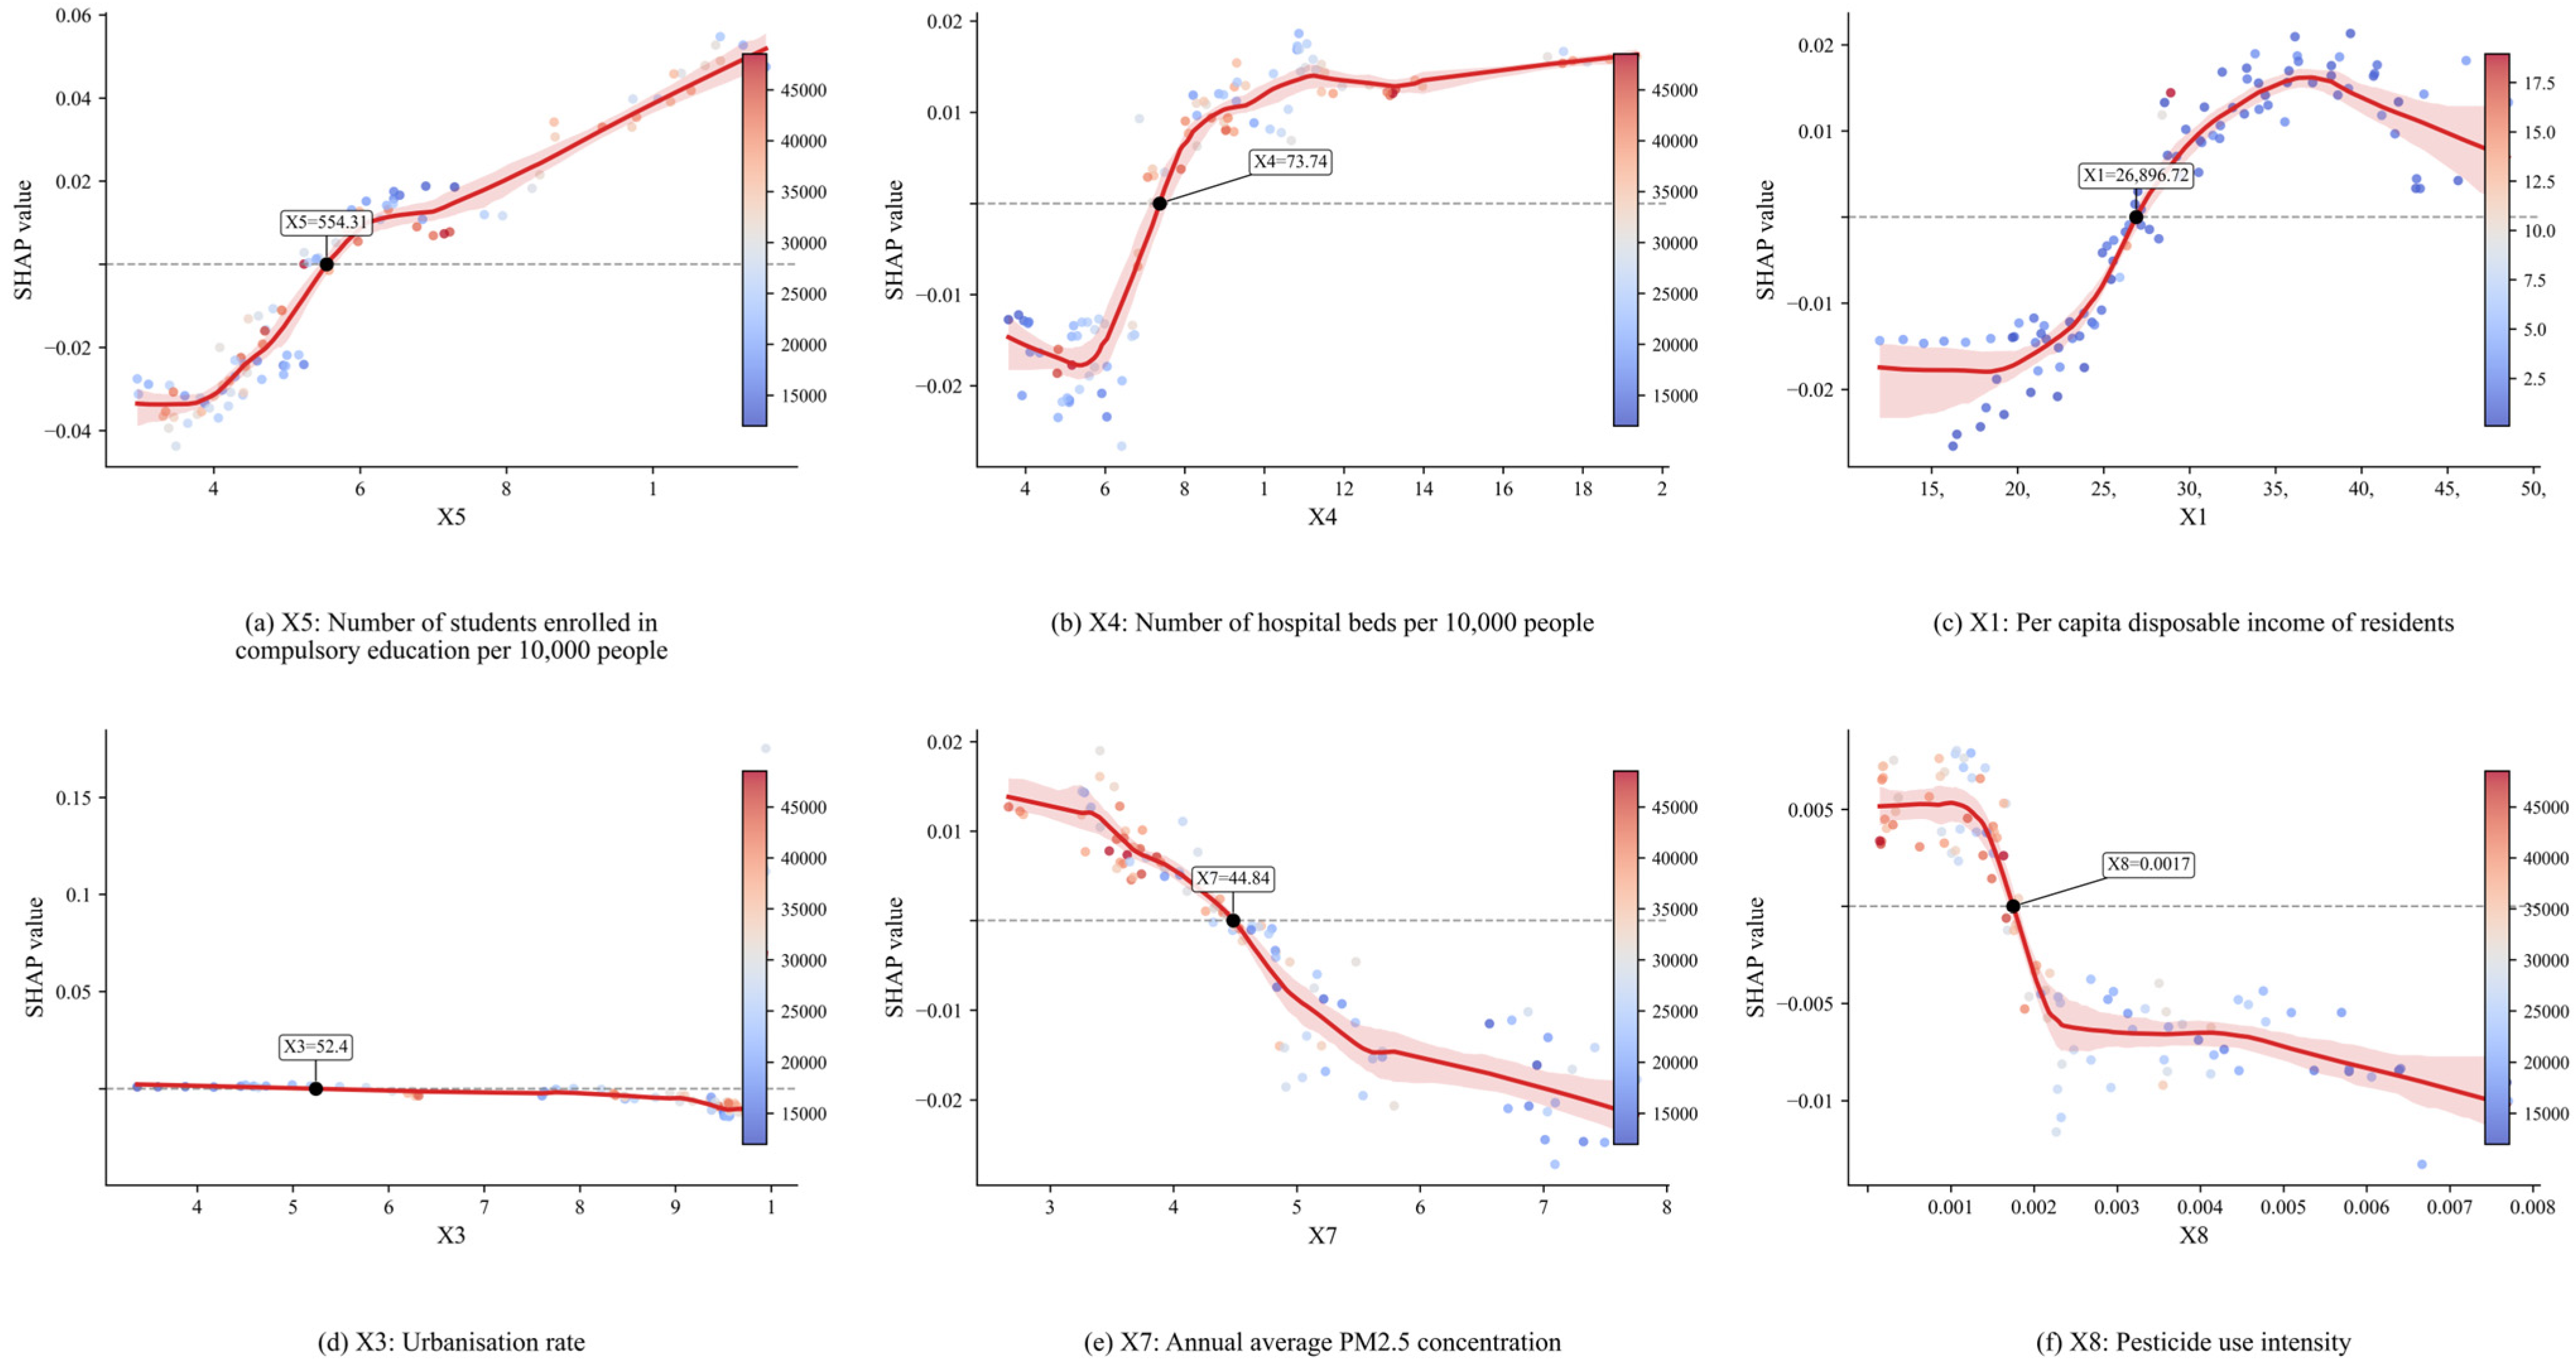
To further identify the nonlinear effects of key driving factors, this study selected the six most influential variables according to the SHAP importance ranking, namely X5, X4, X1, X3, X7 and X8, and produced a composite SHAP dependence figure, as shown in Figure 6.
Figure 6. SHAP dependence plots of the key driving factors for rural green development in the Chang-Zhu-Tan Ecological Green Heart region.
The results indicate that human capital (X5) made the strongest positive contribution to rural green development and showed a clear threshold effect. When the number of students enrolled in compulsory education per 10,000 people reached approximately 539.24, the SHAP value changed from negative to positive, after which the marginal contribution continued to increase. Medical resources (X4) also showed a clear positive threshold effect. When the number of hospital beds per 10,000 people reached approximately 76.09, the SHAP value turned from negative to positive and then increased gradually. Per capita disposable income of residents (X1) generally contributed positively to rural green development. When income exceeded approximately 27,608.20 yuan, its SHAP value became positive, but the marginal promoting effect weakened at higher income levels, suggesting a certain diminishing marginal effect of income growth.
Urbanisation level (X3) showed a more complex nonlinear pattern. For most observations, its contribution to rural green development was relatively limited and fluctuated around zero. However, at very high levels of urbanisation, the SHAP value changed more markedly. This indicates that urbanisation may improve infrastructure, public services and resource allocation efficiency after reaching a certain stage, but its effect is not simply linear and may vary across regions [43]. By contrast, annual average PM2.5 concentration (X7) showed a clear negative contribution to rural green development. When PM2.5 concentration exceeded approximately 46.40, the SHAP value changed from positive to negative and continued to decline, indicating that deteriorating air quality may constrain rural green development. Pesticide use intensity (X8) also showed a negative nonlinear effect. When pesticide use intensity increased beyond a relatively low level, its SHAP value decreased rapidly and remained negative, suggesting that excessive agricultural chemical input may increase environmental pressure and weaken rural green development.
Overall, the driving factors of rural green development in the Chang-Zhu-Tan Ecological Green Heart region showed clear nonlinear and heterogeneous characteristics. Human capital, medical resources and income level were the main positive contributors, while air pollution and pesticide use intensity acted as important environmental constraints. Urbanisation showed a stage-specific and nonlinear effect. These findings suggest that promoting rural green development should not rely on single-factor input but should instead emphasise the coordinated advancement of human capital accumulation, public service improvement, residents’ income growth, urban–rural coordination and ecological environmental governance.

4.4.3. Analysis of Interaction Effects Among Driving Factors

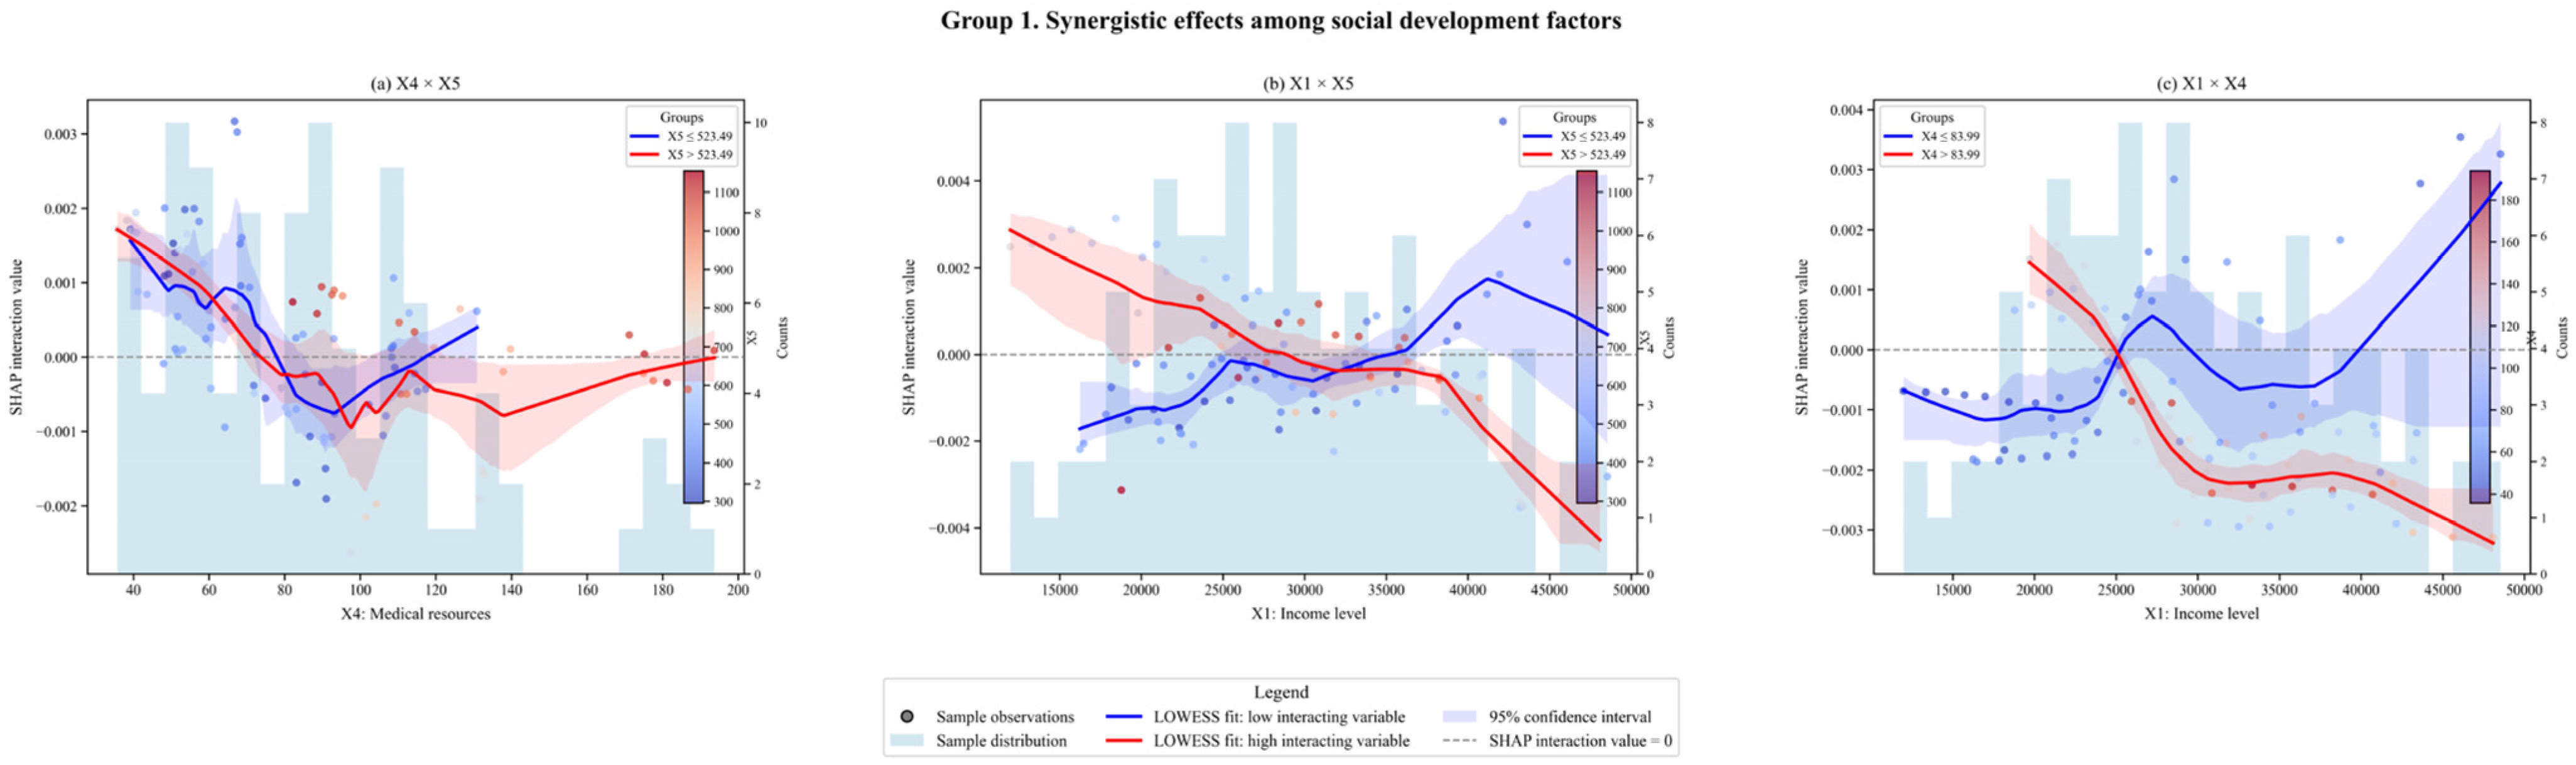
Building on the analysis of single-factor effects, this section further examines the interaction relationships among different driving factors and their joint contributions to rural green development in the Chang-Zhu-Tan Ecological Green Heart region. Based on SHAP interaction dependence plots, this study analyses the interaction effects among key variables (Figure 7). According to the updated SHAP feature importance ranking, the analysis focuses on the interactions among human capital (X5), medical resources (X4), per capita disposable income of residents (X1), urbanisation level (X3), air quality represented by annual average PM2.5 concentration (X7), and pesticide use intensity (X8).
Figure 7. SHAP interaction effects among social development factors.
(1)
Synergistic interactions among social development factors
The first group reflects the interaction effects among social development factors, including medical resources and human capital (X4 × X5), income level and human capital (X1 × X5), and income level and medical resources (X1 × X4). Among these interactions, income level and medical resources (X1 × X4) showed the strongest contribution, with a mean absolute SHAP interaction value of 0.001568 and a relative contribution of 41.65%, followed by income level and human capital (X1 × X5), with a relative contribution of 34.30%. The interaction between medical resources and human capital (X4 × X5) was relatively weaker, but it showed a positive mean SHAP interaction value, suggesting a more stable positive association between public service provision and human capital accumulation.
These results indicate that the social foundation of rural green development is not determined by income, education or medical resources alone, but by their coordinated effects. In areas with better educational foundations, income growth may be more easily transformed into green production capacity, technology adoption and environmental governance participation. However, the negative interaction ratios of X1 × X4 and X1 × X5 suggest that the marginal contribution of income growth or medical resource improvement may weaken when basic development conditions are already relatively high. Therefore, improving human capital and basic public services remains particularly important for relatively lagging counties and districts, where these factors can enhance the role of income growth in rural green development.
(2)
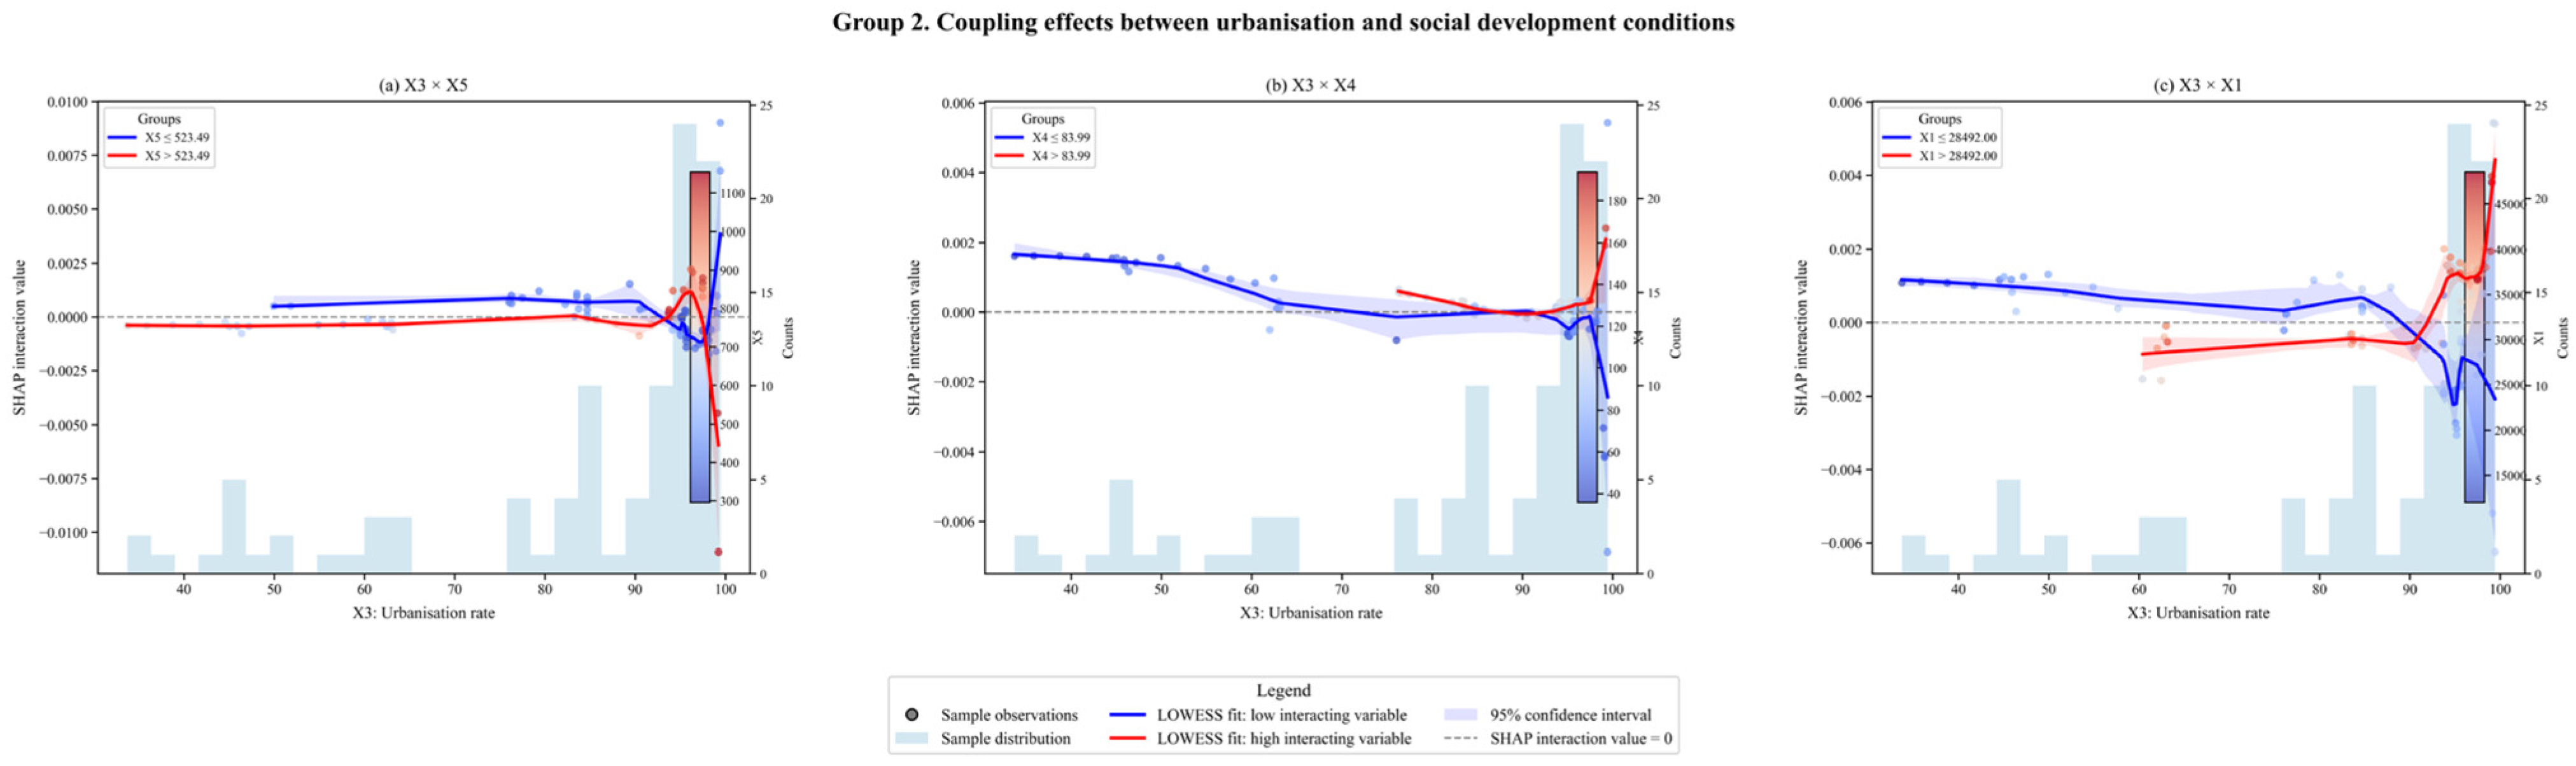
Coupling effects between urbanisation and social development conditions
The second group reflects the interaction effects between urbanisation and social development conditions, including urbanisation level and human capital (X3 × X5), urbanisation level and medical resources (X3 × X4), and urbanisation level and income level (X3 × X1) (Figure 8). The results show that the interaction effects of urbanisation were generally weak at low and medium levels but became more evident when urbanisation reached a relatively high level. This suggests that the contribution of urbanisation to rural green development depends on local social development conditions.
Figure 8. SHAP interaction effects between urbanisation and social development factors.
Specifically, stronger human capital, better medical resources and higher income levels may help transform urbanisation into improvements in infrastructure, public services, resource allocation and green technology adoption. By contrast, when these supporting conditions are insufficient, rapid or uneven urbanisation may fail to generate positive green development effects and may instead increase land-use pressure, ecological constraints and public service mismatch. Therefore, in the Chang-Zhu-Tan Ecological Green Heart region, urbanisation should be coordinated with human capital accumulation, public service improvement and income growth in order to better support rural green development.
(3)
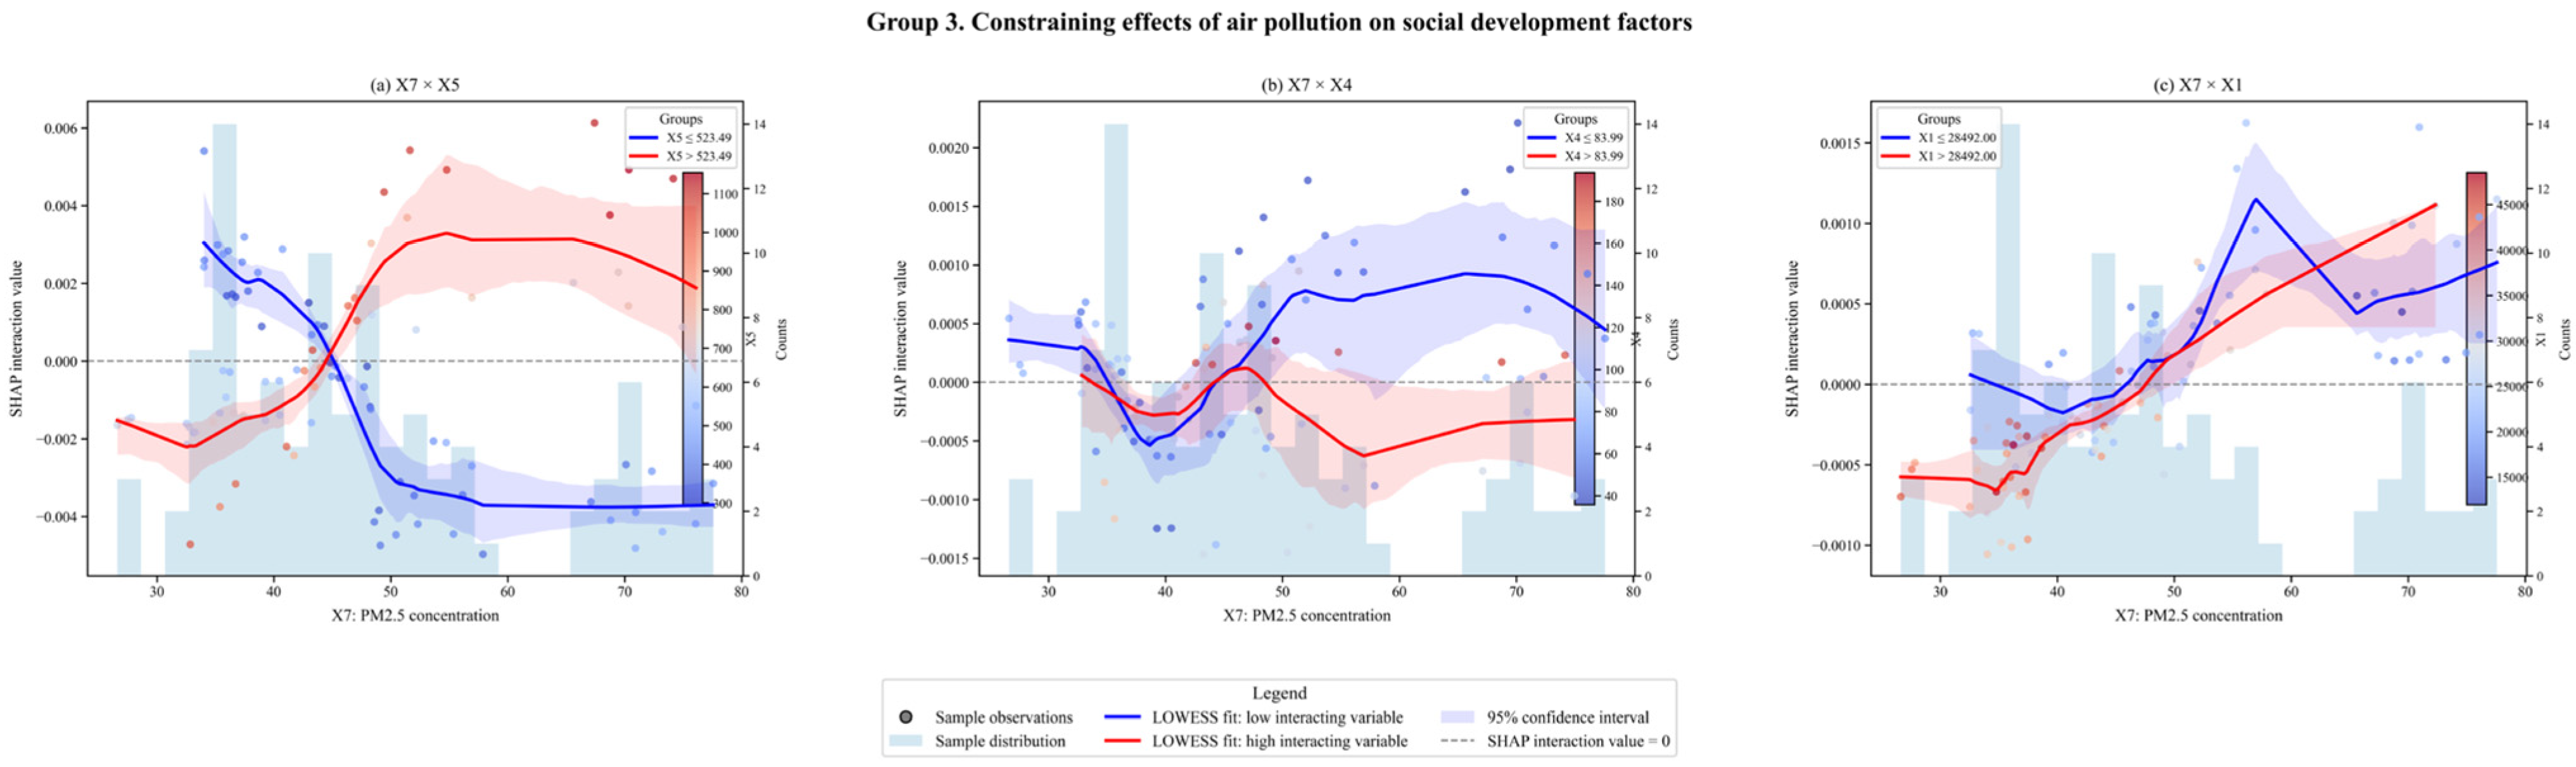
Constraining effects of air pollution on social development factors
The third group reflects the interaction effects between air pollution and social development factors, including PM2.5 concentration and human capital (X7 × X5), PM2.5 concentration and medical resources (X7 × X4), and PM2.5 concentration and income level (X7 × X1) (Figure 9). The results show that air pollution acted as an important environmental constraint on rural green development, but its interaction effects varied under different social development conditions.
Figure 9. SHAP interaction effects between PM2.5 concentration and social development factors.
Specifically, higher human capital, better medical resources and higher income levels may partly weaken or modify the negative contribution of PM2.5 pollution by improving environmental awareness, health resilience, financial capacity and local governance ability. By contrast, in areas with weaker education, insufficient medical resources or lower income levels, increasing PM2.5 concentration may more strongly constrain rural green development by raising health risks, reducing living environment quality and limiting the capacity for environmental governance. Therefore, improving rural green development in the Chang-Zhu-Tan Ecological Green Heart region requires not only strengthening air pollution control but also enhancing education, medical services and residents’ income to improve the region’s capacity to cope with environmental pressure.
(4)
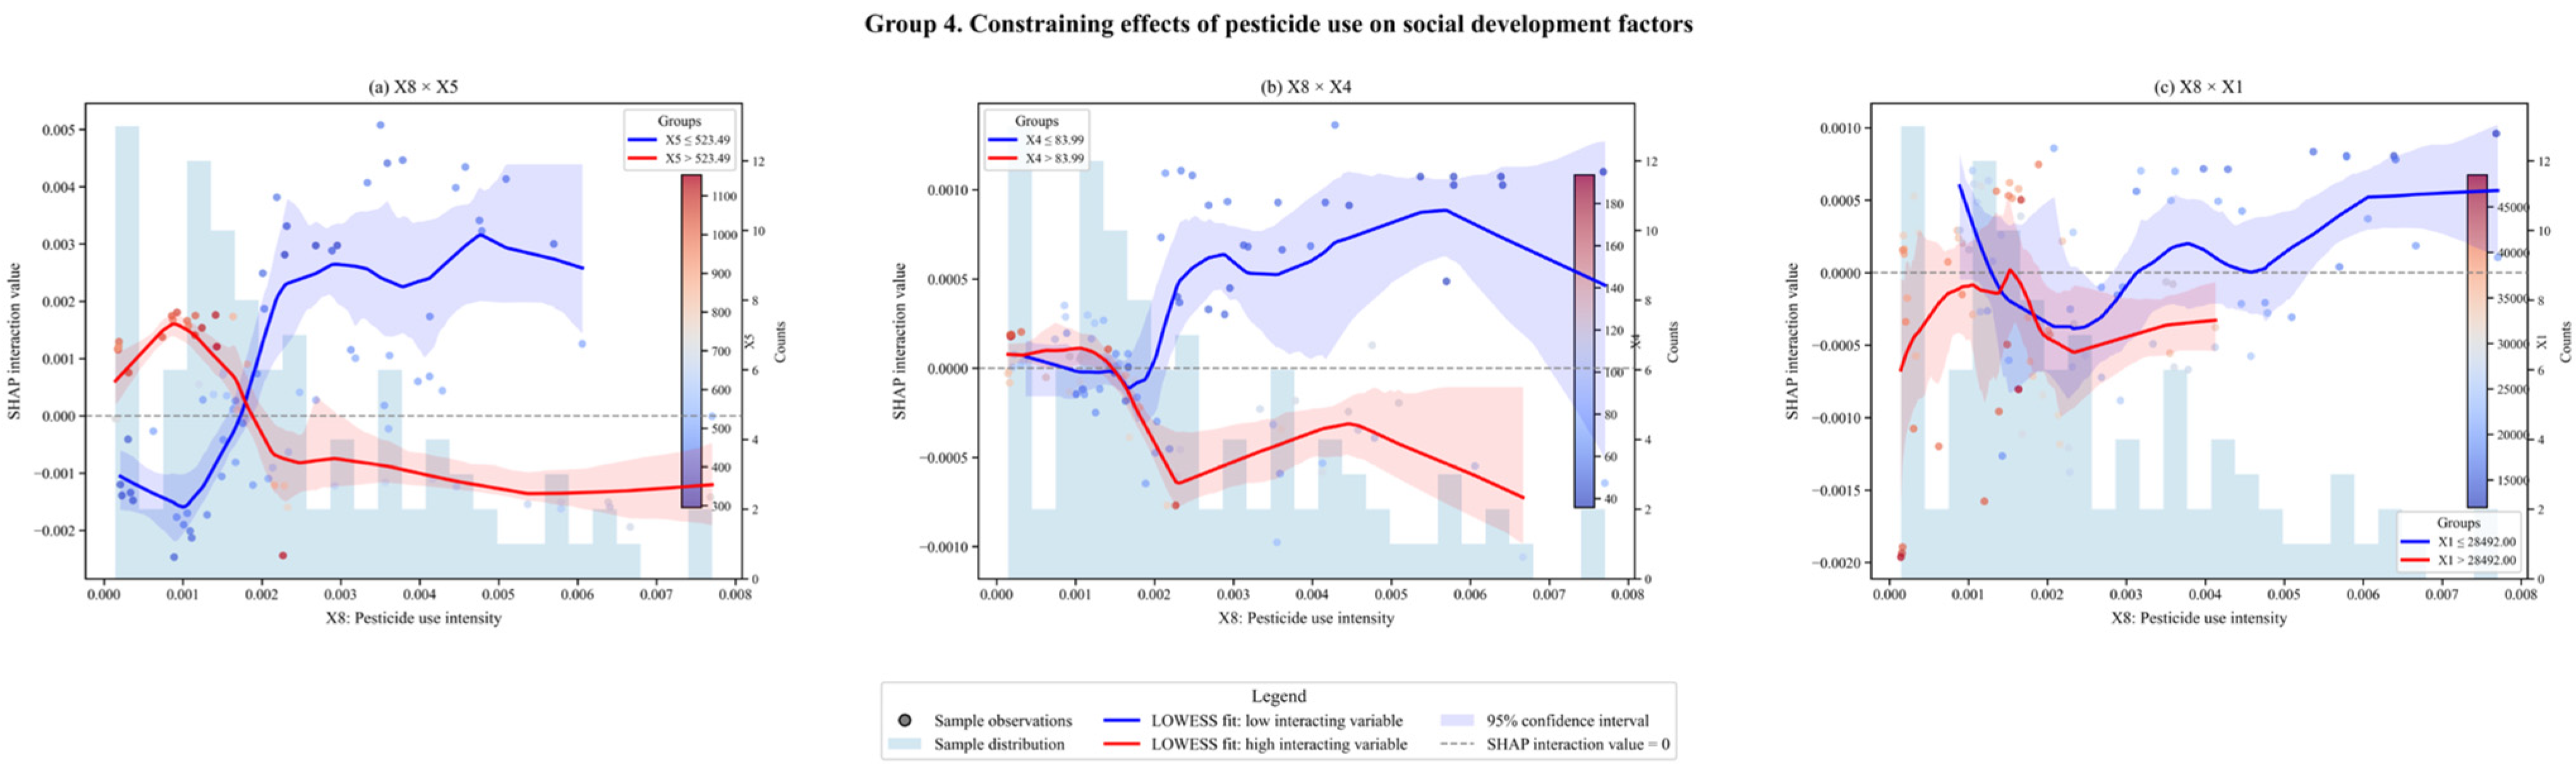
Constraining effects of pesticide use on social development factors
The fourth group reflects the interaction effects between pesticide use intensity and social development factors, including pesticide use intensity and human capital (X8 × X5), pesticide use intensity and medical resources (X8 × X4), and pesticide use intensity and income level (X8 × X10) (Figure 10). The results show that pesticide use intensity acted as an important agricultural environmental constraint on rural green development, and its negative contribution became more evident when pesticide input increased beyond a certain level.
Figure 10. SHAP interaction effects between pesticide use intensity and social development factors.
Specifically, human capital, medical resources and income level may help improve agricultural production efficiency and environmental awareness under relatively low pesticide use intensity. However, when pesticide use intensity remains high, these positive social development conditions may be weakened by the environmental pressure associated with agricultural chemical input. In higher-income or better-developed areas, excessive pesticide use may become a more visible constraint on green transformation, while in lower-income areas, the weaker interaction effect may reflect short-term dependence on chemical inputs to maintain agricultural output. Therefore, improving rural green development requires not only enhancing education, public services and residents’ income but also reducing pesticide dependence, promoting green agricultural technologies and strengthening agricultural non-point source pollution control.
(5)
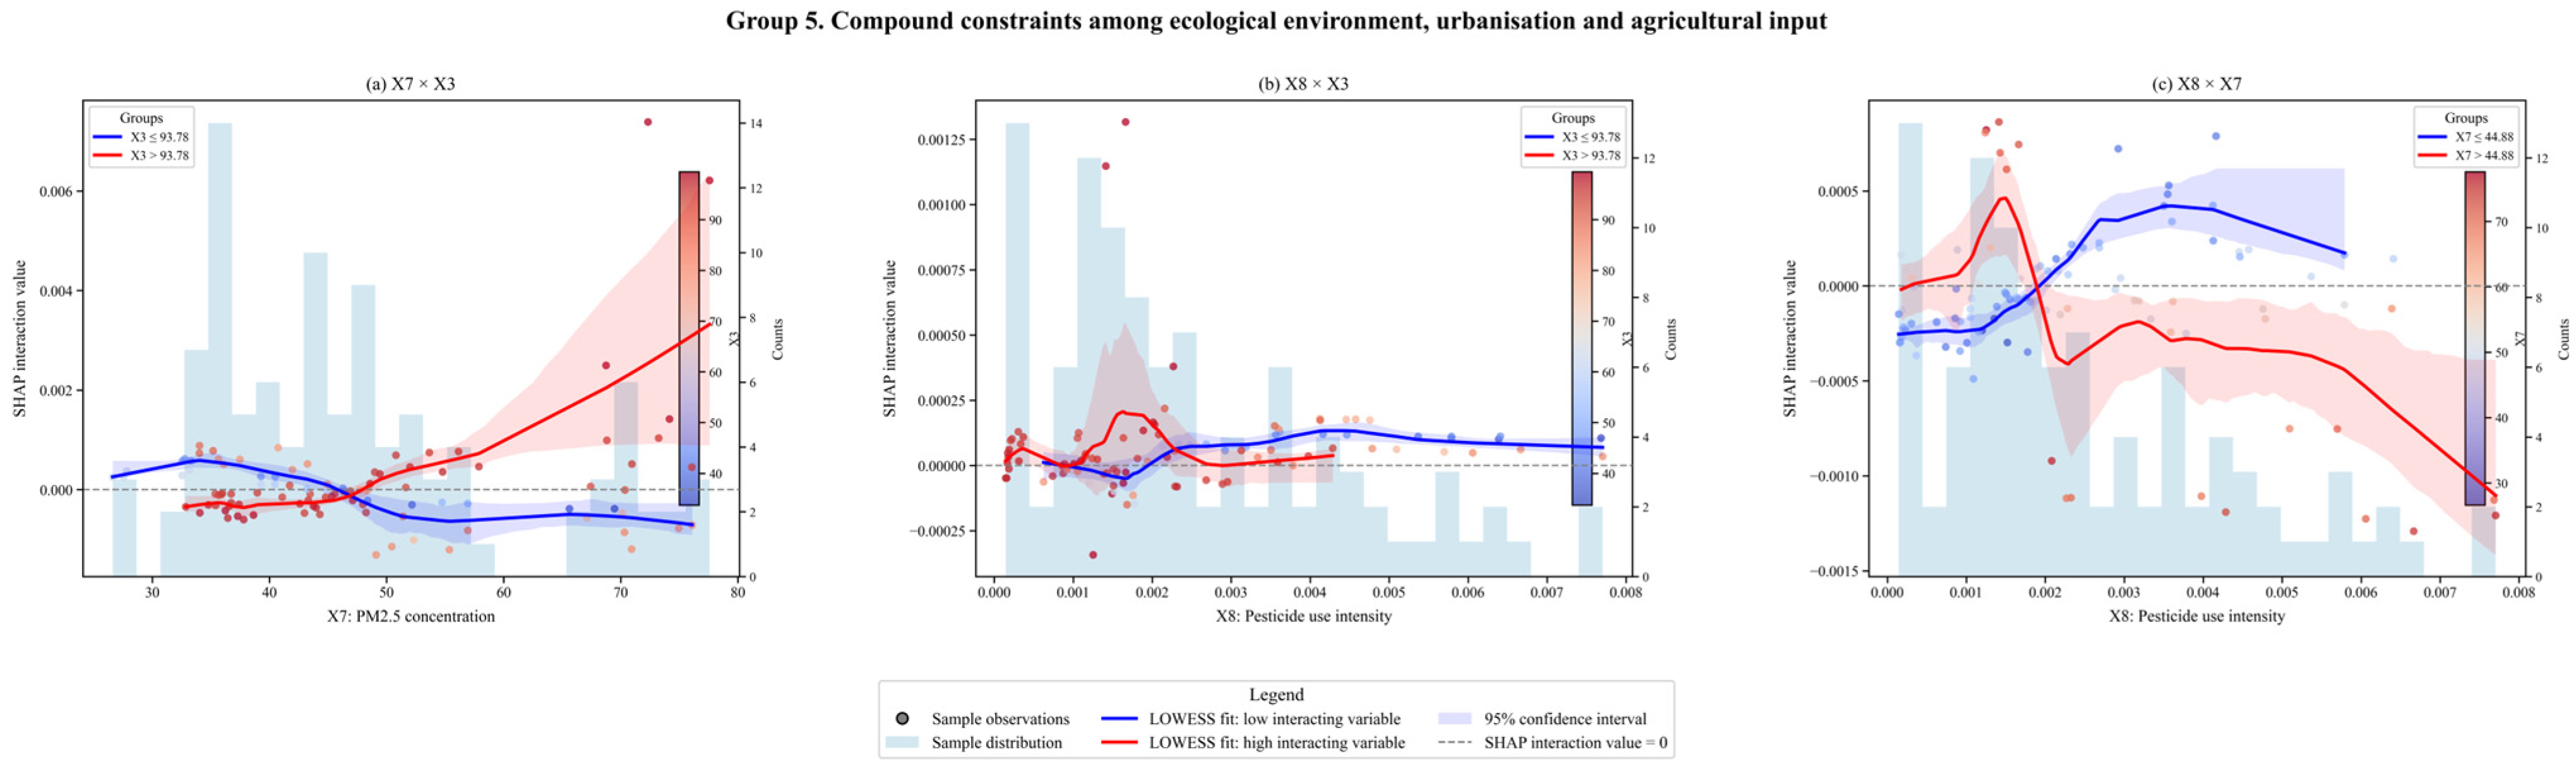
Compound constraints among ecological environment, urbanisation and agricultural input
The fifth group reflects the compound interaction effects among ecological environment, urbanisation and agricultural input, including PM2.5 concentration and urbanisation level (X7 × X3), pesticide use intensity and urbanisation level (X8 × X3), and pesticide use intensity and PM2.5 concentration (X8 × X7) (Figure 11). The results show that the constraints of air pollution and pesticide use became more evident when urbanisation or environmental pressure reached higher levels, indicating that ecological pressure, urbanisation and agricultural input may jointly shape rural green development.
Figure 11. Compound SHAP interaction effects among urbanisation, PM2.5 concentration and pesticide use intensity.
Specifically, under higher urbanisation levels, PM2.5 pollution may interact with land-use expansion, population concentration and industrial activities, thereby strengthening environmental constraints on rural green development. Similarly, pesticide use intensity showed more variable interaction effects in highly urbanised areas, suggesting that urbanisation may change agricultural production patterns and land-use structures, while high pesticide input may further increase agricultural non-point source pollution pressure. In addition, when PM2.5 concentration was already high, increasing pesticide use intensity tended to generate a more negative interaction effect, indicating that air pollution and agricultural chemical input may jointly weaken rural green development.
Overall, ecological environmental quality, urbanisation process and agricultural input intensity form a compound constraint system for rural green development in the Chang-Zhu-Tan Ecological Green Heart region. Therefore, rural green development in this region requires integrated governance rather than single-factor intervention. Policy efforts should coordinate urbanisation guidance, air pollution reduction, agricultural non-point source pollution control and the green transformation of agricultural production.

5. Conclusions and Suggestions

5.1. Conclusions

Based on panel data for 10 counties, county-level cities and districts in the Chang-Zhu-Tan Ecological Green Heart region from 2013 to 2022, this study constructed an evaluation index system for rural green development and analysed its development level, spatial pattern, regional disparities and potential driving mechanisms by combining the combined weighting–TOPSIS model, Global Moran’s I, the Theil index and the XGBoost–SHAP method. The main conclusions are as follows.
(1)
Rural green development in the Chang-Zhu-Tan Ecological Green Heart region showed a fluctuating upward trend from 2013 to 2022. The regional average index increased from 0.315 to 0.378, indicating an overall improvement during the study period. However, this improvement was spatially uneven. High-value areas gradually expanded, especially in Liuyang City and the core areas of the Changsha group, while some counties and districts remained at relatively low levels. The Global Moran’s I results did not support statistically significant global spatial autocorrelation, suggesting that the spatial pattern should be understood mainly as regional differentiation and certain local high-value concentration rather than significant global spatial clustering.
(2)
The Theil index results show that overall disparities in rural green development narrowed substantially during the study period. The decomposition results further indicate that inter-group disparities among the Changsha, Zhuzhou and Xiangtan groups continued to decline, while intra-group disparities remained the main source of overall disparities. In particular, internal disparities within the Zhuzhou group became increasingly prominent. This suggests that the focus of regional imbalance has shifted from differences among city groups to differences within city groups, highlighting the need for more refined county- and district-level governance.
(3)
The XGBoost–SHAP results show that rural green development was associated with multiple socioeconomic, ecological and agricultural factors. Human capital, medical resources, income level, urbanisation level, PM2.5 concentration and pesticide use intensity were the main explanatory factors. Among them, human capital, medical resources and income level generally made positive contributions to the model predictions, while higher PM2.5 concentration and pesticide use intensity tended to act as environmental constraints. This indicates that rural green development depends not only on economic growth but also on public service capacity, human capital accumulation and ecological environmental quality.
(4)
The SHAP interaction results further reveal the nonlinear and coupled characteristics of rural green development. Socioeconomic factors such as income, human capital and medical resources showed important interaction effects, while air pollution and pesticide use intensity may weaken the positive contributions of social development factors. These findings suggest that rural green development in urban-agglomeration ecological spaces should be understood as a multi-factor coupling process involving economic foundation, public service capacity, agricultural green transformation and ecological governance, rather than as the result of a single driving factor.
Overall, the key issue for rural green development in the Chang-Zhu-Tan Ecological Green Heart region is not only to raise the average development level but also to enhance the transformation capacity of relatively lagging counties and districts. Future improvement should rely on coordinated progress in socioeconomic development, ecological protection, agricultural green transformation and public service equalisation.

5.2. Suggestions

Green development is a long-term process that involves industrial transformation, public service improvement, ecological protection, rural construction, technological innovation and spatial governance. The empirical findings of this study indicate that rural green development in the Chang-Zhu-Tan Ecological Green Heart region has improved overall, but this improvement has been accompanied by clear regional differentiation, prominent intra-group disparities and complex interactions among socioeconomic and ecological factors. Accordingly, policy measures should move beyond a uniform governance approach and instead respond to the development level, disparity structure and major constraints of different groups and counties [44,45].
(1)
For the Changsha group, enhance the demonstration role and spillover capacity of high-value areas.
The evaluation results indicate that the Changsha group has become the main high-value area of rural green development, with Tianxin District, Yuhua District and Liuyang City maintaining relatively strong performance. For this group, the policy focus should no longer remain at the stage of basic improvement, but should shift towards quality enhancement, demonstration building and regional spillover. High-performing areas can further improve green infrastructure, promote digital and low-carbon agricultural technologies, and strengthen the efficiency of ecological governance. More importantly, their existing advantages should be translated into wider regional benefits. This can be achieved through technology diffusion, public service sharing, ecological product value realisation and cooperation in green industries. By strengthening these linkages, the Changsha group can help narrow the gap between its core and non-core areas while continuing to play a leading role in regional rural green development.
(2)
For the Zhuzhou group, reduce internal disparities and strengthen the green transformation capacity of lagging areas.
The Theil index decomposition suggests that intra-group disparities have become the main source of overall disparities, and the internal disparity contribution of the Zhuzhou group increased markedly during the study period. This means that uneven development within the Zhuzhou group has become a key issue affecting regional balance. Policy efforts should therefore place greater emphasis on relatively lagging areas, particularly Shifeng District. For these areas, the priority should be to improve the basic conditions for green transformation, including industrial upgrading, land-use efficiency, ecological restoration, rural infrastructure and public service provision. At the same time, Hetang District and Tianyuan District, which showed faster improvement, should consolidate their existing progress by expanding cleaner production, green technology application and low-carbon rural industries. In this way, the Zhuzhou group can gradually reduce its internal development gap while improving the green transformation capacity of its weaker areas.
(3)
For the Xiangtan group, improve basic development capacity and avoid low-level balanced development.
The Xiangtan group showed a relatively low overall level of rural green development, while its internal disparities remained limited. This pattern should not be simply interpreted as coordinated development. Rather, it may indicate a low-level balanced state in which several areas face similar development constraints. For this reason, policy measures in the Xiangtan group should focus on strengthening the basic capacity for rural green development. Yuhu District and Xiangtan County need to prioritise rural infrastructure improvement, public service provision, human capital accumulation, ecological governance capacity and rural industrial upgrading. Yuetang District, which improved relatively rapidly, can be used as a local demonstration area for green transformation within the group. The main policy objective is to raise the development level of lower-performing areas towards the regional average and prevent low-level equilibrium from becoming a persistent pattern [46].
(4)
Build a regional governance framework that combines disparity identification, multi-factor coordination and spatial regulation.
The Global Moran’s I results indicate that rural green development in the study area did not form statistically significant global spatial clustering. Meanwhile, the Theil index results show that regional imbalance was mainly reflected in intra-group disparities. This suggests that governance should not rely only on broad spatial clustering assumptions, but should pay closer attention to the identification of specific lagging counties and districts. A monitoring framework can be established using the rural green development index, the Theil index and the contribution rate of intra-group disparities. The rural green development index can be used to evaluate the development level of each county or district, the Theil index can track the overall degree of regional imbalance, and the intra-group contribution rate can help identify where internal differentiation is most pronounced.
The XGBoost–SHAP results further indicate that rural green development is associated with the combined effects of human capital, income level, medical resources, urbanisation level, PM2.5 concentration and pesticide use intensity. Therefore, future governance should shift from single-factor improvement to coordinated policy combinations. Education investment, income growth, grassroots medical services, ecological restoration, agricultural non-point source pollution control and green technology application need to be better integrated. Particular attention should be given to PM2.5 pollution control and the reduction of excessive pesticide dependence, because ecological and agricultural environmental pressures may weaken the positive contributions of socioeconomic development [47].
In addition, the Chang-Zhu-Tan Ecological Green Heart region is located within a rapidly urbanising urban agglomeration. Rural green development in this region is therefore closely related to land-use regulation, ecological space protection and urban–rural spatial coordination. Strengthening these aspects can help reduce the ecological pressure generated by disorderly urban expansion and improve the ability of counties and districts to transform socioeconomic resources into rural green development performance [48].

5.3. Limitations and Future Research

The findings of this study should be understood in light of several limitations. The first limitation relates to the construction of the evaluation index system. Although the selected indicators cover the economic, social and environmental dimensions of rural green development, the evaluation is still constrained by the availability of continuous and comparable county-level data. Some aspects that are important for understanding rural green development, such as village infrastructure quality, public service accessibility, rural road connectivity, land-use structure, settlement morphology and the quality of rural living environments, could not be fully incorporated. In addition, several indicators were derived from aggregate county-level statistics rather than strictly rural-specific data. This may make it difficult to completely separate rural development conditions from broader county-level socioeconomic conditions, especially in highly urbanised districts. Therefore, the evaluation results should be regarded as a county-level approximation of rural green development rather than a complete representation of all rural spatial, ecological and governance characteristics.
The second limitation concerns the interpretive scope of the methods used in this study. The combined weighting–TOPSIS model provides a systematic and comparable way to measure rural green development, and the Theil index helps reveal the structure and sources of regional disparities. However, these methods mainly describe development levels and disparity patterns, rather than explaining the deeper socioeconomic or institutional processes through which these differences are formed. Similarly, the XGBoost–SHAP approach is useful for identifying the relative importance, nonlinear associations and interaction relationships of different driving factors, but SHAP values reflect model-based associations rather than verified causal effects. For this reason, the driving factors and interaction effects identified in this study should be interpreted as exploratory evidence that helps reveal potential relationships, rather than as definitive causal conclusions.
The spatial analysis also has certain scale-related limitations. This study uses 10 county-level units as the basic spatial units, which restricts the statistical power of spatial autocorrelation analysis. The Global Moran’s I results did not indicate a statistically significant pattern of global spatial clustering, but this does not rule out the possibility of local spatial dependence, spatial heterogeneity or spillover effects at finer spatial scales. In addition, the Chang-Zhu-Tan Ecological Green Heart region has distinctive characteristics as an ecological green space embedded within an urban agglomeration. Its ecological protection function, urban–rural interactions and spatial governance context make it a meaningful case but also mean that the findings may not be directly transferable to regions with different ecological functions, development stages or governance structures.
Future research can be improved in several ways. First, finer-scale spatial data, including township- and village-level statistics, remote sensing data, land-use data, road network data, points of interest and field survey data, could be incorporated to better capture rural built environment quality, ecological conditions and spatial governance characteristics. Second, more rural-specific indicator systems should be developed to distinguish rural development conditions from aggregate county-level socioeconomic conditions more accurately. Third, the robustness of evaluation results could be further examined by using alternative weighting schemes, different evaluation models and longer time-series data. Finally, future studies could combine interpretable machine learning with spatial econometric models, geographically weighted models or causal inference methods to further examine local spatial heterogeneity, spatial spillover effects and the causal mechanisms underlying rural green development.

Author Contributions

Conceptualization, K.C. and Y.W.; methodology, Y.W., X.Y. and Y.C.; software, Y.W. and F.Y.; validation, K.C. and X.Y.; formal analysis, Y.W.; investigation, K.C., Y.W. and F.Y.; resources, X.Y. and Y.C.; data curation, Y.W.; writing—original draft preparation, K.C., Y.W. and X.Y.; writing—review and editing, K.C., Y.W., X.Y., Y.C. and F.Y.; visualization, Y.W. and X.Y. All authors have read and agreed to the published version of the manuscript.

Funding

This research received no external funding.

Institutional Review Board Statement

Not applicable.

Data Availability Statement

The data presented in this study are available on request from the corresponding author.

Acknowledgments

The authors would like to thank all individuals and institutions that provided support during the preparation of this study.

Conflicts of Interest

The authors declare no conflicts of interest.

References

  1. Wang, X.; Zhao, G.; Xiong, H. The Temporal-Spatial Evolution and Driving Mechanism of Rural Green Development in China. Pol. J. Environ. Stud. 2022, 31, 5313–5327. [Google Scholar] [CrossRef] [Scilit]
  2. Zhang, X.; Wu, H.; Li, Z.; Li, X. Spatial–Temporal Evolution Characteristics and Driving Factors of Rural Development in Northeast China. Land 2023, 12, 1407. [Google Scholar] [CrossRef] [Scilit]
  3. Zhu, K.; Wang, T.; He, J.; Song, D.; Wu, L.; Wu, D.; Huang, S.; Zhou, L.; Liu, J. Green development in the Chengdu-Chongqing economic zone: Evolution and drivers from a “production-living-ecology” perspective. Front. Environ. Sci. 2024, 12, 1506618. [Google Scholar] [CrossRef] [Scilit]
  4. Li, C.; Song, L. Regional Differences and Spatial Convergence of Green Development in China. Sustainability 2022, 14, 8511. [Google Scholar] [CrossRef] [Scilit]
  5. Chen, C.; Zhang, H. Evaluation of Green Development Level of Mianyang Agriculture, Based on the Entropy Weight Method. Sustainability 2023, 15, 7589. [Google Scholar] [CrossRef] [Scilit]
  6. Geng, Y.; Yang, X.; Zhang, N.; Li, J.; Yan, Y. Sustainable rural development: Differentiated paths to achieve rural revitalization with case of Western China. Sci. Rep. 2024, 14, 31507. [Google Scholar] [CrossRef] [Scilit] [PubMed]
  7. Huang, J.; Duan, X.; Li, Y.; Guo, H. Spatial-temporal evolution and driving factors of green high-quality agriculture development in China. Front. Environ. Sci. 2023, 11, 1320700. [Google Scholar] [CrossRef] [Scilit]
  8. Liang, K.; Luo, L. Measurement of China’s green development level and its spatial differentiation in the context of carbon neutrality. PLoS ONE 2023, 18, e0284207. [Google Scholar] [CrossRef] [Scilit] [PubMed]
  9. Hua, Y.; Zhang, J.; Ding, X.; Ding, G. Does New Urbanization Support the Rural Inclusive Green Development under Domestic Circulation in China? Sustainability 2024, 16, 2950. [Google Scholar] [CrossRef] [Scilit]
  10. Zhu, K.; Song, D.; Zhang, L.; He, Y.; Zhang, S.; Liu, Y.; Tian, X. Evolving Trends and Influencing Factors of the Rural Green Development Level in Chongqing. Land 2023, 12, 1333. [Google Scholar] [CrossRef] [Scilit]
  11. Liu, Y.; Lu, C.; Chen, X. Dynamic analysis of agricultural green development efficiency in China: Spatiotemporal evolution and influencing factors. J. Arid Land 2023, 15, 127–144. [Google Scholar] [CrossRef] [Scilit]
  12. Lu, W.; Zhang, X. Spatial and Temporal Characteristics and Regional Difference in China’s Provincial Green Low-Carbon Development. Sustainability 2025, 17, 8180. [Google Scholar] [CrossRef] [Scilit]
  13. Wang, J.; Han, X.; Liu, W.; Ni, C.; Wu, S. Comprehensive assessment system and spatial difference analysis on development level of green sustainable agriculture based on life cycle and SA-PP model. J. Clean. Prod. 2024, 434, 139724. [Google Scholar] [CrossRef] [Scilit]
  14. Li, C.; Zhang, R.; Li, T.; Guo, H.; Guo, R. Dynamic Changes and Influencing Factors of Vegetation in the “Green Heart” Zone of the Chang-Zhu-Tan Urban Agglomeration during the Past 21 Years. Int. J. Environ. Res. Public Health 2023, 20, 4517. [Google Scholar] [CrossRef] [Scilit] [PubMed]
  15. He, L.; Bai, Y. Effectiveness of China’s green heart strategy in urban agglomerations: A case study of Hunan Province. Environ. Dev. Sustain. 2026. [Google Scholar] [CrossRef] [Scilit]
  16. Deng, Z.; Quan, B.; Zhang, H.; Xie, H.; Zhou, Z. Scenario Simulation of Land Use and Cover under Safeguarding Ecological Security: A Case Study of Chang-Zhu-Tan Metropolitan Area, China. Forests 2023, 14, 2131. [Google Scholar] [CrossRef] [Scilit]
  17. Ouyang, J.; Zhang, P.; Yu, H.; Zhang, N.; Liu, Y. Analysis on Coupling Coordination Degree Between Livelihood Strategy for Peasant Households and Land Use Behavior in Ecological Conservation Areas—A Case Study of the Chang-Zhu-Tan Ecological Greenheart Area. Sustainability 2025, 17, 3996. [Google Scholar] [CrossRef] [Scilit]
  18. Zhang, Q.; Cen, T.; Zhong, Y.; Peng, W. Dynamic Characteristics of the Forest Recreation Network in Chang-Zhu-Tan Green Heart Based on Multivariate Heterogeneous Data. Forests 2025, 16, 1800. [Google Scholar] [CrossRef] [Scilit]
  19. Tang, Y.; Shen, S.; Zhan, W.; Lu, Y.; He, P.; Cheng, H. Ecological Importance Evaluation of the Changzhutan Ecological Green Heart. Wirel. Commun. Mob. Comput. 2022, 2022, 2711719. [Google Scholar] [CrossRef] [Scilit]
  20. Standing Committee of the Hunan Provincial People’s Congress. Regulations of Hunan Province on the Protection of the Chang-Zhu-Tan Ecological Green Heart. 2024. Available online: https://www.hnrd.gov.cn/content/646840/98/13978230.html (accessed on 10 July 2026).
  21. Hunan Provincial Development and Reform Commission; Hunan Provincial Department of Natural Resources. Plan for High-Level Protection and High-Quality Development of the Chang-Zhu-Tan Ecological Green Heart (2024–2035). 2025. Available online: https://fgw.hunan.gov.cn/fgw/xxgk_70899/ghjh/202504/t20250407_33633321.html (accessed on 10 July 2026).
  22. Amusa, L.B.; Hossana, T. An empirical comparison of some missing data treatments in PLS-SEM. PLoS ONE 2024, 19, e0297037. [Google Scholar] [CrossRef] [Scilit] [PubMed]
  23. Liu, G.; Zhu, J.; Liu, X. Comprehensive Evaluation of Regional Logistics Competitiveness Considering Multiple Reference Points and Dynamic Index Improved Analytic Hierarchy Process. Symmetry 2020, 12, 847. [Google Scholar] [CrossRef] [Scilit]
  24. Liu, D.; Li, F.; Qiu, M.; Zhang, Y.; Zhao, X.; He, J. An integrated framework for measuring sustainable rural development towards the SDGs. Land Use Policy 2024, 147, 107339. [Google Scholar] [CrossRef] [Scilit]
  25. Li, X.; Yang, H.; Jia, J.; Shen, Y.; Liu, J. Index system of sustainable rural development based on the concept of ecological livability. Environ. Impact Assess. Rev. 2021, 86, 106478. [Google Scholar] [CrossRef] [Scilit]
  26. Chen, Y.; Kipkulei, H.K.; Xie, Z.; Sieber, S. Assessment of agricultural sustainability performance in Dali Prefecture, China using the DPSIR Model. Int. J. Agric. Sustain. 2024, 22, 2401201. [Google Scholar] [CrossRef] [Scilit]
  27. Zhang, J.; Fan, X.; Liu, L.; Ma, L.; Bai, Z.; Ma, W. Comparison of indicators for agricultural green development and the Sustainable Development Goals, and mapping the way forward. Front. Agric. Sci. Eng. 2024, 11, 69–82. [Google Scholar] [CrossRef] [Scilit]
  28. Xia, Q.; Tian, G.; Zhao, D.; Zhao, Q.; Varis, O. Effects of new-type urbanization on resource pressure: Evidence from a water-energy-food system perspective in China. Sustain. Cities Soc. 2024, 107, 105411. [Google Scholar] [CrossRef] [Scilit]
  29. Liu, H.; Li, Z.; He, Q. Suitability Assessment of Multilayer Urban Underground Space Based on Entropy and CRITIC Combined Weighting Method: A Case Study in Xiong’an New Area, China. Appl. Sci. 2023, 13, 10231. [Google Scholar] [CrossRef] [Scilit]
  30. Mukhametzyanov, I. Specific character of objective methods for determining weights of criteria in MCDM problems: Entropy, CRITIC and SD. Decis. Mak. Appl. Manag. Eng. 2021, 4, 76–105. [Google Scholar] [CrossRef] [Scilit]
  31. Li, P.; Qian, H.; Wu, J.; Chen, J. Sensitivity analysis of TOPSIS method in water quality assessment: I. Sensitivity to the parameter weights. Environ. Monit. Assess. 2013, 185, 2453–2461. [Google Scholar] [CrossRef] [Scilit] [PubMed]
  32. Ma, X.-F.; Zhang, R.; Ruan, Y.-F. How to evaluate the level of green development based on entropy weight TOPSIS: Evidence from China. Int. J. Environ. Res. Public Health 2023, 20, 1707. [Google Scholar] [CrossRef] [Scilit] [PubMed]
  33. Fu, X.; Wang, M.; Zhang, D.; Chen, F.; Peng, X.; Wang, L.; Tan, S.K. An XGBoost-SHAP framework for identifying key drivers of urban flooding and developing targeted mitigation strategies. Ecol. Indic. 2025, 175, 113579. [Google Scholar] [CrossRef] [Scilit]
  34. Li, Y.; He, Y.; Yang, F.; An, H.; Li, J.; Xie, Y. An XGBoost-SHAP analysis of the driving factors of carbon emissions in China’s first-tier cities. Sci. Rep. 2026, 16, 1659. [Google Scholar] [CrossRef] [Scilit]
  35. Jiang, B. Head/Tail Breaks: A New Classification Scheme for Data with a Heavy-Tailed Distribution. Prof. Geogr. 2013, 65, 482–494. [Google Scholar] [CrossRef] [Scilit]
  36. Brewer, C.A.; Pickle, L. Evaluation of Methods for Classifying Epidemiological Data on Choropleth Maps in Series. Ann. Assoc. Am. Geogr. 2002, 92, 662–681. [Google Scholar] [CrossRef] [Scilit]
  37. Beecham, R.; Dykes, J.; Meulemans, W.; Slingsby, A.; Turkay, C.; Wood, J. Map LineUps: Effects of spatial structure on graphical inference. IEEE Trans. Vis. Comput. Graph. 2017, 23, 391–400. [Google Scholar] [CrossRef] [Scilit] [PubMed]
  38. Kim, J.-H. Multicollinearity and misleading statistical results. Korean J. Anesthesiol. 2019, 72, 558–569. [Google Scholar] [CrossRef] [Scilit] [PubMed]
  39. Smith, A.C.; Li, L.; Xiang, J.; Fang, F. Machine learning-based land-use regression models for predicting carbon dioxide concentrations in San Francisco Bay area. Environ. Earth Sci. 2025, 84, 539. [Google Scholar] [CrossRef] [Scilit] [PubMed]
  40. Rainio, O.; Teuho, J.; Klén, R. Evaluation metrics and statistical tests for machine learning. Sci. Rep. 2024, 14, 6086. [Google Scholar] [CrossRef] [Scilit] [PubMed]
  41. Lundberg, S.M.; Erion, G.; Chen, H.; DeGrave, A.; Prutkin, J.M.; Nair, B.; Katz, R.; Himmelfarb, J.; Bansal, N.; Lee, S.-I. From local explanations to global understanding with explainable AI for trees. Nat. Mach. Intell. 2020, 2, 56–67. [Google Scholar] [CrossRef] [Scilit] [PubMed]
  42. Freiesleben, T.; König, G.; Molnar, C.; Tejero-Cantero, Á. Scientific Inference with Interpretable Machine Learning: Analyzing Models to Learn About Real-World Phenomena. Minds Mach. 2024, 34, 32. [Google Scholar] [CrossRef] [Scilit]
  43. Auwalu, F.K.; Bello, M. Exploring the Contemporary Challenges of Urbanization and the Role of Sustainable Urban Development: A Study of Lagos City, Nigeria. J. Contemp. Urban Aff. 2023, 7, 175–188. [Google Scholar] [CrossRef] [Scilit]
  44. Ge, D.; Zhou, G.; Qiao, W.; Yang, M. Land use transition and rural spatial governance: Mechanism, framework and perspectives. J. Geogr. Sci. 2020, 30, 1325–1340. [Google Scholar] [CrossRef] [Scilit]
  45. Liu, J.; Fang, Y.; Wang, R.; Zou, C. Rural typology dynamics and drivers in peripheral areas: A case of Northeast China. Land Use Policy 2022, 120, 106260. [Google Scholar] [CrossRef] [Scilit]
  46. Dipeolu, A.A.; Ibem, E.O.; Oriola, O.A. Influence of Green Infrastructure on Residents’ Endorsement of the New Ecological Paradigm in Lagos, Nigeria. J. Contemp. Urban Aff. 2022, 6, 159–173. [Google Scholar] [CrossRef] [Scilit]
  47. Di Giuseppe, A.; Cardinali, M.; Castellani, B.; Filipponi, M.; Gambelli, A.M.; Postrioti, L.; Nicolini, A.; Rossi, F. The Effect of the Substrate on the Optic Performance of Retro-Reflective Coatings: An In-Lab Investigation. Energies 2021, 14, 2921. [Google Scholar] [CrossRef] [Scilit]
  48. Benameur, O.; Leghrib, F.; Laroui, A. Assessing Urban Green Space Accessibility for Sustainable Development in Mostaganem, Algeria: A Space Syntax Approach. J. Contemp. Urban Aff. 2024, 8, 197–211. [Google Scholar] [CrossRef] [Scilit]
Disclaimer/Publisher’s Note: The statements, opinions and data contained in all publications are solely those of the individual author(s) and contributor(s) and not of MDPI and/or the editor(s). MDPI and/or the editor(s) disclaim responsibility for any injury to people or property resulting from any ideas, methods, instructions or products referred to in the content.

Article Metrics

Citations

Article Access Statistics

Multiple requests from the same IP address are counted as one view.