Article

Effect of National Green Data Center Policy on Enterprise Green Transformation

1
Dong Fureng Institute of Economic and Social Development, Wuhan University, Wuhan 430072, China
2
Climate Change and Energy Economics Study Center, Wuhan University, Wuhan 430072, China
*
Author to whom correspondence should be addressed.
Sustainability 2026, 18(14), 7380; https://doi.org/10.3390/su18147380
Submission received: 18 June 2026 / Revised: 16 July 2026 / Accepted: 17 July 2026 / Published: 19 July 2026

Abstract

Building green data centers is an important task in constructing a new generation of information infrastructure and is an inevitable choice for promoting sustainable economic development. This study regards the implementation of the national green data center (NGDC) policy in batches as a quasi-natural experiment and uses the multiperiod difference-in-difference (DID) method to study the effect and mechanism of NGDC policy on the green transformation (GT) of Chinese listed enterprises. Research has found that the NGDC policy has a substantial improvement effect on the level of GT of enterprises, mainly achieved through two paths: enhancing the investment in environmental protection and improving the environmental, social, and corporate governance performance of enterprises. Heterogeneity analysis found that the effect of NGDC policy on empowering enterprises to improve their GT level is more remarkable in state-owned enterprises and those located in more competitive industries. In addition, the technology business environment and environmental regulation in the region emphasize the positive regulatory effect of NGDC policy on promoting enterprise GT. The results of this paper provide empirical evidence and policy implications for improving the construction of national green data centers and promoting sustainable development of enterprises.

1. Introduction

Coping with climate change and achieving sustainable development has become a consensus among countries around the world. As a core area of carbon emissions and resource consumption, the GT of the manufacturing industry is related not only to the quality of a country’s development but also to the future well-being of all mankind. Since 2010, China’s manufacturing enterprises have consistently ranked first worldwide in terms of added value and played an important role in driving global industrial economic growth. However, the extensive development in the past has placed the relationship between China’s economic growth and environmental pollution on the left side of the Environmental Kuznets Curve for a long time, seriously hindering the sustainable development of the manufacturing industry. Under the joint guidance of the “dual carbon” strategic goals and the deployment of the plenary session, as micro-entities of economic development, enterprises’ GT plays a crucial role in promoting sustainable social and economic development. However, in the process of GT, enterprises face uncertainties such as long cycles, large investments, and high risks, which bring many limitations to their GT [1,2,3]. Therefore, exploring how to improve the GT of the manufacturing industry and achieve sustainable development has important theoretical and practical significance [4,5]. Digital innovation represented by generative AI, blockchain, and the Internet of Things is driving non-linear growth in computing power demand, and the data centers that support its operation are leading the transformation of production methods from an industrialized society to an intelligent society [6,7]. Data centers provide a new technological path for achieving carbon reduction by empowering traditional industries to undergo digital transformation and improving resource allocation efficiency. However, the computing infrastructure represented by the traditional data center is also a high energy consuming sector, and the energy consumption and carbon emissions issues brought about by its rapid expansion are becoming increasingly prominent [8]. Green data centers, with their green and digital features, are becoming an important driving force for promoting corporate green transformation. Green data centers mainly refers to data centers that adopt the concepts of energy conservation, environmental protection, and sustainable development for technological construction and operation, aiming to reduce energy consumption and carbon emissions. The green data center has established a sound market-oriented green technology standard system, formed a transparent and open green technology information disclosure and regulatory mechanism, and promoted enterprises to shift from relying on policy subsidies for technology introduction to sustainable high-quality technology R&D. As the marginal benefits of technological innovation exceed the energy control cost threshold, enterprises will receive positive incentives to continuously increase their investment in green technology R&D. Therefore, the purpose of this study is to explore whether green data centers can effectively promote corporate green transformation.
There are mainly two types of literature related to this study. The first type of literature focuses on identifying the determining factors of GT. Most of the literature believes that the digital economy, coordinated development of two-way FDI, financial development, and innovative human capital are important factors that stimulate green transformation [9,10,11,12,13,14,15,16]. Some studies have also pointed out that technological transformation; institutional pressure; mandatory social responsibility disclosure; environmental, social, and corporate governance (ESG) rating; imported robots; and the digitalization of enterprises positively influence the GT of enterprises [17,18,19,20,21,22,23,24]. Some studies tested the empowering effect of a single policy on GT and have drawn relatively positive conclusions from financial policies such as central bank guarantee category green finance policy, green credit policy, as well as environmental policy dimensions such as environmental protection fee tax reform, carbon emission trading policy, and new energy demonstration city policy [25,26,27,28,29,30,31,32]. With the continuous development of digitization, data elements have gradually become a new driving force for economic development [33], playing an important role in promoting GT in enterprises. Previous studies have found that the digital transformation can improve enterprises’ GT level from multiple directions, such as alleviating financing constraints, improving production efficiency, and stimulating internal green innovation vitality [34,35]. At the same time, digital infrastructure policy provides fundamental support for digital development and can effectively leverage digital elements to empower GT in enterprises [36,37].
Regarding data centers, research results mainly focus on the spatial layout and carbon emission spatial transfer of data centers. Some scholars have also found that the construction of data centers can accelerate the flow of data elements, empower emerging industries, and help improve the level of new quality productivity [38,39,40,41]. Scholars have also used machine learning models to predict and optimize energy consumption and pollution emissions in data centers, hoping to reduce data centers’ environmental pollution by improving the construction of data centers [42,43,44]. Currently, research on the effects of national green data center (NGDC) policy is lacking. Pei (2025) found that NGDC policy can reduce urban carbon emission by improving the development level of urban digital industries and green technology innovation based on the DID model [45]. Li et al. (2025) found through the use of dual machine learning methods that NGDC policy can improve the level of digital economy [46]. Shang et al. (2026) found using a dual machine learning approach that NGDC policy can improve the effectiveness of the digital regional innovation ecosystem by stimulating regional entrepreneurship and reducing carbon emission intensity [47]. Song et al. (2026) found that the NGDC policy mainly promotes urban energy efficiency improvement by stimulating green technology innovation and promoting industrial structure upgrading by using the DID method [48]. Yang et al. (2026) found that NGDC policy can reduce the level of pollutants and carbon emissions in cities by improving their resource utilization efficiency based on the DID model and urban data [49]. Overall, there is currently limited literature on the environmental impact assessment of NGDC policy, and no literature has included NGDC policy and GT in a unified analytical framework. There is also a lack of empirical research on how NGDC policy affects enterprise GT.
Clarifying the causal relationship between NGDC policy and enterprise GT is not only a key point in evaluating the effectiveness of digital infrastructure policies but also a theoretical key point in overcoming the dilemma of enterprise GT. Although existing research has focused on the promotion effect of digitalization on green development, systematic theoretical explanation and empirical evidence on how digital infrastructure can promote GT activities at the micro level are lacking. This study analyzes the key proposition and attempts to answer whether the NGDC policy, as a system planning with dual attributes of computing power support and energy efficiency constraints, can effectively promote the GT behavior of enterprises. Is its mechanism of action based on supply side capacity adjustment, attributed to changes in factor inputs at the capital level, or strengthened external supervision at the governance level? The empirical investigation of these issues can help identify the governance boundaries of digital infrastructure at the micro level, provide micro support for clarifying how digital technology can correct green behavior, and offer theoretical basis for improving the quality of digital economic policy supply in the future.
This study has three marginal contributions: First, based on the typical facts of energy consumption and pollution caused by data center construction, this paper uses a multiperiod DID model and the policy practice of creating NGDC to study its effect on enterprise GT, further enriching the relevant research on the effect of NGDC policy. Second, existing research has studied the digital influencing factors of GT in enterprises from aspects such as digital transformation, digital infrastructure construction, and big data development. Unlike existing research, this article fully considers the role of green elements in promoting GT through digitalization, providing new empirical evidence for enhancing the GT level through digitalization and greening. Third, this article analyzes in depth the mechanism by which the NGDC policy promotes the GT of enterprises from two dimensions: environmental protection investment and ESG. This work also conducts a regulatory effect analysis from the perspectives of technology business environment and environmental regulation strength. Subsequently, this work performs heterogeneity analysis through enterprise property rights and the level of industry competition, providing policy references for further strengthening the NGDC policy and promoting corporate sustainable development.

2. Institutional Background and Research Hypothesis

2.1. Institutional Background

The development of digitalization is one of the key elements empowering enterprises to undergo GT. As the core infrastructure for data storage and processing, the number of data centers has substantially increased in recent years. The extensive construction of data centers provides fundamental support for digital development but also brings a series of environmental problems. In 2015, the construction of green data centers entered an important historical turning point. The Chinese government formulated the “National Green Data Center Pilot Work Plan” and decided to conduct the pilot work of green data centers. The plan clearly defines the goal of establishing a green data center promotion mechanism and selects a group of data centers with strong representation, good work foundation, and high management level in key areas such as production and manufacturing, energy, public institutions, and finance to complete pilot creation. In 2018, the first batch of 49 NGDCs were distributed in telecommunications, the Internet, finance, public institutions, production, energy, and other fields. In 2019, to accelerate the development of NGDCs, the Chinese government issued the “Guiding Opinions on Strengthening the Construction of Green Data Centers” and proposed key tasks such as strengthening green design, deepening green construction and procurement, promoting energy-saving and the GT of in-use data centers. The NGDC policy actively explores incentive mechanisms and financing platforms represented by the green electricity trading market, improves the diversified investment and financing system for green technology R&D, promotion and application, and achieves a smooth path of financial-driven green transformation. In addition, NGDC policy requires the establishment of a sound green supply chain management mechanism; the use of electricity, products, and services that meet green standards; and the realization of a green transformation throughout the entire process of technology R&D. As of 2024, 246 green data centers have been built nationwide. The practice of creating NGDC policy shows that NGDCs in various fields have remarkably improved the efficiency of energy utilization such as water and electricity through measures such as strengthening green design, exploring green transformation, optimizing operating parameters, and properly handling and phasing out old equipment. This outcome has effectively driven innovation in green energy-saving technologies and popularized and promoted a number of advanced, applicable energy-saving technology products [50,51,52].
The NGDC policy, as a government-guided data center reform plan, encourages the use of high-efficiency servers and the promotion of the application of renewable energy. This reflects the effective substitution of traditional high-energy consumption resources by clean energy and technological progress in the theory of factor substitution elasticity. At the same time, NGDC policy ensures that newly built data centers comply with environmental standards, and regularly evaluates and optimizes existing data centers to continuously reduce electricity consumption and carbon emissions, and improve energy efficiency. This process not only directly reduces pollution emissions, but also drives the GT of related industries through technology spillover effects in the industrial chain. In addition, NGDCs themselves have digital and green characteristics, which inevitably promotes GT. The NGDC policy has built a diversified investment and financing system, providing a financing platform for enterprise green technology activities, increasing R&D investment, and accelerating the dissemination and sharing of green technology. Therefore, the GT effect of NGDC policy on enterprises needs to be tested.

2.2. Research Hypothesis

2.2.1. Direct Effect of NGDC Policy on GT

The focus of enterprise GT is to reduce pollution emission intensity from the aspects of process technology and infrastructure, which cannot be separated from high-quality green innovation activities and substantial technological leaps. Environmentally friendly enterprises that conduct such activities often find receiving strong support from financial institutions difficult. NGDC pilot cities can reduce the cost of green data search, acquisition, and verification for market entities through higher-quality data sharing platforms and more efficient data transmission chains. NGDC policy can assist managers in scientifically formulating operation and maintenance strategies, enabling data elements to empower various processes and links of GT, and invisibly improving the enthusiasm of market entities for GT. NGDC pilot cities can also rely on their own more comprehensive data acquisition and regulatory mechanisms, as well as a sounder market-oriented green technology innovation system, effectively alleviating information asymmetry between enterprises and financial institutions, continuously reducing enterprise financing costs, and promoting GT.
From the perspective of input–output efficiency, NGDC policy reduces the marginal cost of process optimization and re-engineering for enterprises by providing efficient computing power support. Enterprises can maintain optimal output levels with lower energy consumption, and repair capacity utilization at both the physical and value levels, transitioning from extensive factor stacking to intensive connotation development. In addition, the NGDC policy has effectively broken down temporal and spatial barriers to knowledge and technology flow, maximizing the free flow and effective integration of innovation and green production factors. This approach is conducive to allocating more data, talent, and capital factors to emerging digital green integration fields with higher production efficiency and broader development prospects, thereby providing solid element support for enterprise GT. Therefore, we propose the following hypothesis.
H1: 
The NGDC policy can promote the GT of enterprises.

2.2.2. Indirect Effect of NGDC Policy on GT

The NGDC policy serves as a strong policy signal and infrastructure support, inducing enterprises to increase their substantial investment in green fixed assets and R&D funds by reducing the transaction costs and technological barriers of GT. From a micro perspective of investment decision-making, infrastructure construction has a remarkable “crowding in effect”. The NGDC policy has defined clear green technology standards and digital interfaces for the industrial chain, creating a siphon effect due to the difference in technological potential. This effect reduces the trial and error costs for enterprises to explore green technologies, and enterprises can actively deepen their capital by injecting funds into equipment updates and technological transformations related to digitization and greening. With the specialized investment of high-tech assets, enterprises are required to have corresponding technology absorption capabilities and supporting processes, thus forming an endogenous investment wave caused by external policy shocks.
Environmental investment (EI) provides financial support for the research and implementation of green technologies in enterprises and is the core driving force for promoting GT. The high asset specificity and sunk cost effect brought about by the increase in EI have locked in the technological evolution path of enterprises, thereby compressing their survival space for strategic innovation and promoting substantive GT activities. When enterprises make large-scale specialized asset investments (such as purchasing intelligent energy-saving equipment and building energy management systems) driven by the NGDC policy. To ensure that these enormous investments can generate expected economic returns, companies must conduct high-intensity substantive technology R&D that matches them to solve energy efficiency problems in actual production. Therefore, we propose the following hypothesis.
H2: 
The NGDC policy can promote the GT of enterprises by increasing EI.
The NGDC policy has greatly improved the measurability and rating level of corporate ESG performance by strengthening digital disclosure and full life cycle environmental monitoring. In the context of digital transformation, data centers have become digital hubs for environmental information collection and disclosure. By accessing the NGDC network, the energy usage data and carbon emission indicators of enterprises can be captured in real time and accurately measured. This situation can substantially reduce the search cost for external rating agencies to obtain corporate environmental performance information, eliminating the problems caused by information asymmetry. The improvement of information transparency based on hard data support enables enterprises to be evaluated more objectively in the ESG rating system, effectively avoiding rating discounts caused by insufficient information disclosure. At the same time, participating in national-level green infrastructure construction itself is seen by the capital market as a clear signal of fulfilling environmental responsibilities, which can quickly transform into positive evaluations from rating agencies, thereby establishing the leading position of enterprises in the field of sustainable development.
Enterprise ESG performance includes three aspects: the enterprise’s impact on the environment, its commitment to social responsibility, and its internal governance. Among them, the environmental dimension mainly focuses on the impact and protection of the natural environment by enterprises in the production and operation process, the social dimension mainly examines how enterprises should actively fulfill their social responsibilities, and the governance dimension focuses on the standardization of internal governance structure and operation of enterprises. Enterprise ESG performance is one of the reference standards used by enterprises to regulate and supervise their own behavior, and it is also the basis for investors to measure the sustainability of their invested companies. The GT of enterprises is a dynamic process guided by the concept of green development, using green technology to achieve the greening of the entire product life cycle and production process, improve enterprise social environmental performance, and achieve sustainable development. According to the theory of signal transmission, the ESG performance of an enterprise is to transmit positive signals of its environmental, social, and governance performance to the external market, which can improve the transparency of the enterprise and alleviate the problem of information asymmetry. And many investors tend to choose enterprises with good ESG performance, so many external resources flow to these companies with good ESG performance. At the same time, these enterprises also receive preferential policies and other benefits, effectively alleviating their financing difficulties and providing capital, technology and other support for GT. In addition, a high level of ESG rating means that a company is under close supervision from investors, regulatory agencies, and the general public. This situation will also force enterprise management to give up the short-sighted behavior of creating economic bubbles and to pursue the long-term value of technological innovation instead. In addition, for enterprises, actively taking on relevant social responsibilities will help them gain more social attention and maintain a competitive advantage in acquiring various resources, which will help them conduct GT activities [53]. To address environmental issues that arise during the rapid development of digitalization, the NGDC policy is beneficial for leveraging digital technology to promote improvement in the ESG level of enterprises. Moreover, strengthening the consideration of green elements in the construction and operation of data centers will further enhance the awareness of enterprises to improve ESG performance, and ultimately promote the GT of enterprises by improving their level of environmental and social responsibility. Therefore, we propose the following hypothesis.
H3: 
The NGDC policy can promote the GT of enterprises by improving ESG performance.

3. Research Design

3.1. Benchmark Model

To explore the effect of NGDC policy on GT, this study constructs the following model based on existing research [47,48]:
G T i t = α 0 + α 1 N G D C i t + α 2 C V i t + μ i + γ t + ε i t ,
Among them, i represents the enterprise and t represents the year. GTit represents the level of green transformation of enterprise i during the t period. NGDCit is a dummy variable that represents NGDC policy, and its coefficient α1 is the key focus object. Specifically, this study sets the cities covered by the NGDC policy as the treatment group, and the cities not covered as the control group. Among them, in the year of implementation of the NGDC policy and subsequent years, the value of NGDCit for the treatment group is 1, otherwise it is 0. The NGDCit values of the control group are all set to 0. CV represents the control variables that may affect the GT of enterprises.

3.2. Data Sources and Variable Selection

3.2.1. Data Sources

We select A-share listed companies from 2010 to 2024 as the research sample and process the data as follows: Firstly, we exclude non-manufacturing enterprises and enterprises with industry type changes during the research period. Secondly, we exclude enterprises with abnormal status such as ST, *ST, PT, etc. Thirdly, we exclude samples with relatively short establishment time and severe data loss. Fourth, we tail all continuous variables at the micro level to reduce the impact of outliers. The data mainly comes from the CSMAR database and Wind database.

3.2.2. Variable Selection

Green Transformation (GT): Green transformation is the process by which enterprises transition from traditional high energy consumption and high pollution production modes to low energy consumption, low pollution, and high efficiency green production modes, aiming to protect environmental resources and achieve a win-win situation of economic and environmental benefits. Following the approach of the existing literature [35,54,55], we establish the important directions for text keyword search, namely, the three important dimensions of “enterprise green system transformation”, “enterprise green action transformation” and “enterprise green guarantee transformation”. To define the keywords related to corporate GT accurately, we conduct preliminary vocabulary collection and classification based on government-issued policy documents, academic research, and industry reports. Again, by utilizing Python 3.11’s text segmentation tool, we conduct a comprehensive text search and keyword recognition on the annual reports of enterprises. The frequency of the term “green transformation” is counted. We take the logarithm of the frequency of the term “green transformation” of the enterprise to obtain the intensity index of the GT.
National green data center (NGDC) policy: The list of national green data centers is determined based on procedures such as self-assessment by enterprises, initial review by local industrial and information technology authorities, expert evaluation, and public announcement. Due to different times of public announcement, this paper takes enterprises in the prefecture-level city where the NGDC is located as the treatment group. When the prefecture-level city where the enterprise is located has a NGDC in that year, NGDCit is assigned a value of 1 for that year and subsequent years, otherwise it is assigned a value of 0.
Control variables: In order to control the factors that affect GT at the enterprise level, we have chosen the following variables as control variables [56,57], as shown in Table 1 below. Enterprise size (Size): Enterprise size is usually considered to have a positive impact on a company’s R&D investment. Large-scale enterprises typically have more resources, including capital, technology, and human resources, that can be invested in GT activities. At the same time, large enterprises are also more likely to have sufficient economies of scale to share the costs of green innovation activities, thereby increasing the feasibility of innovation and improving the level of GT. We use the logarithm of a company’s total assets to measure enterprise size. Enterprise age (Age): The older the enterprise, the more abundant its accumulation, stronger competitiveness, higher innovation investment and production efficiency, and stronger level of GT. Therefore, this study selects the logarithm of enterprise age as the control variable. Asset liability ratio (Lev): Higher debt means that companies need to pay more interest and principal, thereby reducing the funds available for green transformation. At the same time, higher debt levels can also lower investor confidence, leading to limited financing capabilities for companies and affecting R&D investment and innovation efficiency. This paper uses the asset liability ratio to represent the debt situation of a company. Return on assets (Roa): The higher the asset return rate of a company, the more stable its operating cash flow and the more abundant its internal funds. Adequate cash flow can provide sustained financial support for green technology innovation and low-carbon transformation projects with long cycles and large investments, significantly enhancing the sustainability of green technology innovation and consolidating the foundation of enterprise GT. We use the ratio of net profit to total assets to reflect the return on assets in a company. Board size (Board): The larger the size of a company’s board of directors, the more it can gather members from diverse professional backgrounds, covering decision-making perspectives in different fields such as environmental protection and strategy. This makes it easier for the company to carry out green-transformation-related plans and help improve its environmental governance level. Therefore, this study selects the logarithm of the number of board members as the control variable. Ownership concentration (Top): When equity is highly concentrated, major shareholders may focus more on short-term economic benefits and overlook the long-term value of GT, resulting in insufficient R&D investment and environmental protection measures in the enterprise. We use the shareholding ratio of the company’s largest shareholder to measure the ownership concentration in the enterprise. Tobin’s Q value (TobinQ): TobinQ reflects the linkage between enterprise value and GT. A high TobinQ value corresponds to a high industry investment return rate, which can further attract green capital inflows and provide sustained financial support for the GT of enterprises. We use the ratio of market value to asset replacement value to measure a company’s Tobin’s Q value.

4. Empirical Result Analysis

4.1. Benchmark Regression

Table 2 reports the regression results of the NGDC policy on GT. To ensure the reliability of the estimation conclusions, this study adopts a stepwise regression approach, gradually adding control variables to examine the sensitivity and stability of key explanatory variable coefficients. All NGDC coefficients in columns (1) to (7) are significant, which shows that the NGDC policy improves the level of corporate GT, thus verifying hypothesis H1. From an economic perspective, a coefficient of 0.263 means that compared to non-pilot enterprises, the NGDC policy has increased the GT indicators of pilot enterprises by an average of about 26.3 percentage points.

4.2. Robustness Test

4.2.1. Parallel Trend Test

This study adopts the event study method to dynamically identify the time-varying characteristics of policy effects. The empirical results clearly depict the dynamic evolution trajectory of core variables before and after policy shocks, which strongly supports the basic conclusion of this paper. According to the results in Table 3, from a longitudinal comparison in the time dimension, during the three periods before the implementation of the NGDC policy (Pre-3 to Pre-1), the estimated regression coefficients fluctuate slightly around the 0 axis. This result indicates that prior to the external impact of NGDC policy, there is a high degree of consistency and parallelism in the level of GT between the treatment group and the control group, with no significant pre-group differences or expected strategic adjustments. However, after crossing the critical point of policy implementation, the regression coefficient quickly rises above the zero axis and shows a sustained and significant increasing trend. This completely different spatiotemporal distribution characteristic suggests that policy shock is the key turning point leading to changes in GT level.

4.2.2. Placebo Test

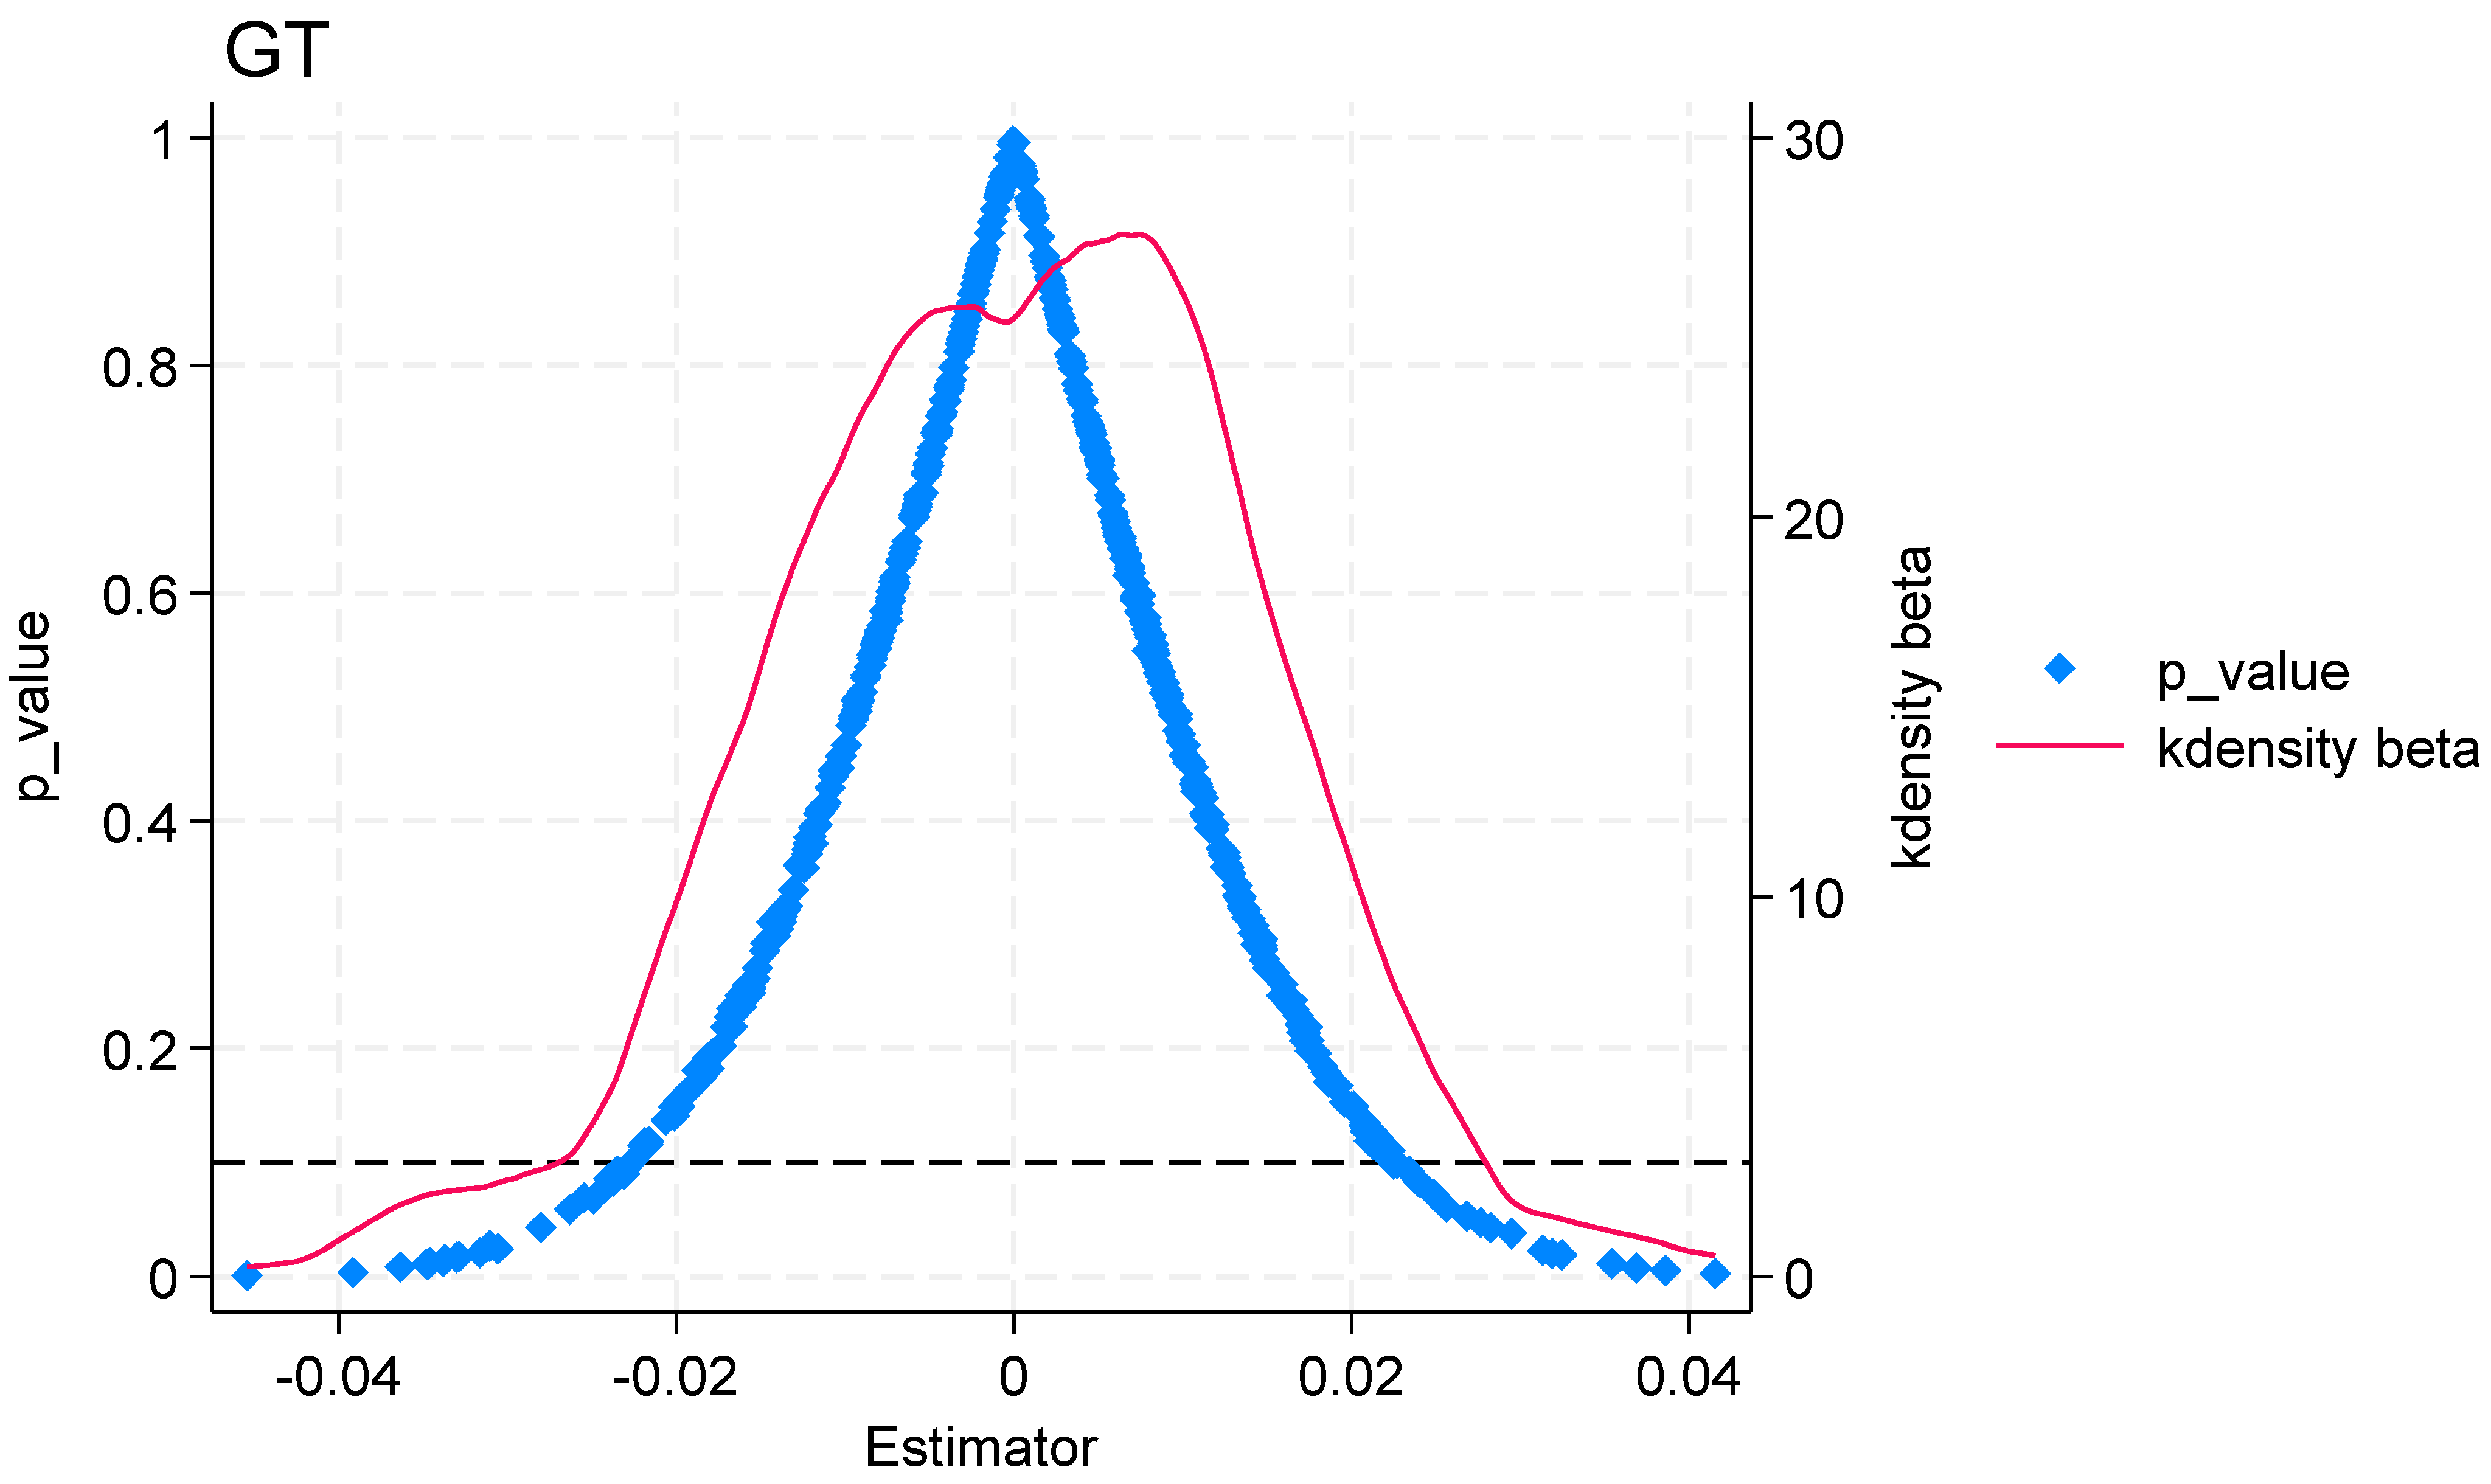
To further remove the potential interference of random factors on empirical results, this study constructs a placebo test to suggest the robustness of policy effect. If the promotion effect of the NGDC policy on GT is robust, then under the impact of “pseudo policy” in the random shuffling treatment group and policy implementation time, the estimated coefficient should follow a random distribution with 0 as the mean, while the true policy effect value should deviate significantly from this distribution as a small probability event. Based on this logic, this study randomly selects a treatment group within the sample and assigned policy time, conducting 500 Monte Carlo simulation regressions to construct a statistical inference basis for placebo testing. The results indicate that the governance effect captured by benchmark regression is not due to accidental random disturbances, but rather the inevitable result caused by specific institutional arrangements. As shown in Figure 1, the randomly generated “pseudo regression coefficients” exhibit a standard normal distribution pattern, with the peak height of their probability density function concentrated around 0, indicating that under random conditions, the “pseudo policy” has not had a substantial impact on the GT of enterprises.

4.2.3. Exclude Interference from Other Policies

There are some policy shocks similar to the NGDC policy during the sample period, which may confuse the regression results of this paper. Therefore, this study excludes the influence of four contemporaneous policies: low-carbon city policy (LCCP), green finance reform and innovation pilot zone policy (GFRIPZP), artificial intelligence innovation pilot zone policy (AIPZP), and broadband China policy (BCAP). This paper constructs policy shock dummy variables based on the pilot period of the above policies, and includes the four constructed policy shock dummy variables separately and collectively into the regression model for testing. Table 4 shows the regression results excluding other policy shocks during the same period, and the regression coefficients of the NGDC are still significant, indicating that the conclusion drawn in this study is not affected by confounding policy factors during the same period.

4.2.4. Other Robustness Tests

This study also adopts the following methods for robustness testing: Firstly, as the NGDC policy is a policy pilot at the city level, and enterprises within the same city often have similarities in policy environment, resource endowment, location characteristics, etc., this study further adds the fixed effect of city–year interaction to control the impact of different cities changing over time, and re-regresses the benchmark model. Secondly, considering the special characteristics of economic management authority, functional positioning, and cadre hierarchy in municipalities directly under the central government, which may have a certain impact on the research conclusions of this paper, this paper further excludes the sample of enterprises located in municipalities directly under the central government and re-regresses the benchmark model. Thirdly, to eliminate the estimation bias caused by a single measurement method of the dependent variable, this study replaces the dependent variables in the benchmark regression with green innovation and total factor productivity, and re-regresses the benchmark model. Green innovation is measured by an enterprise’s green patent application, and total factor productivity is calculated based on the OP method [58]. As shown in Table 5, the regression coefficients of NGDC are still significant, indicating that after controlling for the fixed effects of city–year interaction, excluding enterprise samples located in municipalities, and replacing the measurement method of the dependent variable, the research conclusion of this paper still holds true.

4.3. Impact Mechanism Analysis

To verify hypotheses H2 and H3, we use the following mediation effect model for testing.
M e d i t = β 0 + β 1 N G D C i t + β 2 C V i t + μ i + γ t + ε i t ,
G T i t = δ 0 + δ 1 M e d i t + δ 2 N G D C i t + δ 3 C V i t + μ i + γ t + ε i t ,
Med refers to corporate environmental investment (EI) and ESG performance, respectively. In the above model, if both δ 1 and δ 2 are significantly positive, it indicates that the mediation effect test has passed. This study selects environmental investment (EI) as the core mechanism variable, which measures the actual capital expenditures of enterprises in environmental protection, energy conservation and consumption reduction, and clean production technology transformation. Table 6 shows the regression results of the mechanism test. Column (1) takes the mechanism variable EI as the dependent variable, and the regression coefficient of EI is 0.101, passing the 1% statistical significance test. The results in column 2 show that the coefficients of NGDC and EI are significantly positive, indicating that EI is a mediating variable for NGDC to promote corporate GT. This result indicates that the NGDC policy has significantly driven the increase in EI scale of enterprises, resulting in an increase in actual capital in the field of green governance, and thus showing a significant improvement effect on GT.
If NGDC policy can improve ESG performance, then the promotion effect of NGDC policy on corporate GT is stronger in the context of higher levels of corporate ESG performance. To test this mechanism, this paper uses the Huazhong ESG rating score to measure a company’s level of ESG performance. Column (3) takes the mechanism variable ESG as the dependent variable, and the coefficient of ESG is 0.051, passing the 5% statistical significance test. Column (4) shows that the coefficients of NGDC and EI are significantly positive, indicating that ESG performance is a mediating variable for NGDC policy to promote corporate GT. This indicates that the NGDC policy has achieved an effective promotion effect on GT by enhancing the overall ESG performance of enterprises. Therefore, hypotheses H2 and H3 of this study have been validated.

4.4. Moderating Effect Analysis

Regional environmental regulation (ER) and technology business environment (TBE) may affect the impact of NGDC policy. Regions with strong ER often come with policy tools such as subsidies for green technology R&D, government green procurement preferences, etc. The synergistic cooperation with the NGDC policy may form a certain policy synergy, effectively stimulating enterprises to carry out GT. In addition, a good TBE is usually accompanied by sufficient R&D funds and a sound innovation system. Enterprises within the jurisdiction also have a stronger willingness and motivation for green technology innovation, which often affects the implementation effect of NGDC. Therefore, we construct the following model to test the moderating effects of ER and TBE.
G T i t = σ 0 + σ 1 M o d i t × N G D C i t + σ 2 N G D C i t + σ 2 M o d i t + σ 3 C V i t + μ i + γ t + ε i t ,
In model (4), Mod represents the ER and TBE of the region, respectively. We can determine the moderating effect of ER and TBE by observing the significance of σ 1 . This study uses the ratio of investment costs for regional environmental pollution control to GDP to characterize the strength of ER. The larger the indicator, the stronger the ER in the region [59]. The coefficient of NGDC × ER in Table 7 is positive. This indicates that ER has a positive moderating effect on the implementation of NGDC policy. ER refers to the strength of constraints imposed by local governments on the negative externalities of pollution through policy tools such as emission standards and ecological taxes. The differences in their intensity lead to systematic response differences in enterprises’ GT strategies through the constraint incentive transmission mechanism and environmental compliance cost path. Strict ER can forcibly transform more negative externalities of the corporate environment into their explicit costs. Enterprises, driven by environmental compliance requirements and cost–benefit constraints, will actively implement GT strategies. Therefore, the higher the intensity of ER in a region, the more NGDC policy can promote the GT of enterprises.
This study refers to the approach of Han et al. (2025) and measures the TBE of a region by the logarithm of the total search volume of financial-technology-related vocabulary in Baidu news advanced search [60]. The coefficient of the interaction term NGDC × TBE in Table 7 is significant. This indicates that the better the regional technology business environment, the more prominent the positive role of NGDC policy in promoting the GT of enterprises. A favorable TBE is conducive to reducing the financing threshold and cost of science and technology innovation enterprises, enabling pilot cities to better integrate data advantages into technology finance, providing more accurate and efficient fund allocation for green innovation activities of enterprises, and promoting their GT. The urban TBE is relatively good, which means that different types of knowledge, technology and other resources can quickly flow and integrate, greatly promoting the application of green technology and digital green integration technology, thereby adding momentum to the GT of enterprises. Therefore, the higher the intensity of the TBE in a region, the more NGDC policy can promote the GT of enterprises.

4.5. Heterogeneity Analysis

We divide the samples into a state-owned enterprise (SOE) sample and non-SOE sample based on the property rights of the enterprises, and then conduct sample regression. In Table 8, the NGDC coefficient in the SOE sample is 0.411, while the NGDC coefficient in the non-SOE sample is 0.241. The NGDC coefficient in the SOE sample is greater than that in the non-SOE sample, indicating that NGDC policy has a better impact on the GT of SOEs compared to non-SOEs. Even if the regression coefficients of NGDC in grouped regression are significant, relying solely on the difference in absolute values of the coefficients is still insufficient to determine inter-group coefficient difference. Therefore, this paper further adopts Fisher’s permutation test to examine the inter-group coefficient difference. After 500 permutation tests, the empirical p value of Fisher’s permutation test passes the significance test, which indicates that there is a significant difference in the impact of NGDC policy on GT between SOEs and Non-SOEs. A SOE usually has superior internal resource endowments, such as R&D teams, R&D funding support, data decision-making and analysis capabilities, etc. The data processing capabilities of NGDC policy can efficiently coordinate with their internal resources, motivating them to carry out GT activities. In addition, with the intervention of the NGDC policy, penetration monitoring of enterprise energy consumption and carbon footprint has been achieved through digital means, greatly enhancing the information acquisition capability of regulatory authorities. A SOE is subject to stricter supervision by government departments, giving them greater motivation to undergo GT. A non-SOE, on the other hand, may not fully benefit from the GT promotion effect brought by the NGDC policy due to practical reasons such as incomplete internal supporting facilities and weak data analysis capabilities. Therefore, compared to non-SOEs, NGDC policy has a better promoting effect on the GT of SOEs.
Industry competition (IC) refers to the degree of intense competition faced by enterprises in their industry, and the differences in its level may affect the production decision-making mode selection of enterprises through the transmission mechanism of innovation incentives and constraints. In a highly competitive market structure, enterprises face higher survival pressure and innovation challenges. The NGDC policy, as a representative pilot policy for new digital infrastructure, helps to reduce the information acquisition cost and computing power constraints of enterprise green technology R&D, and provides more motivation for enterprises in competitive industries to enhance their green competitiveness. It is not difficult to infer that the impact of NGDC policy on enterprise GT may have heterogeneity in IC intensity. Compared with enterprises with weaker IC, the promotion effect of GT by NGDC policy on enterprises with stronger IC may be more sufficient. This study uses the Herfindahl–Hirschman index to characterize the degree of IC. Based on the median of this index, the sample is divided into two groups: strong IC and weak IC. The coefficient of NGDC for companies with strong IC is significantly higher than that for companies with weak IC. The empirical p value of Fisher’s permutation test passes the significance test, which indicates significant difference in the samples. This indicates that there is heterogeneity in the IC intensity of the impact of NGDC policy on the GT of enterprises. Compared with enterprises with weaker IC, the promotion effect of the GT of enterprises with stronger IC is more fully realized by the NGDC policy.

5. Conclusions

Finding external drivers to promote the GT of enterprises is a very important topic. Based on the establishment of the national green data center policy, this study empirically tests the impact of NGDC policy on enterprise GT. The benchmark regression results indicate a significant positive relationship between NGDC policy and corporate GT; that is, NGDC policy can provide important assistance for corporate GT. The reason is that NGDC policy can prompt enterprises to increase their green investment intensity and enhance their ESG performance level, thereby promoting corporate GT. The regional institutional environment can have a positive regulatory effect; that is, the level of technology business environment, and environmental regulation can further amplify the promotional effect of NGDC policy on corporate GT. In addition, the policy effect of NGDC promoting GT is primarily reflected in SOEs, and enterprises with stronger industry competition. This study provides a novel research perspective for the micro-governance effects of NGDC policy. It also puts forward the following policy implications for the in-depth promotion of GT in the real economy by NGDC policy.
Based on the conclusion of this paper, we propose the following policy recommendations.
First, the government should further expand the coverage of NGDC policy and strengthen the effectiveness of policy implementation. As an important policy practice to promote the coordinated development of digitalization and greening, the NGDC policy can help drive the GT of enterprises. From the current situation of multiple green data centers that have been built, much room for improvement remains in the number of cities covered and the scope of fields involved. To this end, relevant departments should actively explore the possibility of building NGDCs in more cities and encourage and support provinces and regions to create regional green data centers based on their own digital economy development realities. Relevant departments need to expand further the coverage of NGDCs, including the wholesale and retail industry in the pilot construction scope of NGDCs.
Second, the moderation effect results show that environmental regulations can amplify the enhancing effect of NGDC policy on GT. Therefore, the government should leverage the combined effectiveness of NGDC policy and external environmental policies and ensure that green data policies empower the smooth path of green transition. The government should further enhance the intensity of green governance, build a comprehensive environmental protection system, improve environmental protection legislation and law enforcement, and actively strengthen public environmental awareness through policy guidance, innovative publicity, and other means to leverage fully the effectiveness of green governance in the implementation of green data center policies. Moreover, given that the regional technology business environment has a significant moderating effect on the green effect of NGDC policy, the government can further expand the enhancement effect of NGDC policy on enterprise GT by optimizing the regional technology business environment. To optimize the regional technology business environment, the government should establish a technology business environment supervision mechanism. The government can encourage enterprises to supervise the efficiency of government services and the effectiveness of policy implementation in the technology system. At the same time, the government can widely collect and feedback opinions and suggestions from all sectors of society on optimizing the business environment in the technology field, reflect the relevant problems encountered by enterprises in the process of green technological innovation in a timely manner, and further improve the social supervision system of the regional technology business environment.
Third, the heterogeneity results indicate that the promoting effect of NGDC policy on enterprise GT is more significant in SOEs and enterprises with stronger industry competition. Therefore, each enterprise should develop different green transformation strategies based on its property rights nature and industry type. For SOEs, they should leverage their economies of scale and resource integration capabilities, and take on more demonstration and leading roles in the NGDC policy. The government can encourage SOEs to increase investment in green technology R&D, environmental protection facility construction, and green supply chain management, use big data to optimize resource allocation, improve energy utilization efficiency, and enhance the environmental protection level of production processes. For enterprises in highly competitive industries, they should rely on their strong data processing and analysis capabilities to deepen the application of big data in green production, green marketing, and green services. The government can encourage enterprises to use green data centers to gain insights into changes in market demand, develop green products and services, and enhance market competitiveness. In addition, the government also needs to strengthen intellectual property protection and market supervision, safeguard the legitimate rights and interests of enterprises in green technology innovation and market competition order, and provide strong support for the improvement of GT levels.
This study has the following limitations. Due to the fact that pilot cities may differ from other cities in terms of economic development, environmental policies, or technological capabilities, the implementation of NGDC policy may not be entirely exogenous, which may affect our estimation results due to selection bias. In addition, since the NGDC policy is implemented at the city level, firms in neighboring non-pilot cities may benefit from nearby green data centers, which may influence the estimated policy effects. In the future, we will attempt to use new econometric analysis methods to discuss and address the non-exogeneity and spillover effects of NGDC pilot policy.

Author Contributions

Conceptualization, W.Z. and C.Z.; methodology, W.Z. and C.Z.; formal analysis, W.Z.; resources, C.Z.; writing—original draft preparation, W.Z.; writing—review and editing, C.Z.; visualization, C.Z.; project administration, C.Z.; funding acquisition, C.Z. All authors have read and agreed to the published version of the manuscript.

Funding

This research received no external funding.

Institutional Review Board Statement

Not applicable.

Informed Consent Statement

Not applicable.

Data Availability Statement

Data are available on request.

Conflicts of Interest

The authors declare no conflicts of interest.

References

  1. Abilakimova, A.; Bauters, M.; Afolayan Ogunyemi, A. Systematic literature review of digital and green transformation of manufacturing SMEs in Europe. Prod. Manuf. Res. 2025, 13, 2443166. [Google Scholar]
  2. Liang, P.; Sun, X.; Qi, L. Does artificial intelligence technology enhance green transformation of enterprises: Based on green innovation perspective. Environ. Dev. Sustain. 2024, 26, 21651–21687. [Google Scholar] [CrossRef]
  3. Luo, J.; Feng, W. Promoting green transformation of enterprises in China to adapt to climate change: An evolutionary game analysis. Front. Clim. 2025, 7, 1504615. [Google Scholar] [CrossRef]
  4. Khan, T.; Khan, A.; Wei, L.; Khan, T.; Ayub, S. Industrial innovation on the green transformation of manufacturing commerce. J. Mark. Strateg. 2022, 4, 283–304. [Google Scholar] [CrossRef]
  5. Siyal, A.W.; Chen, H.; Shahzad, F.; Bano, S. Investigating the role of institutional pressures, technology compatibility, and green transformation in driving manufacturing industries toward green development. J. Clean. Prod. 2023, 428, 139416. [Google Scholar] [CrossRef]
  6. Andrienko, G.; Andrienko, N.; Boldrini, C.; Caldarelli, G.; Cintia, P.; Cresci, S.; Facchini, A.; Giannoti, F.; Gionis, A.; Guidotti, R.; et al. (So) Big Data and the transformation of the city. Int. J. Data Sci. Anal. 2021, 11, 311–340. [Google Scholar]
  7. Maguire, J.; Ross Winthereik, B. Digitalizing the state: Data centres and the power of exchange. Ethnos 2021, 86, 530–551. [Google Scholar]
  8. Masanet, E.; Shehabi, A.; Lei, N.; Smith, S.; Koomey, J. Recalibrating global data center energy-use estimates. Science 2020, 367, 984–986. [Google Scholar] [CrossRef] [PubMed]
  9. Taleb, M.; Pheniqi, Y. Linking green human capital, green transformational leadership, green dynamic capabilities, and green innovation: A moderation model. J. Syst. Manag. Sci. 2023, 13, 102–127. [Google Scholar] [CrossRef]
  10. Safi, A.; Kchouri, B.; Elgammal, W.; Nicolas, M.K.; Umar, M. Bridging the green gap: Do green finance and digital transformation influence sustainable development? Energy Econ. 2024, 134, 107566. [Google Scholar] [CrossRef]
  11. Hidayat-ur-Rehman, I.; Hossain, M.N. The impacts of Fintech adoption, green finance and competitiveness on banks’ sustainable performance: Digital transformation as moderator. Asia Pac. J. Bus. Adm. 2025, 17, 987–1020. [Google Scholar] [CrossRef]
  12. Li, X.; Wang, R.; Shen, Z.Y.; Song, M. Green credit and corporate energy efficiency: Enterprise pollution transfer or green transformation. Energy 2023, 285, 129345. [Google Scholar] [CrossRef]
  13. Zhang, W.; Sun, C. How does outward foreign direct investment affect enterprise green transition? Evidence from China. J. Clean. Prod. 2023, 428, 139331. [Google Scholar] [CrossRef]
  14. Si, H.; Tian, Z.; Guo, C.; Zhang, J. The driving effect of digital economy on green transformation of manufacturing. Energy Environ. 2024, 35, 2636–2656. [Google Scholar]
  15. Huang, S.; Wang, Y.; Li, S.; Pan, D. Impact of Regional Green Finance Development on Green Transformation of Enterprises. Financ. Res. Lett. 2025, 92, 109412. [Google Scholar] [CrossRef]
  16. Ling, L.; Hu, L.; Li, S.; Zhao, X.; Ye, X. How does open public data affect enterprise green transformation? Socio-Econ. Plan. Sci. 2025, 102, 102342. [Google Scholar] [CrossRef]
  17. Xu, Y.; Yang, C.; Ge, W.; Liu, G.; Yang, X.; Ran, Q. Can industrial intelligence promote green transformation? New insights from heavily polluting listed enterprises in China. J. Clean. Prod. 2023, 421, 138550. [Google Scholar] [CrossRef]
  18. Xu, H.; Fu, Y.; Li, Y.; Zhang, G.; Bi, S. Environmental information disclosure and green transformation: Evidence from Chinese manufacturing enterprises. Heliyon 2024, 10, e38402. [Google Scholar] [CrossRef] [PubMed]
  19. Chang, Y.; Wang, S. A study on the impact of ESG rating on green technology innovation in enterprises: An empirical study based on informal environmental governance. J. Environ. Manag. 2024, 358, 120878. [Google Scholar] [CrossRef]
  20. Guo, Y.; Zhang, F. Accelerated depreciation of fixed assets and green transformation of enterprises. Pac.-Basin Financ. J. 2024, 86, 102428. [Google Scholar] [CrossRef]
  21. Feng, Y.; Gao, Y.; Hu, S.; Sun, M.; Zhang, C. How does digitalization affect the green transformation of enterprises registered in China’s resource-based cities? Further analysis on the mechanism and heterogeneity. J. Environ. Manag. 2024, 365, 121560. [Google Scholar] [CrossRef]
  22. Dai, H.; Yang, R.; Cao, R.; Yin, L. Does the application of industrial robots promote export green transformation? Evidence from Chinese manufacturing enterprises. Int. Rev. Econ. Financ. 2024, 96, 103538. [Google Scholar] [CrossRef]
  23. Lee, C.C.; Qin, S.; Li, Y. Does industrial robot application promote green technology innovation in the manufacturing industry? Technol. Forecast. Soc. Change 2022, 183, 121893. [Google Scholar] [CrossRef]
  24. Bergougui, B.; Sulimany, H.G.H. When Do Robots Go Green? Unveiling Mechanisms, Thresholds, and Spillovers of Industrial Robotics on Global Ecological Capacity. Bus. Strategy Environ. 2026, 1, 1–24. [Google Scholar] [CrossRef]
  25. Sun, J.; Qi, B.; Wang, J.; Nie, Y. Government guidance funds and green transformation of enterprises. Appl. Econ. Lett. 2025, 32, 2116–2120. [Google Scholar]
  26. Liu, S.; Ma, L. Impact of green finance on the green transformation of manufacturing enterprises. Resour. Sci. 2023, 45, 1992–2008. [Google Scholar] [CrossRef]
  27. Niu, H.; Zhao, X.; Luo, Z.; Gong, Y.; Zhang, X. Green credit and enterprise green operation: Based on the perspective of enterprise green transformation. Front. Psychol. 2022, 13, 1041798. [Google Scholar] [CrossRef] [PubMed]
  28. Liu, S.; Wang, Y. Green innovation effect of pilot zones for green finance reform: Evidence of quasi natural experiment. Technol. Forecast. Soc. Change 2023, 186, 122079. [Google Scholar] [CrossRef]
  29. Zhou, C.; Qi, S.; Li, Y. Environmental policy uncertainty and green transformation dilemma of Chinese enterprises. J. Environ. Manag. 2024, 370, 122891. [Google Scholar] [CrossRef]
  30. Yu, Y.; Liu, J.; Wang, Q. Has environmental protection tax reform promoted green transformation of enterprises? Evidence from China. Environ. Sci. Pollut. Res. 2024, 31, 29472–29496. [Google Scholar] [CrossRef]
  31. Wan, D.; Zhang, L. Carbon emissions trading and corporate green transformation: Evidence from a quasi-natural experiment in China. J. Environ. Manag. 2025, 391, 126602. [Google Scholar] [CrossRef]
  32. Wang, P.; Li, D. New energy demonstration cities policy and urban green transformation. Financ. Res. Lett. 2025, 79, 107261. [Google Scholar] [CrossRef]
  33. Guo, B.; Hu, P.; Lin, J. The effect of digital infrastructure development on enterprise green transformation. Int. Rev. Financ. Anal. 2024, 92, 103085. [Google Scholar] [CrossRef]
  34. Zhang, Z.; Li, P.; Huang, L.; Kang, Y. The impact of artificial intelligence on green transformation of manufacturing enterprises: Evidence from China. Econ. Change Restruct. 2024, 57, 146. [Google Scholar] [CrossRef]
  35. Zhou, C.; Zhang, H.; Ying, J.; He, S.; Zhang, C.; Yan, J. Artificial intelligence and green transformation of manufacturing enterprises. Int. Rev. Financ. Anal. 2025, 104, 104330. [Google Scholar] [CrossRef]
  36. Hu, X.; Wang, S.; Cao, J.; Hao, P. The Impact of Digital Infrastructure on China’s Green Total Factor Productivity: A Quasi-Natural Experiment Based on the “Broadband China” Pilot Policy. J. Inf. Econ. 2024, 2, 32–56. [Google Scholar] [CrossRef]
  37. Jiang, G.; Shi, Q.; Liang, X.; Qian, S. Effect of internet construction on urban green development: Evidence from the pilot policy of Broadband China. Bull. Econ. Res. 2025, 77, 398–414. [Google Scholar] [CrossRef]
  38. Dayarathna, M.; Wen, Y.; Fan, R. Data center energy consumption modeling: A survey. IEEE Commun. Surv. Tutor. 2015, 18, 732–794. [Google Scholar] [CrossRef]
  39. Uddin, M.; Darabidarabkhani, Y.; Shah, A.; Memon, J. Evaluating power efficient algorithms for efficiency and carbon emissions in cloud data centers: A review. Renew. Sustain. Energy Rev. 2015, 51, 1553–1563. [Google Scholar] [CrossRef]
  40. Saunavaara, J.; Laine, A.; Salo, M. The Nordic societies and the development of the data centre industry: Digital transformation meets infrastructural and industrial inheritance. Technol. Soc. 2022, 69, 101931. [Google Scholar] [CrossRef]
  41. Yu, Y.; Ren, X.; Zhang, Z. How data factors drive to the new quality productive forces in China: The role of big data pilot zones. Appl. Econ. 2025, 11, 1–22. [Google Scholar] [CrossRef]
  42. Ferreira, M.S.; Bispo, R.; Correia, I.; Brown, D. Integrating machine learning and optimization methods for green Data Center energy management. Renew. Energy Focus 2026, 58, 100867. [Google Scholar] [CrossRef]
  43. Mahmud, A.; Kamal, K.M.S.; Reza, A.W. Greener and energy-efficient data center for blockchain-based cryptocurrency mining. Procedia Comput. Sci. 2025, 252, 192–201. [Google Scholar] [CrossRef]
  44. Shrivastav, A.K.; Dash, D.K.; Dhara, S.; Ghosh, P. Techno-economic design and reliability assessment of a solar PV-battery-based green data center. Frankl. Open 2025, 11, 100290. [Google Scholar] [CrossRef]
  45. Pei, X. Carbon emission reduction effects of national green data centers: Theoretical analysis and empirical evidence. China Popul. Resour. Environ. 2025, 11, 37–47. [Google Scholar]
  46. Li, C.; He, W.; Cao, E. Impact of green data center pilots on the digital economy development: An empirical study based on dual machine learning methods. Comput. Ind. Eng. 2025, 201, 110914. [Google Scholar] [CrossRef]
  47. Shang, Y.; Kang, S.K.; Zhao, Z.M. National green data center pilots and digital regional innovation ecosystem effectiveness: Evidence from China. Int. Rev. Econ. Financ. 2026, 110, 105573. [Google Scholar] [CrossRef]
  48. Song, Z.; Chen, L.; Jia, M. Toward a sustainable energy future: Can green data center construction promote energy efficiency? Energy Rep. 2026, 15, 109166. [Google Scholar] [CrossRef]
  49. Yang, Z.; Lai, F.; M Liu, M. Green leapfrogging in China? Unveiling the impact of new infrastructure construction on synergistic control of pollutants and carbon emissions: Evidence from green data center. Sustain. Cities Soc. 2026, 143, 107371. [Google Scholar] [CrossRef]
  50. Wang, C.; Zhao, Y.; Zhang, Y.; Li, D. Environmental sustainability and firm performance: Unpacking the productivity effects of green data center pilots. J. Environ. Manag. 2025, 395, 127764. [Google Scholar] [CrossRef]
  51. Cai, Y.; Guo, J.; Shen, C. Green data center pilots and urban economic resilience: Causal inference based on double machine learning. Int. Rev. Econ. Financ. 2026, 106, 104927. [Google Scholar] [CrossRef]
  52. Mondal, S.; Faruk, F.B.; Rajbongshi, D.; Khondhoker Efaz, M.M.; Islam, M.M. GEECO: Green data centers for energy optimization and carbon footprint reduction. Sustainability 2023, 15, 15249. [Google Scholar] [CrossRef]
  53. Porter, M.E.; Kramer, M.R. The link between competitive advantage and corporate social responsibility. Harv. Bus. Rev. 2006, 84, 78–92. [Google Scholar] [CrossRef] [PubMed]
  54. Wu, F.; Li, W. Tax Incentives and Corporate Green Transformation—Empirical Evidence Based on Text Recognition of Listed Companies’ Annual Reports. Public Financ. Res. 2022, 4, 100–118. [Google Scholar]
  55. Qian, Y.; Cao, L. Intelligence analysis of digital technology innovation empowering enterprise green transformation: An empirical examination of mediating and moderating effects. Sci. Rep. 2025, 15, 44115. [Google Scholar] [CrossRef] [PubMed]
  56. Tan, W.; Yan, E.H.; Yip, W.S. Go green: How does Green Credit Policy promote corporate green transformation in China. J. Int. Financ. Manag. Account. 2025, 36, 38–67. [Google Scholar]
  57. Deng, W.Y.; Zhang, Z.L.; Guo, B.R. Firm-level carbon risk awareness and green transformation: A research on the motivation and consequences from government regulation and regional development perspective. Int. Rev. Financ. Anal. 2024, 91, 103026. [Google Scholar] [CrossRef]
  58. Olley, S.; Pakes, A. The dynamics of productivity in the telecommunications equipment industry. Econometrica 1996, 64, 1263–1297. [Google Scholar] [CrossRef]
  59. Yu, D.H.; Sun, T. Environmental Regulation, Skill Premium and International Competitiveness of Manufacturing Industry. China Ind. Econ. 2017, 5, 35–53. [Google Scholar]
  60. Han, X.F.; Wei, X. How can the “green-sharing” data policy synergistically promote urban green transformation? Ind. Econ. Res. 2025, 3, 86–99. [Google Scholar] [CrossRef]
Figure 1. Placebo test.
Sustainability 18 07380 g001
Table 1. Variable description and descriptive statistics.
VariableSymbolDefinitionMeanSD
Green transformationGTCalculated based on text analysis3.8760.955
National green data center policyNGDCDummy variable0.2780.401
Enterprise sizeSizeLn(enterprise total assets)22.4881.654
Enterprise ageAgeLn(enterprise age +1)3.1050.299
Asset liability ratioLevRatio of total liabilities to total assets0.4210.237
Return on assetsRoaRatio of net profit to total assets0.0530.077
Board sizeBoardLn(the number of board members)2.5540.342
Ownership
concentration
TopProportion of shares held by the largest shareholder0.3670.188
Tobin’s Q valueTobinQRatio of market value to asset replacement value2.3451.789
Table 2. The impact of NGDC policy on GT.
(1)(2)(3)(4)(5)(6)(7)
GTGTGTGTGTGTGT
NGDC0.262 ***0.261 ***0.262 ***0.261 ***0.261 ***0.262 ***0.263 ***
(0.0167)(0.0167)(0.0167)(0.0167)(0.0168)(0.0168)(0.0168)
Size−0.00589−0.00552−0.0091 **−0.0080 *−0.0082 *−0.00746−0.00956 *
(0.00384)(0.00388)(0.00449)(0.0046)(0.0047)(0.00480)(0.00506)
Age −0.0116−0.0130−0.0135−0.0138−0.0146−0.0135
(0.0159)(0.0160)(0.0160)(0.0161)(0.0161)(0.0161)
Lev 0.0464 *0.03440.03430.03400.0323
(0.0277)(0.0305)(0.0306)(0.0306)(0.0306)
Roa −0.0687−0.0691−0.0581−0.0280
(0.0786)(0.0786)(0.0792)(0.0817)
Board 0.005820.003820.00258
(0.0245)(0.0246)(0.0246)
Top −0.00039−0.00038
(0.00032)(0.00032)
TobinQ −0.00583
(0.00395)
Firm FEYESYESYESYESYESYESYES
Year FEYESYESYESYESYESYESYES
Obs15,29615,29615,29615,29615,29615,29615,296
R-squared0.5480.5480.5480.5480.5480.5480.548
Note: Robust standard errors are in parentheses; * p < 0.1, ** p < 0.05, and *** p < 0.01.
Table 3. Parallel trend.
(1)(2)
GTGT
Pre-3−0.0242−0.0259
(0.0312)(0.0312)
Pre-20.01990.0167
(0.0312)(0.0312)
Pre-10.01830.0153
(0.0309)(0.0310)
Post10.237 ***0.234 ***
(0.0311)(0.0312)
Post20.296 ***0.294 ***
(0.0340)(0.0341)
Post30.396 ***0.392 ***
(0.0332)(0.0334)
Post40.323 ***0.317 ***
(0.0975)(0.0976)
Control VariableNOYES
Firm FEYESYES
Year FEYESYES
Obs15,29615,296
R-squared0.6150.616
Note: Robust standard errors are in parentheses; *** p < 0.01.
Table 4. Exclude interference from other policies.
(1)(2)(3)(4)
Low-Carbon City
Policy
Green Finance Reform and Innovation Pilot Zone PolicyArtificial Intelligence Innovation Pilot Zone PolicyBroadband China Policy
GTGTGTGT
NGDC0.261 ***0.26 ***0.263 ***0.264 ***
(0.0198)(0.0187)(0.0233)(0.0259)
LCCP0.112 *
(0.062)
GFRIPZP 0.143
(0.477)
AIPZP 0.094
(0.132)
BCAP 0.087 *
(0.048)
Control VariableYESYESYESYES
Firm FEYESYESYESYES
Year FEYESYESYESYES
Obs15,29615,29615,29615,296
R-squared0.5480.5480.5480.548
Note: Robust standard errors are in parentheses; * p < 0.1, and *** p < 0.01.
Table 5. Other robustness tests.
(1)(2)(3)(4)
GTGTTFPGI
NGDC0.169 ***0.258 ***0.014 ***0.122 ***
(0.0374)(0.0487)(0.0358)(0.0305)
Control VariableYESYESYESYES
Firm FEYESYESYESYES
Year FEYESYESYESYES
Obs15,29612,87215,29615,296
R-squared0.6120.5150.8350.771
Note: Robust standard errors are in parentheses; *** p < 0.01.
Table 6. Mechanism analysis.
(1)(2)(3)(4)
EIGTESGGT
NGDC0.101 ***0.221 ***0.051 **0.205 ***
(0.0297)(0.0245)(0.0249)(0.0186)
EI 0.521 *
(0.0281)
ESG 1.047 *
(0.572)
Control VariableYESYESYESYES
Firm FEYESYESYESYES
Year FEYESYESYESYES
Obs15,29615,29615,29615,296
R-squared0.4330.550.6670.549
Note: Robust standard errors are in parentheses; * p < 0.1, ** p < 0.05, and *** p < 0.01.
Table 7. Moderating effect analysis.
(1)(2)
GTGT
NGDC0.183 ***0.384 ***
(0.065)(0.096)
NGDC × ER0.0246 *
(0.0136)
NGDC × TBE 0.0943 *
(0.05)
ER0.0157
(0.0231)
TBE 0.194
(0.105)
Control VariableYESYES
Firm FEYESYES
Year FEYESYES
Obs15,29615,296
R-squared0.6080.613
Note: Robust standard errors are in parentheses; * p < 0.1, and *** p < 0.01.
Table 8. Heterogeneity analysis.
(1)(2)(3)(4)
SOENon-SOEStrong Industry CompetitionWeak Industry Competition
GTGTGTGT
NGDC0.411 ***0.241 **0.477 ***0.195 *
(0.094)(0.114)(0.119)(0.109)
Control VariableYESYESYESYES
Firm FEYESYESYESYES
Year FEYESYESYESYES
Obs5488980810,1965100
R-squared0.5550.5460.6110.539
Empirical p value0.001 ***0.001 ***
Note: Robust standard errors are in parentheses; * p < 0.1, ** p < 0.05, and *** p < 0.01.
Disclaimer/Publisher’s Note: The statements, opinions and data contained in all publications are solely those of the individual author(s) and contributor(s) and not of MDPI and/or the editor(s). MDPI and/or the editor(s) disclaim responsibility for any injury to people or property resulting from any ideas, methods, instructions or products referred to in the content.