Article

Exploring the Impact of Digital Economy on Carbon Emission Intensity: Empirical Analysis Based on Panel Data of Chinese Cities

School of Economics, Hebei University, Baoding 071002, China
*
Author to whom correspondence should be addressed.
Sustainability 2026, 18(13), 6726; https://doi.org/10.3390/su18136726
Submission received: 10 May 2026 / Revised: 20 June 2026 / Accepted: 30 June 2026 / Published: 2 July 2026

Abstract

China’s urban low-carbon transition requires clearer city-level evidence on whether and how digitalization mitigates carbon emission intensity. Using panel data for 288 Chinese prefecture-level and above cities from 2013 to 2022, this study constructs a multidimensional Digital Economy Index and measures carbon emission intensity using EDGAR emissions and GDP at constant 2013 prices. We employ two-way fixed effects, instrumental variables, System GMM, robustness checks, mediation analysis, heterogeneity tests, and a Spatial Durbin Model. The results show that digital economy development significantly reduces urban carbon emission intensity, and this conclusion remains robust across alternative measurements, lag specifications, sample adjustments, fixed-effect structures, and endogeneity corrections. Mechanism analysis indicates that industrial structure rationalization and upgrading are key transmission channels, whereas technological innovation may generate short-term adjustment costs consistent with a “green paradox.” The carbon-reduction effect is stronger in old industrial base cities, cities with weaker initial innovation foundations, and cities with lower initial population density. Spatial analysis shows that digitalization generates significant carbon-reduction spillovers under geographical proximity, while economic-linkage-based spillovers are more complex. These findings provide theoretical and policy implications for digitally enabled and regionally coordinated urban decarbonization.

1. Introduction

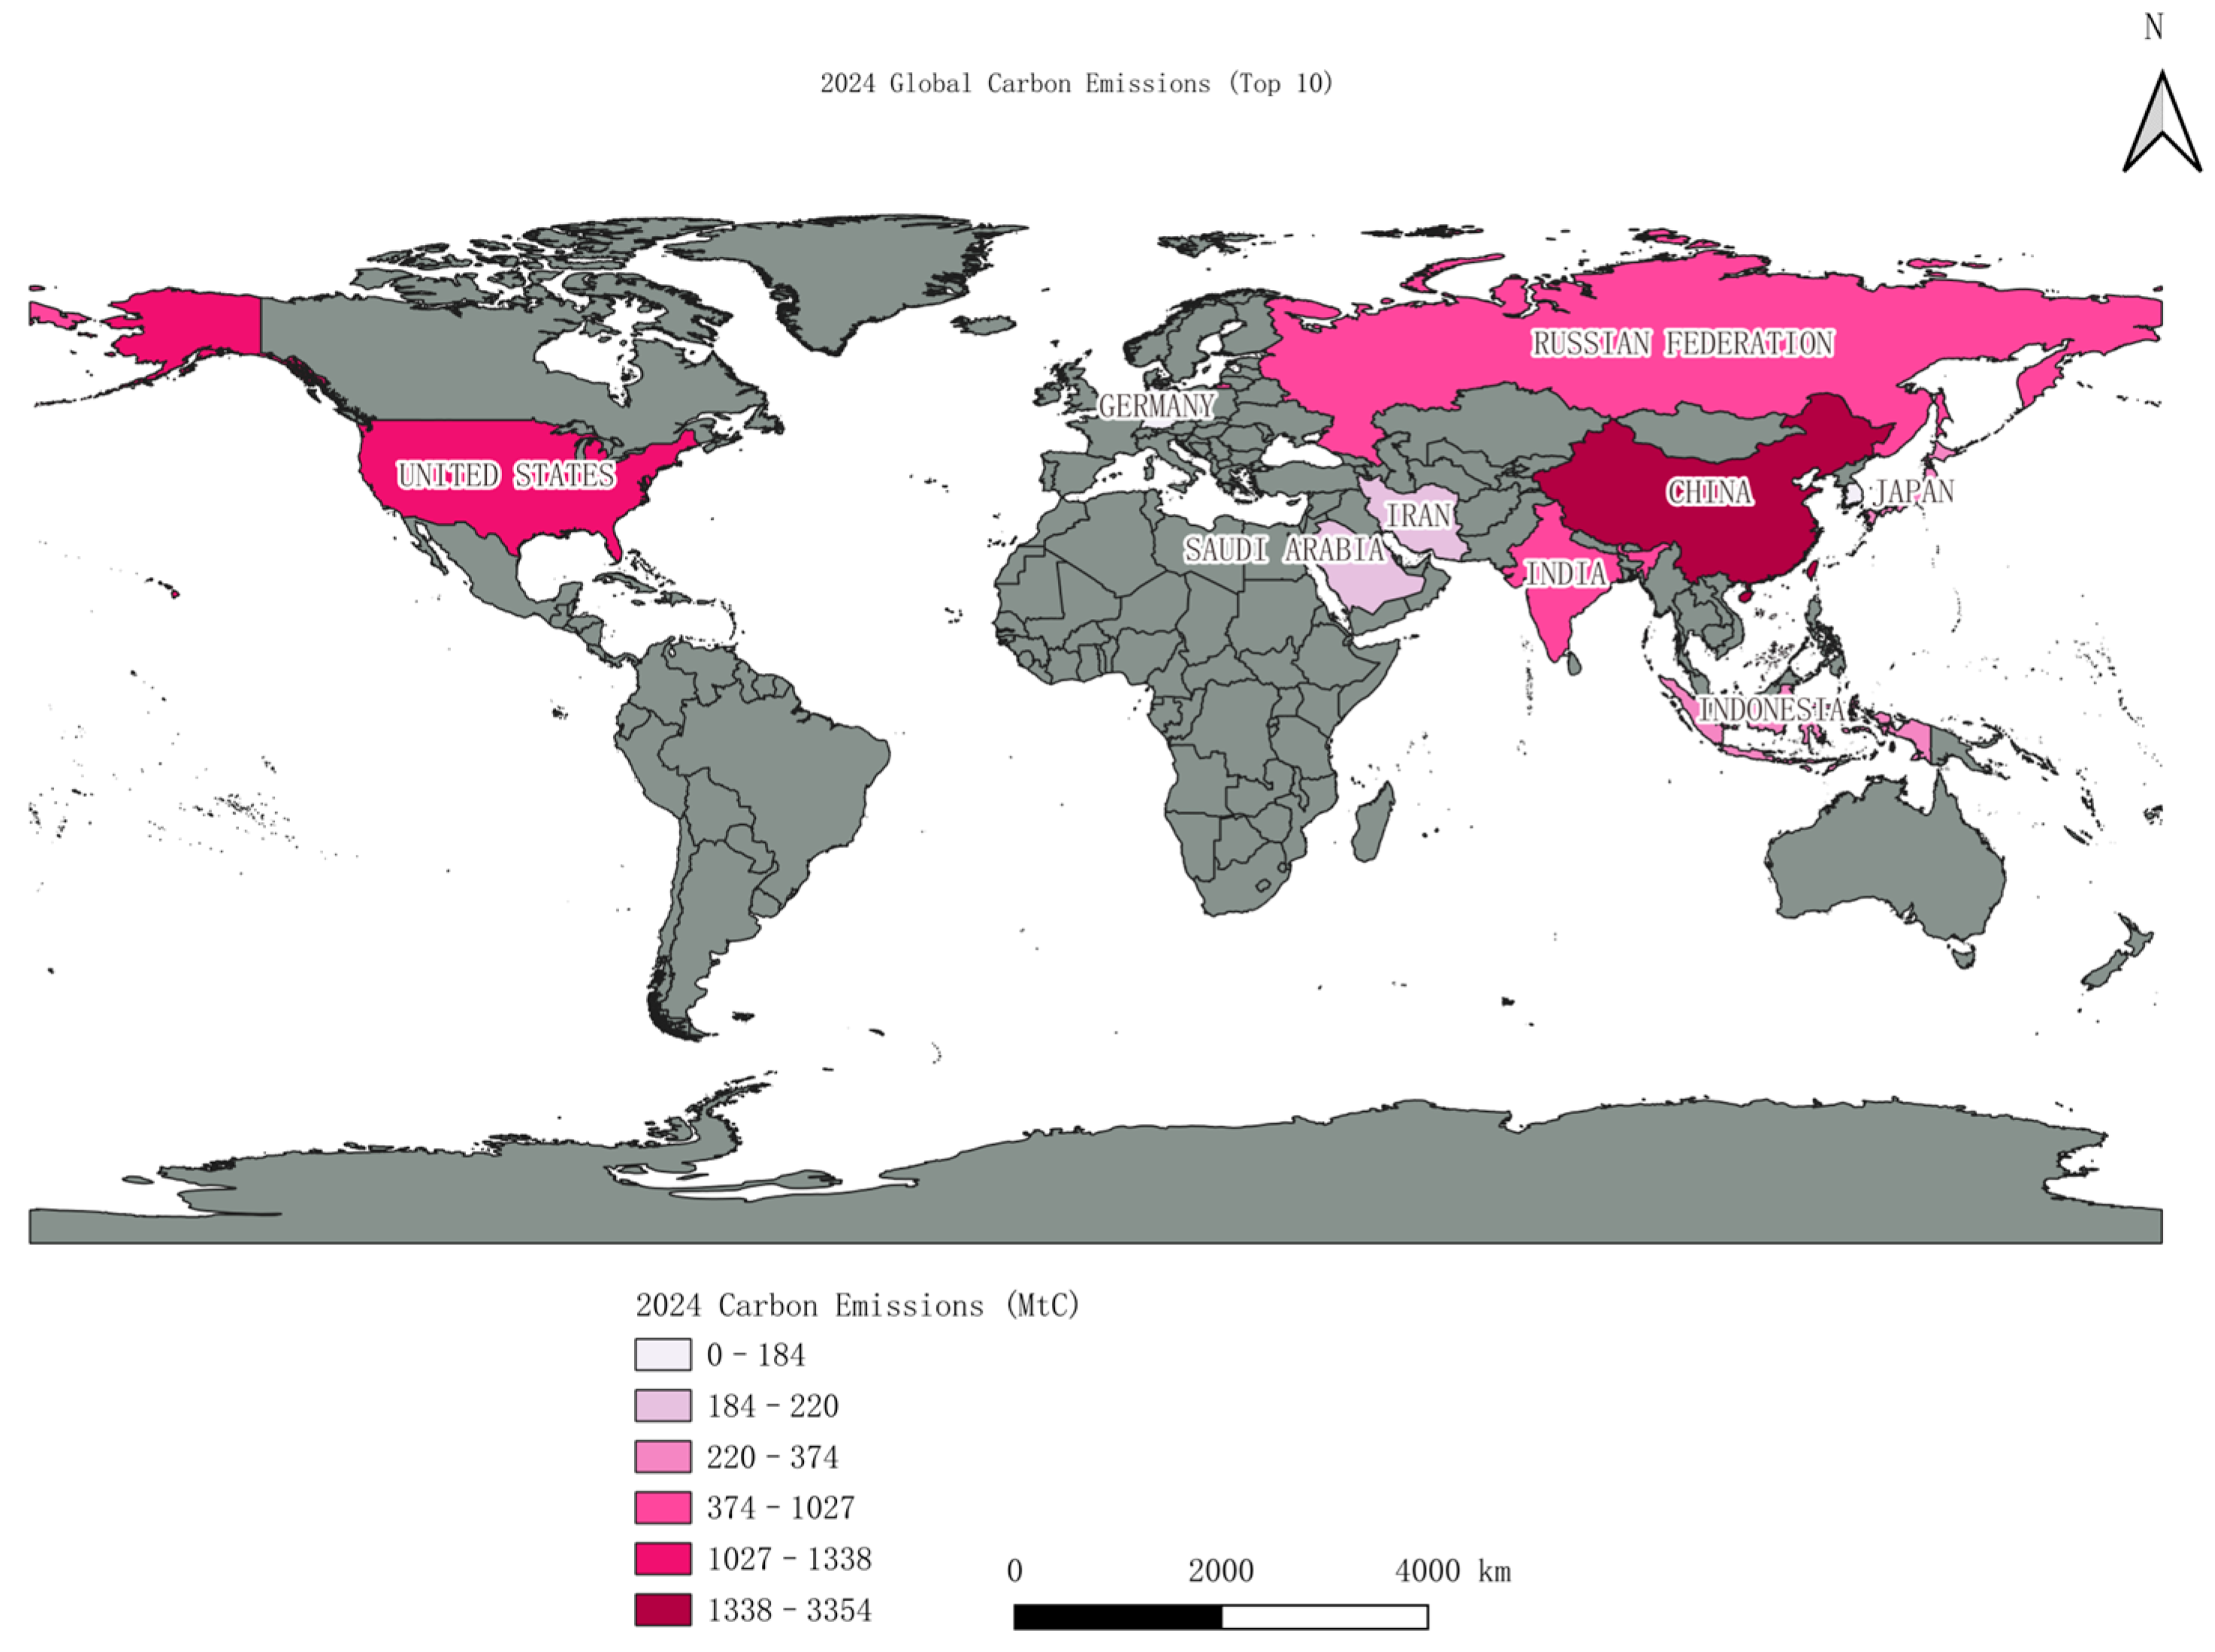
Global climate change has become one of the most pressing sustainability challenges facing human society, and reducing greenhouse gas emissions is essential for limiting long-term climate risks. According to the Global Carbon Budget 2024, China remains one of the world’s largest carbon emitters, underscoring its critical role in global climate governance and low-carbon transition [1]. Figure 1 shows the global distribution of the top ten carbon-emitting countries in 2024, providing the international background for examining China’s carbon-reduction pathway. Against this background, China has proposed its “dual-carbon” goals—peaking carbon emissions before 2030 and achieving carbon neutrality before 2060—and has incorporated green and low-carbon development into the broader agenda of ecological civilization construction. Meanwhile, the rapid expansion of the digital economy has become an important force reshaping production, governance, and resource allocation. China’s digital economy has continued to expand in scale and strategic importance, providing new opportunities for improving energy efficiency, promoting industrial transformation, and supporting urban low-carbon development.
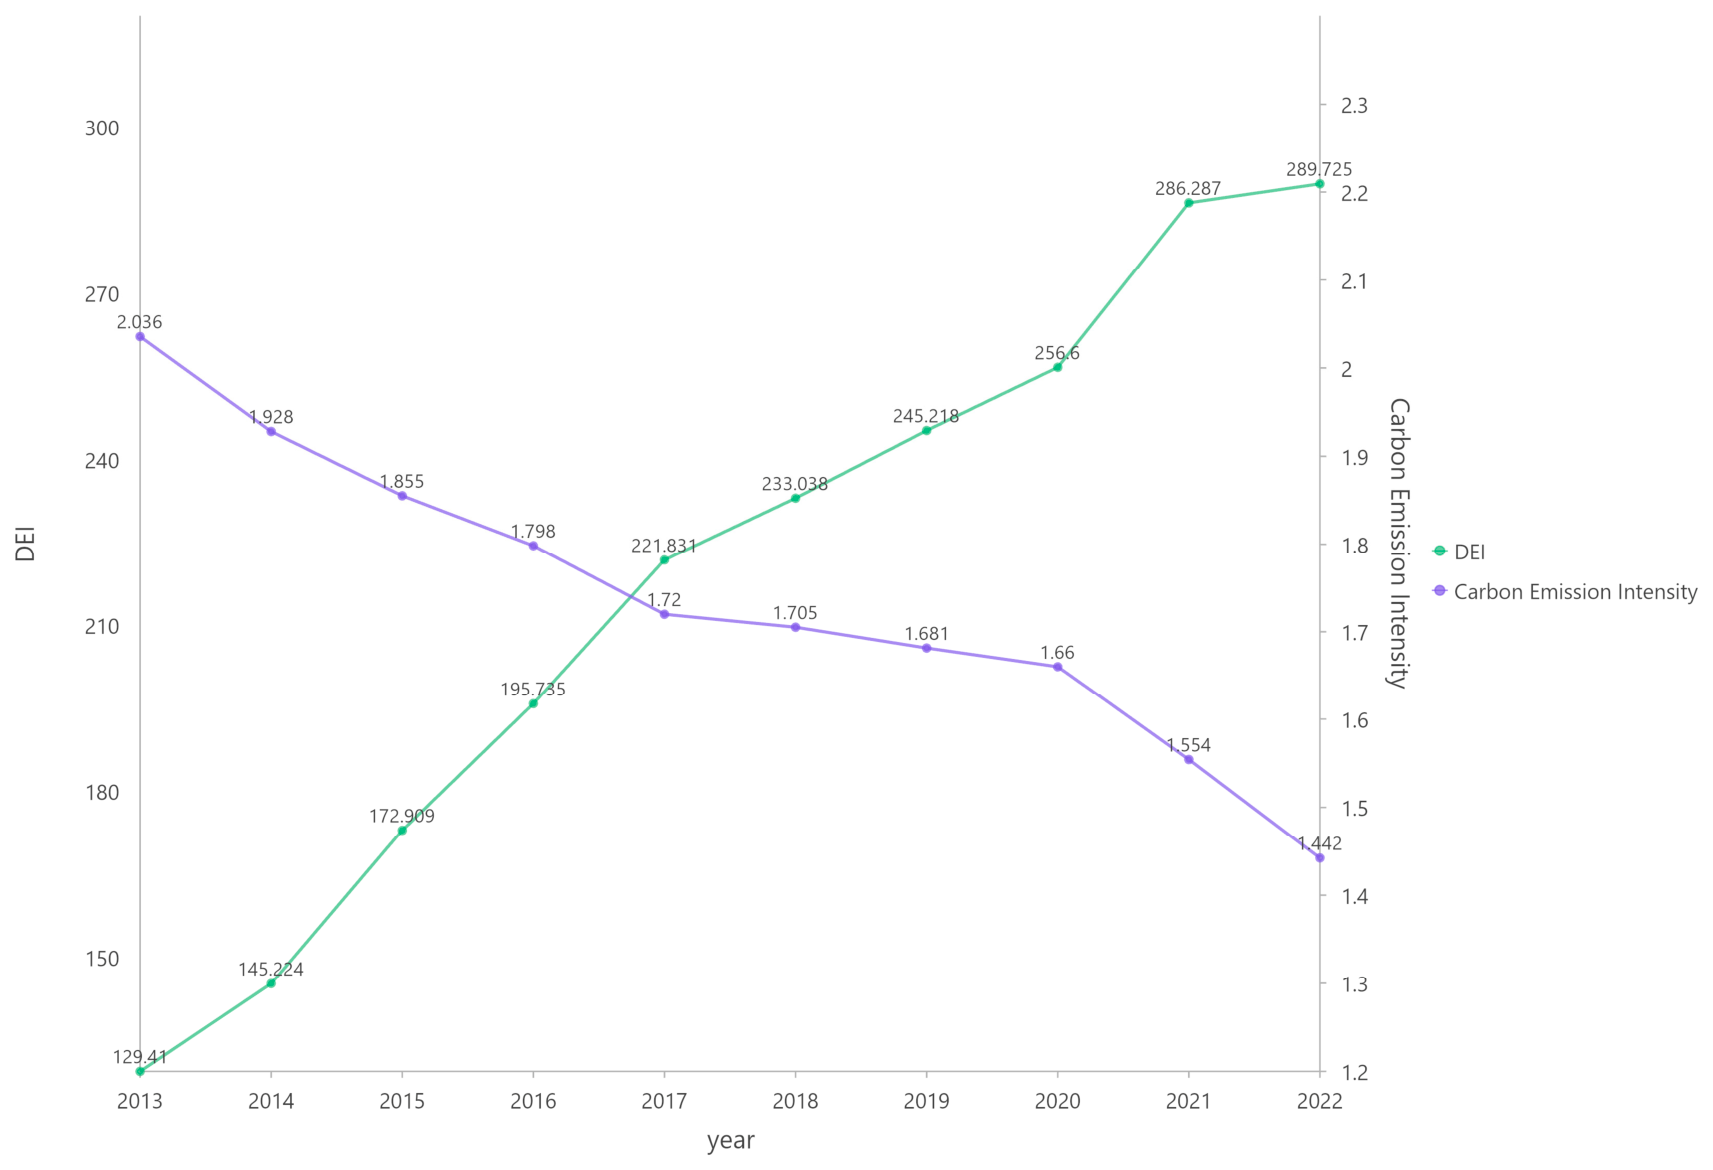
In parallel with the acceleration of low-carbon transition, digital technologies represented by big data, artificial intelligence, blockchain, cloud computing, and the Internet of Things are profoundly reshaping the global economic system. The digital economy, with data as a key factor of production, has become an important engine for promoting high-quality development and improving sustainability performance. In China, the strategic significance of the digital economy has been continuously strengthened. According to the 2022 report of the State Council, the scale of China’s digital economy accounted for 41.5% of GDP, indicating that digitalization has become deeply embedded in economic and social development. The 14th Five-Year Plan for the Development of the Digital Economy explicitly emphasizes the use of digital technologies to promote a comprehensive green transformation of economic and social systems. Similarly, the 2024 Government Work Report places the vigorous development of the digital economy alongside the steady advancement of carbon peaking and carbon neutrality, providing a clear policy orientation for integrating digital transformation with carbon mitigation. Theoretically, the digital economy may affect carbon emissions through both emission-reducing and emission-increasing channels. On the one hand, digital technologies can reduce carbon emission intensity by optimizing production processes, improving energy efficiency, enhancing resource allocation, facilitating intelligent environmental governance, and promoting the transformation of industrial structures toward low-energy and service-oriented sectors. On the other hand, the construction and operation of digital infrastructure, including data centers and communication networks, may generate additional energy demand and lead to rebound effects. Thus, the net environmental impact of the digital economy remains an empirical question. Figure 2 illustrates the trends in China’s urban digital economy development index and carbon emission intensity from 2013 to 2022. The figure shows a clear negative association: as the digital economy index increased steadily, carbon emission intensity declined continuously. This preliminary pattern suggests that the digital economy may have considerable potential to support carbon reduction. However, the observed correlation does not necessarily imply causality, nor does it reveal the underlying transmission mechanisms, spatial spillover effects, or heterogeneous impacts across different types of cities. These issues require further rigorous empirical investigation.
Although the observed correlation in Figure 2 suggests a close association between digital economy development and carbon emission intensity, it does not by itself establish causality or reveal the channels through which digitalization affects urban low-carbon transition. To address these issues, this study constructs a city-level panel dataset covering 288 prefecture-level and above cities in China from 2013 to 2022 and examines the impact of the digital economy on urban carbon emission intensity using fixed-effects models, mediation analysis, and a Spatial Durbin Model. This study contributes to the literature in four main ways. First, it provides refined city-level evidence on the relationship between digital economy development and carbon emission intensity. Compared with provincial-level analyses, city-level data better capture intra-provincial heterogeneity and the role of cities as operational units for digital infrastructure construction, industrial transformation, and carbon governance. In particular, this study processes gridded carbon emission data from EDGAR by spatially matching emission grids with prefecture-level administrative boundaries, aggregating grid-level emissions to the city-year level, and then calculating carbon emission intensity using GDP deflated to constant 2013 prices. This procedure improves the spatial comparability of urban carbon emission measurement and provides a more precise empirical basis for city-level low-carbon analysis. Second, this study constructs a dual-path mechanism framework linking the digital economy, industrial structure, technological innovation, and carbon emission intensity. Rather than treating industrial upgrading and technological innovation as independent explanatory variables, this paper compares their mediating roles within a unified analytical framework and further examines the possibility that green technological innovation may generate a short-term “green paradox” effect before its long-term carbon-reduction benefits are fully realized. Third, this study explicitly incorporates spatial dependence into the analysis. Digital technologies are characterized by network externalities and cross-regional diffusion, implying that digital economy development in one city may affect not only local carbon emission intensity but also that of neighboring cities. By employing a Spatial Durbin Model and decomposing direct and indirect effects, this study identifies whether the carbon-reduction effect of the digital economy operates mainly through local effects or spatial spillovers. Fourth, this study examines the boundary conditions under which the carbon-reduction effect of the digital economy varies across cities. Specifically, it investigates heterogeneity across different levels of digital economy development, fiscal expenditure, and geographical location. These analyses provide more targeted evidence for differentiated urban low-carbon policies and help clarify how digital transformation can support sustainable development in different types of cities.
The remainder of this paper is organized as follows. Section 2 reviews the relevant literature and clarifies the theoretical positioning of this study. Section 3 presents the theoretical analysis and research hypotheses. Section 4 describes the research design, including data sources, variable measurement, spatial weight matrix construction, and econometric model specification. Section 5 reports the empirical results, including benchmark regression, endogeneity tests, robustness checks, mediation analysis, heterogeneity analysis, and spatial effect decomposition. Section 6 summarizes the main conclusions, discusses policy implications, and identifies the limitations of the study as well as directions for future research.

2. Literature Review

2.1. Research on Measurement and Influencing Factors of Carbon Emission Intensity

Carbon emission intensity, usually measured as carbon emissions per unit of economic output, is a key indicator for evaluating the carbon cost of economic growth and the quality of low-carbon development. Compared with total carbon emissions, carbon emission intensity better reflects the coordination between economic expansion and carbon mitigation, especially for developing economies that still face the dual tasks of maintaining growth and reducing emissions. Therefore, it has been widely used in studies of regional low-carbon transition, urban sustainability, and carbon-reduction policy evaluation [3].
The measurement of carbon emission intensity depends first on the accurate estimation of carbon emissions. Existing carbon accounting approaches can generally be divided into three categories: emission-factor-based accounting, input output-based estimation, and spatially explicit estimation based on remote sensing or gridded emission datasets. Emission-factor methods are closely linked to energy consumption and industrial activity data, but their application at the city level is often constrained by missing energy statistics and inconsistent statistical calibers across regions. Input output methods are useful for tracing embodied emissions across sectors and supply chains, but they are usually more applicable to national or provincial analyses because city-level input output tables are often unavailable or incomplete. In recent years, gridded emission datasets, nighttime-light-based estimation, and near-real-time emission monitoring have improved the spatial and temporal comparability of urban carbon emission measurement [4]. These approaches make it possible to construct comparable city-level carbon emission indicators by matching emission information with administrative boundaries or functional urban areas. Although uncertainties remain across data sources, spatial resolutions, sectoral classifications, and boundary definitions, city-level emission datasets provide an important empirical foundation for analyzing the spatial heterogeneity of carbon emission intensity [5].
Beyond measurement, existing studies have increasingly focused on the determinants of carbon emission intensity. First, economic development level and urbanization are important factors affecting carbon emission intensity. Economic growth may increase energy demand and carbon emissions through scale expansion, but higher income levels may also support cleaner technologies, stricter environmental governance, and more efficient infrastructure. Therefore, the relationship between economic development and carbon emission intensity may be nonlinear. Urbanization and population agglomeration also have mixed effects. On the one hand, dense urban areas may improve infrastructure sharing, public service efficiency, and energy utilization efficiency; on the other hand, rapid urban expansion may increase transportation demand, construction activities, and energy consumption [6].
Second, industrial structure and energy structure are widely regarded as core determinants of carbon emission intensity. Cities with a higher share of heavy industry and energy-intensive manufacturing usually face greater pressure to reduce carbon intensity, whereas the expansion of services, high-technology industries, and knowledge-intensive sectors tends to lower the carbon cost of economic output. Existing city-level evidence shows that differences in infrastructure, industrial composition, and energy-related characteristics are closely associated with the spatial heterogeneity of carbon intensity across Chinese cities [7]. In particular, industrial structure optimization can reduce factor misallocation across sectors and improve the coordination between output structure and employment structure, while technical progress can reduce energy consumption and carbon emissions per unit of output [8].
Third, technological progress and green innovation play important roles in reducing carbon emission intensity. Technological progress can improve production efficiency, promote cleaner production processes, and reduce the carbon cost of economic output. However, the carbon-reduction effect of technological innovation may not be fully released immediately. In the short run, research and development, equipment renewal, and the coexistence of old and new production systems may increase energy inputs, while efficiency improvement may also generate rebound effects. Therefore, the effect of technological progress on carbon emission intensity may depend on the stage of technology diffusion, local absorptive capacity, and industrial application conditions [8].
Fourth, environmental regulation, government intervention, and policy instruments also affect carbon emission intensity. Stricter environmental regulation can force firms to improve energy efficiency and adopt cleaner technologies, while fiscal expenditure, science and technology investment, green finance, and low-carbon pilot policies may provide institutional support for carbon reduction. However, the effectiveness of these policies varies across cities because of differences in industrial foundations, governance capacity, financial resources, and technology absorption ability. Empirical evidence from Chinese cities suggests that environmental regulation can affect urban CO2 emissions by promoting industrial structure upgrading and technological innovation, but its effect may vary across regions and stages of development [9].
In addition, carbon emission intensity is not spatially independent. Economic activity, industrial linkages, energy flows, infrastructure networks, and environmental policies can generate spatial interactions across neighboring cities. City-level studies show that urban emission trajectories and emission peaks are shaped not only by local socioeconomic conditions but also by regional development patterns and intercity linkages [10]. This implies that carbon-intensity reduction should be analyzed not only from the perspective of local characteristics but also from the perspective of spatial interaction.
Overall, the existing literature has provided rich evidence on the measurement and influencing factors of carbon emission intensity. Studies have shown that carbon emission intensity is jointly shaped by emission-accounting methods, economic development, urbanization, industrial structure, energy structure, technological progress, environmental regulation, population density, and spatial interaction. Nevertheless, several issues still require further investigation. First, some studies focus on total carbon emissions rather than carbon emission intensity, which may not fully reflect the carbon efficiency of urban economic growth. Second, although existing studies have examined multiple influencing factors, the role of digital economy development in reshaping industrial structure, technological innovation, and spatial spillovers remains insufficiently integrated into a unified analytical framework. Third, city-level evidence based on spatially comparable emission data is still needed to better capture intra-provincial heterogeneity and regional interactions. Therefore, this study uses carbon emission intensity as the dependent variable and examines how digital economy development affects urban carbon intensity through direct effects, transmission mechanisms, heterogeneous impacts, and spatial spillovers.

2.2. Studies on the Impact of the Digital Economy on Industry and Technological Innovation

The digital economy has become an increasingly important factor affecting carbon emissions and environmental performance. Digital technologies may influence carbon emission intensity through multiple pathways. First, digital infrastructure and data-driven production systems can improve energy efficiency by optimizing production processes, reducing information asymmetry, and enabling real-time monitoring of energy consumption, which can lead to lower carbon intensity at both firm and city levels [11,12]. Second, digital platforms facilitate the allocation of resources by reducing transaction costs and supporting the transfer of production factors from low-productivity and high-emission sectors toward more efficient and low-carbon sectors, thereby mitigating emissions associated with structural imbalances [12,13]. Third, by enhancing carbon monitoring, environmental regulation transparency, and market-based policy implementation, digital technologies can strengthen environmental governance and accelerate the diffusion of low-carbon standards and practices [13].
Empirical studies have provided growing evidence that the digital economy is associated with improved carbon performance. Using Chinese city-level panel data, Yi (2022) found that digital economy development significantly improves urban carbon emission performance by reducing energy intensity and fostering urban greening, although the effects vary across regions and development stages [14]. At the provincial level, Bai et al. (2023) employed a Spatial Durbin Model and reported that digital economy development exerts both significant direct effects and spatial spillover effects in reducing carbon emissions, indicating that digitalization in one region may benefit neighboring regions’ carbon outcomes as well [15]. Ren (2021) further examined the nonlinear and spatial effects of the digital economy on carbon emission intensity, emphasizing that the stage of technology adoption and local industrial composition condition the strength of carbon-reducing effects [16].
Nevertheless, the environmental effect of the digital economy is not necessarily uniform or unconditionally positive. The construction and operation of digital infrastructure—including data centers, telecommunication networks, and other digital facilities—may increase electricity demand and generate rebound effects, which could offset part of the carbon savings from efficiency gains [17,18]. At the same time, productivity improvements enabled by digital technologies may lower production costs and stimulate output expansion the “scale effect, partly counteracting the unit-level emission reductions [18]. These potential countervailing forces underscore that the relationship between digital economy development and carbon emission intensity remains an empirical question, particularly at the city level where digital infrastructure, industrial composition, and energy consumption patterns vary substantially across regions and over time.

2.3. Studies on the Carbon Reduction Effects of Industry and Technological Innovation

The impact of the digital economy on carbon emission intensity is closely related to changes in industrial structure and technological innovation. From the perspective of industrial structure, digital economy development can promote both industrial structure rationalization and industrial structure upgrading. Industrial structure rationalization improves the allocation efficiency of labor, capital, information, and technology across sectors, thereby reducing factor misallocation and energy consumption per unit of output. Industrial structure upgrading increases the share of services, high-technology industries, and knowledge-intensive activities, which generally have lower carbon intensity than traditional resource-based and heavy industrial sectors. Existing studies on China show that the digital economy can promote industrial transformation and upgrading, and that industrial structure upgrading plays an important mediating role in reducing carbon emission intensity [19,20].
Technological innovation represents another important pathway through which the digital economy may affect carbon emission intensity. Digital technologies reduce information search costs, accelerate knowledge diffusion, and improve the efficiency of research and development activities. Big data, artificial intelligence, industrial internet platforms, and digital finance can support the development and adoption of green technologies by improving the matching efficiency between technology supply and market demand. From the perspective of directed technical change, innovation incentives can shift technological progress from carbon-intensive production toward cleaner technologies when appropriate market and policy conditions are present [21]. Empirical evidence based on patent data also suggests that green technological innovation can contribute to carbon dioxide emission reduction, although its effectiveness may depend on income level, technology absorption capacity, and the stage of economic development [22].
However, the carbon-reduction effect of technological innovation may involve a time lag. In the short run, green technology research and development, equipment renewal, and the coexistence of old and new production systems may require additional energy inputs. Moreover, efficiency improvements may reduce unit production costs and stimulate output expansion, thereby generating rebound effects that partially offset energy savings and emission reductions [23,24]. Therefore, technological innovation may generate a short-term “green paradox” or masking effect before its long-term carbon-reduction benefits are fully realized. This suggests that industrial structure optimization and technological innovation should not be treated merely as separate control variables; rather, they should be examined as potential transmission mechanisms through which the digital economy affects carbon emission intensity.

2.4. Spatial Spillover Effects of the Digital Economy

Urban carbon emissions are not spatially independent. Economic activities, industrial chains, technological diffusion, environmental regulation, and infrastructure networks all generate spatial interactions among cities. Spatial econometric theory suggests that ignoring spatial dependence may lead to biased or inconsistent estimates when the dependent variable or key explanatory variables are spatially correlated. This issue is particularly relevant for studies of digital economy impacts, because digital technologies are characterized by network externalities and cross-regional diffusion patterns that may transcend administrative boundaries [25].
The spatial spillover effect of the digital economy may operate through several mechanisms. First, digital networks weaken geographical barriers to knowledge diffusion. Innovative management practices, green production techniques, and digital monitoring systems developed in one city can be transmitted to neighboring cities through patent information flows, digital platforms, interregional cooperation, and talent mobility [25,26]. Second, digital supply-chain platforms can promote intercity coordination among upstream and downstream firms. When leading firms or core cities adopt digital carbon-management standards, these practices may diffuse to suppliers and partner cities along the production network, thereby facilitating coordinated emission reductions [26]. Third, local governments may imitate successful digital and low-carbon policies adopted by neighboring cities due to policy learning, demonstration effects, or intergovernmental competition, leading to policy diffusion and strategic convergence [27].
Existing empirical studies have increasingly incorporated spatial econometric models into the analysis of digital economy and carbon or environmental outcomes. A number of studies using Spatial Durbin Models, spatial lag models, or spatial error models have documented significant spatial spillovers, suggesting that digital infrastructure and digital connectivity in one region can contribute to emission reductions in adjacent regions [11,15]. However, the magnitude and direction of spatial spillovers appear to depend on regional characteristics such as economic development level, industrial composition, infrastructure connectivity, and human capital endowments [11,12]. These findings indicate that the carbon-reduction effect of the digital economy should be examined not only from a local perspective but also from a regional and spatial perspective.

2.5. Literature Positioning of This Study

Overall, the existing literature provides important insights into urban carbon emission measurement, the environmental effects of the digital economy, and the roles of industrial structure, technological innovation, and spatial spillovers. However, three issues still require further investigation. First, although city-level research has increased, more evidence is needed based on spatially comparable urban carbon emission indicators constructed from gridded emission data. Second, the transmission mechanisms through which the digital economy affects carbon emission intensity need to be examined within a unified framework that compares industrial structure optimization and technological innovation. Third, given the network externalities of digital technologies and the spatial dependence of carbon emissions, it is necessary to distinguish local effects from spatial spillover effects.
In response to these issues, this study constructs a panel dataset of 288 Chinese prefecture-level and above cities from 2013 to 2022. It examines the impact of the digital economy on urban carbon emission intensity, identifies the mediating roles of industrial structure and technological innovation, and uses a Spatial Durbin Model to decompose direct and indirect effects. In doing so, this study provides city-level empirical evidence on how digital transformation contributes to urban low-carbon transition and offers policy implications for differentiated and regionally coordinated carbon reduction.

3. Theoretical Analysis

3.1. Conceptual Framework and Measurement Dimensions of the Digital Economy

The digital economy refers to an economic system in which data serve as a key production factor, information networks provide the basic infrastructure, and digital technologies are integrated into production, circulation, consumption, and governance. Rather than representing only the expansion of information and communication technologies, the digital economy reflects a broader process of organizational restructuring, factor reallocation, industrial transformation, and governance modernization.
Consistent with the measurement framework of this study, the digital economy is conceptualized along four interrelated dimensions: digital infrastructure, digital application, digital industrialization, and industrial digitalization. These dimensions capture different functional layers of digital development and provide the theoretical basis for examining its impact on urban carbon emission intensity.
First, digital infrastructure constitutes the foundational condition for digital connectivity. It includes internet access, mobile communication networks, broadband facilities, and other information transmission systems. By reducing information transmission costs and improving data-processing capacity, digital infrastructure can support real-time energy monitoring, more efficient production coordination, and intelligent urban management. However, its construction and operation may also increase electricity demand, particularly through data centers and communication networks.
Second, digital application reflects the diffusion of digital services into economic transactions, financial activities, and public governance. Digital finance, online platforms, and data-based services can reduce information asymmetry, improve market matching efficiency, and facilitate access to financing for energy-saving investment and green technology adoption. In this sense, digital application may contribute to carbon intensity reduction by improving allocation efficiency and strengthening the responsiveness of environmental governance.
Third, digital industrialization refers to the development of industries that produce digital goods and services, such as software, telecommunications, information technology services, and data-related industries. As these sectors are generally more knowledge-intensive and less dependent on fossil-fuel-based material inputs than traditional heavy industries, their expansion may promote a shift toward higher value-added and lower-carbon economic activities. Nevertheless, the growth of digital industries may also generate additional energy demand, implying that its environmental effect depends on the balance between structural upgrading and energy consumption.
Fourth, industrial digitalization captures the integration of digital technologies into traditional industries, especially manufacturing, logistics, and producer services. Through industrial internet platforms, intelligent equipment, digital supply-chain management, and data-driven production systems, industrial digitalization can reduce factor misallocation, improve energy efficiency, and enhance coordination across production networks. It therefore constitutes a key pathway through which the digital economy may reduce carbon emissions per unit of output.
More importantly, the four dimensions of the digital economy correspond to different components of carbon emission intensity. Digital infrastructure and industrial digitalization mainly affect the carbon-emission numerator by improving energy monitoring, production coordination, and process efficiency. Digital application and digital industrialization mainly affect the economic-output denominator by reducing information frictions, improving factor allocation, and expanding knowledge-intensive activities. Meanwhile, the expansion of digital infrastructure may also increase energy demand and generate rebound effects. Therefore, the relationship between the digital economy and carbon emission intensity should be analyzed through both emission-reduction and output-efficiency mechanisms.

3.2. Direct Impact of the Digital Economy on Carbon Emission Intensity

Carbon emission intensity is defined as carbon emissions per unit of economic output. Therefore, the direct effect of the digital economy on urban carbon emission intensity can be understood from an intensity-decomposition perspective. Specifically, the digital economy may affect carbon emission intensity by reducing the carbon-emission numerator, improving the economic-output denominator, and reshaping the efficiency relationship between emissions and output. This perspective provides a closer theoretical connection between the connotation of the digital economy and the measurement meaning of carbon emission intensity.
First, the digital economy can reduce the carbon-emission component of carbon emission intensity by improving energy-use efficiency and production-process efficiency. Digital infrastructure, industrial internet platforms, Internet of Things sensors, big data analytics, and artificial intelligence systems enable firms and local governments to monitor energy consumption, identify inefficient production links, and optimize equipment operation in real time. Compared with traditional production systems, digitalized production systems can reduce information delays and improve the precision of energy management, thereby lowering unnecessary energy losses and carbon emissions during production activities [28]. In addition, digital technologies can improve the coordination of production, logistics, inventory management, and supply-chain operations. By reducing redundant production, excessive inventory, and inefficient transportation, the digital economy can directly reduce the carbon emissions generated per unit of economic activity.
Second, the digital economy can reduce carbon emission intensity by improving the economic-output component of the indicator. As data become an important production factor, digital technologies reduce information asymmetry, transaction costs, and search costs in factor markets. This strengthens the matching efficiency of labor, capital, technology, and information across firms and industries. More efficient factor allocation allows cities to generate higher economic output under the same level of resource and energy input, thereby reducing carbon emissions per unit of GDP [29]. In this sense, the digital economy does not only influence emissions through technological substitution, but also changes the efficiency relationship between carbon emissions and economic output by improving total factor productivity and urban resource-allocation efficiency.
Third, the digital economy can directly affect carbon emission intensity through digital environmental governance. Carbon emission intensity is not only determined by firms’ production behavior but also by the precision and effectiveness of environmental regulation. Digital monitoring platforms, remote sensing technologies, online emission-reporting systems, and big-data-based regulatory tools can improve the timeliness, accuracy, and transparency of environmental supervision. These tools help local governments identify high-emission sources, reduce regulatory information asymmetry, and strengthen policy implementation. As a result, digital governance can enhance the enforcement of environmental regulations and promote more efficient carbon-emission control [30]. Compared with traditional governance methods, digital governance improves the ability of cities to transform environmental regulation from ex post administrative intervention into real-time and data-driven management.
Fourth, the direct effect of the digital economy on carbon emission intensity may also involve a countervailing mechanism. The construction and operation of digital infrastructure, especially data centers, cloud computing facilities, communication base stations, and large-scale computing systems, require substantial electricity consumption. If the electricity used by these facilities mainly comes from fossil energy, the expansion of digital infrastructure may increase carbon emissions and partially offset the carbon-reduction effect generated by efficiency improvement [31]. In addition, the efficiency gains brought by digital technologies may reduce production costs and stimulate output expansion, which may generate rebound effects. Therefore, the direct impact of the digital economy on carbon emission intensity is theoretically ambiguous and depends on the relative strength of efficiency improvement, output expansion, and additional energy demand from digital infrastructure.
Overall, from the perspective of carbon emission intensity decomposition, the digital economy may reduce urban carbon emission intensity through three main direct channels: lowering carbon emissions by improving energy and production efficiency, increasing economic output efficiency through better factor allocation, and strengthening carbon-emission control through digital environmental governance. However, the expansion of digital infrastructure and possible rebound effects may weaken or offset part of this carbon-reduction effect. Therefore, whether the digital economy ultimately reduces urban carbon emission intensity remains an empirical question. Based on the above analysis, this study proposes the following hypothesis:
H1. 
Digital economy development significantly reduces urban carbon emission intensity.

3.3. Indirect Impact of the Digital Economy on Urban Carbon Emission Intensity

3.3.1. Industrial Structure Optimization Pathway

Industrial structure optimization includes two dimensions: industrial structure rationalization and industrial structure upgrading. These two dimensions reduce carbon emission intensity through different but complementary mechanisms. Industrial structure rationalization refers to the improvement of coordination among industries and the enhancement of factor allocation efficiency. In this study, industrial structure rationalization is measured by the Theil index, and a lower value indicates a more rational industrial structure. In the traditional economy, the movement of production factors such as labor and capital across industries is often constrained by information asymmetry and transaction costs. These frictions may lead to factor misallocation and efficiency losses, thereby increasing energy consumption and carbon emission intensity per unit of output [32]. The development of the digital economy can significantly reduce these frictions. Digital platforms lower search costs in the labor market through real-time information matching; online financial services accelerate the flow of capital toward more productive sectors; and supply-chain collaboration platforms facilitate information sharing and inventory optimization between upstream and downstream enterprises [19]. When production factors are reallocated from low-efficiency and high-emission sectors to high-efficiency and low-emission sectors, the energy input and carbon emissions required per unit of GDP decline accordingly. In this sense, the digital economy can reduce carbon emission intensity by promoting the rationalization of industrial structure.
Industrial structure upgrading refers to the transformation of the industrial system from one dominated by low-end manufacturing toward one led by services and high-technology industries. Compared with heavy industries, services and high-technology sectors generally have lower carbon emission intensity, and their carbon emissions per unit of value added are substantially lower than those of energy-intensive manufacturing sectors [33]. The development of the digital economy accelerates this transformation in several ways. First, the application of digital technologies gives rise to many emerging service industries with relatively low-carbon characteristics, such as platform services, digital finance, online education, telemedicine, and information services. Second, digital transformation enables traditional manufacturing firms to extend their value chains toward research and development, design, branding, marketing, and after-sales services. This process of manufacturing servitization promotes the upgrading of industrial structure and reduces dependence on high-energy-consuming production activities [13].
It should be emphasized that industrial structure rationalization and industrial structure upgrading are not two completely separate processes. Rationalization provides the foundation for upgrading. Only when factor allocation efficiency continues to improve can the transition toward a more advanced industrial structure become sustainable. Conversely, upgrading creates new space for rationalization. The expansion of services and high-technology industries generates higher value-added employment opportunities and encourages the further reallocation of production factors toward more efficient sectors [20]. Therefore, industrial structure rationalization and industrial structure upgrading jointly constitute the first indirect transmission pathway through which the digital economy affects urban carbon emission intensity.

3.3.2. Technological Innovation Pathway

Technological innovation constitutes the second indirect pathway through which the digital economy affects urban carbon emission intensity. Its mechanism can be explained from two aspects: the technology supply side and the technology application side. On the technology supply side, digital technologies significantly improve the research and development efficiency and diffusion speed of green technologies by reducing the information and coordination costs of innovation activities. According to the classical knowledge production function, innovation output depends on knowledge stock, research and development input, and the efficiency of knowledge recombination. The core contribution of digital technologies lies in improving the efficiency of knowledge recombination.
Specifically, big data analytics and machine learning technologies can rapidly identify patterns of energy consumption and emissions from massive heterogeneous datasets and accurately locate technological bottlenecks. As a result, the traditional trial-and-error-based research and development process can be partly transformed into a data-driven prediction process. Digital platforms also reduce cooperation barriers among innovation actors, enabling enterprises, universities, and research institutions to share data, conduct collaborative design, and carry out joint research through cloud-based systems. This accelerates the iterative upgrading of green technologies. In addition, digital networks allow knowledge and technologies to diffuse across space at lower cost and higher speed. For example, after a green patent is granted in city A, its technical information can be quickly accessed and learned by innovators in city B through digital networks [34]. The essence of this mechanism is that digital technologies transform tacit knowledge originally embedded in specific geographical spaces and organizations into codifiable and transferable digital information, thereby substantially reducing the spatial and temporal costs of knowledge spillovers.
On the technology application side, the effect of green technological innovation on carbon emission intensity is not necessarily linear. Rather, it may follow an Environmental Kuznets Curve-type pattern. In the short run, the carbon reduction effect of green technological innovation may be constrained by several factors. First, green technology research and development, equipment renewal, and technological adaptation themselves require energy inputs, which may temporarily increase carbon emissions during the innovation process. Second, a decline in energy consumption per unit of product may reduce production costs and encourage firms to expand production due to price advantages, leading to the Jevons paradox, in which total carbon emissions do not decrease but instead increase. Third, before old technologies are fully eliminated and new technologies are widely adopted, old and new systems may operate simultaneously, causing duplicated energy consumption in the short term. Therefore, at the initial stage of technology introduction, green technological innovation may be positively associated with carbon emission intensity.
In the long run, however, once green technologies are commercialized on a large scale and gradually replace traditional technologies, their energy-saving and carbon reduction effects can be fully released. Energy-saving technologies reduce energy consumption per unit of output; cleaner production technologies reduce pollutants and carbon emissions during production processes; and renewable energy technologies optimize the energy supply structure and reduce dependence on fossil fuels [35]. At this stage, urban carbon emission intensity is expected to decline significantly. Therefore, the relationship between green technological innovation and carbon emission intensity may exhibit an inverted U-shaped pattern: carbon emissions may increase with innovation activity in the early stage of technology introduction, but begin to decline after green innovation exceeds a certain threshold.
The carbon reduction effect of green technological innovation is not automatically realized; rather, it depends on the economic incentives and policy environment for technology adoption. Only when the marginal carbon reduction cost of green technologies is lower than the marginal benefit will firms have sufficient incentives to upgrade their technologies. Digital technologies help alleviate this incentive constraint by reducing information asymmetry, providing more accurate market signals, and improving the matching efficiency between technology supply and technology demand. In this way, the digital economy may accelerate the arrival of the turning point at which green technological innovation begins to exert a stronger carbon reduction effect [36].
Furthermore, technological innovation and industrial structure optimization interact with each other. Technological innovation gives rise to new industries, new business models, and new forms of production organization, thereby promoting the upgrading of industrial structure. At the same time, the optimization of industrial structure provides broader application scenarios and market space for technological innovation, forming a positive feedback loop [37]. Therefore, from the perspective of theoretical mechanisms, industrial structure optimization and technological innovation jointly constitute the “dual engines” through which the digital economy affects carbon emission intensity. These two mechanisms reinforce each other rather than simply operating in parallel. Based on the above analysis, this study proposes the following hypotheses:
H2. 
The digital economy reduces urban carbon emission intensity through industrial structure optimization.
H3. 
The impact of green technological innovation on carbon emission intensity exhibits an inverted U-shaped nonlinear pattern, and a short-term “green paradox” effect may exist.

3.4. Spatial Spillover Effects of the Digital Economy on Urban Carbon Emission Intensity

The digital economy may affect not only local carbon emission intensity but also carbon emission intensity in neighboring cities through spatial spillover mechanisms. From the perspective of spatial econometrics, urban carbon outcomes are often spatially correlated because economic activities, industrial linkages, infrastructure networks, technology diffusion, and environmental policies are not confined within administrative boundaries. This is particularly relevant to the digital economy, as digital infrastructure, data flows, online platforms, and knowledge networks naturally exhibit cross-regional connectivity and network externalities. Therefore, the effect of digital economy development on carbon emission intensity should be examined not only from a local perspective but also from a spatial interaction perspective.
The technology-diffusion channel provides an important mechanism through which the digital economy may generate positive spatial spillovers. Digital networks reduce the cost of information transmission and weaken geographical barriers to knowledge spillovers. Green technologies, energy-saving management practices, carbon-monitoring tools, and digital production standards developed in one city can be transmitted to neighboring cities through digital platforms, patent information flows, interregional cooperation, and talent mobility [25]. Such diffusion can improve neighboring cities’ capacity for cleaner production, energy management, and low-carbon governance, thereby reducing their carbon emission intensity.
The supply-chain coordination channel further strengthens the regional carbon-reduction effect of the digital economy. In urban agglomerations and regional production networks, firms located in different cities are often connected through upstream and downstream industrial chains. Digital platforms can improve information sharing, logistics coordination, inventory management, and production scheduling across cities. When core firms or leading cities adopt digital carbon-management standards, these standards may be transmitted to suppliers and partner cities through production networks [26]. As a result, digital economy development in one city may help neighboring cities reduce redundant production, improve resource allocation, and lower carbon emissions per unit of output.
The policy-learning channel also contributes to the spatial transmission of digital carbon-reduction effects. Local governments often observe the policy practices of neighboring cities, especially when such practices improve environmental performance or regional competitiveness. Digital governance tools, smart environmental-monitoring platforms, carbon-emission information systems, and low-carbon pilot policies may spread across cities through demonstration effects and intergovernmental learning [27]. This process can improve the regional coordination of carbon governance and strengthen the spillover effect of digitalization on carbon intensity reduction.
However, the spatial spillover effect of the digital economy is not necessarily positive in all cases. Digitally advanced cities may generate siphon effects by attracting high-skilled labor, data resources, innovative firms, financial capital, and public investment from surrounding areas [38]. If neighboring cities lose key production factors and innovation resources, their capacity for digital transformation and low-carbon development may be weakened. In addition, core cities may transfer low-end or high-emission production activities to peripheral cities during industrial upgrading, which may increase the carbon emission pressure of surrounding areas [39]. Therefore, the spatial effect of the digital economy depends on the relative strength of positive diffusion effects and negative siphon effects.
Overall, the spatial effect of the digital economy is theoretically ambiguous. When technology diffusion, supply-chain coordination, and policy learning dominate, digital economy development in one city may reduce carbon emission intensity in neighboring cities. However, when siphon effects dominate, digitally advanced cities may attract skilled labor, innovation resources, digital infrastructure investment, and high-value-added industries from surrounding cities, thereby weakening neighboring cities’ low-carbon transition capacity. Therefore, the net spatial effect of the digital economy depends on the type of intercity linkage and the relative strength of diffusion and siphon mechanisms. Based on the above analysis, this study proposes the following hypotheses:
H4a. 
Under geographical proximity, digital economy development exerts a negative spatial spillover effect on urban carbon emission intensity through technology diffusion, supply-chain coordination, and policy learning.
H4b. 
Under economic-linkage-based proximity, digital economy development may generate competitive or siphon effects, thereby weakening or offsetting the carbon-reduction spillovers among economically connected cities.
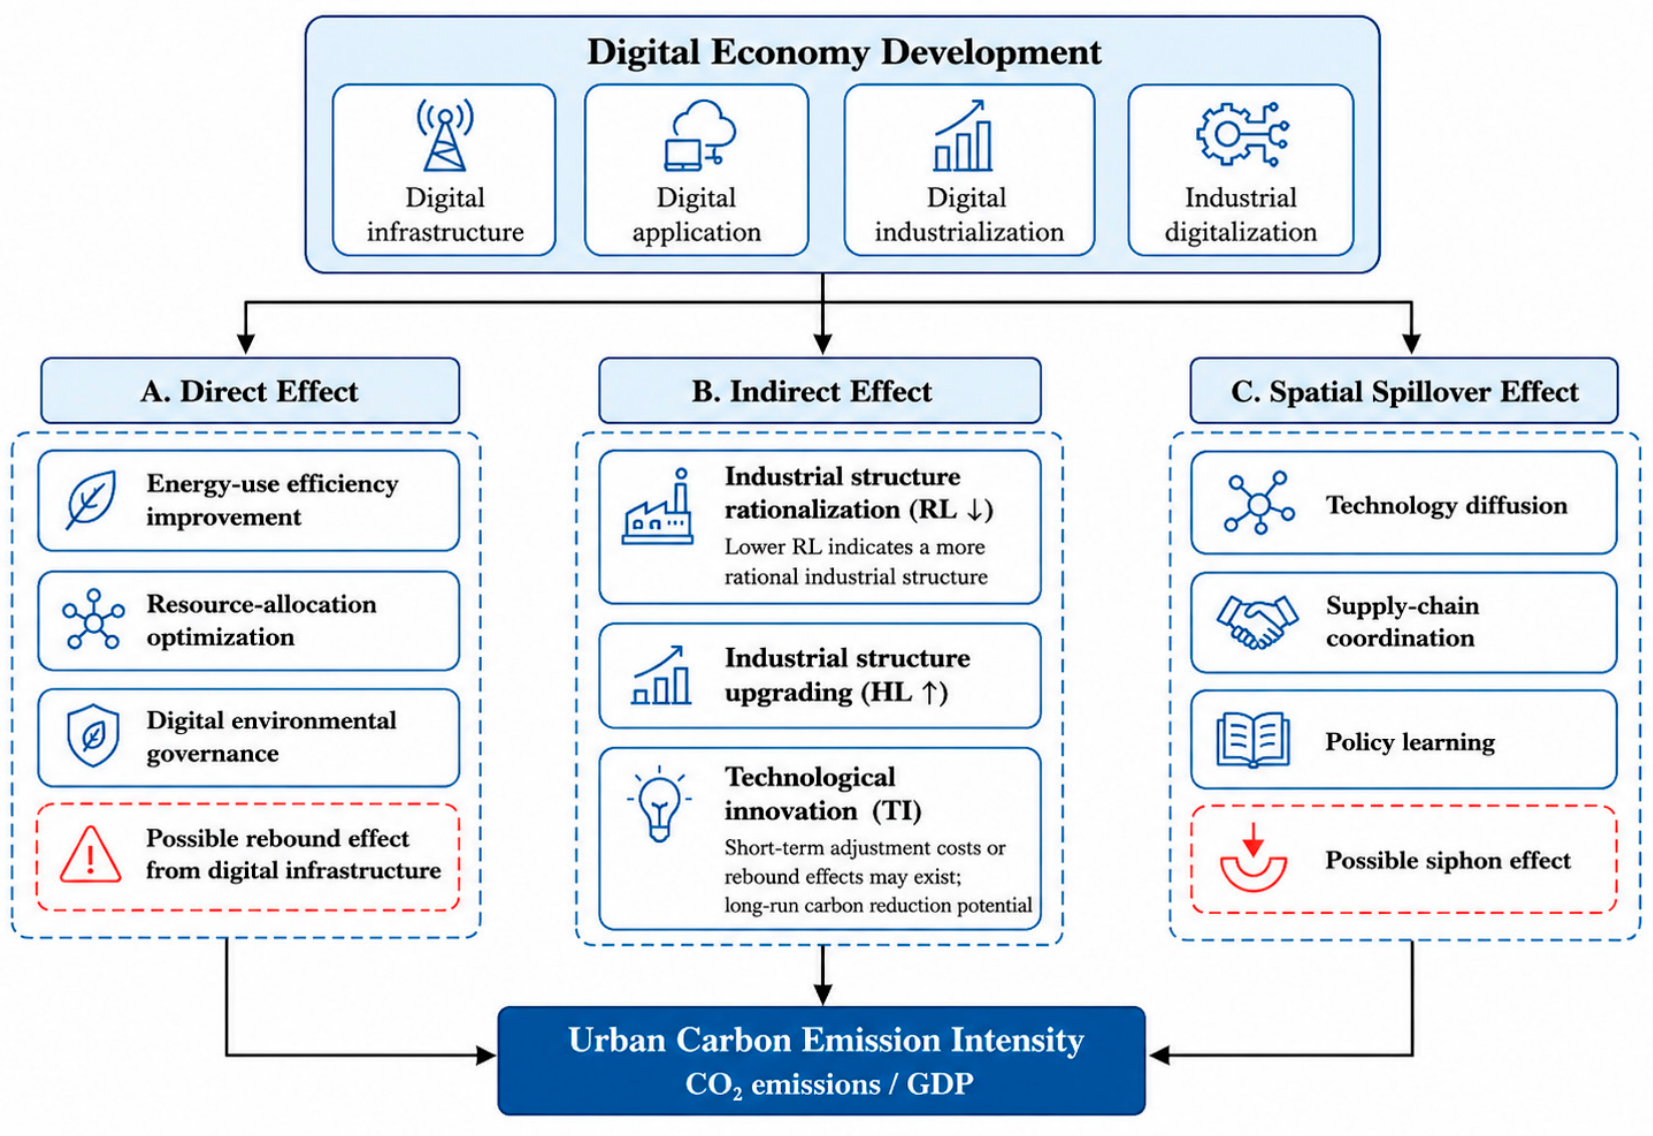
Figure 3 illustrates the theoretical mechanism through which digital economy development affects urban carbon emission intensity. The framework consists of three channels: direct effects, indirect mechanisms, and spatial spillovers. From the perspective of carbon emission intensity decomposition, the digital economy may reduce the emission component by improving energy-use efficiency, production coordination, and environmental governance, and may enhance the output component through better resource allocation and productivity improvement. Meanwhile, digital infrastructure expansion may generate additional electricity demand and rebound effects. The indirect mechanisms include industrial structure rationalization, industrial structure upgrading, and technological innovation, through which digitalization reshapes factor allocation, promotes low-carbon industrial transformation, and facilitates knowledge diffusion. Spatial spillovers occur through technology diffusion, supply-chain coordination, and policy learning, although siphon effects may weaken neighboring cities’ low-carbon transition capacity. This framework provides the theoretical foundation for the empirical tests that follow.


4. Research Design

4.1. Variable Description

4.1.1. Dependent Variable

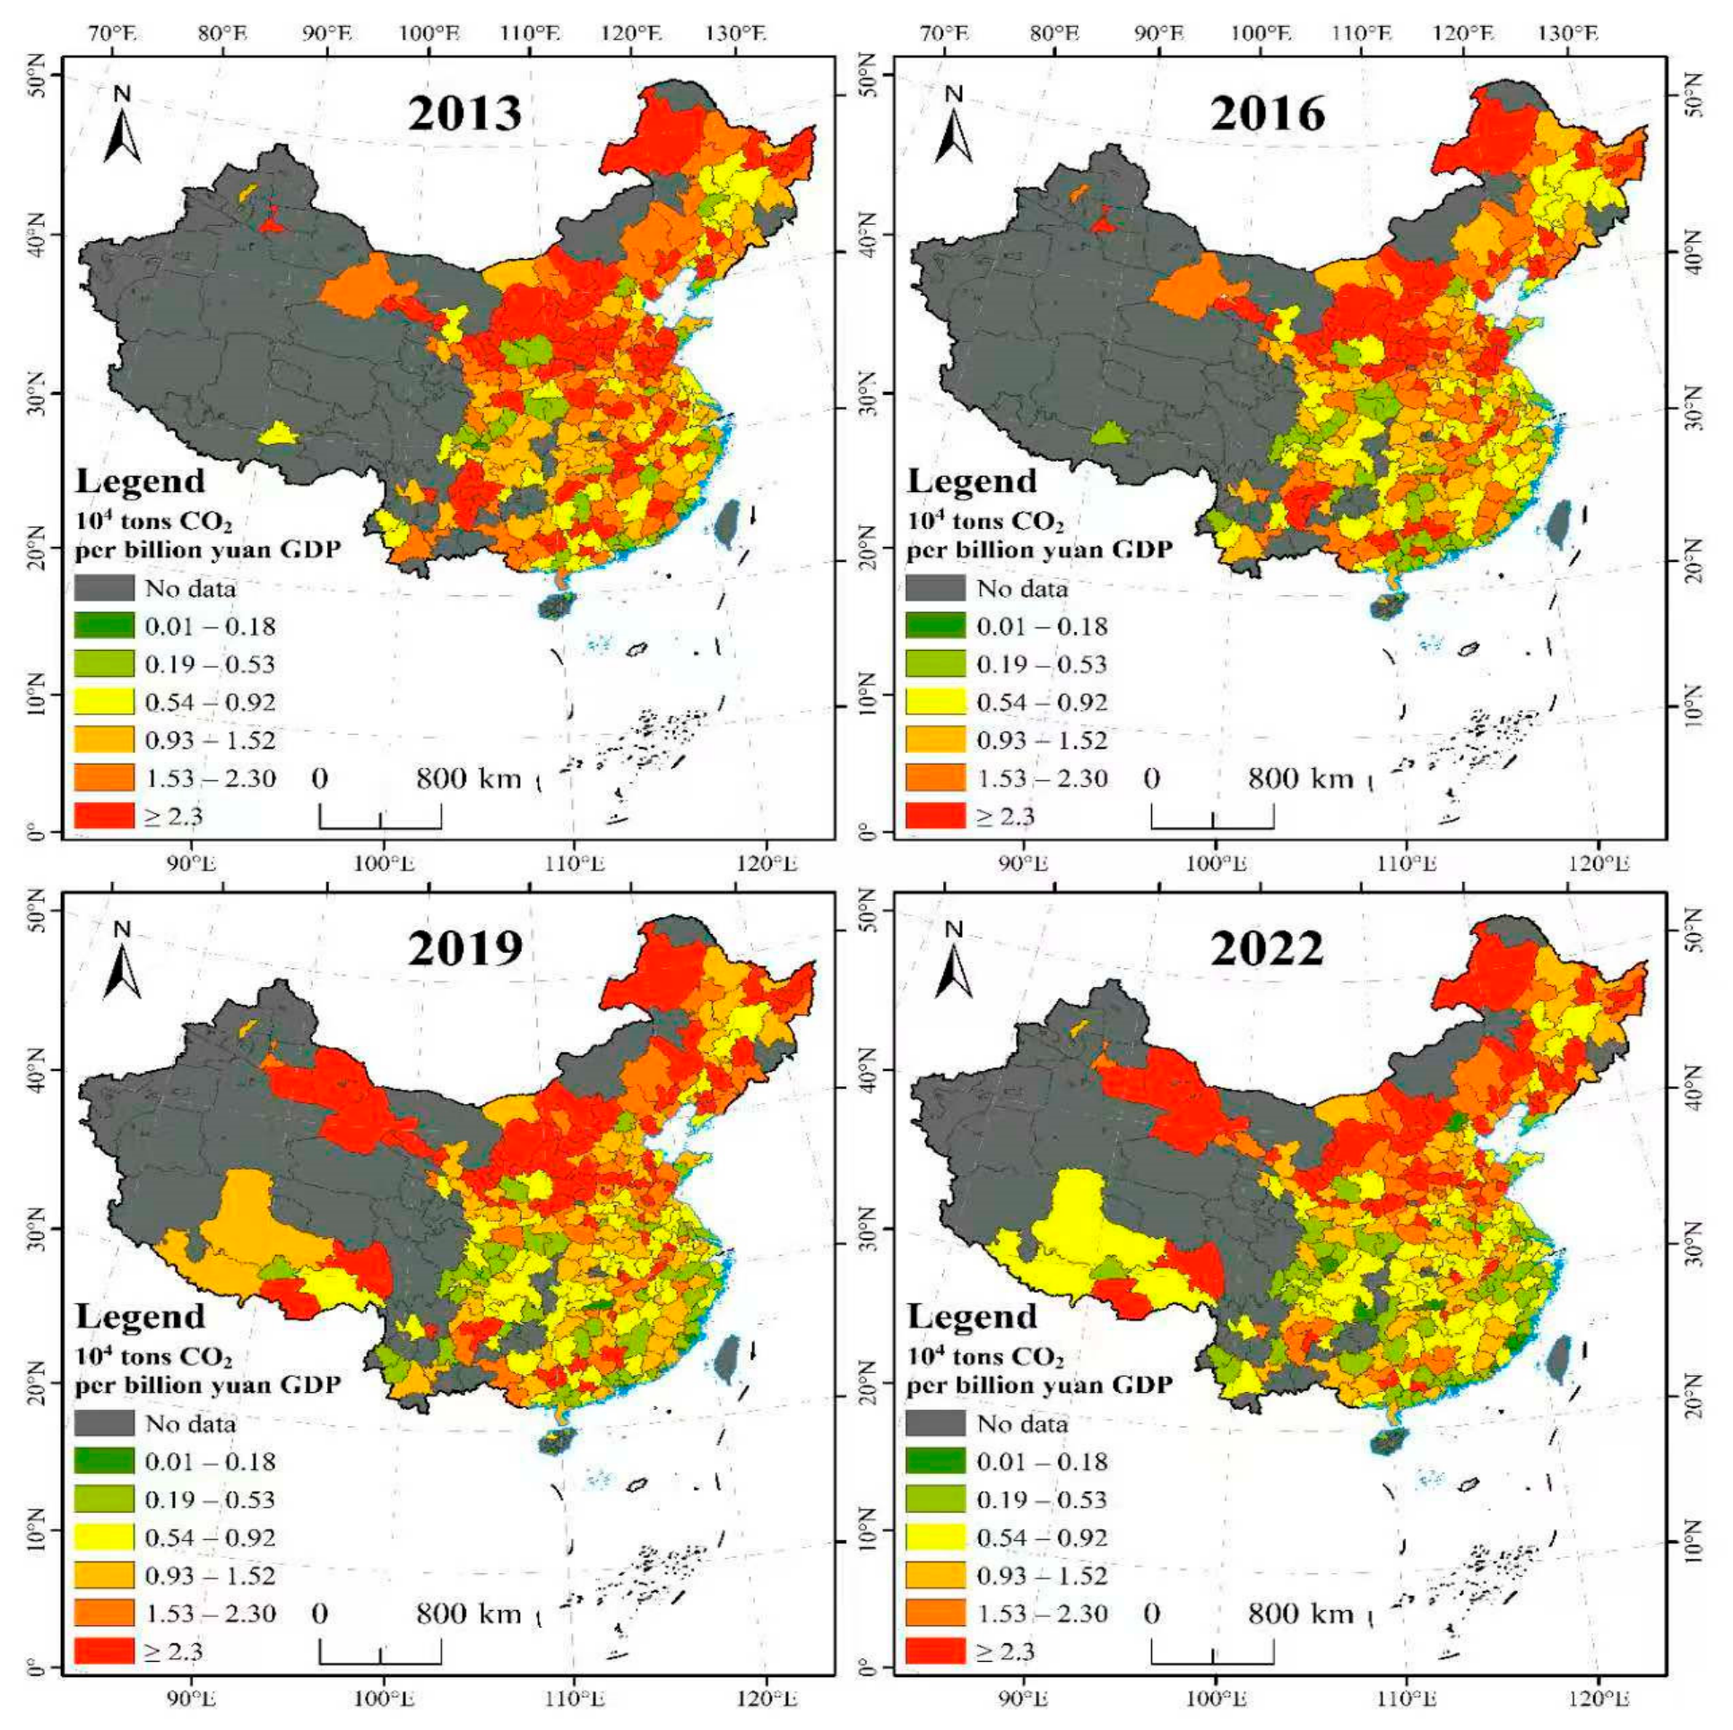
The dependent variable in this study is carbon emission intensity, measured as the ratio of urban carbon emissions to regional gross domestic product (GDP). Carbon emission data are obtained from the Emissions Database for Global Atmospheric Research (EDGAR). GDP is deflated using constant 2013 prices to eliminate the influence of price fluctuations and ensure temporal comparability. This indicator reflects the level of carbon emissions generated per unit of economic output and is widely used to evaluate the quality of regional low-carbon development. Figure 4 shows that urban carbon emission intensity generally declined from 2013 to 2022, with low- and medium-intensity areas gradually expanding. High-intensity areas remained relatively concentrated in northern, northeastern, and northwestern China, indicating that regional disparities in low-carbon transition persisted during the study period.

4.1.2. Core Explanatory Variable

The core explanatory variable is the Digital Economy Index (DEI). Following existing studies [41], this paper constructs an evaluation system for digital economy development from four dimensions: digital infrastructure, digital application, digital industrialization, and industrial digitalization. Eleven indicators are selected, including the number of internet users, the number of mobile phone users at year-end, and the Digital Financial Inclusion Index. The entropy weight method is used to determine the weights of each indicator, and the weighted sum is then employed to calculate the Digital Economy Index.
The entropy weight method assigns weights objectively according to the information entropy of each indicator, thereby avoiding potential bias caused by subjective weighting. Specifically, indicators with greater variation contain more information, have lower entropy values, and are assigned higher weights. The calculation procedure is as follows (Table 1).

4.1.3. Mediating Variables

Industrial structure rationalization (RL): Following Ding et al. [42], this study measures industrial structure rationalization using the Theil index. The formula is specified as follows:
rationalization i , t = ∑ n = 1 3 Y i , t , n Y i , t Ln Y i , t , n Y i , t / L i , t , n L i , t
where i denotes the city, t denotes the year, and (n = 1,2,3) represents the primary, secondary, and tertiary industries, respectively. Y refers to gross regional product, and L refers to employment. A smaller value of RL indicates a more rational industrial structure, suggesting a higher degree of coordination between output structure and employment structure across industries.
Industrial structure upgrading (HL): industrial structure upgrading is measured by the ratio of tertiary industry value-added to secondary industry value-added.
Technological innovation capability (TI): Technological innovation capability is measured by the number of regional patent applications. A larger number of patent applications indicates a stronger technological innovation capability. This indicator reflects the overall intensity of local innovation activities and is commonly used to capture regional technological capacity.

4.1.4. Control Variables

Based on existing studies [9], this paper selects a set of control variables to account for other factors that may affect the relationship between the digital economy and carbon emission intensity. These variables include administrative land area, economic growth rate, economic development level, fiscal expenditure, and science and technology expenditure.
Specifically, administrative land area (Area) is measured by the total land area within a city’s administrative boundaries, expressed in square kilometers. Economic growth rate (GDPg) is measured by the annual GDP growth rate of each city. Economic development level (PGDP) is measured by per capita GDP in the current year, expressed in CNY. Fiscal expenditure (FE) is measured by the ratio of general public budget expenditure to regional GDP. Science and technology expenditure (TE) is measured by the ratio of fiscal expenditure on science and technology to total fiscal expenditure. These control variables are included to reduce omitted-variable bias and improve the reliability of the estimated effect of the digital economy on carbon emission intensity.

4.2. Model Specification

4.2.1. Baseline Regression Model

To examine the direct inhibitory effect of the digital economy on carbon emission intensity, corresponding to H1, this study constructs a two-way fixed effects model as follows:
CI it = α + β × DEI it + ∑ k = 1 n γ k × Control kit + μ i + λ t + ε kt
where CI it is the carbon emission intensity of city i in period t; DEIit is the digital economy index; Controlkit is the k-th control variable; μi is the individual fixed effect; λt is the time fixed effect and εit is the random error term.

4.2.2. Mediation Effect Model

To test the mediation effects of industrial structure optimization (H2) and technological innovation (H3), the following stepwise regression models are constructed:
Med it = α + β ⋅ DEI it + ∑ k = 1 n γ k ⋅ Control kit + μ i + λ t + ε it
CI it = α 1 + θ ⋅ DEI it + δ ⋅ Med it + ∑ k = 1 n ϕ k ⋅ Control kit + μ i + λ t + ε it
where Medit is the mediating variable (industrial structure upgrading HL, industrial structure rationalization RL, or Technological innovation capability TI); θ is the coefficient for the direct effect of the core explanatory variable; δ is the coefficient capturing the mediating variable’s effect on carbon emission intensity.

4.3. Spatial Econometric Model

To address potential spatial dependence across cities, this study employs the Spatial Durbin Model (SDM) as an auxiliary empirical specification following established spatial econometric approaches [14]. The SDM accounts for both spatial dependence in carbon emission intensity and spatial spillovers from explanatory variables, while the inverse-distance-squared spatial weight matrix captures the decay of intercity interactions with geographical distance. Since the main focus of this study is the direct effect of digital economy development on urban carbon emission intensity, the detailed spatial correlation tests, model selection procedures, and effect decomposition are reported in the empirical analysis section.

4.4. Data and Descriptive Statistics

This study takes 288 prefecture-level and above cities in China as the research sample, covering the period from 2013 to 2022. The final dataset contains 2880 city-year observations. Data are obtained from the Emissions Database for Global Atmospheric Research (EDGAR), the Peking University Digital Financial Inclusion Index, the China City Statistical Yearbook, the China National Intellectual Property Administration, and the National Bureau of Statistics. To reduce the potential influence of extreme values on the estimation results, all continuous variables are winsorized at the 1st and 99th percentiles.
Table 2 reports the descriptive statistics. Carbon emission intensity varies considerably across cities, with a mean value of 1.7217 and a standard deviation of 1.6157. The Digital Economy Index ranges from 0.8777 to 3.6107, with a mean value of 2.1764. The control variables also exhibit substantial variation, indicating that the sample covers cities at diverse stages of economic development, fiscal capacity, technological investment, and spatial scale. This variation provides an empirical basis for identifying the impact of the digital economy on urban carbon emission intensity.
In addition, a variance inflation factor (VIF) diagnostic was conducted for the explanatory variables. The maximum VIF is 1.92 and the mean VIF is 1.40, both well below the conventional threshold of 10, indicating that severe multicollinearity is unlikely to affect the regression estimates.

5. Empirical Results

5.1. Baseline Regression Results

Table 3 reports the baseline regression results. Column (1) includes only the Digital Economy Index, whose coefficient is significantly negative at the 1% level, suggesting a preliminary carbon-reduction effect of the digital economy. Column (2) further controls for city-level characteristics, city fixed effects, and year fixed effects. The coefficient of the Digital Economy Index remains significantly negative, with an estimated value of −0.7628, indicating that digital economy development significantly reduces urban carbon emission intensity.
For the control variables, administrative land area, economic growth rate, and economic development level are negatively associated with carbon emission intensity, while fiscal expenditure shows a significantly positive effect. The coefficient of science and technology expenditure is not statistically significant. Overall, the results provide strong empirical support for H1, confirming that the digital economy plays a significant role in reducing urban carbon emission intensity.

5.2. Endogeneity Tests

Potential endogeneity may remain despite the inclusion of city fixed effects, year fixed effects, and city-level controls. To address reverse causality, omitted variables, and measurement error, this study adopts four complementary strategies: a two-stage least squares (2SLS) approach using geographic diffusion instruments, System GMM estimation, a heteroskedasticity-based instrumental-variable method, and a Smart City pilot DID design.

5.2.1. Instrumental Variable Approach

To mitigate potential endogeneity, this study employs a two-stage least squares (2SLS) approach. The baseline instrument is constructed by interacting each city’s standardized distance to Hangzhou with the national level of digital economy development. Hangzhou is a leading digital-economy hub in China, and proximity to Hangzhou is expected to capture differential exposure to digital infrastructure diffusion, platform spillovers, and technology transmission. Since the distance variable is time-invariant and absorbed by city fixed effects, while the national digital-economy trend is absorbed by year fixed effects, their interaction provides time-varying cross-city variation in digital economy exposure.
To assess whether the results depend on a single instrument, an alternative geographic instrument is constructed using each city’s standardized distance to the nearest node city of China’s “eight-vertical-and-eight-horizontal” national communication-trunk network, interacted with the same national digital-economy trend. As backbone-network nodes represent major hubs of digital infrastructure, proximity to these nodes is closely associated with local digital economy development through infrastructure accessibility and network diffusion.
Table 4 reports the 2SLS estimates. The first-stage results show that both instruments are significantly correlated with the Digital Economy Index. The Kleibergen–Paap rk Wald F statistics are 272.58 for the Hangzhou-distance instrument and 33.66 for the backbone-node instrument, both exceeding the conventional weak-instrument threshold. The second-stage coefficients of the Digital Economy Index are negative across specifications, consistent with the baseline results. In the over-identified specification using both instruments, the coefficient remains negative (−0.7576), and the Hansen over-identification test is not rejected (p = 0.758), providing no evidence against the over-identifying restrictions. These results indicate that the estimated carbon-reduction effect of the digital economy is robust to alternative geographic instruments.

5.2.2. System GMM Estimation

Considering the dynamic persistence of carbon emission intensity, this study further employs the system generalized method of moments estimator. By introducing the lagged dependent variable, the system GMM approach helps alleviate potential dynamic endogeneity, reverse causality, and omitted-variable bias.
As reported in Table 5, the coefficient of the lagged carbon emission intensity is positive and significant, indicating strong persistence in urban carbon emission intensity. More importantly, the coefficient of the Digital Economy Index remains significantly negative (−0.0922, t = −2.4508), which is consistent with the baseline results. The diagnostic tests support the validity of the dynamic panel specification. The AR(1) test is significant, whereas the AR(2) test is insignificant with a p-value of 0.270, indicating no second-order serial correlation in the differenced residuals. The Hansen test yields a p-value of 0.310, suggesting that the validity of the instruments is not rejected. These results provide further evidence that digital economy development contributes to reducing urban carbon emission intensity after controlling for dynamic adjustment and potential endogeneity.

5.2.3. Additional Endogeneity-Correction Tests

To further verify the reliability of the results, this study conducts two additional endogeneity-correction tests. First, a heteroskedasticity-based instrumental-variable estimation is employed to construct internal instruments from the heteroskedastic structure of the data. As shown in Table 6, The results show that the coefficient of the Digital Economy Index remains significantly negative (−0.1414, t = −4.5963), indicating that the baseline conclusion is not driven by potential omitted-variable bias or measurement error.
Second, this study uses the Smart City pilot policy as a quasi-natural experiment to examine the effect of digital transformation on carbon emission intensity. Smart City construction promotes digital infrastructure, data-driven governance, and the integration of digital technologies into urban management, thereby providing an external policy shock related to digital economy development. The estimated coefficient remains negative and statistically significant at the 10% level (−0.1230, t = −1.8201), further supporting the inhibitory effect of digital transformation on carbon emission intensity.
Overall, the results from the 2SLS estimation, system GMM estimation, heteroskedasticity-based instrumental-variable method, and Smart City DID analysis consistently indicate that the digital economy reduces urban carbon emission intensity. These findings suggest that the baseline conclusion is unlikely to be driven by endogeneity concerns.

5.3. Robustness Checks

To further verify the reliability of the baseline results, this study conducts five robustness checks, including replacing the dependent variable, replacing the core explanatory variable, excluding municipalities, excluding special years, and adjusting the fixed-effect specification.

5.3.1. Replacing the Dependent Variable

The dependent variable is replaced with per capita carbon emissions to examine whether the results are affected by the measurement of carbon emissions. As reported in Column (1) of Table 7, the coefficient of the Digital Economy Index remains significantly negative at the 1% level, indicating that the main conclusion does not depend on a specific measurement of carbon emissions.

5.3.2. Replacing the Core Explanatory Variable

The one-period lag of the Digital Economy Index is used as an alternative core explanatory variable to alleviate potential reverse causality. Column (2) shows that the coefficient of the lagged Digital Economy Index remains significantly negative, which is consistent with the baseline regression results.

5.3.3. Excluding Municipalities

Considering that Beijing, Tianjin, Shanghai, and Chongqing differ from other prefecture-level cities in administrative status, policy support, and resource endowments, these four municipalities are excluded from the sample. The result in Column (3) shows that the coefficient of the Digital Economy Index remains significantly negative, suggesting that the baseline conclusion is not driven by these special samples.

5.3.4. Excluding Special Years

The years 2020 and 2021 are excluded to avoid potential disturbances caused by the COVID-19 pandemic. As shown in Column (4), the coefficient of the Digital Economy Index is still significantly negative at the 1% level, indicating that the core conclusion is not affected by abnormal shocks during the pandemic period.

5.3.5. Adjusting the Fixed-Effect Specification

Finally, this study adjusts the fixed-effect specification to test whether the results depend on a particular fixed-effect setting. Column (5) shows that the coefficient of the Digital Economy Index remains significantly negative. Overall, the robustness checks confirm that the carbon reduction effect of the digital economy is stable and reliable.

5.4. Mediation Effect Analysis

To examine the transmission mechanisms linking digital economy development to urban carbon emission intensity, this study tests three mediating channels: industrial structure rationalization, industrial structure upgrading, and technological innovation capability. The results based on stepwise regressions and Bootstrap tests are reported in Table 8 and Table 9.
Industrial structure rationalization constitutes a significant mediation channel. The coefficient of the Digital Economy Index on industrial structure rationalization (RL) is significantly negative. Since RL is measured by the Theil index, a lower value indicates a more rational industrial structure. Therefore, the negative coefficient suggests that digital economy development reduces the mismatch between output structure and employment structure across industries, thereby improving industrial structure rationalization. In the carbon-emission-intensity equation, RL has a significantly positive coefficient, indicating that greater industrial mismatch increases carbon emission intensity. Accordingly, the product of the negative DEI–RL effect and the positive RL–carbon-intensity effect generates a negative indirect effect. The Bootstrap result confirms this mechanism, with an indirect effect of −0.0476 and a 95% confidence interval of [−0.082, −0.013]. This finding indicates that the digital economy reduces carbon emission intensity by promoting industrial structure rationalization.
Industrial structure upgrading also serves as an important transmission pathway. The coefficient of the Digital Economy Index on industrial structure upgrading (HL) is significantly positive, while the coefficient of HL in the carbon-emission-intensity equation is significantly negative. The Bootstrap indirect effect is −0.0866, with a 95% confidence interval of [−0.134, −0.048], indicating that industrial structure upgrading significantly transmits the carbon-reduction effect of the digital economy. This result suggests that digital technologies, digital finance, and platform-based resource allocation facilitate the transition from energy-intensive and low-value-added sectors toward cleaner, more efficient, and higher-value-added industries. The larger indirect effect of the upgrading channel relative to the rationalization channel further indicates that industrial upgrading is a more prominent pathway through which digital economy development reduces carbon emission intensity.
The mediating effect of technological innovation shows a more complex pattern. The Digital Economy Index significantly promotes technological innovation capability (TI). However, TI has a significantly positive coefficient in the carbon-emission-intensity equation, and the Bootstrap indirect effect is 0.1515, with a 95% confidence interval of [0.091, 0.212]. This result suggests that technological innovation has not yet generated an immediate carbon-reduction effect during the sample period. Innovation activities may involve short-term adjustment costs, including R&D investment, equipment renewal, infrastructure construction, and transitional energy demand during the replacement of old production systems. Moreover, innovation may initially expand production capacity before its environmental benefits are realized through commercialization, diffusion, and large-scale application.
Overall, the mediation results indicate that industrial structure optimization is a key mechanism through which the digital economy reduces urban carbon emission intensity. Both industrial structure rationalization and industrial structure upgrading generate significant negative indirect effects, thereby supporting H2. By contrast, technological innovation exhibits a positive indirect effect in the short term, suggesting that its carbon-reduction contribution may be constrained by time lags, adjustment costs, and the efficiency of innovation transformation. Therefore, H3 is partially supported. These findings imply that the environmental benefits of digital economy development depend not only on technological progress itself, but also on whether digitalization can promote low-carbon industrial restructuring and accelerate the conversion of innovation outcomes into green productivity.

5.5. Heterogeneity Analysis

To examine whether the carbon-reduction effect of the digital economy varies across urban contexts, this study conducts heterogeneity analyses from three dimensions: industrial legacy, initial technological innovation foundation, and initial population density. The results are reported in Table 10.

5.5.1. Heterogeneity by Old Industrial Base

The estimated effect of the digital economy differs significantly between old industrial base cities and non-old industrial base cities. In the old industrial base group, the coefficient of the Digital Economy Index is significantly negative (−1.2828, t = −3.2941). In contrast, the coefficient in the non-old industrial base group is smaller in magnitude and statistically insignificant (−0.2872, t = −1.5985). The between-group difference is statistically significant at the 5% level, with a p-value of 0.014.
This result indicates that digital economy development generates a stronger marginal carbon-reduction effect in cities facing greater industrial transformation pressure. Old industrial base cities are generally characterized by a higher share of heavy industry, stronger dependence on energy-intensive sectors, and more pronounced carbon lock-in. These structural constraints create greater scope for efficiency improvement, factor reallocation, and industrial restructuring. Digital technologies may therefore reduce carbon emission intensity in such cities by improving energy-use efficiency, enhancing production coordination, and accelerating the transition from high-carbon production systems toward cleaner and more efficient industrial structures. The weaker effect in non-old industrial base cities does not imply that digitalization is less important; rather, it suggests that cities with lighter industrial structures may have smaller marginal adjustment space for carbon-intensity reduction.

5.5.2. Heterogeneity by Initial Technological Innovation Foundation

The carbon-reduction effect of the digital economy is also conditioned by cities’ initial technological innovation foundation. The coefficient of the Digital Economy Index is significantly negative in the low-foundation group (−1.2057, t = −3.8057), whereas the coefficient in the high-foundation group is smaller and statistically insignificant (−0.3088, t = −1.6284). The coefficient-difference test yields a p-value of 0.034, confirming significant heterogeneity between the two groups.
This finding suggests that digitalization produces larger marginal environmental benefits in cities with weaker initial innovation foundations. In such cities, digital technologies can reduce information frictions, enhance access to external knowledge, improve technology absorption capacity, and strengthen resource-allocation efficiency. These effects may facilitate technological catch-up and amplify the carbon-reduction effect of industrial restructuring. This result does not contradict the mediation analysis, which shows that technological innovation may involve short-term adjustment costs. Rather, it indicates that in low-foundation cities, the carbon-reduction effect of digitalization is more likely to operate through technology diffusion, efficiency improvement, and structural adjustment than through the immediate expansion of local innovation activities. In cities with stronger initial innovation capacity, the marginal contribution of additional digital development may be constrained by a higher pre-existing technological and efficiency frontier.

5.5.3. Heterogeneity by Initial Population Density

The effect of the digital economy further varies by initial population density. In the low-density group, the coefficient of the Digital Economy Index is significantly negative (−1.1795, t = −3.5408). In the high-density group, the coefficient is statistically insignificant (−0.2412, t = −0.9523). The between-group difference is significant, with a p-value of 0.026.
This result indicates that digital economy development has a stronger carbon-reduction effect in cities with greater spatial coordination constraints. Low-density cities often face higher costs in logistics organization, infrastructure utilization, public service provision, and environmental governance. These spatial frictions may intensify resource misallocation and increase carbon emission intensity. Digital technologies can mitigate such constraints by improving information connectivity, optimizing transport and energy management, and enhancing the precision of environmental monitoring and governance. By contrast, high-density cities may already benefit from agglomeration economies, infrastructure sharing, and more efficient service provision, which may reduce the marginal contribution of digitalization to further carbon-intensity reduction.
Overall, the heterogeneity results show that the carbon-reduction effect of the digital economy is not uniform across cities. Stronger effects are observed in cities with greater industrial restructuring pressure, weaker initial technological foundations, and more pronounced spatial coordination constraints. These findings should be interpreted as evidence of heterogeneous marginal effects rather than as a preference for less advanced urban conditions. The results indicate that digital economy development is particularly effective when it can relax structural constraints, promote factor reallocation, facilitate technology diffusion, and improve governance efficiency. For cities with more advanced industrial structures, stronger innovation capacity, and higher population density, the carbon-reduction potential of digitalization may depend more on its integration with green innovation, clean energy systems, and high-level industrial upgrading.

5.6. Spatial Spillover Effect Testing

5.6.1. Global Moran’s I Test

To examine the spatial autocorrelation of carbon emission intensity and digital economy development, this study calculates the Global Moran’s I for the period 2013–2022. The results are reported in Table 11.
Global Moran’s I values for carbon emission intensity are consistently positive and statistically significant at the 1% level, ranging from 0.1200 to 0.2066. This indicates a significant positive spatial autocorrelation in urban carbon emission intensity, suggesting that cities with similar emission intensity tend to be spatially clustered. Moreover, the increasing trend of the index implies that the spatial dependence of carbon emission intensity strengthened during the sample period.
Similarly, Global Moran’s I values for the Digital Economy Index are also positive and significant at the 1% level in all years, ranging from 0.2654 to 0.4404. This suggests that digital economy development also exhibits significant spatial clustering. Overall, these findings confirm the existence of spatial dependence in both carbon emission intensity and digital economy development, thereby supporting the necessity of employing a spatial econometric model.

5.6.2. Spatial Model Specification Tests

To determine the appropriate spatial econometric specification, this study conducts a series of diagnostic tests. As reported in Table 12, both the LM tests and their robust forms are statistically significant at the 1% level, rejecting the null hypothesis of no spatial dependence. This confirms the existence of spatial autocorrelation in the sample data.
The LR and Wald tests further reject the null hypotheses that the Spatial Durbin Model can be simplified into either the Spatial Lag Model or the Spatial Error Model. These results indicate that the Spatial Durbin Model is the preferred specification. In addition, the Hausman test is significant at the 1% level, supporting the use of fixed effects rather than random effects. The LR tests for individual and time effects also confirm the appropriateness of the two-way fixed-effect specification. Therefore, this study adopts the Spatial Durbin Model with both city and year fixed effects as the benchmark spatial econometric model.

5.6.3. Spatial Durbin Model Estimation Results

Table 13 reports the Spatial Durbin Model estimates and the corresponding effect decomposition. The coefficient of the Digital Economy Index in the main equation is significantly negative (−0.3573, p < 0.05), indicating that digital economy development reduces local urban carbon emission intensity. The spatial autoregressive coefficient is positive and significant (ρ = 0.4119, p < 0.01), confirming the presence of spatial dependence in urban carbon emission intensity and justifying the use of a spatial econometric specification.
The spatially lagged coefficient of the Digital Economy Index is significantly negative (−1.1621, p < 0.01), suggesting that digital economy development in neighboring cities contributes to local carbon-intensity reduction. The effect decomposition further supports this result. The direct, indirect, and total effects of the Digital Economy Index are −0.3850, −2.2103, and −2.5952, respectively. The direct effect is significant at the 5% level, while the indirect and total effects are significant at the 1% level. These results indicate that the carbon-reduction effect of the digital economy operates both locally and through spatial spillovers.
The magnitude of the indirect effect exceeds that of the direct effect, implying that intercity spillovers constitute an important channel through which digitalization contributes to carbon-intensity reduction. This finding is consistent with the theoretical mechanisms of technology diffusion, supply-chain coordination, and policy learning. Overall, the significantly negative spatially lagged coefficient and indirect effect under the geographical distance matrix indicate that digital economy development generates a significant negative geographical spillover effect on urban carbon emission intensity, thereby supporting H4a.

5.6.4. Additional Tests Based on Alternative Spatial Weight Matrices

To examine whether the estimated spatial effects depend on the specification of intercity linkages, this study further re-estimates the Spatial Durbin Model using two alternative spatial weight matrices: an economic distance matrix and a geo-economic matrix. Table 14 reports the estimates for the Digital Economy Index, with control variables, city fixed effects, and year fixed effects included but omitted for brevity.
The direct effects of the Digital Economy Index remain significantly negative across all three matrices, indicating that the local carbon-reduction effect of digital economy development is robust to alternative spatial-weight specifications. However, the indirect effects differ across matrices. Under the geographical distance matrix, the indirect effect is significantly negative, suggesting that digital economy development generates carbon-reduction spillovers among geographically proximate cities. This finding supports H4a and is consistent with the mechanisms of technology diffusion, supply-chain coordination, and policy learning.
By contrast, the economic distance matrix yields a significantly positive indirect effect, while the total effect is statistically insignificant. This result indicates that, among economically similar cities, digital economy development may be accompanied by competitive or siphon effects. Specifically, digitally advanced cities may absorb skilled labor, innovation resources, digital infrastructure investment, and high-value-added industries from economically connected cities, thereby weakening their low-carbon transition capacity and offsetting the diffusion benefits of digitalization. Under the geo-economic matrix, the indirect effect is negative but statistically insignificant, whereas the total effect remains significantly negative. This suggests that when geographical proximity and economic similarity are jointly considered, diffusion and siphon mechanisms may partially offset each other.
Overall, these additional tests show that the spatial environmental effect of the digital economy is conditional on the type of intercity linkage. The negative spillover effect is more pronounced under geographical proximity, whereas economic-linkage-based proximity may involve competitive or siphon mechanisms. These findings provide empirical support for H4a and H4b.

5.7. Discussion

The empirical findings provide consistent evidence that digital economy development significantly reduces urban carbon emission intensity. The negative effect remains robust across two-way fixed-effects estimation, endogeneity corrections, dynamic panel models, and alternative robustness checks, indicating that digitalization constitutes an important driver of urban low-carbon transition rather than a result of model specification or sample selection.
The mechanism analysis shows that industrial structure rationalization and upgrading are key channels through which the digital economy affects carbon emission intensity. Digitalization improves factor allocation efficiency and promotes the shift toward service-oriented and knowledge-intensive sectors, thereby weakening dependence on energy-intensive production. The relatively stronger role of industrial upgrading suggests that the carbon-reduction effect of the digital economy is closely associated with structural transformation rather than only within-sector efficiency improvement.
The results for technological innovation reveal a more complex mechanism. The positive short-term effect of innovation on carbon emission intensity suggests the existence of transitional adjustment costs, including R&D investment, equipment renewal, and the coexistence of old and new production systems. This finding supports the view that the environmental benefits of green innovation may exhibit temporal lag effects and depend on subsequent commercialization and large-scale diffusion.
The heterogeneity analysis indicates that the carbon-reduction effect of the digital economy varies across urban contexts. The effect is more pronounced in old industrial base cities, cities with weaker initial innovation capacity, and cities with lower initial population density. These results imply that digitalization generates greater marginal benefits where industrial restructuring pressure, technology catch-up potential, and coordination constraints are stronger.
The spatial econometric results further demonstrate that the digital economy produces significant regional spillover effects. The indirect effect exceeds the direct effect, suggesting that digitalization reduces carbon emission intensity not only through local channels but also through cross-city technology diffusion, supply-chain coordination, and policy learning. Therefore, regional coordination is essential for maximizing the low-carbon benefits of digital economy development.

6. Conclusions and Policy Implications

6.1. Conclusions

Using panel data from 288 prefecture-level and above cities in China from 2013 to 2022, this study examines the impact of digital economy development on urban carbon emission intensity. By combining two-way fixed effects models, endogeneity tests, robustness checks, mediation analysis, heterogeneity analysis, and spatial econometric models, this study identifies the direct effect, transmission mechanisms, heterogeneous patterns, and spatial spillover effects of the digital economy.
The empirical results support four main conclusions. Digital economy development significantly reduces urban carbon emission intensity. This conclusion remains valid after controlling for city and year fixed effects, adopting alternative variable measurements, excluding special samples, introducing lagged explanatory variables, changing fixed-effect structures, and applying multiple endogeneity-correction methods. These results indicate that digitalization is not only a driver of economic transformation but also an important factor in urban low-carbon development.
Industrial structure optimization is a key mechanism through which the digital economy reduces carbon emission intensity. Digital economy development improves industrial structure rationalization by reducing factor mismatch and promotes industrial structure upgrading by facilitating the transition toward service-oriented, knowledge-intensive, and low-carbon sectors. Both channels generate significant carbon-reduction effects. By contrast, technological innovation exhibits a short-term positive indirect effect, suggesting that innovation activities may involve adjustment costs, equipment renewal, and transitional energy consumption before long-term green benefits are fully realized.
The carbon-reduction effect of the digital economy differs across cities. The effect is stronger in old industrial base cities, cities with weaker initial innovation foundations, and cities with lower initial population density. These findings indicate that digitalization generates greater marginal benefits where industrial restructuring pressure, technology catch-up potential, and spatial coordination constraints are more pronounced. The heterogeneity results should therefore be interpreted as evidence of differentiated marginal effects rather than as a preference for less advanced urban conditions.
The spatial econometric results show that the digital economy also affects carbon emission intensity through intercity spillovers. Under geographical proximity, digital economy development generates negative spatial spillover effects through technology diffusion, supply-chain coordination, and policy learning. Additional tests based on alternative spatial weight matrices further suggest that economic-linkage-based spillovers may be more complex, as competitive or siphon effects may weaken or offset part of the carbon-reduction spillovers among economically connected cities.

6.2. Policy Implications

The findings provide several policy implications for integrating digital economy development with urban low-carbon transition.
Digital economy development should be incorporated into urban carbon-mitigation strategies. Local governments should strengthen digital infrastructure, industrial internet platforms, data-sharing systems, and digital public-service platforms, while avoiding inefficient and high-energy digital infrastructure expansion. The construction of data centers, communication networks, and computing facilities should be coordinated with renewable energy use, energy-efficiency standards, and green electricity procurement to prevent rebound effects.
Industrial structure optimization should be placed at the center of digitally enabled carbon reduction. Cities should use digital platforms, digital finance, and data-driven governance tools to improve factor allocation across industries and reduce mismatch between output structure and employment structure. At the same time, digital transformation should be directed toward the upgrading of traditional manufacturing, the development of producer services, and the expansion of high-value-added and low-carbon industries. Particular attention should be given to the integration of digital technologies with energy-intensive sectors, where carbon-reduction potential is substantial.
The role of technological innovation should be evaluated from a dynamic perspective. Since innovation may generate short-term adjustment costs, policy design should not focus only on increasing patent quantity or R&D expenditure. More emphasis should be placed on the commercialization, diffusion, and industrial application of green technologies. Governments should improve mechanisms for technology transfer, green finance, intellectual property protection, and demonstration projects, so that digital innovation can be converted more efficiently into green productivity.
Differentiated digital transformation policies should be adopted across city types. For old industrial base cities, digital technologies should be used to support industrial restructuring, energy-efficiency improvement, and the digital upgrading of traditional manufacturing. For cities with weaker innovation foundations, policy support should focus on technology diffusion, external knowledge absorption, and digital public platforms that reduce innovation barriers. For low-density cities, digital infrastructure and smart governance systems should be used to reduce spatial coordination costs in logistics, public services, energy management, and environmental supervision. For cities with stronger industrial and innovation foundations, policy emphasis should shift toward high-level digital-green integration, green innovation networks, and advanced low-carbon technology deployment.
Regional coordination is essential for maximizing the carbon-reduction effect of the digital economy. The significant geographical spillover effect indicates that digitalization can promote carbon reduction beyond local administrative boundaries. Therefore, urban agglomerations and metropolitan areas should establish cross-city mechanisms for digital infrastructure sharing, carbon data exchange, supply-chain carbon management, and coordinated environmental governance. At the same time, policymakers should recognize the possibility of siphon effects under economic linkages. Digitally advanced cities should be encouraged to share technology, platforms, standards, and governance experience with surrounding cities, rather than merely concentrating talent, capital, and innovation resources. A more balanced regional digital system is necessary to transform digitalization into a coordinated low-carbon transition pathway.

Author Contributions

Z.H. conceptualized the study, designed the research framework, and supervised the entire research process. Y.L. conducted the data curation, performed the formal analysis and empirical estimation, and drafted the original manuscript. The corresponding author revised the manuscript and handled the submission and review process. All authors have read and agreed to the published version of the manuscript.

Funding

This research was supported by the Hebei Provincial Social Science Foundation Project, grant number HB23YJ036.

Institutional Review Board Statement

Not applicable.

Informed Consent Statement

Not applicable.

Data Availability Statement

The datasets and computer programs used in this study are available from the corresponding author upon reasonable request.

Acknowledgments

We sincerely appreciate the hard work and valuable comments from the editorial team and anonymous reviewers. Any errors in this paper are entirely our responsibility.

Conflicts of Interest

The authors declare no conflicts of interest.

References

  1. Friedlingstein, P.; O’Sullivan, M.; Jones, M.W.; Andrew, R.M.; Hauck, J.; Landschützer, P.; Le Quéré, C.; Li, H.; Luijkx, I.T.; Olsen, A.; et al. Global Carbon Budget 2024. Earth Syst. Sci. Data 2025, 17, 965–1039. [Google Scholar] [CrossRef] [Scilit]
  2. GS(2016)1666; Standard Map of China. Ministry of Natural Resources of China: Beijing, China, 2016.
  3. Shan, Y.; Liu, J.; Liu, Z.; Shao, S.; Guan, D. An emissions-socioeconomic inventory of Chinese cities. Sci. Data 2019, 6, 190027. [Google Scholar] [CrossRef] [Scilit] [PubMed]
  4. Huo, D.; Huang, X.; Dou, X.; Ciais, P.; Li, Y.; Deng, Z.; Wang, Y.; Cui, D.; Benkhelifa, F.; Sun, T.; et al. Carbon Monitor Cities near-real-time daily estimates of CO2 emissions from 1500 cities worldwide. Sci. Data 2022, 9, 533. [Google Scholar] [CrossRef] [Scilit] [PubMed]
  5. Chen, J.; Gao, M.; Chen, S.; Liu, X.; Hou, W.; Song, M.; Li, D.; Fan, W. China’s city-level carbon emissions during 1992–2017 based on the inter-calibration of nighttime light data. Sci. Rep. 2021, 11, 3323. [Google Scholar] [CrossRef] [Scilit] [PubMed]
  6. Ribeiro, H.V.; Rybski, D.; Kropp, J.P. Effects of changing population or density on urban carbon dioxide emissions. Nat. Commun. 2019, 10, 3204. [Google Scholar] [CrossRef] [Scilit] [PubMed]
  7. Zheng, B.; Zhang, Q.; Davis, S.J.; Ciais, P.; Hong, C.; Li, M.; Liu, F.; Tong, D.; Li, H.; He, K. Infrastructure shapes differences in the carbon intensities of Chinese cities. Environ. Sci. Technol. 2018, 52, 6032–6041. [Google Scholar] [CrossRef] [Scilit] [PubMed]
  8. Zhang, F.; Deng, X.; Phillips, F.; Fang, C.; Wang, C. Impacts of industrial structure and technical progress on carbon emission intensity: Evidence from 281 cities in China. Technol. Forecast. Soc. Chang. 2020, 154, 119949. [Google Scholar] [CrossRef] [Scilit]
  9. Wang, H.; Zhang, R. Effects of environmental regulation on CO2 emissions: An empirical analysis of 282 cities in China. Sustain. Prod. Consum. 2022, 29, 259–272. [Google Scholar] [CrossRef] [Scilit]
  10. Shan, Y.; Guan, Y.; Hang, Y.; Zheng, H.; Li, Y.; Guan, D.; Li, J.; Zhou, Y.; Li, L.; Hubacek, K. City-level emission peak and drivers in China. Sci. Bull. 2022, 67, 1910–1920. [Google Scholar] [CrossRef] [Scilit] [PubMed]
  11. Zhang, W.; Liu, X.; Wang, D.; Zhou, J. Digital economy and carbon emission performance: Evidence at China’s city level. Energy Policy 2022, 165, 112927. [Google Scholar] [CrossRef] [Scilit]
  12. Li, Z.; Wang, J. The dynamic impact of digital economy on carbon emission reduction: Evidence city-level empirical data in China. J. Clean. Prod. 2022, 351, 131570. [Google Scholar] [CrossRef] [Scilit]
  13. Zhou, X.; Zhou, D.; Zhao, Z.; Wang, Q. A framework to analyze carbon impacts of digital economy: The case of China. Sustain. Prod. Consum. 2022, 31, 357–369. [Google Scholar] [CrossRef] [Scilit]
  14. Yi, M.; Liu, Y.; Sheng, M.S.; Wen, L. Effects of digital economy on carbon emission reduction: New evidence from China. Energy Policy 2022, 171, 113271. [Google Scholar] [CrossRef] [Scilit]
  15. Bai, L.; Guo, T.; Xu, W.; Liu, Y.; Kuang, M.; Jiang, L. Effects of digital economy on carbon emission intensity in Chinese cities: A life-cycle theory and the application of non-linear spatial panel smooth transition threshold model. Energy Policy 2023, 183, 113792. [Google Scholar] [CrossRef] [Scilit]
  16. Ren, S.; Hao, Y.; Xu, L.; Wu, H.; Ba, N. Digitalization and energy: How does internet development affect China’s energy consumption? Energy Econ. 2021, 98, 105220. [Google Scholar] [CrossRef] [Scilit]
  17. Lange, S.; Pohl, J.; Santarius, T. Digitalization and energy consumption. Does ICT reduce energy demand? Ecol. Econ. 2020, 176, 106760. [Google Scholar] [CrossRef] [Scilit]
  18. Jin, X.; Yu, W. Information and communication technology and carbon emissions in China: The rebound effect of energy intensive industry. Sustain. Prod. Consum. 2022, 32, 731–742. [Google Scholar] [CrossRef] [Scilit]
  19. Bai, T.; Qi, Y.; Li, Z.; Xu, D. Digital economy, industrial transformation and upgrading, and spatial transfer of carbon emissions: The paths for low-carbon transformation of Chinese cities. J. Environ. Manag. 2023, 344, 118528. [Google Scholar] [CrossRef] [Scilit] [PubMed]
  20. Chang, H.; Ding, Q.; Zhao, W.; Hou, N.; Liu, W. The digital economy, industrial structure upgrading, and carbon emission intensity: Empirical evidence from China’s provinces. Energy Strategy Rev. 2023, 50, 101218. [Google Scholar] [CrossRef] [Scilit]
  21. Acemoglu, D.; Aghion, P.; Bursztyn, L.; Hemous, D. The environment and directed technical change. Am. Econ. Rev. 2012, 102, 131–166. [Google Scholar] [CrossRef] [Scilit] [PubMed]
  22. Du, K.; Li, P.; Yan, Z. Do green technology innovations contribute to carbon dioxide emission reduction? Empirical evidence from patent data. Technol. Forecast. Soc. Chang. 2019, 146, 297–303. [Google Scholar] [CrossRef] [Scilit]
  23. Gillingham, K.; Rapson, D.; Wagner, G. The rebound effect and energy efficiency policy. Rev. Environ. Econ. Policy 2016, 10, 68–88. [Google Scholar] [CrossRef] [Scilit]
  24. Sorrell, S. Jevons’ paradox revisited: The evidence for backfire from improved energy efficiency. Energy Policy 2009, 37, 1456–1469. [Google Scholar] [CrossRef] [Scilit]
  25. LeSage, J.; Pace, R.K. Introduction to Spatial Econometrics; Chapman and Hall/CRC: Boca Raton, FL, USA, 2009. [Google Scholar] [CrossRef] [Scilit]
  26. Anselin, L.; Bera, A.K.; Florax, R.; Yoon, M.J. Simple diagnostic tests for spatial dependence. Reg. Sci. Urban Econ. 1996, 26, 77–104. [Google Scholar] [CrossRef] [Scilit]
  27. Jaffe, A.B.; Trajtenberg, M.; Henderson, R. Geographic localization of knowledge spillovers as evidenced by patent citations. Q. J. Econ. 1993, 108, 577–598. [Google Scholar] [CrossRef] [Scilit]
  28. Niu, X.; Ma, Z.; Ma, W.; Yang, J.; Mao, T. The spatial spillover effects and equity of carbon emissions of digital economy in China. J. Clean. Prod. 2024, 434, 139885. [Google Scholar] [CrossRef] [Scilit]
  29. Wang, J.; Dong, K.; Dong, X.; Taghizadeh-Hesary, F. Assessing the digital economy and its carbon-mitigation effects: The case of China. Energy Econ. 2022, 113, 106198. [Google Scholar] [CrossRef] [Scilit]
  30. Xu, C.; Zhao, W.; Li, X.; Cheng, B.; Zhang, M. Quality of life and carbon emissions reduction: Does digital economy play an influential role? Clim. Policy 2024, 24, 346–361. [Google Scholar] [CrossRef] [Scilit]
  31. Ma, Y.; Li, R. The impact of digital economy on carbon emissions: Insights from the G-20 energy transition and environmental governance. Energy Strategy Rev. 2025, 57, 101612. [Google Scholar] [CrossRef] [Scilit]
  32. Zhu, Y.; Lan, M. Digital economy and carbon rebound effect: Evidence from Chinese cities. Energy Econ. 2023, 126, 106957. [Google Scholar] [CrossRef] [Scilit]
  33. Tan, L.; Yang, Z.; Irfan, M.; Ding, C.J.; Hu, M.; Hu, J. Toward low-carbon sustainable development: Exploring the impact of digital economy development and industrial restructuring. Bus. Strategy Environ. 2024, 33, 2159–2172. [Google Scholar] [CrossRef] [Scilit]
  34. Meng, X.; Xu, S.; Zhang, J. How does industrial intelligence affect carbon intensity in China? Empirical analysis based on Chinese provincial panel data. J. Clean. Prod. 2022, 376, 134273. [Google Scholar] [CrossRef] [Scilit]
  35. Yi, J.; Shiji, L.; Ren, M.; Yang, X.; Dhar, B. Green innovation, ESG governance, and digital transformation: Evidence from China’s high-end manufacturing sector. Acon. Copernic. 2025, 16, 977–1020. [Google Scholar]
  36. Chu, C.-C.; Narayan, P.K.; Ji, Y. Technology innovation, digital finance and renewable energy consumption: Evidence from China. Energy Econ. 2025, 150, 108762. [Google Scholar] [CrossRef] [Scilit]
  37. Dong, X.; Lv, S.; Wu, S. The green promise of digital finance: Exploring its effects and mechanisms on carbon reduction. China Econ. Rev. 2025, 90, 102374. [Google Scholar] [CrossRef] [Scilit]
  38. Song, H.; Chen, W. A digital blueprint for sustainability: Can digital infrastructure policies promote renewable energy innovation? Renew. Energy 2025, 244, 122727. [Google Scholar] [CrossRef] [Scilit]
  39. Balland, P.A.; Jara-Figueroa, C.; Petralia, S.G.; Steijn, M.P.A.; Rigby, D.L.; Hidalgo, C.A. Complex economic activities concentrate in large cities. Nat. Hum. Behav. 2020, 4, 248–254. [Google Scholar] [CrossRef] [Scilit] [PubMed]
  40. GS(2019)1818; Standard Map of China. Ministry of Natural Resources of China: Beijing, China, 2019.
  41. Levinson, A.; Taylor, M.S. Unmasking the pollution haven effect. Int. Econ. Rev. 2008, 49, 223–254. [Google Scholar] [CrossRef] [Scilit]
  42. Li, J.; Chen, L.; Chen, Y.; He, J. Digital economy, technological innovation, and green economic efficiency—Empirical evidence from 277 cities in China. Manag. Decis. Econ. 2022, 43, 616–629. [Google Scholar] [CrossRef] [Scilit]
Figure 1. Global Distribution of The Top Ten Carbon-Emitting Countries in 2024. Notes: Grey areas indicate countries outside the top ten emitters. Data source: Global Carbon Project, Global Carbon Budget 2024. Standard map GS(2016)1666 approved by the Ministry of Natural Resources of China [2].
Sustainability 18 06726 g001
Figure 2. Trends of Digital Economy Index and Carbon Emission Intensity in China (2013–2022).
Sustainability 18 06726 g002
Figure 3. The Impact of the Digital Economy on Carbon Emission Intensity: Core Mechanism Pathways.Notes: The black arrows represent the transmission pathways, and the red dashed boxes indicate potential negative effects.
Sustainability 18 06726 g003
Figure 4. Spatial Distribution of Urban Carbon Emission Intensity, 2013–2022. Notes: The base map was prepared using the standard map with approval number GS(2019)1818, obtained from Tianditu, with no modification to the base map [40]. The figure shows carbon emission intensity for cities with available data in 2013, 2016, 2019, and 2022, with 288, 288, 296, and 297 cities included, respectively. Grey areas indicate regions without available data.
Sustainability 18 06726 g004
Table 1. Digital economy index measurement system.
Primary IndicatorSecondary IndicatorTertiary Indicator & UnitEconomic MeaningDirectionAverage Weight
Digital Economy Index (DEI)Digital InfrastructureNumber of internet users (households)Reflects the absolute scale of internet access and the basic capacity of urban digital connectivity.+0.0853
Year-end mobile phone users (10,000 households)Reflects the scale of mobile communication users and the breadth of mobile digital access.+0.0802
Internet users per 100 people (persons)Captures the penetration intensity of internet access relative to the urban population.+0.0489
Mobile phone users per 100 people (persons)Captures the penetration intensity of mobile communication services relative to the urban population.+0.0622
Digital ApplicationDigital inclusive finance indexMeasures the development level of digital financial services, including coverage, depth of use, and digitalization.+0.0147
Per-capita telecom business volume (10,000 CNY/person)Reflects the intensity of digital service use and the demand for telecom-based digital applications.+0.0925
Industry DigitalizationEmployees in IT, computer services & software (10,000 persons)Measures the employment scale of digital-related industries and the human-resource base of digital industrialization.+0.3282
Total telecom business volume (10,000 CNY)Reflects the overall market scale of telecom and digital services in the city.+0.1307
Share of IT, computer services & software employees (%)Captures the relative importance of digital-related employment in the urban labor structure.+0.0612
Industrial Digital TransformationDigital inclusive finance coverage per 10,000 employeesReflects the penetration of digital finance in production activities and its support for enterprise digital transformation.+0.0536
Telecom service density per employee (10,000 CNY/10,000 persons)Measures the intensity of telecom and digital-service support for labor input and industrial production.+0.0425
Table 2. Descriptive statistics.
VarNameOBSMEANSDP1MedianP95
Carbon Emission (CE)28801.72171.61570.04831.195715.3378
Digital Economy Index (DEI)28802.17640.56910.87772.21863.6107
land area (LA)28801.65622.14330.12011.223226.1570
Economic growth rate (EGR)28806.71223.32196−4.90007.300015.1000
Economic development level (EDL)28805.96653.46611.47465.010118.0816
Fiscal expenditure (FE)28800.21010.10540.04390.18140.9155
Technology expenditure (TE)28800.03020.02990.00130.02150.6310
Table 3. Baseline Regression Results at the City Level.
VarName(1)(2)
CECE
DEI−1.4029 ***−0.7628 ***
(−6.8772)(−3.6747)
LA −0.4038 ***
(−4.4782)
EGR −0.0137 **
(−2.4600)
EDL −0.0702 ***
(−3.8211)
FE 2.7170 ***
(7.9838)
TE 0.3503
(0.4023)
Constant4.7749 ***3.9820 ***
(10.7295)(8.6580)
N28802880
R20.95060.9583
City FEYESYES
Year FEYESYES
Note: ***, **, and * denote significance at the 1%, 5%, and 10% levels respectively; t-statistics are in parentheses. The same applies to all subsequent tables.
Table 4. Instrumental variable (2SLS) regression results.
Variable(1) 1st: HZ(2) 2nd: HZ(3) 1st: Node(4) 2nd: Node(5) Over-ID
DEI −0.7773 * −0.4749−0.7576
(−1.7367) (−0.3740)(−1.6131)
First stage (DV = DEI)
Distance to Hangzhou × trend−0.0469 *** Yes
(−16.5101)
Distance to backbone node × trend −0.0205 *** Yes
(−5.8015)
Kleibergen–Paap rk Wald F272.58272.5833.6633.66138.82
Hansen J test (p-value)————0.758
Controls (EDL, EGR)YESYESYESYESYES
City/Year FEYESYESYESYESYES
N28802880287028702870
Notes: The instruments are a city’s standardized distance to Hangzhou/to the nearest backbone-network node, each interacted with the national level of digital economy development. Columns (1) and (3) report first stages (DV = DEI); columns (2), (4) and (5) report second stages (DV = carbon emission intensity, CE). Column (5) includes both instruments. t-statistics in parentheses.
Table 5. System GMM dynamic panel estimation results.
VariableSystem GMM (CE)
L.CE1.0867 ***
(11.9582)
DEI−0.0922 **
(−2.4508)
AR(1) test (p-value)0.001
AR(2) test (p-value)0.270
Hansen test (p-value)0.310
Control variablesYES
N2592
Table 6. Endogeneity Test Results.
VariableHeteroskedasticity in Explanatory VariableSmart City DiD
DEI−0.1414 ***
(−4.5963)
Treat × Post −0.1230 *
(−1.8201)
LA−0.3566 ***−0.3948 ***
(−3.6132)(−4.4045)
EGR−0.0063 *−0.0124 **
(−1.8453)(−2.3475)
EDL−0.1174 ***−0.0783 ***
(−9.3451)(−3.9410)
FE1.9900 ***2.8873 ***
(7.1313)(7.8542)
TE0.65840.0614
(0.6246)(0.0712)
N25892878
R20.23680.9578
Table 7. Robustness checks result.
VariableReplace Dependent VariableLagged Explanatory VariableExclude MunicipalitiesExclude Special YearsReplace Fixed Effects Level
(1)(2)(3)(4)(5)
Per Capita CECECECECE
DEI−1.0136 *** −0.8335 ***−0.8709 ***−1.3876 ***
(−3.7276) (−3.9310)(−2.9074)(−3.7484)
L.DEI −1.1796 ***
(−3.5866)
Control VariablesYESYESYESYESYES
Constant3.8235 ***5.2442 ***4.1522 ***3.7934 ***5.9039 ***
(5.7935)(7.5336)(8.8975)(6.4453)(7.9615)
N28802592283820142016
R20.95100.31480.95850.96970.3148
City FEYESYESYESYESYES
Year FEYESYESYESYESYES
Table 8. Mediation effect test results.
VariableRLCEHLCETICE
(1)(2)(3)(4)(5)(6)
DEI−0.2530 ***−0.7152 ***0.4228 ***−0.6762 ***4.3666 ***−0.9143 ***
(−5.9388)(−3.4839)(5.6798)(−3.3270)(8.0411)(−4.3102)
RL 0.1882 ***
(3.0255)
HL −0.2049 ***
(−4.9141)
TI 0.0347 ***
(3.6600)
Controls−0.0599 ***−0.3926 ***0.0054−0.4027 ***0.3918 ***−0.4174 ***
City FE(−2.9268)(−4.3960)(0.1343)(−4.4537)(4.4910)(−4.5669)
Year FE−0.0010−0.0135 **0.0004−0.0136 **−0.0051−0.0135 **
N(−1.6132)(−2.4531)(0.3559)(−2.4714)(−1.4892)(−2.4460)
R2−0.0057 **−0.0691 ***−0.0022−0.0706 ***−0.0706−0.0677 ***
Notes: RL is measured by the Theil index. A smaller value of RL indicates a more rational industrial structure.
Table 9. Bootstrap mediation effect test results.
MediatorEffectCoefficientStd. Err.zp95%
RLIndirect−0.0476 ***0.0175−2.7140.007[−0.082, −0.013]
Direct−0.7152 ***0.1928−3.709<0.001[−1.093, −0.337]
HLIndirect−0.0866 ***0.0218−3.965<0.001[−0.134, −0.048]
Direct−0.6762 ***0.1937−3.490<0.001[−1.047, −0.294]
TIIndirect0.1515 ***0.03084.920<0.001[0.091, 0.212]
Direct−0.9143 ***0.1975−4.629<0.001[−1.301, −0.527]
Table 10. Heterogeneity analysis results.
VariableOld Industrial Base StatusInitial Technological Innovation FoundationInitial Population Density
Old Industrial BaseNon-Old Industrial BaseLow FoundationHigh FoundationLow DensityHigh Density
CECECECECECE
DEI−1.2828 ***−0.2872−1.2057 ***−0.3088−1.1795 ***−0.2412
(−3.2941)(−1.5985)(−3.8057)(−1.6284)(−3.5408)(−0.9523)
LA−3.4429 ***−0.3540 ***−0.3702 ***−1.4312 ***−0.3559 ***−1.2252 ***
(−3.5331)(−3.8010)(−3.8038)(−3.0079)(−3.7125)(−3.0097)
EGR−0.0214 ***−0.0094−0.0171 ***−0.0073−0.0167 ***−0.0089
(−4.7319)(−1.6163)(−4.4136)(−1.2372)(−4.7096)(−1.3230)
EDL−0.2195 ***−0.0439 ***−0.2176 ***−0.0295 ***−0.1789 ***−0.0246 ***
(−7.6946)(−3.4800)(−9.8197)(−3.1861)(−11.2647)(−2.6630)
FE2.8160 ***1.9935 ***1.7394 ***3.5330 ***1.9184 ***3.1481 ***
(5.8500)(5.7352)(5.3180)(6.9443)(6.2166)(5.5773)
TE−1.85330.82120.6852−0.5498−0.39851.9143
(−1.5131)(0.8347)(0.5968)(−1.1417)(−1.2666)(1.3595)
Constant10.8637 ***2.5967 ***5.9836 ***3.5427 ***5.7945 ***2.8715 ***
(6.0013)(6.3737)(8.2761)(4.9586)(7.3445)(4.2062)
Difference test p-value0.0140.0340.026
N94019201440144014301430
R20.96350.95770.95800.96480.96240.9593
City FEYESYESYESYESYESYES
Year FEYESYESYESYESYESYES
Notes: Cities are classified into low- and high-foundation groups according to their technological innovation levels in 2013, and into low- and high-density groups according to their population density in 2013.
Table 11. Global Moran‘s I test results.
YearCEDEI
IZp-ValueIZp-Value
20130.12617.17100.00000.310917.20400.0000
20140.12066.86470.00000.265414.71020.0000
20150.12006.86490.00000.295016.33050.0000
20160.12587.24600.00000.283915.72660.0000
20170.15168.59050.00000.314217.40900.0000
20180.16399.23080.00000.367020.29960.0000
20190.194510.91360.00000.389721.51510.0000
20200.204711.46910.00000.406622.44030.0000
20210.206611.58060.00000.428423.63970.0000
20220.204511.46410.00000.440424.28080.0000
Table 12. Spatial model specification tests results.
TestStatisticp
LM_Lag test2598.9290.000
Robust LM_Lag test88.8320.000
LM_Err test2584.1690.000
Robust LM_Err test74.0720.000
LR test spatial lag209.420.000
LR test spatial error155.190.000
Wald test spatial lag217.690.000
Wald test spatial error158.180.000
Hausman test38.280.000
LR ind both66.280.000
LR time both8810.610.000
Table 13. Empirical results of Spatial Durbin model estimation.
VariableMain EffectSpatial EffectDirect EffectIndirect EffectTotal Effect
DEI−0.3573 **−1.1621 ***−0.3850 **−2.2103 ***−2.5952 ***
(−2.4096)(−3.7743)(−2.5697)(−4.5718)(−5.6466)
LA−0.5343 ***5.5608 ***−0.4023 ***8.9817 ***8.5794 ***
(−7.8169)(13.5687)(−5.9833)(10.0679)(9.4396)
EGR−0.0119 ***−0.0139 **−0.0122 ***−0.0310 ***−0.0431 ***
(−5.8758)(−2.5703)(−6.2742)(−3.4814)(−4.7148)
EDL−0.0778 ***0.0800 ***−0.0767 ***0.0815 ***0.0048
(−11.0405)(4.9995)(−11.4105)(3.3030)(0.2095)
FE1.9148 ***1.2099 **1.9657 ***3.3103 ***5.2760 ***
(9.0417)(2.0048)(9.6971)(3.8947)(6.4376)
TE0.4819−0.66710.4905−0.6125−0.1220
(1.4267)(−0.5715)(1.4572)(−0.2965)(−0.0570)
ρ0.4119 ***
(9.1300)
sigma2_e0.0960 ***
(37.7856)
N2880
R20.2372
Number of pro288
Table 14. Spatial Effect Estimates under Alternative Spatial Weight Matrices.
Spatial Weight MatrixMain EffectWx EffectDirect EffectIndirect EffectTotal Effect
Geographical distance matrix−0.3573 **−1.1621 ***−0.3850 **−2.2103 ***−2.5952 ***
(−2.4096)(−3.7743)(−2.5697)(−4.5718)(−5.6466)
Economic distance matrix−0.8158 ***1.2868 ***−0.7935 ***1.3222 ***0.5287
(−6.6980)(4.2487)(−6.3255)(3.8014)(1.3770)
Geo-economic matrix−0.7635 ***0.0623−0.7650 ***−0.1718−0.9368 ***
(−5.5849)(0.2629)(−5.5488)(−0.5826)(−3.1068)
Disclaimer/Publisher’s Note: The statements, opinions and data contained in all publications are solely those of the individual author(s) and contributor(s) and not of MDPI and/or the editor(s). MDPI and/or the editor(s) disclaim responsibility for any injury to people or property resulting from any ideas, methods, instructions or products referred to in the content.