Article

Can Supply Chain Digitalization Foster Green Innovation in Kuwait? A Quantile-on-Quantile Analysis

Department of Business Administration, Institute of Graduate Research and Studies, University of Mediterranean Karpasia, Mersin 33010, Turkey
*
Author to whom correspondence should be addressed.
Sustainability 2026, 18(14), 7309; https://doi.org/10.3390/su18147309
Submission received: 1 June 2026 / Revised: 23 June 2026 / Accepted: 26 June 2026 / Published: 17 July 2026

Abstract

To solve ecological challenges, green innovation plays a crucial role. As a result, this study examines the impact of supply chain digitalization (SCD), carbon dioxide emissions (CO2), and financial globalization (FIG) on green innovation (GINV) in Kuwait from 2000Q1 to 2022Q4 using the Multiple Quantile-on-Quantile (MQQ), Quantile-on-Quantile Regression (QQ), and Wavelet Quantile Regression (WQR) non-parametric techniques. The variables, methods, and country examined in this research contribute to the existing literature. More specifically, Kuwait has been underexplored in existing studies. In addition, the study is motivated by Kuwait’s growing commitment to economic diversification, digital transformation, and sustainable development. Thus, the results are as follows: Firstly, the MQQ outcome confirms that the combination of SCD, CO2, and FIG can drive GINV. The strength of this relationship is pronounced in the upper quantiles. Secondly, the QQ result shows that SCD, CO2, and FIG diminish GINV at the lower and middle quantiles. However, at the upper quantiles, a positive relationship is ascertained. Lastly, the WQR confirms that SCD has a negative association with GINV in the short term. However, in the medium and long term, across all quantiles, the relationship is predominantly positive. CO2 drives GINV significantly in the medium term, while FIG shows evidence of an asymmetric connection in the medium and long term. The findings suggest that policymakers in Kuwait should promote targeted incentives and digital infrastructure development to support SCD as a driver of green innovation.

1. Introduction

Over the past few decades, many nations have seen rapid economic progress and industrialization; nonetheless, widespread diminishing resources have resulted in ecological risks and climate change. These problems force decision-makers to create long-term, positive responses to tackle these challenges. Green technologies are now regarded as key instruments for cutting carbon emissions (CO2) by as much as 60% [1,2].
According to Fernando et al. [3], companies are becoming more interested in strategies like eco-innovation as a result of stakeholders’ increased knowledge of ecological issues. Thus, achieving long-term ecological equilibrium and sustainability requires green innovation (GINV) [4]. The creation of technologies and procedures that save resources, reduce energy use, and stop damage to the environment is referred to as “GINV” [3,5]. The ultimate goal is to create sustainable innovation through decreasing ecological damage [6]. By lowering the proportion of fossils and increasing the proportion of environmentally conscious resources and consumption, GINV encompasses production, management, and distribution in an approach that supports a green environment [7,8].
According to [9], GINV, which includes the creation and use of eco-friendly goods, procedures, and technology, has become a vital tactic for businesses trying to meet the growing demand for ecological sustainability. The organization’s commitment to achieving environmental and economic harmony is influenced by several internal and external variables [10]. The firm’s strengths, resources, and strategic stance are frequently a reflection of internal drivers. R&D expenditures, staff expertise, and senior management’s dedication to sustainability are internal drivers of GINV [11]. Additionally, a company’s capacity to implement green practices can be greatly influenced by its corporate culture and structure. In the meantime, external factors, including market demand, the dynamics of competition, and regulatory demands, come from the broader business landscape. Stricter ecological laws may compel businesses to employ greener technology and procedures [12]. Market motivations for GINV are created by rising customer knowledge and demand for eco-friendly products [13,14]. Additionally, organizations may be encouraged by fierce competition to set themselves apart with sustainable processes and green services.
Supply chain digitalization (SCD) can also be one of the drivers of GINV. SCD transforms and optimizes conventional supply chains by utilizing cutting-edge digital technologies like blockchain, IoT, big data, and AI [15,16,17,18]. In addition to improving responsiveness and transparency, this process optimizes resource allocation and lowers operating expenses [19]. Yue [10] argued that numerous possible advantages of the digital shift for businesses include increased productivity through automated processes, which results in reduced expenses and quicker response times. For instance, robots can reduce labor expenses while increasing production [20,21].
Additionally, SCD enhances supply chain activity visibility by enabling real-time data dissemination and tracking. Businesses can promptly recognize and resolve problems that might occur, such as delays or poor quality. Additionally, it improves agility by enabling quicker reactions to shifts in demand and interruptions in the supply chain. Digital technology enables businesses to swiftly modify their manufacturing and dissemination plans in response to unanticipated occurrences such as natural disasters or geopolitical uncertainty [22,23]. By boosting cooperation and interaction among supply chain participants, SCD also enhances teamwork. Digital platforms improve supply chain performance and collaboration by facilitating information exchange and collaborative decision-making [24]. Lastly, it encourages sustainability by cutting emissions, minimizing waste, and making the best use of available resources.
Financial globalization (FIG) and CO2 can also play a vital role in determining the level of GINV. Innovation, access to technology, and communication have all been enhanced as a result of globalization [25]. It has accelerated economic growth and created several new development possibilities, which have been crucial in bringing individuals from different cultural heritages together. Globalization has caused a number of problems, the most significant of which is environmental [26]. Yuan et al. [27] stated that due to the asymmetry of information brought on by undeveloped technology, GINV ventures are extremely risky and have a hard time getting loans. However, the quick growth of financial technology over the last 20 years has increased the effectiveness of financial intermediaries’ allocation of resources while also opening up new avenues for GINV. Additionally, financial intermediaries are better equipped to weed out “dyed green,” “fake green,” or low-quality GINV initiatives and give greater financing to high-quality GINV initiatives. On the other hand, rising emissions can enable and put pressure on entrepreneurs and businesses to innovate in order to solve the prevailing ecological problems.
Thus, this research examines the impact of SCD, CO2, and FIG on GINV in Kuwait from 2000Q1 to 2022Q4 using the MQQ, QQ, and WQR methods. Kuwait’s economy is rooted in fossil fuels and is one of the major oil exporters in the world, characterized as a high-energy user [28,29]. Kuwait confronts a structural limitation as global climate obligations under agreements like the Paris Agreement increase pressure to cut emissions: economic expansion is still strongly linked to carbon-intensive activities [30]. As a result, the country has increasingly emphasized economic diversification, digital transformation, and sustainable development through national development strategies, such as Kuwait 2035. These initiatives drive technological modernization, private sector competitiveness, and ecological sustainability. Despite these efforts, the adoption of GINV remains relatively challenging due to the country’s dependence on traditional energy-intensive industries and the evolving nature of its sustainability framework. In this regard, understanding whether SCD can facilitate GINV is particularly important to policymakers and business leaders seeking to balance growth and ecological objectives.
Therefore, the contribution of this research is as follows: (1) It advances existing research by going past theoretical and normative assessments to evaluate the impact of SCD on GINV empirically. It is important to state that there is still a lack of research in the literature regarding the impact of SCD on GINV. According to Schiederig et al. [6], GINV refers to the actions taken by businesses in product design, manufacturing procedures, and management models to attain both economic and ecological advantages. It helps reduce pollution, preserve resources, and enhance brand image and market competitiveness [31]. Thus, it is useful from a theoretical and practical standpoint to investigate how SCD affects GINV. (2) Other studies have focused on how GINV impacts CO2 [32,33] while neglecting the impact of CO2 on GINV. (3) The literature on the impact of FIG on GINV is also scant, which requires further investigation. (4) Few studies have been able to combine these variables in a single study. The combination of these variables is important for Kuwait because the country faces a dual challenge of maintaining economic expansion while reducing ecological degradation. SCD and FIG have the capacity to provide technological and financial opportunities for sustainability, while CO2 represents the ecological pressure driving this transformation. This research thus provides relevant policy recommendations for achieving sustainable development and promoting a greater economy in Kuwait. (5) It is observed that diverse studies have focused on advanced economies such as China [34,35], while case studies on the GCC countries have been neglected. (6) Non-parametric methods such as MQQ, QQ, and WQR are employed in this research, which are more robust than parametric techniques. In addition, as a robustness check, this research employed the WQC approach.
Based on these gaps, the following research questions are stated:
  • What is the impact of SCD on GINV?
  • What is the impact of CO2 on GINV?
  • What is the impact of FIG on GINV?
The remainder of the paper is structured as follows: The next section reviews the relevant literature and identifies key gaps, positioning the research within existing debates. This is followed by the methodology section, which explains the data, variables, and empirical approach used to address the research objectives. The subsequent section presents and discusses the empirical results. Lastly, the paper concludes by summarizing the findings, recommending policies, and suggesting areas for future research.

2. Literature Review

2.1. Supply Chain Digitalization and Green Innovation

An et al. [4] established that the amount and quality of enterprise GINV are greatly increased by SCD, with a greater influence on quality. Secondly, the association between SCD and the amount and quality of corporate GINV is somewhat mediated by supply chain financing capability and firm awareness of the environment. Among Chinese firms, Ma et al. [35] found the following: (1) SCD improves organizational GINV, with strong outcomes in a number of experiments. (2) Better internal SCM efficiency and increased SCI—more from supplier concentration than customer concentration—are the primary causes of the effect. (3) The Quality—first Effect, Crowding-in Effect, and Persistence Effect are the three features of the impact. In particular, SCD has a beneficial impact on sustained GINV and primarily increases high-quality GINV patent applications without displacing other non-GINV. Yue [10] argued that SCD encourages greener behaviors and increases transparency, which both directly and indirectly foster GINV. Jiang et al. [36] also ascertained that SCD positively contributes to GINV and increases the performance of the organization. According to mechanism analysis, SCD encourages tactical GINV by increasing supply chain nodes’ management effectiveness and substantive GINV by enhancing the ESG performance of businesses. According to heterogeneity analysis, high-tech companies, those with a strong level of internal control, and those with few financial limitations benefit more from SCD’s promotion of GINV [37]. Qiu et al. [38] established that SCD increases the quantity, quality, and sustainability of green technological innovation, which further encourages regional green consumption; from the standpoint of management innovation, SCD further stimulates the growth of regional green consumption by encouraging green management innovation. Shah et al. [39] confirmed that SCD is a crucial conduit for digital innovation’s contribution to GINV performance. Jie et al. [40] argued that corporate GINV is greatly enhanced by SCD, with a stronger impact on substantive innovation than on strategic innovation. Furthermore, heterogeneity develops based on firm size and ownership arrangement, with larger and state-owned businesses showing greater effects. Further research reveals that SCD fosters overall corporate GINV by strengthening carbon disclosure practices, which in turn fosters substantive GINV. Substantial innovation conduct is focused on advancing technology and preserving competitive advantage, while strategic innovation is typically focused on achieving other goals [41]. At the same time, it has also been ascertained that the association between SCD and GINV can be complex in the sense that the magnitude of the positive impact is moderated by firm-specific and environmental variables. For example, the promotion effect is more significant for high-tech firms, companies with high degrees of internal control, and those operating in regions with low SCD chains [37,42,43]. Additionally, top management’s environmental awareness is identified as a factor that can positively moderate the link between SCD and GINV firm performance [44]. The implication of this is that without an adequate level of internal control within the firm, and when top management officials lack ecological awareness, the level of GINV performance could be affected. Based on these discussions, the hypothesis is as follows:
H1. 
SCD can have a positive or negative impact on GINV.

2.2. CO2 and Green Innovation

Sarkodie and Owusu [45] discovered that in nations with high GHG emissions, green energy technologies are boosted by fossil fuels. This suggests that after attaining economic development, IEA member nations in a fossil fuel-based CO2 regime are more inclined to invest in and embrace green energy breakthroughs and pursue ecological sustainability. Increasing funding for energy research, development, and demonstration is essential for green energy technologies and makes the shift to clean energy and emission reduction easier. Using the DID technique, Yu et al. [46] confirmed that the CO2 trading policy encourages GINV among corporations that are regulated and is more prominent among government-owned companies. Additionally, through input-output linkages, this beneficial effect flows downstream in comparison to the regulated firms, but it decreases GINV for upstream firms. As a result, the price mechanism facilitates this kind of innovation spread. Based on GINV patent filings, Chen et al. [47] stated that ecological regulations of CO2 had a favorable impact on the cities’ green technology innovation, which is in line with the “Porter Hypothesis.” Using SEM with 3SLS for 71 countries, Thi and Do [48] confirmed that innovation and CO2 are correlated in both directions. In particular, innovation has a negative impact on emissions, whereas CO2 has a beneficial impact on innovation. Xiaobao et al. [49] opined that the CO2 trading pilot program greatly enhanced GINV collaboration between and within cities through the upgrading effect of industrial structure and the coverage effect of digital finance. Although the link between CO2 and GINV is primarily negative, some studies underscore that the impact of GINV policy is not uniform and it depends heavily on the specific regulatory channel, firm characteristics, and institutional quality [50,51,52,53]. This means that an inadequacy/weakness in any of these factors can impede GINV’s growth. In addition, it has been established that innovation helps reach the turning point where emissions decline [54,55,56]. This establishes the concept of the Environmental Kuznets Curve (EKC) hypothesis. Based on these viewpoints, the hypothesis is as follows.
H2. 
CO2 can have a positive or adverse effect on GINV.

2.3. Financial Globalization and Green Innovation

The empirical evidence regarding FIG and GINV is mixed, showing both constructive roles in technology transfer and capital access as well as complex non-linear or heterogeneous impacts that vary by economic progress level and threshold conditions. According to Abid et al. [7], to accomplish ecological targets, GINV and financial progress are essential. Using the CS-ARDL approach for BRICS economies, Qi and Yang [57] discovered that ESG factors stimulate GINV in the long term. More specifically, globalization plays a significant role in the progress of GINV. Based on a cross-country investigation, Yuan [58] examined how capital globalization influences GINV using the quantile regression method and found that OFDI and FDI have a positive effect on GINV in each of the eight nations. Additionally, the link between FDI and OFDI and green patents is found to be mediated by R&D investment, highlighting the importance of capital globalization in fostering GINV. Xuan et al. [59] stated that the globalization wave of the twenty-first century has strengthened the connection between countries and accelerated the flow of financial market risk to new levels. Therefore, if risks related to the financial market are prevented, GINV is encouraged, especially in the service sector, industries that are regulated, and companies that are state-owned. Wedajo et al. [60] argued that GINV is greatly boosted by being close to international banks, especially within a 10–20 km radius. Additionally, the association between ESG ratings and GINV is moderated by foreign bank expansion, with a greater impact seen in closer proximity. These findings demonstrate how international banks support green initiatives. One of the theoretical assertions that corroborates how FIG spurs GINV is the Pollution Halo Hypothesis, which posits that FIG facilitates the transfer of advanced, cleaner technologies from developed to developing economies. It argues that investment from abroad brings better ecological practices and greener standards, thereby stimulating local GINV through technology spillovers [58,60]. This is opposed to the Pollution Haven Hypothesis, which suggests that multinational corporations move their dirty industries to countries with weaker ecological regulations [58]. However, despite the beneficial impact of FIG on GINV, evidence suggests that the positive influence of international green finance on GINV is not linear; rather, it follows an inverted U-shaped path where the benefits diminish after reaching certain thresholds [61,62,63]. Furthermore, while FIG can reduce pollution, empirical investigations opined that the broader integration of the financial markets might not always align with uniform improvements in ecological innovation productivity [61,64]. Based on these findings, the proposed hypothesis is as follows:
H3. 
FIG may have a positive or negative association with GINV.
To summarize, the connection among SCD, CO2, FIG, and GINV has been scarcely investigated, especially for a country like Kuwait, which holds great potential for the GCC region to be a leader across various sustainability metrics. More specifically, the link between SCD and GINV has been largely investigated in China and other advanced economies, leaving a gap in research on the Kuwaiti economy. Secondly, it is also observed in the literature that methods such as DID, CS-ARDL, GMM, and SEM are used. This research improved on previous studies by using more advanced techniques such as QQ, WQR, and MQQ. In conclusion, although prior studies generally show a positive link between SCD and GINV, important gaps remain regarding the predominance of evidence from a limited set of countries and the applicability of these findings to GCC economies, such as Kuwait. Table 1 shows the summary of the investigated literature.

3. Theoretical Foundation, Data, and Methods

3.1. Theoretical Foundation

SCD is a significant driver of GINV with an emphasis on globalization and sustainability. The Resource-Based View (RBV) states that businesses can create a long-term competitive edge if they have special, valuable, and hard-to-replicate resources [51,52]. SCD can be seen as a key strategic tool that improves businesses’ capacity to effectively manage internal resources and adapt to external ecological issues. This is especially important when businesses are involved in GINV, as digital tools allow for improved optimization of resources and more effective procedures. SCD encourages innovation in shared models and process reengineering, as noted by Yuan et al. [65], which results in more efficient use of green R&D funds. As a result, it causes businesses to change their innovation models from conventional, non-green methods to clever, sustainable, and green ones. According to Teece et al. [66], based on the Dynamic Capability Theory (DCT), organizations’ capacity to integrate, create, and restructure internal and external competencies in response to quickly changing surroundings is essential for innovation. This capability is improved by the supply chain’s digital revolution, which makes cross-node integration easier. This integration facilitates the exchange of green information more easily and encourages cooperative ecological governance between downstream customers and upstream providers [67]. By guiding the supply chain toward green and more environmentally friendly practices, such methodical management enhances businesses’ capacity to react to green demands and regulatory challenges. However, there are many obstacles in the way of improving managerial effectiveness and SCI. Conventional supply chain nodes often encounter “information silos” as a result of poor information governance, which impedes SCI [68]. Additionally, this weakens supply chain responsiveness and coordination by causing buffers and anomalies in information transfer. Crucially, information isolation makes it more difficult for node businesses to keep an eye on unethical ecological actions that are motivated by self-interest [69]. Additionally, these obstacles increase production uncertainty and risk by preventing node firms from obtaining real-time data on market trends, inventories, and productivity progress. Therefore, the dynamics of this relationship show that SCD can drive or inhibit GINV, and the mathematical expression can be written as ( G I N V S C D > 0 ) or ( G I N V S C D < 0 ) .
Secondly, the association between CO2 and GINV is theoretically complex and may be positive or negative. The Porter hypothesis provides an important framework for understanding this relationship by suggesting that ecological challenges and regulatory pressures can stimulate innovation activities. According to Porter, firms facing increasing ecological pressures are encouraged to develop cleaner technologies, improve resource efficiency, and adopt ecologically sustainable production processes. In this context, rising CO2 may create incentives for firms and policymakers to invest in GINV as a means of reducing environmental impacts and complying with ecological regulations. Thus, CO2 can spur GINV ( G I N V C O 2 > 0 ) . However, an alternative perspective suggests that high CO2 may negatively affect GINV. Firms operating in a highly carbon-intensive environment may allocate substantial resources to maintain existing production systems, thereby limiting R&D investment activities. Also, compliance costs associated with ecological regulations may divert financial resources from GINV activities. As a result, CO2 can reduce GINV ( G I N V C O 2 < 0 ) .
Lastly, the link between FIG and GINV can be further explained by the Pollution Halo Hypothesis and Pollution Haven Hypothesis. The Pollution Halo Hypothesis argues that through increased cross-border capital flows, firms gain access to financial resources and technological knowledge that can support investments in ecologically sustainable innovations. Thus, FIG can drive GINV ( G I N V F I G > 0 ) . On the other hand, the Pollution Haven Hypothesis argues that multinational firms may relocate pollution-intensive activities to economies with weaker environmental laws, thereby reducing incentives to invest in cleaner technologies and ecologically sustainable innovations. In addition, increased capital mobility may also encourage firms to prioritize short-term financial returns over long-term environmental investments. From this perspective, FIG may weaken the incentives for GINV ( G I N V F I G < 0 ) .

3.2. Data

The data period of this research is from 2000Q1 to 2022Q4, based on the Kuwait economy. In addition, the data span is determined by data availability. The variables used in this research, presented in Table 2, include green innovation (GINV), supply chain digitalization (SCD), carbon dioxide emissions (CO2), and financial globalization (FIG). The SCD variable is employed in this research because SCD can spur GINV by encouraging cleaner production processes, eco-friendly product development, and sustainable operational practices. CO2 is included in the model because rising CO2 exerts pressure on the government and firms to adopt ecologically friendly technologies. Lastly, the FIG variable is important because FIG can facilitate access to green technologies, FDI, advanced research, and ecologically friendly production techniques.
SCD is proxied by ICT goods exports due to the limited availability of direct measures of SCD at the national level. ICT exports reflect the technological capability of a country, digital infrastructure, and participation in technology-intensive economic activities that facilitate digital integration across supply chains. While the proxy may not fully capture firm-level SCD practices, it represents a broader digital ecosystem that supports supply chain transformation. GINV is measured using environmental technology patents, which are widely recognized as an objective indicator of ecologically oriented technological innovation [70,71]. However, this measure may not capture non-patented GINV or organizational and process-based ecological improvements.
Table 2. Variable descriptions and sources.
SymbolsVariablesDescriptionSources
GINVGreen InnovationDevelopment of Environment-Related Technologies (Patents). They are patents associated with ecologically beneficial technologies aimed at improving environmental quality. This means that any technology/innovation that directly contributes to protecting the environment can be referred to as Environmental Related Patents.OECD [72]
SCDSupply Chain DigitalizationICT goods exports (% of total goods exports). This includes consumer electronics, computers and peripherals, communication devices, electronic components, and other information and technology products (miscellaneous).World Bank [73]
CO2Emissions (MTCO2)Measures Environmental Quality. Million metric tonnes of carbon dioxide, often known as megatonnes, is referred to as MTCO2. It is the common unit of measurement used to calculate the enormous amounts of greenhouse gas emissions that nations dump into the environment. Energy Institute [74]
FIGFinancial GlobalizationReal flows, which include FDI, Portfolio Investment, income payments to foreign nationals, and trade.KOF [75]
Therefore, the model of this study, adopted from [76,77] and modified, is presented in Equation (1) and transformed into log form in Equation (2).
GINV = SCD + CO2 + FIG
G I N V t = ϑ 0 + ϑ 1 S C D t + ϑ 2 C O 2 t + ϑ 3 F I G t

3.3. Methods

3.3.1. QQ Method

QR and nonparametric analysis are combined in this work using the Quantile-on-Quantile (QQ) nonparametric econometric technique. This approach, proposed by [78], is beneficial because it overcomes the drawbacks of OLS, which can be misleading when dealing with complex data. QQ produces objective results and takes multivariate data distribution into consideration, compared to OLS. The QQ technique is an innovative and successful econometric technique that is suggested for use in producing trustworthy results. Furthermore, the QQ technique overcomes the limitations of the QR technique by assessing the impact of an explanatory variable on the various quantiles of the dependent variable [79]. The equation of the QQ model is presented in Equation (3).
Y t = β 0 ( θ , τ ) + β 1 ( θ , τ ) ( X t X τ ) ( ) + ε t σ
(∗) represents the independent variable’s conditional quantile.

3.3.2. WQR

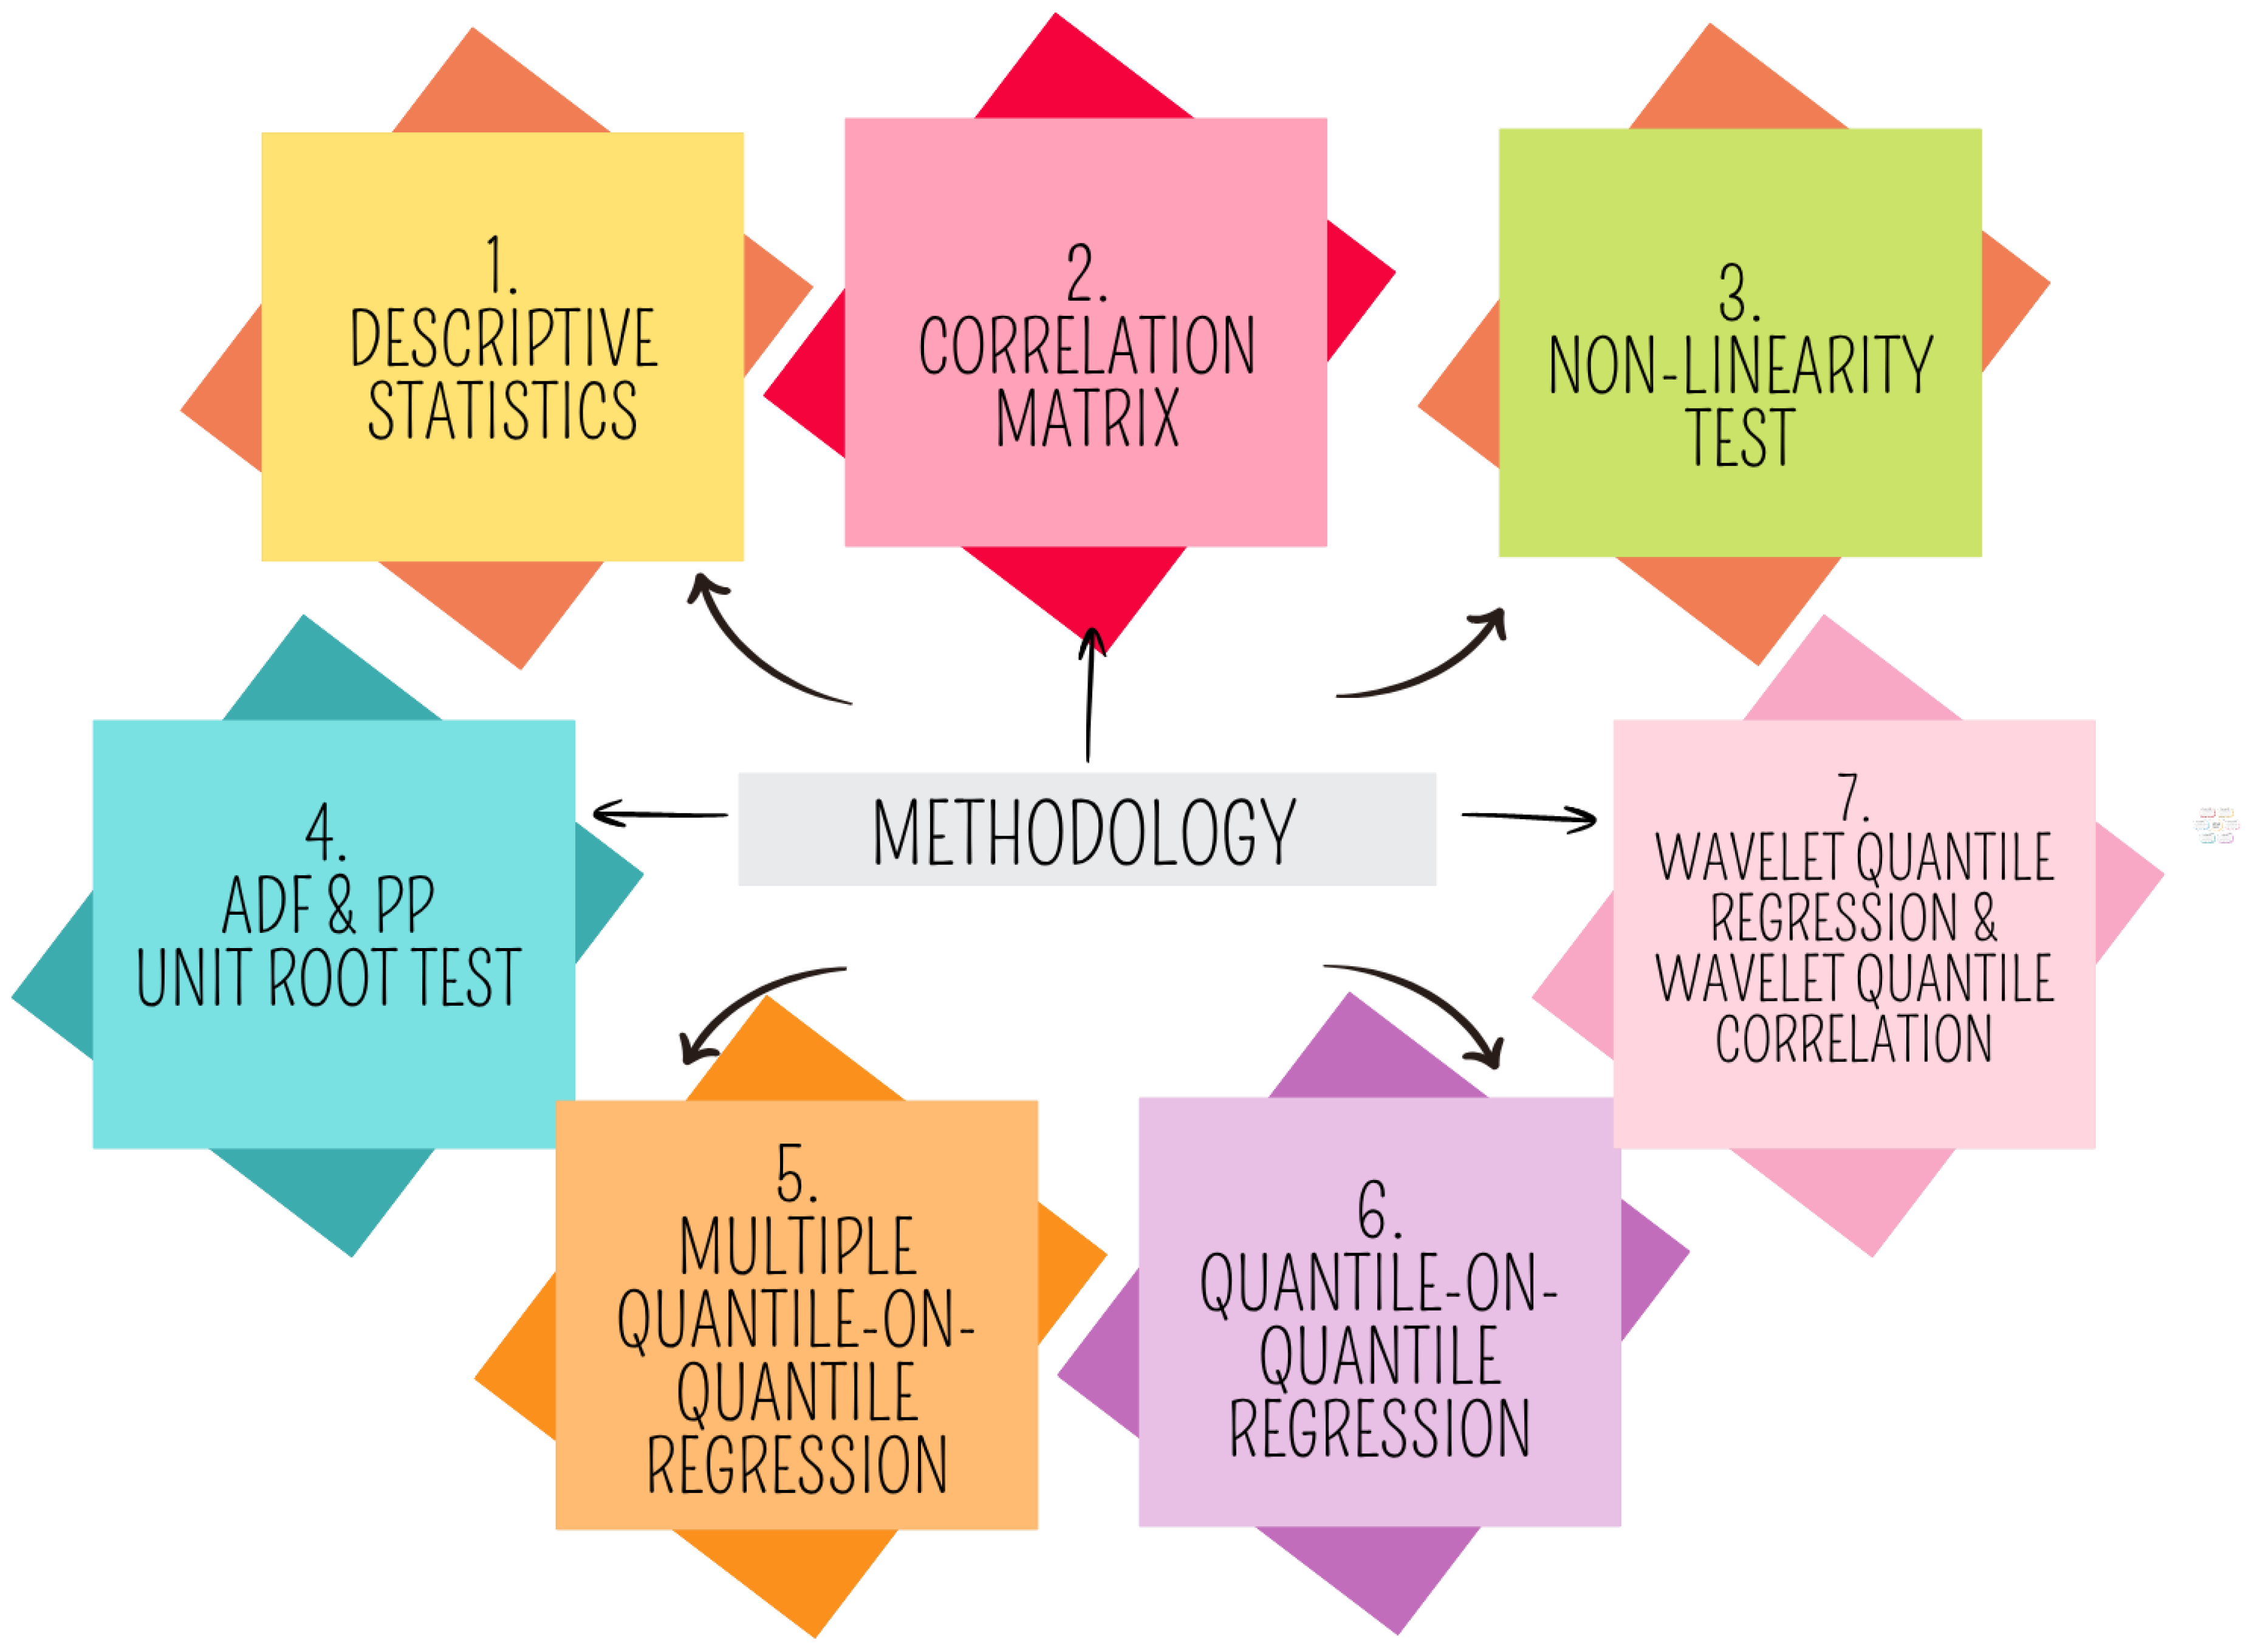
This study also employed the wavelet quantile regression (WQR) approach, which was first presented by Adebayo and Özkan [80]. Unlike conventional QR, WQR is able to identify correlations between series over different quantiles and periods. Furthermore, WQR is better suited for capturing complex data structures because of its flexibility in modeling both linear and non-linear interactions at various scales. WQR offers more versatility in capturing a wide variety of non-linear patterns, while ordinary QR is adept at addressing non-linear correlations. The WQR equation is presented in Equation (4). Furthermore, the methodological structure of this research is presented in Figure 1.
( Գ ) ( d j [ Y ] d j [ X ] ) = Ɓ 0 ( Գ ) + Ɓ 1 ( Գ ) d j [ X ]
In summary, compared to non-linear ARDL and other time-series non-linear models, MQQ and QQ show distributional dependence, quantile-specific effects, and more robust non-linear structures. On the other hand, the WQR technique allows for the observation of short-, medium-, and long-term effects, which cannot necessarily be found in conventional models. The other non-linear models generally show the conditional mean association. Furthermore, although the MQQ, QQ, and WQR methods provide robust estimates across different points of the conditional distribution and effectively capture heterogeneous associations, they do not fully address potential endogeneity arising from reverse causality or omitted variables. Consequently, the findings should be interpreted as evidence of significant associations rather than strict causal connections.

4. Results and Discussion

4.1. Descriptive Statistics

Table 3 shows that CO2 has the highest mean and median, while SCD has the lowest mean and median. Regarding skewness, GINV, SCD, CO2, and FIG are skewed negatively. Furthermore, in terms of Kurtosis, CO2 is leptokurtic because 3.998917 is greater than 3, while GINV, SCD, and FIG are platykurtic because the values are less than 3. In terms of distribution characteristics, GINV (0.111189) is normally distributed, while SCD (0.047015), CO2 (0.000000), and FIG are not distributed normally (0.005725).

4.2. Correlation Matrix

The correlation matrix in Table 4 shows that SCD (0.510430) and FIG (0.036370) are positively correlated with GINV, whereas CO2 (−0.158537) is negatively correlated with GINV.

4.3. Non-Linearity Test

The BDS test is used to examine the non-linear properties of GINV, SCD, CO2, and FIG in Table 5. The results show that all of the series—GINV, SCD, CO2, and FIG—are non-linear, as indicated by their substantial values at the 1% level. This outcome encourages the use of non-linear methods like QQ and WQR.

4.4. Unit Root Analysis

The ADF [81] and PP [82] test results in Table 6 show a mixed integration outcome. GINV, SCD, and CO2 are integrated at level 0, while FIG is integrated at order 1.

4.5. MQQ Analysis

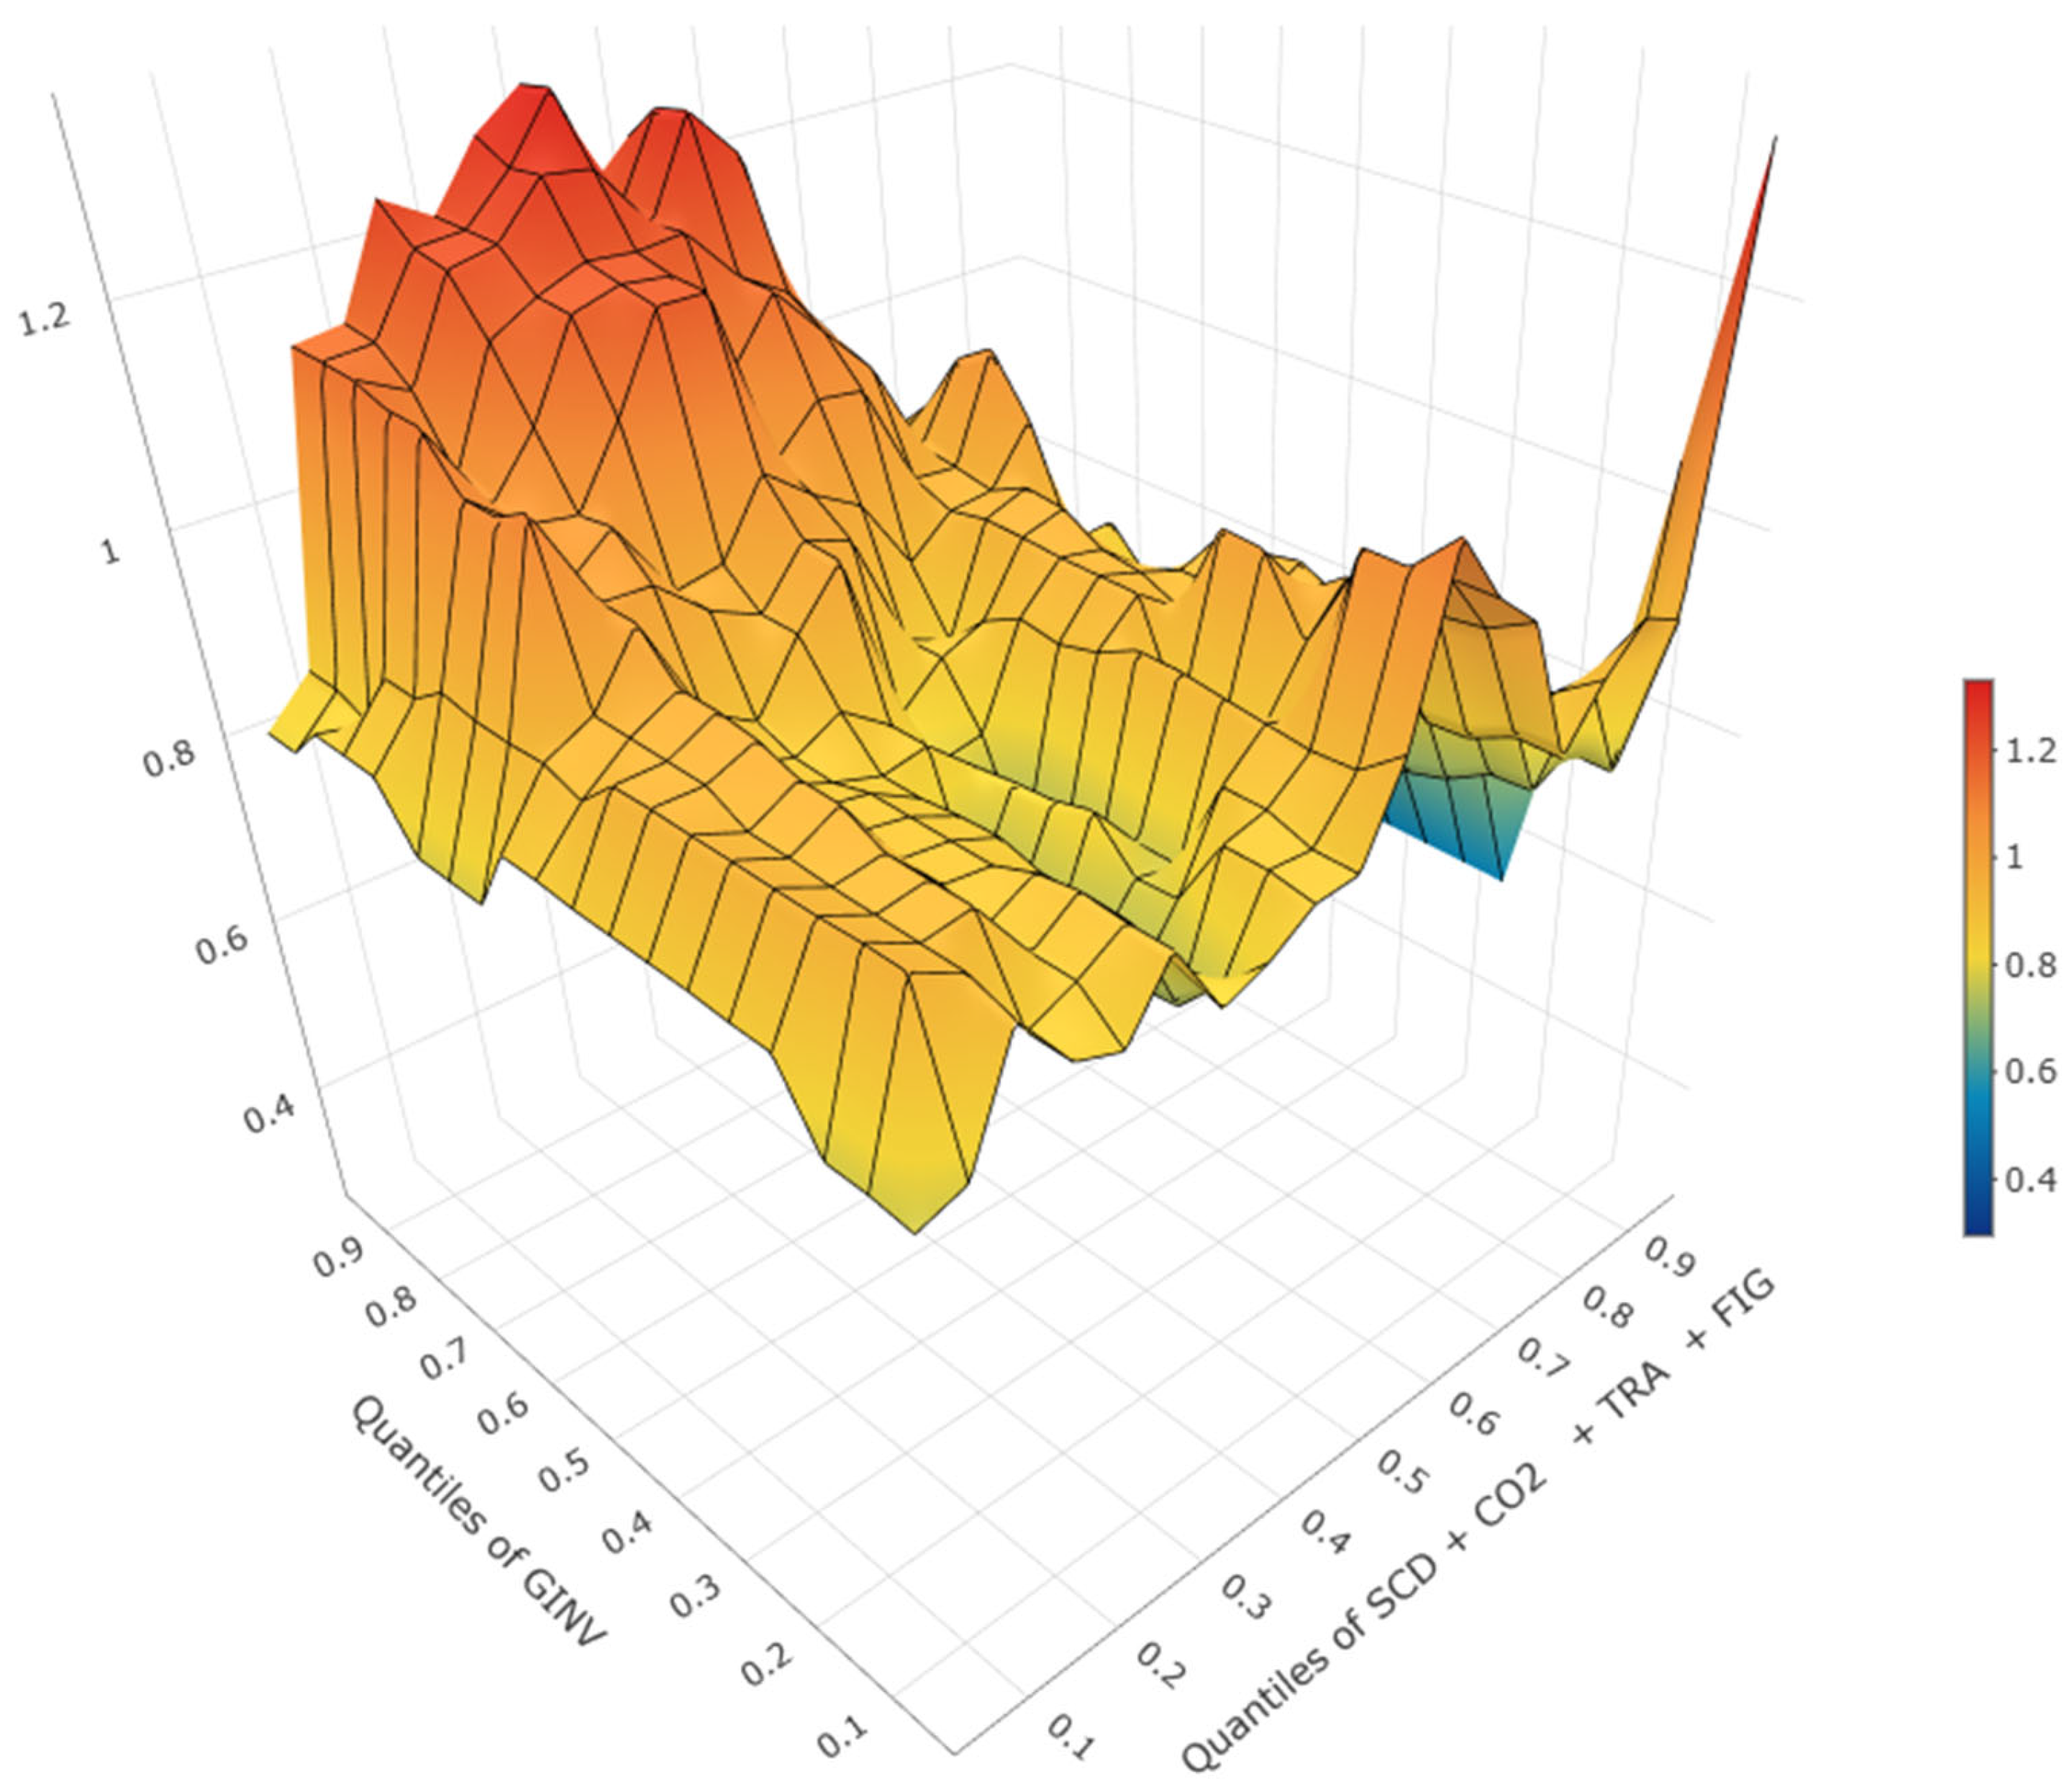
The multiple quantile-on-quantile (MQQ) outcome in Figure 2 shows that the combination of SCD, CO2, and FIG spurs GINV. This means that Kuwait’s transition towards sustainability is being supported by SCD, CO2, and FIG. More specifically, digital technologies improve the ability of firms to develop and implement ecologically viable solutions, the pressure and consequences of rising CO2 contribute to the innovative abilities of entrepreneurs, and FIG provides access to foreign capital that supports ecological innovation. Together, these factors spur GINV.

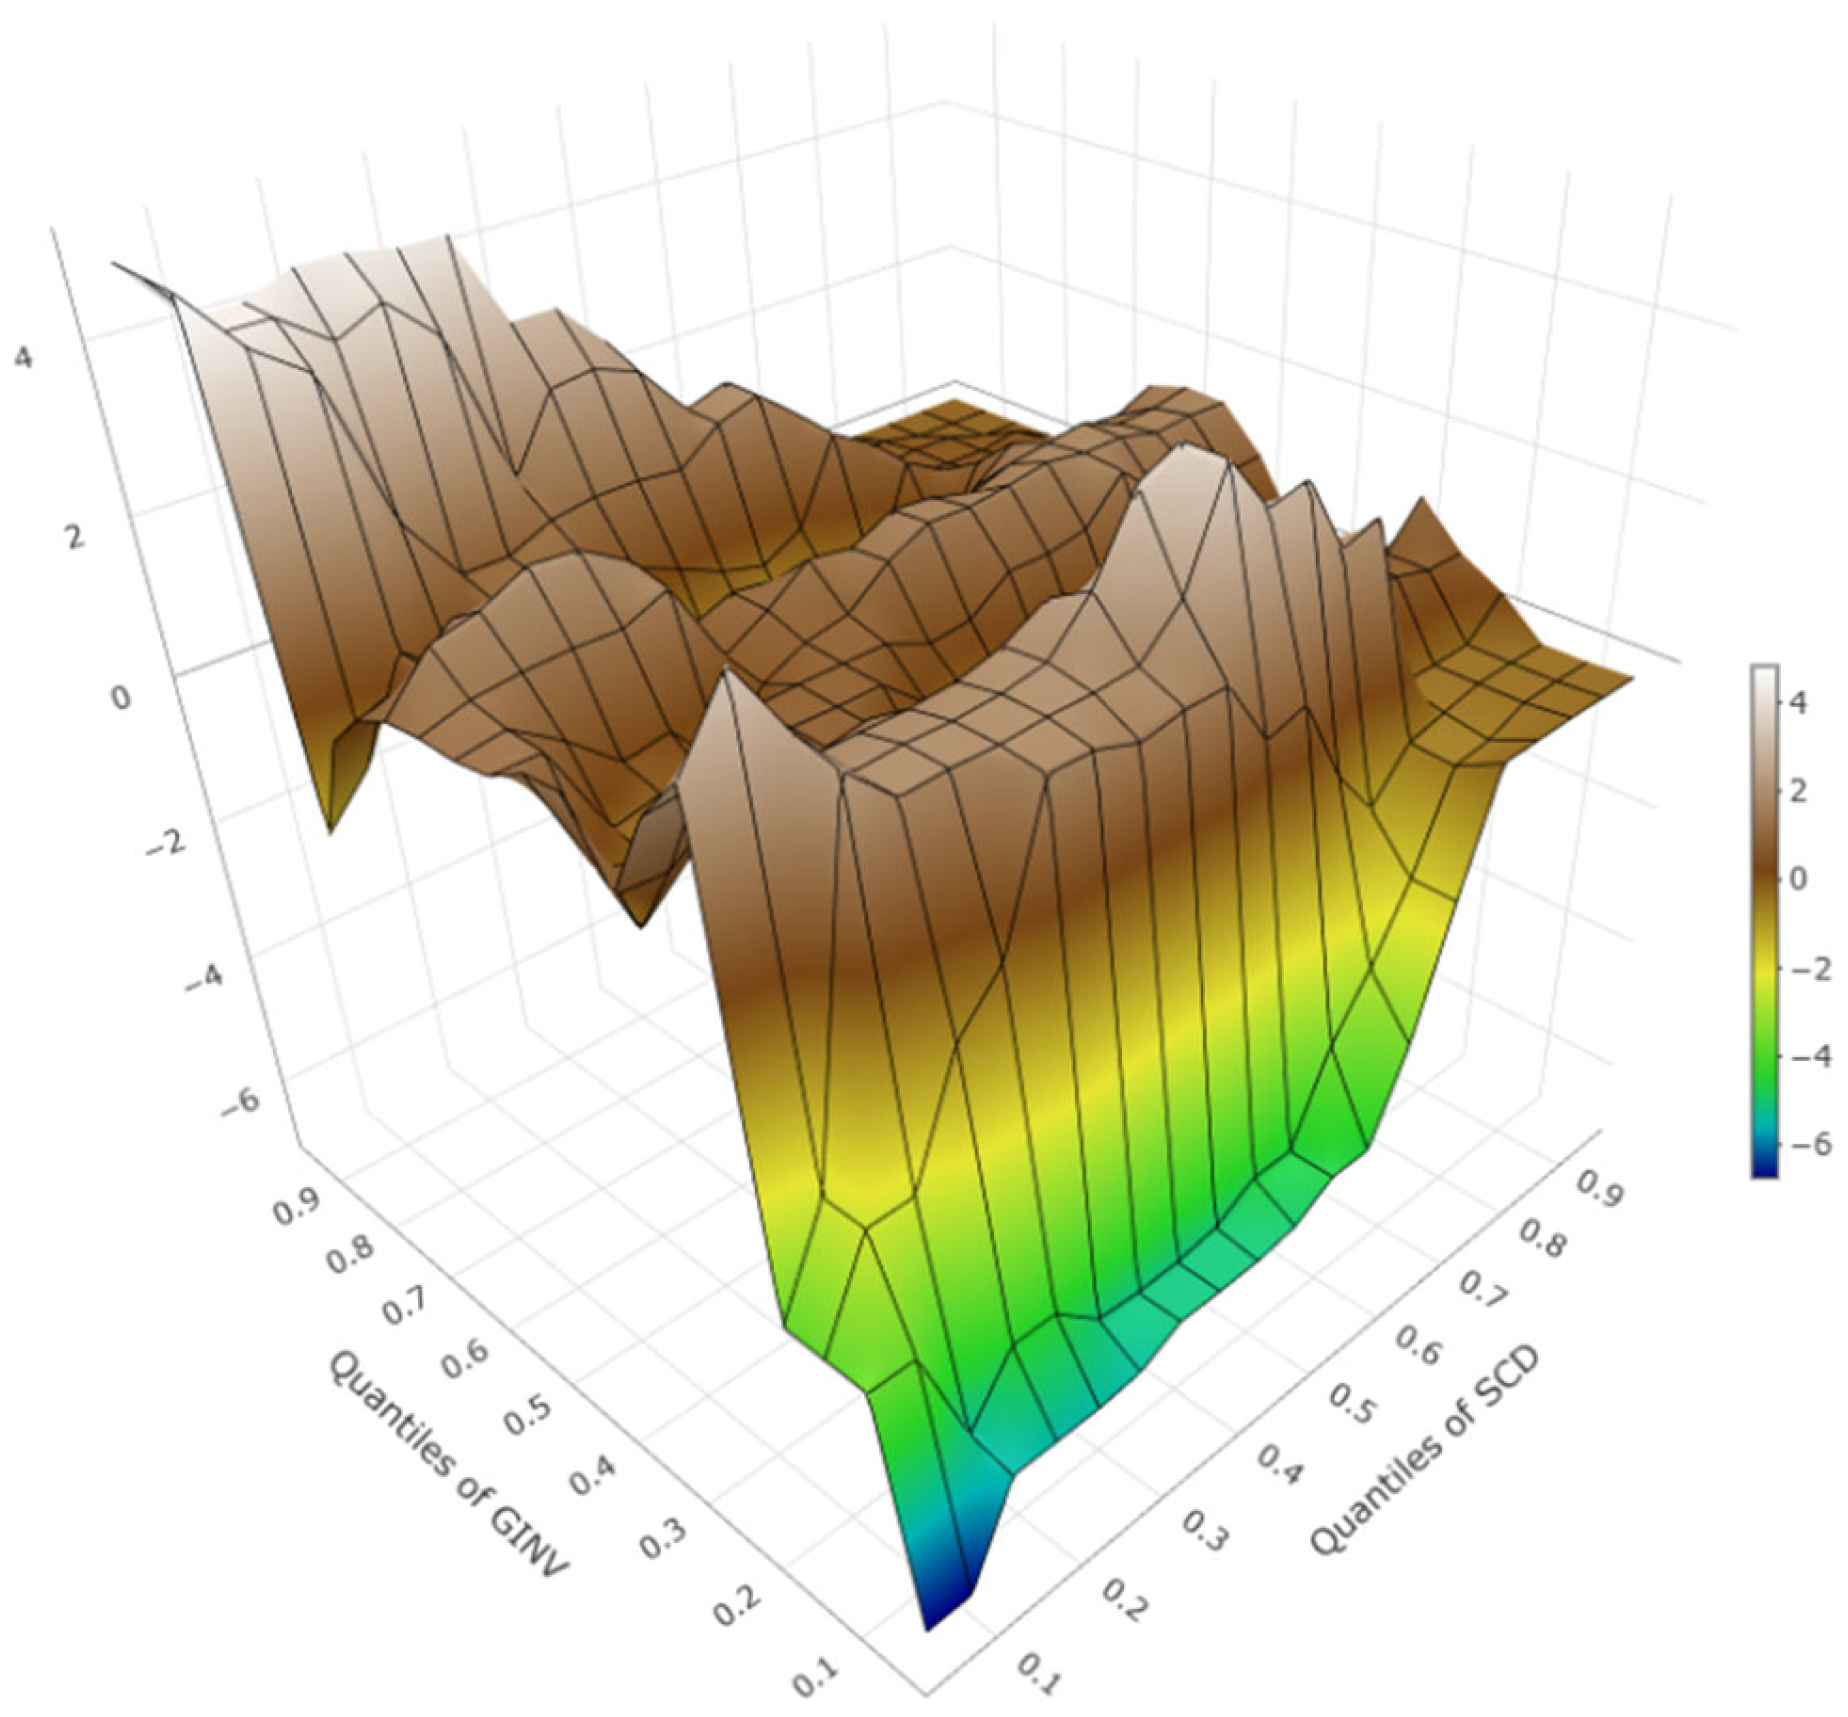
4.6. Q-Q Analysis

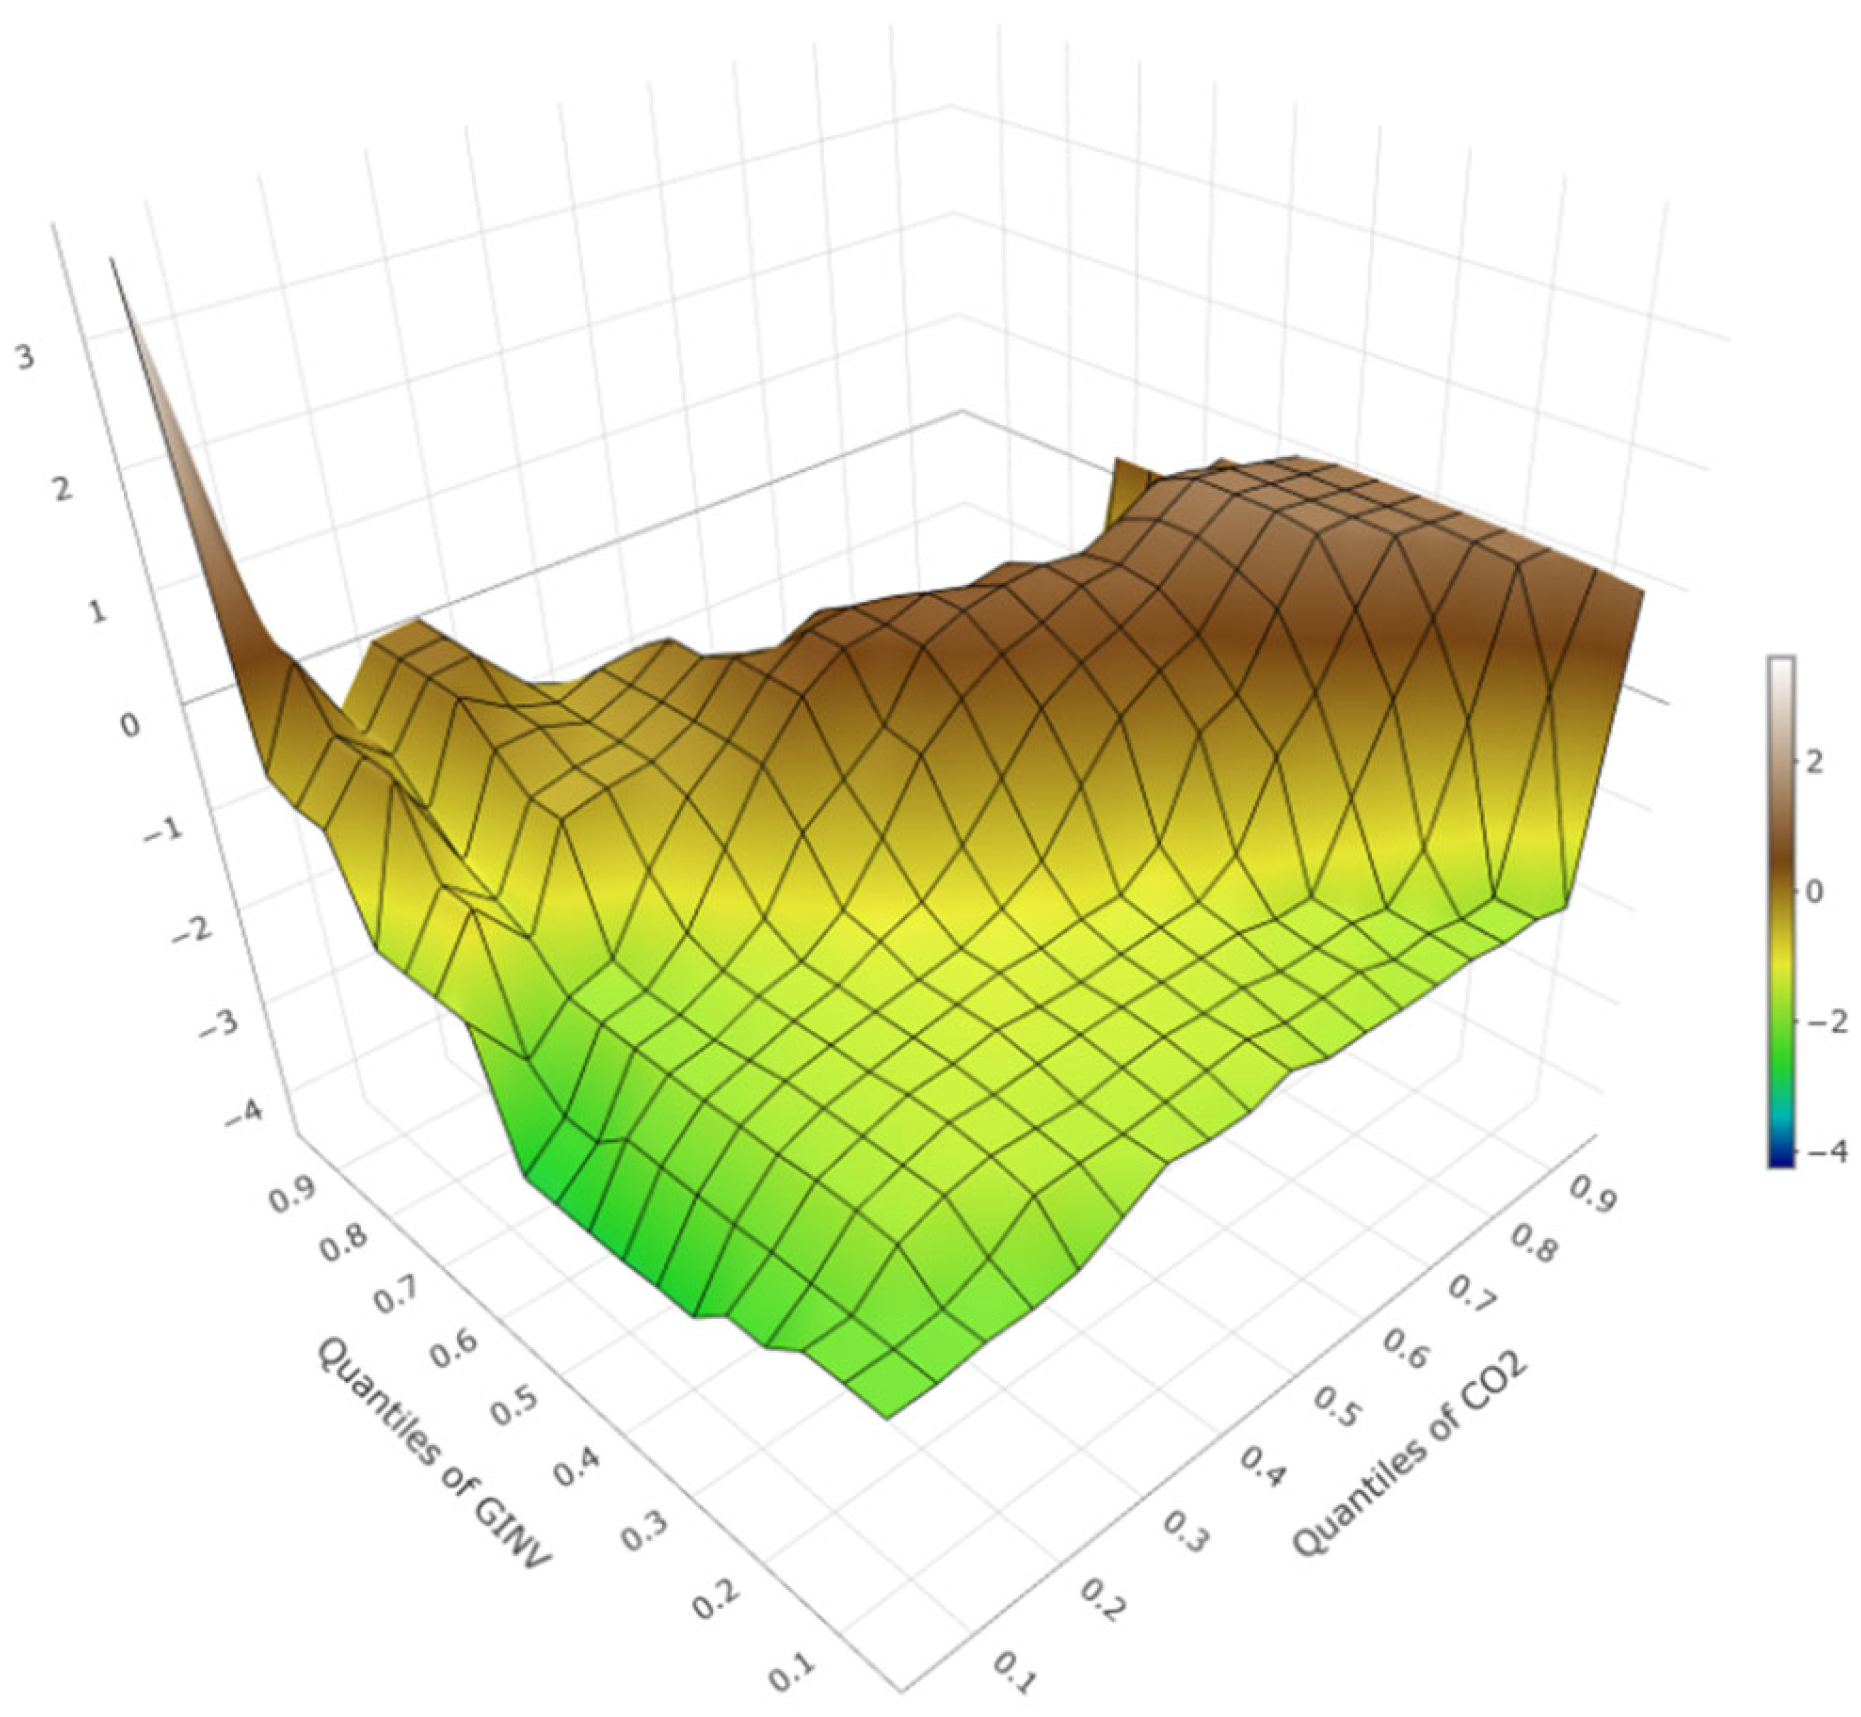
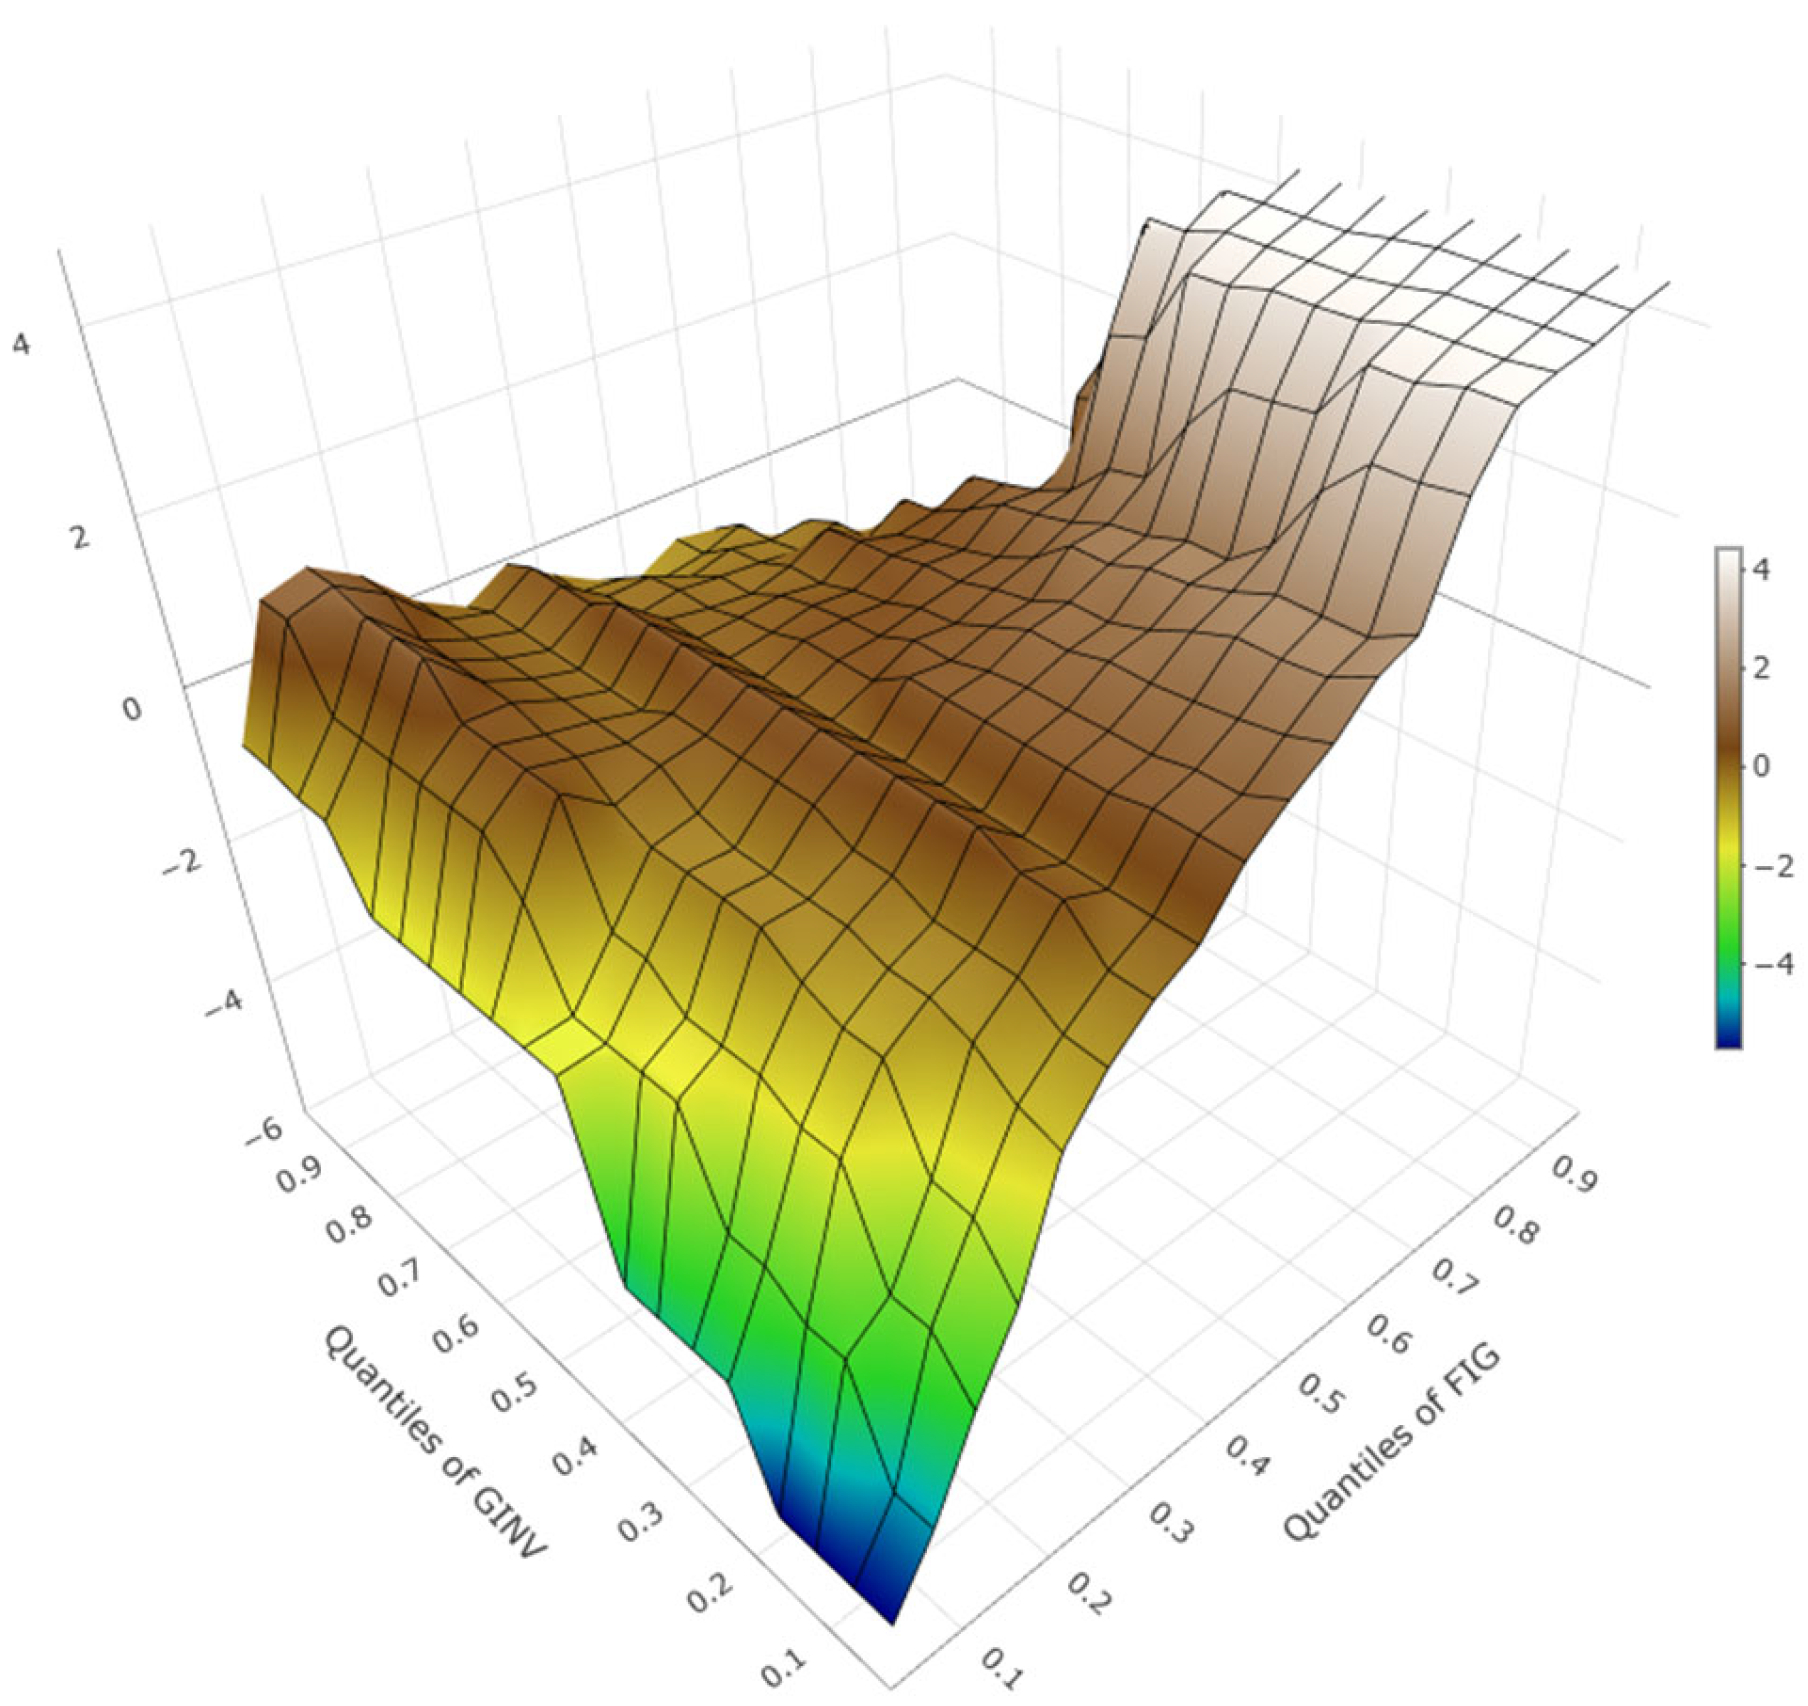
Figure 3, Figure 4 and Figure 5 show the QQ nexus between SCD, CO2, FIG, and GINV. The dark brown color shows a positive relationship, while the colors yellow, green, and blue show a negative association. In Figure 3, at the lower quantiles of SCD and GINV, the link between these two variables is negative, confirming that SCD reduces GINV. The strength of this negative relationship reaches -6. Furthermore, this negative association is observed up to the middle quantiles. However, at the upper quantiles of SCD and GINV, the relationship becomes positive, reaching a magnitude strength of 4. The negative impact of SCD on GINV can be explained by different factors. In the lower and medium quantiles, SCD may reduce GINV in Kuwait because firms initially focus on operational efficiency, expansion of trade, and profitability rather than achieving sustainability objectives. However, in the upper quantiles, SCD becomes advantageous because firms gradually learn how to infuse digital technologies with environmentally friendly practices. In a nutshell, the transition from a negative short and medium-term effect to a long-term positive impact reflects the process of learning and adaptation. At first, firms face adjustment costs, technological uncertainty, and inadequate expertise in combining digitalization with sustainability goals. However, with time, as experiences are accumulated and digital capabilities are improved, they become better at exploiting digital technologies for ecological purposes. This type of transition is quite common in developing economies and resource-dependent economies, where technological progress causes temporal disruption before generating sustainable innovation benefits over the long term. The positive nexus between SCD and GINV is confirmed by previous studies [4,10,35,36].
In Figure 4, CO2 reduces GINV in the lower and middle quantiles, reaching a magnitude of −3. However, in the upper quantiles, the association becomes positive. The short- and medium-term results can be linked to heavy reliance on fossils and the structure of Kuwait’s economy. Kuwait is one of the world’s largest oil-producing economies, and high CO2 is closely linked to intensive extraction of oil, refining, transportation, and activities related to energy consumption. In the short and medium term, much priority is given to economic expansion and export revenues over ecological sustainability. This raises CO2 levels in return. However, the long-run positive link suggests that persistent ecological decline eventually creates technological and policy transformation pressure. The government, firms, and individuals begin to see the danger of ecological degradation, and thus, greener development strategies are enacted. This is evident in Kuwait’s 2035 vision. The positive impact of CO2 on GINV is supported by recent studies [48,83,84]. According to Lee et al. [85] and Linnenluecke et al. [86], the problem of climate change presents an opening for entrepreneurs to be innovative, rather than always seeing it as a threat.
In Figure 5, the QQ relationship between FIG and GINV is examined. The outcome shows that FIG reduces GINV across the lower and middle quantiles. However, at the upper quantiles, the relationship becomes positive. The negative impact at the lower and middle quantiles can be ascribed to how foreign capital is allocated. Foreign investment flows, international capital, and the integration of the financial market are increased by FIG. Therefore, at the initial stages, foreign capital coming into Kuwait is channeled to firms with high returns, and not necessarily to firms with green innovative capabilities. The focus is more on profitability and economic gains. In addition, weak institutional and technological capability to redirect foreign capital to sectors that are sustainable may also be responsible for the negative association. However, in the long term, as the economy adapts and institutions get stronger, a positive association is ascertained, creating knowledge transfer and technological spillovers. This assertion is supported by previous research [7,57,58].
In summary, the results show that SCD, CO2, and FIG have negative effects on GINV at the lower and middle quantiles, but positive effects at the upper quantiles. At lower quantiles, low levels of GINV are observed, while at upper quantiles, high levels of GINV performance are observed. In addition, this lower- and medium-term negative impact is driven by the initial cost of digital transformation, structural dependence on carbon-intensive activities, and limited capacity to transform financial resources into ecological innovation. On the other hand, upper quantiles show evidence of a stronger innovation ecosystem, confirming that SCD, CO2, and FIG are drivers of GINV.

4.7. WQR

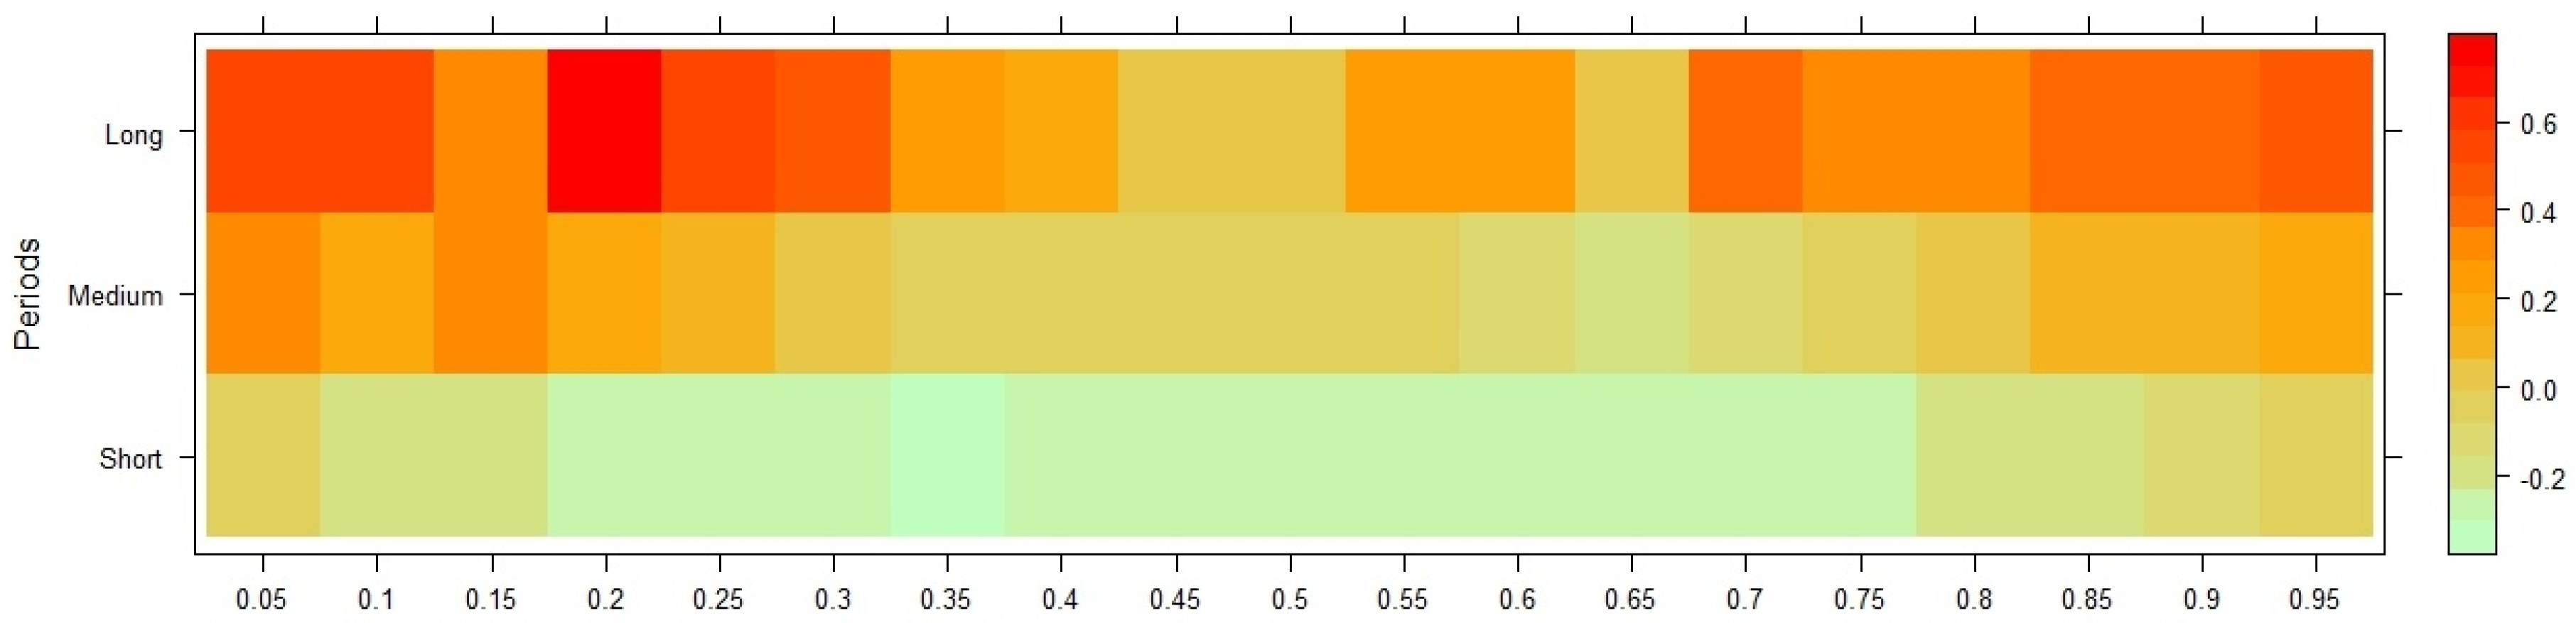
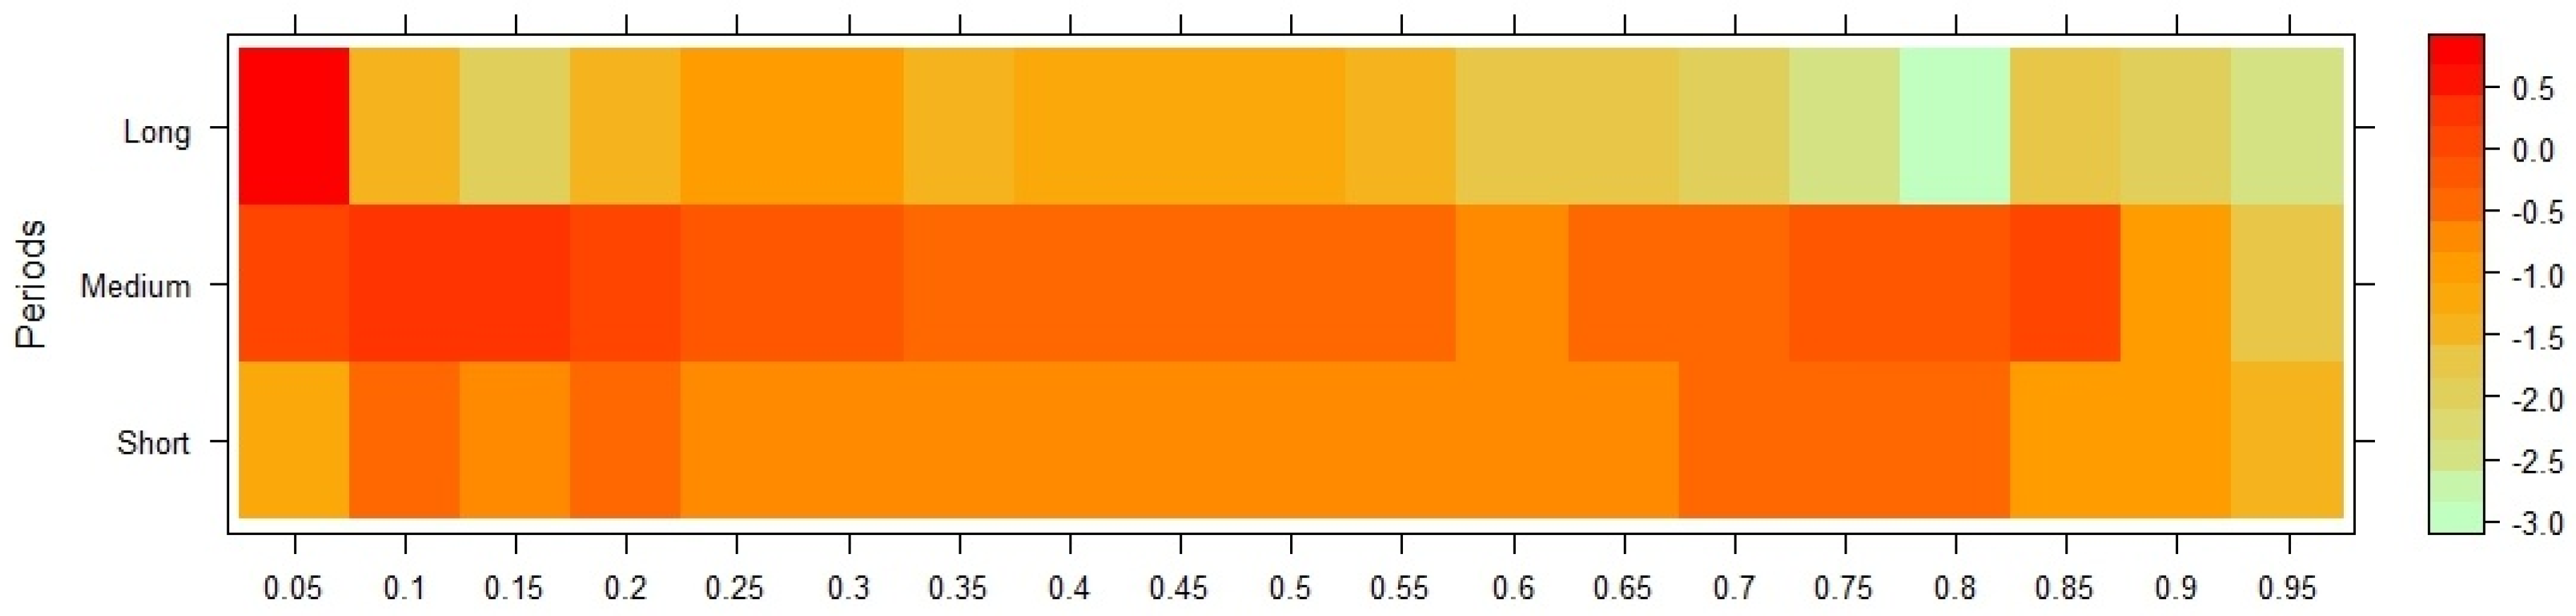
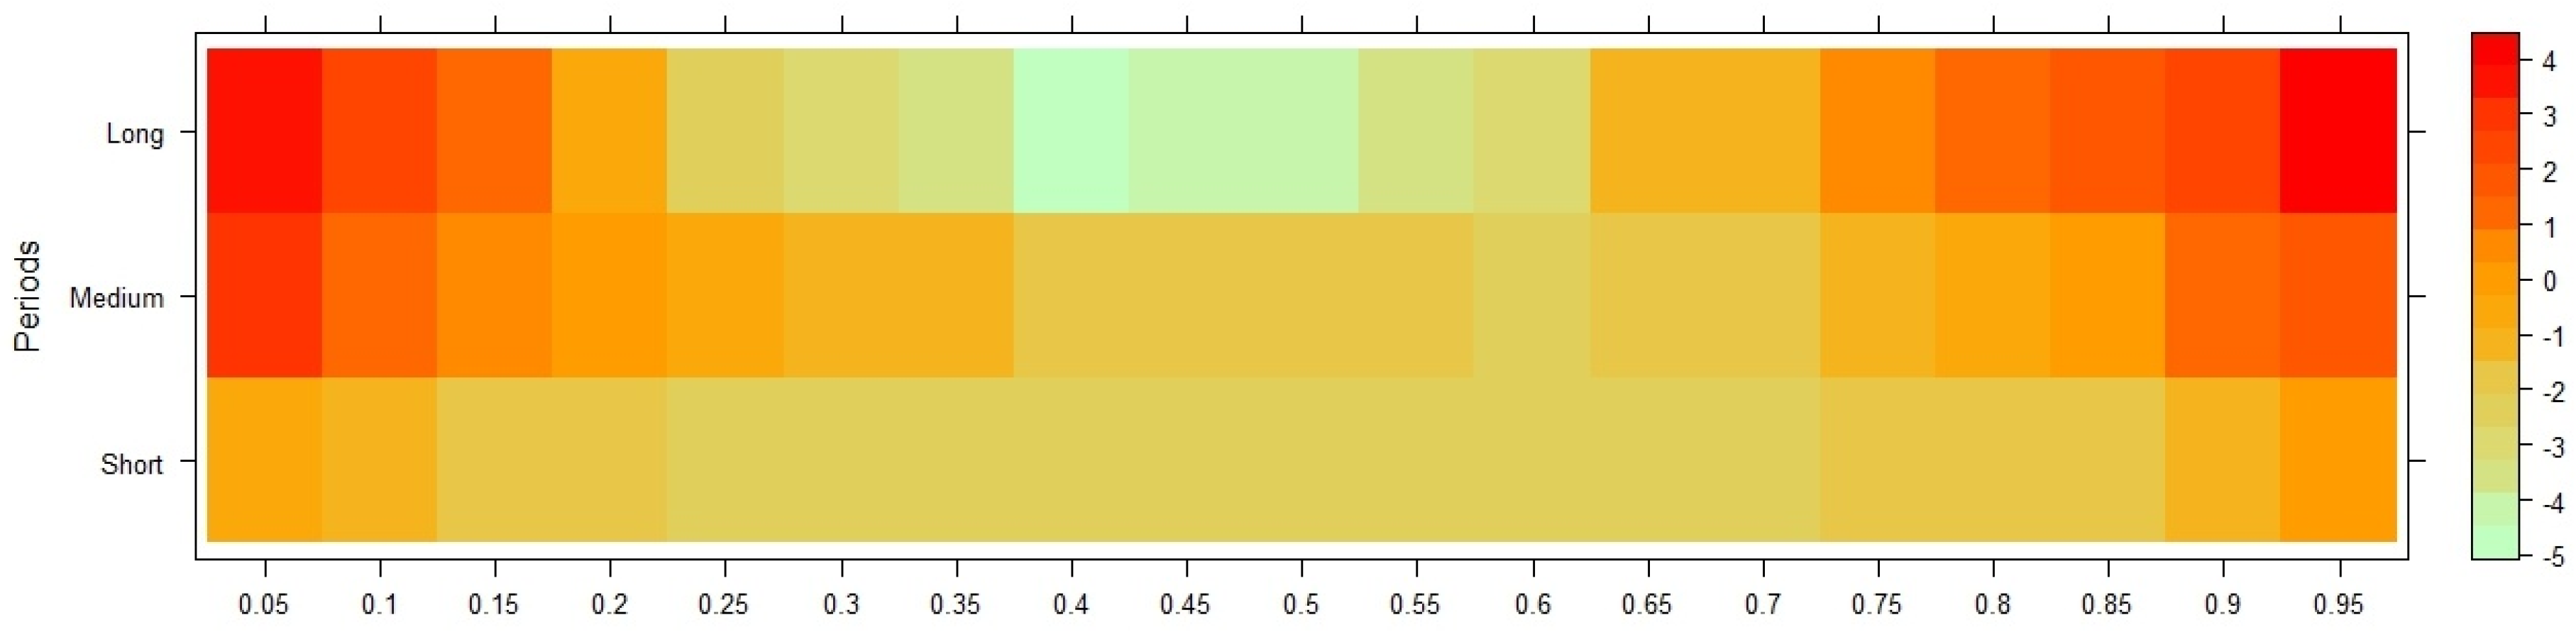
The estimated slope coefficients are shown graphically by the heatmap, which goes from light green to red in ascending order. The effects of SCD, CO2, and FIG on GINV throughout various periods and quantiles for Kuwait are shown in Figure 6, Figure 7 and Figure 8. In Figure 6, the relationship between SCD and GINV is negative in the short term. However, in the medium term, the relationship becomes positive, but moderately strong. In the long term, it is observed that SCD drives GINV across all quantiles, and the effect is particularly strong. As regards the connection between CO2 and GINV, in the short and long term, a negative link is observed. However, in the medium term, across all quantiles, a positive association is ascertained. Lastly, in the medium and long term, the connection between FIG and GINV is asymmetric. In each of these periods, a positive and negative association between FIG and GINV is found. However, the short-term impact is predominantly negative.

4.8. Wavelet Quantile Correlation (WQC)

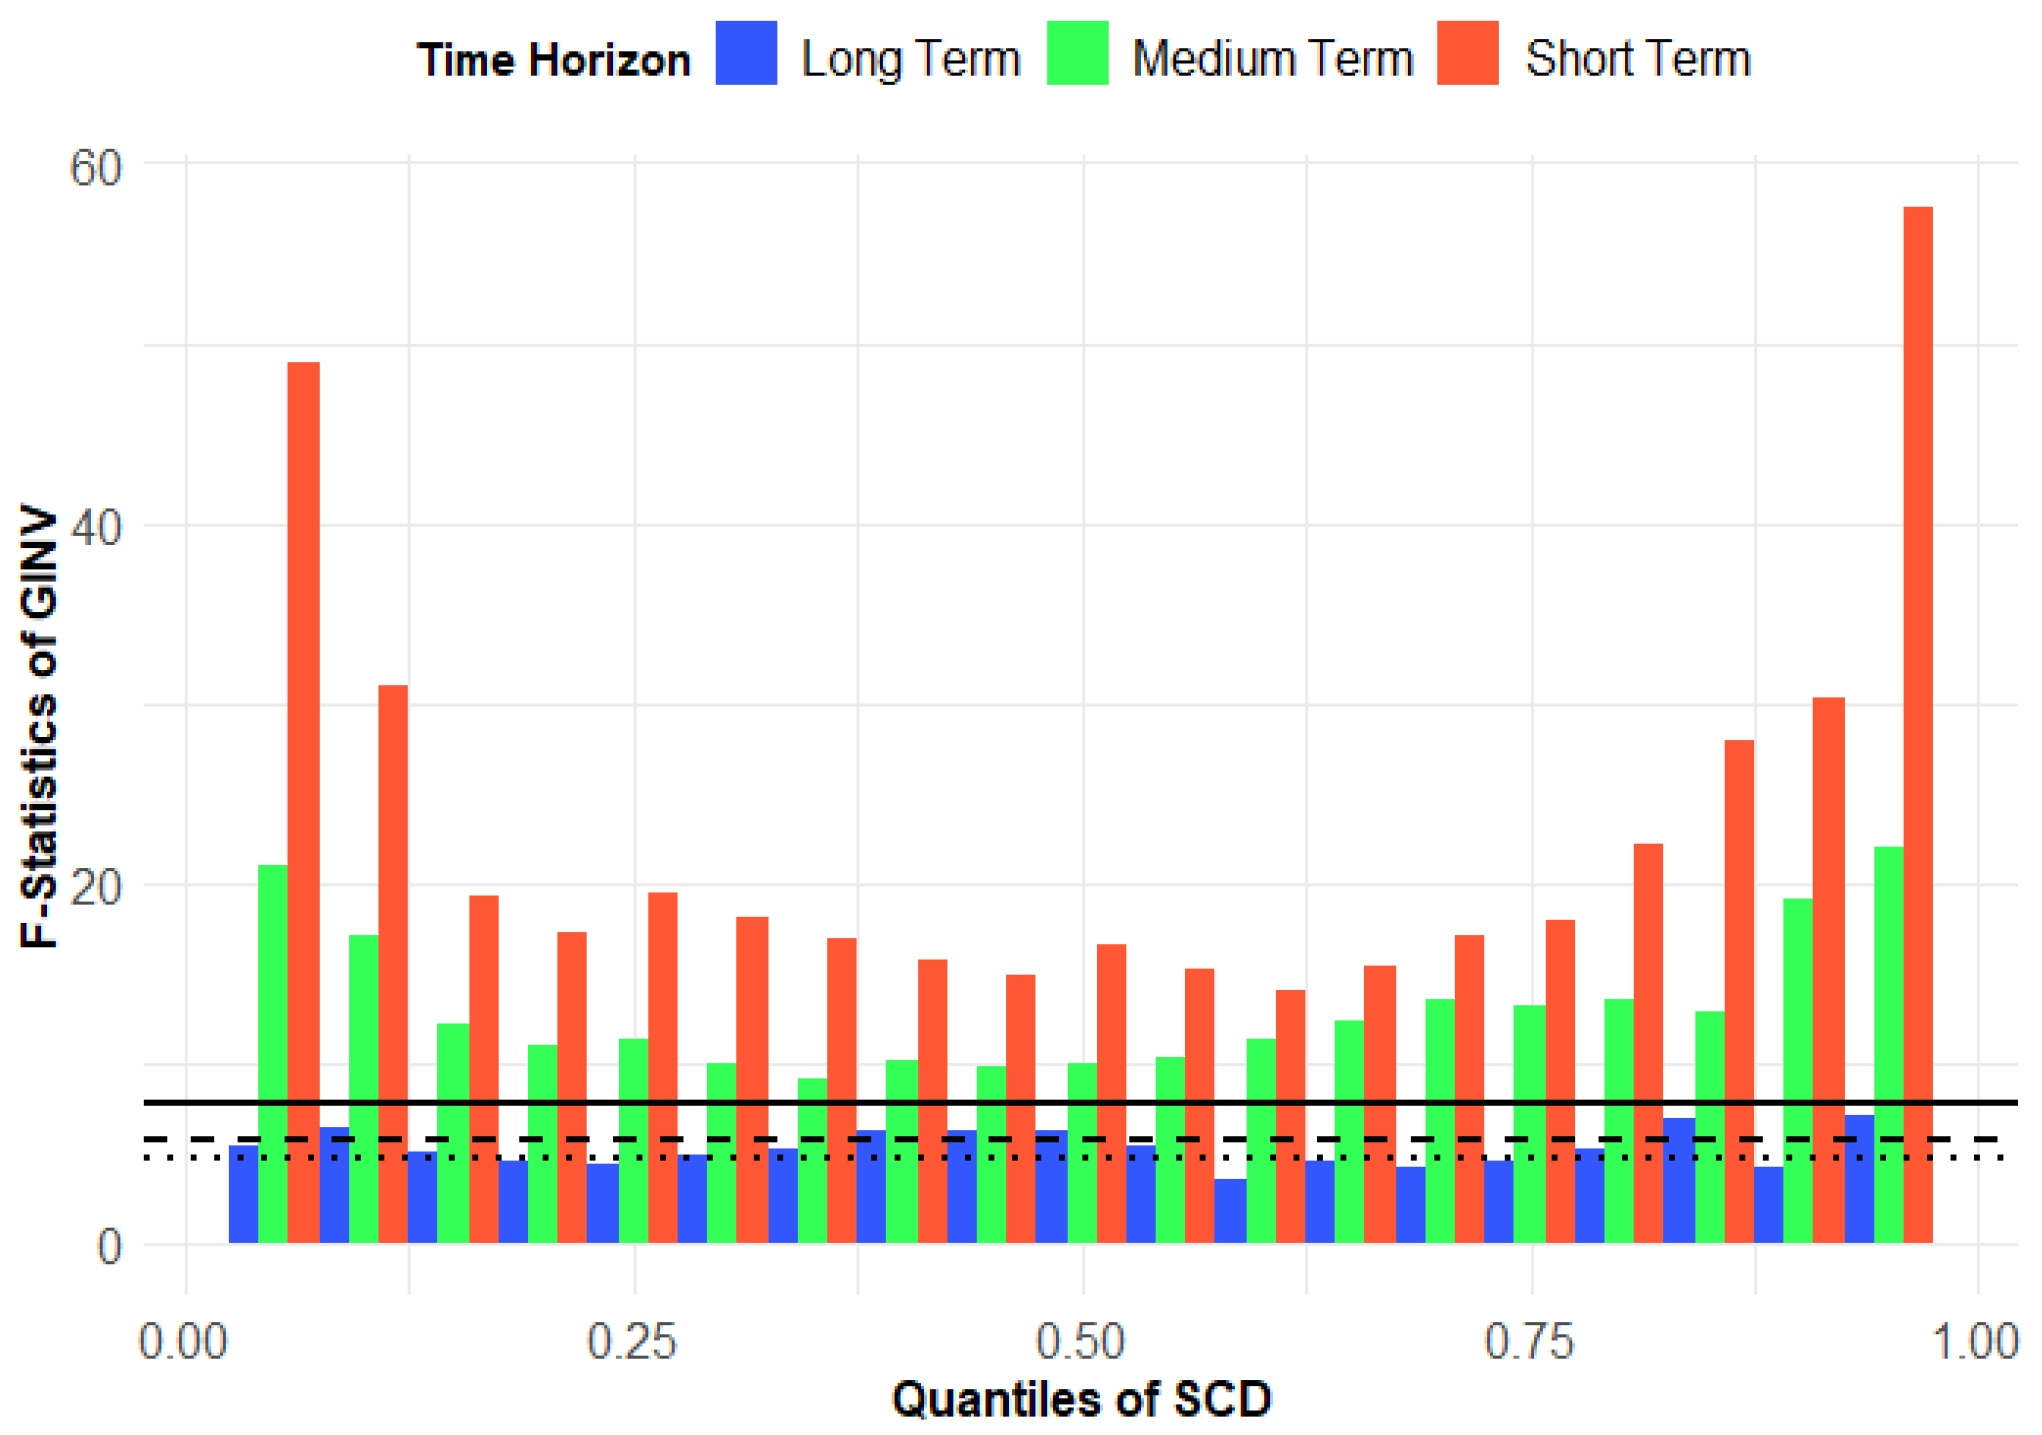
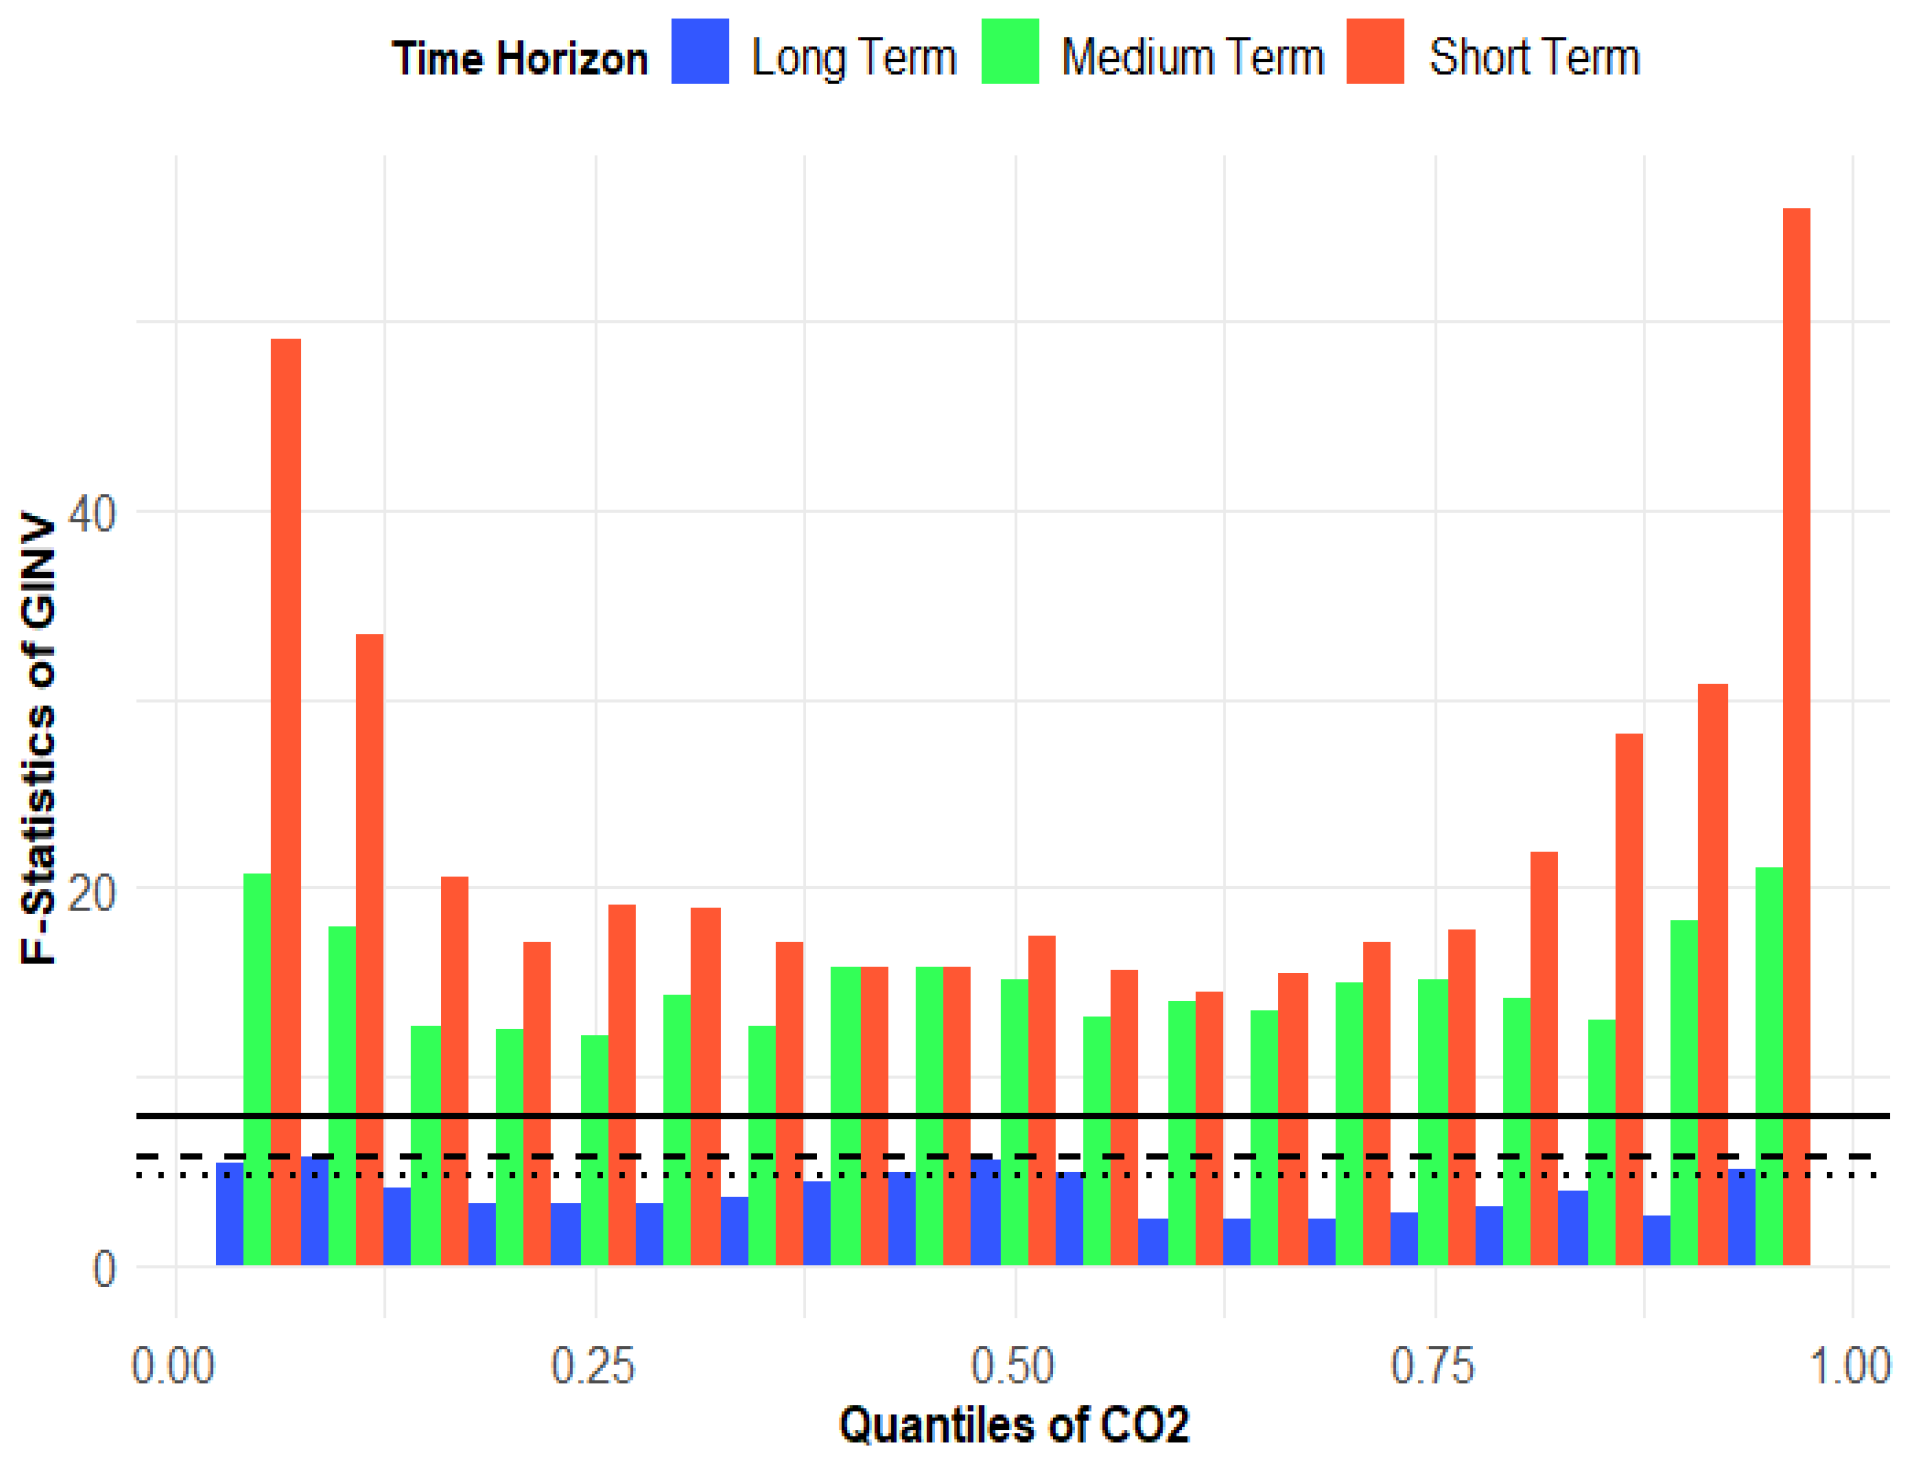
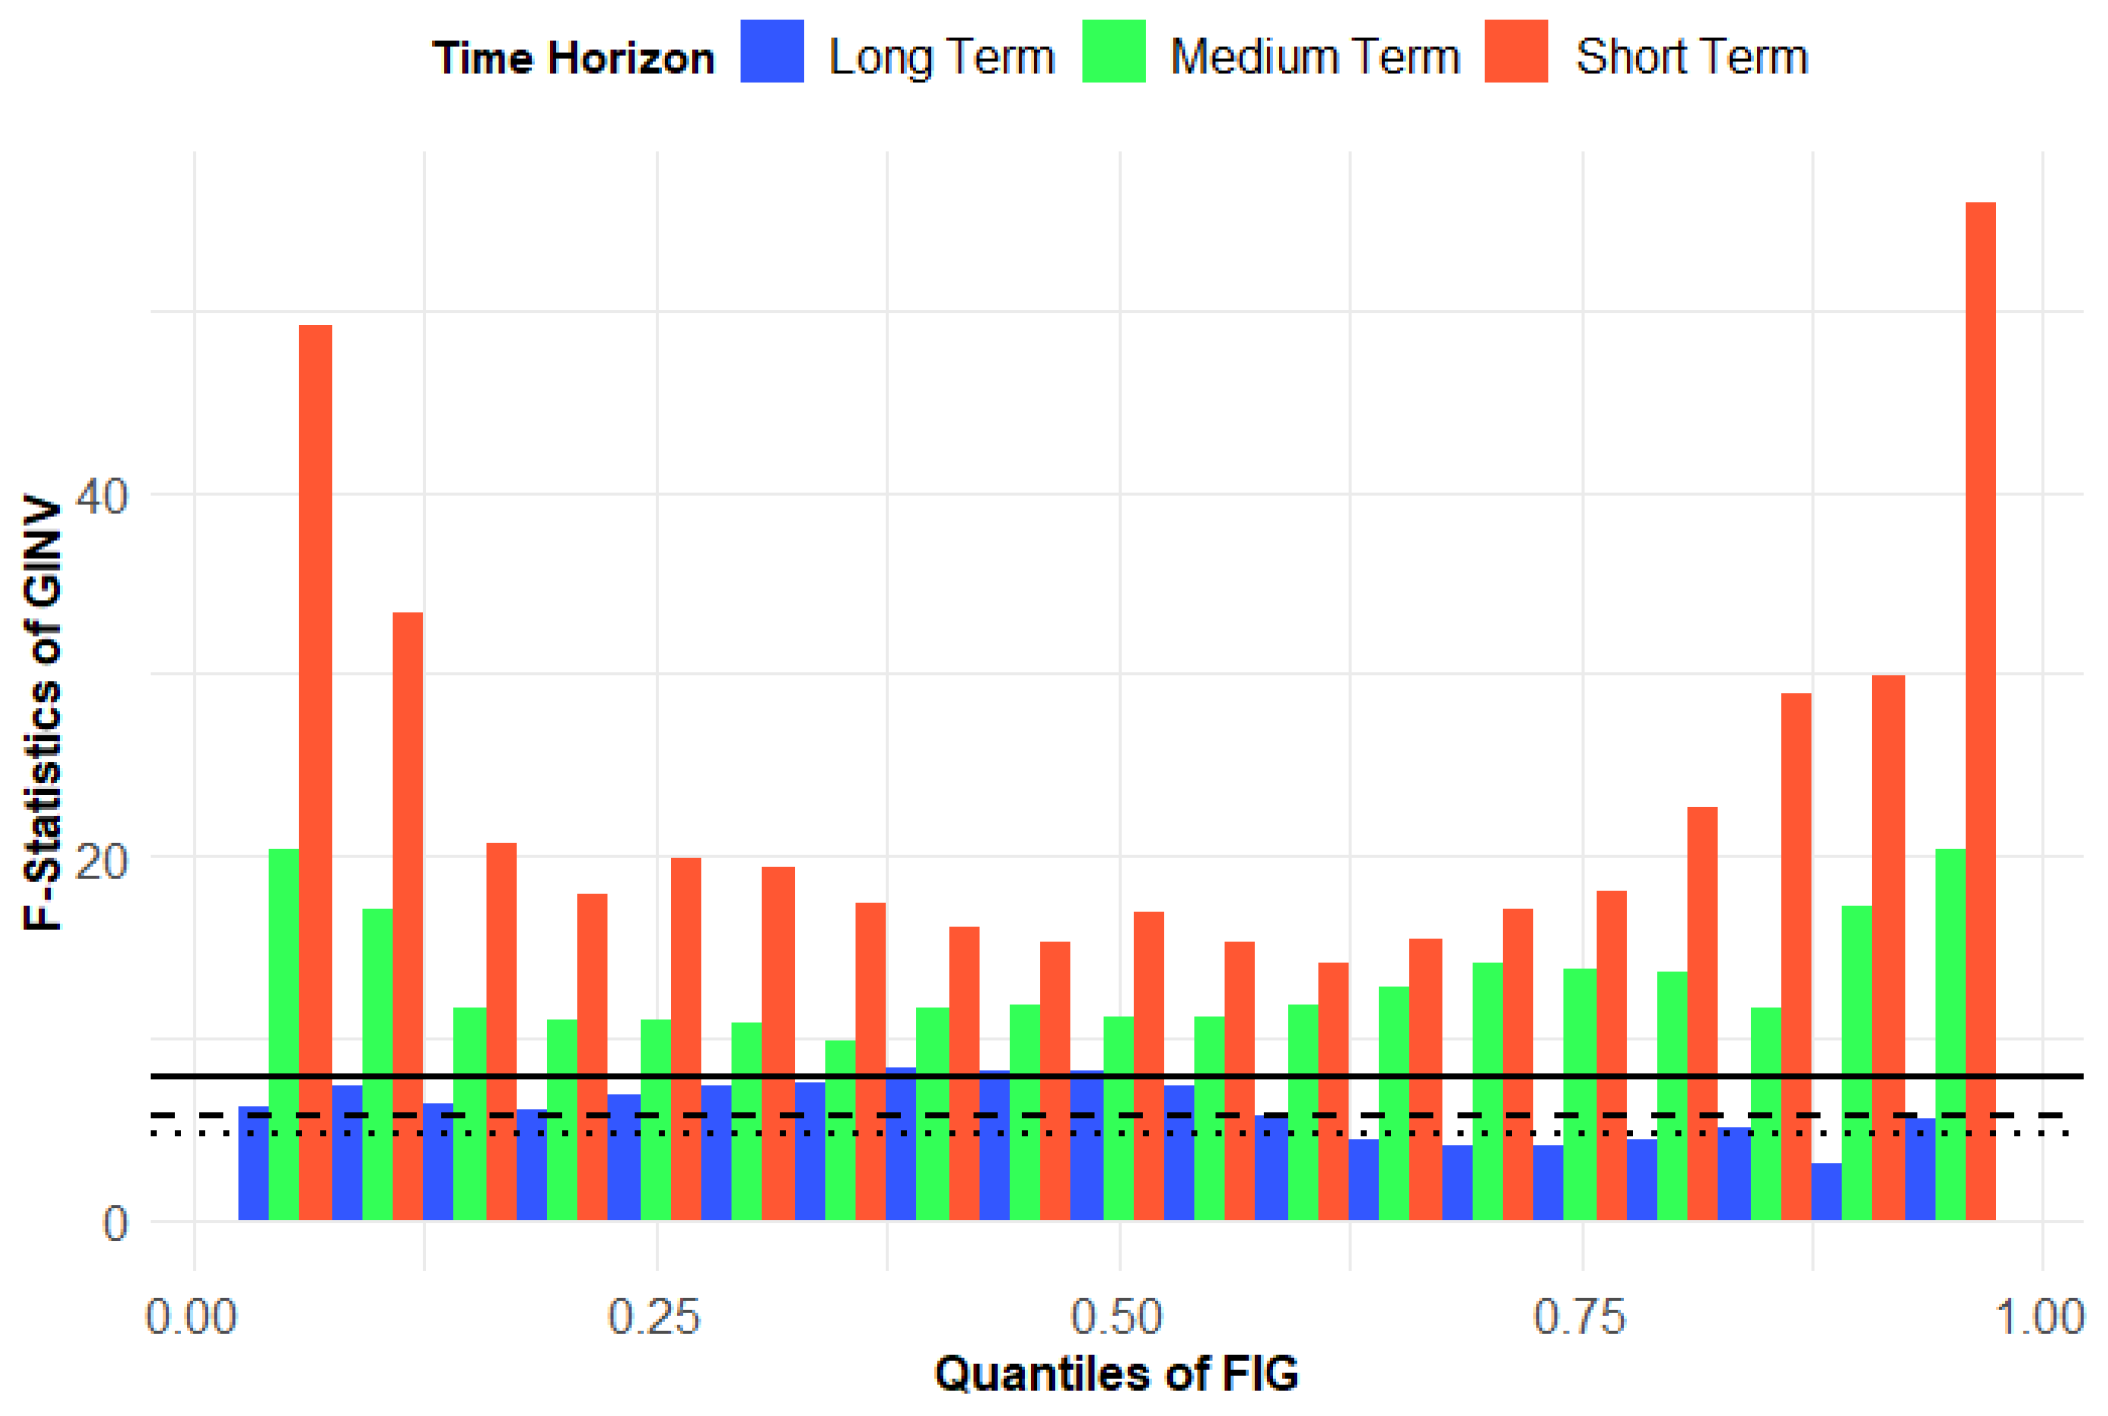
The WQC test results for GINV with SCD, CO2, and FIG are reported in Figure 9, Figure 10 and Figure 11 for the short-, medium-, and long-term horizons, respectively. When the estimated F-statistic is greater than the corresponding critical value, the estimated F-statistic is considered stable, suggesting that there is a long-run equilibrium relationship between GINV and the explanatory variable at the given quantile and frequency band. Unlike the traditional cointegration methods, the WQC framework not only acknowledges distributional heterogeneity but also time-scale dependence, yielding more insights [87,88].
Figure 9 shows high cointegration in most of the quantiles and time spans between GINV and SCD. It is also very strong in the short term with the F-statistics well above the lower and upper quantiles. This indicates that the impact of innovation performance is different depending on the level of innovation performance, with digitalization of the supply chain having a more significant impact in both weak and strong innovation periods. There is also strong cointegration in most quantiles for the medium-term horizon, and a positive statistically significant long-term relationship. The results suggest that digital technologies increase the efficiency of the operations, promote the dissemination of knowledge, optimize the use of resources and speed up environmentally friendly innovation processes. The findings corroborate those of other studies, which have demonstrated that digital transformation and intelligent supply-chain systems contribute to green technological development by enhancing information sharing and lowering innovation costs [89,90]. Likewise, Ref. [87] found that digitalization is beneficial for solidifying firm’s green innovation capability, as it can foster more effective technological integration and green innovation efficiency.
At most quantiles and horizons, there is a high degree of cointegration between GINV and CO2 as shown in Figure 10. The greatest impacts are apparent in the short term, especially toward the extremes of the distribution, where the F-statistics are well above critical values. Medium-term cointegration persists for almost all quantiles and long-term cointegration exists for a few quantiles even at lower levels. The results indicate that the pressure on the environment due to increasing CO2 encourages innovations that seek to improve environmental quality and minimize ecological footprint. This result is consistent with the Porter Hypothesis, which suggests that pressures or challenges in the environment and regulation can force innovation and technological upgrading [13]. This empirical evidence was also confirmed recently by [88] who showed that carbon reduction pressures can stimulate investment in green technologies and sustainable production processes, promoting green innovation.
The WQC results for the period of GINV and FIG are reported in Figure 11. The results show that all horizons were co-integrated, and the greatest relationship was found to exist in the short term. Compared to the critical values, the short-term F-statistics are significantly higher, particularly on the lower and upper quantiles, suggesting that the level of FIG has a significant influence when innovation performance is very low or very high. The presence of medium-term cointegration is also observed between most of the quantiles and the long-term cointegration is stable but comparatively weaker. The findings imply that FIG enables the utilization of foreign capital, cutting-edge technologies and international knowledge networks for innovation activities that are environmentally sustainable. The results are consistent with the results of [91], which showed that global financial integration is associated with an increase in capital mobility, thereby fostering technological advancement and environmental innovation. Similarly, Ref. [61] states that the higher the level of financial openness for firms, the greater their ability to fund green research and development projects, which in turn contributes to better green innovation results.

5. Conclusions

This study explores the impact of SCD, CO2, and FIG on GINV in Kuwait from 2000Q1 to 2022Q4 using the MQQ, QQ, and WQR non-parametric techniques. The variables, methods, and country examined in this research contribute to the existing literature. The MQQ outcome confirms that the combination of SCD, CO2, and FIG can drive GINV. The strength of this relationship is pronounced in the upper quantiles. The QQ result shows that SCD, CO2, and FIG diminish GINV at the lower and middle quantiles. However, at the upper quantiles, a positive relationship is ascertained. Lastly, the WQR confirms that SCD has a negative association with GINV in the short term. However, in the medium and long term, the relationship is predominantly positive. CO2 drives GINV significantly in the medium term, while FIG shows evidence of an asymmetric connection in the medium and long term.

5.1. Policy Recommendations

The following policies are recommended: (1) Incentive programs for SCD transformation must be continued by the relevant stakeholders (government and environmental agencies, the Central Bank of Kuwait, financial institutions, industry leaders, and technology providers) to motivate businesses to consistently engage in high-caliber GINV initiatives. These incentives may include tax reductions, low-interest rate loans, research grants, subsidies for green digital technologies, and financial support for firms investing in smart production systems. Continuous policy support is crucial because the positive impact of SCD on GINV is gradual, which confirms the result at the lower and medium quantiles, rather than immediate. The implication of this is that there will be a significant rise in digital infrastructure in the long term (upper quantiles). More practically, some of the policy frameworks in Kuwait that demonstrate the importance of a solid digital infrastructure and GINV activities include Kuwait Vision 2035, National Digital Transformation Programs, and ICT infrastructure and connectivity policies. (2) FIG can both spur and reduce GINV depending on the strength of environmental laws and green finance mechanisms in Kuwait. The strengthening of ecological laws will control the sectors in which foreign capital is being directed. This will also attract green investment opportunities. Such control tools include carbon taxes and pollution charges. Green finance channels, such as green bonds, sustainability-linked financing schemes, and investment incentives, can also attract foreign capital into ecologically viable projects. In a nutshell, the positive impact of FIG on GINV at upper quantiles implies that international financial integration can serve as an important driver for sustainable technological advancement.

5.2. Policy Implications

The policy implications of this research are as follows: (1) If the stakeholders provide the necessary incentives for SCD, several policy implications may arise for green innovation, which include increased adoption of digital technologies, enhanced green innovation capacity, improved resource efficiency, greater competitiveness and sustainability performance, and progress towards national sustainability goals. (2) The implication of strengthening ecological laws is that it will channel financial flows to green investments. This will reduce the financial flows going to sectors that cause ecological degradation. In addition, the implementation of green finance mechanisms facilitates investments in sustainable technologies, accelerates green innovation, promotes digital and sustainable transformation, strengthens ecological governance, and supports national sustainability goals.

5.3. Study Limitations

This study has limitations. It only focuses on the Kuwaiti economy and has a limited sample size. Other studies could examine the impact of SCD, CO2, and FIG on other individual GCC economies or as a regional study, considering a larger sample size. A comparative study focusing on GCC economies and a sectoral-level analysis can also be considered. Secondly, other drivers of GINV can also be investigated. More specifically, alternative measures of digitalization and green innovation, and the inclusion of institutional or governance variables, can be included in the model. Lastly, a bidirectional or two-way causality approach can be employed by future studies. Causality techniques like Frequency Domain Causality or Non-Parametric Causality techniques can be used. Other linear or non-linear methods can also be employed, which can factor in control variables. The presence of control variables in a model can lead to outcomes that are more robust.


Author Contributions

Methodology, A.B.A.; resources, A.B.A.; writing—original draft preparation, S.E.; writing—review and editing, S.E.; supervision, W.K.; project administration, W.K. All authors have read and agreed to the published version of the manuscript.

Funding

This research received no external funding.

Institutional Review Board Statement

Not Applicable.

Informed Consent Statement

Not Applicable.

Data Availability Statement

The original contributions presented in this study are included in the article. Further inquiries can be directed to the corresponding author.

Conflicts of Interest

The authors declare no conflicts of interest.

Abbreviations

3SLSThree-Stage Least Squares
AIArtificial Intelligence
BRICSBrazil, Russia, India, China, and South Africa
ADFAugmented Dickey–Fuller
CO2Carbon dioxide Emissions
CS-ARDLCross-sectional Autoregressive Distributed Lag
DCTDynamic Capability Theory
DIDDifference-in-Differences
ESGEnvironmental, Social, and Governance
FDIForeign Direct Investment
FIGFinancial Globalization
GCCGulf Cooperation Countries
GINVGreen Innovation
GMMGeneral Method of Moments
IoTInternet of Things
MQQMultiple Quantile-on-Quantile
OFDIOutward Foreign Direct Investment
OLSOrdinary Least Squares
PPPhillips Perron
QRQuantile Regression
QQQuantile-on-Quantile Regression
RBVResource-Based View
R&DResearch and Development
SCISupply Chain Integration
SCMSupply Chain Management
SEMSimultaneous Equation Modeling
WQCWavelet Quantile Correlation
WQRWavelet Quantile Regression

References

  1. Du, K.; Li, P.; Yan, Z. Do green technology innovations contribute to carbon dioxide emission reduction? Empirical evidence from patent data. Technol. Forecast. Soc. Change 2019, 146, 297–303. [Google Scholar] [CrossRef] [Scilit]
  2. Ozturk, I.; Aslan, A.; Altinoz, B. Investigating the nexus between CO2 emissions, economic growth, energy consumption and pilgrimage tourism in Saudi Arabia. Econ. Res.-Ekon. Istraž. 2022, 35, 3083–3098. [Google Scholar] [CrossRef] [Scilit]
  3. Fernando, Y.; Chiappetta Jabbour, C.J.; Wah, W.-X. Pursuing green growth in technology firms through the connections between environmental innovation and sustainable business performance: Does service capability matter? Resour. Conserv. Recycl. 2019, 141, 8–20. [Google Scholar] [CrossRef] [Scilit]
  4. An, S.; Gu, Y.; Pan, L.; Yu, Y. Supply chain digitalization and firms’ green innovation: Evidence from a pilot program. Econ. Anal. Policy 2024, 84, 828–846. [Google Scholar] [CrossRef] [Scilit]
  5. Saunila, M.; Ukko, J.; Rantala, T. Sustainability as a driver of green innovation investment and exploitation. J. Clean. Prod. 2018, 179, 631–641. [Google Scholar] [CrossRef] [Scilit]
  6. Schiederig, T.; Tietze, F.; Herstatt, C. Green innovation in technology and innovation management—An exploratory literature review. R&D Manag. 2012, 42, 180–192. [Google Scholar] [CrossRef] [Scilit]
  7. Abid, N.; Ceci, F.; Ahmad, F.; Aftab, J. Financial development and green innovation, the ultimate solutions to an environmentally sustainable society: Evidence from leading economies. J. Clean. Prod. 2022, 369, 133223. [Google Scholar] [CrossRef] [Scilit]
  8. Younes, S.; Adedokun, M.W.; Alzubi, A.B.; Aljuhmani, H.Y. Impact of Supply Chain Management on Energy Transition and Environmental Sustainability: The Role of Knowledge Management and Green Innovations. Sustainability 2025, 17, 9249. [Google Scholar] [CrossRef] [Scilit]
  9. Singh, S.K.; Del Giudice, M.; Chierici, R.; Graziano, D. Green innovation and environmental performance: The role of green transformational leadership and green human resource management. Technol. Forecast. Soc. Change 2020, 150, 119762. [Google Scholar] [CrossRef] [Scilit]
  10. Yue, W. Supply chain digitalization and corporate green innovation. Financ. Res. Lett. 2025, 74, 106656. [Google Scholar] [CrossRef] [Scilit]
  11. Guo, Y.; Wang, L.; Chen, Y. Green entrepreneurial orientation and green innovation: The mediating effect of supply chain learning. Sage Open 2020, 10, 2158244019898798. [Google Scholar] [CrossRef] [Scilit]
  12. Acemoglu, D.; Aghion, P.; Bursztyn, L.; Hemous, D. The environment and directed technical change. Am. Econ. Rev. 2012, 102, 131–166. [Google Scholar] [CrossRef] [Scilit] [PubMed]
  13. Porter, M.E.; van der Linde, C. Toward a new conception of the environment-competitiveness relationship. J. Econ. Perspect. 1995, 9, 97–118. [Google Scholar] [CrossRef] [Scilit]
  14. Kriym, A.; Aljuhmani, H.Y. Knowledge Management in Environmental Sustainability: The Roles of Financial and Social Integration. Sustainability 2026, 18, 735. [Google Scholar] [CrossRef] [Scilit]
  15. Gopal, P.R.C.; Rana, N.P.; Krishna, T.V.; Ramkumar, M. Impact of big data analytics on supply chain performance: An analysis of influencing factors. Ann. Oper. Res. 2024, 333, 769–797. [Google Scholar] [CrossRef] [Scilit]
  16. Preindl, R.; Nikolopoulos, K.; Litsiou, K. Transformation strategies for the supply chain: The impact of industry 4.0 and digital transformation. Supply Chain. Forum Int. J. 2020, 21, 26–34. [Google Scholar] [CrossRef] [Scilit]
  17. Abobassier, A.; Khadem, A.; Aljuhmani, H.Y.; Alzubi, A.B. Unlocking Sustainable Supply Chains Through Blockchain Traceability: The Strategic Roles of Transparency, Collaboration, and Environmental Orientation. Sustainability 2026, 18, 4138. [Google Scholar] [CrossRef] [Scilit]
  18. Alfaqiyah, E.; Alzubi, A.; Aljuhmani, H.Y.; Öz, T. How Industry 4.0 Technologies Enhance Supply Chain Resilience: The Interplay of Agility, Adaptability, and Customer Integration in Manufacturing Firms. Sustainability 2025, 17, 7922. [Google Scholar] [CrossRef] [Scilit]
  19. Tavana, M.; Shaabani, A.; Raeesi Vanani, I.; Kumar Gangadhari, R. A Review of Digital Transformation on Supply Chain Process Management Using Text Mining. Processes 2022, 10, 842. [Google Scholar] [CrossRef] [Scilit]
  20. Khalifa, R.; Aljuhmani, H.Y. Interplay of Industrial Robots, Education, and Environmental Sustainability in United States: A Quantile-Based Investigation. Sustainability 2025, 17, 10255. [Google Scholar] [CrossRef] [Scilit]
  21. Almuammari, K.; Iyiola, K.; Alzubi, A.; Aljuhmani, H.Y. AI-Powered Insights: How Digital Supply Networks and Public–Private Alliances Shape Socio-Economic Paths to Sustainability. Systems 2025, 13, 691. [Google Scholar] [CrossRef] [Scilit]
  22. Kumar, D.; Singh, R.K.; Mishra, R.; Wamba, S.F. Applications of the internet of things for optimizing warehousing and logistics operations: A systematic literature review and future research directions. Comput. Ind. Eng. 2022, 171, 108455. [Google Scholar] [CrossRef] [Scilit]
  23. Durman, S.; Iyiola, K.; Alzubi, A.B.; Aljuhmani, H.Y. Dynamic capabilities in action: Digital capability, business model innovation and absorptive capacity. Manag. Decis. 2025, 1–36. [Google Scholar] [CrossRef] [Scilit]
  24. Queiroz, M.M.; Pereira, S.C.F.; Telles, R.; Machado, M.C. Industry 4.0 and digital supply chain capabilities: A framework for understanding digitalisation challenges and opportunities. Benchmarking An. Int. J. 2021, 28, 1761–1782. [Google Scholar]
  25. Xia, W.; Apergis, N.; Bashir, M.F.; Ghosh, S.; Doğan, B.; Shahzad, U. Investigating the role of globalization, and energy consumption for environmental externalities: Empirical evidence from developed and developing economies. Renew. Energy 2022, 183, 219–228. [Google Scholar] [CrossRef] [Scilit]
  26. Song, M.; Zhao, X.; Shang, Y. The impact of low-carbon city construction on ecological efficiency: Empirical evidence from quasi-natural experiments. Resour. Conserv. Recycl. 2020, 157, 104777. [Google Scholar] [CrossRef] [Scilit]
  27. Yuan, G.; Ye, Q.; Sun, Y. Financial innovation, information screening and industries’ green innovation—Industry-level evidence from the OECD. Technol. Forecast. Soc. Change 2021, 171, 120998. [Google Scholar] [CrossRef] [Scilit]
  28. Alam, W.; Afjal, M.; Moeed, A. Technological innovation as a moderator in the nexus between economic growth and environmental quality: Evidence from Kuwait. Futur Bus. J. 2026, 12, 17. [Google Scholar] [CrossRef] [Scilit]
  29. Alsayegh, O.A. Barriers facing the transition toward sustainable energy system in Kuwait. Energy Strategy Rev. 2021, 38, 100779. [Google Scholar] [CrossRef] [Scilit]
  30. Jamaledini, A.; Bayat, A. Examining the utilization of clean energies for sustainable development: A case study of Saudi Arabia, United Arab Emirates, and Qatar. MPRA 2024, 123077. [Google Scholar]
  31. Chen, Y.-S. The driver of green innovation and green image–green core competence. J. Bus. Ethics 2008, 81, 531–543. [Google Scholar]
  32. Albaker, A.; Abbasi, K.R.; Haddad, A.M.; Radulescu, M.; Manescu, C.; Bondac, G.T. Analyzing the impact of renewable energy and green innovation on carbon emissions in the MENA region. Energies 2023, 16, 6053. [Google Scholar] [CrossRef] [Scilit]
  33. Shan, S.; Genç, S.Y.; Kamran, H.W.; Dinca, G. Role of green technology innovation and renewable energy in carbon neutrality: A sustainable investigation from Turkey. J. Environ. Manag. 2021, 294, 113004. [Google Scholar] [CrossRef] [Scilit]
  34. Li, Z.; Hu, B.; Bao, Y.; Wang, Y. Supply chain digitalization, green technology innovation and corporate energy efficiency. Energy Econ. 2025, 142, 108153. [Google Scholar] [CrossRef] [Scilit]
  35. Ma, J.; Li, Q.; Zhao, Q.; Liou, J.; Li, C. From bytes to green: The impact of supply chain digitization on corporate green innovation. Energy Econ. 2024, 139, 107942. [Google Scholar] [CrossRef] [Scilit]
  36. Jiang, G.; Peng, J.; Liang, X.; Pan, J. Supply chain digitization and continuous green innovation: Evidence from China. Energy Econ. 2025, 142, 108158. [Google Scholar] [CrossRef] [Scilit]
  37. Zhang, S.; Niu, Y.; Zhang, J.; Li, J.; Wang, S.; Guan, Y. Effects of Supply Chain Digitization on Different Types of Corporate Green Innovation: Empirical Evidence from Double Machine Learning (DML). Sustainability 2025, 17, 7509. [Google Scholar] [CrossRef] [Scilit]
  38. Qiu, W.; Liang, Q.; Shao, L.; Li, M.; Wang, C. Digitizing supply chains for regional green consumption: A path to environmental sustainability and green innovation. J. Environ. Manag. 2026, 401, 128820. [Google Scholar] [CrossRef] [Scilit] [PubMed]
  39. Shah, S.F.A.; Pan, H.; Cui, Z.; Yang, W.; Ye, L. Driving green innovation in SMEs: The mediating role of digital green supply chains and complementary capabilities. Technol. Soc. 2026, 87, 103383. [Google Scholar] [CrossRef] [Scilit]
  40. Jie, X.; Wah, K.K.; Lixing, B. Supply Chain Digitalization and its Impact on Green Innovation in Enterprises. Int. J. Acad. Res. Econ. Manag. Sci. 2026, 15, 529–546. [Google Scholar] [CrossRef] [Scilit]
  41. Li, J.; Ren, H.; Zhang, C.; Li, Q.; Duan, K. Substantive Innovation or Strategic Innovation? Research on Multiplayer Stochastic Evolutionary Game Model and Simulation. Complexity 2020, 2020, 9640412. [Google Scholar] [CrossRef] [Scilit]
  42. Gu, J. Did supply chain digitization contribute to corporate green energy innovation? The mediating role of asset receivable management and policy spillovers. Energy Econ. 2025, 143, 108274. [Google Scholar] [CrossRef] [Scilit]
  43. Luo, S.; Xiong, Z.; Liu, J. How does supply chain digitization affect green innovation? Evidence from a quasi-natural experiment in China. Energy Econ. 2024, 136, 107745. [Google Scholar] [CrossRef] [Scilit]
  44. Cheng, W.; Li, Q.; Wu, Q.; Ye, F.; Jiang, Y. Digital capability and green innovation: The perspective of green supply chain collaboration and top management’s environmental awareness. Heliyon 2024, 10, e32290. [Google Scholar] [CrossRef] [Scilit] [PubMed]
  45. Sarkodie, S.A.; Owusu, P.A. Escalation effect of fossil-based CO2 emissions improves green energy innovation. Sci. Total Environ. 2021, 785, 147257. [Google Scholar] [CrossRef] [Scilit] [PubMed]
  46. Yu, H.; Jiang, Y.; Zhang, Z.; Shang, W.-L.; Han, C.; Zhao, Y. The impact of carbon emission trading policy on firms’ green innovation in China. Financ. Innov. 2022, 8, 55. [Google Scholar] [CrossRef] [Scilit]
  47. Chen, Y.; Yao, Z.; Zhong, K. Do environmental regulations of carbon emissions and air pollution foster green technology innovation: Evidence from China’s prefecture-level cities. J. Clean. Prod. 2022, 350, 131537. [Google Scholar] [CrossRef] [Scilit]
  48. Thi, D.M.-T.; Do, T.T.-P. The interrelationships between carbon dioxide emissions and innovation: International evidence. Int. J. Sustain. Energy 2024, 43, 2352515. [Google Scholar] [CrossRef] [Scilit]
  49. Peng, X.; Wu, J.; Chen, Y.; Sumran, A.; Xie, Q. Does the carbon emission trading pilot policy promote green innovation cooperation? Evidence from a quasi-natural experiment in China. Financ. Innov. 2024, 10, 14. [Google Scholar] [CrossRef] [Scilit]
  50. Rahman, M.A.; Ahmad, R.; Ismail, I. Does the US regional greenhouse gas initiative affect green innovation? Environ. Sci. Pollut. Res. 2022, 30, 15689–15707. [Google Scholar] [CrossRef] [Scilit] [PubMed]
  51. Yuan, B.; Li, C.; Yin, H.; Zeng, M. Green innovation and China’s CO2 emissions—The moderating effect of institutional quality. J. Environ. Plan. Manag. 2022, 65, 877–906. [Google Scholar] [CrossRef] [Scilit]
  52. Vitenu-Sackey, P.A.; Acheampong, T. Impact of economic policy uncertainty, energy intensity, technological innovation and R&D on CO2 emissions: Evidence from a panel of 18 developed economies. Environ. Sci. Pollut. Res. 2022, 29, 87426–87445. [Google Scholar] [CrossRef] [Scilit] [PubMed]
  53. Wu, P.; Wang, Z. Porter Hypothesis Test of Carbon Market and Motivation Analysis: Evidence from China. SSRN 2023. [Google Scholar] [CrossRef] [Scilit]
  54. Fethi, S.; Rahuma, A. The role of eco-innovation on CO2 emission reduction in an extended version of the environmental Kuznets curve: Evidence from the top 20 refined oil exporting countries. Environ. Sci. Pollut. Res. 2019, 26, 30145–30153. [Google Scholar] [CrossRef] [Scilit] [PubMed]
  55. Umar Farooq, M.; Amin, A.; Peng, S.; Işık, C.; Aqdas, R.; Akbar, M.; Sabahat, G.; Ongan, S. Role of Innovations to Mitigate CO2e: Theory and Evidence for European Economies. Sustainability 2023, 15, 7618. [Google Scholar] [CrossRef] [Scilit]
  56. Han, H.; Wang, X.; Mahmood, A.; Li, Z. Does innovation in Environmental Technologies Curb CO2 Emissions? Evidence From Advanced Time Series Techniques. Front. Environ. Sci. 2022, 10, 930521. [Google Scholar] [CrossRef] [Scilit]
  57. Qi, X.; Yang, Z. Drivers of green innovation in BRICS countries: Exploring tripple bottom line theory. Econ. Res.-Ekon. Istraž. 2023, 36, 2150670. [Google Scholar] [CrossRef] [Scilit]
  58. Yuan, Y. The Impact of Capital Globalization on Green Innovation: A Cross-Country Empirical Analysis. In Applied Economics and Policy Studies, Proceedings of the 7th International Conference on Economic Management and Green Development; Li, X., Yuan, C., Kent, J., Eds.; Springer Nature: Singapore, 2024; pp. 1054–1063. [Google Scholar] [CrossRef] [Scilit]
  59. Xuan, S.; Song, D.; You, G. Financial risk prevention and corporate green innovation: A quasi-natural experiment based on the new asset management regulation. Pac.-Basin Financ. J. 2024, 88, 102566. [Google Scholar] [CrossRef] [Scilit]
  60. Wedajo, A.D.; Bhat, M.A.; Tiwari, C.K.; Khan, S.T. Financial globalization and sustainability: Examining ESG metrics and green innovation in Chinese firms. Manag. Sustain. Arab Rev. 2025, 1–23. [Google Scholar] [CrossRef] [Scilit]
  61. Ramzan, M.; Razi, U.; Quddoos, M.U.; Adebayo, T.S. Do green innovation and financial globalization contribute to the ecological sustainability and energy transition in the United Kingdom? Policy insights from a bootstrap rolling window approach. Sustain. Dev. 2023, 31, 393–414. [Google Scholar] [CrossRef] [Scilit]
  62. Fotio, H.K.; Nchofoung, T.N.; Asongu, S.A. Financing renewable energy generation in SSA: Does financial integration matter? Renew. Energy 2022, 201, 47–59. [Google Scholar] [CrossRef] [Scilit]
  63. Khan, S.; Ullah, A.; Liu, Y.; Kashif, M. Examining the blockchain and green innovation technologies on sustainability (ESG): The moderating role of global financial integration. J. Sustain. Financ. Invest. 2025, 15, 145–181. [Google Scholar] [CrossRef] [Scilit]
  64. Adebayo, T.S. Analyzing the environmental impact of financial innovation and financial globalization in Finland: A time-frequency approach. Financ. Innov. 2026, 12, 41. [Google Scholar] [CrossRef] [Scilit]
  65. Yuan, C.; Xiao, T.; Geng, C.; Sheng, Y. Digital transformation and division of labor between enterprises: Vertical specialization or vertical integration. China Ind. Econ. 2021, 9, 137–155. [Google Scholar] [CrossRef]
  66. Teece, D.J.; Pisano, G.; Shuen, A. Dynamic capabilities and strategic management. Strateg. Manag. J. 1997, 18, 509–533. [Google Scholar] [CrossRef] [Scilit]
  67. Abuseta, H.; Iyiola, K.; Aljuhmani, H.Y. Digital Technologies and Business Model Innovation in Turbulent Markets: Unlocking the Power of Agility and Absorptive Capacity. Sustainability 2025, 17, 5296. [Google Scholar] [CrossRef] [Scilit]
  68. Bhattacharya, S.; Chatterjee, A. Digital project driven supply chains: A new paradigm. Supply Chain. Manag. Int. J. 2022, 27, 283–294. [Google Scholar]
  69. Yang, M.; Fu, M.; Zhang, Z. The adoption of digital technologies in supply chains: Drivers, process and impact. Technol. Forecast. Soc. Change 2021, 169, 120795. [Google Scholar] [CrossRef] [Scilit]
  70. Liao, J.; Liu, X.; Zhou, X.; Tursunova, N.R. Analyzing the role of renewable energy transition and industrialization on ecological sustainability: Can green innovation matter in OECD countries. Renew. Energy 2023, 204, 141–151. [Google Scholar] [CrossRef] [Scilit]
  71. Caglar, A.E.; Avci, S.B.; Ahmed, Z.; Gökçe, N. Assessing the role of green investments and green innovation in ecological sustainability: From a climate action perspective on European countries. Sci. Total Environ. 2024, 928, 172527. [Google Scholar] [CrossRef] [Scilit] [PubMed]
  72. OECD. Patents: Development of Environment-Related Technologies (Index). 2025. Available online: https://data-explorer.oecd.org/vis?lc=en&tm=DF_PAT_IND&pg=0&snb=1&vw=tb&df[ds]=dsDisseminateFinalDMZ&df[id]=DSD_PAT_IND%40DF_PAT_IND&df[ag]=OECD.ENV.EPI&df[vs]=&pd=1990%2C2022&dq=ARE.A..DEV..&ly[rw]=TECH&ly[cl]=TIME_PERIOD&to[TIME_PERIOD]=false (accessed on 1 May 2026).
  73. World Bank. World Bank Open Data. 2025. Available online: https://data.worldbank.org/ (accessed on 1 May 2026).
  74. Energy Institute. Emissions (MTCO2). 2025. Available online: https://www.energyinst.org/statistical-review/energy-charting-tool/energy-charting-tool (accessed on 1 May 2026).
  75. KOF. KOF Globalization Index. 2025. Available online: https://kof.ethz.ch/en/forecasts-and-indicators/indicators/kof-globalisation-index.html (accessed on 1 May 2026).
  76. Abu Khazam, M.; Khadem, A.; Alzubi, A.B. A Frequency Domain Causality Approach Towards the Management of Supply Chain Digitalization and Environmental Quality in Saudi Arabia: What Is the Role of Green Innovation? Sustainability 2026, 18, 2527. [Google Scholar] [CrossRef] [Scilit]
  77. Wu, W.; Bi, S.; Zhan, Y.; Gu, X. Supply chain digitalization and energy efficiency (gas and oil): How do they contribute to achieving carbon neutrality targets? Energy Econ. 2025, 142, 108140. [Google Scholar] [CrossRef] [Scilit]
  78. Sim, N.; Zhou, H. Oil prices, US stock return, and the dependence between their quantiles. J. Bank. Financ. 2015, 55, 1–8. [Google Scholar] [CrossRef] [Scilit]
  79. Zhang, W.; Bakhsh, S.; Ali, K.; Anas, M. Fostering environmental sustainability: An analysis of green investment and digital financial inclusion in China using quantile-on-quantile regression and wavelet coherence approach. Gondwana Res. 2024, 128, 69–85. [Google Scholar] [CrossRef] [Scilit]
  80. Adebayo, T.S.; Özkan, O. Investigating the influence of socioeconomic conditions, renewable energy and eco-innovation on environmental degradation in the United States: A wavelet quantile-based analysis. J. Clean. Prod. 2024, 434, 140321. [Google Scholar] [CrossRef] [Scilit]
  81. Dickey, D.A.; Fuller, W.A. Distribution of the Estimators for Autoregressive Time Series with a Unit Root. J. Am. Stat. Assoc. 1979, 74, 427–431. [Google Scholar] [CrossRef] [Scilit]
  82. Phillips, P.C.B.; Perron, P. Testing for a unit root in time series regression. Biometrika 1988, 75, 335–346. [Google Scholar] [CrossRef]
  83. Su, H.-N.; Moaniba, I.M. Does innovation respond to climate change? Empirical evidence from patents and greenhouse gas emissions. Technol. Forecast. Soc. Change 2017, 122, 49–62. [Google Scholar] [CrossRef] [Scilit]
  84. Wang, W.; Li, Y.; Lu, N.; Wang, D.; Jiang, H.; Zhang, C. Does increasing carbon emissions lead to accelerated eco-innovation? Empirical evidence from China. J. Clean. Prod. 2020, 251, 119690. [Google Scholar] [CrossRef] [Scilit]
  85. Lee, K.-H.; Min, B.; Yook, K.-H. The impacts of carbon (CO2) emissions and environmental research and development (R&D) investment on firm performance. Int. J. Prod. Econ. 2015, 167, 1–11. [Google Scholar] [CrossRef] [Scilit]
  86. Linnenluecke, M.K.; Smith, T.; McKnight, B. Environmental finance: A research agenda for interdisciplinary finance research. Econ. Model. 2016, 59, 124–130. [Google Scholar] [CrossRef] [Scilit]
  87. Luo, S.; Yimamu, N.; Li, Y.; Wu, H.; Irfan, M.; Hao, Y. Digitalization and sustainable development: How could digital economy development improve green innovation in China? Bus. Strategy Environ. 2023, 32, 1847–1871. [Google Scholar] [CrossRef] [Scilit]
  88. Sharif, A.; Saqib, N.; Dong, K.; Khan, S.A.R. Nexus between green technology innovation, green financing, and CO2 emissions in the G7 countries: The moderating role of social globalisation. Sustain. Dev. 2022, 30, 1934–1946. [Google Scholar] [CrossRef] [Scilit]
  89. Lee, K.L.; Teong, C.X.; Alzoubi, H.M.; Alshurideh, M.T.; Khatib, M.E.; Al-Gharaibeh, S.M. Digital supply chain transformation: The role of smart technologies on operational performance in manufacturing industry. Int. J. Eng. Bus. Manag. 2024, 16, 18479790241234986. [Google Scholar] [CrossRef] [Scilit]
  90. Ma, L.; Chang, R. How big data analytics and artificial intelligence facilitate digital supply chain transformation: The role of integration and agility. Manag. Decis. 2025, 63, 3557–3598. [Google Scholar] [CrossRef] [Scilit]
  91. Paramati, S.R.; Mo, D.; Huang, R. The role of financial deepening and green technology on carbon emissions: Evidence from major OECD economies. Financ. Res. Lett. 2021, 41, 101794. [Google Scholar] [CrossRef] [Scilit]
Figure 1. Methodological structure.
Sustainability 18 07309 g001
Figure 2. MQQ analysis.
Sustainability 18 07309 g002
Figure 3. SCD and GINV nexus.
Sustainability 18 07309 g003
Figure 4. CO2 and GINV nexus.
Sustainability 18 07309 g004
Figure 5. FIG and GINV nexus.
Sustainability 18 07309 g005
Figure 6. Impact of SCD on GINV.
Sustainability 18 07309 g006
Figure 7. Impact of CO2 on GINV.
Sustainability 18 07309 g007
Figure 8. Impact of FIG on GINV.
Sustainability 18 07309 g008
Figure 9. WQC between GINV and SCD.
Sustainability 18 07309 g009
Figure 10. WQC between GINV and CO2.
Sustainability 18 07309 g010
Figure 11. WQC between GINV and FIG.
Sustainability 18 07309 g011
Table 1. Literature review summary.
Author(s)YearCountriesMethod(s)Results
An et al. [4]2011–2020ChinaDIDSCD +
Ma et al. [35]2012–2022Chinese Listed FirmsDIDSCD +
Yue [10]2010–2022Publicly Trade Firms in ChinaDIDSCD +
Jiang et al. [36]2013–2022Chinese Listed FirmsEvent Study & DIDSCD +
Zhang et al. [37]2007–2023Chinese Listed CompaniesMachine Learning ModelsSCD +
Qiu et al. [38]2011–2022Chinese Listed FirmsMechanism AnalysisSCD +
Shah et al. [39]2003–2023European UnionSystem GMMSCD +
Sarkodie & Owusu [45]1975–201421 Industrialized High-IncomePanel-Based Causality EstimatorGHGs +
Yu et al. [46]2009–2019ChinaDIDCO2 +
Chen et al. [47]2004–2016ChinaRegression Analysis CO2 +
Thi & Do [48]1996–202071SEM & 3SLS CO2 +
Xiaobao et al. [49]2008–2020ChinaDIDCO2 +
Abid et al. [7] 2000–2019AdvancedGMMFIG +
Qi & Yang [57]1990–2019BRICSCS-ARDLFIG +
Yuan [58]2000–20208 AdvancedMultiple Regressions & Quantile RegressionFIG +
Xuan et al. [59]2010–2021Chinese A-share Listed CompaniesDIDFIG +
+ denotes a positive relationship.
Table 3. Descriptive statistics.
GINVSCDCO2FIG
Mean3.316759−2.1447954.3741474.190544
Median3.383238−1.9936434.4292334.210272
Maximum4.233607−1.2378744.5751234.304065
Minimum1.499090−3.2188763.8768103.970292
Std. Dev.0.6121560.5075940.1929250.101198
Skewness−0.533056−0.235815−1.385872−0.713022
Kurtosis2.9029531.8283883.9989172.187546
Jarque–Bera4.3930456.11458533.2748610.32578
Probability0.1111890.0470150.0000000.005725
Observations92929292
Table 4. Correlation matrix.
GINVSCDCO2FIG
GINV1
SCD0.5104301
CO2−0.1585370.5111721
FIG0.0363700.5875470.8543051
Table 5. Non-linearity test.
VariablesGINVSCDCO2FIG
M20.140354 ***0.172384 ***0.200421 ***0.198513 ***
M30.218431 ***0.282475 ***0.339359 ***0.335399 ***
M40.254788 ***0.350578 ***0.434666 ***0.428602 ***
M50.267977 ***0.387943 ***0.498712 ***0.491726 ***
M60.267250 ***0.404287 ***0.540623 ***0.535031 ***
*** indicates a significance level of 1%.
Table 6. Unit root analysis.
ADFPP
VariablesI(0)I(1)I(0)I(1)
GINV−3.285073 **−5.757822 ***−2.609479 *−5.757822 ***
SCD−2.760205 *−4.073845 ***−2.480079−4.285166 ***
CO2−3.307994 **−2.739042 *−2.931653 **−4.029334 **
FIG−2.430537−2.923669 **−0.900601−3.039301 **
*, **, and *** are significant at the p-values of 10%, 5%, and 1%, respectively.
Disclaimer/Publisher’s Note: The statements, opinions and data contained in all publications are solely those of the individual author(s) and contributor(s) and not of MDPI and/or the editor(s). MDPI and/or the editor(s) disclaim responsibility for any injury to people or property resulting from any ideas, methods, instructions or products referred to in the content.