Article

Artificial Intelligence and Corporate Sustainability Disclosure: Evidence from Corporate Climate Risk Disclosure in China

1
School of Economics and Finance, Xi’an Jiaotong University, Xi’an 710061, China
2
Department of Economics, Duke University, Durham, NC 27707, USA
*
Author to whom correspondence should be addressed.
Sustainability 2026, 18(14), 7313; https://doi.org/10.3390/su18147313
Submission received: 15 June 2026 / Revised: 14 July 2026 / Accepted: 14 July 2026 / Published: 17 July 2026
(This article belongs to the Section Economic and Business Aspects of Sustainability)

Abstract

As artificial intelligence becomes more deeply embedded in corporate sustainability governance, it remains unclear whether public policies centered on AI development are linked to changes in corporate sustainability disclosure. Focusing on corporate climate risk disclosure as an important dimension of sustainability disclosure, this study examines how China’s National Artificial Intelligence Innovation and Development Pilot Zone policy, referred to as the AI Pilot Zone policy, is associated with firms’ disclosure of climate-related risks. Using Chinese A-share listed firms from 2014 to 2023 and a multi-period difference-in-differences approach, we find that the AI Pilot Zone policy is associated with higher levels of corporate climate risk disclosure. A series of robustness checks further confirms the stability of this finding. Mechanism analysis provides suggestive evidence consistent with three channels: climate-related information-processing capability, climate risk governance capability, and external monitoring pressure. The subsample estimates reveal that the association is more pronounced among firms under greater environmental pressure, firms with higher levels of institutional ownership, and firms whose managers exhibit stronger green awareness. Additional analysis suggests that climate risk disclosure is positively associated with ESG performance, especially environmental and governance performance. This study contributes firm-level empirical evidence on the association between AI-oriented public policies and corporate climate risk disclosure, while highlighting the need to distinguish disclosure improvement from substantive sustainability transformation.

1. Introduction

Corporate sustainability disclosure has become central to corporate non-financial reporting [1]. Through such disclosure, firms communicate their economic, environmental, and social performance to investors, regulators, and other stakeholders. Among various types of sustainability information, climate risk disclosure has received increasing attention because climate change creates physical and transition risks that may materially affect firms’ operations, asset values, financing conditions, and long-term competitiveness [2,3,4,5]. In this study, climate risk disclosure refers to firms’ disclosure of climate-related risks, governance arrangements, risk management practices, and climate-related metrics or targets. It is a specific dimension of sustainability disclosure, but it differs from broader sustainability, environmental, or ESG disclosure because it is more forward-looking and risk-oriented. Accordingly, climate-related disclosure is becoming increasingly institutionalized and standardized worldwide [6]. The International Sustainability Standards Board (ISSB) issued IFRS S2 Climate-related Disclosures, providing a global benchmark for climate-related reporting. In China, the Shanghai, Shenzhen, and Beijing Stock Exchanges issued sustainability reporting guidelines for listed companies in 2024, and the Ministry of Finance and the Ministry of Ecology and Environment released the exposure draft of Corporate Sustainability Disclosure Standard No. 1—Climate (Trial) in April 2025. These developments indicate that climate risk disclosure is becoming an essential part of corporate sustainability governance. High-quality climate risk disclosure requires firms to identify climate-related risks, process complex environmental and operational information, and provide credible and decision-useful disclosure content [7]. Therefore, understanding how to improve corporate climate risk disclosure is important for green development, investor protection, and corporate sustainability governance [8,9].
With the continuous development of digital technologies, artificial intelligence has increasingly emerged as a key driver of changes in corporate production processes, managerial practices, and governance structures [10,11]. Unlike conventional digital technologies, AI is better equipped to collect data, process information, identify patterns, and support decision-making [12,13]. These advantages are particularly relevant to climate risk disclosure, which requires firms to process fragmented and often unstructured information from multiple sources, including operational data, environmental management records, climate-related policies, market expectations, and physical climate risk signals [14,15]. Rather than focusing on AI as a general efficiency-enhancing technology, this study emphasizes its role in reorganizing firms’ information environments under policy intervention.
However, AI should not be understood as a neutral, costless, or inherently sustainability-enhancing technology. Critical studies of AI, datafication, and algorithmic governance show that algorithmic systems may reproduce unequal power relations, reinforce social exclusion, and create new forms of data-driven power [16,17,18,19]. They also remind us that AI development is embedded in material and infrastructural systems and may entail substantial social–ecological costs [20,21]. From this perspective, an exclusive focus on AI as an information-processing tool may risk falling into technological solutionism [22,23]. Accordingly, this study does not assume that AI inherently improves sustainability outcomes; instead, it focuses on whether AI-oriented public policy reshapes corporate disclosure behavior.
Designed to advance AI infrastructure, data resource integration, and industrial digital transformation, the AI Pilot Zone policy creates a suitable empirical context for exploring this issue. Importantly, this policy not only enhances technological conditions but may also reshape firms’ external information environment by increasing visibility to regulators, investors, analysts, and the media. This raises an important research question: is the AI Pilot Zone policy associated with higher levels of corporate climate risk disclosure? Using Chinese A-share listed firms as the research sample, this study draws on the staggered city-level implementation of the AI Pilot Zone policy and adopts a multi-period DID design to examine this question. The empirical evidence shows a positive association between the AI Pilot Zone policy and corporate climate risk disclosure. Mechanism tests further suggest three channels: information-processing capability, climate governance capability, and external monitoring pressure. Heterogeneity analysis shows that the effect is more pronounced among firms facing higher environmental pressure, firms with higher institutional investor ownership, and firms with stronger managerial green cognition. Further analysis suggests that climate risk disclosure is associated with better ESG performance, especially environmental and governance performance, and that the AI Pilot Zone policy strengthens this positive relationship.
The contributions of this study to the existing literature are threefold. First, it contributes to the literature on corporate sustainability disclosure by focusing on climate risk disclosure, a specific and increasingly important dimension of sustainability reporting. Compared with broader ESG disclosure, climate risk disclosure is more forward-looking and risk-oriented, capturing firms’ exposure to physical and transition risks. By focusing on a targeted disclosure dimension rather than general sustainability reporting, this study refines the understanding of disclosure heterogeneity under emerging policy environments.
Second, this study enriches research on the firm-level implications of artificial intelligence policies. Prior research has mainly focused on innovation, productivity, and firm performance, while the implications for sustainability governance remain underexplored. This study conceptualizes AI policy not merely as a productivity shock but as a governance-related information infrastructure that reshapes corporate disclosure incentives. Taking climate risk disclosure as the core outcome, the study suggests that AI policy is associated with firms’ environmental transparency and risk communication behavior.
Third, this study develops a unified framework for understanding the association between the AI Pilot Zone policy and corporate climate risk disclosure by identifying three channels: information-processing capability, climate governance capability, and external monitoring pressure. By incorporating both internal capability enhancement and external monitoring pressure, this multi-channel framework provides a broader analytical perspective on the relationship between AI-oriented governance and corporate sustainability behavior.
The paper is organized in the following manner. Section 2 lays out the literature review, theoretical logic, and research hypotheses. Section 3 explains the data sources, variable construction, and identification strategy. Section 4 provides the main empirical evidence. Section 5 explores the broader economic implications of the results. Section 6 provides the concluding discussion and outlines the policy implications.

2. Theoretical Analysis and Hypotheses

2.1. Literature Review

This study is related to three strands of literature. The first strand examines corporate sustainability disclosure. Sustainability disclosure is generally regarded as an important form of non-financial reporting through which firms communicate environmental, social, and governance-related information to stakeholders. Prior studies show that sustainability disclosure can reduce information asymmetry, improve stakeholder communication, and influence capital market outcomes [24,25,26]. With the development of sustainability reporting standards, scholars have further examined the economic consequences of mandatory and voluntary disclosure regimes, suggesting that regulatory requirements can improve transparency and stakeholder monitoring [27]. However, sustainability disclosure is a broad concept covering multiple dimensions, and different types of disclosure may vary significantly in information content and governance implications. Compared to general sustainability or environmental disclosure, climate risk disclosure is more forward-looking and uncertainty-oriented, as it reflects firms’ exposure to physical risks, transition risks, regulatory changes, technological adjustments, and long-term strategic responses [3]. Accordingly, climate risk disclosure represents a more specific and decision-relevant dimension of sustainability reporting that warrants separate investigation.
The second strand focuses on climate risk disclosure. Existing studies mainly examine its determinants, capital market consequences, and stakeholder demand. Climate-related disclosure contains value-relevant information because climate risks may affect firms’ cash flows, asset values, financing conditions, and long-term competitiveness. Matsumura et al. [28] find that both carbon emissions and carbon disclosure are reflected in firm value, and that non-disclosing firms face an additional market penalty. Ilhan et al. [29] show that institutional investors have a strong demand for climate risk disclosure and actively engage firms to improve disclosure quality. Recent evidence also suggests that climate risk disclosure is associated with better ESG performance by attracting green investors and promoting green innovation [30]. Overall, this strand highlights climate risk disclosure as both an information mechanism and a governance outcome responding to external stakeholder pressure. Nevertheless, existing research pays more attention to firm-level governance characteristics, investor demand, and conventional environmental regulation, yet existing research has provided limited evidence on whether public policies centered on AI development are associated with changes in firms’ climate-related disclosure practices.
The third strand relates to artificial intelligence and corporate outcomes. As a general-purpose technology, AI enhances firms’ capabilities in prediction, information processing, pattern recognition, and decision support [31]. Prior studies suggest that AI generates economic benefits when firms develop complementary organizational capabilities and adjust internal routines to technological change [32]. Prior empirical research has documented the relevance of AI adoption for multiple firm outcomes, including growth, productivity, innovation, employment structure, and market valuation [33,34]. A growing body of research has examined how AI relates to ESG performance, indicating that AI applications can assist firms in handling ESG-related data and advancing environmental management practices [35,36]. However, this literature primarily focuses on firm-level AI adoption or investment rather than policy-driven AI diffusion, and it largely examines broad corporate outcomes rather than specific disclosure behaviors. As a result, the implications of AI-oriented public policy for corporate climate risk disclosure remain underexplored.
Although these strands provide important foundations, several research gaps remain. First, existing studies often examine sustainability or environmental disclosure in a broad sense, while climate risk disclosure, as a more forward-looking and risk-oriented form of reporting, has received relatively limited attention. Second, the AI literature mainly focuses on firm-level adoption and general performance outcomes, with insufficient attention to how AI-related public policy affects corporate disclosure behavior. Third, the mechanisms through which AI-oriented public policy influences climate risk disclosure remain unclear. In response to these unresolved issues, this study uses the phased city-level implementation of China’s AI Pilot Zone policy as an empirical setting to examine whether corporate climate risk disclosure changes following policy adoption. It further investigates three channels: climate-related information-processing capability, climate risk governance capability, and external monitoring pressure.

2.2. AI Pilot Zone Policy and Corporate Climate Risk Disclosure

The AI Pilot Zone policy represents a major initiative in China to advance AI-enabled innovation, industrial adoption, and governance modernization. The construction of National New Generation Artificial Intelligence Innovation and Development Pilot Zones was formally guided by policy documents issued by the Ministry of Science and Technology in 2019. According to the policy design, these pilot zones are expected to conduct AI technology demonstrations, policy experiments, and social experiments, thereby generating replicable practices for the nationwide development of AI. Following its initial launch, the policy was expanded to different regions in multiple stages. By the end of 2021, China had established 17 national AI Pilot Zones, reflecting the gradual expansion of AI-oriented public policy across regions.
The AI Pilot Zone policy may create conditions that encourage firms to improve climate risk disclosure. Climate risk disclosure requires firms to identify climate-related risks, collect relevant internal and external information, and present such information in a structured and credible manner. Compared to traditional financial disclosure, climate risk disclosure is more complex and forward-looking because it involves physical risks, transition risks, regulatory changes, technological adjustments, and market expectations [3,4,37]. The Task Force on Climate-related Financial Disclosures similarly emphasizes that climate-related reporting should provide forward-looking and decision-useful information on corporate oversight, strategic responses, risk identification and control, and performance indicators. Accordingly, high-quality climate risk disclosure depends on both enhanced information-processing capabilities and more systematic governance arrangements.
The AI Pilot Zone policy can provide external technological and institutional support for firms to develop these capabilities. Artificial intelligence can enhance prediction, information processing, and decision support, especially when firms develop complementary organizational capabilities around new technologies [38]. By promoting AI infrastructure, AI applications, data integration, and intelligent decision-making, the AI Pilot Zone policy can help firms better identify, assess, and analyze climate-related risks [39].
Beyond improving firms’ internal capabilities, the AI Pilot Zone policy may also affect disclosure incentives through external information demand. Prior studies show that carbon emissions and carbon disclosure are reflected in firm value, suggesting that firms with weak or absent carbon-related disclosure may face unfavorable market valuation [40]. This implies that climate risk disclosure may serve as an important channel for enhancing corporate transparency and addressing stakeholders’ need for climate-related information. In addition, as policy-supported AI development areas, AI Pilot Zones may attract greater attention from governments, investors, analysts, and the media [41,42]. This external attention may increase firms’ disclosure pressure and encourage them to respond more actively to stakeholder demand for climate-related information. As a result, the AI Pilot Zone policy may be associated with higher levels of corporate climate risk disclosure by easing information-processing constraints, strengthening governance support, and increasing external disclosure incentives. Based on the above analysis, this study proposes the following hypothesis:
Hypothesis 1 (H1).
The AI Pilot Zone policy is positively associated with the level of corporate climate risk disclosure.

2.3. Mechanism Analysis

2.3.1. Climate-Related Information-Processing Capability

Firms’ climate-related information-processing capability may serve as one channel through which the AI Pilot Zone policy is associated with corporate climate risk disclosure. Climate-related information is often complex, forward-looking, and partly unstructured. It includes internal information on production, energy use, and environmental management, as well as external information on physical climate risks, transition risks, regulatory changes, technological adjustments, and market expectations. Consistent with this feature, the Task Force on the Climate-related Financial Disclosures (TCFD) framework emphasizes that climate-related disclosure should provide decision-useful and forward-looking information on governance, strategy, risk management, and metrics and targets [43]. Therefore, effective climate risk disclosure requires firms to identify relevant information, integrate heterogeneous data, analyze climate-related risks, and transform such information into credible disclosure content.
The AI Pilot Zone policy can be associated with stronger climate-related information-processing capability by improving the local digital and technological environment in which firms operate. As a city-level pilot policy, it encourages local governments to build AI infrastructure, expand data resources, promote AI application scenarios, and develop AI-related service ecosystems. These policy measures increase the local supply of AI tools, digital platforms, technical services, and skilled labor, thereby reducing firms’ costs of accessing and using intelligent technologies. The policy environment in pilot zones may encourage firms to deploy AI-related hardware, software, and digital management systems, which provide a stronger technological foundation for processing climate-related information.
At the firm level, stronger AI capability and digital transformation are associated with more efficient and accurate climate-related information processing. AI technologies can help firms collect environmental and operational data, recognize climate-related risk patterns, and support risk assessment and disclosure preparation [44,45]. Digital transformation further facilitates the integration of production, finance, energy use, and environmental management systems, enabling firms to convert fragmented information into more structured and decision-useful disclosure [46,47]. As a result, firms affected by the AI Pilot Zone policy are more capable of generating timely, credible, and forward-looking climate risk disclosure.
The above discussion gives rise to the following hypothesis:
Hypothesis 2 (H2).
The AI Pilot Zone policy is associated with higher levels of corporate climate risk disclosure by enhancing firms’ climate-related information-processing capability.

2.3.2. Climate Risk Governance Capability

The AI Pilot Zone policy may also be associated with corporate climate risk disclosure by strengthening firms’ substantive climate risk governance capability. Climate risk disclosure should not be viewed merely as an issue of information gathering or narrative reporting. Rather, it is closely linked to firms’ substantive responses and governance practices in identifying, managing, and addressing climate-related risks [48,49]. If firms do not take real actions in environmental management, low-carbon transition, or risk governance, their climate-related disclosure is likely to remain limited, symbolic, or less credible [50,51]. Therefore, stronger climate risk governance capability provides an important foundation for more substantive climate risk disclosure.
The AI Pilot Zone policy may be associated with improvements in firms’ climate risk governance capability by lowering the technical barriers and information frictions associated with green transformation. At the city level, the policy is associated with increased AI application scenarios, intelligent manufacturing, digital environmental monitoring, and industrial upgrading. These changes improve firms’ access to intelligent equipment, algorithm-based tools, data resources, and technical services [52]. As a result, firms can identify high-energy-consumption processes more accurately, monitor pollution emissions more effectively, and evaluate the potential benefits of green technology and environmental governance projects more clearly [53]. This makes climate-related problems more visible and manageable, and encourages firms to take more substantive governance actions.
Specifically, the AI Pilot Zone policy may be associated with higher levels of green innovation by improving firms’ ability to search for green knowledge, match technological resources with environmental needs, and reduce uncertainty in green R&D. With AI-supported data analysis and intelligent production systems, firms can better identify where cleaner technologies are needed, which production links should be improved, and how technological upgrading can reduce energy use and emissions [54,55,56]. This increases firms’ incentives and capacity to develop green technologies, apply for green patents, and improve low-carbon production processes. The policy may also increase environmental investment by improving firms’ ability to monitor, evaluate, and manage environmental problems [57]. Intelligent monitoring systems can provide more timely information on energy consumption, pollutant emissions, and environmental risks, while data analysis tools can help firms assess the costs and effectiveness of pollution control, energy conservation, and emission reduction projects [58]. When environmental problems become more measurable and the expected benefits of governance projects become clearer, firms may strengthen their investment in environmental management and protection.
Through green innovation and environmental investment, firms accumulate more concrete climate governance practices, data, and outcomes. These substantive actions not only improve firms’ ability to manage climate-related risks, but also provide richer and more credible content for climate risk disclosure. Therefore, firms affected by the AI Pilot Zone policy are more likely to disclose climate-related information because they have stronger climate governance capability and more real governance practices to report. This leads to the following hypothesis:
Hypothesis 3 (H3).
The AI Pilot Zone policy is positively associated with corporate climate risk disclosure through firms’ climate risk governance capability.

2.3.3. External Monitoring Pressure

The AI Pilot Zone policy may be associated with higher levels of corporate climate risk disclosure by increasing external monitoring pressure. Climate risk disclosure is closely related to the information needs of external stakeholders. Investors, analysts, the media, regulators, and the public rely on climate-related information to evaluate firms’ risk exposure, governance quality, and long-term sustainability. In capital markets, disclosure can reduce information asymmetry and help outside investors better understand firm value and risk [59]. For climate-related issues, institutional investors also show strong demand for more complete and comparable climate risk disclosure [60]. Therefore, stronger external monitoring can increase firms’ incentives to provide more transparent and credible climate risk disclosure.
The AI Pilot Zone policy can be associated with stronger external monitoring because it has a strong policy signal and demonstration effect [61]. As a national pilot policy, it reflects government support for AI development, regional innovation, and industrial upgrading. Cities selected as AI Pilot Zones may therefore receive greater attention from governments, investors, analysts, and the media. Firms located in these cities may also become more visible in capital markets, especially when they are viewed as potential beneficiaries or participants in AI-driven transformation [62]. This increased visibility can raise external stakeholders’ demand for information about firms’ technological transformation, environmental responsibility, and sustainability governance.
Analysts and the media are two important channels through which such external monitoring pressure affects corporate disclosure. Analysts collect, interpret, and transmit firm-specific information, and they play an important role in improving the corporate information environment [63]. When analyst attention increases, firms face stronger pressure to provide timely, transparent, and decision-useful disclosure in order to reduce information uncertainty. Meanwhile, the business press also acts as an important information intermediary in capital markets. Media attention can amplify public scrutiny and reputational pressure, especially when firms’ environmental performance and sustainability practices are involved. Recent research also finds that greater media attention is associated with stronger corporate environmental disclosure practices [64]. Therefore, firms affected by the AI Pilot Zone policy are more likely to exhibit higher levels of climate risk disclosure to respond to analyst demand, reduce information asymmetry, and protect their reputation under stronger public scrutiny.
The preceding analysis leads to the following hypothesis:
Hypothesis 4 (H4).
The AI Pilot Zone policy is associated with higher levels of corporate climate risk disclosure by increasing external monitoring pressure.
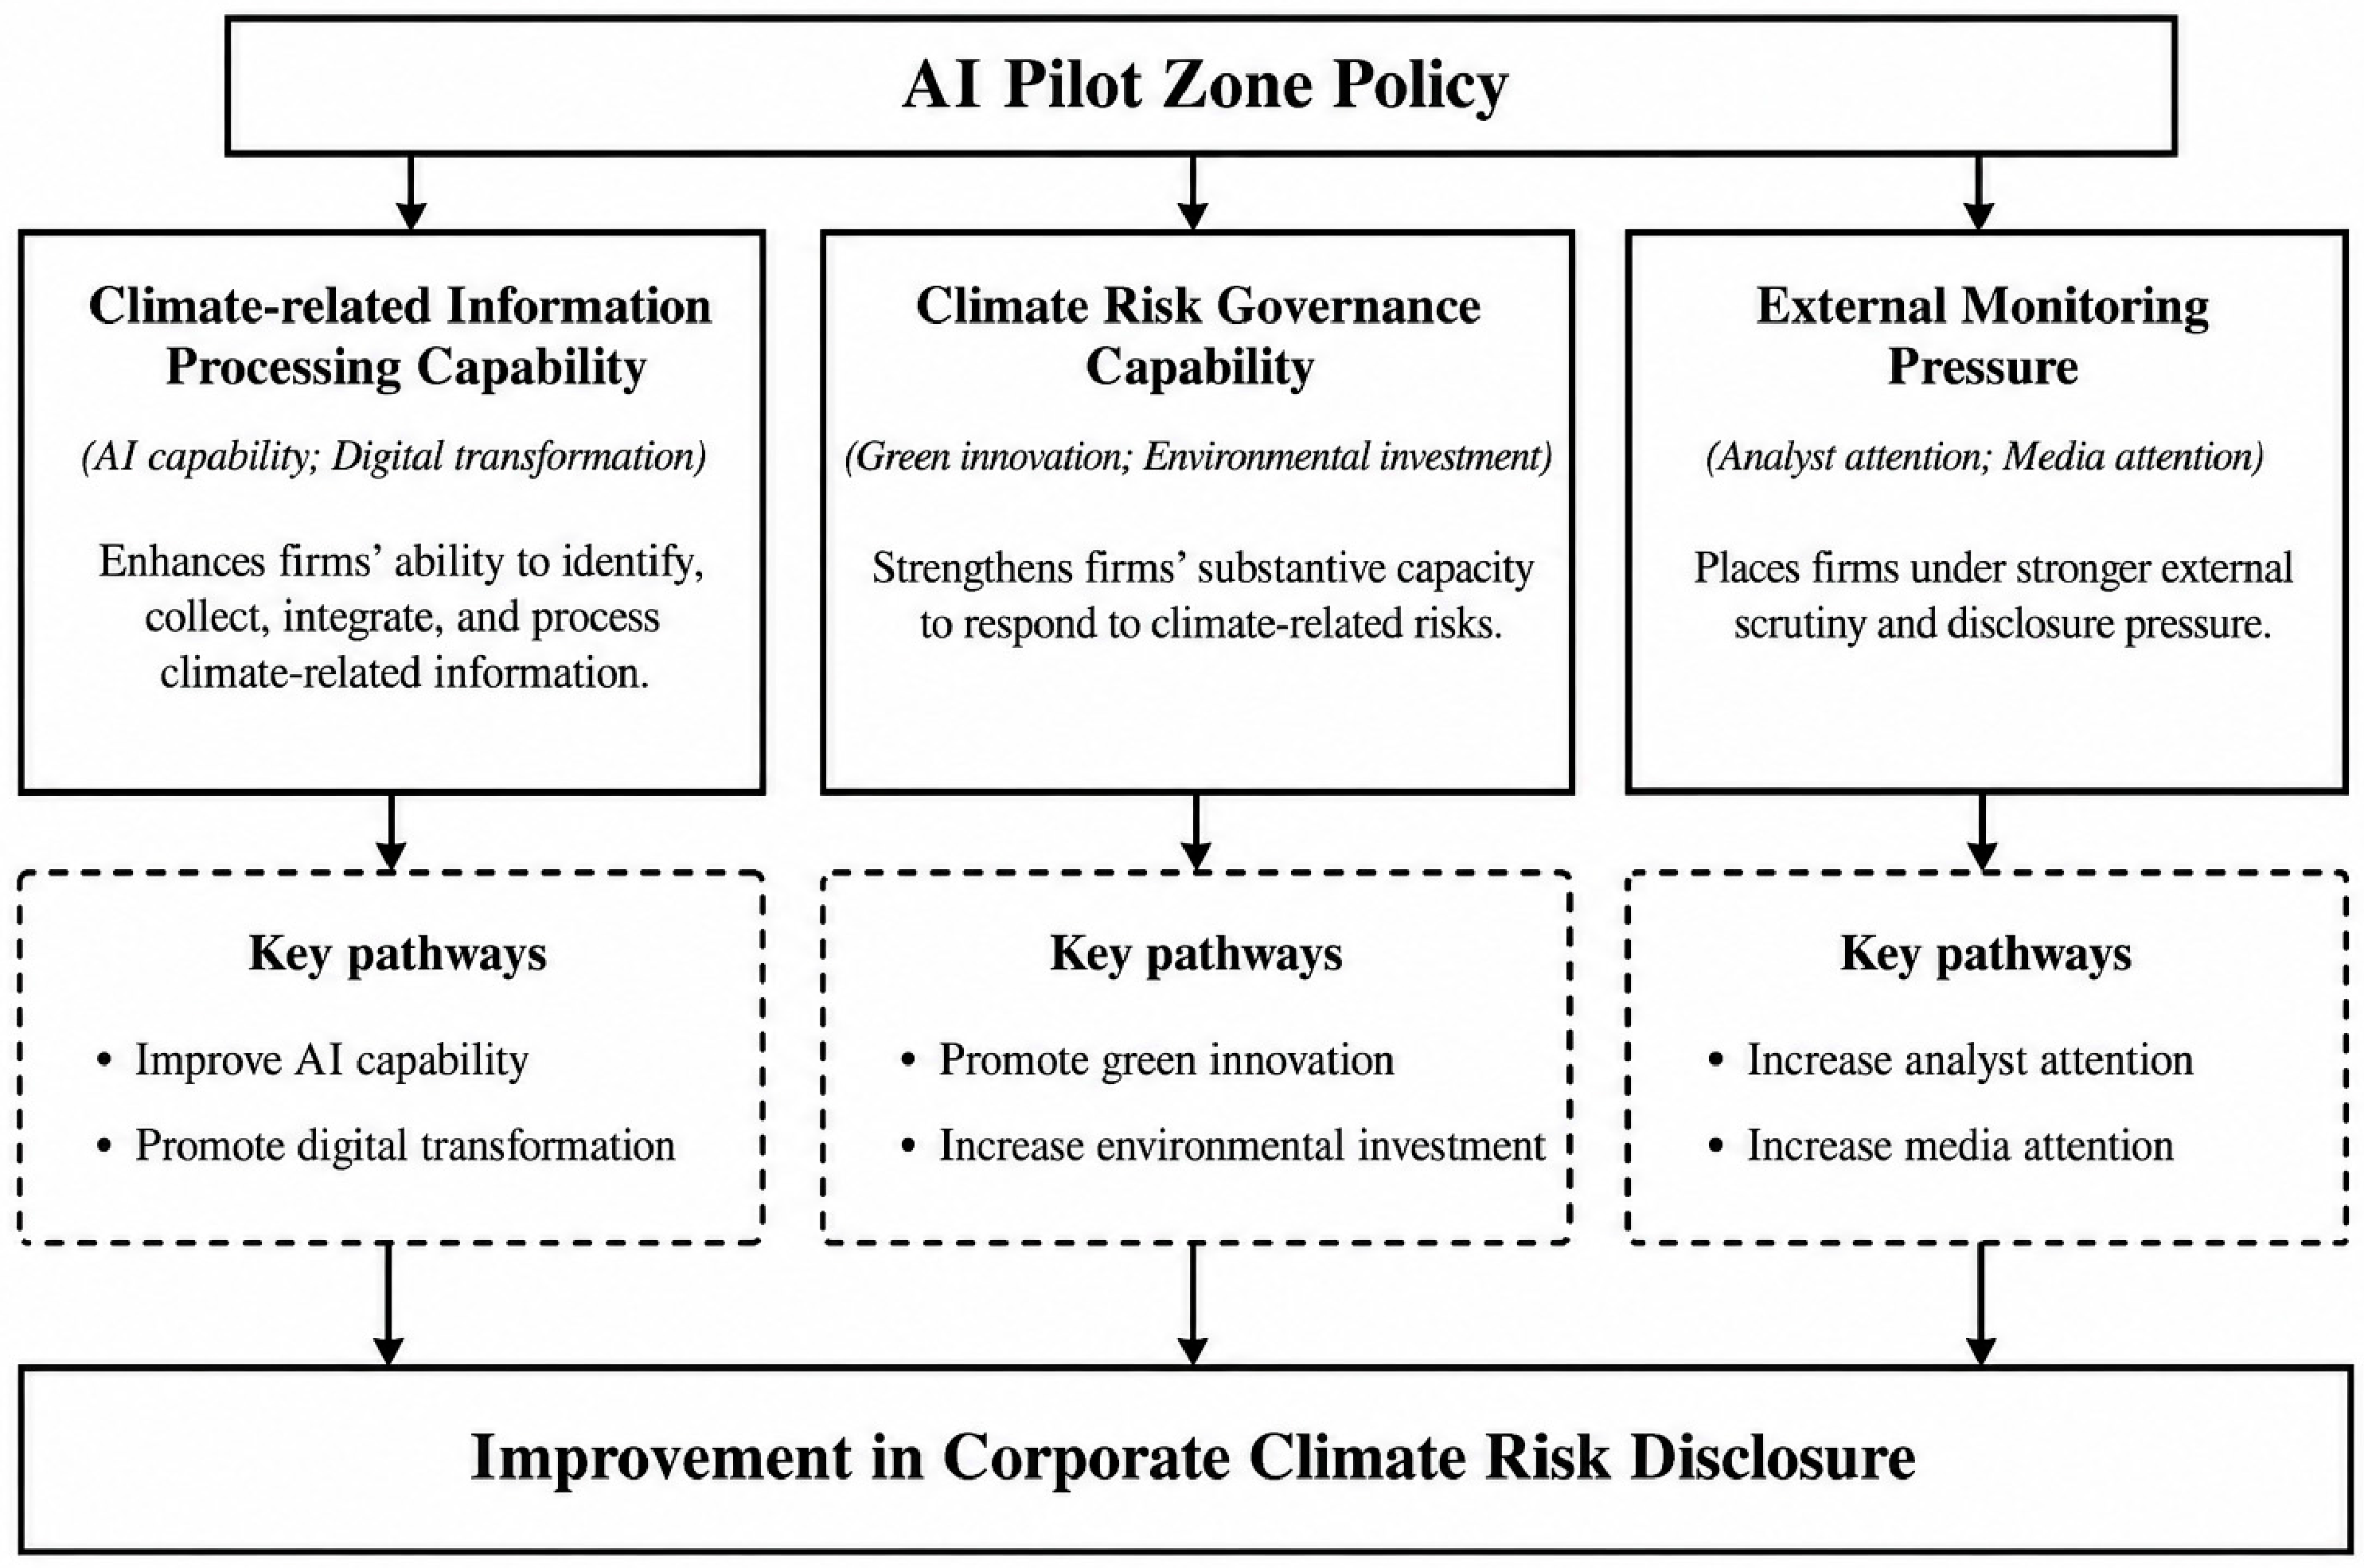
Figure 1 summarizes the theoretical framework developed in this study based on the above analysis.

3. Research Design

3.1. Model Construction

3.1.1. Baseline Regression Model

This study draws on the staggered implementation of the AI Pilot Zone policy across cities and employs a multi-period DID design to assess its association with corporate climate risk disclosure. The specification estimates the policy-related change in climate risk disclosure by comparing firms in AI Pilot Zone cities with those in non-pilot cities before and after policy implementation, while absorbing firm fixed effects and common year shocks.
C R D i t = α 0 + α 1 T r e a t i × P o s t t + α 2 C o n t r o l s i t + μ t + η i + ε i t
where C R D i t captures the extent of climate risk disclosure by firm i in year t. Treat is a dummy variable indicating whether firm i is located in a city covered by the AI Pilot Zone policy and Post is a dummy variable that equals one for the years after the policy implementation and zero otherwise. The interaction term T r e a t × P o s t denoted as D I D is the core explanatory variable, and its coefficient α 1 captures the estimated policy-related association with corporate climate risk disclosure. C o n t r o l s i t denotes the vector of control variables at both the firm and regional levels. Firm fixed effects μ i are included to absorb unobservable firm characteristics that do not vary over time, while year fixed effects η t capture shocks common to all firms in a given year. ε i t refers to the disturbance term.

3.1.2. Mediation Effect Model

To further examine the underlying mechanisms through which the AI Pilot Zone policy is associated with corporate climate risk disclosure, this study adopts a mediation analysis framework [65]. The mediation models are specified as follows:
M i t = β 0 + β 1 T r e a t i × P o s t t + β 2 C o n t r o l s i t + μ t + η i + ε i t
C R D i t = γ 0 + γ 1 T r e a t i × P o s t t + γ 2 M i t + γ 3 C o n t r o l s i t + μ t + η i + ε i t
where M i t denotes the mediating variable. Other variable definitions are unchanged from Equation (1).

3.2. Data Sources

The empirical sample consists of Chinese A-share listed companies observed between 2014 and 2023. Data are compiled from firm-level financial and governance databases, regional statistical yearbooks, and other relevant sources. Firm-level information is primarily obtained from the China Stock Market and Accounting Research (CSMAR) database and the Wind database, while city-level data are drawn from the China City Statistical Yearbook. The initial sample contains 39,971 firm–year observations. The sample period is determined based on the implementation background of the AI Pilot Zone policy and data availability. Since the AI Pilot Zone policy was first launched in 2019 and then gradually expanded across cities, the period from 2014 to 2023 provides a suitable window for empirical analysis: the years before 2019 allow this study to observe firms’ climate risk disclosure before the policy shock, while the years after 2019 capture changes during the implementation and expansion of the policy.
The initial sample is further screened to enhance comparability and reduce potential noise in the empirical analysis. Financial firms are first removed because of their distinctive accounting rules and regulatory characteristics. The sample further excludes ST, *ST, and PT firms, as their abnormal operating conditions and delisting risks may distort the empirical results. Observations with missing data for key variables are then removed. To mitigate the influence of extreme values, continuous variables are winsorized at the 1% and 99% levels. After these screening procedures, the final sample contains 28,297 firm–year observations. The final dataset therefore provides a relatively complete and comparable firm–year panel for the empirical analysis.

3.3. Variable Definitions

3.3.1. Dependent Variable: Climate Risk Disclosure (CRD)

To measure corporate climate risk disclosure, this study constructs a text-based variable, CRD. The analysis relies on the MD&A sections of annual reports of Chinese A-share listed firms, since this section usually reflects the management’s assessment of firm operations, potential risks, future strategies, and external uncertainties. It is therefore suitable for capturing firms’ narrative and forward-looking disclosure of climate-related risk information.
Following prior studies that measure climate-related disclosure and risk exposure using textual analysis [66,67,68], this study constructs a climate-related keyword dictionary based on the Task Force on the Climate-related Financial Disclosures (TCFD) framework [43] and the language patterns commonly used in Chinese listed firms’ annual reports. The final dictionary contains 104 climate-related keywords covering physical climate risks, transition risks, low-carbon transformation, technological responses, climate governance, and climate-related disclosure. Details of the keyword dictionary are presented in Appendix A.
In the empirical implementation, the 104 climate-related keywords are first added to the user dictionary of the jieba word segmentation package. This step ensures that multi-word phrases such as “climate change”, “carbon emissions trading”, and “climate-related financial disclosure” can be identified as complete terms. Python (version 3.10.12) was then used to process the MD&A text files in batches, and the jieba.lcut() function in jieba (version 0.42.1) was applied for Chinese word segmentation.. Stop words are removed based on the hit_stopwords.txt stop-word list, and one-character non-keyword tokens are also deleted to reduce noise in the denominator. For each firm–year observation, this study counts the frequency of all climate-related keywords and divides it by the total number of words after word segmentation and text cleaning. The ratio is multiplied by 100 to obtain the CRD index, which is calculated as follows:
C R D i t = 100 × C l i m a t e W o r d s i t T o t a l W o r d s i t
where C l i m a t e W o r d s i t is the count of climate-related terms identified in the MD&A section of firm i in year t, while T o t a l W o r d s i t is the number of valid words retained in the same text after word segmentation and the removal of stop words. The ratio is multiplied by 100 to improve interpretability and reduce scale differences. A higher value of C R D i t indicates a higher level of corporate climate risk disclosure.
It should be noted that this keyword-based measure captures the intensity of climate-related disclosure in annual reports, rather than the quality, specificity, credibility, or decision usefulness of such disclosure. Therefore, CRD should be interpreted as a measure of disclosure level rather than disclosure quality. To improve measurement validity, we further classify climate-related keywords into different dimensions and provide representative text examples in Appendix A. In addition, we construct a stricter CRD measure by excluding general environmental terms and retaining only climate-specific keywords as a robustness check.

3.3.2. Independent Variable: AI Pilot Zone Policy (DID)

To examine the relationship between the AI Pilot Zone policy and corporate climate risk disclosure, this study constructs a difference-in-differences variable based on the timing of policy implementation across cities. Treat identifies firms located in cities included in the pilot program, while Post indicates the post-implementation period for each corresponding pilot city. The interaction term Treat × Post (DID) serves as the main policy variable and captures the estimated policy-related change in corporate climate risk disclosure.
Firm location is identified using the registered address reported in the CSMAR database and annual reports. Treatment status is assigned from the year in which a firm’s registered city is officially selected for the AI Pilot Zone program. Firms located in cities that are not included in the program during the sample period serve as the control group. The final sample covers 249 cities, including 17 treated cities and 232 never-treated cities. Since the policy varies at the city level, standard errors in all baseline regressions are clustered at the city level. The list of treated cities, entry years, and the distribution of sample firms across treatment cohorts are reported in Appendix B.

3.3.3. Mediating Variables

To investigate the underlying channels through which the AI Pilot Zone policy is associated with corporate climate risk disclosure, this study constructs three categories of mediating variables: climate-related information-processing capability, climate risk governance capability, and external monitoring pressure.
Climate-related Information-Processing Capability. Corporate climate risk disclosure requires firms to identify, process, and integrate complex climate-related information. Therefore, this study uses corporate AI-related hardware and software investment (AICap) and digital transformation (Digit) as proxies for firms’ climate-related information-processing capability. Following Wu et al. (2025) [69], AICap captures firms’ AI asset deployment. It is measured using AI-related fixed assets and intangible assets disclosed in the financial statement notes. Specifically, we identify AI-related hardware and software items through keyword matching, sum the corresponding ending balances at the firm–year level, and divide the total amount by total assets to construct AICap. The detailed extraction fields and keyword rules are reported in Table 1. Corporate digital transformation is measured using an annual-report-based textual analysis approach, which is widely adopted in studies of Chinese listed firms [70]. Higher levels of AICap and Digit reflect stronger technological and digital capabilities for collecting, processing, and disclosing climate-related information.
Climate Risk Governance Capability. Climate risk disclosure also depends on firms’ substantive capacity to manage and respond to climate-related risks. Stronger climate risk governance capability may enable firms to better perceive climate-related pressures, organize environmental response activities, and produce more meaningful climate-related disclosure. Based on this logic, this study uses green innovation (GreenInnov) and environmental investment (EnvInv) as proxies for corporate climate risk governance capability. Following prior studies, this study uses the number of green patent applications to capture firms’ green innovation activities and defines GreenInnov as the natural logarithm of one plus this number [71,72]. Environmental investment is measured as environmental-protection expenditure scaled by total assets, which reflects their resource commitment to pollution control, energy conservation, and environmental governance [73]. A higher value of these indicators indicates stronger corporate climate risk governance capability.
External Monitoring Pressure. Corporate climate risk disclosure is also affected by external monitoring pressure. Firms receiving greater attention from analysts or the media usually face stronger information demand, public scrutiny, and reputational pressure, which may encourage them to disclose more climate-related information. Therefore, this study uses analyst attention (Analyst) and media attention (Media) as proxies for external monitoring pressure. Analyst attention is measured as the natural logarithm of one plus the number of analysts following the firm, following the common measurement of analyst coverage in prior studies [74]. Media attention is measured as the natural logarithm of one plus the number of online media reports about the firm, consistent with prior studies that construct media coverage based on firm-specific news reports [75]. A higher value of these indicators indicates stronger external monitoring pressure.

3.3.4. Control Variables

Since firms’ disclosure practices may vary with their internal characteristics, this study incorporates several firm-level controls based on the existing literature. Given that the AI Pilot Zone policy is introduced at the city level, the empirical model also accounts for local economic and institutional conditions [76,77,78]. The control variables are selected from both firm and city dimensions. For firm-level characteristics, Size is represented by the natural logarithm of total assets, reflecting differences in firm scale and disclosure capacity. Lev is calculated as the ratio of total liabilities to total assets, and ROA is used to capture firm profitability. Growth captures firms’ business expansion and is defined as the year-on-year change in operating revenue. Cash flow reflects firms’ operating cash flow relative to total assets. To account for board structure, Board is defined as the logarithm of the total number of directors. SOE identifies whether a firm is state-owned, taking the value of one for state-owned enterprises and zero otherwise, while Dual takes the value of one when the chairman also serves as the general manager. ListAge is measured by the number of years since the firm’s initial public offering.
At the city level, this study includes several variables to capture regional economic development, institutional conditions, and digital infrastructure. lnGDP is measured as the natural logarithm of regional GDP. IndStr is used to measure the degree of service-sector development in the local economy, based on the tertiary industry’s share of regional GDP. FinDev is measured by the balance of financial institution loans relative to GDP, capturing local financial development. DigEcon is proxied by the city-level digital economy index, which controls for differences in the local digital environment. EnvReg captures the intensity of environmental regulation and is constructed through text analysis of city government work reports. Specifically, after word segmentation using Python, this variable is calculated as the share of words in sentences containing environmental-protection terms relative to the total word count of the report. MP measures the marketization process and is defined as the ratio of GDP to budgetary expenditure, with larger values indicating weaker relative government intervention and a stronger role of market mechanisms. Including these controls helps reduce potential omitted-variable concerns arising from heterogeneity in firm attributes and regional conditions.

4. Empirical Results

4.1. Descriptive Statistics

Table 2 summarizes the main variables. CRD has a mean of 0.180 and a standard deviation of 0.178, suggesting notable variation in climate risk disclosure across firms. The mean value of DID is 0.517, meaning that 51.7% of the firm–year observations fall within the treated group after policy implementation. In general, the distributions of the firm-level and city-level controls are consistent with expectations and offer adequate variation for subsequent regression analysis.

4.2. Baseline Regression

The baseline results are reported in Table 3. Across all model specifications, the coefficient on DID remains positive and statistically significant, providing empirical support for H1. Once firm and city characteristics are taken into consideration, DID retains a positive coefficient of 0.0886 and reaches statistical significance at the 1% level. The result provides evidence that the AI Pilot Zone designation is linked to more extensive climate risk disclosure among local listed firms.

4.3. Endogeneity Tests

Although the staggered establishment of AI Pilot Zones provides a quasi-natural experimental setting, several endogeneity concerns remain. First, firms in pilot and non-pilot cities may have followed different disclosure trends before policy implementation. This study therefore conducts a parallel trends test and applies the sensitivity analysis of Rambachan and Roth (2023) [79] to assess robustness to moderate deviations from this assumption.
Second, pilot cities were not selected randomly. Cities with stronger digital foundations, innovation capacity, or governance conditions may have been more likely to receive pilot status. To mitigate this concern, the study excludes digitally advanced cities and municipalities and further employs PSM-DID to improve the comparability of treated and control samples.
Third, concurrent digital and green policies may simultaneously affect corporate climate risk disclosure and confound the estimated policy effect. The study therefore controls for several overlapping policy programs, both separately and jointly.
Finally, direct reverse causality is relatively unlikely because the AI Pilot Zone policy is approved by central authorities at the city level, whereas climate risk disclosure is measured at the firm level. A single firm’s disclosure behavior is therefore unlikely to determine whether a city is selected as a pilot zone. Nevertheless, cities with stronger pre-existing digital and sustainability conditions may have been more likely to receive pilot approval. This concern is primarily mitigated through the parallel trends analysis, sample restrictions, and PSM-DID estimation.

4.3.1. Testing the Parallel Trends Assumption

To test whether the treatment and control groups satisfy the parallel trends assumption before the implementation of the AI Pilot Zone policy, this study constructs the following event–study model:
C R D i t = λ 0 + k 1 λ 1 D I D i t + γ 2 C o n t r o l s i t + μ t + η i + ε i t
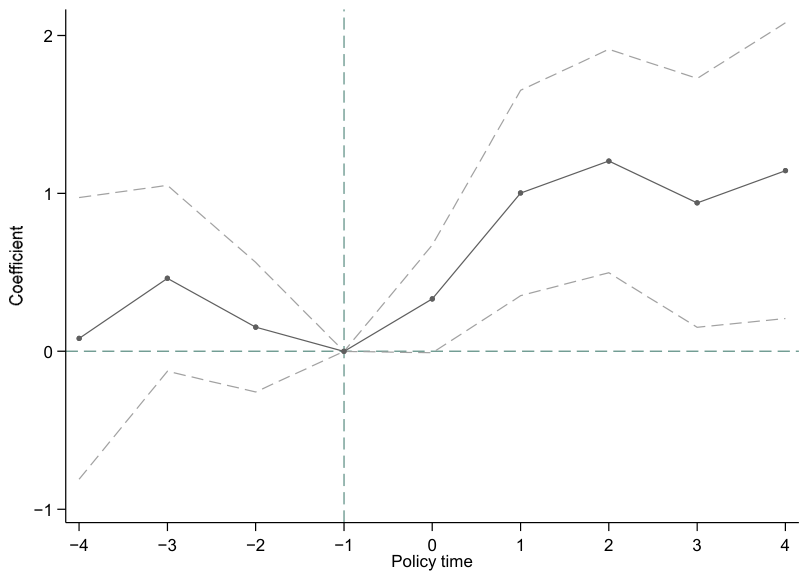
The event–study estimates are shown in Figure 2. Before policy implementation, the estimated coefficients remain near zero and are statistically insignificant, which suggests that treated and control firms exhibited comparable pre-treatment trends in climate risk disclosure. After the AI Pilot Zone policy was introduced, the coefficients become positive and show an upward pattern, indicating an increasing post-policy association between the policy and corporate climate risk disclosure. This pattern is consistent with the parallel trends assumption and supports the validity of the DID design.
This study also conducts joint tests on the event–study coefficients separately for the periods before and after policy adoption, and Table 4 presents the corresponding results. For the pre-policy period, the F-statistic is 0.93 with a p-value of 0.4274, showing that the pre-treatment coefficients are not jointly significant. The evidence does not reveal systematic differences in pre-treatment climate risk disclosure trends between the two groups. By contrast, the post-policy coefficients are jointly significant, with an F-statistic of 3.06 and a p-value of 0.0107. This finding suggests a statistically significant post-policy change and further supports the parallel trends assumption.

4.3.2. Sensitivity to Violations of the Parallel Trends Assumption

Although the event–study results support the parallel trends assumption, statistically insignificant pre-treatment coefficients do not necessarily rule out modest differences in underlying trends between treated and control firms. Such deviations may generate endogeneity concerns and bias the estimated policy effect. To assess whether the baseline results are sensitive to potential violations of the parallel trends assumption, this study applies the sensitivity analysis proposed by Rambachan and Roth (2023) [79].
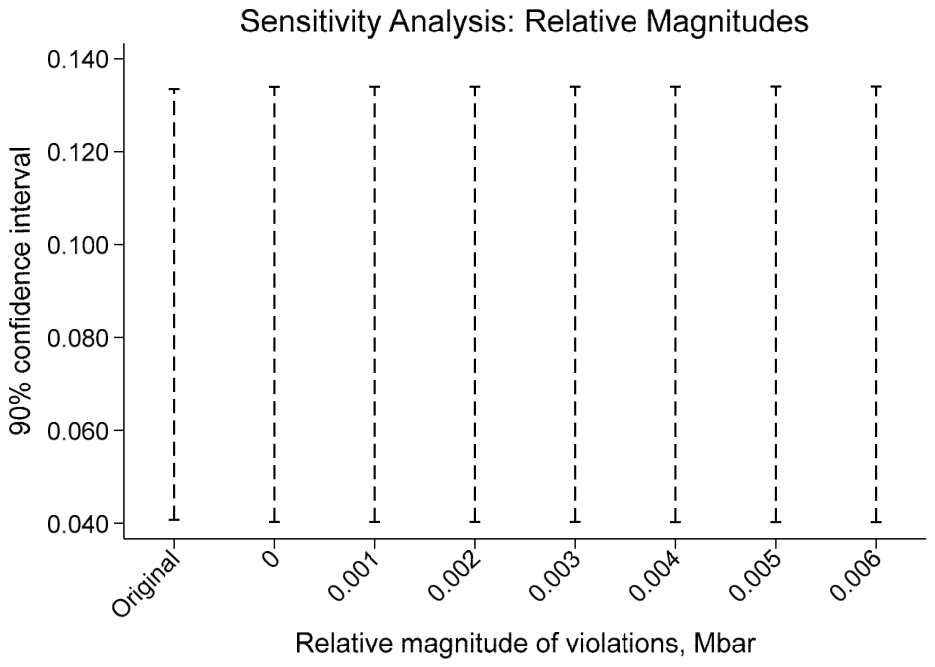
First, the relative-magnitude restriction is used to allow post-treatment deviations from parallel trends to depend on the magnitude of pre-treatment trend differences. As shown in Figure 3, when the relative-magnitude parameter (Mbar) increases from zero to 0.006, the 90% confidence intervals remain above zero and close to the original confidence interval. This finding indicates that moderate deviations from the exact parallel trends assumption do not materially alter the estimated positive association between the AI Pilot Zone policy and corporate climate risk disclosure.
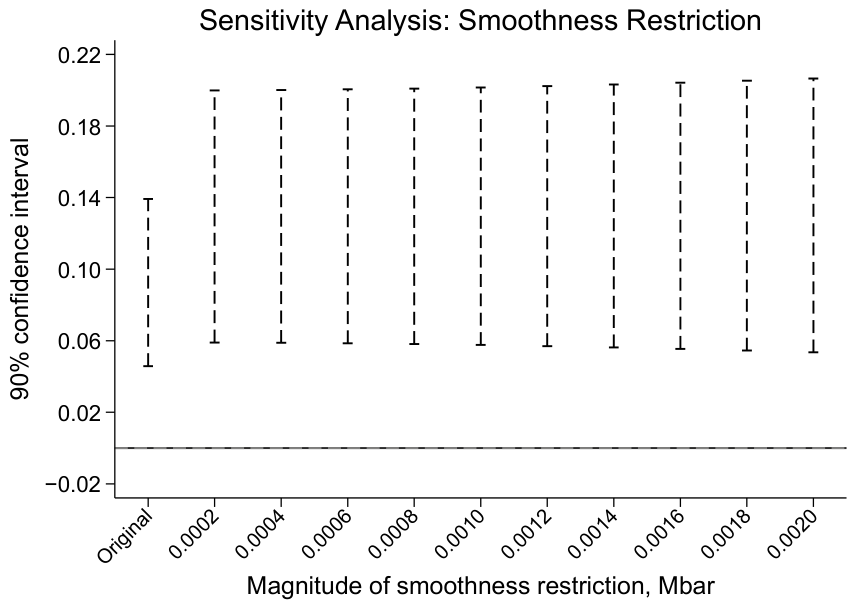
Second, this study applies the smoothness-restriction approach, which allows the differential trend between treated and control firms to change gradually over time. Figure 4 shows that the confidence intervals remain positive and do not include zero as the smoothness parameter (Mbar) increases within the examined range. Overall, the results suggest that the baseline estimates remain robust even when moderate violations of the parallel trends assumption are permitted, thereby reducing concerns that the findings are driven by unobserved differential trends.

4.3.3. Addressing Policy Selection Bias

The designation of AI Pilot Zones was not random. Cities with stronger digital foundations or higher administrative status may have been more likely to receive pilot approval, while these characteristics may also influence corporate climate risk disclosure. To mitigate concerns arising from non-random policy selection, this study conducts two sets of tests.
First, the baseline model is re-estimated after excluding cities with particularly strong digital development and China’s centrally administered municipalities. As shown in Table 5, the DID coefficients remain positive and statistically significant in both subsamples. Specifically, the coefficient is 0.1302 when strong digital cities are excluded and 0.0922 when municipalities are excluded. These results suggest that the baseline finding is not driven by digitally advanced cities or the distinctive economic and institutional characteristics of municipalities.
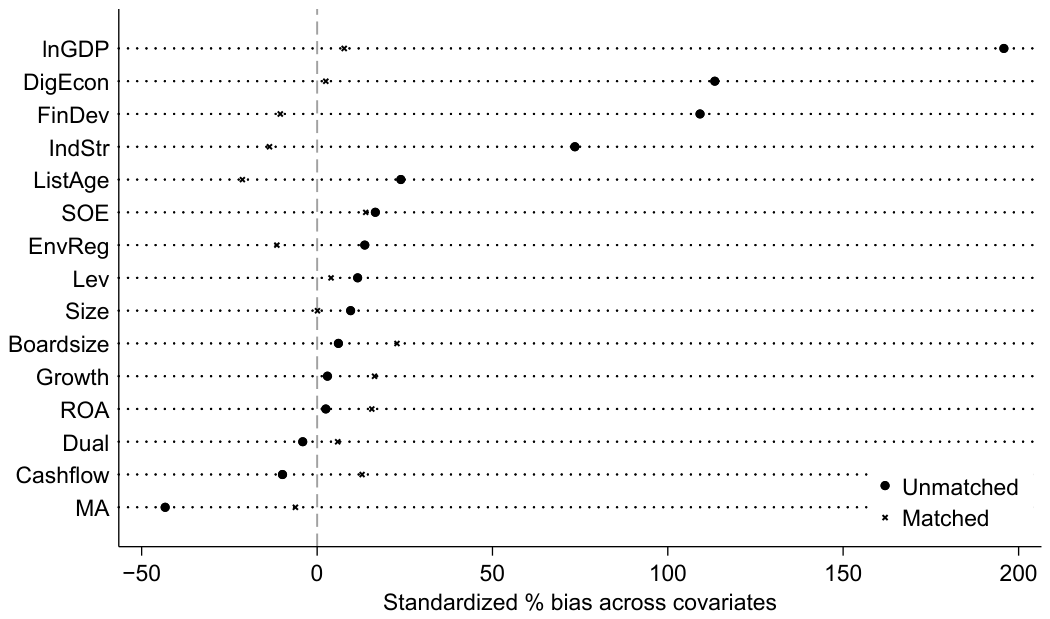
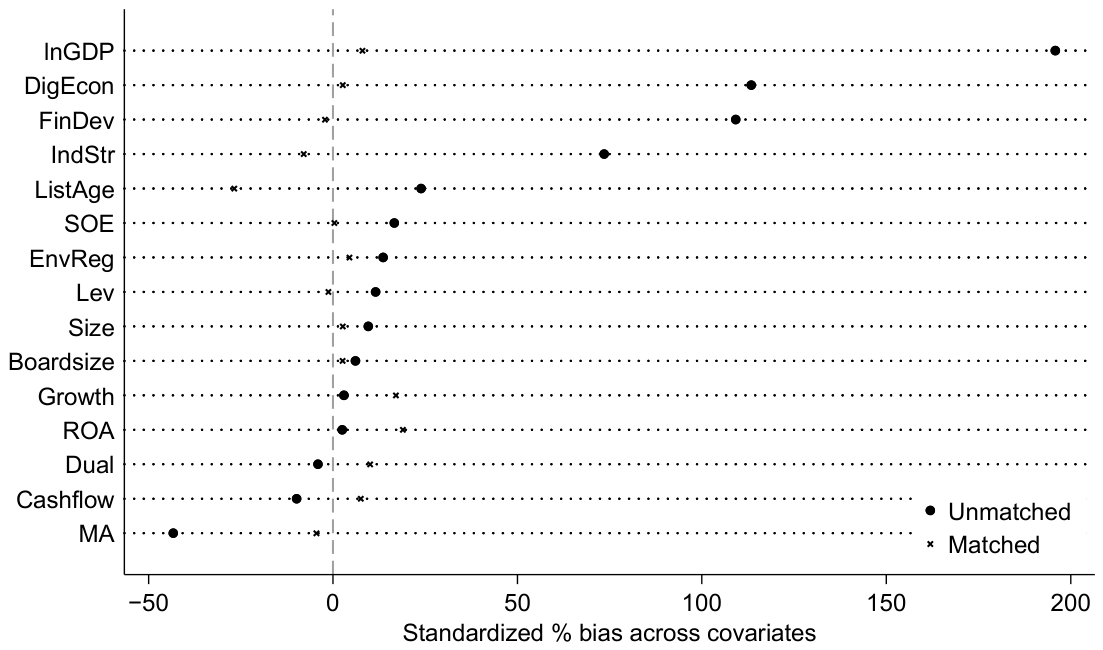
Second, this study employs a PSM-DID approach to improve the comparability of treated and control firms and reduce selection bias arising from observable characteristics [80,81]. Firms are first matched according to observable characteristics measured before policy implementation, which helps construct a control group that is more comparable to the treated group. The matched samples are constructed using two alternative procedures: nearest-neighbor matching and kernel matching.
Figure 5 and Figure 6 show the covariate balance tests for the two matching procedures. The standardized biases decrease markedly after matching, with most covariates falling below the 10% threshold. This indicates that the differences in observable characteristics between treated and control firms are substantially reduced. Overall, the balance results suggest that the matched samples are sufficiently comparable and suitable for the subsequent PSM-DID analysis.
Table 6 presents the PSM-DID estimates based on the matched samples. The coefficients of DID are 0.0910 for nearest-neighbor matching and 0.0928 for kernel matching, and both are statistically significant. These findings are broadly in line with the baseline results, suggesting that the positive association between the AI Pilot Zone policy and corporate climate risk disclosure remains robust after addressing potential sample selection concerns.

4.3.4. Controlling for Concurrent Policy Shocks

Another potential source of endogeneity arises from concurrent policy interventions. During the implementation of the AI Pilot Zone policy, some pilot cities were also affected by other digital and green development programs. If these policies simultaneously influence corporate climate risk disclosure, the baseline DID coefficient may capture not only the effect associated with the AI Pilot Zone policy but also the effects of overlapping policy shocks, thereby generating omitted-variable bias.
To mitigate this concern, this study controls for four major concurrent policies: the Green Finance Pilot Zone, the Low-Carbon City Pilot, the National Big Data Pilot Zone, and the Broadband China Pilot. Table 7 reports the results. Columns (1)–(4) include these policy variables separately, while Column (5) includes all four policies simultaneously. Across all specifications, the coefficient of DID remains positive and statistically significant. In particular, when all concurrent policies are jointly controlled for, the DID coefficient is 0.0911 and remains significant at the 1% level.
These results suggest that the positive association between the AI Pilot Zone policy and corporate climate risk disclosure is unlikely to be driven by overlapping digital or green policy initiatives. Nevertheless, AI-related policies may interact with other policy programs in practice. Therefore, the estimated coefficient should be interpreted as the effect associated with the AI Pilot Zone policy conditional on the broader policy environment, rather than as evidence that the policy operates independently of other concurrent interventions.

4.4. Robustness Tests

4.4.1. Heterogeneous Treatment Effects

Given the staggered introduction of the AI Pilot Zone policy across cities, this study applies the Goodman–Bacon decomposition to examine the composition of the baseline multi-period DID estimate. Since the policy was implemented across cities at different times, potential heterogeneity in treatment effects may affect the validity of the TWFE estimator. Firms located in different pilot cities may differ in digital infrastructure, industrial structure, environmental governance pressure, and capital market attention, which may lead to heterogeneous policy effects across cohorts and over time.
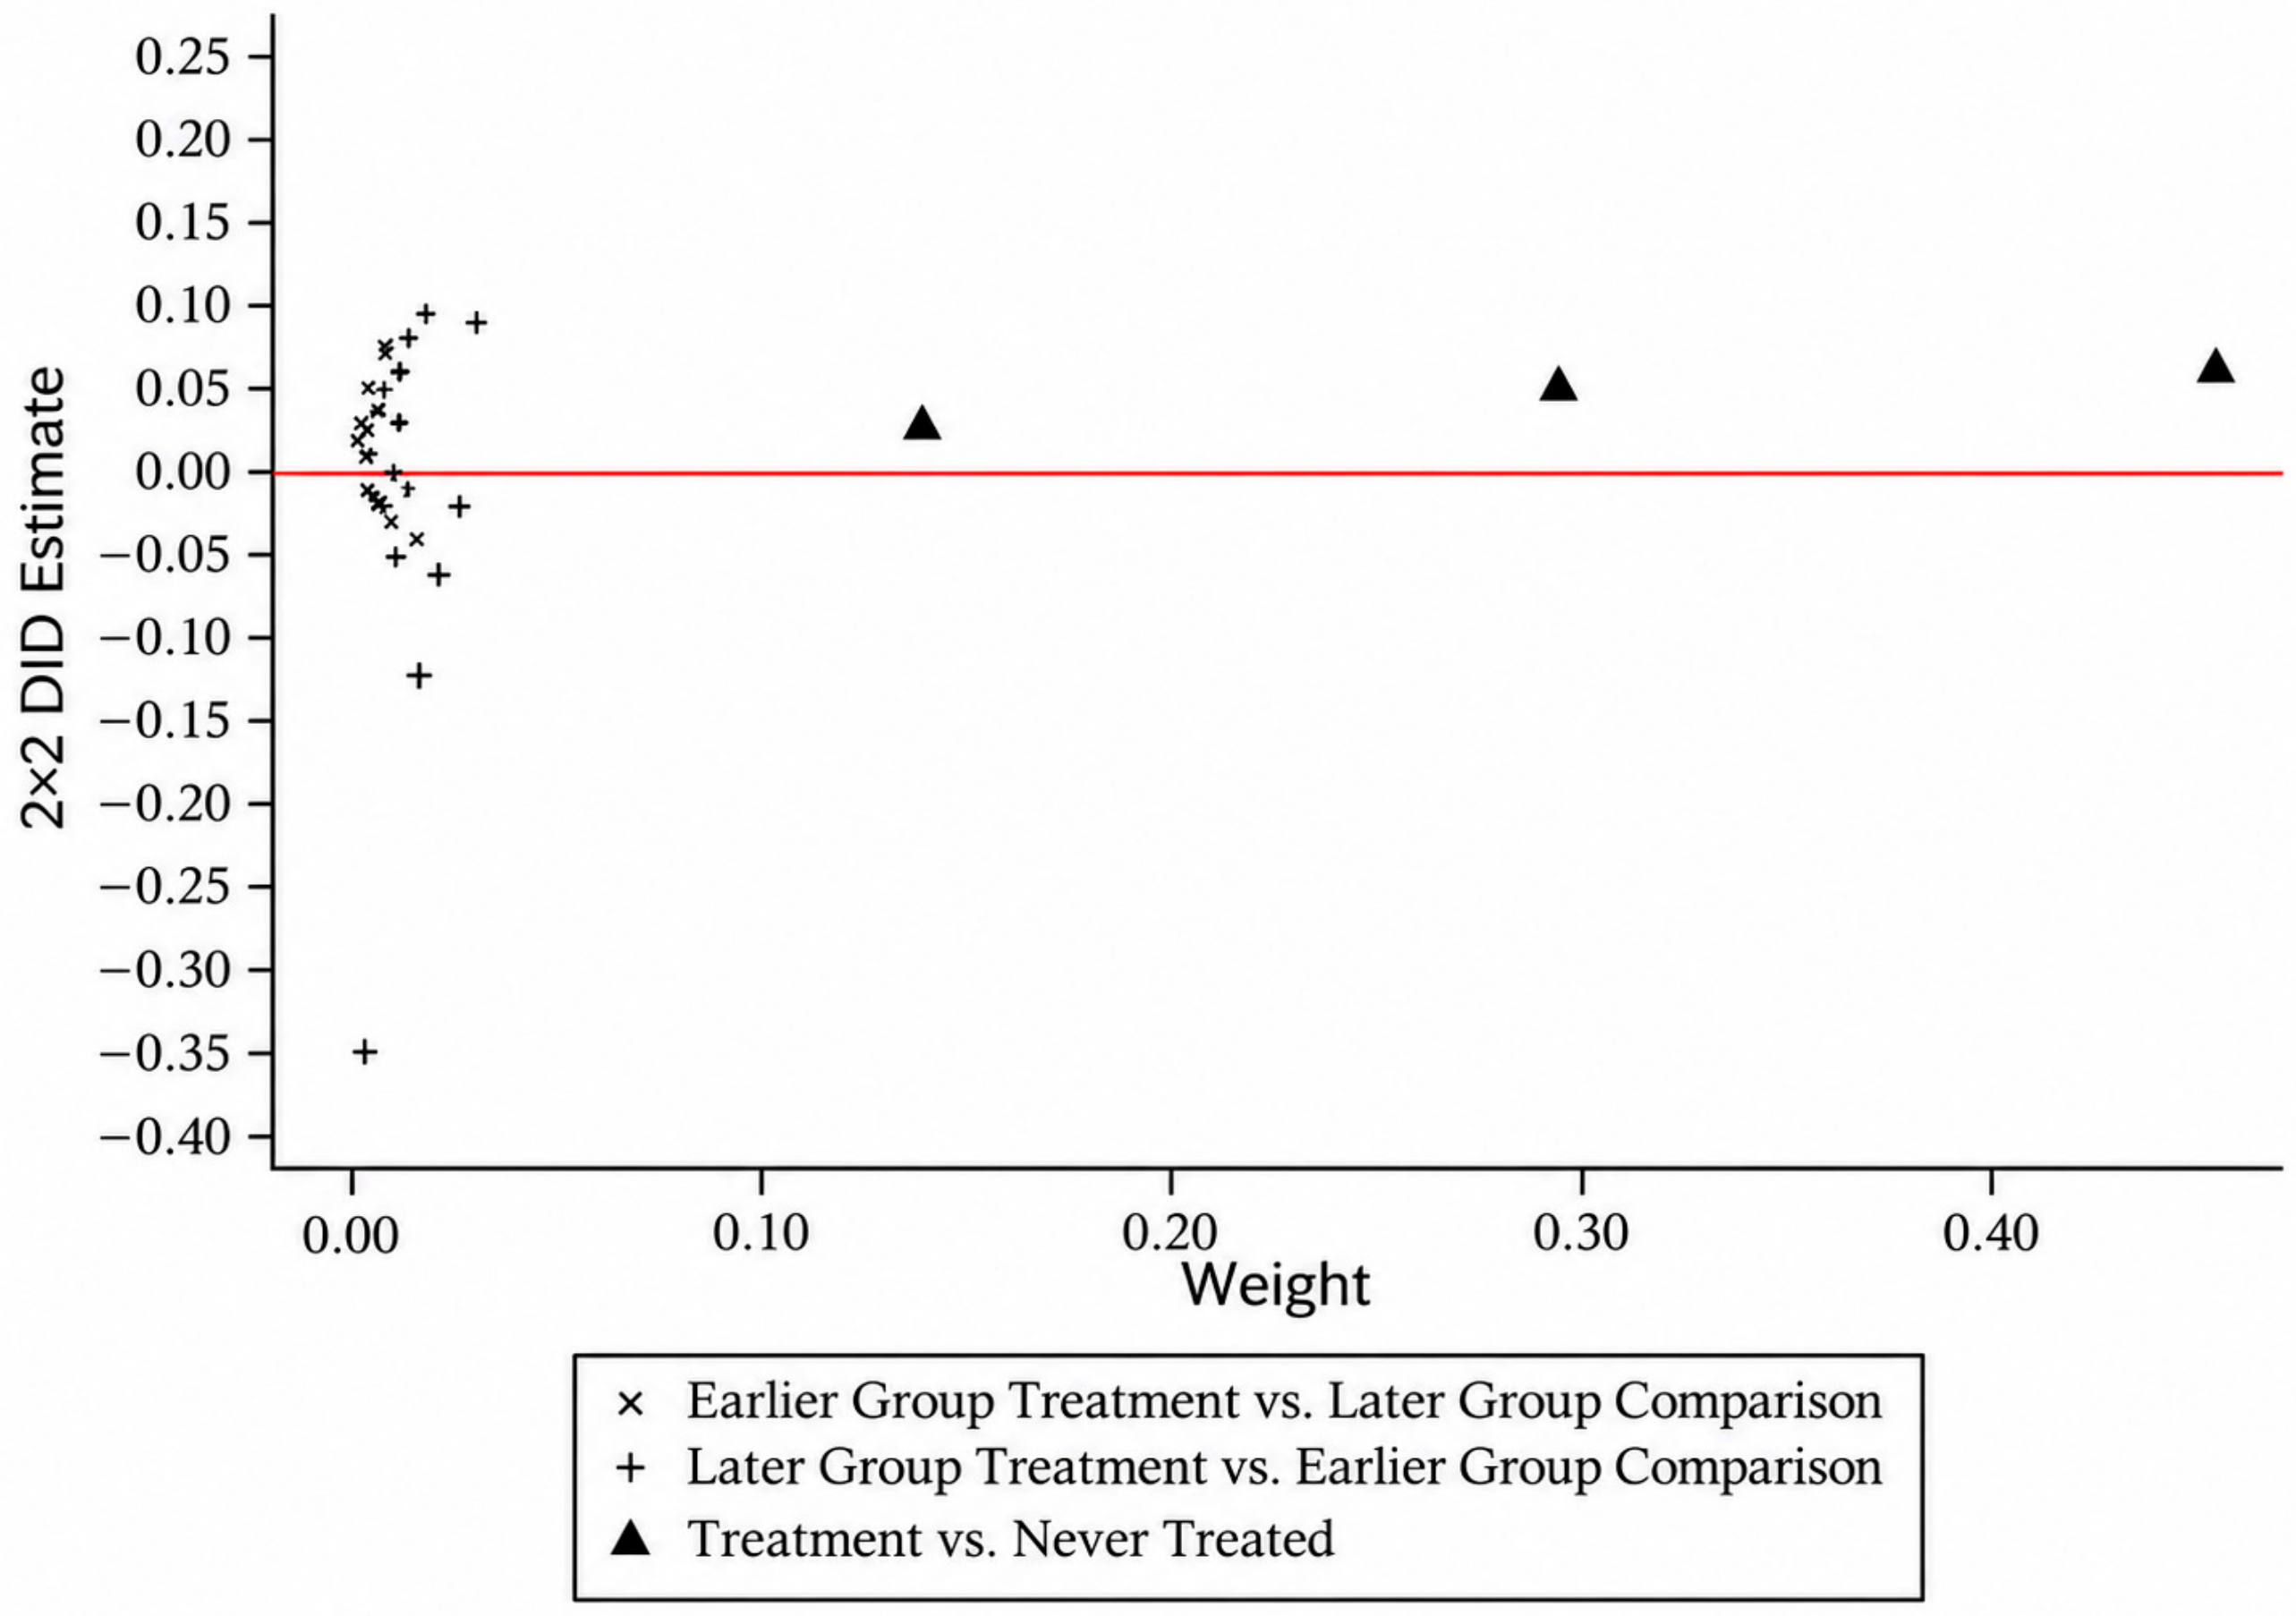
Following Goodman–Bacon (2021) [82], we decompose the TWFE estimate in the staggered DID framework into weighted 2 × 2 DID components. The purpose of this exercise is to examine whether the TWFE estimate is dominated by certain cohort-specific comparisons in the presence of heterogeneous treatment effects. As shown in Figure 7, the decomposed overall estimate remains positive and follows the same direction as the baseline result. The weight assigned to later-treated versus earlier-treated comparisons is relatively small, suggesting that such comparisons do not dominate the estimate. These findings further support the robustness of the observed association between the AI Pilot Zone policy and corporate climate risk disclosure.
As shown in Table 8, the weighted estimate obtained from the Goodman–Bacon decomposition is close to the baseline TWFE estimate. Comparisons between treated and never-treated firms contribute the largest share of identifying variation, accounting for 91.8% of the total weight. In contrast, later-treated versus earlier-treated comparisons receive only 3.4% of the weight. These results indicate that the baseline estimate relies primarily on treated-versus-never-treated comparisons and is not dominated by treatment-timing comparisons that may raise concerns under heterogeneous treatment effects.
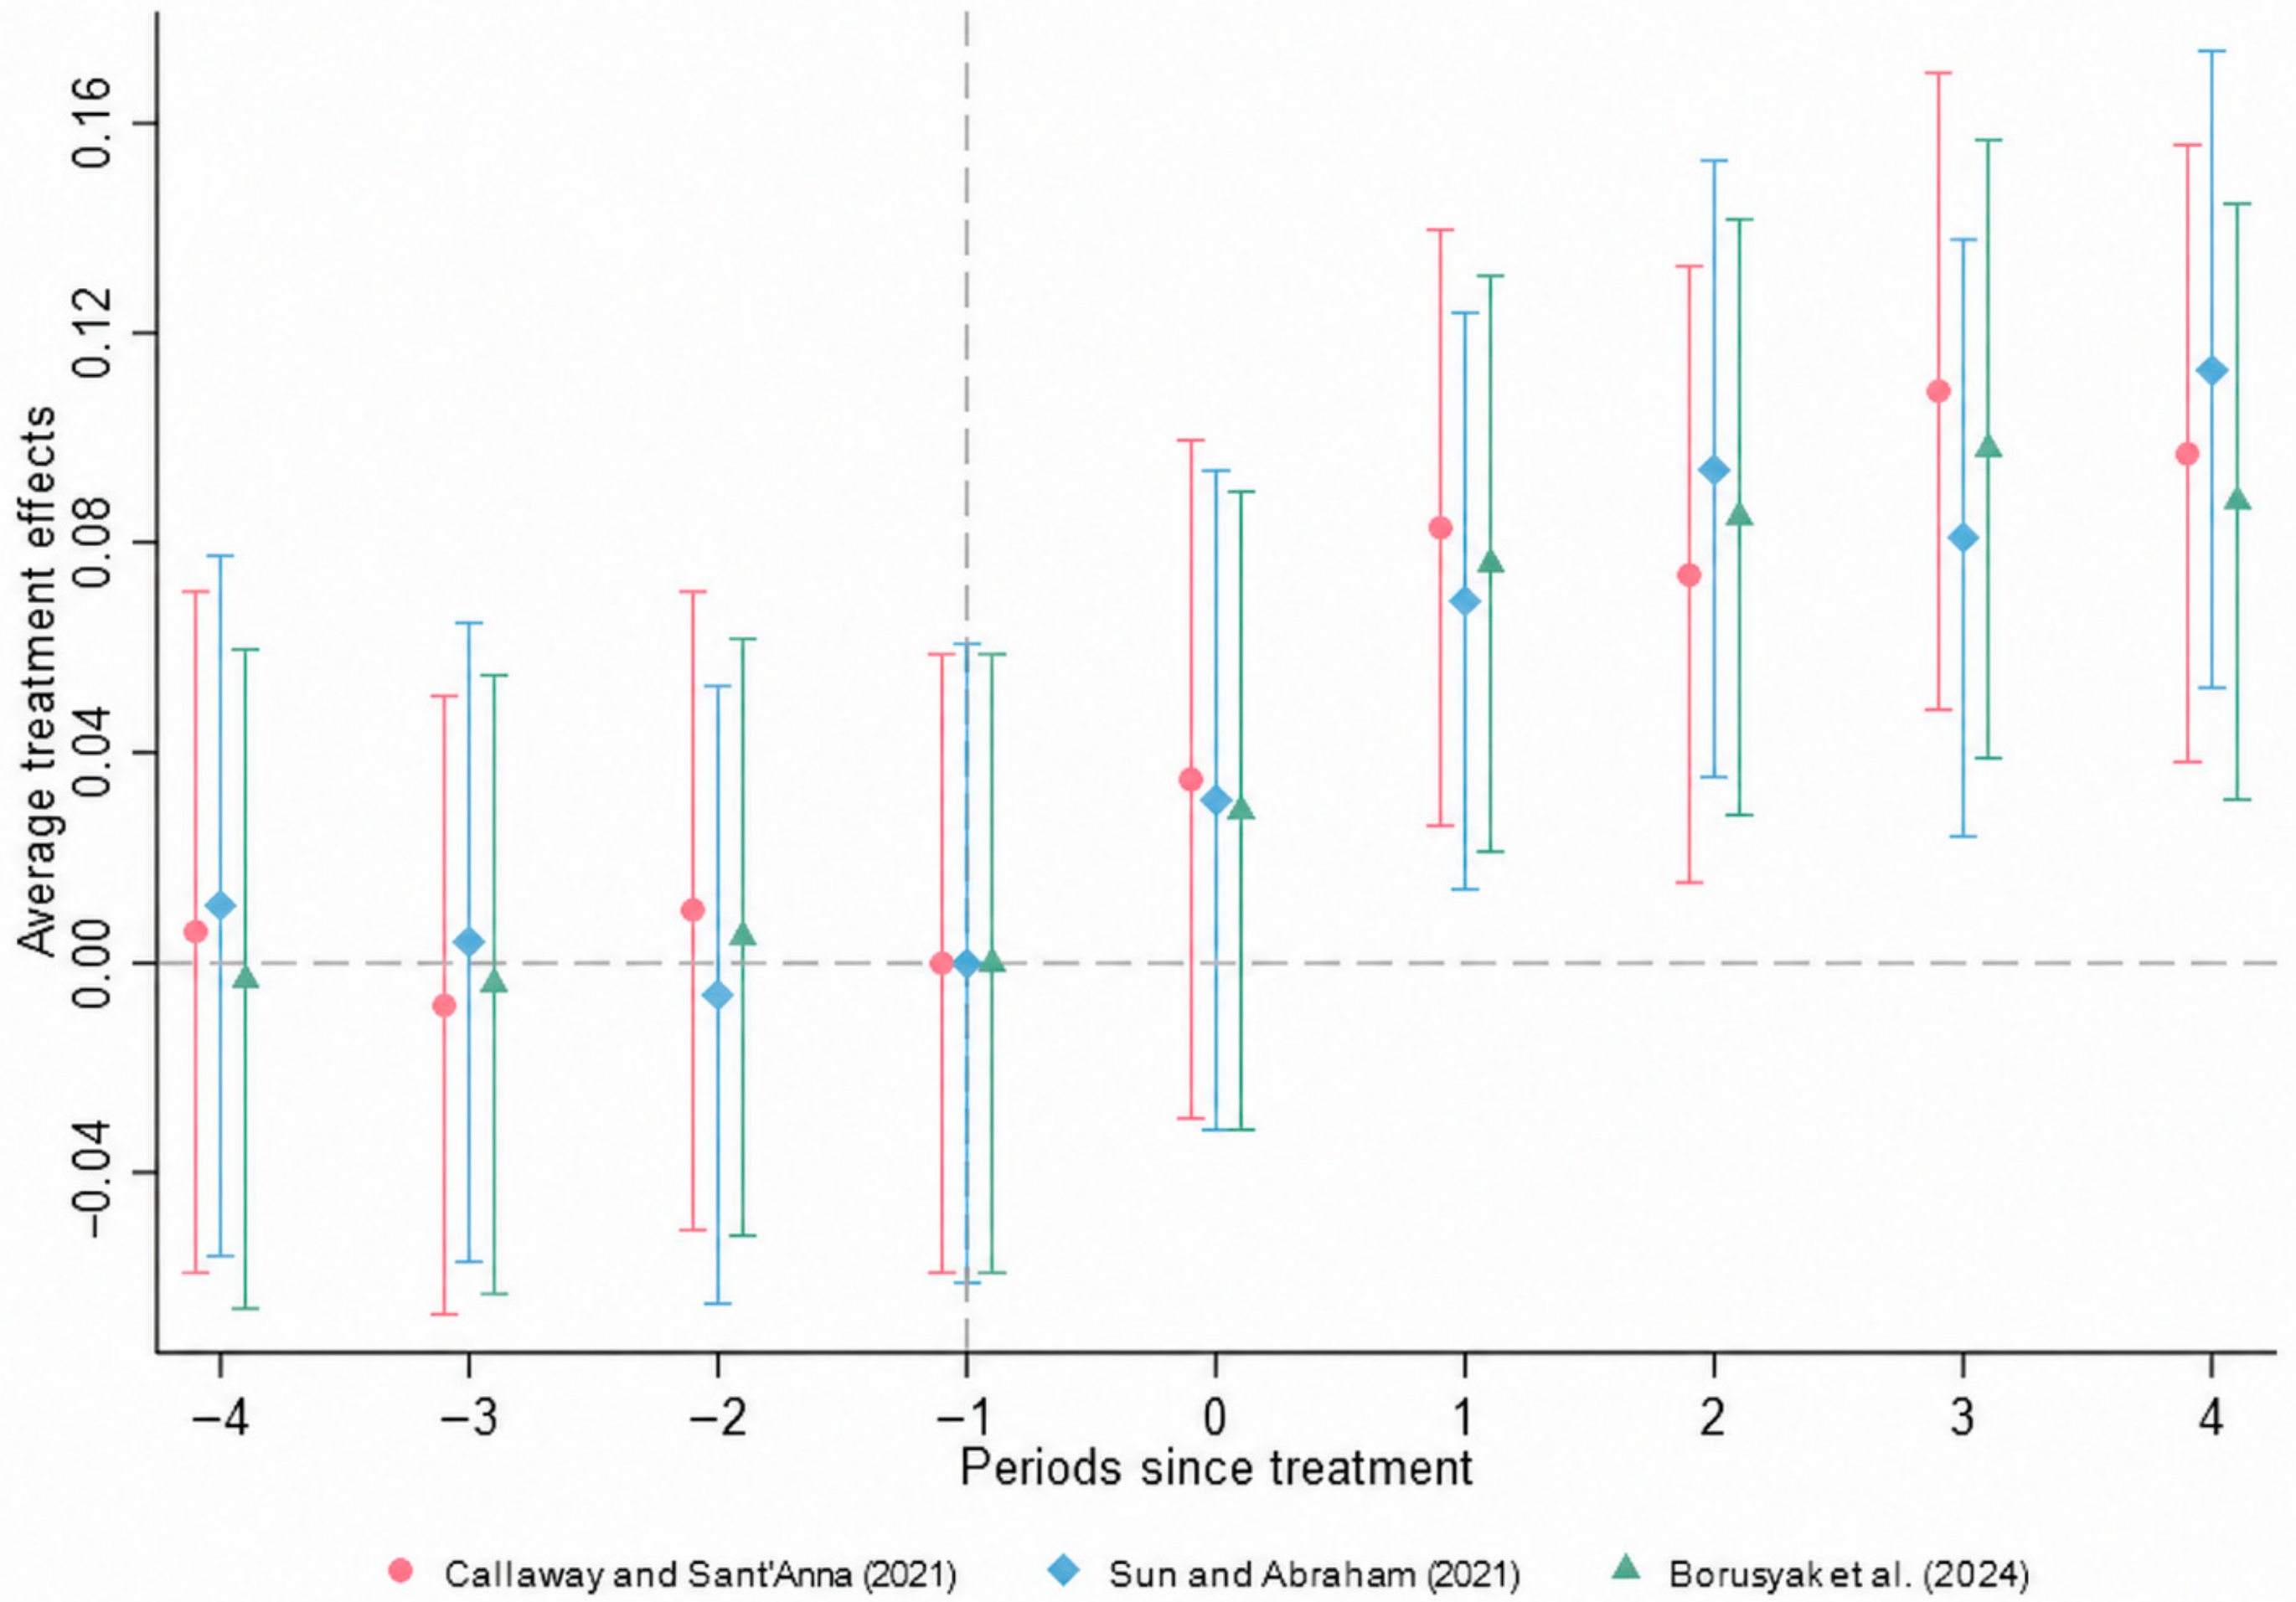
Because cities entered the AI Pilot Zone program at different points in time, estimates from the conventional TWFE DID model may be biased when treatment effects vary across cohorts or over time. Therefore, following Callaway and Sant’Anna (2021), Sun and Abraham (2021), and Borusyak et al. (2024) [83,84,85], this study further uses a set of heterogeneous-treatment-effect estimators as robustness checks for the baseline results.
Figure 8 shows the dynamic treatment estimates based on different methods. Before policy implementation, the estimated coefficients fluctuate around zero, suggesting that the treated and control groups followed broadly similar trends prior to the introduction of the AI Pilot Zone policy. After policy implementation, the estimated coefficients generally become positive, indicating that the policy is associated with higher levels of corporate climate risk disclosure after accounting for heterogeneous treatment effects. When viewed alongside the Goodman–Bacon decomposition results, these results reinforce the credibility of the baseline estimate and indicate that treatment-timing heterogeneity does not substantially affect the main conclusion.
To address potential bias in two-way fixed effects DID estimators under heterogeneous treatment effects, this study further reports alternative staggered DID estimators. As shown in Table 9, the estimated coefficients remain positive and statistically significant across the Sun and Abraham, Callaway and Sant’Anna, and Borusyak et al. estimators. The evidence suggests that heterogeneous treatment effects under staggered policy adoption do not materially alter the baseline finding.

4.4.2. Placebo Test

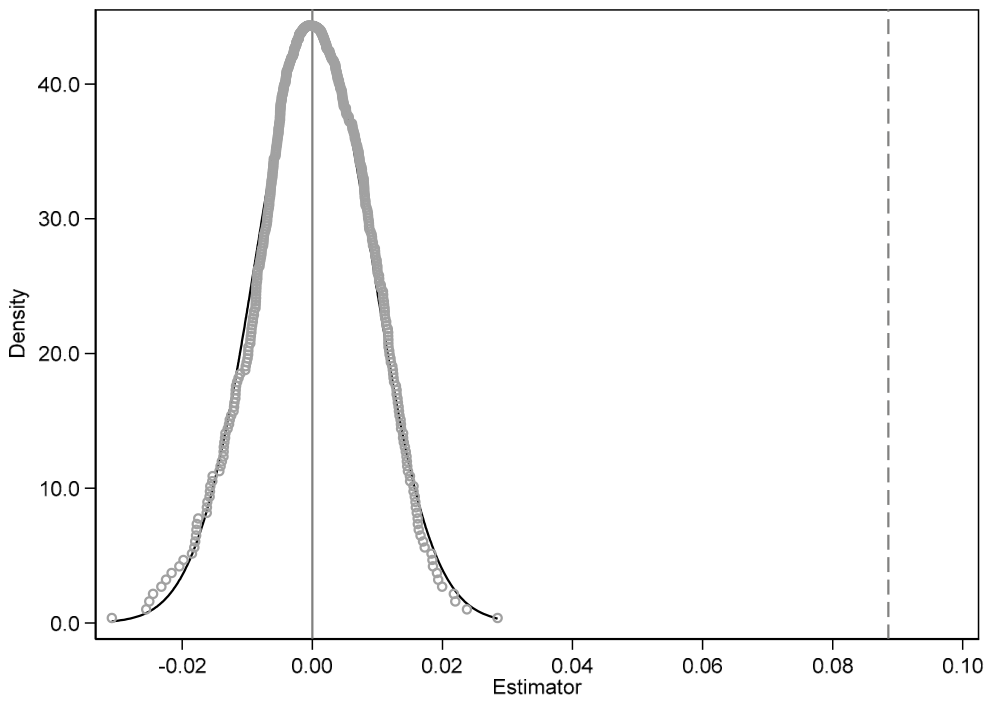
To examine whether the baseline finding may arise from random assignment, this study implements a placebo test following Bertrand et al. (2004) [86]. In this test, the DID variable is randomly reassigned, while the original control variables, firm fixed effects, and year fixed effects are kept unchanged. The randomization process is repeated 500 times to generate the empirical distribution of placebo coefficients. The results are shown in Figure 9. Most placebo estimates are centered around zero and display an approximately symmetric distribution, while the actual DID coefficient from the baseline regression is located outside the main range of the placebo distribution. This pattern indicates that the observed positive association between the AI Pilot Zone policy and corporate climate risk disclosure is unlikely to be explained by random disturbances, thereby providing further support for the robustness of the baseline result.

4.4.3. Alternative Measurement of Climate Risk Disclosure

To alleviate concerns that the baseline results may depend on the self-constructed 104-keyword dictionary, this study conducts two alternative measurement tests. First, we adopt an alternative 96-keyword dictionary from prior literature [87,88] to reconstruct climate risk disclosure. The dictionary includes 32 transition risk keywords and 64 physical risk keywords. Transition risks refer to risks arising from policy, technological, market, and regulatory changes during the low-carbon transition, while physical risks refer to the direct impacts of climate change and extreme weather events. Based on this dictionary, we construct three measures: overall climate risk disclosure (CRD1), transition climate risk disclosure (TCRD), and physical climate risk disclosure (PCRD). Each measure is calculated as the frequency of the corresponding keywords in the MD&A section divided by the total number of words after text cleaning and word segmentation, multiplied by 100. Table A4 presents the complete keyword list. Second, to examine whether the baseline CRD indicator captures climate-specific disclosure instead of general environmental narratives, we construct a stricter measure of climate risk disclosure (CRD_strict). Specifically, we exclude general environmental terms and retain only climate-specific keywords directly related to climate change, carbon mitigation, physical climate risks, transition risks, and climate-related disclosure, while excluding general environmental and sustainability terms. Table A5 provides the full list of keywords.
Table 10 presents the estimation results based on the alternative climate risk keyword dictionary. When CRD1 is adopted as an alternative dependent variable, DID continues to show a positive and statistically significant coefficient, suggesting that the baseline finding does not depend on a specific disclosure measure. After decomposing climate risk disclosure into transition risk and physical risk components, the policy effect is found to be significant only for TCRD. This result indicates that the AI Pilot Zone policy is more closely related to firms’ disclosure of transition-related climate risks, which is in line with the policy orientation toward technological upgrading, digital transformation, green innovation, and low-carbon development. By contrast, physical risks are more closely related to natural climate events and are less directly affected by AI-oriented public policies. When CRD_strict is adopted in Column (4), the estimated coefficient on DID remains positive and statistically significant. This evidence suggests that the main result reflects climate-specific disclosure rather than general environmental narratives. Taken together, these results provide additional support for the baseline conclusion and indicate that the observed policy-related association is mainly reflected in climate-specific disclosure, especially transition risk disclosure.

4.4.4. Robustness to Alternative Clustering Levels

Considering that the AI Pilot Zone policy varies at the city level, this study further examines whether the statistical inference is robust to alternative clustering levels and wild-cluster bootstrap inference. As shown in Table 11, the coefficient of DID remains positive and statistically significant when standard errors are clustered at the city, firm, and province levels. The wild-cluster bootstrap p-value is 0.0127, further confirming that the baseline inference is not driven by the choice of clustering level or by concerns about a limited number of treated city clusters.

4.4.5. Additional Robustness Tests

Table 12 provides a set of supplementary robustness checks. In Column (1), industry-by-year fixed effects are added to mitigate the influence of unobserved shocks that vary across industries over time. Column (2) includes province-by-year fixed effects, thereby accounting for time-varying differences in provincial policies, economic conditions, and institutional environments. In both specifications, the DID estimates remain positive and statistically significant, suggesting that the main finding is not explained by industry-level dynamics or province-specific shocks. Column (3) incorporates additional governance-related controls, including ownership concentration, board independence, and managerial shareholding, and the DID coefficient continues to be significantly positive. Columns (4) and (5) further introduce city-level and province-level linear trends, respectively, to address potential differences in local development trajectories. The results are still consistent with the baseline evidence. Overall, these tests confirm that the positive association between the AI Pilot Zone policy and corporate climate risk disclosure is robust to changes in fixed effect settings, expanded control variables, and differential local trends.

4.5. Mechanism Tests

4.5.1. Mechanism Tests: Climate-Related Information-Processing Capability

Table 13 reports the results for the climate-related information-processing capability channel. AICap and Digit are used to measure firms’ AI capability and digital transformation, respectively. The positive estimates for AICap and Digit indicate that the policy is linked to stronger information-processing foundations among firms located in AI Pilot Zone cities. In addition, AICap and Digit are positively associated with corporate climate risk disclosure. To alleviate concerns about simultaneity and reverse causality, columns (3) and (6) further use lagged mediators. The coefficients of AICap t - 1 and Digit t - 1 remain significantly positive, suggesting that stronger information-processing capability in the previous period is associated with higher current climate risk disclosure. Overall, these findings provide suggestive evidence consistent with the information-processing capability channel, rather than definitive causal mediation evidence.

4.5.2. Mechanism Tests: Climate Risk Governance Capability

Table 14 presents evidence on the climate risk governance capability channel. GreenInnov and EnvInv are employed to capture firms’ green innovation and environmental investment. The estimated coefficients for GreenInnov and EnvInv are both positive and statistically significant, suggesting that firms in pilot cities show stronger governance-related responses to climate risk. In addition, GreenInnov and EnvInv are both positively associated with corporate climate risk disclosure. To partly alleviate concerns about simultaneity and reverse causality, Columns (3) and (6) further use lagged mediators. The coefficients of GreenInnov t - 1 and EnvInv t - 1 remain significantly positive, suggesting that stronger climate risk governance capability in the previous period is associated with higher current climate risk disclosure. Overall, these findings provide suggestive evidence consistent with the climate risk governance capability channel, rather than definitive causal mediation evidence.

4.5.3. Mechanism Test: External Monitoring Pressure

Table 15 reports the results for the external monitoring pressure channel. Analyst and Media are used to measure analyst attention and media attention, respectively. The estimated coefficients for Analyst and Media are both positive and statistically significant, suggesting that treated firms tend to face greater external monitoring. In addition, Analyst and Media are both positively associated with corporate climate risk disclosure. To alleviate concerns about simultaneity and reverse causality, Columns (3) and (6) further use lagged mediators. The coefficients of Analyst t - 1 and Media t - 1 remain significantly positive, suggesting that stronger external monitoring pressure in the previous period is associated with higher current climate risk disclosure. Overall, these findings provide suggestive evidence consistent with the external monitoring pressure channel, rather than definitive causal mediation evidence.

4.6. Heterogeneity Analysis

4.6.1. Environmental Pressure Heterogeneity

Firms may differ in their responses to the AI Pilot Zone policy depending on the extent of environmental pressure they face. To explore potential differences across industries, this study divides firms into heavy-polluting and non-heavy-polluting groups. Firms in heavy-polluting industries are treated as facing higher environmental pressure, whereas other firms are assigned to the lower-pressure group. The subgroup regression results are presented in Columns (1) and (2) of Table 16. To provide a more formal comparison across groups, this study also estimates full-sample interaction models, with the results reported in Appendix D. The interaction estimates are broadly consistent with the subgroup evidence.
Although the estimated DID coefficients are positive across both groups, the effect size is greater for firms under higher environmental pressure. This pattern indicates that heavy-polluting firms exhibit a stronger policy-related increase in climate risk disclosure. Although the coefficient for this group is significant only at the 10% level, this may be partly attributable to the reduced sample size and the corresponding increase in standard errors. More importantly, the between-group difference is statistically significant at the 1% level, providing further evidence that the policy-related disclosure effect varies significantly with firms’ environmental pressure.

4.6.2. Institutional Ownership Heterogeneity

Institutional investors play an important monitoring role in capital markets and tend to have stronger demand for climate-related information. When institutional ownership is relatively high, firms may face stronger external pressure to enhance transparency and respond more actively to the AI Pilot Zone policy. Based on this consideration, this study separates the sample into high- and low-institutional-ownership groups using the annual median of institutional shareholding as the cutoff. Table 16 presents these estimates in Columns (3) and (4).
A clear difference emerges across the two ownership groups: DID is positive and statistically significant in the high institutional ownership subsample, but loses significance in the low-institutional-ownership subsample. The coefficient difference between the two groups is also significant at the 1% level. This evidence suggests that institutional investors may amplify the policy-related disclosure effect by strengthening external oversight and increasing firms’ incentives to provide climate risk information.

4.6.3. Executive’ Green Awareness Heterogeneity

Managerial green awareness may shape firms’ responses to the AI Pilot Zone policy. This study measures such awareness through the textual analysis of listed firms’ annual reports. The keyword dictionary consists of three categories: green competitive advantage, corporate social responsibility, and external environmental pressure. The measure is constructed by dividing the number of green-awareness-related terms by the total word count of the annual report and multiplying the result by 100. Using the annual median of this indicator as the cutoff, the sample is divided into firms with higher and lower levels of managerial green awareness. The corresponding results are shown in Columns (5) and (6) of Table 16.
The estimates indicate that the DID coefficient is positive and statistically significant only for firms with higher managerial green awareness, while it is insignificant for firms with lower managerial green awareness. The difference between the two coefficients is also significant at the 1% level. This finding implies that when managers attach greater importance to green development, firms are more likely to translate the institutional support and technological conditions associated with the AI Pilot Zone policy into concrete climate risk disclosure practices.

5. Further Analysis

5.1. Association Between Climate Risk Disclosure and ESG Performance

This section conducts an exploratory analysis of how corporate climate risk disclosure is related to ESG performance. This study uses ESG rating information provided by the Huazheng ESG database. Since the original ratings are expressed on an ordinal scale from C to AAA, they are transformed into numerical scores, with larger values representing higher ESG ratings. It is important to note that ESG ratings may capture not only firms’ actual ESG practices but also the extent and quality of ESG-related information disclosed to the public, as rating agencies often rely on publicly available materials. Accordingly, the following analysis should be understood as providing correlational evidence, not causal identification.
Table 17 presents additional evidence on how corporate climate risk disclosure relates to ESG ratings. The estimate in Column (1) shows that the coefficient of CRD is 0.1149 and statistically significant at the 10% level, suggesting a positive association between climate risk disclosure and firms’ overall ESG ratings. Column (2) adds the interaction term between CRD and the AI Pilot Zone policy, denoted as CRD_DID. The coefficient of this interaction term is 0.6121 and it is significant at the 1% level, indicating that the positive association between climate risk disclosure and ESG ratings is stronger for firms located in AI Pilot Zones. Nevertheless, this finding should not be interpreted as evidence that climate risk disclosure directly improves ESG performance. Both climate risk disclosure and ESG ratings may be influenced by common firm characteristics, such as governance quality, transparency, sustainability orientation, or other unobserved factors. Moreover, because ESG rating systems may include disclosure-based indicators, the observed relationship may partly reflect the way ESG scores are constructed.
Columns (3)–(5) further distinguish the environmental, social, and governance components of ESG ratings. Further analysis by ESG dimension shows that CRD has significant positive estimates for the environmental and governance scores, whereas its estimate for the social score is insignificant. Thus, the relationship between climate risk disclosure and ESG performance appears to operate primarily through the environmental and governance dimensions. This result is consistent with the nature of climate risk disclosure, which is more closely connected to carbon emissions, green transition, risk management, and governance arrangements. By contrast, the social dimension is more related to employee welfare, supply chain responsibility, and community engagement. When ESG ratings are examined by dimension, the positive association with climate risk disclosure is mainly observed in the environmental and governance components. However, these results remain correlational and do not demonstrate that disclosure itself leads to substantive improvements in ESG performance.

5.2. Climate Risk Disclosure and Carbon Emissions

To address the concern that climate risk disclosure may merely capture the optimization of climate-friendly language rather than substantive environmental outcomes, this study further examines the relationship between climate risk disclosure and firms’ carbon emissions. Specifically, we use carbon emissions and carbon emission intensity as dependent variables and regress them on CRD while controlling for firm-level and city-level characteristics, firm fixed effects, and year fixed effects.
The results are reported in Table 18. The coefficient of CRD is significantly negative in both columns. In column (1), the coefficient of CRD is −0.8243 and significant at the 10% level, indicating that firms with higher climate risk disclosure tend to have lower carbon emissions. The regression using carbon emission intensity as the dependent variable reports a significantly negative coefficient for CRD in Column (2) (−0.3547, significant at the 5% level). This finding suggests that firms disclosing more climate-related information tend to exhibit lower carbon emission intensity. These findings provide supplementary evidence that climate risk disclosure is not merely a textual or symbolic practice, but is also associated with real climate-related environmental outcomes.
This analysis, however, should be interpreted carefully. The results provide associative evidence linking climate risk disclosure to carbon emissions, rather than conclusive causal evidence that disclosure itself lowers emissions. Climate risk disclosure remains a reporting practice, and its environmental consequences may depend on whether firms translate disclosure into substantive low-carbon actions.

6. Conclusions and Policy Implications

6.1. Research Conclusions

This study analyzes whether China’s AI Pilot Zone policy is associated with corporate climate risk disclosure and further examines the underlying channels, heterogeneity, and extended outcomes related to this association. The empirical analysis draws on Chinese A-share firm-level panel data for 2014–2023 and adopts a staggered DID design. It further examines potential mechanisms, cross-firm heterogeneity, and the robustness of the main findings. The key findings can be summarized as follows.
First, the AI Pilot Zone policy is related to an increase in corporate climate risk disclosure. After controlling for unobserved firm heterogeneity, common year shocks, and observable firm- and city-level characteristics, DID continues to be positive and statistically significant. A broad set of robustness exercises, including tests for parallel trends, placebo regressions, alternative staggered DID estimators, substitute measures of key variables, expanded covariate sets, and local time trends, leads to consistent conclusions. These results suggest that AI-oriented public policy is positively associated with firms’ climate-related disclosure.
Second, the mechanism analysis provides suggestive evidence consistent with three channels linking the AI Pilot Zone policy to corporate climate risk disclosure. Specifically, the results are consistent with the roles of firms’ climate risk information-processing capability, climate risk governance capability, and external monitoring pressure, as reflected by AI capability and digital transformation, green innovation and environmental investment, and analyst and media attention, respectively. These findings are consistent with the view that the AI Pilot Zone policy is associated with climate risk disclosure through firms’ climate-related information-processing capability, climate risk governance capability, and external monitoring pressure.
Third, the estimated relationship between the AI Pilot Zone policy and corporate climate risk disclosure differs across firm characteristics. Subsample evidence indicates that the policy-related increase in climate risk disclosure is concentrated among firms with stronger environmental pressure, higher institutional ownership, and greater managerial green cognition. This suggests that the positive association is more pronounced when firms face stronger environmental constraints, greater capital market monitoring, and stronger internal awareness of green development.
Further analysis shows that corporate climate risk disclosure is positively associated with ESG performance, especially environmental and governance performance, while its relationship with social performance is not significant. Moreover, the positive relationship between climate risk disclosure and ESG performance is more pronounced among firms exposed to the AI Pilot Zone policy. These findings suggest that AI-oriented public policy is associated with higher climate risk disclosure and that disclosure practices are positively linked to broader sustainability performance.

6.2. Policy Implications

This study provides three policy implications. First, policymakers should strengthen the integration of AI infrastructure with climate governance. The AI Pilot Zone policy can be further extended to carbon monitoring, climate risk assessment, environmental management, and sustainability reporting, thereby helping firms apply AI technologies to practical climate governance scenarios. Second, firms should improve their climate-related data processing capacity. Since high-quality climate risk disclosure requires the integration of information on production, emissions, energy use, supply chains, and external climate risks, firms should increase investment in AI-related hardware and software and build more systematic climate information management platforms. Third, regulators should enhance external monitoring and disclosure quality supervision. While AI-oriented policies may be associated with greater attention from investors, analysts, and the media, regulatory authorities should further improve disclosure standards and encourage firms to provide more specific, comparable, and verifiable climate risk information rather than symbolic or boilerplate statements.

6.3. Limitations and Future Prospects

While this study provides new evidence on the link between the AI Pilot Zone policy and corporate climate risk disclosure, it is still subject to several limitations. First, from the perspective of sample coverage, the empirical analysis is confined to Chinese A-share listed companies. Listed firms usually have more standardized information disclosure systems and face stronger regulatory and market attention than non-listed firms. Therefore, the extent to which these findings apply to small- and medium-sized enterprises or unlisted firms remains an open question.
Second, in terms of variable measurement, corporate climate risk disclosure is mainly measured based on textual information in annual reports. Although this study improves the measurement validity of CRD through keyword classification, representative text examples, and a stricter keyword-based robustness test, the textual measure mainly captures the level of climate-related disclosure and may not fully reflect its quality, specificity, or substantive content. It may also capture symbolic, generalized, or boilerplate disclosure, making it difficult to fully distinguish substantive disclosure from impression management or greenwashing. Moreover, climate risk disclosure is a reporting practice rather than a direct measure of ecological performance. Although this study further examines the relationship between climate risk disclosure and carbon emissions, improved disclosure should not be equated with actual emissions reduction or substantive sustainability transformation. Future research could combine textual analysis with manual coding, disclosure quality scoring, or machine-learning classification, and further examine whether disclosure improvements are accompanied by measurable changes in carbon emissions, energy efficiency, or other real sustainability outcomes.
Third, from a methodological standpoint, although this study implements a range of robustness checks and controls for several overlapping policies, the estimated results may still be subject to the influence of other regional reforms occurring during the sample period. In addition, the current DID design primarily captures the direct policy-related change among treated firms, while potential spillovers across regions, industries, and supply chains remain insufficiently explored. Future research can adopt spatial econometric methods, supply chain network analysis, or multi-policy interaction designs to further explore the broader effects of AI-related policies on corporate sustainability disclosure.
Finally, this study has an important conceptual limitation. It examines the effect of an AI-oriented public policy on corporate climate risk disclosure, but it does not evaluate the broader ecological and social consequences of AI development. AI systems may involve substantial energy consumption, data-center water use, rare-earth extraction, labor displacement, and new forms of algorithmic governance. Therefore, the positive disclosure effect identified in this study should not be interpreted as evidence of a net ecological benefit of AI policy, as improved disclosure does not necessarily imply that its environmental benefits outweigh the material and energy costs of AI. Moreover, this study does not consider broader structural issues, such as the growth imperative, overproduction, and the Jevons paradox, under which technological progress and efficiency gains may coexist with increased resource use or emissions. Similarly, the mediating roles of green innovation and environmental investment should be understood as firms’ governance and organizational responses, rather than as direct evidence of net ecological improvement, because such activities may also be accompanied by production expansion, rebound effects, or capital accumulation incentives. Future research could adopt a broader interdisciplinary perspective to evaluate both the governance benefits and the material, ecological, and social costs of AI development.


Author Contributions

Conceptualization, W.Q.; Methodology, W.Q.; Software, W.Q.; Validation, Q.Z.; Formal analysis, Q.Z.; Investigation, Q.Z.; Resources, Q.Z.; Data curation, L.S.; Writing—original draft, L.S.; Writing—review & editing, L.S.; Visualization, Z.Y.; Supervision, Z.Y.; Project administration, Z.Y.; Funding acquisition, L.S. All authors have read and agreed to the published version of the manuscript.

Funding

This research was funded by the National Social Science Fund of China (NSSFC) under Grant [21BJY004].

Institutional Review Board Statement

Not applicable.

Informed Consent Statement

Not applicable.

Data Availability Statement

The raw data supporting the conclusions of this article will be made available by the authors on request.

Conflicts of Interest

The authors declare no conflicts of interest.

Appendix A. Classification of Climate Risk Keywords and Representative Text Examples

Table A1. Classification of climate risk keywords and representative text examples.
DimensionRepresentative KeywordsRepresentative Text Examples
Physical risksClimate change; extreme weather; global warming; climate warming; extreme climate; physical risk; climate vulnerability; sea level rise; high temperature; drought; flood; hurricane; wildfire; supply chain disruption; operational disruption; asset impairmentThe company identifies climate change and extreme weather events as potential risks that may affect production continuity, supply chain stability, and asset safety.
Transition risksClimate policy; carbon risk; low carbon; low-carbon development; carbon neutrality; carbon peak; energy transition; carbon market; carbon trading; carbon emissions trading; carbon tax; climate regulation; environmental regulation; regulatory requirements; compliance costs; Paris Agreement; nationally determined contributionsThe company faces transition risks arising from carbon neutrality policies, carbon emissions trading, and stricter environmental regulation, which may increase compliance costs and affect future business strategy.
Climate governance and strategyClimate governance; climate action; climate strategy; sustainability strategy; environmental management; carbon management; stakeholder engagement; investor attention; information disclosure; climate-related financial disclosure; TCFD; ESG report; sustainability report; corporate social responsibilityThe company has incorporated climate governance into its sustainability strategy and strengthened climate-related information disclosure in response to stakeholder and investor attention.
Climate-related metrics and targetsCarbon emissions; carbon dioxide; greenhouse gases; carbon footprint; carbon emission intensity; climate targets; emission reduction targets; carbon neutrality commitment; net-zero commitment; net-zero emissions; zero carbon; internal carbon pricing; carbon costs; carbon assets; carbon liabilitiesThe company discloses its carbon emissions, carbon emission intensity, and emission reduction targets, and has set a carbon neutrality commitment to guide future low-carbon development.
Low-carbon technologies and energy transitionRenewable energy; clean energy; new energy; energy efficiency; energy efficiency improvement; low-carbon technology; clean technology; green technology; electrification; decarbonization; carbon capture; carbon storage; carbon sinkThe company promotes renewable energy use, energy efficiency improvement, and low-carbon technologies to support decarbonization and reduce climate-related transition pressure.
Green finance and low-carbon business practicesGreen bonds; green finance; ESG investment; climate investment; low-carbon economy; circular economy; green manufacturing; sustainable supply chain; green products; environmentally friendly products; eco-design; sustainable procurementThe company supports low-carbon transformation through green finance, sustainable procurement, green manufacturing, and the development of environmentally friendly products.

Appendix B. List of AI Pilot Zone Cities and Entry Years

Table A2. List of AI pilot zone cities and entry years.
Policy YearTreated Cities
2019Shanghai, Beijing, Hefei, Tianjin, Hangzhou, Shenzhen
2020Guangzhou, Chengdu, Wuhan, Jinan, Xi’an, Chongqing
2021Harbin, Shenyang, Suzhou, Zhengzhou, Changsha
Table A3. Sample distribution by treatment cohort.
EntryYearNumber_of_Treated_CitiesNumber_of_Treated_FirmsFirm_Year_Observations
20196163410,533
202065143306
202153031886
Never treated 219713,572

Appendix C. Climate Risk Keyword Set

Table A4. Climate risk keyword set.
Climate Risk TypeKeyword Set
Climate Physical RiskClimate; weather; humidity; water temperature; cooling; cold; air temperature; rainfall; temperature; rainwater; rainy season; rainfall conditions; precipitation; continuous rain; heavy rain; extreme cold; winter; flood season; high humidity; water conditions; water level; sunlight; water shortage; alpine cold; cold wave; subsidence; groundwater; flood conditions; surface; water storage; disaster; earthquake; typhoon; tsunami; drought and flood; extreme; severe; urban flooding; strong wind; sandstorm; hurricane; frost; flood disaster; storm; debris flow; landslide; freezing; snow disaster; drought disaster; flood and waterlogging; rainstorm; tornado; hail; flood; rain and snow; freezing; blizzard; freezing damage; drought; drought conditions; heavy rainfall; floodwater; severe cold; wind and sand (64 keywords)
Climate Transition RiskEnergy conservation; energy; clean; ecology; environment; transition; solar energy; upgrading; recycling; utilization rate; nuclear power; wind power; natural gas; efficiency improvement; fuel oil; efficiency; renewable; emission reduction; environmental protection; green; low carbon; consumption reduction; fuel; water conservation; photovoltaic; high efficiency; renovation; fuel consumption; electricity consumption; energy consumption; efficiency; intensive use (32 keywords)
Table A5. CRD_strict keyword dictionary.
ItemKeyword
CRD_strict keyword dictionaryClimate change; carbon risk; extreme weather; carbon emissions; climate policy; low carbon; greenhouse gases; global warming; climate warming; climate risk; extreme climate; carbon dioxide; greenhouse effect; low-carbon development; carbon neutrality; carbon peak; green and low-carbon; energy conservation and emission reduction; carbon market; carbon trading; carbon sink; carbon capture; carbon storage; climate change adaptation; climate resilience; climate action; climate governance; Paris Agreement; physical risk; transition risk; climate adaptation; climate vulnerability; sea level rise; high temperature; drought; flood; hurricane; wildfire; climate regulation; carbon emissions trading; carbon tax; regulatory requirements; compliance costs; disclosure requirements; TCFD; SBTi; climate targets; nationally determined contributions; carbon pricing; internal carbon pricing; carbon costs; climate-related financial disclosure; climate scenario analysis; stress testing; climate strategy; carbon management; carbon footprint; carbon emission intensity; emission reduction targets; carbon neutrality commitment; net-zero commitment (61 keywords)

Appendix D. Interaction Tests for Heterogeneous Effects

Table A6. Full-sample interaction tests for heterogeneous effects.
(1)(2)(3)
VariableEnvironmental PressureInstitutional OwnershipManagerial Green Cognition
DID0.0332−0.00710.0290
(0.0284)(0.0248)(0.0271)
DID_heavy0.4378 ***
(0.1445)
DID_InsInvestor 0.1868 ***
(0.0438)
DID_GreenCog 0.1213 ***
(0.0367)
Constant1.6377 ***1.6573 ***1.7064 ***
(0.0394)(0.0198)(0.0180)
ControlsYesYesYes
Firm fixed effectsYesYesYes
Year fixed effectsYesYesYes
Observations28,29728,29728,297
Adj-R20.87250.87200.8716
Note: Robust standard errors clustered at the city level are reported in parentheses. ***, indicate significance at the 1% level, respectively.

References

  1. Dhaliwal, D.S.; Li, O.Z.; Tsang, A.; Yang, Y.G. Voluntary nonfinancial disclosure and the cost of equity capital: The initiation of corporate social responsibility reporting. Account. Rev. 2011, 86, 59–100. [Google Scholar] [CrossRef] [Scilit]
  2. Christensen, H.B.; Hail, L.; Leuz, C. Mandatory CSR and sustainability reporting: Economic analysis and literature review: HB Christensen et al. Rev. Account. Stud. 2021, 26, 1176–1248. [Google Scholar] [CrossRef] [Scilit]
  3. Krueger, P.; Sautner, Z.; Starks, L.T. The importance of climate risks for institutional investors. Rev. Financ. Stud. 2020, 33, 1067–1111. [Google Scholar] [CrossRef] [Scilit]
  4. Bolton, P.; Kacperczyk, M. Do investors care about carbon risk? J. Financ. Econ. 2021, 142, 517–549. [Google Scholar] [CrossRef] [Scilit]
  5. Ginglinger, E.; Moreau, Q. Climate risk and capital structure. Manag. Sci. 2023, 69, 7492–7516. [Google Scholar] [CrossRef] [Scilit]
  6. Rusu, T.M.; Odagiu, A.; Pop, H.; Paulette, L. Sustainability performance reporting. Sustainability 2024, 16, 8538. [Google Scholar] [CrossRef] [Scilit]
  7. de Villiers, C.; Dimes, R.; La Torre, M.; Molinari, M. The international sustainability standards board’s (ISSB) past, present, and future: Critical reflections and a research agenda. Pac. Account. Rev. 2024, 36, 255–273. [Google Scholar] [CrossRef] [Scilit]
  8. Adhikari, A.; Zhou, H. Voluntary disclosure and information asymmetry: Do investors in US capital markets care about carbon emission? Sustain. Account. Manag. Policy J. 2022, 13, 195–220. [Google Scholar]
  9. Baumanns, K. The Contribution of Ash Recycling to the Sustainability of Bioenergy from Forest Biomass: An Analysis of Götaland, Sweden. Master’s Thesis, Lund University, Lund, Sweden, 2010. [Google Scholar]
  10. Raisch, S.; Krakowski, S. Artificial intelligence and management: The automation–augmentation paradox. Acad. Manag. Rev. 2021, 46, 192–210. [Google Scholar] [CrossRef] [Scilit]
  11. Babina, T.; Fedyk, A.; He, A.; Hodson, J. Artificial intelligence, firm growth, and product innovation. J. Financ. Econ. 2024, 151, 103745. [Google Scholar] [CrossRef] [Scilit]
  12. Goldfarb, A.; Taska, B.; Teodoridis, F. Could machine learning be a general purpose technology? A comparison of emerging technologies using data from online job postings. Res. Policy 2023, 52, 104653. [Google Scholar] [CrossRef] [Scilit]
  13. Cockburn, I.M.; Henderson, R.; Stern, S. The impact of artificial intelligence on innovation: An exploratory analysis. In The Economics of Artificial Intelligence: An Agenda; University of Chicago Press: Chicago, IL, USA, 2018; pp. 115–146. [Google Scholar]
  14. International Sustainability Standards Board (ISSB). IFRS S2 Climate-related Disclosures, 2023. Available online: https://www.ifrs.org/issued-standards/ifrs-sustainability-standards-navigator/ifrs-s2-climate-related-disclosures (accessed on 13 July 2026).
  15. Sautner, Z.; Van Lent, L.; Vilkov, G.; Zhang, R. Firm-level climate change exposure. J. Financ. 2023, 78, 1449–1498. [Google Scholar] [CrossRef] [Scilit]
  16. Eubanks, V. Automating Inequality: How High-Tech Tools Profile, Police, and Punish the Poor; Macmillan + ORM: New York, NY, USA, 2018. [Google Scholar]
  17. Noble, S.U. Algorithms of oppression: How search engines reinforce racism. In Algorithms of Oppression; New York University Press: New York, NY, USA, 2018. [Google Scholar]
  18. Benjamin, R. Race After Technology: Abolitionist Tools for the New Jim Code; Polity Press: Cambridge, UK, 2019. [Google Scholar]
  19. Zuboff, S. The age of surveillance capitalism. In Social Theory Re-Wired; Routledge: Abingdon, UK, 2023; pp. 203–213. [Google Scholar]
  20. Crawford, K. Atlas de IA: Poder, Política y Costes Planetarios de la Inteligencia Artificial; Ned Ediciones: Barcelona, Spain, 2023; Volume 2089. [Google Scholar]
  21. Pasquinelli, M. The Eye of the Master: A Social History of Artificial Intelligence; Verso Books: New York, NY, USA, 2023. [Google Scholar]
  22. Morozov, E. To Save Everything, Click Here: The Folly of Technological Solutionism; PublicAffairs: New York, NY, USA, 2013. [Google Scholar]
  23. Rouvroy, A.; Berns, T. Algorithmic governmentality and prospects of emancipation: Disparateness as a precondition for individuation through relationships? Réseaux 2013, 177, 163–196. [Google Scholar]
  24. Elkington, J.; Rowlands, I.H. Cannibals with forks: The triple bottom line of 21st century business. Altern. J. 1999, 25, 42. [Google Scholar]
  25. Richardson, A.J.; Welker, M. Social disclosure, financial disclosure and the cost of equity capital. Account. Organ. Soc. 2001, 26, 597–616. [Google Scholar] [CrossRef] [Scilit]
  26. Khamisu, M.S.; Paluri, R.A. Emerging trends of environmental social and governance (ESG) disclosure research. Clean. Prod. Lett. 2024, 7, 100079. [Google Scholar] [CrossRef] [Scilit]
  27. Mion, G.; Loza Adaui, C.R. Mandatory nonfinancial disclosure and its consequences on the sustainability reporting quality of Italian and German companies. Sustainability 2019, 11, 4612. [Google Scholar] [CrossRef] [Scilit]
  28. Matsumura, E.M.; Prakash, R.; Vera-Muñoz, S.C. Firm-value effects of carbon emissions and carbon disclosures. Account. Rev. 2014, 89, 695–724. [Google Scholar]
  29. Ilhan, E.; Krueger, P.; Sautner, Z.; Starks, L.T. Climate risk disclosure and institutional investors. Rev. Financ. Stud. 2023, 36, 2617–2650. [Google Scholar] [CrossRef] [Scilit]
  30. Duan, D.; Wei, R.; Wang, C.; Xia, B. Opportunity or obstacle? Climate risk disclosure and corporate ESG performance. Int. Rev. Econ. Financ. 2025, 100, 104101. [Google Scholar] [CrossRef] [Scilit]
  31. Wu, J.; Shang, S. Managing uncertainty in AI-enabled decision making and achieving sustainability. Sustainability 2020, 12, 8758. [Google Scholar] [CrossRef] [Scilit]
  32. Brynjolfsson, E.; Rock, D.; Syverson, C. Artificial intelligence and the modern productivity paradox: A clash of expectations and statistics. In The Economics of Artificial Intelligence: An Agenda; University of Chicago Press: Chicago, IL, USA, 2018; pp. 23–57. [Google Scholar]
  33. Alekseeva, L.; Azar, J.; Giné, M.; Samila, S.; Taska, B. The demand for AI skills in the labor market. Labour Econ. 2021, 71, 102002. [Google Scholar] [CrossRef] [Scilit]
  34. Badghish, S.; Soomro, Y.A. Artificial intelligence adoption by SMEs to achieve sustainable business performance: Application of technology–organization–environment framework. Sustainability 2024, 16, 1864. [Google Scholar] [CrossRef] [Scilit]
  35. Tian, H.; Wang, J.; Cai, Y. Artificial intelligence adoption and corporate ESG performance. Bus. Strategy Environ. 2025, 34, 8922–8945. [Google Scholar] [CrossRef] [Scilit]
  36. Yang, S.; Zhou, N. Artificial intelligence and the quality of corporate accounting information disclosure. Financ. Res. Lett. 2025, 85, 108136. [Google Scholar] [CrossRef] [Scilit]
  37. Moreno, A.-I.; Caminero, T. Application of text mining to the analysis of climate-related disclosures. Int. Rev. Financ. Anal. 2022, 83, 102307. [Google Scholar] [CrossRef] [Scilit]
  38. Agrawal, A.; Gans, J.; Goldfarb, A. Prediction Machines, Updated and Expanded: The Simple Economics of Artificial Intelligence; Harvard Business Press: Brighton, MA, USA, 2022. [Google Scholar]
  39. Wang, M.; Yu, X.; Feng, S.; Xu, C. The application of artificial intelligence in corporate climate risk: Information disclosure, information advantage, and information prediction. J. Clean. Prod. 2025, 534, 147040. [Google Scholar] [CrossRef] [Scilit]
  40. Wang, Y.; Cao, S.; Shah, M.H. The impact of carbon information disclosure on firm value: The mediating role of green M&A—Evidence from China. Sustainability 2026, 18, 2225. [Google Scholar] [CrossRef] [Scilit]
  41. Healy, P.M.; Palepu, K.G. Information asymmetry, corporate disclosure, and the capital markets: A review of the empirical disclosure literature. J. Account. Econ. 2001, 31, 405–440. [Google Scholar] [CrossRef] [Scilit]
  42. Dai, J. Is policy pilot a viable path to sustainable development? Attention allocation perspective. Int. Rev. Financ. Anal. 2025, 98, 103923. [Google Scholar] [CrossRef] [Scilit]
  43. Task Force on Climate-related Financial Disclosures (TCFD). Recommendations of the Task Force on Climate-Related Financial Disclosures; Financial Stability Board: Basel, Switzerland, 2017; Available online: https://www.fsb-tcfd.org/recommendations/ (accessed on 13 July 2026).
  44. Miglionico, A. The use of technology in corporate management and reporting of climate-related risks. Eur. Bus. Organ. Law Rev. 2022, 23, 125–141. [Google Scholar] [CrossRef] [Scilit]
  45. Zhao, X.; Tong, Y.; Lee, H.; Shahzad, U. The role of artificial intelligence in enhancing corporate environmental information disclosure: Implications for energy transition and sustainable development. Energy Econ. 2025, 148, 108680. [Google Scholar] [CrossRef] [Scilit]
  46. Chen, Y.; Zhang, M.; Matthews, L.; Guo, H. Digital transformation and environmental information disclosure in China: The moderating role of top management team’s ability. Bus. Strategy Environ. 2024, 33, 8456–8470. [Google Scholar] [CrossRef] [Scilit]
  47. He, Y.; Li, J.; Ren, Y. Digital transformation and corporate ESG information disclosure herd effect. Financ. Res. Lett. 2024, 65, 105557. [Google Scholar] [CrossRef] [Scilit]
  48. Gupta, S.; Langhans, S.D.; Domisch, S.; Fuso-Nerini, F.; Felländer, A.; Battaglini, M.; Tegmark, M.; Vinuesa, R. Assessing whether artificial intelligence is an enabler or an inhibitor of sustainability at indicator level. Transp. Eng. 2021, 4, 100064. [Google Scholar] [CrossRef] [Scilit]
  49. Qiu, Y.; Shaukat, A.; Tharyan, R. Environmental and social disclosures: Link with corporate financial performance. Br. Account. Rev. 2016, 48, 102–116. [Google Scholar] [CrossRef] [Scilit]
  50. Brunnermeier, S.B.; Cohen, M.A. Determinants of environmental innovation in US manufacturing industries. J. Environ. Econ. Manag. 2003, 45, 278–293. [Google Scholar] [CrossRef] [Scilit]
  51. Clarkson, P.M.; Li, Y.; Richardson, G.D.; Vasvari, F.P. Does it really pay to be green? Determinants and consequences of proactive environmental strategies. J. Account. Public Policy 2011, 30, 122–144. [Google Scholar] [CrossRef] [Scilit]
  52. Wan, J.; Li, X.; Dai, H.-N.; Kusiak, A.; Martinez-Garcia, M.; Li, D. Artificial-intelligence-driven customized manufacturing factory: Key technologies, applications, and challenges. Proc. IEEE 2020, 109, 377–398. [Google Scholar]
  53. Uriarte-Gallastegi, N.; Arana-Landín, G.; Landeta-Manzano, B.; Laskurain-Iturbe, I. The role of AI in improving environmental sustainability: A focus on energy management. Energies 2024, 17, 649. [Google Scholar] [CrossRef] [Scilit]
  54. Nishant, R.; Kennedy, M.; Corbett, J. Artificial intelligence for sustainability: Challenges, opportunities, and a research agenda. Int. J. Inf. Manag. 2020, 53, 102104. [Google Scholar] [CrossRef] [Scilit]
  55. Mijit, R.; Hu, Q.; Xu, J.; Ma, G. Greening through AI? The impact of artificial intelligence innovation and development pilot zones on green innovation in China. Energy Econ. 2025, 146, 108507. [Google Scholar] [CrossRef] [Scilit]
  56. Liu, Y.; Shen, F.; Guo, J.; Hu, G.; Song, Y. Can artificial intelligence technology improve companies’ capacity for green innovation? Evidence from listed companies in China. Energy Econ. 2025, 143, 108280. [Google Scholar] [CrossRef] [Scilit]
  57. Ifada, L.M.; Jaffar, R. Does environmental cost expenditure matter? Evidence from selected countries in the Asia-Pacific region. Sustainability 2023, 15, 4322. [Google Scholar] [CrossRef] [Scilit]
  58. Zeng, S.; Xu, X.; Yin, H.; Tam, C.M. Factors that drive Chinese listed companies in voluntary disclosure of environmental information. J. Bus. Ethics 2012, 109, 309–321. [Google Scholar]
  59. Kanoujiya, J.; Abraham, R.; Rastogi, S.; Bhimavarapu, V.M. Transparency and disclosure and financial distress of non-financial firms in India under competition: Investors’ perspective. J. Risk Financ. Manag. 2023, 16, 217. [Google Scholar] [CrossRef] [Scilit]
  60. Flammer, C.; Toffel, M.W.; Viswanathan, K. Shareholder activism and firms’ voluntary disclosure of climate change risks. Strateg. Manag. J. 2021, 42, 1850–1879. [Google Scholar] [CrossRef] [Scilit]
  61. Yuan, C.; Liu, J.; Fan, Y. Exploring the dynamics of urban digital intelligent transformation: Sustainable development through the National AI innovation pilot zone. Environ. Dev. Sustain. 2025, 27, 1–36. [Google Scholar] [CrossRef] [Scilit]
  62. Bushee, B.J.; Core, J.E.; Guay, W.; Hamm, S.J. The role of the business press as an information intermediary. J. Account. Res. 2010, 48, 1–19. [Google Scholar] [CrossRef] [Scilit]
  63. Yu, F.F. Analyst coverage and earnings management. J. Financ. Econ. 2008, 88, 245–271. [Google Scholar] [CrossRef] [Scilit]
  64. Zhang, J.; Zhang, L.; Zhang, M. Media pressure, internal control, and corporate environmental information disclosure. Financ. Res. Lett. 2024, 63, 105369. [Google Scholar] [CrossRef] [Scilit]
  65. Baron, R.M.; Kenny, D.A. The moderator–mediator variable distinction in social psychological research: Conceptual, strategic, and statistical considerations. J. Personal. Soc. Psychol. 1986, 51, 1173. [Google Scholar] [CrossRef]
  66. Hoang, K.; Pham, L.; Ha, O.K.; Nghiem, H.X. Firm-level climate change exposure and firm efficiency. Int. Rev. Econ. Financ. 2025, 101, 104220. [Google Scholar] [CrossRef] [Scilit]
  67. Tong, Z.; Tan, Z. Artificial intelligence and climate risk: Toward sustainable development within a Double Helix framework. Technol. Forecast. Soc. Change 2026, 226, 124592. [Google Scholar] [CrossRef] [Scilit]
  68. Vestrelli, R.; Colladon, A.F.; Pisello, A.L. When attention to climate change matters: The impact of climate risk disclosure on firm market value. Energy Policy 2024, 185, 113938. [Google Scholar] [CrossRef] [Scilit]
  69. Wu, Q.; Qalati, S.A.; Tajeddini, K.; Wang, H. The impact of artificial intelligence adoption on Chinese manufacturing enterprises’ innovativeness: New insights from a labor structure perspective. Ind. Manag. Data Syst. 2025, 125, 849–874. [Google Scholar] [CrossRef] [Scilit]
  70. Wu, K.; Lu, Y. Corporate digital transformation and financialization: Evidence from Chinese listed firms. Financ. Res. Lett. 2023, 57, 104229. [Google Scholar] [CrossRef] [Scilit]
  71. Zhang, D.; Rong, Z.; Ji, Q. Green innovation and firm performance: Evidence from listed companies in China. Resour. Conserv. Recycl. 2019, 144, 48–55. [Google Scholar] [CrossRef] [Scilit]
  72. Cui, J.; Dai, J.; Wang, Z.; Zhao, X. Does environmental regulation induce green innovation? A panel study of Chinese listed firms. Technol. Forecast. Soc. Change 2022, 176, 121492. [Google Scholar] [CrossRef] [Scilit]
  73. Liu, S.; Liu, H.; Chen, X. Does environmental regulation promote corporate green investment? Evidence from China’s new environmental protection law. Environ. Dev. Sustain. 2024, 26, 12589–12618. [Google Scholar]
  74. Kim, Y.; Ryu, D. Firm-specific or market-wide information: How does analyst coverage influence stock price synchronicity? Borsa Istanb. Rev. 2022, 22, 1069–1078. [Google Scholar] [CrossRef] [Scilit]
  75. Liu, B.; McConnell, J.J.; Xu, W. The power of the pen reconsidered: The media, CEO human capital, and corporate governance. J. Bank. Financ. 2017, 76, 175–188. [Google Scholar] [CrossRef] [Scilit]
  76. Li, Y.; Wang, D.; Meng, D.; Hu, Y. Peer effect on climate risk information disclosure. China J. Account. Res. 2024, 17, 100375. [Google Scholar] [CrossRef] [Scilit]
  77. Honey, D.; Ahsan, T.; Migliori, S. The impact of governance quality on corporate climate risk disclosure: The role of the governance committee. Int. Rev. Financ. Anal. 2025, 98, 103901. [Google Scholar] [CrossRef] [Scilit]
  78. Gao, Y.; Saleh, N.M.; Abdullah, A.M. Corporate climate risk disclosure and financing constraints: Evidence from China. Financ. Res. Lett. 2025, 85, 108184. [Google Scholar] [CrossRef] [Scilit]
  79. Rambachan, A.; Roth, J. A more credible approach to parallel trends. Rev. Econ. Stud. 2023, 90, 2555–2591. [Google Scholar] [CrossRef] [Scilit]
  80. Rosenbaum, P.R.; Rubin, D.B. The central role of the propensity score in observational studies for causal effects. Biometrika 1983, 70, 41–55. [Google Scholar] [CrossRef]
  81. Hainmueller, J. Entropy balancing for causal effects: A multivariate reweighting method to produce balanced samples in observational studies. Political Anal. 2012, 20, 25–46. [Google Scholar] [CrossRef] [Scilit]
  82. Goodman-Bacon, A. Difference-in-differences with variation in treatment timing. J. Econom. 2021, 225, 254–277. [Google Scholar] [CrossRef] [Scilit]
  83. Callaway, B.; Sant’Anna, P.H. Difference-in-differences with multiple time periods. J. Econom. 2021, 225, 200–230. [Google Scholar] [CrossRef] [Scilit]
  84. Sun, L.; Abraham, S. Estimating dynamic treatment effects in event studies with heterogeneous treatment effects. J. Econom. 2021, 225, 175–199. [Google Scholar] [CrossRef] [Scilit]
  85. Borusyak, K.; Jaravel, X.; Spiess, J. Revisiting event-study designs: Robust and efficient estimation. Rev. Econ. Stud. 2024, 91, 3253–3285. [Google Scholar] [CrossRef] [Scilit]
  86. Bertrand, M.; Duflo, E.; Mullainathan, S. How much should we trust differences-in-differences estimates? Q. J. Econ. 2004, 119, 249–275. [Google Scholar] [CrossRef] [Scilit]
  87. Wu, N.; Xiao, W.; Liu, W.; Zhang, Z. Corporate climate risk and stock market reaction to performance briefings in China. Environ. Sci. Pollut. Res. 2022, 29, 53801–53820. [Google Scholar] [CrossRef] [Scilit]
  88. Li, Q.; Shan, H.; Tang, Y.; Yao, V. Corporate climate risk: Measurements and responses. Rev. Financ. Stud. 2024, 37, 1778–1830. [Google Scholar] [CrossRef] [Scilit]
Figure 1. Theoretical framework of the AI Pilot Zone and corporate climate risk disclosure.
Sustainability 18 07313 g001
Figure 2. Parallel trends test. Note: the period −1 is used as the benchmark.
Sustainability 18 07313 g002
Figure 3. Sensitivity analysis: relative magnitudes.
Sustainability 18 07313 g003
Figure 4. Sensitivity analysis: smoothness restriction.
Sustainability 18 07313 g004
Figure 5. Covariate balance after nearest-neighbor matching.
Sustainability 18 07313 g005
Figure 6. Covariate balance after caliper matching.
Sustainability 18 07313 g006
Figure 7. Goodman–Bacon decomposition.
Sustainability 18 07313 g007
Figure 8. Dynamic treatment effects [83,84,85].
Sustainability 18 07313 g008
Figure 9. Placebo test.
Sustainability 18 07313 g009
Table 1. Extraction rules for corporate AI-related investment level.
VariableData SourceExtraction FieldKeyword-Matching Rule
AI Hardware InvestmentFixed asset details in notes to financial statementsFixed asset itemComputer, electronic equipment, data equipment, automation equipment, information equipment, server, intelligent terminal, computer room, communication equipment, integrated equipment, storage equipment, computing power, PC, chip, CPU, network
AI Software InvestmentIntangible asset details in notes to financial statementsIntangible asset itemSoftware, intelligent, information platform, system, data, digital, client, service platform, Internet, cloud computing, information technology, 5G, AI, Internet of Things, blockchain, technology, APP, mini-program, webpage, website
Table 2. Descriptive statistics of main variables.
VariableObservationsMeanStdMinMax
CRD28,2970.1800.1780.0251.031
DID28,2970.5170.5000.0001.000
Treat28,2970.5020.4990.0001.000
Post28,2970.2700.4440.0001.000
Size28,29722.2991.34319.67926.398
Lev28,2970.4310.2120.0590.960
ROA28,2970.0310.076−0.3190.221
Growth28,2970.1480.441−0.6512.732
Cash flow28,2970.0450.070−0.1740.242
Board28,2972.1010.1991.6092.639
SOE28,2970.3370.4730.0001.000
Dual28,2970.2950.4560.0001.000
ListAge28,2972.2110.8460.0003.401
lnGDP28,2979.2071.0676.52010.763
IndStr28,2970.5860.1300.3290.848
FinDev28,2974.3891.6631.4288.158
DigEcon28,2970.3040.2130.0140.832
EnvReg28,2970.9520.2280.5051.692
MP28,2977.0072.0673.02612.803
Table 3. Baseline regression results.
(1)(2)
VariableCRDCRD
DID0.0878 **0.0886 ***
(0.0340)(0.0338)
Constant1.6958 ***−3.9293 ***
(0.0095)(0.7320)
ControlsNoYes
Firm fixed effectsYesYes
Year fixed effectsYesYes
Observations28,29728,297
Adj-R20.87140.8752
Note: Robust standard errors clustered at the city level are reported in parentheses. *** and ** indicate significance at the 1% and 5% levels, respectively.
Table 4. Joint significance tests of event–study coefficients.
(1)(2)
Test PeriodF-Statisticp-Value
Pre-Policy Period0.930.4274
Post-Policy Period3.060.0107
Table 5. Robustness test addressing policy selection bias.
(1)(2)
VariableExcluding Strong Digital CitiesExcluding Municipalities
DID0.1302 ***0.0922 **
(0.0500)(0.0465)
Constant−3.7455 ***−3.1502 ***
(1.0861)(0.7951)
ControlsYesYes
Firm fixed effectsYesYes
Year fixed effectsYesYes
Observations19,46422,264
Adj-R20.86160.8698
Note: Robust standard errors clustered at the city level are reported in parentheses. *** and ** indicate significance at the 1% and 5% levels, respectively.
Table 6. PSM-DID regression results.
(1)(2)
VariableNearest-Neighbor Matched SampleCaliper-Matched Sample
DID0.0910 ***0.0928 **
(0.0331)(0.0426)
Constant−3.9864 ***−4.6146 ***
(0.8182)(1.1470)
ControlsYesYes
Firm fixed effectsYesYes
Year fixed effectsYesYes
Observations13,63725,963
Adj-R20.86060.8634
Note: Robust standard errors clustered at the city level are reported in parentheses. *** and ** indicate significance at the 1% and 5% levels, respectively.
Table 7. Controlling for concurrent policy shocks.
(1)(2)(3)(4)(5)
VariableGreen Finance Pilot ZoneLow-Carbon City PilotNational Big Data Pilot ZoneBroadband China PilotAll Concurrent Policies Included Simultaneously
DID0.0846 **0.0856 **0.0910 ***0.0885 ***0.0911 ***
(0.0337)(0.0339)(0.0309)(0.0330)(0.0304)
Constant−4.0018 ***−3.9916 ***−4.0435 ***−3.9271 ***−3.9588 ***
(0.8195)(0.8254)(0.8258)(0.8101)(0.8285)
ControlsYesYesYesYesYes
Firm fixed effectsYesYesYesYesYes
Year fixed effectsYesYesYesYesYes
Observations28,29728,29728,29728,29728,297
Adj-R20.87520.87520.87520.87530.8753
Note: Robust standard errors clustered at the city level are reported in parentheses. *** and ** indicate significance at the 1% and 5% levels, respectively.
Table 8. Goodman–Bacon decomposition results.
Type of Comparison(1)(2)
WeightAverage 2 × 2 DID
Treated group vs. never-treated group0.9180.085
Earlier-treated group vs. later-treated group0.0480.102
Later-treated group vs. earlier-treated group0.0340.135
Table 9. Robustness tests using alternative staggered DID estimators.
(1)(2)(3)(4)
VariableBaseline TWFESun and Abraham [84]Callaway and Sant’Anna [83]Borusyak et al. [85]
DID0.0886 ***0.0732 **0.0853 **0.0763 **
(0.0338)(0.0324)(0.0463)(0.0314)
Observations28,29728,13628,29728,033
Note: Parentheses contain standard errors clustered by city. Columns (2)–(4) report alternative staggered DID estimates that account for heterogeneous treatment effects. *** and ** indicate significance at the 1% and 5% levels, respectively.
Table 10. Alternative measurement of climate risk disclosure.
(1)(2)(3)(4)
VariableCRD1TCRDPCRDCRD_Strict
DID0.0887 **0.0890 **0.00150.0520 ***
(0.0372)(0.0363)(0.0010)(0.0180)
Constant−4.1699 ***−4.0167 ***−0.0512 ***−2.3000 ***
(0.9434)(0.9316)(0.0151)(0.4800)
ControlsYesYesYesYes
Firm fixed effectsYesYesYesYes
Year fixed effectsYesYesYesYes
Observations28,29728,29728,29728,297
Adj-R20.87090.87110.76740.8650
Note: Robust standard errors clustered at the city level are reported in parentheses. *** and ** indicate significance at the 1% and 5% levels, respectively.
Table 11. Robustness tests using alternative clustering levels.
(1)(2)(3)(4)
VariableCity ClusteringFirm ClusteringProvince ClusteringWild-Cluster Bootstrap
DID0.0878 **0.0878 ***0.0878 **0.0878 **
(0.0340)(0.0269)(0.0365)(wild p = 0.0127)
Constant1.6958 ***1.6958 ***1.6958 ***-
(0.0095)(0.0072)(0.0099)-
ControlsYesYesYesYes
Firm fixed effectsYesYesYesYes
Year fixed effectsYesYesYesYes
Observations28,29728,29728,29728,297
Adj-R20.87140.87140.87140.8714
Note: Robust standard errors clustered at the city level are reported in parentheses. *** and ** indicate significance at the 1% and 5% levels, respectively.
Table 12. Additional robustness tests.
(1)(2)(3)(4)(5)
VariableIndustry × Year FEProvince × Year FEAdditional ControlsCity-Specific Time TrendsProvince-Specific Time Trends
DID0.0895 ***0.1255 ***0.0852 **0.0778 **0.0912 ***
(0.0294)(0.0414)(0.0342)(0.0343)(0.0343)
Constant−3.9184 ***−4.0604 ***−3.9837 ***−3.9251 ***−3.9731 ***
(0.7722)(0.8105)(0.8141)(1.4485)(0.8356)
ControlsYesYesYesYesYes
Firm fixed effectsYesYesYesYesYes
Year fixed effectsYesYesYesYesYes
Industry × Year Fixed EffectsYesNoNoNoNo
Province × Year Fixed EffectsNoYesNoNoNo
City-specific Time TrendsNoNoNoYesNo
Province-specific Time TrendsNoNoNoNoYes
Observations28,29728,29728,29728,29728,297
Adj-R20.88640.87680.87550.88010.8759
Note: Robust standard errors clustered at the city level are reported in parentheses. *** and ** indicate significance at the 1% and 5% levels, respectively.
Table 13. Climate-related information-processing capability.
(1)(2)(3)(4)(5)(6)
VariableAICapCRDCRDDigitCRDCRD
DID0.1454 ***0.0810 **0.0677 **0.0457 **0.0862 **0.0741 **
(0.0234)(0.0342)(0.0295)(0.0228)(0.0344)(0.0298)
AICap 0.0617 ***
(0.0092)
Digit 0.0831 ***
(0.0130)
AICap t - 1 0.0353 ***
(0.0083)
Digit t - 1 0.0472 ***
(0.0104)
Constant−3.5324 ***−3.8114 ***−3.7519 ***−0.6247 *−3.9775 ***−3.8313 ***
(0.5532)(0.8214)(0.8862)(0.3493)(0.8180)(0.8869)
ControlsYesYesYesYesYesYes
Firm fixed effectsYesYesYesYesYesYes
Year fixed effectsYesYesYesYesYesYes
Observations28,29728,29723,70528,29728,29723,705
Adj-R20.75840.87580.89780.85370.87600.8978
Note: Robust standard errors clustered at the city level are reported in parentheses. ***, **, and * indicate significance at the 1%, 5%, and 10% levels, respectively.
Table 14. Climate risk governance capability.
(1)(2)(3)(4)(5)(6)
VariableGreenInnovCRDCRDEnvInvCRDCRD
DID0.0907 ***0.0762 **0.0671 **0.1802 ***0.0746 **0.0654 **
(0.0216)(0.0325)(0.0290)(0.0669)(0.0324)(0.0290)
GreenInnov 0.1000 ***
(0.0194)
EnvInv 0.0592 ***
(0.0191)
GreenInnov t - 1 0.0589 ***
(0.0185)
EnvInv t - 1 0.0449 ***
(0.0118)
Constant−2.7420 ***−3.7257 ***−3.7645 ***−4.2309 ***−3.7492 ***−3.6967 ***
(0.3145)(0.8083)(0.8809)(0.8240)(0.7903)(0.8607)
ControlsYesYesYesYesYesYes
Firm fixed effectsYesYesYesYesYesYes
Year fixed effectsYesYesYesYesYesYes
Observations28,29728,29723,70528,29728,29723,705
Adj-R20.66740.87570.89780.69110.87610.8980
Note: Robust standard errors clustered at the city level are reported in parentheses. *** and ** indicate significance at the 1% and 5% levels, respectively.
Table 15. External monitoring pressure.
(1)(2)(3)(4)(5)(6)
VariableAnalystCRDCRDMediaCRDCRD
DID0.0407 *0.0857 **0.0718 **0.0939 **0.0851 **0.0716 **
(0.0223)(0.0341)(0.0300)(0.0460)(0.0338)(0.0298)
Analyst 0.0128 **
(0.0060)
Media 0.0206 **
(0.0088)
Analyst t - 1 0.0101 *
(0.0059)
Media t - 1 0.0111 **
(0.0046)
Constant−0.5547 *−4.0074 ***−3.8725 ***−1.3453 ***−3.7665 ***−3.7100 ***
(0.2968)(0.8201)(0.8860)(0.5778)(0.8071)(0.8970)
ControlsYesYesYesYesYesYes
Firm fixed effectsYesYesYesYesYesYes
Year fixed effectsYesYesYesYesYesYes
Observations28,29728,29723,70528,29728,29723,705
Adj-R20.79260.87520.89770.71170.87530.8977
Note: Robust standard errors clustered at the city level are reported in parentheses. ***, **, and * indicate significance at the 1%, 5%, and 10% levels, respectively.
Table 16. Heterogeneity test results.
Variable(1)(2)(3)(4)(5)(6)
Environmental PressureInstitutional OwnershipExecutive Green Awareness
HighLowHighLowHighLow
CRDCRDCRDCRDCRDCRD
DID0.2039 *0.0818 ***0.1040 **0.04480.1248 **0.0260
(0.1100)(0.0294)(0.0486)(0.0316)(0.0542)(0.0297)
Constant−3.1201−3.8561 ***−3.7732 ***−3.5972 ***−4.0623 ***−3.6502 ***
(2.0168)(0.7815)(1.1606)(0.9563)(1.1628)(0.8932)
ControlsYesYesYesYesYesYes
Firm fixed effectsYesYesYesYesYesYes
Year fixed effectsYesYesYesYesYesYes
Observations570722,59013,97114,36214,13514,162
Adj-R20.90110.87730.89990.87170.89140.8835
Chowtest8.22 (p = 0.0042)13.65 (p = 0.0003)8.94 (p = 0.003)
Note: Robust standard errors clustered at the city level are reported in parentheses. ***, **, and * indicate significance at the 1%, 5%, and 10% levels, respectively.
Table 17. Further analysis: climate risk disclosure and ESG performance.
(1)(2)(3)(4)(5)
VariableESG ScoreESG ScoreE-ScoreS-ScoreG-Score
CRD0.1149 *0.1349 **0.1784 **0.16730.1552 **
(0.0661)(0.0672)(0.0756)(0.1162)(0.0738)
CRD_DID 0.6121 ***
(0.1601)
DID 0.7396 ***
(0.1920)
Constant41.2314 ***42.3440 ***43.7257 ***37.9385 ***38.1672 ***
(2.8379)(2.8261)(4.0281)(5.7200)(4.8232)
ControlsYesYesYesYesYes
Firm fixed effectsYesYesYesYesYes
Year fixed effectsYesYesYesYesYes
Observations28,29728,29728,29728,29728,297
Adj-R20.50640.50740.50400.48900.4485
Note: Robust standard errors clustered at the city level are reported in parentheses. ***, **, and * indicate significance at the 1%, 5%, and 10% levels, respectively.
Table 18. Climate risk disclosure and carbon emissions.
(1)(2)
VariableCarbonCarbonIntensity
CRD−0.8243 *−0.3547 **
(0.4777)(0.1530)
Constant2.3476−0.2087
(2.4466)(1.0357)
ControlsYesYes
Firm fixed effectsYesYes
Year fixed effectsYesYes
Observations21,46921,469
Adj-R20.87760.7190
Note: Carbon denotes firms’ total carbon emissions, measured in tons and divided by 10,000 for scale adjustment. Carbon intensity is measured as total carbon emissions scaled by total assets. Standard errors clustered by city are shown in parentheses. ** and * denote statistical significance at the 5% and 10% levels, respectively.
Disclaimer/Publisher’s Note: The statements, opinions and data contained in all publications are solely those of the individual author(s) and contributor(s) and not of MDPI and/or the editor(s). MDPI and/or the editor(s) disclaim responsibility for any injury to people or property resulting from any ideas, methods, instructions or products referred to in the content.