Biogenic Compounds and ATP Measurement as Indicators for Assessing Operational Risk and Biological Stability of Tap Water
Abstract
1. Introduction
2. Materials and Methods
2.1. Study Area—Water Sampling
2.2. Chemical Analysis
2.3. Microbial Analysis
2.4. Assessment of Tap Water Stability
2.4.1. Physical Stability of Water
2.4.2. Chemical Stability of Water
2.4.3. Biological Stability of Water
3. Results and Discussion
3.1. Analysis of the Physicochemical Quality of Tap Water
3.2. Microbiological Parameters in the Assessment of the Sanitary Quality of Tap Water
4. Conclusions
Author Contributions
Funding
Institutional Review Board Statement
Informed Consent Statement
Data Availability Statement
Conflicts of Interest
Abbreviations
| EU | European Union |
| DWD | Drinking Water Directive |
| WTP | water treatment plant |
| BDOC | biologically dissolved organic carbon |
| TOC | total organic carbon |
| DOC | dissolved organic carbon |
| THMs | trihalomethanes |
| HAAs | haloacetic acids |
| TBC | total bacterial count |
| PE | polyethylene |
| PVC | polyvinyl chloride |
References
- Directive (EU) 2020/2184 of the European Parliament and of the Council of 16 December 2020 on the Quality of Water Intended for Human Consumption (Recast) ELI. Available online: http://data.europa.eu/eli/dir/2020/2184/oj (accessed on 11 November 2025).
- Lin, L.; Yang, H.; Xu, X. Effects of water pollution on human health and disease heterogeneity: A review. Front. Environ. Sci. 2022, 10, 880246. [Google Scholar] [CrossRef]
- Halder, J.; Islam, N.; Islam, N. Water Pollution and its Impact on the Human Health. J. Environ. Hum. 2015, 2, 36–46. [Google Scholar] [CrossRef]
- Chowdhary, P.; Bharagava, R.N.; Mishra, S.; Khan, N. Role of Industries in Water Scarcity and its Adverse Effects on Environment and Human Health. In Environmental Concerns and Sustainable Development; Springer: Singapore, 2020; pp. 235–256. [Google Scholar] [CrossRef]
- Papciak, D.; Zdeb, M. Rainwater Treatment Technology for the Hygienic and Food Purposes in Households. In Proceedings of CEE 2023, Rzeszów, Poland, 6–8 September 2023; Lecture Notes in Civil Engineering; Springer: Cham, Switzerland, 2024; Volume 438, pp. 295–307. [Google Scholar] [CrossRef]
- Wichrowska, B.; Życiński, D.; Krogulska, B. Wpływ przewodów wodociągowych na jakość wody do picia. Rocz. PZH 1997, 48, 415–423. [Google Scholar]
- Li, M.; Liu, Z.; Chen, Y.; Hai, Y. Characteristics of iron corrosion scales and water quality variations in drinking water distribution systems of different pipe materials. Water Res. 2016, 106, 593–603. [Google Scholar] [CrossRef] [PubMed]
- Slavik, I.; Oliveira, K.R.; Cheung, P.B.; Uhl, W. Water quality aspects related to domestic drinking water storage tanks and consideration in current standards and guidelines throughout the world—A review. J. Water Health 2020, 18, 439–441. [Google Scholar] [CrossRef] [PubMed]
- Boryczko, K. Water age in the water supply network as health risk factor associated with collective water supply. Ecol. Chem. Eng. A 2016, 23, 33–43. [Google Scholar] [CrossRef] [PubMed]
- Domańska, M.; Łomotowski, J. Badania nad szybkością zaniku chloru i dwutlenku chloru w wodzie w sieci wodociągowej. Ochr. Śr. 2009, 31, 47–49. [Google Scholar]
- Wang, Z.; Yang, X.; Fu, L.; Li, M. A review of secondary contamination of drinking water quality in distribution systems: Sources, mechanisms, and prospects Open Access. AQUA-Water Infrastruct. Ecosyst. Soc. 2025, 74, 118–141. [Google Scholar] [CrossRef]
- Papciak, D.; Domon, A.; Zdeb, M.; Skwarczynska-Wojsa, A.; Konkol, J. Optimization of Quantitative Analysis of Biofilm Cell from Pipe Materials. Coatings 2021, 11, 1286. [Google Scholar] [CrossRef]
- Muhammad, M.H.; Idris, A.L.; Fan, X.; Guo, Y.C.; Yu, Y.Y.; Jin, X.; Qiu, J.Z.; Guan, X.; Huang, T.P. Beyond risk: Bacterial biofilms and their regulating approaches. Front. Microbiol. 2020, 11, 89–99. [Google Scholar] [CrossRef] [PubMed]
- Grabińska-Łoniewska, A. Sieć wodociągowa jako środowisko bytowania i przenoszenia mikroorganizmów. Technol. Wody 2011, 3, 14–18. [Google Scholar]
- Kręgiel, D. Pandemia COVID-19 a występowanie bakterii Legionella sp. w systemach wody ciepłej—Ocena ryzyka. Gaz. Woda Tech. Sanit. 2020, 1, 32–35. [Google Scholar]
- Regulation of the Minister of Health of December 7, 2017 on the Quality of Water Intended for Human Consumption (Journal of Laws 2017, Item 2294). Available online: https://isap.sejm.gov.pl/isap.nsf/download.xsp/WDU20170002294/O/D20172294.pdf (accessed on 11 November 2025).
- Prest, E.; Hammes, I.; van Loosdrecht, F.; Vrouwenvelder, M. Biological Stability of Drinking Water: Controlling Factors, Methods, and Challenges. Front. Microbiol. 2016, 7, 45. [Google Scholar] [CrossRef] [PubMed]
- Wang, H.; Masters, S.; Edwards, M.; Falkinham, J.O.; Pruden, A. Effect of Disinfectant, Water Age, and Pipe Materials on Bacterial and Eukaryotic Community Structure in Drinking Water Biofilm. Environ. Sci. Technol. 2014, 48, 1426–1435. [Google Scholar] [CrossRef] [PubMed]
- Waqas, U.; Farhan, A.; Haider, A.; Qumar, U.; Raza, A. Advancements in biofilm formation and control in potable water distribution systems: A comprehensive review and analysis of chloramine decay in water systems. J. Environ. Chem. Eng. 2023, 11, 111377. [Google Scholar] [CrossRef]
- Piegdon, I. Variability of Drinking Water Quality on the Basis of Analysis of Qualitative Monitoring from a Selected Water Supply Network Located in South-Eastern Poland. Water 2024, 16, 3355. [Google Scholar] [CrossRef]
- Hammes, F.; Berney, M.; Wang, Y.; Vital, M.; Köster, O.; Egli, T. Flow-cytometric total bacterial cell counts as a descriptive microbiological parameter for drinking water treatment processes. Water Res. 2008, 42, 269–277. [Google Scholar] [CrossRef] [PubMed]
- Jachimowski, A. Efficiency of removing biogenic compounds in water treatment. Ecol. Eng. Environ. Technol. 2017, 18, 97–106. [Google Scholar] [CrossRef] [PubMed][Green Version]
- Pietrzyk, A.; Papciak, D. The effectiveness of organic matter removal in unit processes of the technological groundwater treatment system. E3S Web Conf. 2018, 44, 00142. [Google Scholar] [CrossRef]
- Domoń, A.; Kowalska, B.; Papciak, D.; Wojtas, E. Assessment of the stability of tap water in the distribution system. Desalination Water Treat. 2025, 322, 101130. [Google Scholar] [CrossRef]
- Bonenberg, W.; Rybicki, S.M.; Schneider-Skalska, G.; Stochel-Cyunel, J. Sustainable water management in a Krakow housing complex from the nineteen seventies in comparison with a model bio-morpheme unit. Sustainability 2022, 14, 5499. [Google Scholar] [CrossRef]
- Domon, A.; Papciak, D.; Tchórzewska-Cieslak, B. Influence of Water Treatment Technology on the Stability of Tap Water. Water 2023, 15, 911. [Google Scholar] [CrossRef]
- PN-EN ISO 19458:2007; Water Quality—Sampling for Microbiological Analysis. Polish Committee for Standardization: Warsaw, Poland, 2007.
- Vreeburg, J.H.G.; Schippers, D.; Verberk, J.Q.J.C.; van Dijk, J.C. Impact of particles on sediment accumulation in a drinking water distribution system. Water Res. 2008, 42, 4233–4242. [Google Scholar] [CrossRef] [PubMed]
- Liu, G.; Zhang, Y.; Knibbe, W.-J.; Feng, C.; Liu, W.; Medema, G.; van der Meer, W. Potential impacts of changing supply-water quality on drinking water distribution: A review. Water Res. 2017, 116, 135–148. [Google Scholar] [CrossRef] [PubMed]
- Wolska, M. Biological stability of water in water distribution systems. The effect of water treatment trials. Environ. Prot. Eng. 2015, 41, 147–157. [Google Scholar] [CrossRef]
- Wolska, M.; Mołczan, M. Ocena stabilności wody wprowadzanej do sieci wodociągowej. Ochr. Sr. 2015, 37, 51–65. [Google Scholar]
- Papciak, D.; Tchórzewska-Cieślak, B.; Pietrucha-Urbanik, K.; Pietrzyk, A. Analysis of the biological stability of tap water on the basis of risk analysis and parameters limiting the secondary growth of microorganisms in water distribution systems. Desalin. Water Treat. 2018, 117, 1–8. [Google Scholar] [CrossRef]
- Riyadh, A.; Peleato, N. Natural Organic Matter Character in Drinking Water Distribution Systems: A Review of Impacts on Water Quality and Characterization Techniques. Water 2024, 16, 446. [Google Scholar] [CrossRef]
- García-Ávila, F.; Ramos-Fernández, L.; Zhindón-Arévalo, C. Estimation of corrosive and scaling trend in drinking water systems in the city of Azogues Ecuador. Rev. Ambiente Água 2018, 13, e2237. [Google Scholar] [CrossRef]
- Background Documents for Development of WHO Guidelines for Drinking-Water Quality, 4th ed. Incorporating the First and Second Addenda. 22 December 2021. Available online: https://www.who.int/publications/m/item/background-documents-for-development-of-who-guidelines-for-drinking-water-quality--4th-ed.-incorporating-the-first-and-second-addenda (accessed on 1 December 2025).
- Fang, W.; Hu, J.Y.; Ong, S.L. Influence of phosphorus on biofilm formation in model drinking water distribution systems. J. Appl. Microbiol. 2009, 106, 1328–1335. [Google Scholar] [CrossRef] [PubMed]
- Rosales, E.; Del Olmo, G.; Calero Preciado, C.; Douterelo, I. Phosphate Dosing in Drinking Water Distribution Systems Promotes Changes in Biofilm Structure and Functional Genetic Diversity. Front. Microbiol. 2020, 11, 599091. [Google Scholar] [CrossRef] [PubMed]
- Huang, C.; Ginn, T.R.; Clark, G.G.; Zaki, F.R.; Won, J.; Boppart, S.A.; Nguyen, T.H. Phosphate-Based Corrosion Inhibition in Drinking Water Systems and Effects on Disinfectant Decay and Biofilm Growth. Environ. Eng. Sci. 2023, 40, 634–644. [Google Scholar] [CrossRef]
- Lehtola, M.J.; Miettinen, I.T.; Vartiainen, T.; Martikainen, P.J. Changes in content of microbially available phosphorus, assimilable organic carbon and microbial growth potential during drinking water treatment processes. Water Res. 2002, 36, 3681–3690. [Google Scholar] [CrossRef] [PubMed]
- Garci-a-Avila, F.; Sanchez-Alvarracin, C.; Cadme-Galabay, M.; Conchado-Martinez, J.; Garcia-Mera, G.; Zhindon-Arevalo, C. Relationship between chlorine decay and temperature in the drinking water. MethodsX 2020, 7, 101002. [Google Scholar] [CrossRef] [PubMed]
- US Environmental Protection Agency. The Effectiveness of Disinfectant Residuals in the Distribution System; US Environmental Protection Agency: Washington, DC, USA, 2010. Available online: https://www.epa.gov/sites/default/files/2021-05/documents/effectiveness_of_disinfectant_residuals_final_-_3-7-07.pdf (accessed on 1 December 2025).
- Kalita, I.; Kamilaris, A.; Havinga, P.; Reva, I. Assessing the Health Impact of Disinfection Byproducts in Drinking Water. ACS EST Water 2024, 4, 1564–1578. [Google Scholar] [CrossRef] [PubMed]
- Kali, S.; Khan, M.; Ghaffar, M.S.; Waseem, S.; Mazhar Iqbal, A.; Bilal khan Niaz, M.; Iqbal Zafar, M. Occurrence, influencing factors, toxicity, regulations, and abatement approaches for disinfection by-products in chlorinated drinking water: A comprehensive review. Environ. Pollut. 2021, 281, 116950. [Google Scholar] [CrossRef] [PubMed]
- Available online: https://mpwik.rzeszow.pl/download-category/jakosc-wody/ (accessed on 28 January 2026).
- Winter, J.; Barbeau, B.; Bérubé, P. Nanofiltration and tight ultrafiltration membranes for natural organic matter removal-Contribution of fouling and concentration polarization to filtration resistance. Membranes 2017, 7, 34. [Google Scholar] [CrossRef] [PubMed]
- Wang, L.; Zhang, L.; Lv, J.; Zhang, Y.; Ye, B. Public Awareness of Drinking Water Safety and Contamination Accidents: A Case Study in Hainan Province, China. Water 2018, 10, 446. [Google Scholar] [CrossRef]
- Nappier, S.P.; Soller, J.A.; Eftim, S.E. Potable water reuse: What are the microbiological risks? Curr. Environ. Health Rep. 2018, 5, 283–292. [Google Scholar] [CrossRef] [PubMed]
- Some, S.; Mondal, R.; Mitra, D.; Jain, D.; Verma, D.; Das, S. Microbial pollution of water with special reference to coliform bacteria and their nexus with environment. Energy Nexus 2021, 1, 100008. [Google Scholar] [CrossRef]
- Wen, X.; Chen, F.; Lin, Y.; Zhu, H.; Yuan, F.; Kuang, D.; Jia, Z.; Yuan, Z. Microbial Indicators and Their Use for Monitoring Drinking Water Quality—A Review. Sustainability 2020, 12, 2249. [Google Scholar] [CrossRef]
- Total Microorganism Count at 22 °C in Water Intended for Human Consumption; Prepared at the Request of the Chief Sanitary Inspectorate: Matuszewska, R. Krogulska, B. Maziarka, D.—Department of Environmental Health Safety, National Institute of Public Health—National Institute of Hygiene (Poland). Chief Sanitary Inspectorate 2018. Available online: https://www.gov.pl/web/psse-gliwice/wytyczne-gis-nadzor-wody (accessed on 28 January 2026).
- Pistelok, F.; Ficek, A.; Stuczyński, T.; Wiera, B. Wykorzystanie testu ATP do oceny jakości wody przeznaczonej do spożycia na przykładzie małych wodociągów. Ochr. Śr. 2014, 36, 29–35. (In Polish) [Google Scholar]
- Masłoń, A.; Tomaszek, J.; Zamorska, J.; Zdeb, M.; Piech, A.; Opaliński, I.; Jurczyk, Ł. The impact of powdered keramsite on activated sludge and wastewater treatment in a sequencing batch reactor. J. Environ. Manag. 2019, 237, 305–312. [Google Scholar] [CrossRef] [PubMed]
- Siebel, E.; Wang, Y.; Egli, T.; Hammes, F. Correlations between total cell concentration, total adenosine tri-phosphate concentration and heterotrophic plate counts during microbial monitoring of drinking water. Drink. Water Eng. Sci. 2008, 1, 71–86. [Google Scholar] [CrossRef]
- Vang, Ó.K.; Corfitzen, C.B.; Smith, C.; Albrechtsen, H.J. Evaluation of ATP measurements to detect microbial ingress by wastewater and surface water in drinking water. Water Res. 2014, 64, 309–320. [Google Scholar] [CrossRef] [PubMed]
- Chen, W.S.; Abkar, L.; Mohseni, M. Evaluating ATP testing for distribution system monitoring: Comparison to HPC, impact of chlorine quenching, and hold time dependency. J. Biol. Eng. 2024, 18, 63. [Google Scholar] [CrossRef] [PubMed]
- Zamorska, J.; Karwowska, E.; Przystaś, W. Assessment of Microbiological Quality of Water Using Culture Methods, Flow Cytometry and Luminometry. Water 2023, 15, 4077. [Google Scholar] [CrossRef]
- Hammes, F.; Berger, C.; Köster, O.; Egli, T. Assessing biological stability of drinking water without disinfectant residuals in a full-scale water supply system. J. Water Supply Res. Technol.-Aqua 2010, 59, 31–40. [Google Scholar] [CrossRef]
- Epstein, S. The phenomenon of microbial uncultivability. Curr. Opin. Microbiol. 2013, 16, 636–642. [Google Scholar] [CrossRef] [PubMed]
- Learbuch, K.; Smidt, H.; van der Wielen, P. Water and biofilm in drinking water distribution systems in the Netherlands. Sci. Total Environ. 2022, 831, 154940. [Google Scholar] [CrossRef] [PubMed]
- Zhang, H.; Xu, L.; Huang, T.; Yan, M.; Liu, K.; Miao, Y.; He, H.; Li, S.; Sekar, R. Combined effects of seasonality and stagnation on tap water quality: Changes in chemical parameters, metabolic activity and co-existence in bacterial community. J. Hazard. Mater. 2021, 403, 124018. [Google Scholar] [CrossRef] [PubMed]
- Nescerecka, A.; Rubulis, J.; Vital, M.; Juhna, T.; Hammes, F. Biological instability in a chlorinated drinking water distribution network. PLoS ONE 2014, 9, e96354. [Google Scholar] [CrossRef] [PubMed]
- Lautenschlager, K.; Boon, N.; Wang, Y.; Egli, T.; Hammes, F. Overnight stagnation of drinking water in household taps induces microbial growth and changes in community composition. Water Res. 2010, 44, 4868–4877. [Google Scholar] [CrossRef] [PubMed]
- Van der Wielen, P.W.; van der Kooij, D. Effect of water composition, distance and season on the adenosine triphosphate concentration in unchlorinated drinking water in the Netherlands. Water Res. 2010, 44, 4860–4867. [Google Scholar] [CrossRef] [PubMed]
- Hansen, C.B.; Kerrouche, A.; Tatari, K.; Rasmussen, A.; Ryan, T.; Summersgill, P.; Desmulliez, M.P.Y.; Bridle, H.; Albrechtsen, H.-J. Monitoring of drinking water quality using automated ATP quantification. J. Microbiol. Methods 2019, 165, 105713. [Google Scholar] [CrossRef] [PubMed]
- Vital, M.; Dignum, M.; Magic-Knezev, A.; Ross, P.; Rietveld, L.; Hammes, F. Flow cytometry and adenosine tri-phosphate analysis: Alternative possibilities to evaluate major bacteriological changes in drinking water treatment and distribution systems. Water Res. 2012, 46, 4665–4676. [Google Scholar] [CrossRef] [PubMed]
- Besmer, M.D.; Weissbrodt, D.G.; Kratochvil, B.E.; Sigrist, J.A.; Weyland, M.S.; Hammes, F. The feasibility of automated online flow cytometry for in-situ monitoring of microbial dynamics in aquatic ecosystems. Front. Microbiol. 2014, 5, 265. [Google Scholar] [CrossRef] [PubMed]
- Zdeb, M.; Papciak, D. Disinfection of Rainwater for Economic Purposes. Sustainability 2023, 15, 16121. [Google Scholar] [CrossRef]
- Fish, K.E.; Osborn, A.M.; Boxall, J. Characterising and understanding the impact of microbial biofilms and the extracellular polymeric substance (EPS) matrix in drinking water distribution systems. Environ. Sci. Water Res. Technol. 2016, 2, 614–630. [Google Scholar] [CrossRef]
- Roeselers, G.; Coolen, J.; van der Wielen, P.W.J.J.; Jaspers, M.C.; Atsma, A.; de Graaf, B.; Schuren, F. Microbial biogeography of drinking water: Patterns in phylogenetic diversity across space and time. Environ. Microbiol. 2015, 17, 2505–2514. [Google Scholar] [CrossRef] [PubMed]


| Stability Assessment | Method | Technology | Stability Criterion | Purpose |
|---|---|---|---|---|
| Physical | Turbidity | Water turbidity measurement | <0.8–1 NTU | Evaluation of water clarity |
| Chemical | Langelier Saturation Index (LSI) Ryznar Stability Index (RSI) Strochecker Index (SI) | Measurement of alkalinity and pH | −0.5 < LSI < 0.5 6 < RSI < 7 SI = 0 | Evaluation of the scaling or corrosive tendency of water |
| Biological | Biogenic compounds: Assimilable and Biodegradable Dissolved Organic Carbon (AOC/BDOC), phosphates and the sum of inorganic nitrogen compounds | Measurement of content: TOC DOC P-PO43− N-NH4+ N-NO2− N-NO3− | The stability conditions BDOC ≤ 0.25 mg C/L Ninorg. ≤ 0.2 mg N/L P ≤ 0.01 mg P-PO43−/L | Estimation of biological stability of water as an acceptable level; water quality requires monitoring (possibility of changes in water quality in the system); biologically unstable water indicates a high probability of secondary water contamination. |
| Biofilm monitoring | Pipe coupons, sensors | Qualitative studies of biofilm using instrumental methods | Assessment of biofilm formation and prediction of possible secondary water contamination | |
| Microbiological quality of water | Measurement of the total number of bacteria—HTP method using R2A Agar Escherichia coli and Enterococcus—using the membrane filtration procedure | The total number of bacteria at 37 °C <20 CFU/mL 22 °C <200 CFU/mL * Escherichia coli: 0 CFU/100 mL Enteroccocus: 0 CFU/100 mL | Water safely for drinking purposes |
| Parameter | Unit | Analytical Method/Standard |
|---|---|---|
| pH | - | ELMETRON CX-505 (ELMETRON GP, Zabrze, Poland) |
| Colour | mg Pt/L | Spectrophotometric method using a Hach-Lange DR 5000 spectrophotometer (Hach Company, Loveland, CO, USA) |
| Turbidity | NTU | 2100P ISO TURBIDIMETER HACH (Hach Company, Loveland, CO, USA) |
| TOC | mg C/L | TOC analyser Sievers 5310 C (SUEZ, Boulder, CO, USA); |
| Ammonium nitrogen | mg N-NH4+/L | Spectrophotometric method 8155 (sachet tests—Ammonia Salicylate (1) and Cyanurate (2)) using a Hach-Lange DR 5000 spectrophotometer |
| Nitrite nitrogen | mg N-NO2−/L | Colorimetric method by Nitrite Test Merck 1.14408 (Merck KGaA (Darmstadt, Germany)) |
| Nitrate nitrogen | mg N-NO3−/L | Spectrophotometric method 8039 (sachet tests—NitraVer5) usinga Hach-Lange DR 5000 spectrophotometer |
| Phosphates | mg P-PO43−/L | Spectrophotometric method 8048 (sachet tests—PhosVer3) usinga Hach-Lange DR 5000 spectrophotometer |
| Parameter | Unit | Analytical Method/Standard |
|---|---|---|
| The total number of bacteria at 37 °C and at 22 °C | CFU/mL | HTP method using R2A Agar (CM0906) manufactured by Oxoid Thermo Scientific (Oxford, UK) (incubation for 7 days) |
| Escherichia coli | CFU/100 mL | Membrane filtration procedure using Chromocult® Coliform Agar (MERCK, Warsaw, Poland) |
| Enterococcus | CFU/100 mL | Membrane filtration procedure using Slanetz and Bartley Agar (MERCK, Poland) |
| ATP concentration | RLU/100 µL | Luminometric method; determination according to protocol Promega https://pl.promega.com/resources/protocols/technical-manuals/0/glomax-2020-luminometer-protocol/ (accessed on 1 December 2025) LuminUltra 20/20 |
| Biologically stable water—acceptable level of water safety if: |
| BDOC ≤ 0.25 mg C/L AND Ninorg. ≤ 0.2 mg N/L AND P ≤ 0.01 mg P-PO43−/L OR BDOC ≤ 0.25 mg C/L AND = Ninorg. ≤ 0.2 mg N/L AND P > 0.01 mg P-PO43−/L OR BDOC ≤ 0.25 mg C/L AND = Ninorg. > 0.2 mg N/L AND P ≤ 0.01 mg P-PO43−/L OR BDOC > 0.25 mg C/L AND Ninorg. ≤ 0.2 mg N/L AND P ≤ 0.01 mg P-PO43−/L |
| Water requires monitoring, if: |
| BDOC > 0.25 mg C/L AND Ninorg. > 0.2 mg N/L AND P ≤ 0.01 mg PO43−/L OR BDOC > 0.25 mg C/L AND Ninorg. ≤ 0.2 mg N/L AND P > 0.01 mg PO43−/L OR BDOC ≤ 0.25 mg C/L AND Nnieorg. > 0.2 mg N/L AND P > 0.01 mg PO43−/L |
| Biologically unstable water—high probability of secondary water contamination, if: |
| BDOC > 0.25 mg C/L AND Ninorg. > 0.2 mg N/L AND P > 0.01 mg PO43−/L |
| Parameter | Unit | WTP | P-1 | P-2 | P-3 | P-4 | P-5 | P-6 |
|---|---|---|---|---|---|---|---|---|
| Mean ± SD and Range (Min–Max) | ||||||||
| pH | - | 7.83 ± 0.12 (7.70–7.92) | 7.80 ± 0.21 (7.48–8.05) | 7.87 ± 0.14 (7.75–8.04) | 7.51 ± 0.47 (7.30–7.89) | 7.79 ± 0.29 (7.28–8.03) | 7.63 ± 0.35 (7.11–7.92) | 7.65 ± 0.41 (6.97–8.01) |
| Colour | mg Pt/L | <5.00 | 2.00 ± 3.46 (0.00–8.00) | 1.40 ± 1.14 (0.00–3.00) | 0.80 ± 1.30 (0.00–3.00) | 0.20 ± 0.45 (0.00–1.00) | 0.40 ± 0.55 (0.00–1.00) | 0.60 ± 0.89 (0.00–2.00) |
| Conductivity | µS/cm | 655 ± 84.9 (562–727) | 672 ± 118.5 (529–778) | 650 ± 96.29 (542–730) | 673 ± 115.6 (529–759) | 669 ± 105.2 (552–751) | 668 ± 81.03 (577–742) | 669 ± 95.53 (553–748) |
| Turbidity | NTU | <0.2 | 0.53 ± 0.21 (0.34–0.85) | 0.34 ± 0.16 (0.17–0.56) | 0.38 ± 0.12 (0.22–0.54) | 0.40 ± 0.18 (0.21–0.69) | 0.36 ± 0.06 (0.31–0.45) | 0.56 ± 0.29 (0.26–0.92) |
| Nitrites | mg N-NO2/L | <0.05 | 0.00 ± 0.00 (0.00–0.00) | 0.0003 ± 0.00 (0.00–0.002) | 0.00 ± 0.00 (0.00–0.00) | 0.00 ± 0.00 (0.00–0.00) | 0.00 ± 0.00 (0.00–0.00) | 0.0038 ± 0.00 (0.00–0.019) |
| Ammonium nitrogen | mg N-NH4+/L | - * | 0.01 ± 0.00 (0.00–0.03) | 0.02 ± 0.00 (0.00–0.06) | 0.00 ± 0.00 (0.00–0.01) | 0.01 ± 0.00 (0.00–0.05) | 0.02 ± 0.00 (0.00–0.10) | 0.01 ± 0.00 (0.00–0.03) |
| Nitrates | mg N-NO3/L | 1.79 ± 0.16 (1.69–2.03) | 1.48 ± 0.48 (1.00–2.00) | 1.66 ± 0.38 (1.30–2.20) | 1.38 ± 0.48 (0.90–2.10) | 1.60 ± 0.24 (1.30–1.90) | 1.40 ± 0.29 (1.00–1.70) | 1.58 ± 0.71 (1.00–2.70) |
| Alkalinity | mval/L | - | 3.98 ± 0.36 (3.4–4.4) | 4.02 ± 0.50 (3.40–4.70) | 4.02 ± 0.52 (3.30–4.70) | 4.12 ± 0.56 (3.20–4.70) | 4.06 ± 0.60 (3.10–4.70) | 4.00 ± 0.59 (3.40–4.70) |
| Total hardness | mg CaCO3/L | 279 ± 25.73 (250–300) | 318 ± 34.93 (280–368) | 322 ± 33.81 (274–360) | 314 ± 46.76 (302–380) | 324 ± 48.25 (280–405) | 301 ± 48.83 (251–380) | 298 ± 28.05 (266–332) |
| Chlorides | mg Cl−/L | 36 ± 4.72 (29–40) | 45 ± 9.42 (38–56) | 46 ± 9.13 (35–54) | 46 ± 7.60 (39–57) | 45 ± 10.06 (35–58) | 42 ± 9.17 (33–55) | 42 ± 6.20 (35–49) |
| Phosphates | mg P-PO43−/L | - | 0.14 ± 0.14 (0.01–0.30) | 0.16 ± 0.13 (0.06–0.31) | 0.20 ± 0.35 (0.01–0.83) | 0.13 ± 0.11 (0.03–0.28) | 0.09 ± 0.06 (0.02–0.18) | 0.17 ± 0.20 (0.01–0.51) |
| Sulphates | mg SO42−/L | 39 ± 6.14 (32–44) | 40 ± 11.37 (23–47) | 42 ± 7.29 (32–48) | 43 ± 7.52 (33–50) | 43 ± 7.16 (39–50) | 43 ± 7.07 (33–48) | 44 ± 6.23 (35–49) |
| Free chlorine | mg Cl2/L | - | 0.01 ± 0.01 (0.00–0.02) | 0.05 ± 0.02 (0.03–0.06) | 0.03 ± 0.02 (0.02–0.06) | 0.02 ± 0.02 (0.00–0.03) | 0.03 ± 0.01 (0.02–0.03) | 0.06 ± 0.05 (0.02–0.11) |
| TOC | mg C/L | 1.83 ± 0.12 (1.7–1.9) | 2.16 ± 0.74 (1.74–3.44) | 2.16 ± 0.17 (1.99–2.40) | 1.96 ± 0.16 (1.77–2.20) | 2.02 ± 0.07 (1.94–2.05) | 2.17 ± 0.29 (1.81–2.60) | 1.91 ± 0.15 (1.86–2.11) |
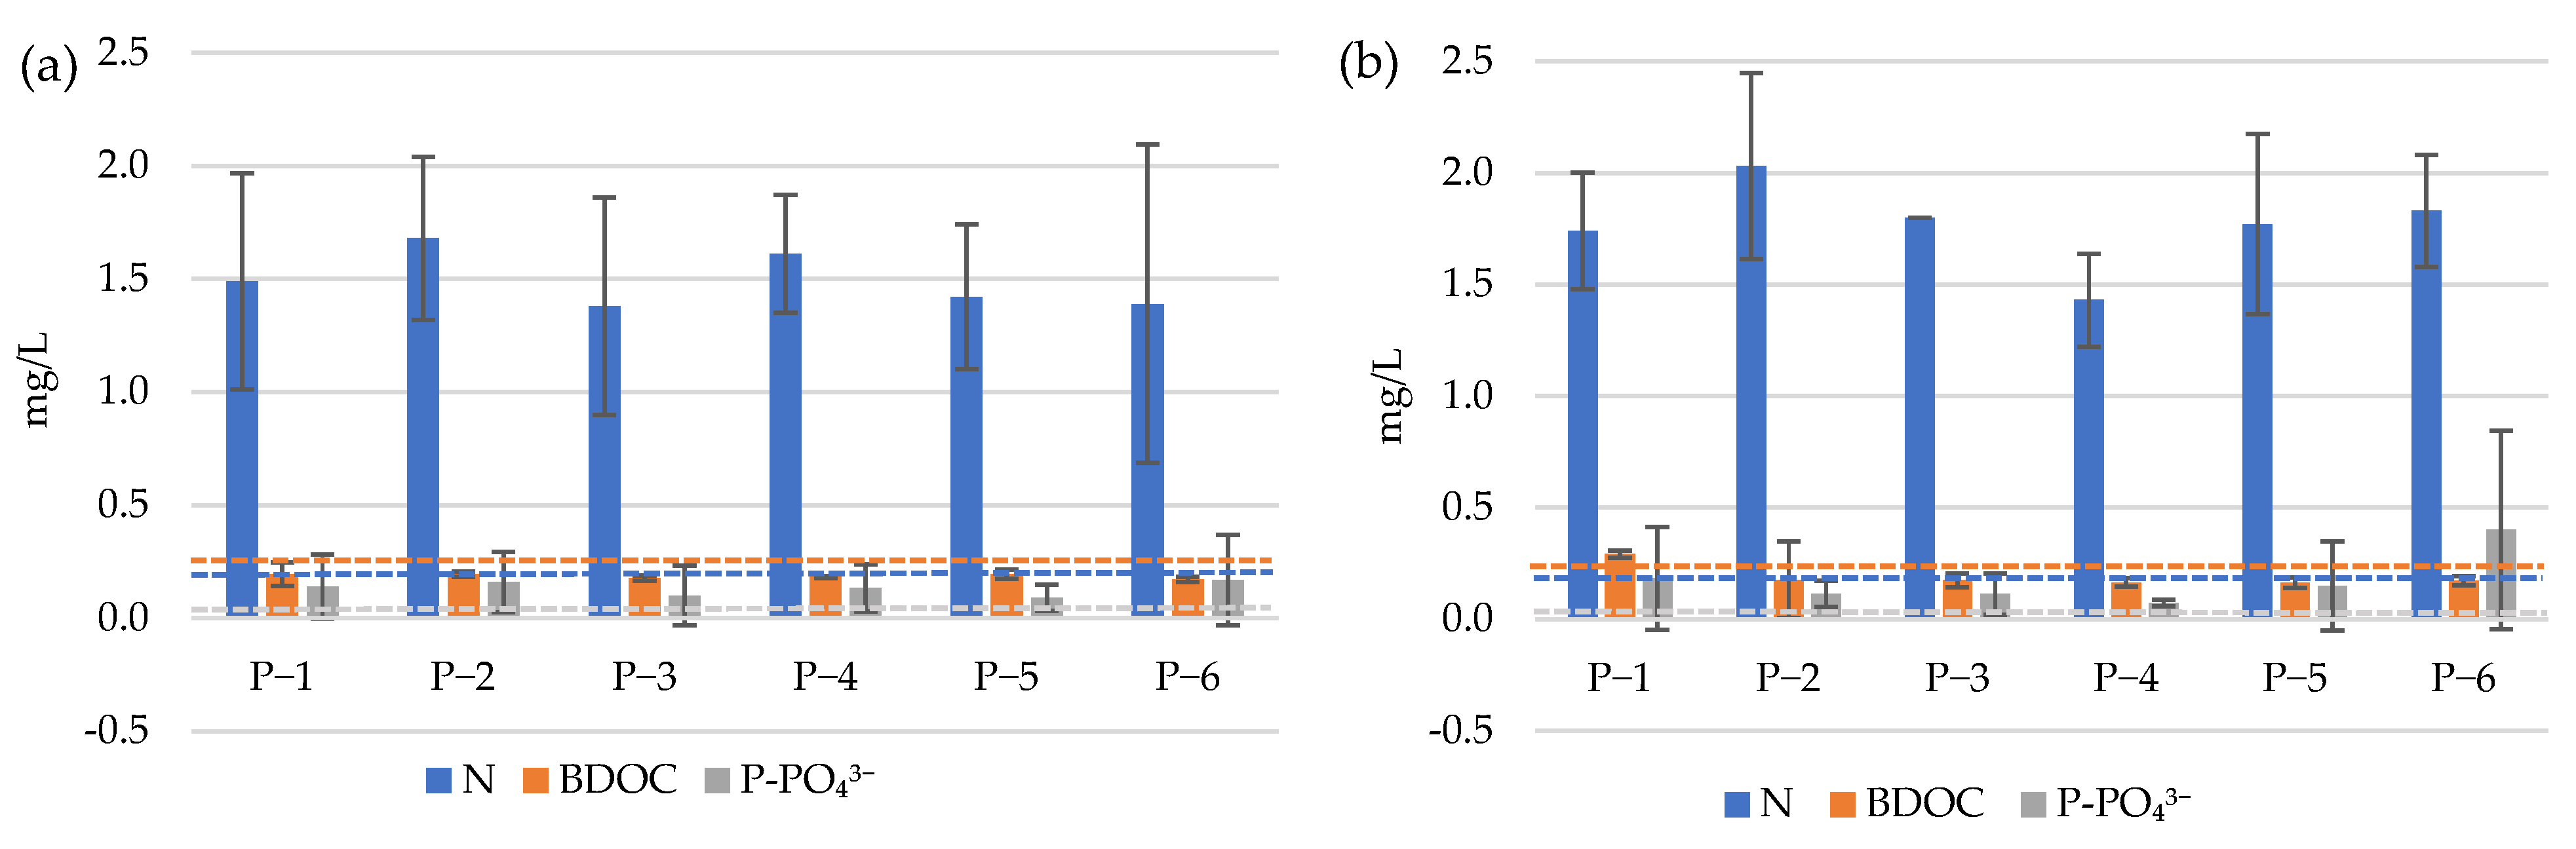
| BDOC | mg C/L | 0.13 (0.12–0.14) | 0.16 (0.12–0.25) | 0.16 (0.14–0.17) | 0.14 (0.13–0.16) | 0.15 (0.14–0.15) | 0.16 (0.13–0.19) | 0.14 (0.12–0.15) |
| Parameter | Unit | WTP | P-1 | P-2 | P-3 | P-4 | P-5 | P-6 |
|---|---|---|---|---|---|---|---|---|
| Mean ± SD and Range (Min–Max) | ||||||||
| pH | - | 7.63 ± 0.33 (7.27–7.87) | 7.51 ± 0.26 (7.26–7.78) | 7.88 ± 0.17 (7.69–8.00) | 7.90 ± 0.19 (7.70–8.08) | 7.90 ± 0.10 (7.81–8.01) | 7.89 ± 0.11 (7.78–7.99) | 7.88 ± 0.11 (7.77–7.99) |
| Colour | mg Pt/L | <5.00 | 0.33 ± 0.58 (0.00–1.00) | 1.67 ± 2.89 (0.00–5.00) | 1.00 ± 1.73 (0.00–3.00) | 0.33 ± 0.58 (0.00–1.00) | 0.33 ± 0.58 (0.00–1.00) | 1.00 ±1.73 (0.00–3.00) |
| Conductivity | µS/cm | 545 ± 125.5 (453–688) | 528 ± 69.5 (451–586) | 517 ± 73.4 (455–598) | 535 ± 88.2 (444–620) | 534 ± 85.6 (447–618) | 527 ± 78.1 (455–610) | 538 ± 86.9 (462–633) |
| Turbidity | NTU | <0.20 | 0.35 ± 0.07 (0.27–0.41) | 0.40 ± 0.07 (0.32–0.46) | 0.34 ± 0.21 (0.16–0.57) | 0.23 ± 0.10 (0.12–0.32) | 0.23 ± 0.15 (0.13–0.40) | 0.38 ± 0.19 (0.23–0.59) |
| Nitrites | mg N-NO2/L | <0.05 | 0.00 ± 0.00 (0.00–0.00) | 0.00 ± 0.00 (0.00–0.00) | 0.00 ± 0.00 (0.00–0.00) | 0.00 ± 0.00 (0.00–0.00) | 0.00 ± 0.00 (0.00–0.00) | 0.00 ± 0.00 (0.00–0.00) |
| Ammonium nitrogen | mg N-NH4+/L | 0.00 ± 0.00 (0.00–0.00) | 0.01 ± 0.01 (0.00–0.02) | 0.00 ± 0.00 (0.00–0.00) | 0.00 ± 0.00 (0.00–0.00) | 0.00 ± 0.00 (0.00–0.00) | 0.00 ± 0.00 (0.00–0.00) | 0.00 ± 0.01 (0.00–0.01) |
| Nitrates | mg N-NO3/L | 1.79 ± 0.02 (1.76–1.80) | 1.73 ± 0.25 (1.50–2.00) | 2.03 ± 0.42 (1.70–2.50) | 1.80 ± 0.00 (1.80–1.80) | 1.43 ± 0.21 (1.20–1.60) | 1.77 ± 0.40 (1.40–2.20) | 1.83 ± 0.25 (1.60–2.10) |
| Alkalinity | mval/L | - * | 3.42 ± 0.53 (2.90–3.40) | 3.53 ± 1.04 (2.70–4.70) | 3.33 ± 0.85 (2.50–4.20) | 3.30 ± 0.75 (2.50–4.00) | 3.20 ± 0.80 (2.40–4.00) | 3.37 ± 0.70 (2.70–4.10) |
| Total hardness | mg CaCO3/L | 257 ± 33.32 (221–287) | 261 ± 38.28 (218–292) | 274 ± 39.34 (238–316) | 279 ± 60.54 (224–344) | 275 ± 57.07 (220–334) | 231 ± 33.13 (200–266) | 262 ± 43.86 (224–310) |
| Chlorides | mg Cl−/L | 30 ± 5.77 (27–37) | 31 ± 6.43 (26–38) | 30 ± 7.94 (24–39) | 31 ± 8.72 (25–41) | 31 ± 8.39 (26–41) | 31 ± 8.39 (26–41) | 32 ± 4.58 (28–37) |
| Phosphates | mg P-PO43−/L | - | 0.18 ± 0.23 (0.05–0.45) | 0.11 ± 0.06 (0.07–0.18) | 0.11 ± 0.09 (0.06–0.22) | 0.07 ± 0.02 (0.06–0.07) | 0.15 ± 0.20 (0.03–0.38) | 0.4 ± 0.44 (0.05–0.9) |
| Sulphates | mg SO42−/L | 38 ± 7.64 (31–46) | 38 ± 10.02 (30–49) | 39 ± 10.15 (30–50) | 38 ± 9.29 (30–48) | 37 ± 9.71 (29–48) | 39 ± 10.02 (31–50) | 37 ± 10.97 (28–49) |
| Free chlorine | mg Cl2/L | - | 0.04 ± 0.04 (0.01–0.09) | 0.1 5± 0.08 (0.07–0.23) | 0.11 ± 0.04 (0.06–0.16) | 0.05 ± 0.04 (0.02–0.09) | 0.09 ± 0.04 (0.06–0.13) | 0.02± 0.02 (0.00–0.05) |
| TOC | mg C/L | 1.94 ± 0.23 (1.69–2.14) | 3.25 ± 1.83 (1.74–5.99) | 1.97 ± 0.42 (1.63–2.44) | 1.94 ± 0.27 (1.78–2.25) | 1.83 ± 0.32 (1.62–2.20) | 1.81 ± 0.29 (1.63–2.15) | 1.92 ± 0.58 (1.55–2.58) |
| BDOC | mg C/L | 0.14 ± 0.02 (0.12–0.15) | 0.23 ± 0.17 (0.13–0.43) | 0.14 ± 0.03 (0.12–0.18) | 0.14 ± 0.02 (0.13–0.16) | 0.13 ± 0.02 (0.12–0.16) | 0.13 ± 0.02 (0.12–0.15) | 0.14 ± 0.04 (0.12–0.19) |
| P-1 | P-2 | P-3 | P-4 | P-5 | P-6 | |
|---|---|---|---|---|---|---|
| Mean ± SD and Range (Min–Max) | ||||||
| Autumn period | −0.29 ± 0.28 (−0.55 ÷ 0.16) | −0.37 ± 0.21 (−0.59 ÷ −0.11) | −0.20 ± 0.30 (−0.47 ÷ 0.25) | −0.31 ± 0.26 (−0.52 ÷ 0.14) | −0.13 ± 0.43 (−0.54 ÷ 0.37) | −0.35 ± 0.14 (−0.50 ÷ −0.12) |
| Winter period | −0.14 ± 0.21 (0.00 ÷ 0.38) | −0.33 ± 0.28 (−0.64 ÷ −0.02) | −0.22 ± 0.21 (−0.41 ÷ −0.02) | −0.22 ± 0.21 (−0.37 ÷ 0.03) | −0.17 ± 0.20 (−0.30 ÷ 0.05) | −0.21 ± 0.16 (−0.32 ÷ 0.03) |
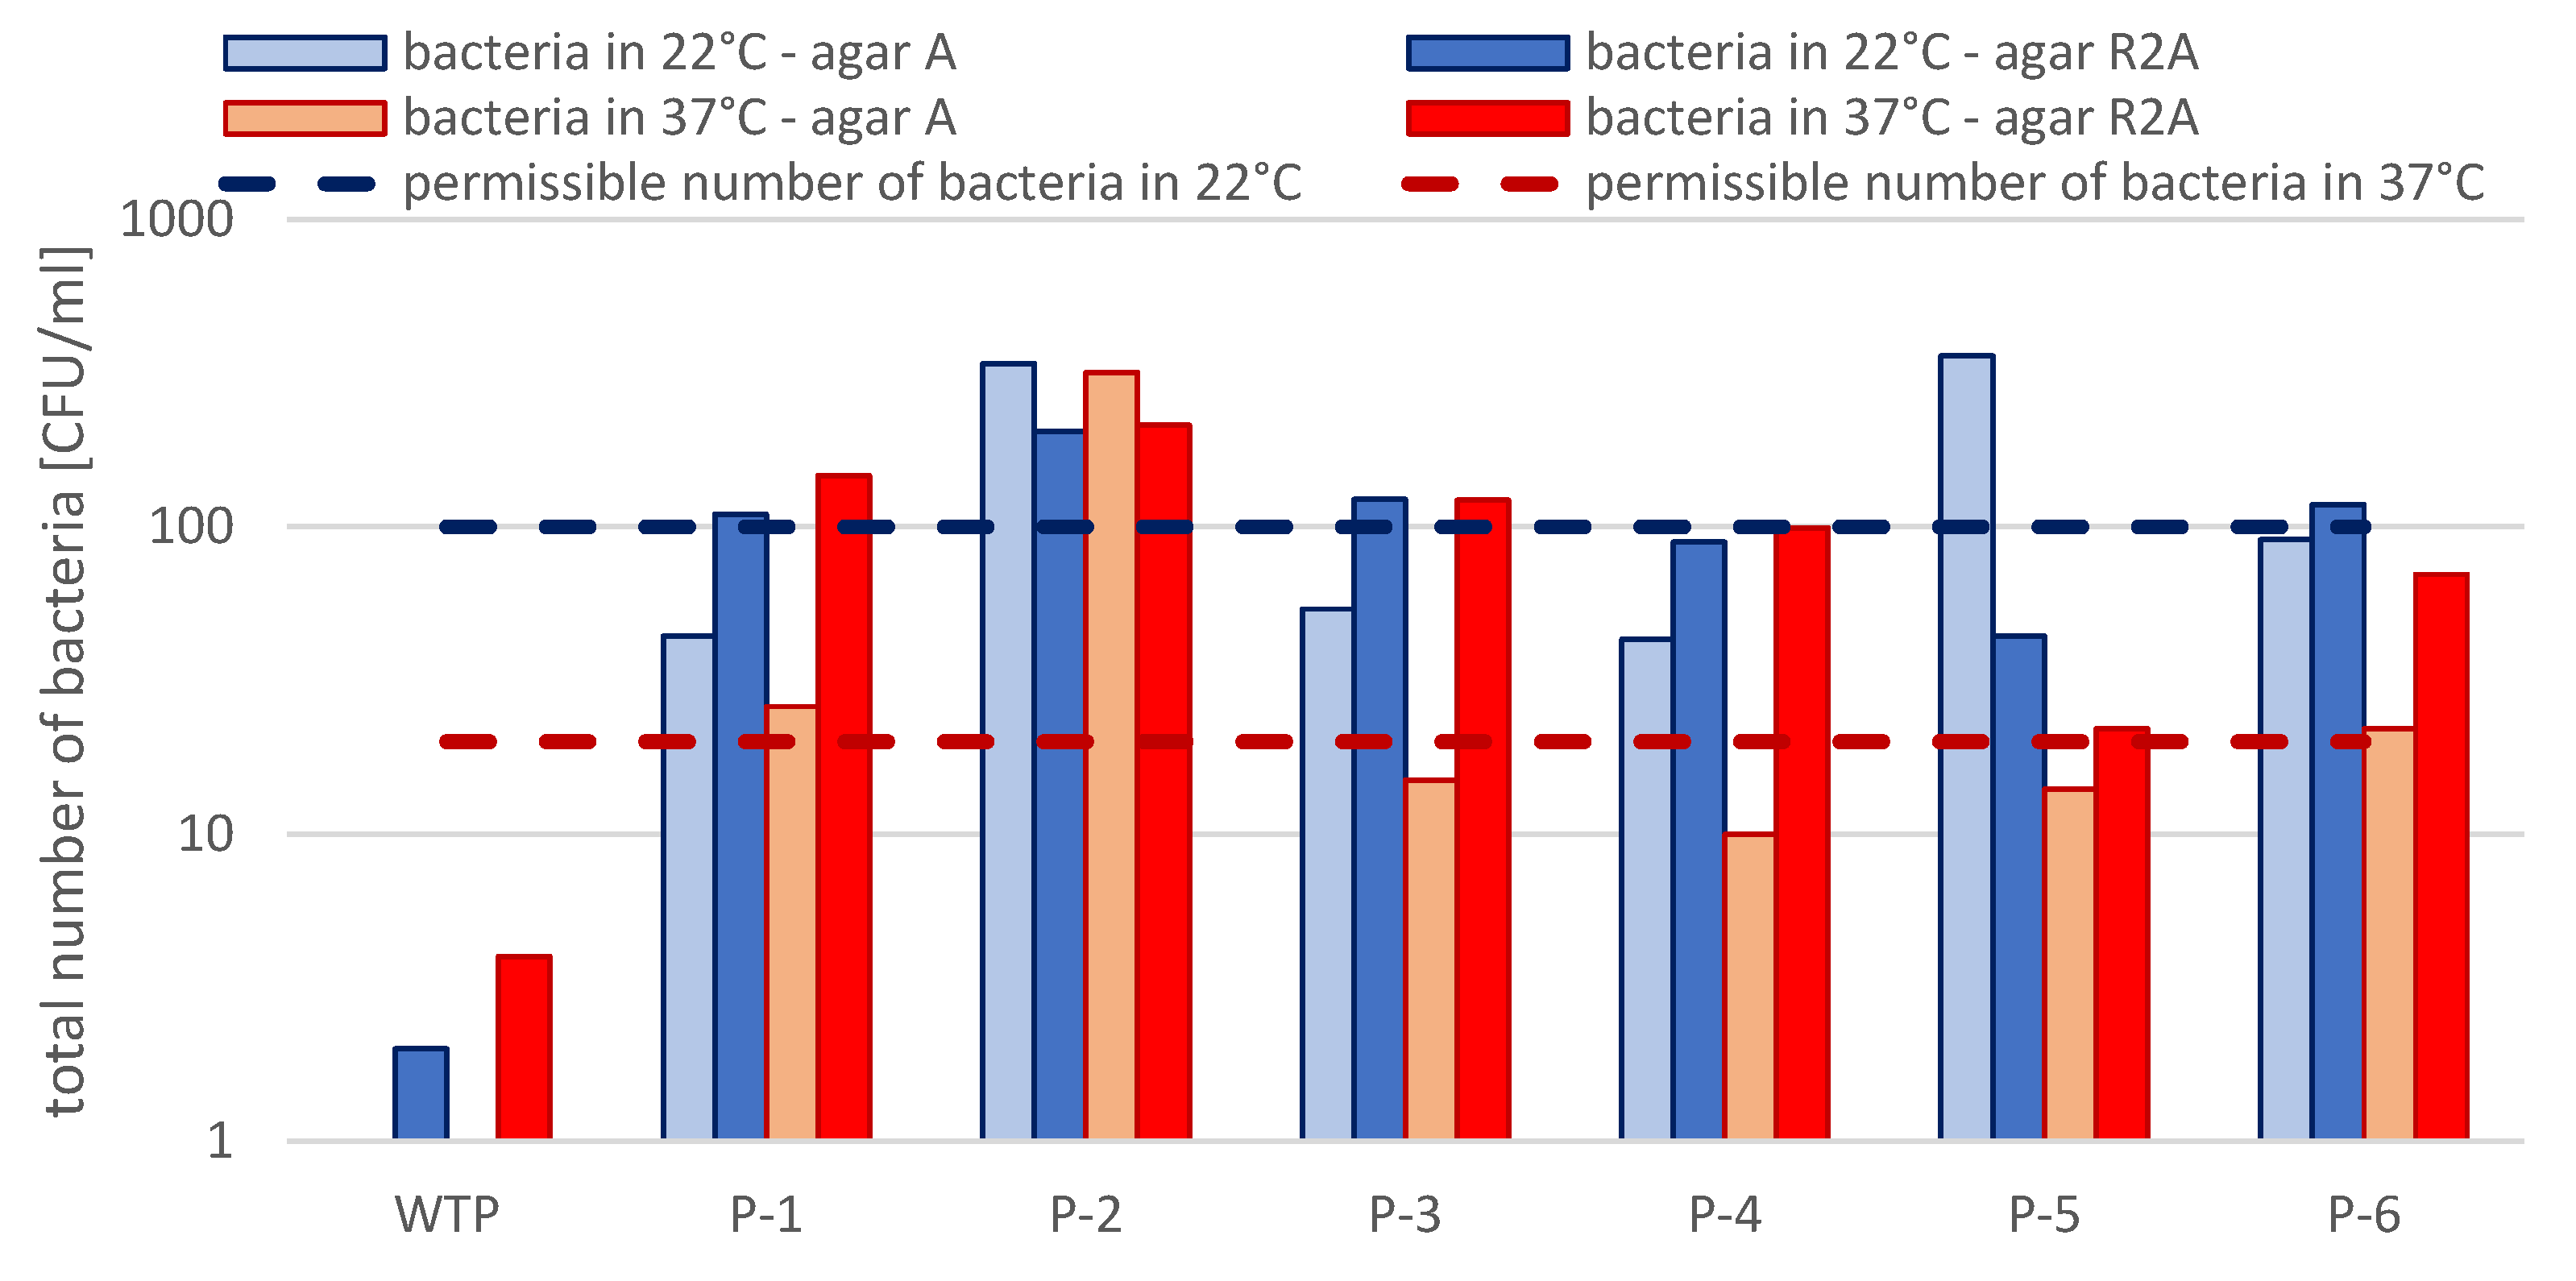
| Sample | Unit | Bacteria in 22 °C (A Agar) | Bacteria in 22 °C (R2A Agar) | Bacteria in 37 °C (A Agar) | Bacteria in 37 °C (R2A Agar) |
|---|---|---|---|---|---|
| Mean ± SD and Range (Min–Max) | |||||
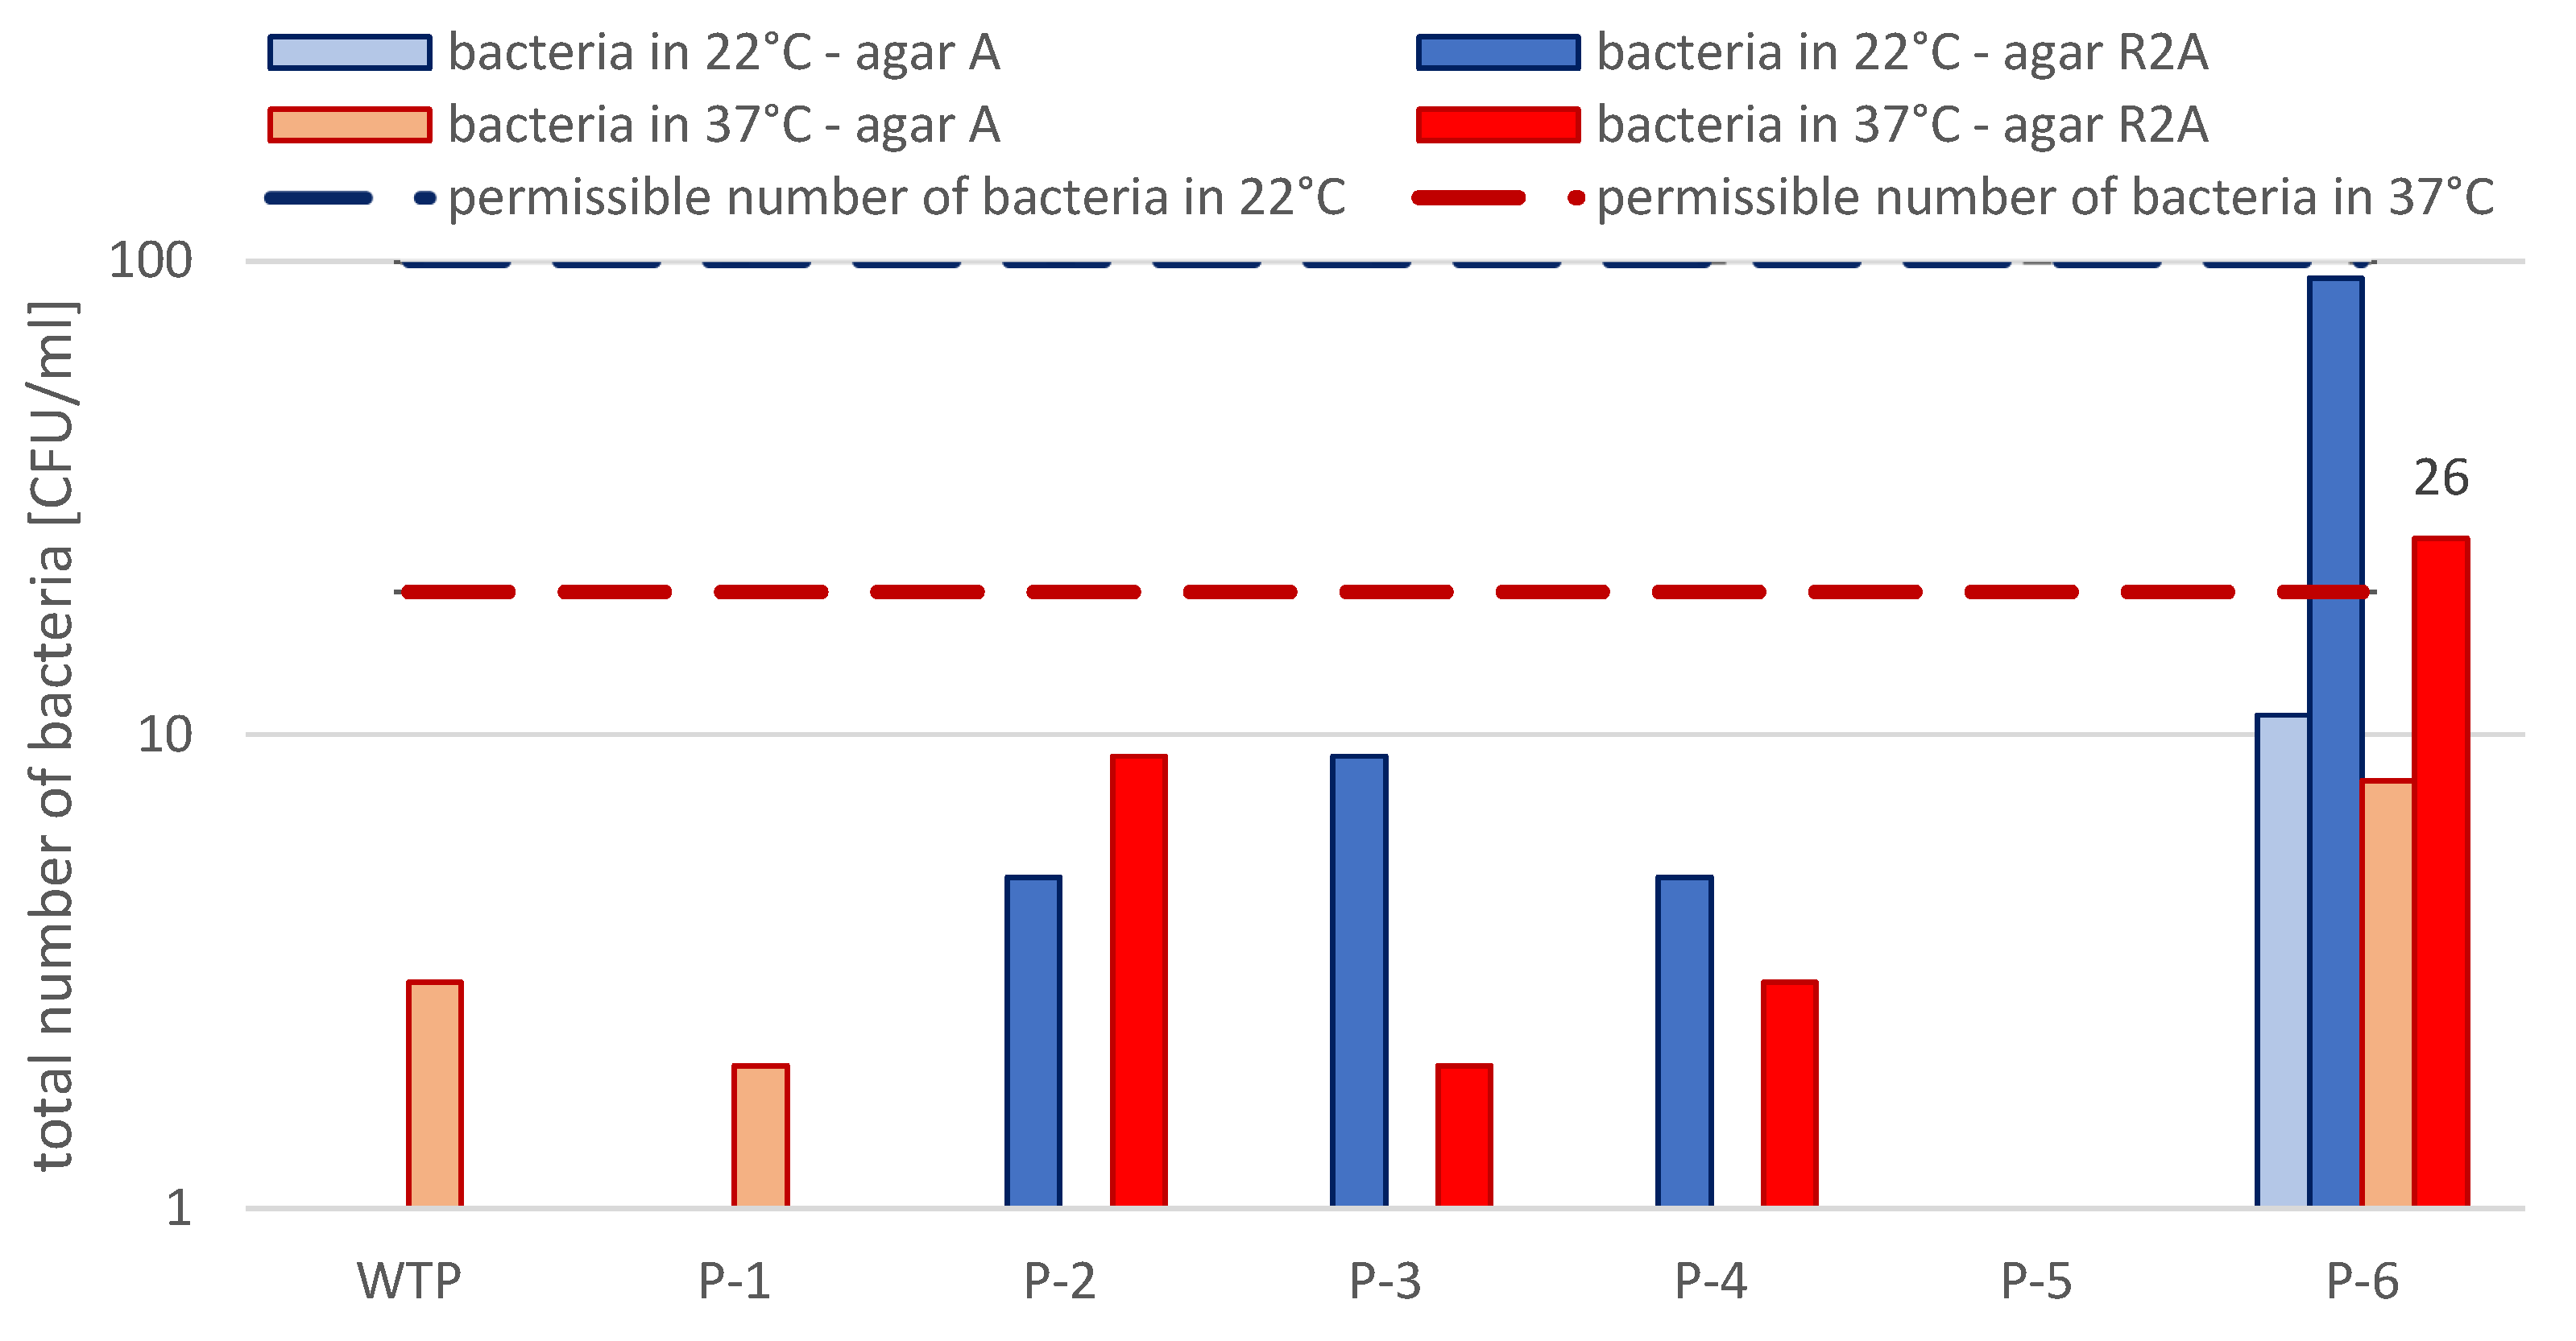
| WTP | CFU/mL | 0 ± 0.44 (0–1) | 2 ± 0.44 (0–1) | 1 ± 1.64 (0–4) | 0 ± 0.44 (0–1) |
| P-1 | 0 ± 00 (0–0) | 1 ± 0.70 (0–2) | 2 ± 1.34 (1–4) | 1 ± 0.44 (0–1) | |
| P-2 | 1 ± 0.84 (0–2) | 11 ± 11.77 (0 –30) | 0 ± 0.44 (0–1) | 8 ± 6.06 (0–17) | |
| P-3 | 0 ± 0.44 (0–1) | 14 ± 14.35 (0–30) | 0 ± 0.54 (0–1) | 2 ± 1.22 (0–33) | |
| P-4 | 0 ± 1.64 (0–4) | 5 ± 5.21 (1–13) | 0 ± 0.44 (0–1) | 3 ± 1.80 (0–4) | |
| P-5 | 0 ± 0.45 (0–1) | 2 ± 1.78 (0–4) | 1 ± 0.54 (0–1) | 1 ± 0.44 (0–1) | |
| P-6 | 1 ± 13.03 (0–31) | 93 ± 92.30 (14–250) | 10 ± 9.63 (0–23) | 26 ± 22.03 (1–61) | |
| Sample | Unit | Bacteria in 22 °C (A Agar) | Bacteria in 22 °C (R2A Agar) | Bacteria in 37 °C (A Agar) | Bacteria in 37 °C (R2A Agar) |
|---|---|---|---|---|---|
| Mean ± SD and Range (Min–Max) | |||||
| WTP | CFU/mL | 0 ± 00.41 (0–1) | 1 ± 1.21 (0–3) | 1 ± 1.64(0–4) | 0 ± 0.81 (0–2) |
| P-1 | 16 ± 23.69 (1–59) | 110 ± 76.53 (3–255) | 2 ± 1.34 (1–4) | 23 ± 31.38 (2–78) | |
| P-2 | 116 ± 0.827638 (1–680) | 173 ± 405.18 (1–1000) | 0 ± 0.44 (0–1) | 265 ± 605.81 (2–1500) | |
| P-3 | 27 ± 35.39 (0–95) | 110 ± 176.32 (2–470) | 0 ± 0.54 (0–1) | 13 ± 22.65 (1–59) | |
| P-4 | 15 ± 34.54 (0–85) | 85 ± 96.17 (0–260) | 0 ± 0.44 (0–1) | 9 ± 12.27 (0–26) | |
| P-5 | 120 ± 288.88 (0–710) | 39 ± 74.11 (2–190) | 1 ± 0.54 (0–1) | 12 ± 26.06 (0–65) | |
| P-6 | 32 ± 67.98 (1–170) | 113 ± 80.23 (1–212) | 10 ± 9.63 (0–23) | 18 ± 27.42 (0–56) | |
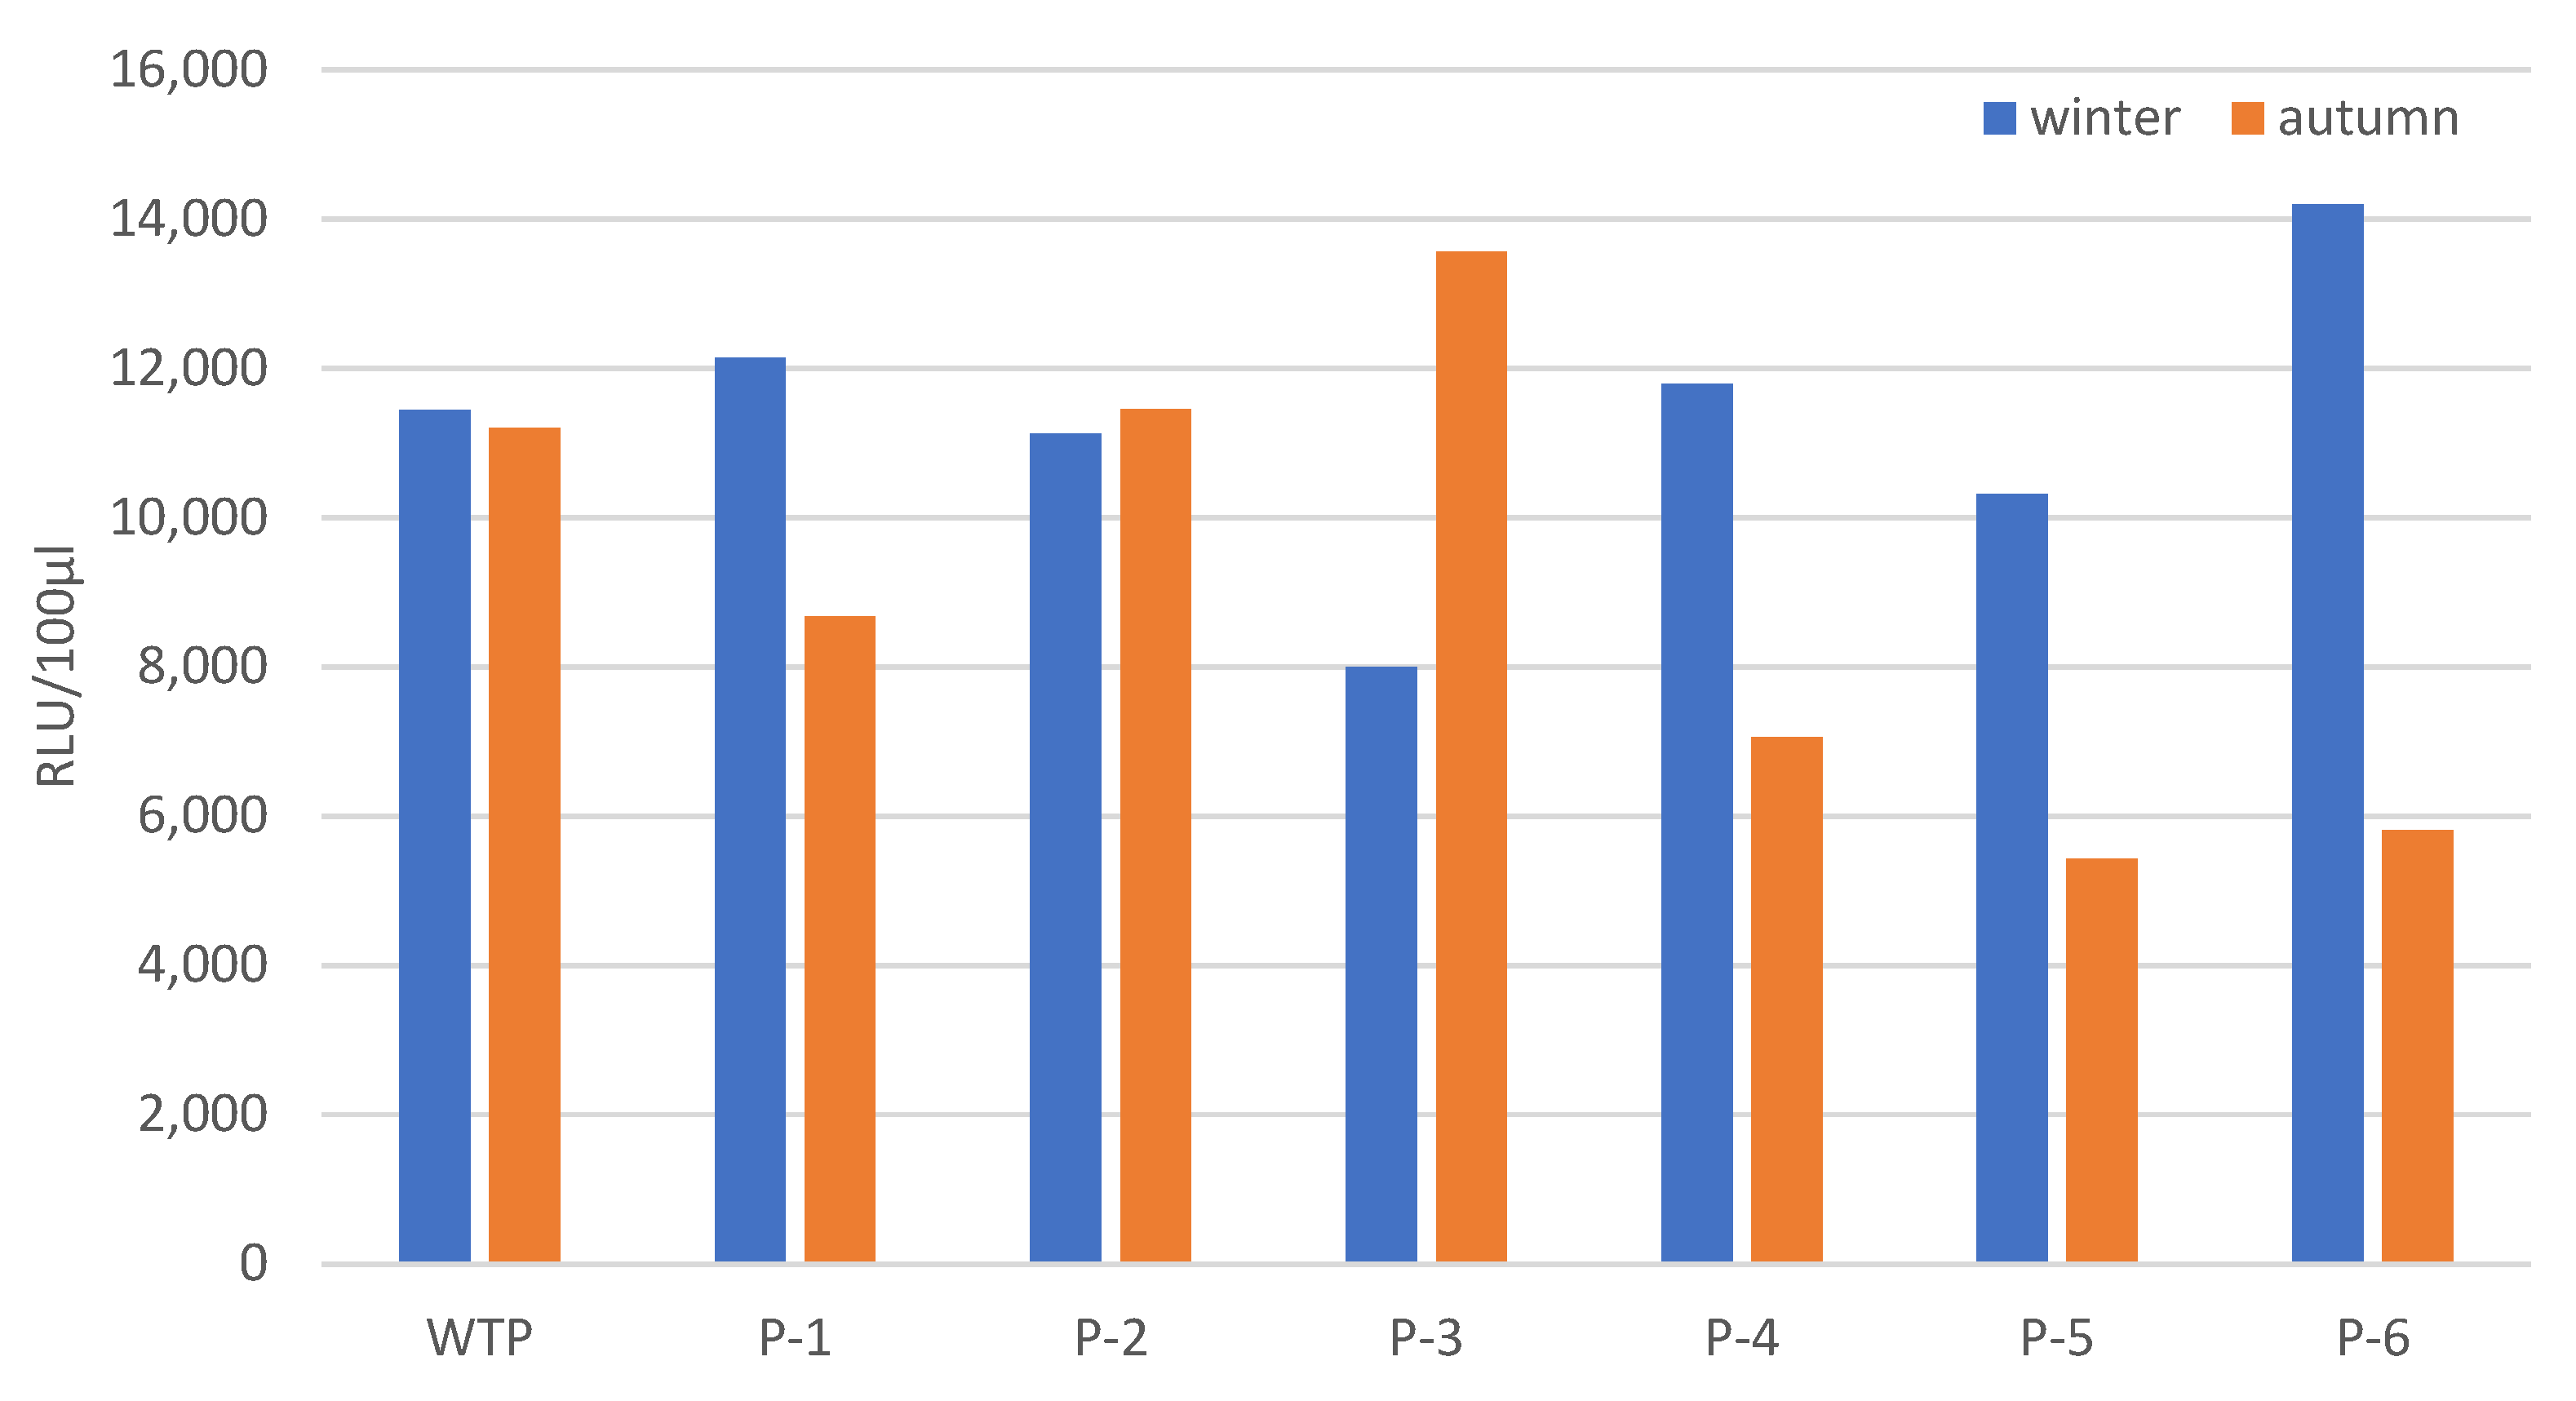
| Sample | Unit | Autumn | Winter |
|---|---|---|---|
| Mean ± SD (Min–Max) | |||
| WTP | RLU/100 μL | 11,209 ± 9654.83 (4382–18,039) | 11,445 ± 7609.17 (6065–16,826) |
| P-1 | 8670 ± 7061.82 (1321–19,643) | 12,145 ± 3342.72 (9396–15,866) | |
| P-2 | 11,454 ± 11,292.03 (1500–29,703) | 11,130 ± 777.59 (10,233–11,613) | |
| P-3 | 13,569 ± 22,960.07 (1102–54,427) | 7996 ± 1495.02 (6278–8999) | |
| P-4 | 7059 ± 4470.81 (1218–13,574) | 11,786 ± 3275.90 (8861–15,326) | |
| P-5 | 5424 ± 2832.17 (1404–9277) | 10,314 ± 4707.68 (6676–15,631) | |
| P-6 | 5811 ± 2755.59 (1171–8135) | 14,203 ± 8637.07 (4309–20,233) | |
Disclaimer/Publisher’s Note: The statements, opinions and data contained in all publications are solely those of the individual author(s) and contributor(s) and not of MDPI and/or the editor(s). MDPI and/or the editor(s) disclaim responsibility for any injury to people or property resulting from any ideas, methods, instructions or products referred to in the content. |
© 2026 by the authors. Licensee MDPI, Basel, Switzerland. This article is an open access article distributed under the terms and conditions of the Creative Commons Attribution (CC BY) license.
Share and Cite
Domoń, A.; Zdeb, M.; Skwarczyńska-Wojsa, A.; Papciak, D. Biogenic Compounds and ATP Measurement as Indicators for Assessing Operational Risk and Biological Stability of Tap Water. Sustainability 2026, 18, 7224. https://doi.org/10.3390/su18147224
Domoń A, Zdeb M, Skwarczyńska-Wojsa A, Papciak D. Biogenic Compounds and ATP Measurement as Indicators for Assessing Operational Risk and Biological Stability of Tap Water. Sustainability. 2026; 18(14):7224. https://doi.org/10.3390/su18147224
Chicago/Turabian StyleDomoń, Andżelika, Monika Zdeb, Agata Skwarczyńska-Wojsa, and Dorota Papciak. 2026. "Biogenic Compounds and ATP Measurement as Indicators for Assessing Operational Risk and Biological Stability of Tap Water" Sustainability 18, no. 14: 7224. https://doi.org/10.3390/su18147224
APA StyleDomoń, A., Zdeb, M., Skwarczyńska-Wojsa, A., & Papciak, D. (2026). Biogenic Compounds and ATP Measurement as Indicators for Assessing Operational Risk and Biological Stability of Tap Water. Sustainability, 18(14), 7224. https://doi.org/10.3390/su18147224