1. Introduction
Manufacturing is a key engine of economic growth, jobs, technology development and value creation [
1,
2]. However, industrial production also consumes large amounts of energy, water, raw materials, and labor and generates emissions, waste, occupational hazards and broader social impacts [
2,
3]. There is an increasing pressure on manufacturing organizations to move beyond the traditional measures of productivity, cost, and profitability to assess their performance. Sustainable manufacturing addresses this requirement by integrating economic viability, environmental responsibility, and social well-being within the Triple Bottom Line (TBL) framework [
1,
2,
3]. The conceptual development of sustainable manufacturing is important but translating the principles into measurable and decision-relevant information is still challenging [
3,
4]. The literature contains a multitude of indicators regarding financial performance, production efficiency, resource consumption, occupational health and safety, labor practices, stakeholder relations, emissions, water management, waste, and environmental governance [
3,
4,
5]. This diversity reflects the multidimensionality of sustainability but also presents challenges for the development of useful assessment systems [
4,
5]. Indicators may overlap in concept, have different measurement units, represent positive and negative performance directions, require data that are not always available, or have limited relevance to particular industrial contexts [
4,
5]. Empirical evidence also indicates that manufacturing organizations are still challenged in terms of consistently selecting, measuring and applying appropriate sustainability indicators [
4].
Previous studies have proposed different approaches to structure and aggregate sustainability indicators. Helleno et al. [
2] integrated TBL indicators with Lean Manufacturing and Value Stream Mapping, and Saad et al. [
6] proposed a framework that includes indicator identification, normalization, weighting, aggregation and interpretation. Neri et al. [
7] proposed a balanced set of TBL indicators for industrial supply chains. These studies provided the critical groundwork for multidimensional sustainability assessment. Nonetheless, the relevance of indicators is determined by the industrial sector, the size of the organization, regulatory conditions, stakeholder priorities, assessment level, and data availability [
4,
7,
8,
9]. Therefore, indicators from the literature need to be validated prior to being integrated into an operational framework. Expert validation can enhance the contextual appropriateness of candidate indicators. However, expert judgment is subjective by nature and often expressed in linguistically uncertain terms. To tackle this problem, the Fuzzy Delphi Technique (FDT) is used, which transforms the linguistic assessments into fuzzy values and applies explicit criteria for consensus and indicator acceptance [
10]. Lin et al. [
10] showed how it can be used for validation of sustainability indicators for employee activities related to production. FDT can decide whether an indicator is sufficiently supported by experts, but the accepted set may still be too large for efficient data collection, interpretation and subsequent weighting [
10,
11].
A large set of indicators increases data needs, respondent burden and analytical complexity, especially if pairwise comparisons are required [
8,
9,
11]. The weighting is therefore based on screening of indicators. For example, Gani et al. [
11] showed that Pareto analysis can reduce complexity by keeping only the indicators that contribute to the largest part of assessed importance. However, due to the study being mainly based on environmental indicators, there is a lack of studies applying Pareto screening to the whole TBL framework, especially as a link between fuzzy validation and hierarchical weighting [
8,
10,
11]. Moreover, the retained indicators should have different weights, as they do not equally contribute to the overall sustainability performance [
8,
9,
12]. Although methods such as Best–Worst Scaling have been used [
8], the Analytic Hierarchy Process (AHP) offers a very structured way to derive hierarchical priorities and to evaluate the consistency of expert judgments [
12]. But weights alone do not represent actual performance. Since sustainability indicators differ in terms of units, scales and desired directions (e.g., more financial return is positive, while more emissions or accident rates are negative), values must be normalized and combined with weights to generate comparable sustainability scores [
6,
7,
12]. The practical value of these scores, however, lies not only in their mathematical aggregation but also in their communication. Most approaches end with scoring calculations and do not incorporate the results into an operational platform [
9,
12,
13]. Furthermore, while Industry 4.0 technologies can improve the stages from data acquisition to decision-making [
13], standard dashboards may not be able to provide actionable managerial guidance as they may not be able to clarify the root causes of weak performance, distinguish priority gaps, or identify complex relationships among TBL dimensions [
9,
13].
One possibility to bridge this interpretability divide is Generative artificial intelligence (GenAI). Gholami [
14] used fuzzy logic, computational tools, and large language models in a manufacturing decision support application. Ghobakhloo et al. [
15] identified potential contributions of GenAI to sustainable and human-centered manufacturing, such as analytical insight, knowledge accessibility, and operational decision support. Additionally, AI has been integrated with fuzzy multi-criteria techniques for evaluating ESG strategies in manufacturing [
16]. These developments suggest that GenAI can add value beyond automated reporting. However, outputs produced directly from unstructured or unweighted data may be generic, inconsistent with organizational priorities or difficult to verify [
14,
15,
16]. A more defensible role for AI is to interpret results that have been produced through an explicit process where the relevance, priority, scoring direction and performance level of indicators have already been set.
Despite recent progress in sustainability assessment and digital decision support systems, existing studies generally address indicator validation, indicator reduction, priority weighting, score calculation, system implementation, AI-assisted interpretation, and usability evaluation as separate or incomplete components. This creates a research gap in developing an integrated framework that can move from expert-validated TBL indicators to weighted scoring, operational system implementation, and AI-assisted managerial interpretation within a single workflow. The distinguishing feature of the proposed SIM Model is its sequential architecture, which combines FDT-based expert validation, Pareto-based indicator reduction, Group AHP weighting with consistency verification, Utility Value Analysis, web-based AI-DSS implementation, AI-assisted interpretation of structured sustainability scores, and formal usability evaluation using SUS. In this study, the SIM Model is developed as a sequential AI-assisted sustainability intelligence architecture for manufacturing organizations. The novelty of this work therefore lies not in any single method, but in the integration of these methodological and operational components into a transparent and usable sustainability assessment workflow.
2. Materials and Methods
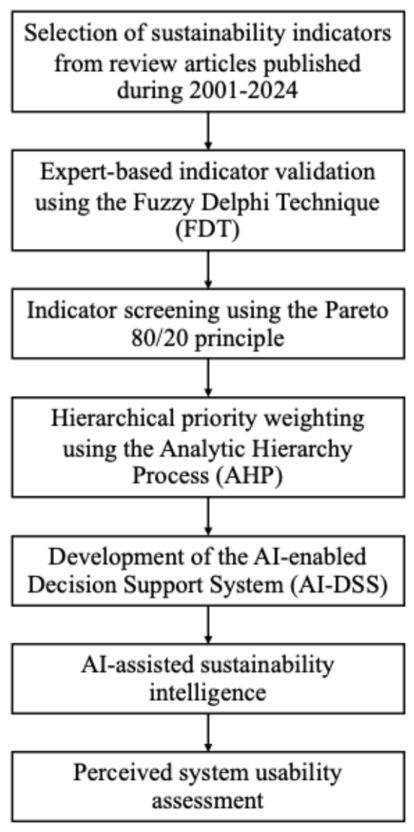
The Sustainable Industrial Measurement (SIM) Model was developed through a sequential mixed-methods research design in this study. The methodology was designed to translate general sustainability notions into a validated, simplified, weighted, digitally implemented and AI-supported decision support architecture for manufacturing entities. The methodological workflow was composed of seven stages: (i) identification of candidate sustainability indicators based on the literature; (ii) expert-based validation using the Fuzzy Delphi Technique (FDT); (iii) reduction of indicators using Pareto 80/20 principle; (iv) hierarchical priority weighting using Group Analytic Hierarchy Process (Group AHP); (v) calculation of sustainability scores using Utility Value Analysis (UVA); (vi) implementation of the weighted assessment model within a web-based AI-enabled decision support system (AI-DSS); and (vii) assessment of usability and practical applicability using the System Usability Scale (SUS). The sequential design is based on the logic of systematic evidence synthesis, expert validation, multi-criteria prioritization, composite indicator construction and evaluation of the decision support system. The research workflow is shown in
Figure 1.
2.1. Literature-Based Sustainable Industrial Indicator Identification
The first step was to generate a large set of candidate sustainability indicators for manufacturing organizations. A systematic literature review was performed to find the indicators used in sustainable manufacturing, industrial sustainability assessment, Triple Bottom Line evaluation, sustainability performance measurement, and multi-criteria decision-making frameworks in the past. The review process was guided by systematic review principles to improve transparency, traceability and reproducibility in indicator identification [
17,
18]. The search for peer-reviewed studies was conducted via Scopus, ScienceDirect and other academic databases. The search was limited to studies published between 2001 and 2024, clearly targeting the sustainability assessment in manufacturing or industrial contexts and operationalized indicators in economic, social and environmental dimensions. Studies were selected if they satisfied at least one of the following criteria: (i) proposed sustainability indicators for manufacturing processes or organizations; (ii) developed a sustainability assessment framework based on measurable indicators; (iii) applied multi-criteria decision-making methods for prioritizing sustainability indicators; or (iv) integrated TBL indicators into an industrial decision support framework. Studies were excluded when they were purely conceptual, focused on sustainability at the national level without organizational indicators, or did not provide measurable variables applicable to manufacturing organizations [
17,
18]. The extracted indicators were classified into economic, social and environmental dimensions, based on the TBL framework. Indicators that overlapped conceptually were merged based on their operational meaning rather than their wording. The merging process followed four criteria. First, indicators were merged when they referred to the same sustainability construct, such as resource efficiency, occupational safety, or environmental compliance. Second, indicators were merged when they used a similar measurement logic, for example, the same numerator–denominator relationship or the same type of performance ratio. Third, indicators were merged only when they had the same performance direction, meaning that higher or lower values indicated the same sustainability interpretation. Fourth, the broader and more operationally measurable indicator label was retained to support practical data collection. Indicators were not merged when they differed in measurement unit, organizational level, stakeholder meaning, or managerial implication. This process reduced redundancy while preserving indicators with distinct operational relevance for manufacturing sustainability assessment. For example, in order to reduce redundancy, similar indicators with different labels were merged into one representative indicator before validation by experts. This process resulted in the generation of 65 candidate sustainability indicators, including 13 economic, 28 social and 24 environmental indicators. These indicators were the initial input for the FDT validation stage.
2.2. Expert Recruitment and Data Collection
In this study, two panels of experts were used. The first panel was used to validate indicators based on the FDT, and the second panel was used to weight the hierarchies based on the AHP. Experts were recruited using purposive expert sampling because the study required specialized judgments regarding manufacturing sustainability rather than statistical representation of a general population. The inclusion criteria were as follows: (i) direct professional, managerial, technical, or academic experience in manufacturing, sustainability assessment, industrial management, environmental management, occupational health and safety, or multi-criteria decision-making; (ii) at least five years of relevant experience, where applicable; (iii) familiarity with industrial sustainability indicators or performance assessment; and (iv) willingness to provide independent and complete judgments. The FDT panel was composed of 33 specialists coming from three knowledge domains: (1) 11 industrial practitioners working in manufacturing or sustainability management, (2) 11 academic researchers specialized in sustainability assessment or industrial management and (3) 11 industrial networks representatives. The total number of 33 experts was selected to ensure balanced representation across the three knowledge domains, with 11 experts from each group. This balanced structure was intended to combine practical manufacturing experience, academic and methodological expertise, and broader industrial network perspectives. The panel size was therefore considered appropriate for FDT-based indicator validation because the purpose was to obtain qualified expert consensus on the contextual relevance of 65 candidate indicators rather than to achieve statistical representativeness of a general population. The anonymized characteristics of the expert panels, including expert group, role in the study, sector or institutional affiliation, qualification criteria, experience criteria, and selection rationale, are summarized in
Table S1. This composition was aimed at encompassing theoretical knowledge as well as practical experience related to manufacturing sustainability assessment [
19,
20,
21]. The AHP panel was made up of 21 experts chosen from the larger pool of experts based on their knowledge of sustainability assessment, industrial management, and multi-criteria evaluation. For AHP, a smaller expert panel was used due to the greater cognitive effort involved in pairwise comparison as compared to rating-based validation. Although these panels were relatively small compared with general survey research, they are methodologically appropriate for expert-based studies, where validity depends primarily on expert qualification, domain relevance, and judgment consistency rather than statistical representativeness. Recent expert-input research in the low-carbon hydrogen sector similarly used 20 screened experts and noted that such a modest sample size is consistent with expert opinion-based literature [
22]. Therefore, the use of 33 experts for FDT and 21 experts for AHP is consistent with established norms for specialized expert elicitation studies. Expert answers were anonymized and used solely for methodological analysis. The importance of sustainability dimensions, categories and indicators was assessed using Saaty’s pairwise comparison scale [
23,
24,
25] in the AHP questionnaire and a seven-point importance scale in the FDT questionnaire.
2.3. Fuzzy Delphi Technique for Indicator Validation
The Fuzzy Delphi Technique was used to validate the contextual relevance and importance of the 65 candidate indicators. FDT was chosen because expert judgments in sustainability assessment are often expressed in linguistic terms and may contain uncertainty, ambiguity and subjective variation. Fuzzy set theory is a mathematical way to represent such uncertainty. Delphi logic supports the expert-based consensus formation [
10,
19,
20,
21]. Each expert rated the importance of each candidate indicator on a seven-level scale. Linguistic ratings were converted into triangular fuzzy numbers (TFNs) as shown in
Table S2. TFNs were used for their capability to represent the lower, most likely and upper bounds of expert judgment in a simple and interpretable form [
10,
19,
20,
21].
For indicator j evaluated by expert i, the linguistic rating was represented as a triangular fuzzy number, as shown in Equation (1) [
19,
20,
21]:
where
is the fuzzy rating assigned by expert
to indicator
;
,
, and
denote the lower, middle, and upper values of the TFN, respectively.
The group fuzzy opinion for each indicator was then obtained by averaging the lower, middle, and upper fuzzy values across all experts, as shown in Equation (2) [
19,
20,
21]:
where
is the aggregated TFN for indicator
;
,
, and
are the aggregated lower, middle, and upper fuzzy values; and n is the number of experts.
Expert consensus was evaluated using the vertex distance method between each expert’s TFN and the aggregated group TFN, as shown in Equation (3) [
19,
20,
21]:
where
is the fuzzy distance between the assessment of expert
and the aggregated group fuzzy opinion for indicator
. A smaller distance indicates stronger agreement between the individual expert and the group judgment.
The average threshold value of each indicator was calculated using Equation (4) [
20,
21]:
where
is the average threshold value of indicator
. In this study,
was used as the threshold for acceptable fuzzy consensus.
The percentage of expert consensus was calculated using Equation (5) [
20,
21]:
where
is the expert consensus percentage for indicator
, and
is an indicator function equal to 1 when the condition is satisfied and 0 otherwise.
The fuzzy importance score of each indicator was calculated through defuzzification using the simple average method, as shown in Equation (6) [
19,
20,
21]:
where
is the defuzzified fuzzy importance score of indicator
.
An indicator was accepted when all three conditions were simultaneously satisfied: average threshold value not greater than 0.20, expert consensus not lower than 75%, and fuzzy importance score not lower than 0.50. The acceptance rule is expressed in Equation (7) [
20,
21]:
where
indicates that indicator
was retained for subsequent analysis, while
indicates that the indicator was rejected. The accepted indicators were then advanced to the Pareto screening stage.
2.4. Indicator Screening Using the Pareto 80/20 Principle
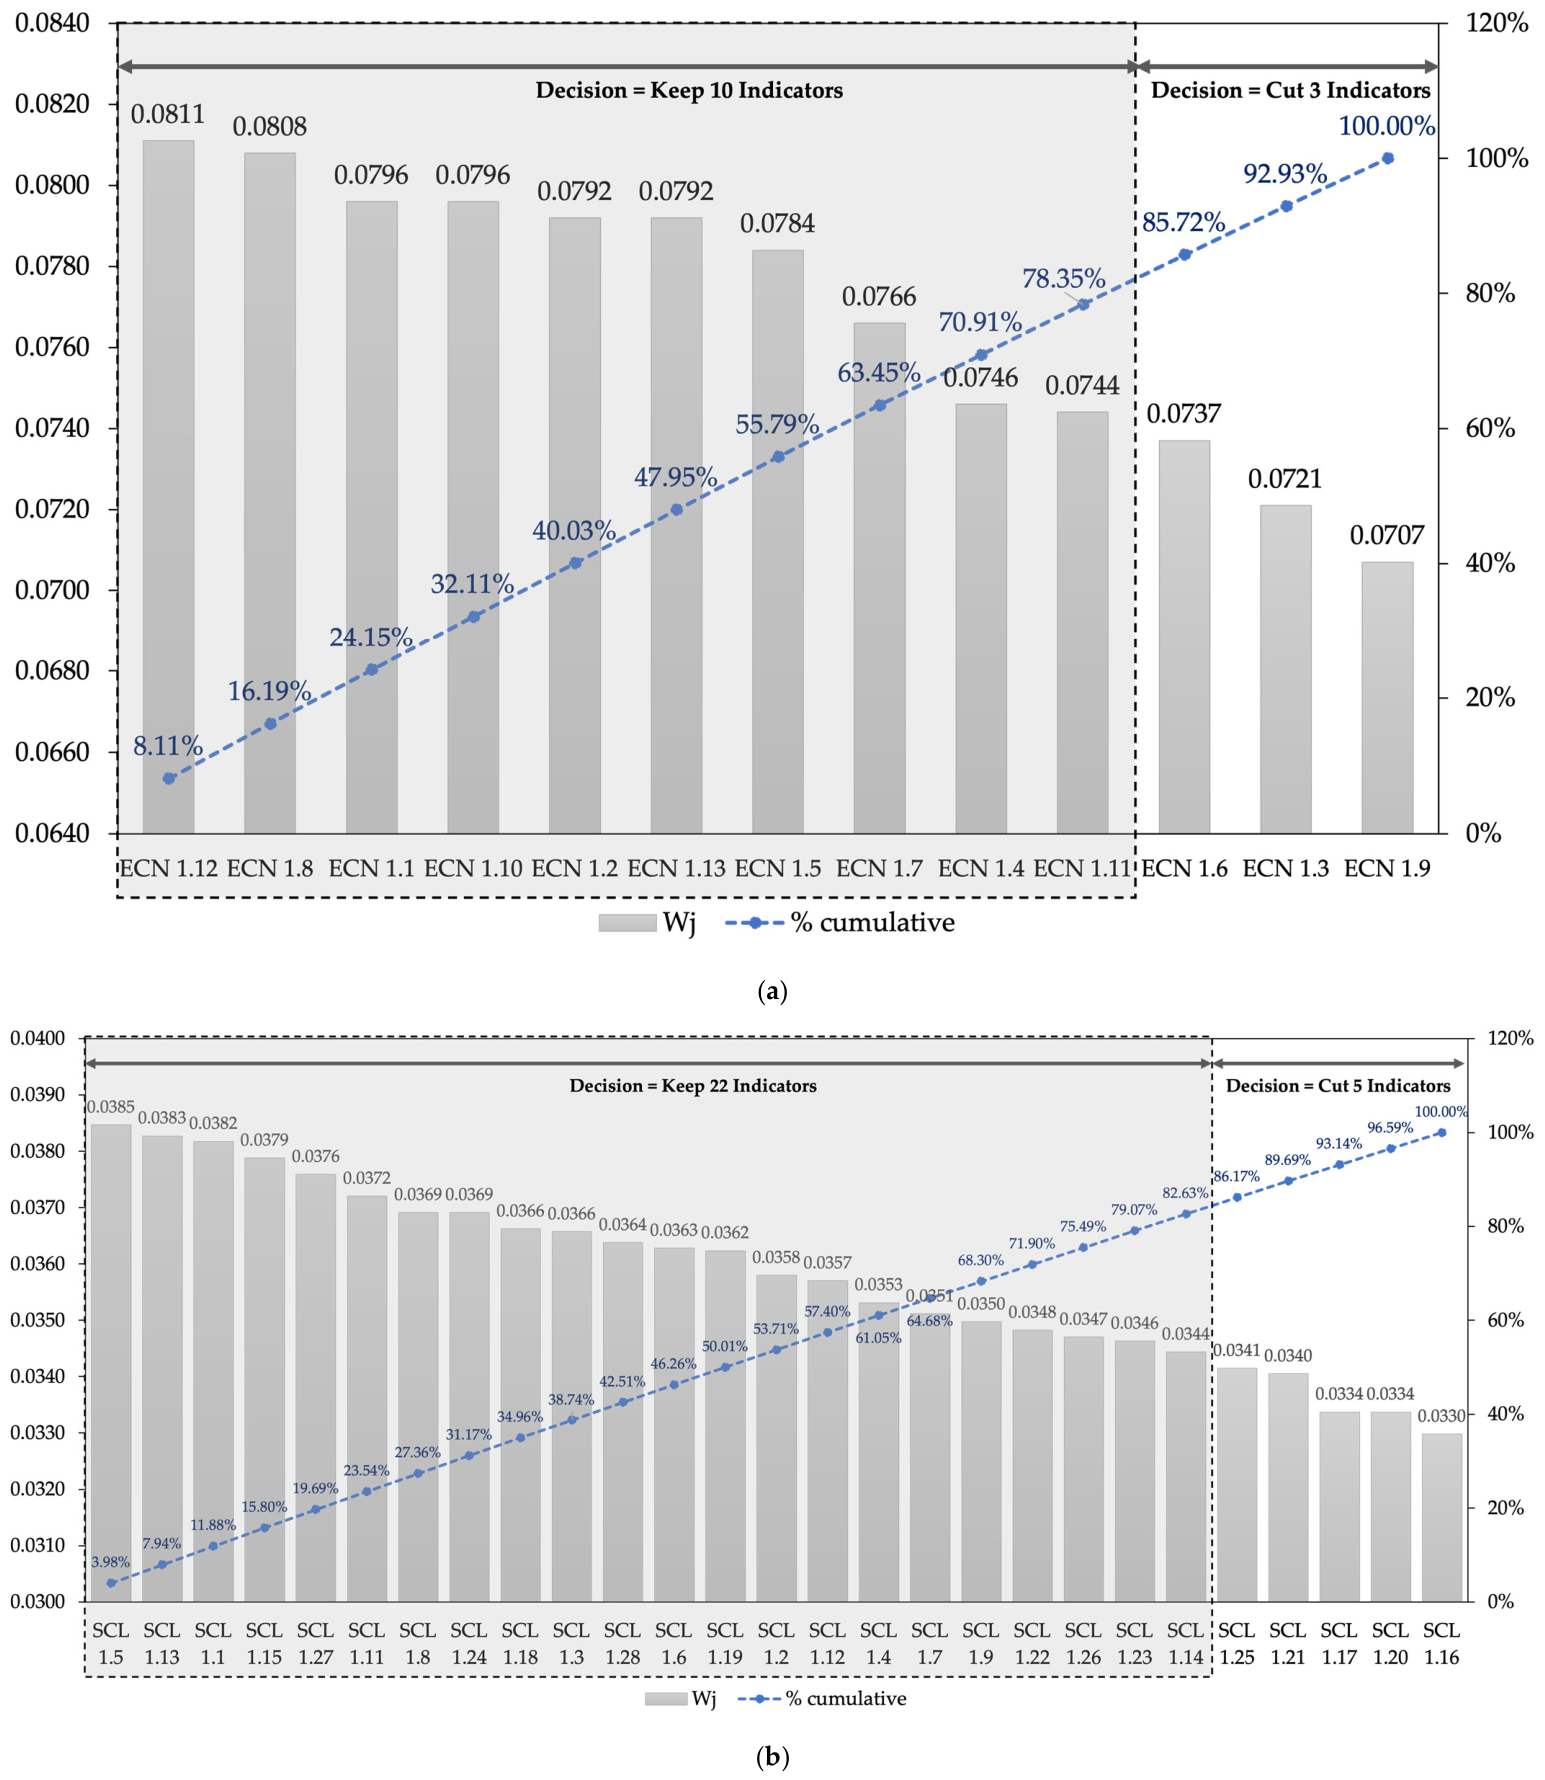
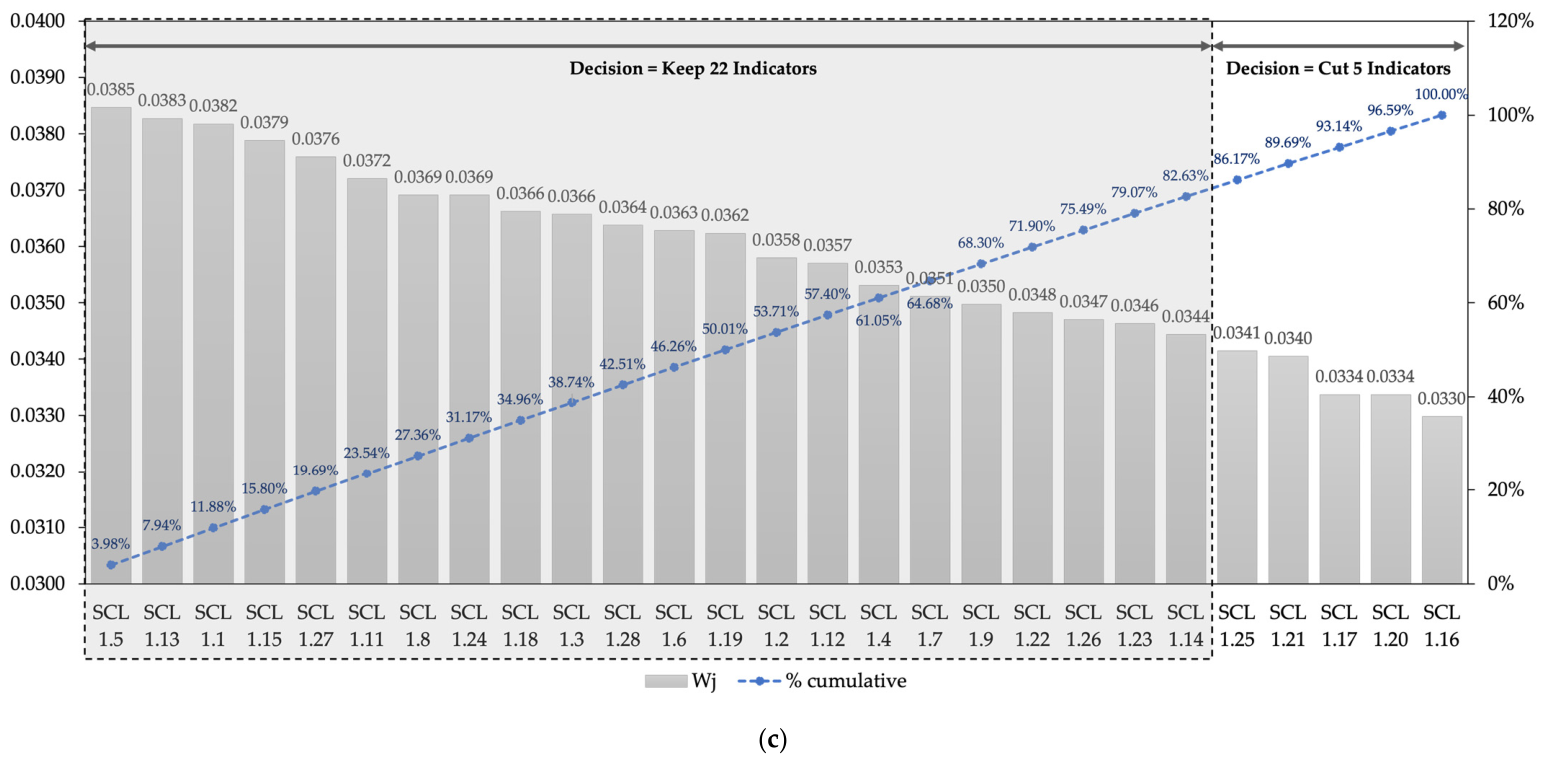
After FDT validation, the Pareto principle (80/20) was used to reduce the number of indicators while retaining those with the strongest contribution to expert-assessed sustainability importance. The 80% cumulative contribution threshold was selected as a pragmatic screening point to retain the dominant share of indicator importance while improving analytical manageability. This logic is consistent with the use of Pareto analysis to identify “vital” sustainability indicators in the manufacturing sector before further multi-criteria prioritization [
11]. The threshold was also appropriate for this study because sustainability assessment in manufacturing involves multiple indicators, heterogeneous data requirements, and practical implementation challenges [
8,
9]. Retaining all 64 FDT-validated indicators would have increased the burden of data collection, management complexity, and the workload of pairwise comparison in the subsequent AHP stage. Therefore, the 80/20 screening rule was applied not to exclude theoretically relevant indicators, but to obtain a manageable high-impact indicator set for Group AHP weighting and AI-DSS implementation [
11,
12].
For each accepted indicator, the defuzzified fuzzy importance score obtained from FDT was normalized into a relative contribution value, as shown in Equation (8) [
8,
11]:
where
is the normalized relative contribution of indicator
,
is the defuzzified fuzzy importance score, and m is the number of FDT-accepted indicators.
The accepted indicators were ranked in descending order according to
. The cumulative contribution of the ranked indicators was then calculated using Equation (9) [
8,
11]:
where
is the cumulative contribution of the top
ranked indicators, and
denotes the normalized contribution of the indicator ranked in position
.
Indicators were retained when their cumulative contribution fell within the Pareto threshold, as shown in Equation (10) [
8,
11]:
where
indicates that the indicator was retained for AHP weighting. When the indicator at the threshold boundary was required to preserve dimensional representation, it was retained to avoid excluding a high-relevance indicator from a TBL dimension.
2.5. Hierarchical Priority Weighting Using Group AHP
The AHP was used to obtain the relative priority weights of the retained indicators. AHP was selected because it breaks down a complex decision problem into levels within a hierarchy and employs pairwise comparisons to produce priority weights with a consistency check. This consistency mechanism is important because expert judgments need to be logically consistent before being used in a weighted sustainability scoring model [
23,
24,
25]. The AHP hierarchy was three levels deep. The first level was the overall goal, namely the industrial sustainability performance. The second level consisted of the three dimensions of TBL: economic, social and environmental sustainability. The third level was constituted by the Pareto-retained sustainability indicators in each dimension. The experts used Saaty’s scale of pairwise comparison to compare elements within the same hierarchical level, where 1 means equal importance and 9 means extreme importance of one element over another [
23,
24,
25]. Since AHP involves multiple experts, the pairwise comparison matrices were aggregated by using the geometric mean method. In the present study, expert judgments were aggregated using equal response weighting as a neutral baseline, meaning that each expert contributed equally to the group AHP matrix. Alternative expert response-weighting schemes, such as experience-based weighting and familiarity-based weighting, were not applied in the current analysis. Previous expert-prioritization research has highlighted the value of examining alternative response-weighting assumptions when assessing the stability of aggregated rankings [
26]. Future sensitivity analysis should therefore compare equal, experience-based, and familiarity-based weighting schemes to determine whether the resulting indicator priorities remain stable. The group comparison value for each pairwise comparison between element i and element j was obtained using Equation (11) [
24,
25]:
where
is the aggregated group comparison value between elements
and
;
is the comparison value provided by expert
; and
is the number of experts.
The aggregated pairwise comparison matrix was normalized by column, as shown in Equation (12) [
23,
25]:
where
is the normalized value of element
i relative to element
j, and
n is the number of elements in the matrix.
The local priority weight of each element was then calculated using the row average method, as shown in Equation (13) [
23,
25]:
where
is the local priority weight of element
i.
To evaluate the internal consistency of the pairwise comparison matrix, the maximum eigenvalue was estimated using Equation (14) [
23,
25]:
where
is the maximum eigenvalue of the aggregated comparison matrix
, and
w is the priority weight vector.
The Consistency Index was then calculated using Equation (15) [
23,
25]:
where
CI is the Consistency Index and n is the matrix size.
The Consistency Ratio was calculated using Equation (16) [
23,
25]:
where
CR is the Consistency Ratio and
RI is the Random Index corresponding to the matrix size. A CR value below 0.10 was considered acceptable. Matrices with CR values greater than 0.10 were reviewed before final weight calculation.
Finally, the global weight of each indicator was calculated by multiplying the relevant hierarchical weights, as shown in Equation (17) [
23,
25]:
where
is the global weight of indicator
j;
is the weight of the TBL dimension;
is the weight of the category within dimension
d, if applicable; and
is the local weight of indicator
j within its category. The resulting global weights were used in the sustainability scoring model and the AI-DSS computational algorithm.
2.6. Utility Value Analysis and Sustainability Score Calculation
The retained and weighted indicators were diverse in their units, measurement scales and direction of performance. Some indicators were benefit-oriented, where higher values indicated better sustainability performance, for example, return on assets or employee training. Others were cost-based where lower values such as energy intensity, accident rate, waste generation or greenhouse gas emissions showed better performance. Hence, the different indicator values were transformed into standardized utility scores and then aggregated using the Utility Value Analysis. This is consistent with the construction of composite indicators, where normalization, weighting and aggregation are necessary to derive interpretable multidimensional scores [
27,
28]. Utility Value Analysis was selected because the objective of this stage was to transform heterogeneous sustainability indicators into standardized and interpretable performance scores, rather than only to rank alternatives. In the SIM Model, Group AHP already provides the relative priority weights of indicators, while UVA provides the operational scoring mechanism that converts benefit-oriented and cost-oriented indicator values into a common 0–5 utility scale. This makes the results suitable for indicator-level diagnosis, dimension-level aggregation, overall sustainability scoring, dashboard visualization, and longitudinal comparison. Other MCDM methods, such as TOPSIS, VIKOR, or PROMETHEE, are well established for alternative ranking, but they are less aligned with the need for a transparent, direction-sensitive, and score-based assessment scale for organizational sustainability monitoring.
For benefit-oriented indicators, the utility score was calculated using Equation (18) [
27,
28]:
where
is the utility score of organization
i for indicator
j;
is the observed value;
is the minimum benchmark value; and
is the maximum benchmark value. The score was scaled from 0 to 5.
For cost-oriented indicators, the utility score was calculated using Equation (19) [
27,
28]:
where a lower observed value produces a higher utility score. The minimum and maximum benchmark values were selected using a hierarchical protocol to ensure consistent implementation. Regulatory or compliance thresholds were prioritized first, followed by sector-specific industry references, historical organizational data, and expert-defined ranges only when other benchmarks were unavailable. The selected benchmark source, reference year, rationale, indicator direction, and minimum–maximum values were documented in the system database to support transparency, comparability, and score traceability. For comparative or longitudinal assessment, the same benchmark set should be applied across assessed units and periods, with any benchmark update recorded as a new version. When
, the indicator was treated as non-discriminating for the assessed dataset and was reviewed before aggregation.
The dimension-level sustainability score was calculated using Equation (20) [
27,
28]:
where
is the sustainability score of organization
i in dimension
d, and
denotes the set of indicators belonging to that dimension.
The overall SIM sustainability score was calculated using Equation (21) [
27,
28]:
where
is the overall sustainability score of organization
i,
K is the total number of weighted indicators,
is the global weight of indicator
j, and
is the normalized utility score. Because the global weights were normalized to sum to 1, the overall score ranged from 0 to 5.
To support managerial interpretation, the overall and dimension-level scores were classified into five performance levels: Poor/High Risk (0–1.00), Needs Improvement (>1.00–2.00), Average/Moderate (>2.00–3.00), Very Good (>3.00–4.00), and Excellent/Best Practice (>4.00–5.00). This classification was used to translate numerical sustainability scores into interpretable managerial categories.
To identify improvement priorities, a weighted performance gap score was calculated using Equation (22) [
27,
28]:
where
is the weighted gap score of organization
i for indicator
j. A high
value indicates an indicator with both high strategic importance and weak performance. This value was used by the AI-assisted interpretation module to rank priority improvement areas.
2.7. Development of the Web-Based AI-Enabled Decision Support System
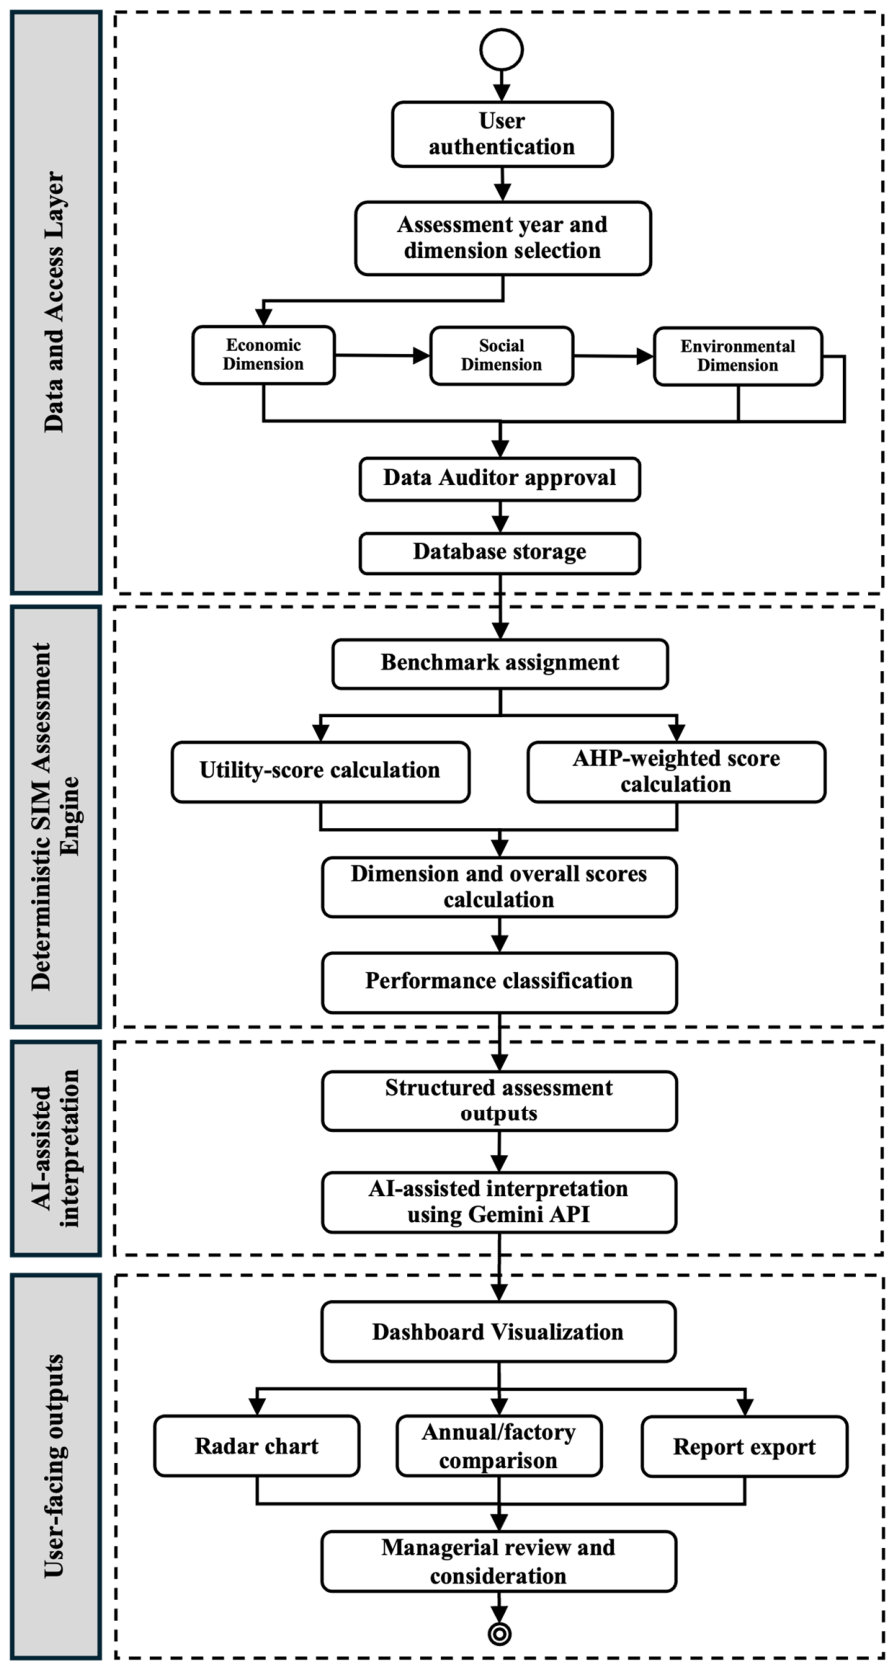
The weighted sustainability assessment model was developed as a web-based decision support system enabled by AI—see
Figure 2. The AI-DSS aimed to transfer the validated and weighted indicator framework into an operational platform to support data entry, automated scoring, visualization, benchmarking, and AI-assisted interpretation. Decision support systems are especially helpful in sustainable manufacturing because of the multiple criteria, trade-offs, uncertainty and need for actionable recommendations that are involved in sustainability decisions [
29]. The architecture of the system consisted of five major modules, namely user management, input of sustainability data, score calculation, visualization and reporting, and AI-assisted recommendation. The data input module enables users to input organizational data for each sustainability indicator. The score calculation module used the normalization and weighted aggregation equations described in
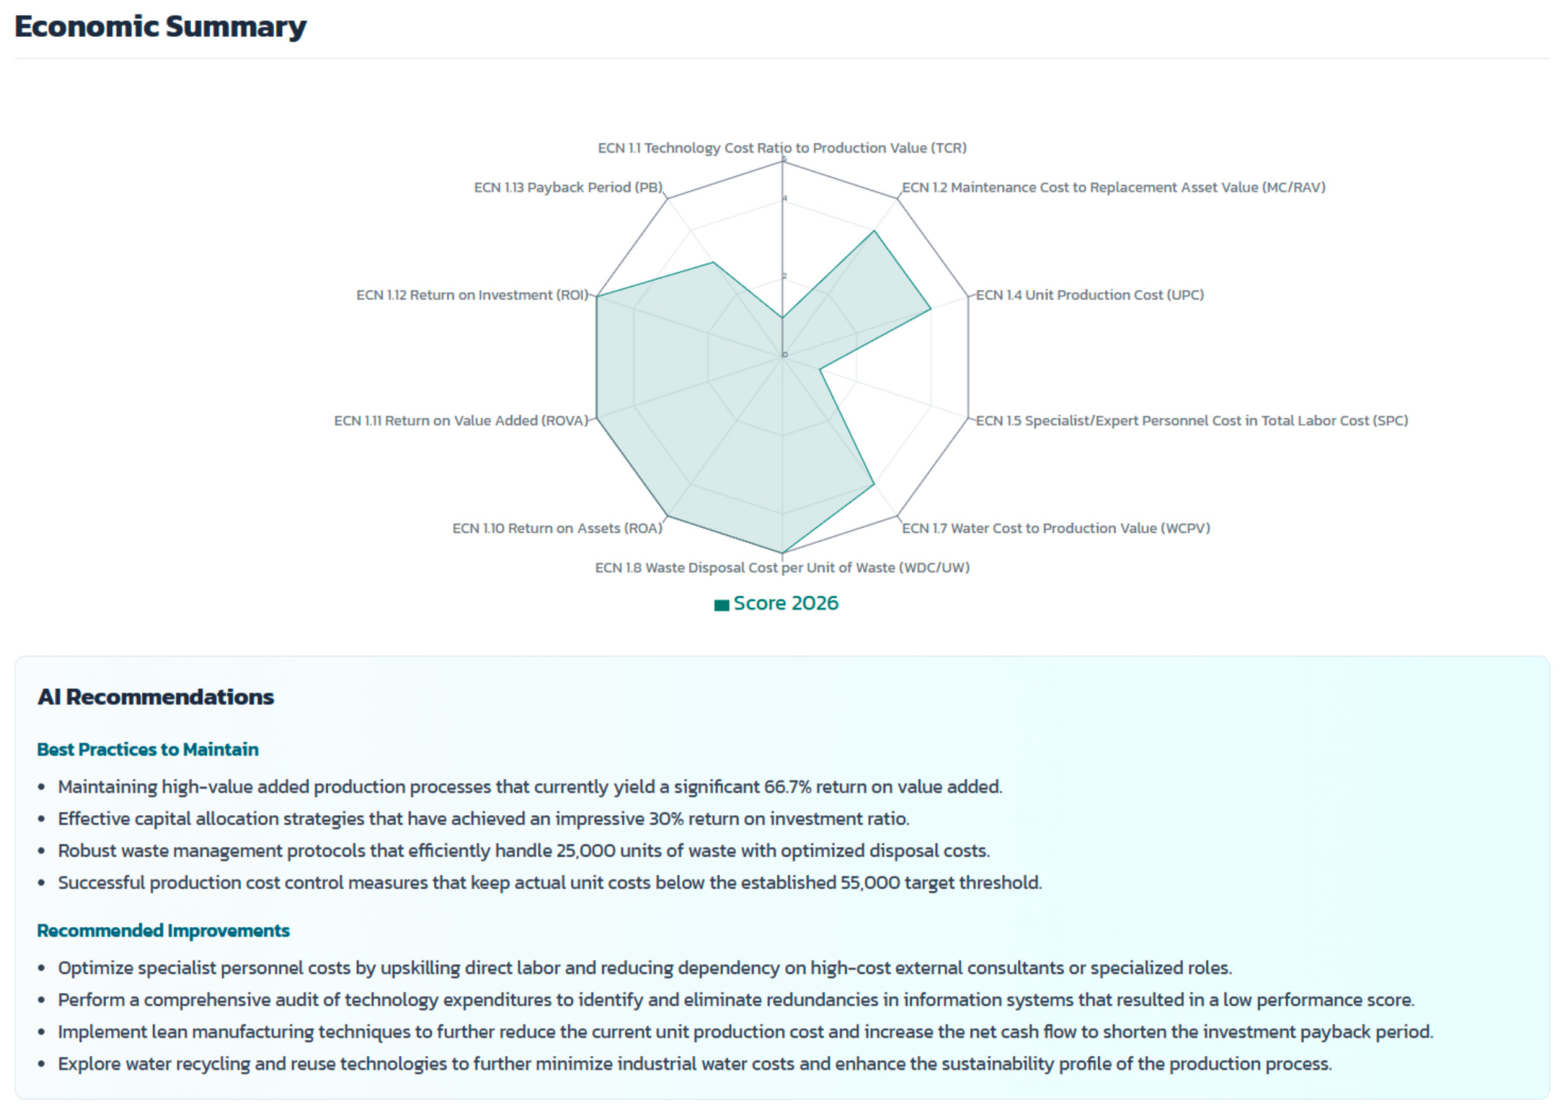
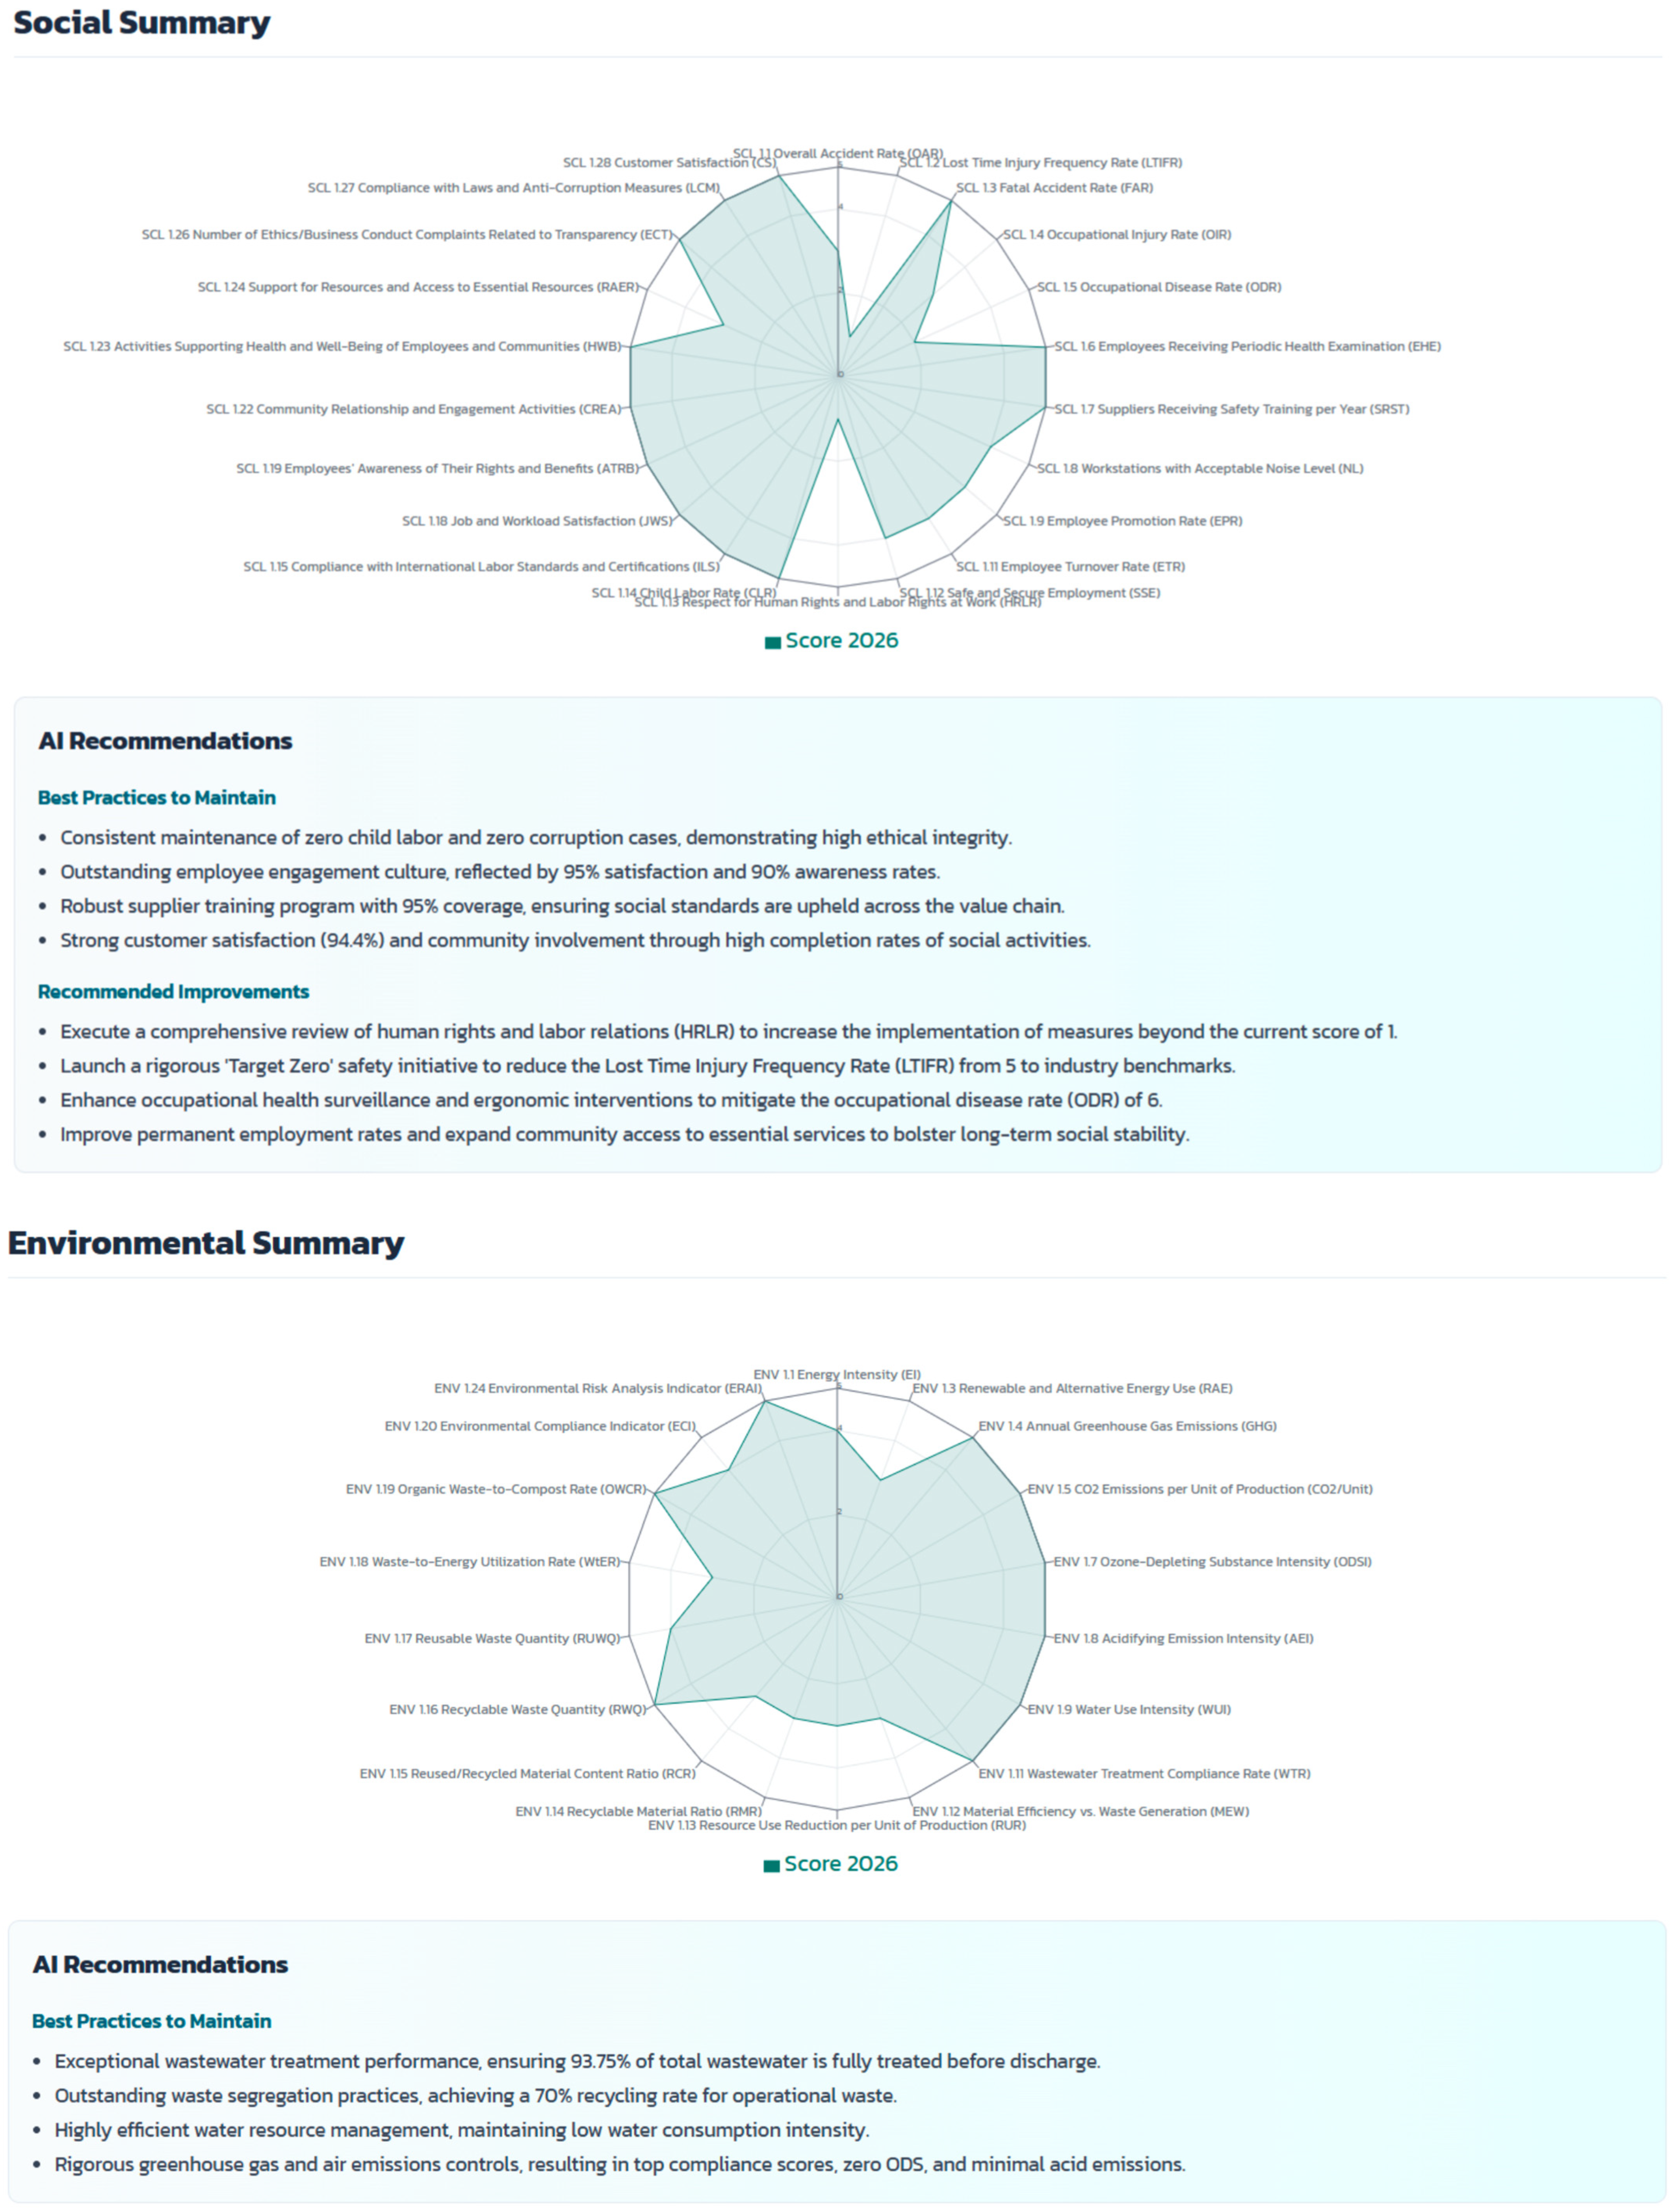
Section 2.6. The visualization module provided dashboards, tables, radar charts and comparative summaries of the indicator-level, dimension-level and overall sustainability performance. The reporting module produced structured outputs of sustainability assessments for organizational review.
The backend database was designed to store semi-structured sustainability data such as organization profile, indicator values, benchmark values, AHP weights, utility score and AI-generated interpretation records. A document-oriented database structure was used, as sustainability data may vary across organizations, sectors and assessment cycles. Such database architectures are suitable for flexible and evolving data models, especially if semi-structured records and changing schema requirements have to be handled [
30]. To support web access and system stability, the system was deployed in a web server environment supported by traffic balancing and reverse-proxy logic, which can improve availability, scalability, and request distribution in server-based applications [
31]. The AI component was integrated via an API-based integration to enable structured sustainability interpretation. The AI module did not compute indicator weights or modify sustainability scores. Instead, it used the validated and weighted score profile produced by the SIM Model. We created structured input objects for the AI module, which include indicator names, TBL dimensions, normalized utility scores, global weights calculated from the AHP, weighted gap scores, and performance classes. This design makes AI-generated outputs based on traceable quantitative evidence and structured schema-based input instead of unstructured raw data [
32,
33].
The AI module was implemented using the Gemini 3.5 Flash model through the Gemini API and functioned only as an interpretive layer above the deterministic scoring model. The AI did not calculate AHP weights or modify sustainability scores; instead, it interpreted structured JSON inputs containing the selected year, ECN/ENV/SCL indicator data, system-calculated scores, and related performance information. The prompt structure consisted of four controlled components: role assignment, structured data injection, JSON-only output constraints, and field-specific instructions for improvements, best practices, summary, and output language. To reduce generic or unsupported outputs, the AI was instructed to generate responses only from the supplied sustainability data and to return outputs in a predefined JSON schema. Hallucination risk was further controlled through output validation and fallback responses when the API failed, returned invalid JSON, or produced empty recommendation fields. AI-generated outputs were presented as advisory recommendations only. Final managerial decisions remained under human responsibility. To support traceability and reproducibility, the system recorded the model identifier, prompt template, structured input data, generated output, output language, assessment year, form type, and anonymized organization identifier for each request. Only structured indicator values and system-calculated scores were transmitted to the API, while factory names and other directly identifying information were excluded. Access to stored assessment records and AI-generated outputs was restricted through authenticated user roles and private database permissions.
2.8. System Usability and Practical Applicability Assessment
The usability and practical applicability of the developed AI-DSS were assessed using the System Usability Scale. SUS was selected because it is a standardized, widely used, and efficient instrument for evaluating perceived usability of interactive systems [
34,
35,
36]. The assessment involved 30 practitioners from 30 industrial organizations. Participants used the AI-DSS prototype and then completed a 10-item SUS questionnaire using a five-point Likert scale ranging from 1 (strongly disagree) to 5 (strongly agree).
For each respondent, the SUS score was calculated using Equation (23) [
34,
35,
36]:
where
is the SUS score of respondent
i, and
is the rating provided by respondent
i for item
q. Odd-numbered items are positively worded, while even-numbered items are negatively worded. The multiplication factor of 2.5 converts the total score to a 0–100 scale.
The mean SUS score was calculated using Equation (24) [
34,
35,
36]:
where
is the average usability score and
N is the number of respondents. The resulting SUS score was interpreted using established usability benchmarks, where higher scores indicate stronger perceived usability, ease of interaction, and practical suitability [
35,
36].
In addition to SUS, a Satisfaction Index was calculated to summarize user satisfaction with the AI-DSS as a practical decision support tool. The Satisfaction Index was calculated as the percentage of the maximum possible Likert score, as shown in Equation (25) [
37]:
where
SI is the Satisfaction Index,
Q is the number of satisfaction items,
is the rating provided by respondent
i for item
q, and
is the maximum Likert score. The
SI values were interpreted as follows: 80–100% = very satisfied, 60–80% = satisfied, 40–60% = moderately satisfied, 20–40% = less satisfied, and 0–20% = not satisfied.
4. Conclusions
This study developed the Sustainable Industrial Measurement (SIM) Model as an integrated sustainability assessment architecture for manufacturing organizations under the Triple Bottom Line framework. The main scientific contribution of the study lies in linking expert-validated indicator governance, evidence-based indicator reduction, consistency-verified priority weighting, utility-based sustainability scoring, web-based DSS implementation, and AI-assisted interpretation within a single sequential framework. This integration addresses a key gap in the literature, where indicator selection, weighting, scoring, system implementation, and managerial interpretation are often treated as separate components. The main findings are summarized as follows:
(1) The proposed SIM Model provides a transparent and sequential framework for transforming broad sustainability concepts into measurable, validated, and weighted indicators. Unlike conventional assessment approaches that rely on predefined or equally weighted indicators, the SIM Model applies FDT to manage expert uncertainty, Pareto screening to reduce indicator complexity, and Group AHP to derive consistency-verified priority weights.
(2) The final indicator structure confirms that manufacturing sustainability requires an integrated Triple Bottom Line perspective. Environmental indicators received the highest aggregate dimensional weight, reflecting the importance of energy, emissions, water use, material efficiency, waste circularity, and environmental compliance. At the same time, economic indicators such as return on assets and value-added production ranked highly at the individual indicator level, indicating that economic performance remains a key enabler of sustainability implementation.
(3) The integration of the weighted indicator framework into a web-based AI-DSS strengthens the operational value of the model. The system enables organizations to convert sustainability data into standardized scores, visualize performance across dimensions, compare factories or assessment periods, and generate structured reports. This shifts sustainability assessment from static performance documentation toward decision-oriented sustainability intelligence.
(4) The Generative AI component was designed to extend the prototype beyond automated reporting by interpreting the validated and weighted sustainability score profile, identifying priority gaps, and generating structured advisory recommendations. It interprets the validated and weighted sustainability score profile to identify strengths, diagnose priority gaps, detect cross-dimensional patterns, and generate improvement recommendations. Because the AI module operates on structured inputs derived from FDT, Pareto screening, AHP weighting, and utility scoring, its outputs are grounded in transparent assessment logic rather than generic text generation.
(5) The usability evaluation demonstrated excellent perceived usability of the SIM Model. Testing with 30 industrial practitioners produced a System Usability Scale score of 86.0. This finding indicates that the prototype was perceived as user-accessible but does not confirm its effectiveness in improving decision quality, sustainability planning, reporting accuracy, resource allocation, or organizational outcomes.
Therefore, the main scientific contribution of this study lies in the development of an integrated methodological and operational architecture for sustainable manufacturing assessment. The SIM Model advances the literature by linking expert-validated TBL indicator construction, evidence-based indicator reduction, consistency-verified AHP weighting, Utility Value Analysis, web-based DSS implementation, and AI-assisted interpretation within a single sequential framework. This integration addresses key limitations of prior sustainability assessment approaches that often treat indicator selection, weighting, scoring, system implementation, and managerial interpretation as separate components. The present evidence directly supports the methodological validity of the indicator framework, the feasibility of system implementation, and the perceived usability of the platform among practitioners. However, the model’s effects on decision quality, recommendation accuracy, resource allocation, and managerial outcomes were not empirically tested and should be examined in future outcome-based studies.
There are limitations of this study. First, the expert judgments and usability evaluations were performed in a specific manufacturing and institutional context. The resulting indicator weights may therefore reflect the priorities of the participating expert group and may need further validation in other industries, countries and firm sizes. In addition, the current Group AHP procedure used equal response weighting when aggregating expert judgments. Therefore, the sensitivity of criteria rankings to alternative stakeholder assumptions was not examined. Future research should conduct sensitivity analysis using three expert response-weighting schemes: (i) equal weighting, (ii) experience-based weighting based on experts’ professional or research experience, and (iii) familiarity-based weighting based on experts’ familiarity with the evaluated sustainability topics [
26]. Such analysis would help assess whether the indicator rankings remain stable under different expert-weighting assumptions and would strengthen the robustness and generalizability of the SIM framework. Second, the AHP structure presupposes hierarchical relationships among indicators, while in practice some sustainability indicators may be interdependent. Third, Pareto screening was applied to produce a manageable operational indicator set. Although representation across all three TBL dimensions was retained and alternative thresholds were discussed, the selected cut-off may affect context-sensitive lower-ranked indicators. The complete indicator catalog should remain available for sector-specific materiality review. Finally, the system evaluation focused mainly on perceived usability rather than demonstrated decision support outcomes. Although the SUS score indicates strong practitioner acceptance, this study did not directly measure whether the SIM Model improves decision quality, sustainability planning effectiveness, reporting accuracy, resource allocation, or managerial prioritization. Future research should conduct longitudinal multi-factory implementation, expert assessment of generated reports and recommendations, and before–after comparison of managerial decisions to validate the actual decision support value of the system.