3.1. Feature Engineering and Clustering Analysis
After data preparation, two feature engineering analyses were conducted on the dataset to investigate the impact of each feature on energy consumption, using Random Forest and Lasso.
Table 5 shows the results of this analysis.
According to
Table 5, the total floor area has the most significant impact on energy consumption. Following that, there are the buildings’ location and age. Regarding property type, although the impact is less than the others, it is not zero, especially considering the non-linear impact from Random Forest. Therefore, three features of total floor area, year built, and property type were selected for K-Means clustering. Since the location factors (longitude and latitude) also have a non-zero impact in Random Forest, they were kept for a more detailed neighborhood analysis in the next step.
To confirm that these drivers were not merely artifacts of the relationship between building size and total energy load, the Random Forest feature importance analysis was repeated using four intensity- and carbon-based dependent variables: site energy use intensity, source energy use intensity, weather-normalized site energy use intensity, and greenhouse gas emission intensity. The results, summarized in
Table 5, confirmed that the importance of total floor area declined substantially when the dependent variable was normalized by area, falling from approximately 34% under the total-energy specification to roughly 25% under the energy intensity specifications. This decline is consistent with the expectation that part of the floor area effect in the total-energy model reflects energy load rather than energy efficiency. Nevertheless, total floor area remained among the two most influential predictors under every intensity formulation, while the importance of geographic location and property type increased and the importance of building age remained stable. These results indicated that the structural features selected for clustering, total floor area, year built, and property type, capture genuine drivers of building energy performance rather than a mechanical consequence of building scale, and that geographic location remained an important determinant warranting its inclusion in the subsequent neighborhood-level matching step.
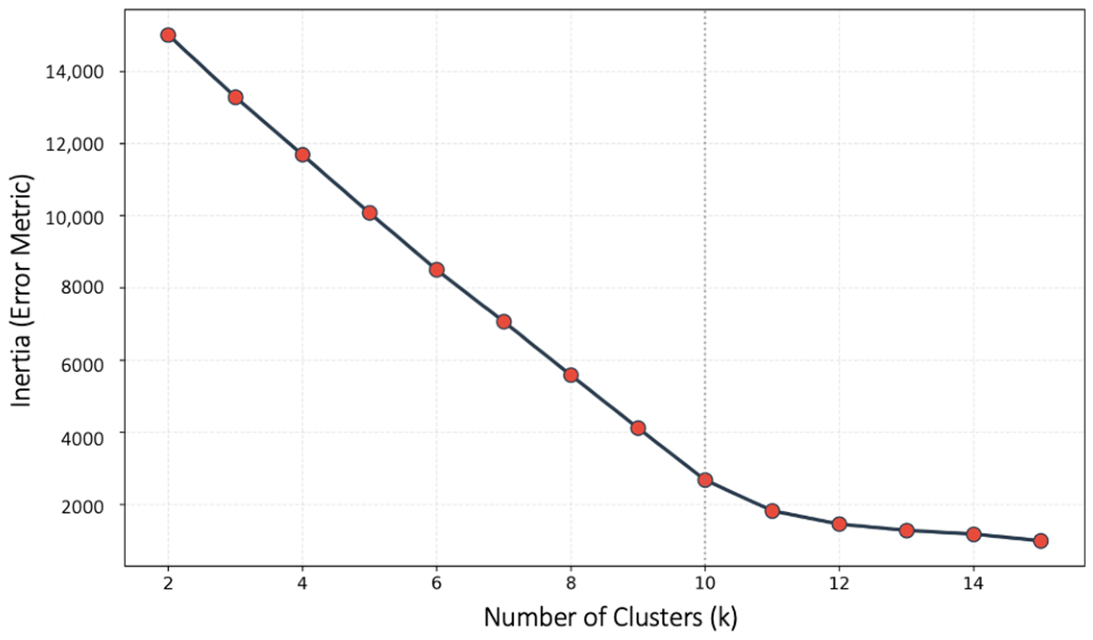
The first step in the K-Means clustering analysis was to identify the optimal number of clusters. To this end, as described in the Methodology section, the elbow graph method was applied, considering three features of total floor area, year built, and property type to find out the optimum number of clusters. In this regard,
Figure 3 shows the elbow graph.
In
Figure 3, the
x-axis represents the number of clusters (k), while the
y-axis shows the inertia, which is the within-cluster sum of squared distances (i.e., an error metric indicating how compact the clusters are). As expected, inertia decreases as the number of clusters increases, since adding more clusters reduces the distance between data points and their assigned centroids. However, this reduction is not uniform. The curve shows a relatively steep decline in inertia from k = 2 to approximately k = 9, indicating that adding clusters in this range significantly improves the clustering quality. Beyond this point, the rate of decrease becomes much smaller, and the curve starts to flatten. This transition point, commonly referred to as the “elbow,” suggests a balance between model complexity and clustering performance. In this case, the elbow is observed at k = 10, where further increases in the number of clusters result in only marginal improvements. Therefore, k = 10 was selected as the optimal number of clusters for this study. This choice ensures that the clustering captures the data’s underlying structure without introducing unnecessary complexity.
To further evaluate the quality and robustness of the clustering results, both quantitative performance indicators and a visual inspection were considered. The clustering achieved a Silhouette Score of 0.69, indicating strong separation between clusters and high internal cohesion. In addition, the Calinski–Harabasz (CH) Index reached 819.40, further confirming that the clusters are both well-separated and compact. Beyond these internal indices, the partition at
k = 10 produced the most functionally coherent grouping of the candidate solutions: as detailed in
Table 6, each of the ten clusters is dominated almost entirely by a single property type, with nine clusters composed exclusively of one functional category and the tenth predominantly of offices. This near-complete functional separation provided the decisive justification for selecting
k = 10, since it confirms that the algorithm recovered interpretable building archetypes rather than statistically arbitrary partitions, directly supporting the matched comparison that follows. These numerical indicators are supported by the visual evidence shown in
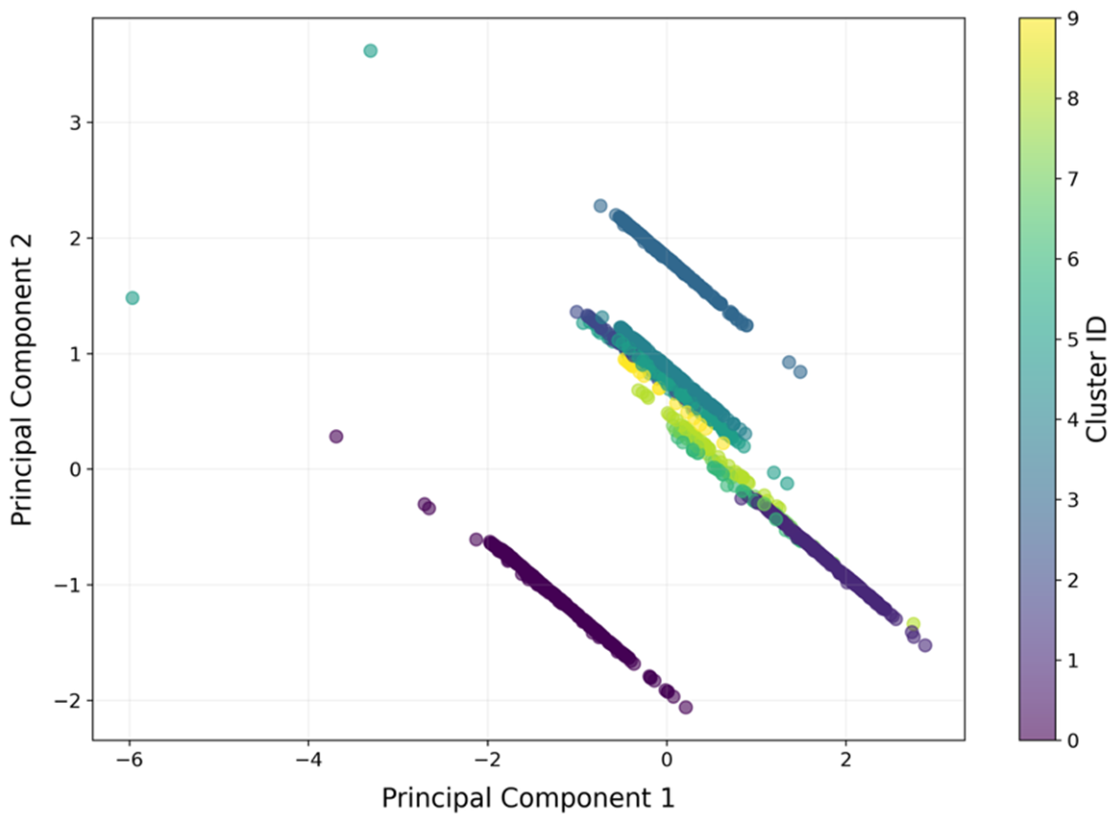
Figure 4, which shows the clusters projected into a two-dimensional space using Principal Component Analysis (PCA). In this projection, each point represents a building, colored by its assigned cluster. Despite the dimensionality reduction, the clusters remain relatively distinct, with clear groupings and limited overlap between them. This consistency between the quantitative metrics and the visual pattern suggests that the selected clustering structure (
k = 10) effectively captures meaningful patterns in the data and provides a reliable basis for subsequent analysis.
The outcome of this step is 10 clusters that each contain buildings with similar characteristics. The descriptive characteristics of each cluster, including the number of buildings, the number of LEED-certified buildings, the median and interquartile range of floor area, the median construction year, the dominant property types, and the median energy intensity, are summarized in
Table 6.
Cluster 1 is a residential cluster. It is dominated almost entirely by multifamily housing, with a few senior living and dormitory buildings. These buildings are generally mid-aged, with a median construction year around 1973, and they tend to be moderately large, with a median size of about 110,250 ft2. Cluster 2 is an education cluster. It is made up mostly of K–12 schools, with some colleges and libraries. These are generally older buildings, with a median year built around 1956, and are typically medium-sized, with a median floor area of about 87,662 ft2. Cluster 3 is a very clear lodging cluster, consisting entirely of hotels. These buildings are relatively newer than many other clusters, with a median year built around 1983, and they are generally large, with a median size of about 208,197 ft2. Cluster 4 is a broad mixed/other-use cluster. It includes a variety of uses such as supermarkets, municipal buildings, strip malls, mixed-use properties, and other miscellaneous buildings. The buildings are mostly mid-aged, with a median year built around 1974, and are medium-sized, with a median area of about 112,440 ft2. Cluster 5 is an industrial cluster. It mainly includes non-refrigerated warehouses, self-storage facilities, distribution centers, and manufacturing buildings. These are mostly older industrial buildings, with a median year built around 1975, and they are moderate in size, with a median floor area of 98,685 ft2.
Cluster 6 is primarily an office cluster. Almost all buildings in this group are offices. They are generally older, with a median year built around 1973, but this cluster stands out because it contains some very large office buildings. Its median size is about 196,162 ft2, while the mean is much higher due to a few very large properties. Cluster 7 is a utility-type cluster, composed mainly of parking structures and data centers. These are among the oldest clusters, with a median year built around 1950, and their size is moderately large, with a median of about 120,800 ft2. Cluster 8 is a public/cultural cluster. It includes museums, recreation buildings, performing arts buildings, and worship facilities. These buildings are generally older, with a median construction year around 1956, and are medium-sized, with a median floor area of about 113,364 ft2. Cluster 9 is the healthcare cluster. It includes medical offices, hospitals, and laboratories. These buildings are mostly older to mid-aged, with a median year built around 1965, and they tend to be among the largest buildings, with a median size of about 207,920 ft2. Cluster 10 is a retail cluster composed entirely of retail stores. Compared with several other clusters, these buildings are somewhat newer, with a median construction year around 1991.5, and they are generally the smallest group in scale, with a median floor area of about 115,856 ft2.
3.2. Energy Analysis
According to the results, the average annual energy consumption of non-LEED buildings is 3988,172 kWh, while this number is 10,199,730 kWh for LEED-certified buildings. Also, regarding average annual energy consumption per sqft, non-LEED buildings consume 22.68 kWh/sq ft, while LEED-certified buildings’ usage is 79.40 kWh/sq ft. Although LEED-certified buildings appear to consume more energy than their non-LEED counterparts, we still need more detailed analysis to reach a conclusion. The magnitude of this raw gap warrants explanation before proceeding, as a difference of this size could in principle indicate a data irregularity rather than a genuine performance difference.
Two features of the sample account for it. First, the comparison is structurally unbalanced: the 58 certified buildings are not a representative cross-section of the 1403-building stock but are concentrated in large, service-intensive functional types, whereas the non-certified pool is dominated by low-intensity uses. As the cluster descriptions in
Table 6 show, the healthcare cluster alone carries a median intensity of roughly 42 kWh/sq ft, several times that of the residential and industrial clusters (approximately 13 and 5 kWh/sq ft) that make up the bulk of the non-certified stock. Therefore, a raw city-wide average contrasts a functionally intensive certified subset against a functionally light non-certified majority, and much of the apparent gap reflects this difference in building function rather than a difference attributable to certification. Second, the certified mean is strongly right-skewed by a small number of very high-intensity records: the median intensity of certified buildings is far closer to that of non-certified buildings than the means suggest, indicating that the raw average is pulled upward by a few extreme observations rather than by a systematic shift across the certified sample. Thus, the raw city-wide comparison is best understood as a composition effect compounded by skew, not as evidence of a uniform efficiency deficit, and it is precisely this confounding that the structural clustering and geographically constrained matching described below are designed to remove.
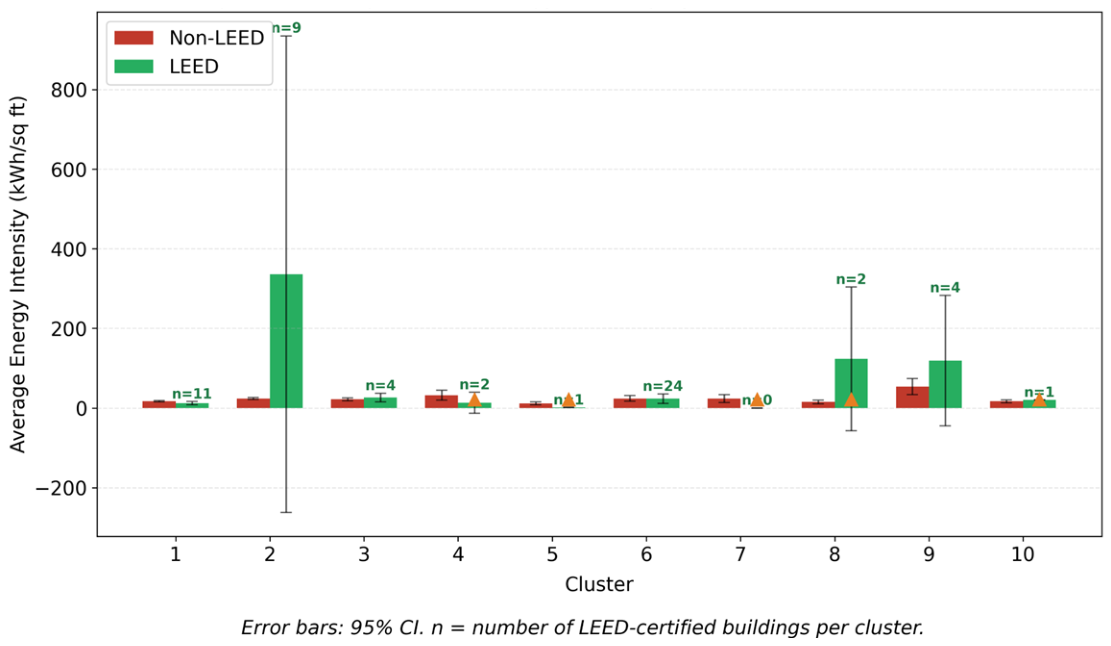
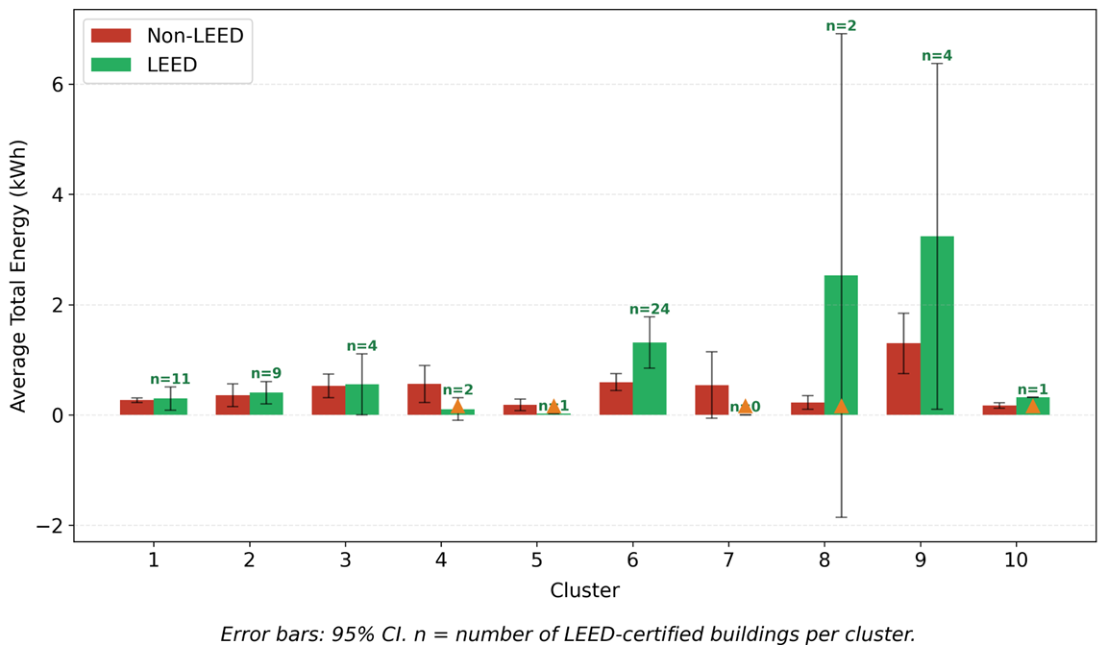
Building clusters was highlighted in the next step. In this step, the average energy consumption of non-LEED and LEED-certified buildings in each of the 10 clusters was compared to provide a fairer comparison among buildings.
Figure 5 shows average annual energy consumption for non-LEED and LEED-certified buildings in clusters.
Similarly,
Figure 6 illustrates average annual energy consumption per sq ft across different building clusters.
When the results are interpreted in light of cluster attributes, the higher energy use of LEED-certified buildings appears to be concentrated mainly in clusters with large, complex, and service-intensive building types. This is especially evident in Cluster 8 (public/cultural), and Cluster 9 (healthcare) where LEED-certified buildings show notably higher total energy consumption and higher energy intensity than non-LEED buildings. These clusters include buildings such as museums, recreation and worship facilities, hospitals, laboratories, and retail stores, all of which can have high operational demands due to long operating hours, specialized systems, ventilation requirements, or occupant-intensive use. Cluster 6, which is primarily office buildings, also shows higher total energy use for LEED-certified buildings, likely reflecting the presence of very large office properties in that cluster. In contrast, the differences between LEED and non-LEED buildings are much smaller in clusters such as Cluster 1 (residential) and Cluster 3 (lodging), where average energy use is relatively comparable. In some clusters, such as Cluster 4 (mixed-use/other) and Cluster 5 (industrial), LEED-certified buildings appear to have lower energy use. Overall, these cluster-level comparisons suggest that the higher overall average energy consumption of LEED-certified buildings is not consistent across all building types, and that building function, size, and operational complexity play an important role in shaping the observed differences between LEED-certified and non-LEED buildings.
These cluster-level patterns can be connected to the operational characteristics that distinguish high-intensity building functions. In the healthcare cluster, the elevated energy use of certified buildings is consistent with the operational profile of hospitals and laboratories, which maintain continuous climate control, operate specialized mechanical systems such as high-rate ventilation and air-change requirements for clinical and laboratory spaces, and sustain plug and process loads from medical and research equipment that are largely independent of envelope or lighting efficiency measures. Because these loads are driven by function rather than by design-stage efficiency provisions, the energy savings achievable through certification strategies are inherently constrained in this building type. A similar logic applies to the public and cultural cluster, where museums, performing-arts venues, and worship and recreation facilities combine extended and irregular operating hours with large, often single-volume conditioned spaces and variable occupant loads, conditions that raise baseline energy demand irrespective of certification status. In contrast, the clusters in which certified and non-certified buildings performed comparably, such as residential and lodging, are characterized by more regular occupancy schedules and standardized mechanical systems, where efficiency measures rewarded by certification can translate more directly into measured savings. This interpretation indicates that the observed differences are shaped substantially by the operational intensity intrinsic to particular building functions.
This interpretation can be framed more precisely through the established distinction between regulated and unregulated building energy loads. Energy modeling under standards such as ASHRAE 90.1, which forms the technical basis of the EA category, primarily governs regulated loads—the fixed building services such as heating, cooling, ventilation, and interior lighting that the design team specifies and controls. Plug loads and specialized process loads, by contrast, including medical imaging and laboratory equipment, server and data-processing loads, and other tenant-installed systems, are treated as unregulated: they fall largely outside the scope of the energy model and of the efficiency measures the certification rewards [
16]. In service-intensive functional types, these unregulated process loads can constitute a substantial and growing share of total consumption, so that even a building with efficient regulated systems may record high measured intensity driven by end uses the certification never addressed. A related mechanism arises from the separation between base-building and tenant scopes. Where certification is pursued for the core and shell—the developer-controlled structure and central systems—the energy-intensive fit-out is frequently designed and installed later by tenants, outside the certified scope and outside the design-stage energy model. In sectors characterized by intensive equipment loads and bespoke tenant fit-outs, such as healthcare and certain public and cultural facilities, this division of responsibility can leave a large portion of operational demand uncaptured by the certification process, offering a plausible account of why certified buildings in precisely these clusters show no measured energy advantage over their structural and spatial peers.
It must be emphasized, nonetheless, that the benchmarking dataset does not contain direct measures of several operational factors that strongly influence energy use, including operating hours, occupancy density, plug loads, ventilation rates, tenant mix, district energy supply, commissioning status, and building management practices. Because certified buildings in this sample are concentrated in functionally demanding, high-occupancy uses, their higher measured intensity may partly reflect more intensive patterns of use rather than lower inherent efficiency. The clustering procedure controls for building function and the matched comparison controls for spatial context, but neither can fully isolate the independent effect of certification from these unmeasured operational drivers. The observed differences are therefore best understood as descriptive of raw operational energy intensity rather than as a clean estimate of the certification effect net of use intensity.
Although the recent analysis provided a fairer comparison, the location factor of the buildings has still not been considered. According to the
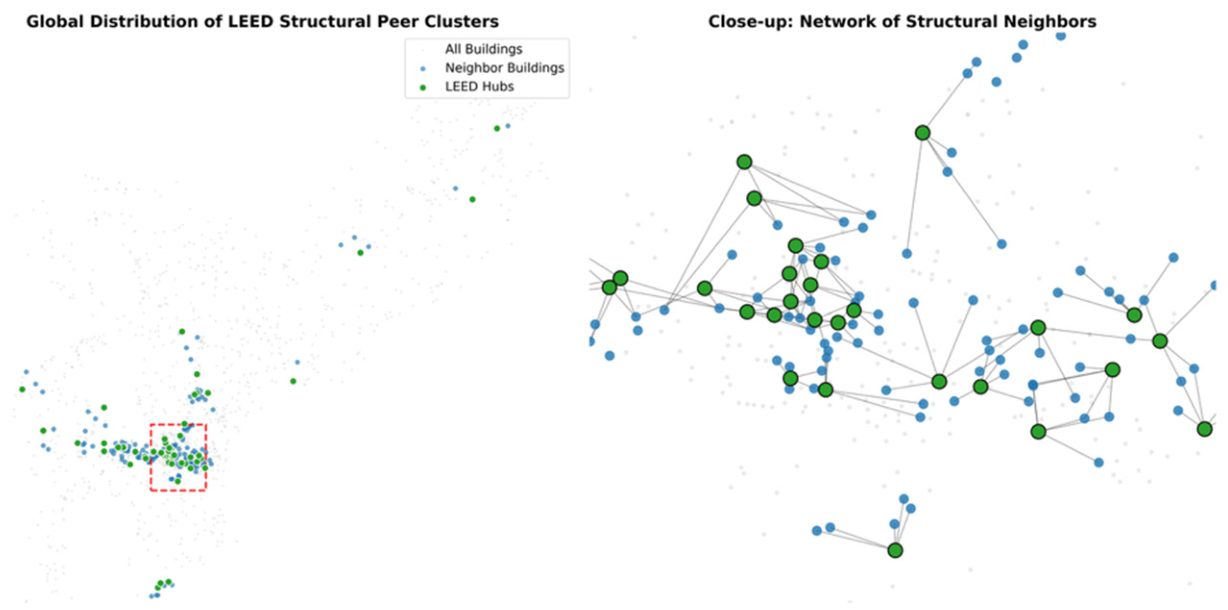
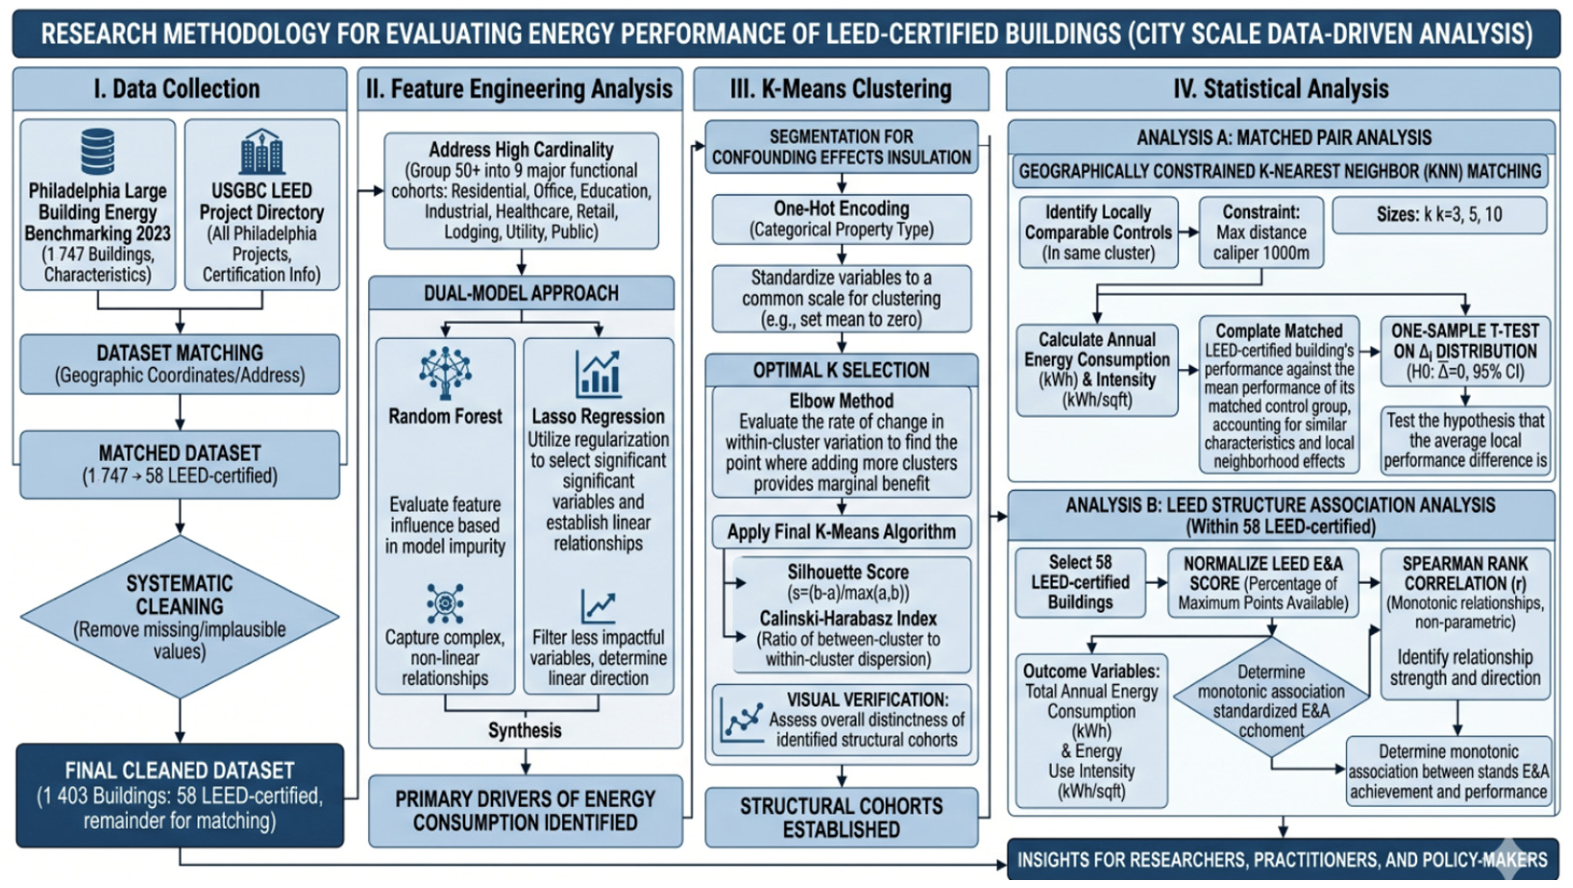
Section 3.1 analysis results, the location factor is one of the major contributors to energy consumption in the city-level analysis. Therefore, the last step of the analysis focused on the cluster and neighborhood analysis as described in the Methodology. In this regard, each LEED-certified building’s energy usage was compared to nearby 3, 5, and 10 non-LEED buildings from the same building cluster in a radius of 1000 m. As an example,
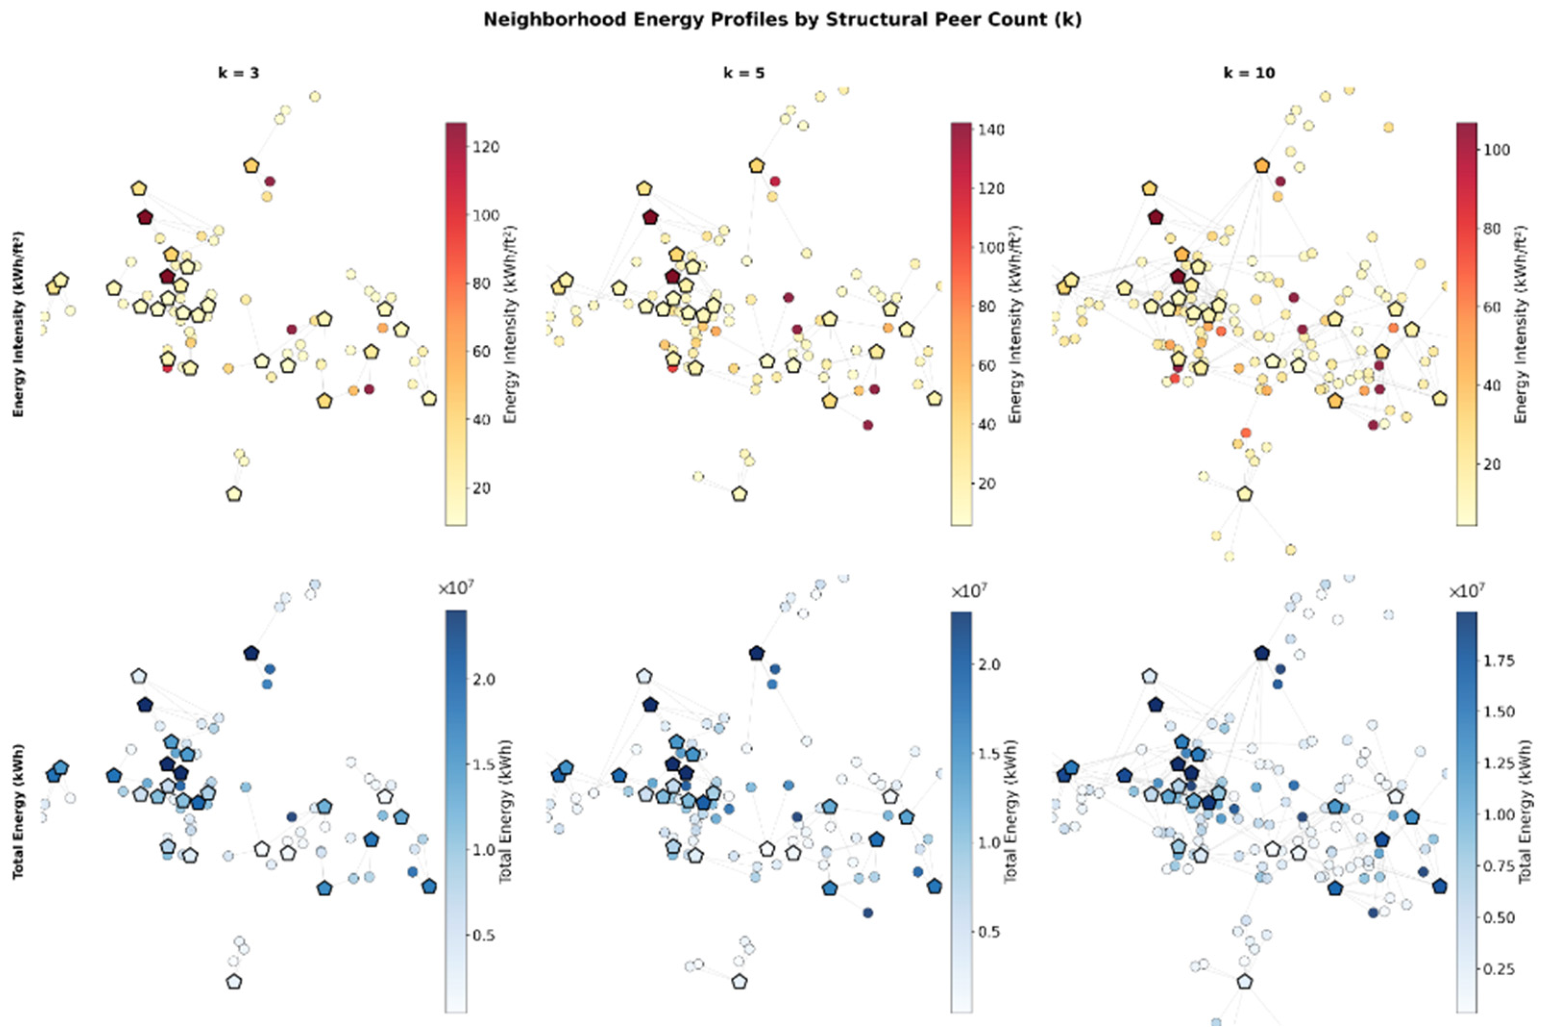
Figure 7 displays a network of structural neighbors for k = 5 neighbors around the LEED-certified buildings. We had similar networks for k = 3 and k = 10 as well.
Building on the cluster-specific findings, the final stage of the analysis integrated spatial proximity to account for the localized urban conditions that drive energy demand. By utilizing a geographically constrained K-nearest neighbor (KNN) matching procedure, each LEED-certified building was compared against its most direct structural peers within a 1000 m radius.
Figure 8 illustrates the resulting neighborhood energy profiles across three distinct peer counts (k = 3, 5, 10), visualizing the spatial connectivity between certified “hubs” and their non-certified counterparts. This mapping highlights that even when controlling for both building archetype and neighborhood context, LEED-certified structures often reside in high-intensity nodes compared to the surrounding building stock.
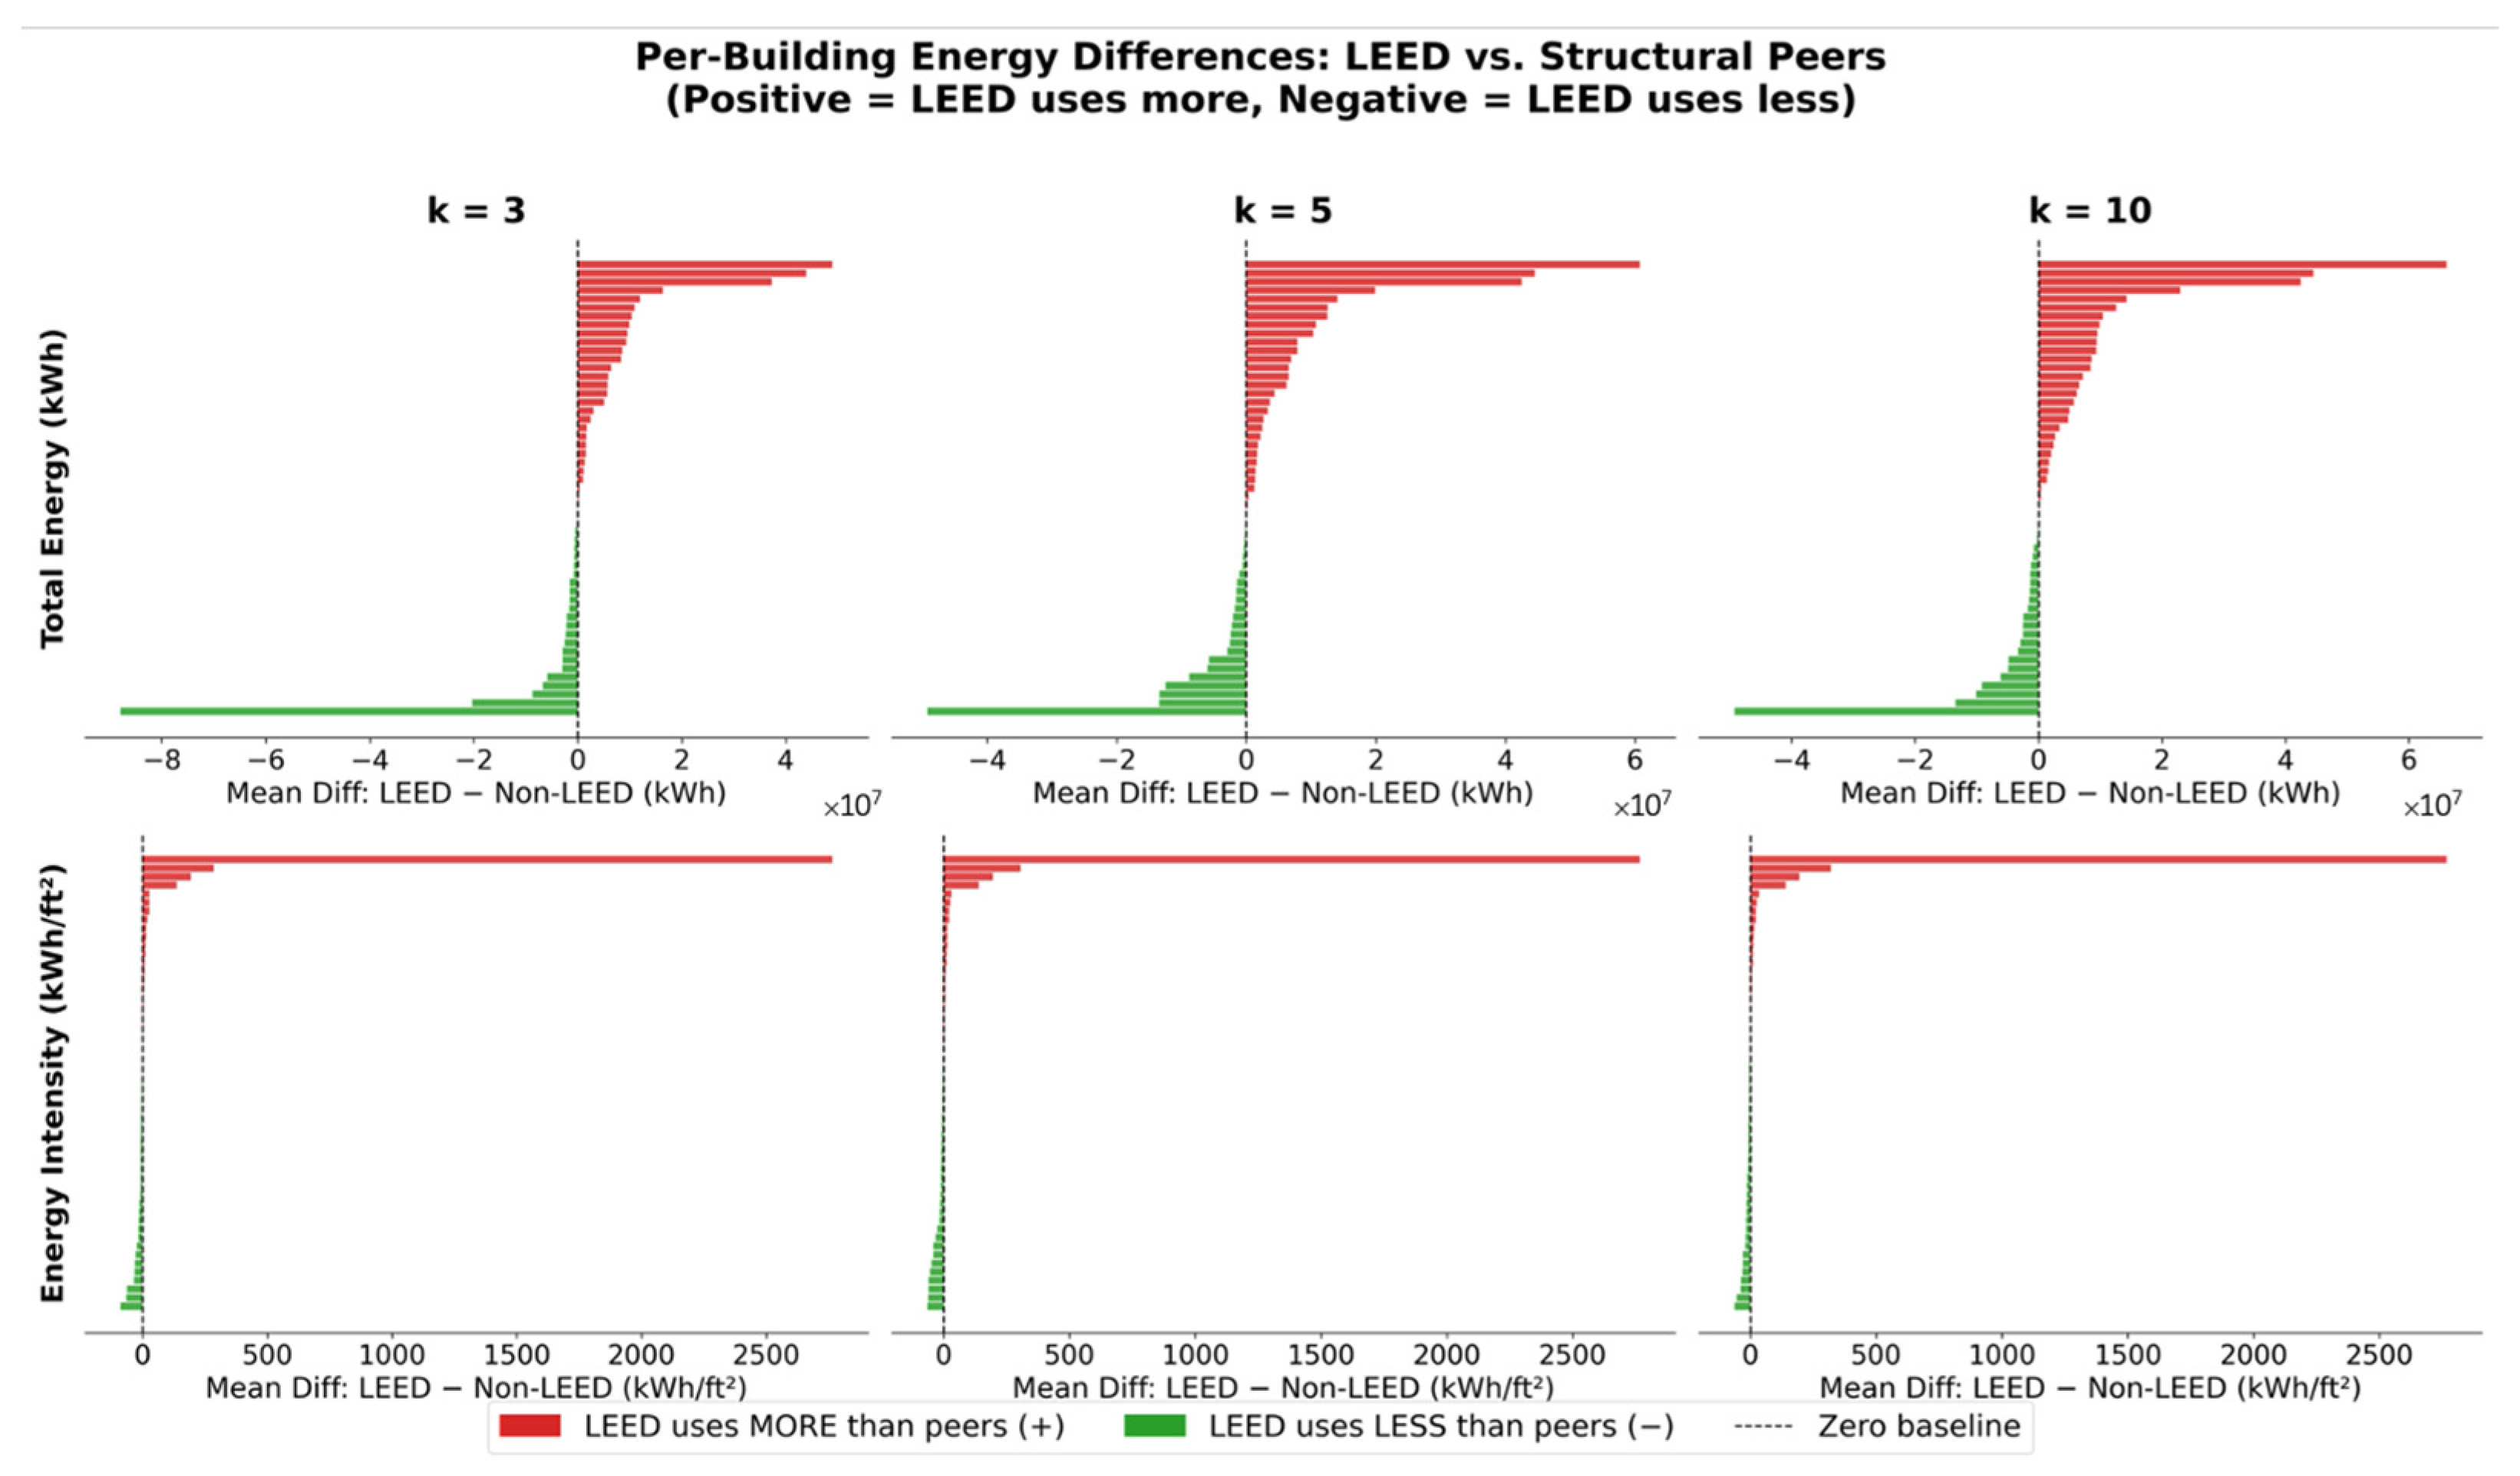
The distribution of these energy performance gaps is further detailed in
Figure 9, which presents the per-building differences in total energy consumption and intensity. The waterfall visualizations reveal a bifurcated performance landscape: while a subset of LEED-certified buildings (represented in green) successfully achieves lower energy use than their local structural peers, a larger portion (represented in red) exhibits higher consumption. Notably, the magnitude of overconsumption in red-performing LEED buildings is larger than the savings observed in green-performing ones, which heavily skews the aggregate city-scale results. For total energy use, these differences are particularly pronounced, suggesting that a few high-intensity certified projects contribute disproportionately to the LEED sample’s overall energy footprint.
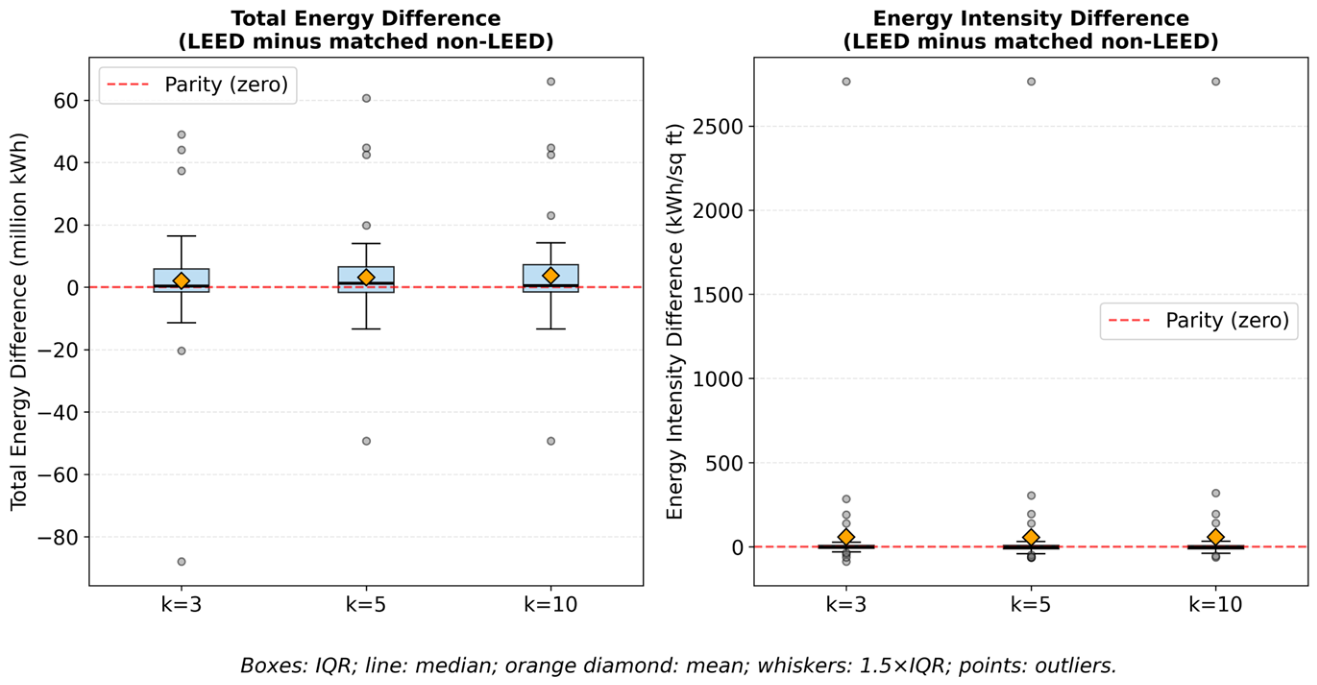
To make the distribution of these per-building differences explicit,
Figure 10 presents the same matched differences as boxplots for each neighborhood size. While the median matched difference lies near or slightly below zero, particularly for energy intensity, a long upper tail reflects a subset of certified buildings with substantially higher consumption than their structural peers. The divergence between the mean (orange marker) and the median in each panel confirms that the positive average differences are driven disproportionately by a small number of high-intensity certified projects rather than by a systematic tendency across the sample.
The statistical synthesis of these comparisons, summarized in
Table 7, provides a comprehensive assessment of the LEED effect in Philadelphia. Across all tested neighborhood sizes (k = 3, 5, and 10), the mean difference in total energy consumption remained positive, indicating that LEED buildings, on average, use more energy than their immediate neighbors. For k = 3, the mean difference was approximately 2.1 million kWh (
p = 0.372), which grew to 3.74 million kWh as the comparison group expanded to k = 10. Interestingly, at the k = 10 level, the
p-value for total energy consumption reached 0.0802, suggesting that the higher energy use of LEED buildings is statistically significant at the 90% confidence level, though it does not meet the more stringent 95% threshold. Similarly, the energy intensity metric (kWh per sq ft) consistently showed that LEED buildings consumed roughly 56–59 units more than their peers, regardless of the number of neighbors considered.
Because matched energy differences are typically right-skewed and sensitive to a small number of extreme buildings, the robustness of the
t-test results was examined using a battery of complementary methods, summarized in
Table 7. For each comparison, effect sizes (Cohen’s d), standard deviations, medians, and both parametric and bootstrapped 95% confidence intervals were computed, alongside Wilcoxon signed-rank tests, 10% trimmed means, and sensitivity analyses excluding the most extreme 5% of buildings. The two outcome variables behaved differently under these checks. For energy use intensity, all methods agreed that no significant difference existed between certified and non-certified buildings; although the mean difference was positive, the median difference was marginally negative (approximately −3 to −4 kWh/sq ft), the trimmed means were near zero, and neither the Wilcoxon tests (
p = 0.28–0.48) nor the outlier-excluded tests (
p = 0.65–0.997) approached significance. The positive mean intensity difference was therefore attributable to a small number of high-intensity certified buildings rather than to a systematic tendency. For total energy consumption, the effect was more sensitive to extreme observations: the raw
t-tests were non-significant (
p = 0.080–0.378), the Wilcoxon tests were closer to significance (
p = 0.055–0.104), and excluding the most extreme 5% of buildings rendered the difference statistically significant at every neighborhood size (
p = 0.006–0.025). This indicated that the higher total energy use of certified buildings was concentrated in, but not solely driven by, a small number of very large, high-consumption certified projects. Because the same non-certified controls were reused across multiple matches, a sign-flip permutation test was additionally conducted for the k = 10 total-energy comparison; the resulting
p-value (0.079) closely matched the parametric result, indicating that control reuse did not materially distort inference. Finally, given that six related hypothesis tests were conducted across two outcomes and three neighborhood sizes, multiple-comparison corrections were applied, and neither Bonferroni nor Benjamini–Hochberg correction yielded any significant result (all corrected
p > 0.34). Taken together, these robustness analyses did not alter the study’s central conclusion: on a floor-area-normalized basis, certified and non-certified buildings performed equivalently, and the only evidence of higher energy use among certified buildings concerned absolute total consumption, was contingent on the inclusion or exclusion of extreme observations, and did not survive correction for multiple comparisons.
The findings indicate an apparent performance gap rather than a statistically confirmed one: LEED-certified buildings in Philadelphia showed no measurable energy savings, and their mean energy use and intensity were directionally higher than those of non-LEED buildings of similar size, age, and function. It should be emphasized that none of these differences were statistically significant at the 95% level (
Table 7); the strongest result, total energy use at k = 10, was significant only at the 90% level (
p = 0.080). These comparisons therefore describe a consistent directional pattern in the matched sample, not a confirmed effect of certification. While the initial raw data suggested a massive gap, the implementation of K-means clustering and spatial matching confirmed that these differences persist even when the comparison is restricted to the most relevant structural and geographical peers. Because the gap is not statistically significant, these results are best interpreted as the absence of a detectable LEED advantage rather than as evidence of a certification penalty. This null finding is itself notable, given that USGBC reports average energy savings of 20–25% for certified buildings. The data suggest that the certification’s intended energy efficiency is frequently offset by the inherent complexity of buildings seeking LEED status. Specifically, Clusters 8 (public/cultural) and 9 (healthcare) showed the most dramatic disparities. These facilities often operate 24/7 and feature specialized ventilation systems that may inherently limit the practical savings achievable solely through sustainable design.
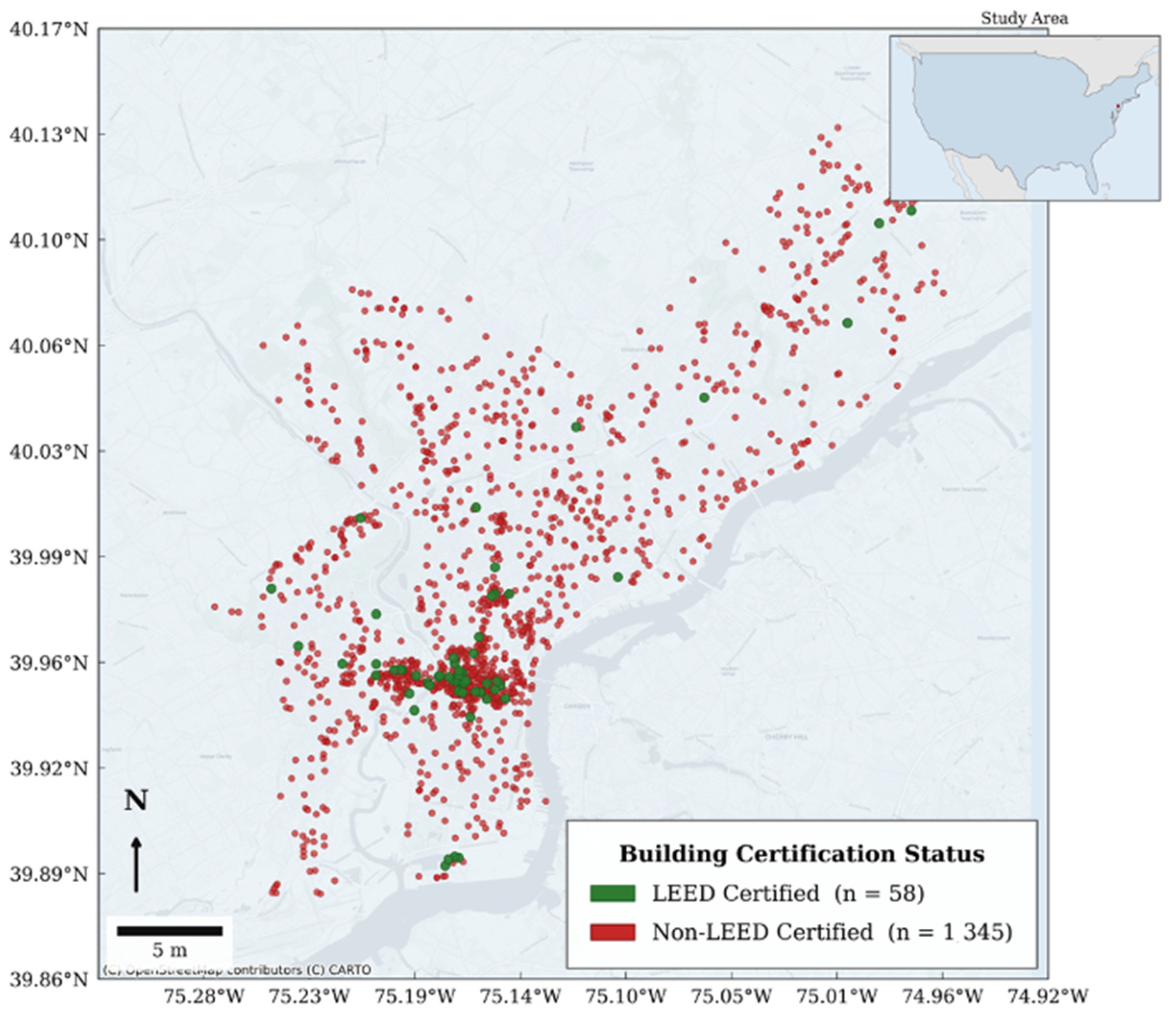
From a policy perspective, these results highlight the performance gap often discussed in green building literature, where design-based ratings do not always translate into operational reality. For practitioners and city planners, this emphasizes the need for post-occupancy evaluations and a shift from rewarding potential efficiency toward rewarding measured performance. Furthermore, the spatial analysis reveals that LEED buildings are heavily concentrated in the dense urban core of Philadelphia, where energy intensity is naturally elevated by factors such as the urban heat island effect and higher occupant density. However, because the KNN matching procedure utilized a 1000 m caliper to substantially reduce the influence of these localized environmental conditions, the higher consumption metrics reported in
Table 7 are unlikely to be explained by broad geographic context alone. It should be acknowledged, nonetheless, that spatial proximity does not constitute complete control for neighborhood energy mechanisms. Distance alone does not equalize urban heat island exposure, building density, street-canyon form, shading, local land surface temperature, transit access, or the intensity of socioeconomic activity, and recent evidence indicates that such urban thermal and landscape mechanisms can be nonlinear and spatially heterogeneous rather than uniform across a given radius [
41]. The caliper therefore restricts comparisons to locally similar environments but should not be interpreted as full statistical control for every neighborhood-level driver of energy use. This suggests that the certification framework itself may not sufficiently prioritize the most effective energy-reduction strategies for this specific urban climate.
A critical finding in this analysis is that LEED-certified buildings in the sample achieve an average satisfaction of only 31.53% of the available points in the EA category. When viewed alongside the satisfaction levels of other LEED categories—Location & Transportation (58.57%), Sustainable Sites (66.12%), Water Efficiency (53.29%), Material & Resources (39.31%), Indoor Environmental Quality (54.60%), Innovation (78.74%), Regional Priority (44.23%), and Integrative Process (27.27%)—the EA category stands out as one of the weakest areas of achievement. Because the total points available in each category vary across rating system versions and project types, these percentages provide a standardized basis for comparison. The notably low EA satisfaction rate is consistent with the possibility that energy-related credits contribute less to certification outcomes in this sample than credits in other categories. It should be emphasized, however, that the available data do not include the detailed credit-level scorecards or certification pathways that would be required to demonstrate strategic point-seeking, and this interpretation is therefore offered as a hypothesis warranting further investigation rather than as an established finding. To examine whether EA credit achievement corresponds to actual energy outcomes, a correlation analysis is conducted for the 58 LEED-certified buildings with complete data.
Table 8 shows the results of this analysis. The results indicate a negligible and non-significant association between the EA percentage score and energy use intensity (r = 0.085,
p = 0.551). The relationship between the EA score and total annual energy consumption is similarly weak and non-significant (r = 0.203,
p = 0.148), a pattern likely influenced by building size, as larger buildings tend to consume more energy in absolute terms while also having greater capacity to pursue EA-related design strategies or renewable energy credits. Overall, the EA credit score carries virtually no predictive signal for measured operational energy performance. This outcome implies that LEED certification may often be achieved through points in categories such as Location & Transportation or Sustainable Sites, or that EA credits primarily reward design intentions and procurement strategies rather than measurable reductions in actual energy use. Lack of appropriate maintenance and a lack of a follow-up policy from LEED to evaluate the buildings years after construction finished can be another reason for this. Taken together, these findings indicate that, in this sample, certification status and measured operational energy performance may diverge, particularly where post-occupancy verification is limited or where high-intensity building uses are not fully accounted for. This divergence does not, in itself, constitute evidence of misleading disclosure or strategic credit-seeking by building owners, and no such inference is drawn here; establishing intent would require credit-level and disclosure data beyond those available in this study. The broader question of environmental credibility and the conditions under which sustainability claims are subject to external scrutiny has been examined in the greenwashing literature [
42], but the present analysis speaks only to the observed divergence between certification and measured energy outcomes, not to its underlying motivations.
To examine whether this absence of association was an artifact of pooling buildings certified under different rating system versions or representing different building functions, the correlation analysis was repeated within version strata, within functional strata, and under several sensitivity specifications. Among the buildings with available data, 38 were certified under LEED v3 (2009), 13 under legacy v2 pathways, and 7 under LEED v4. Within the largest single-version subgroup, LEED v3 (n = 36), the association between EA achievement and energy use intensity remained negligible and non-significant (r = 0.020, p = 0.907), and the same pattern held for the legacy v2 subgroup (r = 0.304, p = 0.393, n = 10) and the v4 subgroup (r = −0.029, p = 0.957, n = 6); excluding v4 buildings did not alter the result (r = 0.130, p = 0.390, n = 46). A parallel stratification by building function, the dimension most likely to govern operational energy demand, was conducted using ENERGY STAR property-type classifications. The only functional category with a sufficiently large subgroup, office buildings (n = 23), likewise exhibited no significant association (r = 0.048, p = 0.826), while the remaining functional categories contained too few certified buildings to support reliable subgroup inference. It should be noted that stratification by LEED rating-system pathway, such as New Construction, Existing Buildings, or Core and Shell, was not feasible, as pathway-level metadata were unavailable for all but one of the certified buildings. The consistent absence of a significant relationship across both version and functional strata indicates that the weak EA–energy association is not an artifact of combining incommensurable rating systems or heterogeneous building functions, although the small size of several subgroups limits statistical power.
The buildings within our analytical sample reflect a cross-section of the LEED program’s evolution, having been certified under versions ranging from v2 and v3 (2009) to the more contemporary v4 and v4.1 standards. In the legacy v2 and v3 systems, the EA category was primarily governed by a prerequisite for minimum energy performance and credits for “Optimizing Energy Performance,” which relied heavily on simulated cost savings relative to ASHRAE 90.1-2004 or 2007 standards. As the framework transitioned to v4 and v4.1, stringency increased by adopting ASHRAE 90.1-2010 and 2016 as baselines, while introducing source energy and greenhouse gas (GHG) emissions as additional evaluation metrics. However, despite these incremental shifts toward more rigorous modeling, these systems still allowed for considerable flexibility, often enabling buildings to achieve certification by focusing on categories outside of energy performance, a trend evidenced by our finding that the buildings in this study achieved an average satisfaction of only 31.53% for EA credits.
The recently introduced LEED v5 rating system, released in April 2025, represents a fundamental pivot intended to address exactly this observed performance gap. Unlike its predecessors, which focused largely on design-phase energy cost predictions, LEED v5 places decarbonization and operational reality at the center of the certification process. A transformative addition is the new prerequisite, Operational Carbon Projection and Decarbonization Plan (EAp1), which mandates that every project team develop and document a 25-year strategy for sustained carbon reduction. Furthermore, v5 raises the performance baseline to ASHRAE 90.1-2019 or 2022, effectively setting a much higher bar for what constitutes “minimum” efficiency. These improvements in the EA category are likely to have a profound impact on the actual energy savings of future LEED-certified buildings in urban environments like Philadelphia. By requiring project teams to register with the Arc platform for real-time performance monitoring, LEED v5 ensures that simulated design metrics must eventually align with actual operational data. This shift away from one-time documentation toward ongoing accountability directly targets the “performance paradox” we identified in our study. Additionally, the new mandate for full electrification and 100% renewable energy offsets for Platinum-level projects reduces the extent to which high-intensity buildings can attain top certification tiers primarily through credits unrelated to operational energy performance. By prioritizing measurable carbon performance as a baseline expectation, LEED v5 may help align certification outcomes more closely with measured operational performance in complex urban building stocks. Whether these provisions will, in practice, close the performance gap identified here remains an open empirical question that can only be resolved once a sufficient number of v5-certified buildings have accumulated multiple years of operational data. The present results should therefore be read as motivating, rather than confirming, the direction of reform embodied in LEED v5.