Article

A Coupled MIKE SHE–MIKE 11 Framework for Simulating Surface–Groundwater Connectivity and Water Quality to Support Sustainable Water Management in the Cau River Basin


by
Tran Tien Dung
1,
Tran Hong Thai
2,
Doan Quang Tri
3,*,
Nguyen Van Hong
4 and
Nguyen Hoang Minh
5
1
Office of the Vietnam Academy of Science and Technology (VAST), Vietnam Academy of Science and Technology, Hanoi 10000, Vietnam
2
Vietnam Academy of Science and Technology, Hanoi 10000, Vietnam
3
Center for Multidisciplinary Monitoring, Institute of Earth Sciences, Vietnam Academy of Science and Technology, Hanoi 10000, Vietnam
4
Sub-Institute of Meteorology, Hydrology, Environment and Marine Sciences, Ho Chi Minh City 70000, Vietnam
5
National Center for Hydro-Meteorological Forcasting, Viet Nam Meteorological and Hydrological Administration, Hanoi 10000, Vietnam
*
Author to whom correspondence should be addressed.
Sustainability 2026, 18(14), 7089; https://doi.org/10.3390/su18147089
Submission received: 4 June 2026 / Revised: 1 July 2026 / Accepted: 8 July 2026 / Published: 10 July 2026
(This article belongs to the Section Sustainable Water Management)

Abstract

The Cau river basin in northern Vietnam is experiencing increasing pressures on water resources due to rapid urbanization, industrial development, agricultural expansion, and inadequate wastewater management. Understanding the interactions between surface water, groundwater, and water quality is essential for developing effective and sustainable water management strategies. This study developed and applied a coupled MIKE SHE–MIKE 11 framework to simulate surface–groundwater connectivity and its influence on water quality dynamics in the Cau river basin. Hydrometeorological and water quality datasets collected during 2023–2024 were used to calibrate and test the integrated model at key monitoring locations, including Cha, Phuc Loc Phuong, and Dap Cau stations. The hydrological component demonstrated satisfactory performance, with Nash–Sutcliffe Efficiency (NSE) values ranging from 0.55 to 0.79 for water level simulations, indicating a reliable representation of surface and subsurface flow processes. Simulated river–aquifer exchange fluxes revealed pronounced spatial variability across the basin. Upstream reaches predominantly functioned as groundwater recharge zones, whereas the middle and downstream sections exhibited dynamic bidirectional exchanges governed by river stage fluctuations, hydraulic gradients, and local hydrogeological conditions. Water quality simulations for BOD5, COD, NH4+, total nitrogen (TN), and total phosphorus (TP) showed good agreement with observations, with calibration and testing errors generally remaining below 25%. Incorporating surface–groundwater interactions improved the representation of pollutant transport, residence time, and nutrient accumulation processes compared with conventional river-only simulations. The results demonstrate that river–aquifer connectivity plays a critical role in regulating both hydrological processes and water quality conditions in the basin. The coupled modeling framework provides a robust scientific basis for identifying critical interaction zones, assessing pollution risks, optimizing monitoring programs, and supporting integrated water resource planning. By explicitly linking hydrological connectivity with water quality dynamics, the proposed framework serves as a practical decision-support tool for sustainable water resource management in the Cau river basin and other river–aquifer systems facing increasing environmental pressures and progressive water quality degradation.

1. Introduction

Elucidating the interactions between surface water and groundwater is a fundamental prerequisite for sustainable water resource management in river basins subject to escalating anthropogenic pressures. These exchanges regulate hydrological processes and control the transport and transformation of pollutants, thereby affecting both surface water quality and groundwater quality. Recent studies have increasingly employed integrated modeling approaches to represent coupled surface–subsurface processes and to quantitatively characterize water exchange and contaminant transport dynamics within river–aquifer systems [1,2,3].
Globally, advanced distributed, physics-based modeling frameworks (e.g., MIKE SHE [4,5], MODFLOW [6,7], MOBIDIC-MODFLOW [8], and HydroGeoSphere (HGS) [9]) have been widely applied to investigate surface–groundwater interactions. These models integrate surface, unsaturated, and saturated flow processes under a unified framework, allowing simultaneous simulation of river–aquifer exchanges and pollutant transport. For example, an integrated MIKE SHE–MIKE 11 modeling system was employed to simulate river–aquifer water exchange, demonstrating that seasonal variations in river stage significantly affect both the direction and magnitude of hydraulic interactions [10,11,12]. Similarly, to investigate nitrate pollution driven by human activities and complex surface water–groundwater interactions, coupled SWAT–MODFLOW–RT3D reactive transport models have been applied at the watershed scale to simulate hydrological exchanges and nitrogen transformation processes, providing insights into spatial and temporal heterogeneity and long-term trajectories of nitrate loads within valley-scale hydrological systems [13]. In Europe, integrated hydrological–hydrodynamic modeling has been employed to quantify water quality changes and nutrient retention in lowland catchments [14,15]. These studies highlight that hydrological connectivity between rivers and floodplains is a key controlling factor governing nutrient fluxes and the self-purification capacity of aquatic systems. In studies conducted across the United States and Canada, SWAT–MODFLOW coupled models have been used to quantify the effects of land-use change and climate forcing on surface–subsurface flow processes and water quality [16,17]. Collectively, these studies demonstrate that integrated modeling frameworks, particularly MIKE SHE–MIKE 11, provide robust tools for simulating coupled hydrological processes, quantifying river–aquifer exchange fluxes, and predicting pollutant transport. Nevertheless, model performance remains highly dependent on the availability and quality of input data, boundary conditions, and calibration datasets, posing significant challenges for applications in data-scarce regions.
Despite these advances, most existing studies have been conducted in data-rich environments and have primarily focused on either hydrodynamic interactions or specific pollutants, with limited consideration of integrated multi-parameter water quality processes under data-limited conditions. Furthermore, few studies have explicitly evaluated the surface–subsurface interactions on pollutant accumulation, transport, and persistence through direct comparisons between coupled and stand-alone modeling approaches.
In Vietnam, hydrological modeling studies have predominantly focused on either surface water hydrodynamics or water quality within individual modeling domains, rather than on fully integrated surface–subsurface systems. Several studies have applied MIKE 11 and coupled 1D–2D modeling approaches to river hydraulic and water quality assessments, including evaluations of pollution load capacity and wastewater assimilation potential [18,19,20]. Meanwhile, the MIKE SHE model has been applied primarily for rainfall-runoff simulations and groundwater recharge estimation in basins such as the Vu Gia–Thu Bon and Sai Gon–Dong Nai basins [21,22].
To date, fully integrated, physically based surface–subsurface modeling frameworks for the concurrent simulation of hydrodynamic processes and multi-parameter water quality remain limited in Vietnam, particularly in contexts characterized by sparse monitoring data and intense anthropogenic pressures.
Research on the Cau river basin has primarily focused on surface water pollution and index-based water quality assessment methods [23]. Previous studies have applied the SWAT and the Streeter–Phelps models to investigate hydrological processes and water quality dynamics within the Cau river basin [24,25]. National assessments by the Ministry of Natural Resources and Environment have reported that severe organic contamination, particularly in downstream reaches, attributed to industrial and domestic wastewater quality and surface water–groundwater interactions, remains scarce [26]. To date, no study has applied a fully integrated MIKE SHE–MIKE 11 framework to simultaneously simulate both hydraulic exchange and pollutant transport between river systems and shallow aquifers in the Cau river basin. This knowledge gap is particularly important because the basin is characterized by high population density, rapid industrialization, and increasing groundwater abstraction, all of which increase the potential for pollutant migration and groundwater degradation. Furthermore, the absence of integrated surface–subsurface modeling limits our understanding of the bidirectional exchange processes controlling pollutant transport pathways and basin-scale water balance, highlighting the need for a coupled modeling approach to support effective water quality management and sustainable resource use. In addition, no quantitative assessment has been conducted to determine how subsurface flow processes influence conventional surface water-based water quality evaluations, potentially leading to an underestimation of pollutant loads and residence times.
Unlike previous studies in Vietnam, which have largely relied on stand-alone hydrological or water quality models, this study develops a fully coupled MIKE SHE–MIKE 11 framework to explicitly simulate river–aquifer interactions and their influence on multi-parameter water quality dynamics in the Cau river basin. The main scientific contributions of this study are threefold: (i) integrating distributed surface and subsurface hydrological processes within a unified high-resolution modeling framework; (ii) quantifying the contribution of groundwater exchange to pollutant transport, accumulation, and persistence through direct comparisons between coupled and stand-alone simulations; and (iii) providing the first basin-scale assessment in Vietnam of lateral pollutant migration within shallow aquifers under conditions of limited monitoring data and intense anthropogenic pressure. By explicitly incorporating surface–subsurface connectivity into water quality assessment, the proposed framework enhances the process-based understanding of coupled hydrological and biogeochemical processes while providing a transferable methodological framework for integrated water resources management in rapidly urbanizing tropical river basins.
This study employs a physically based integrated modeling framework by coupling MIKE SHE and MIKE 11. MIKE 11 simulates one-dimensional river hydraulics and water quality, while MIKE SHE represents distributed surface runoff, unsaturated flow, and groundwater processes. The models are dynamically linked through river–aquifer connection nodes, allowing bidirectional surface–subsurface interactions. The framework includes model calibration using observations from 2023–2024, representation of surface–groundwater exchange driven by hydraulic gradients, simulation of pollutant transport in river and near-surface domains, and comparison of water quality dynamics between coupled and stand-alone model configurations. This comparative modeling framework enables a quantitative evaluation of the influence of surface water–groundwater interactions on hydrological processes and water quality under data-limited conditions.
The objective of this study is to develop and apply a coupled MIKE SHE–MIKE 11 modeling framework to quantify surface water–groundwater interactions and their influence on water quality dynamics in the Cau river basin. Specifically, the study aims to (1) establish, calibrate, and test an integrated MIKE SHE–MIKE 11 model using observed hydrometeorological and water quality data, thereby enabling the simultaneous simulation of surface flow, groundwater dynamics, and pollutant transport; (2) quantify river–aquifer exchange fluxes and characterize the spatial variability of hydraulic connectivity under different hydrological conditions; and (3) evaluate the role of surface–groundwater exchange in controlling the accumulation, migration, and persistence of key water quality parameters (BOD5, COD, NH4+, TN, and TP), with particular emphasis on near-surface aquifer processes, in order to support integrated pollution control strategies and sustainable water resource management.
The findings provide new insights into coupled hydrological–biogeochemical processes and demonstrate the value of integrated surface water–groundwater modeling for supporting river basin management in data-limited developing regions. Furthermore, the proposed framework provides a scientific basis for integrated water resource management in the Cau river basin and supports the development of effective monitoring and pollution control strategies aligned with Vietnam’s environmental protection and water security objectives.

2. Materials and Methods

2.1. Description of the Study Area

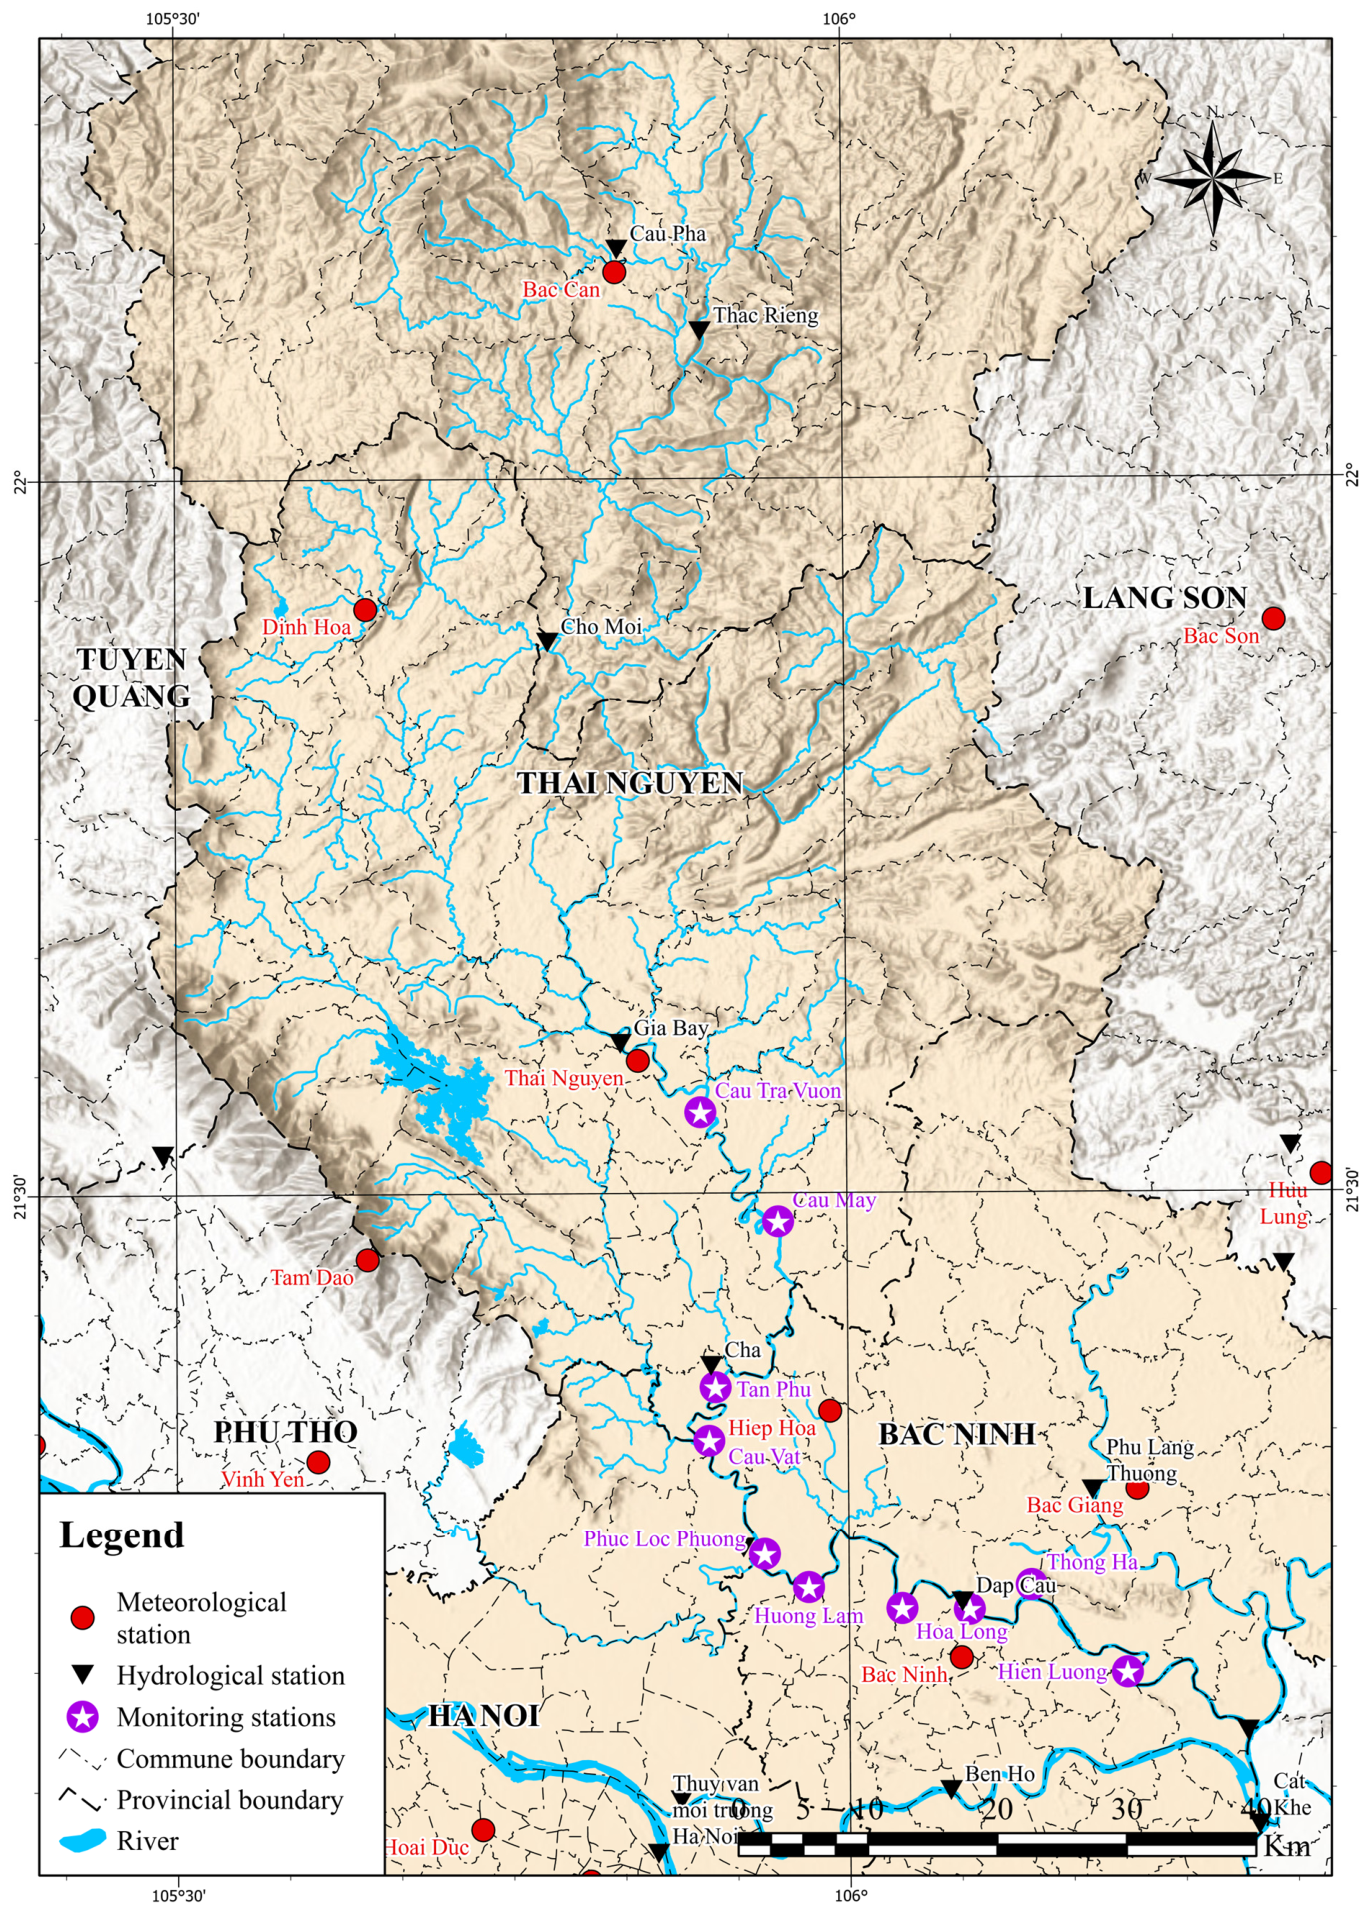
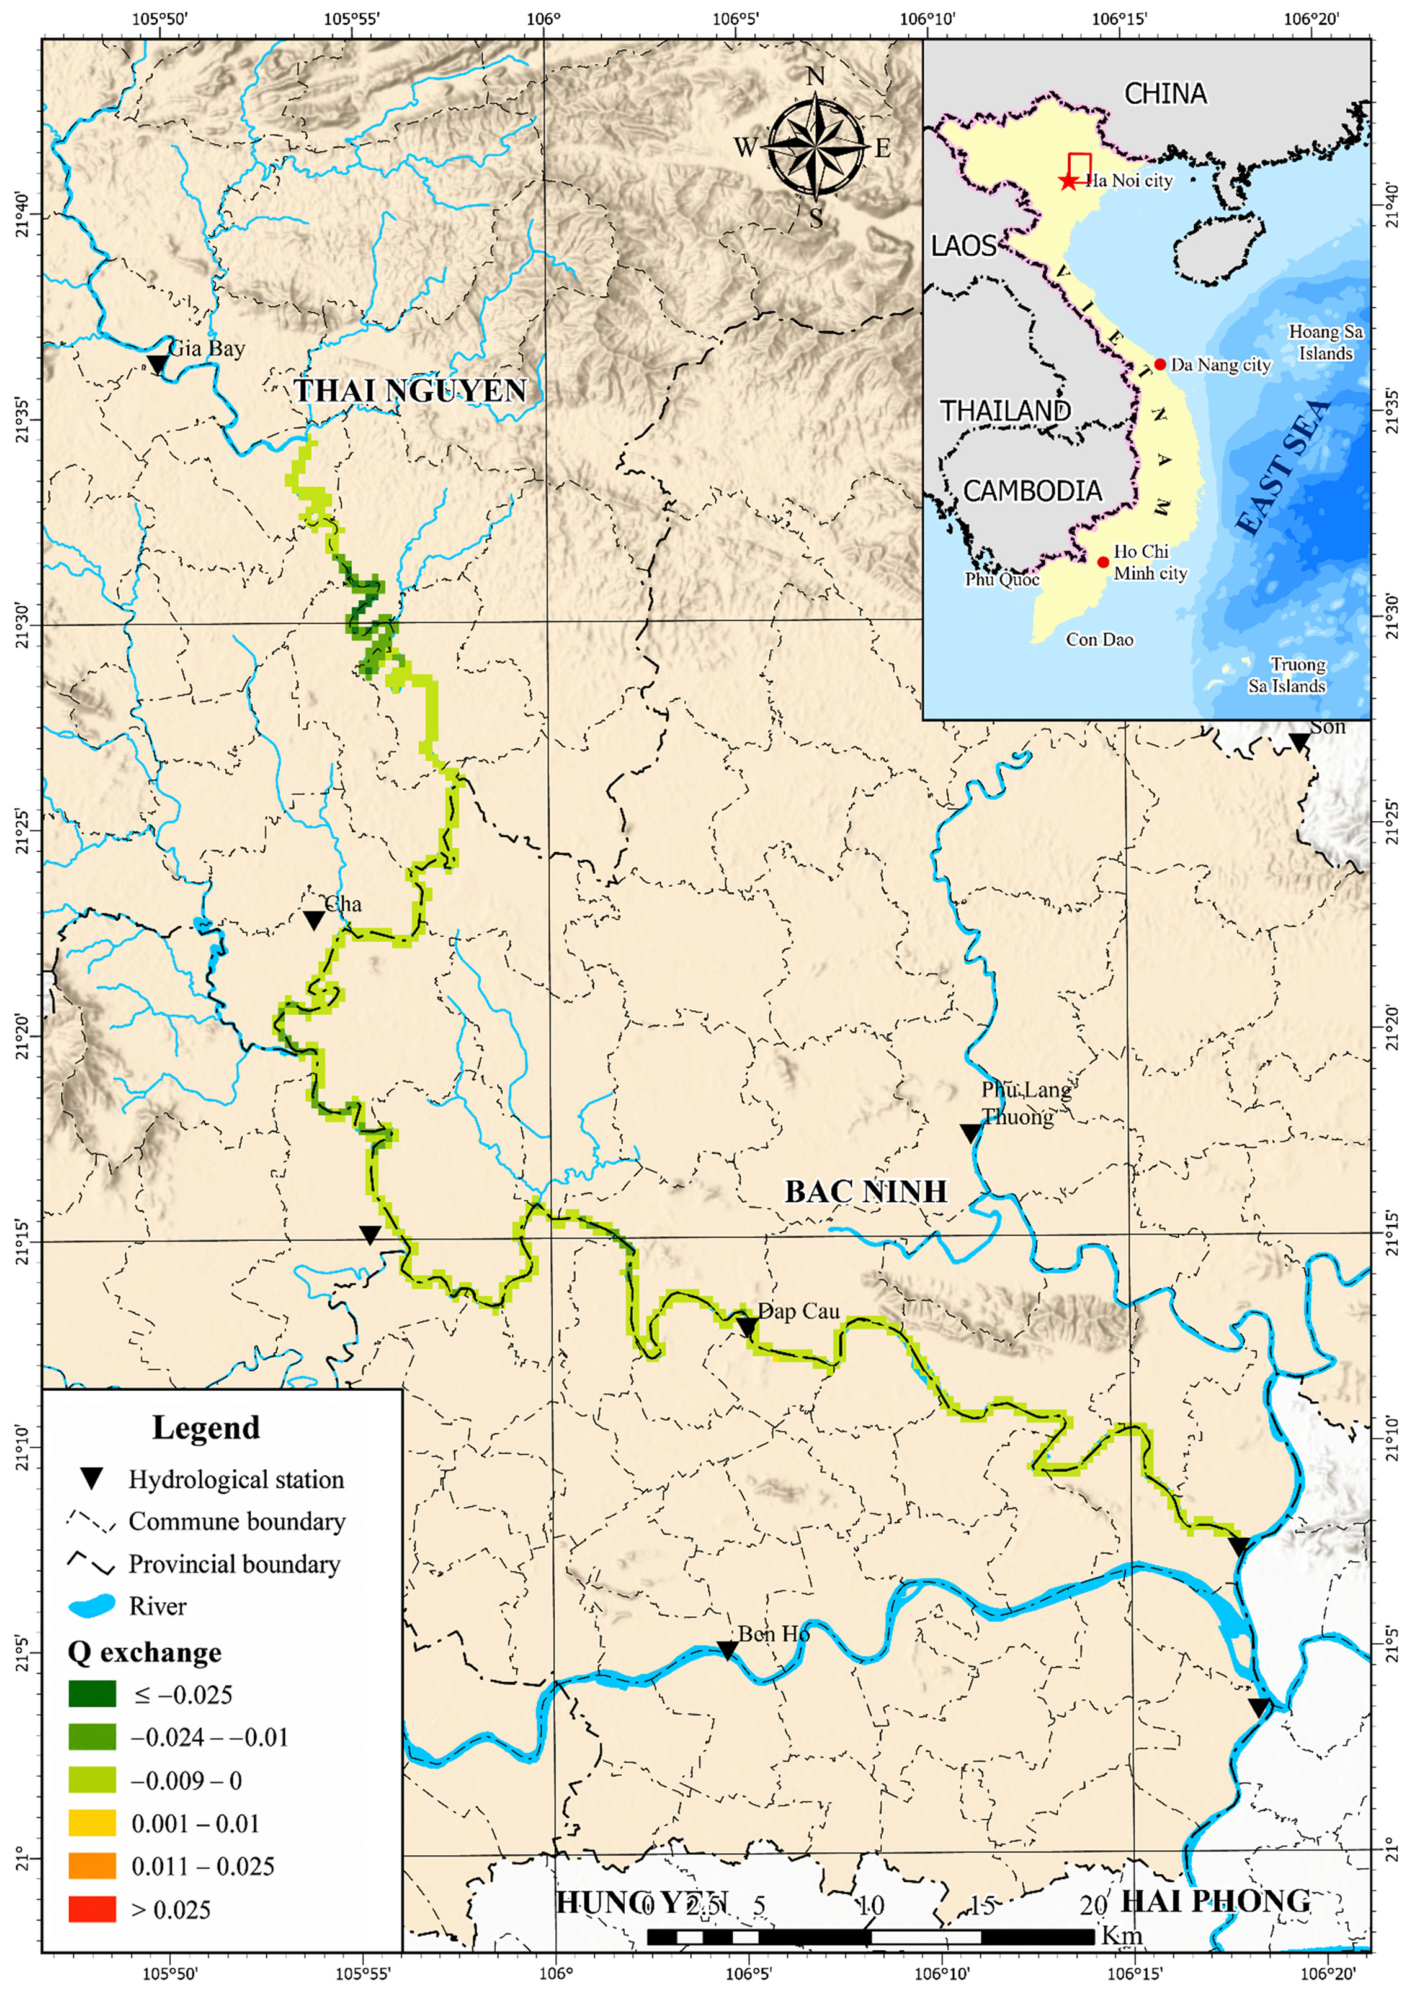
With a drainage area of approximately 6030 km2, the Cau river basin is located in northern Vietnam and is characterized by a main river length of approximately 290 km and a mean elevation of 190 m. This basin lies primarily within Thai Nguyen Province, and extends across Bac Ninh, Phu Tho, Hai Phong, and Hanoi (20°07′–22°18′ N, 105°28′–106°08′ E; Figure 1). From a geomorphological perspective, it is conventionally divided into upper, middle, and lower reaches and includes major tributaries such as the Chu, Nghinh Tuong, Du, Cong, Ca Lo, and Ngu Huyen Khe rivers.
The basin experiences a humid tropical monsoon climate, with a distinct wet season (May–October) accounting for approximately 75–85% of the annual precipitation, and a dry season (November–April) characterized by substantially lower river discharge. Mean annual precipitation ranges from 1300 to 1700 mm, exceeding 2400 mm in mountainous regions such as Tam Dao owing to orographic effects. River discharge exhibits pronounced seasonal variability, with high flows during the monsoon season and prolonged low-flow conditions during the dry season, thereby promoting pollutant accumulation and reducing the river’s dilution capacity. Groundwater occurs primarily within shallow unconfined alluvial and weathered aquifers that are hydraulically connected to the river system and play an important role in sustaining baseflow during dry periods.
The basin is also subjected to substantial anthropogenic pressures. Annual evaporation exceeds 900 mm, while rapid urbanization and industrial development have resulted in approximately 4000 identified pollution sources. These sources are primarily associated with industrial facilities, craft villages, hospitals, and business activities, with industrial and craft village wastewater accounting for more than 90% of total pollutant discharge, particularly concentrated in Thai Nguyen and Bac Ninh provinces.
Water quality varies spatially along the river and has deteriorated markedly in the middle and lower reaches since 2008, while upper reaches remain relatively less impacted [27]. According to monitoring data collected in March 2024, pH and total suspended solids (TSS) generally satisfied the Class A limits specified in QCVN 08:2023/BTNMT, whereas more than 60% of monitoring sites exhibited moderate-to-good water quality for dissolved oxygen (DO), chemical oxygen demand (COD), biochemical oxygen demand (BOD5), and TP. In contrast, TN was consistently classified as Class D, indicating poor water quality throughout the basin. A pronounced longitudinal gradient was observed, with relatively good water quality in the upstream reaches (Bac Kan–Thai Nguyen) and substantial deterioration downstream from Gia Bay Bridge to Bac Ninh, where elevated COD, BOD5, TP, and TN concentrations were primarily associated with polluted tributary inflows and untreated wastewater discharges [28]. Overall, persistent pollution pressures underscore the urgent need for enhanced monitoring and effective wastewater management strategies in the Cau river basin. In addition, the locations of hydrometeorological and water quality monitoring stations used for model calibration and testing (e.g., Cha, Phuc Loc Phuong, and Dap Cau) are presented in Figure 1, providing essential spatial context for the modeling framework and facilitating the interpretation of simulation results.

2.2. Establishing the MIKE 11 and MIKE SHE Models

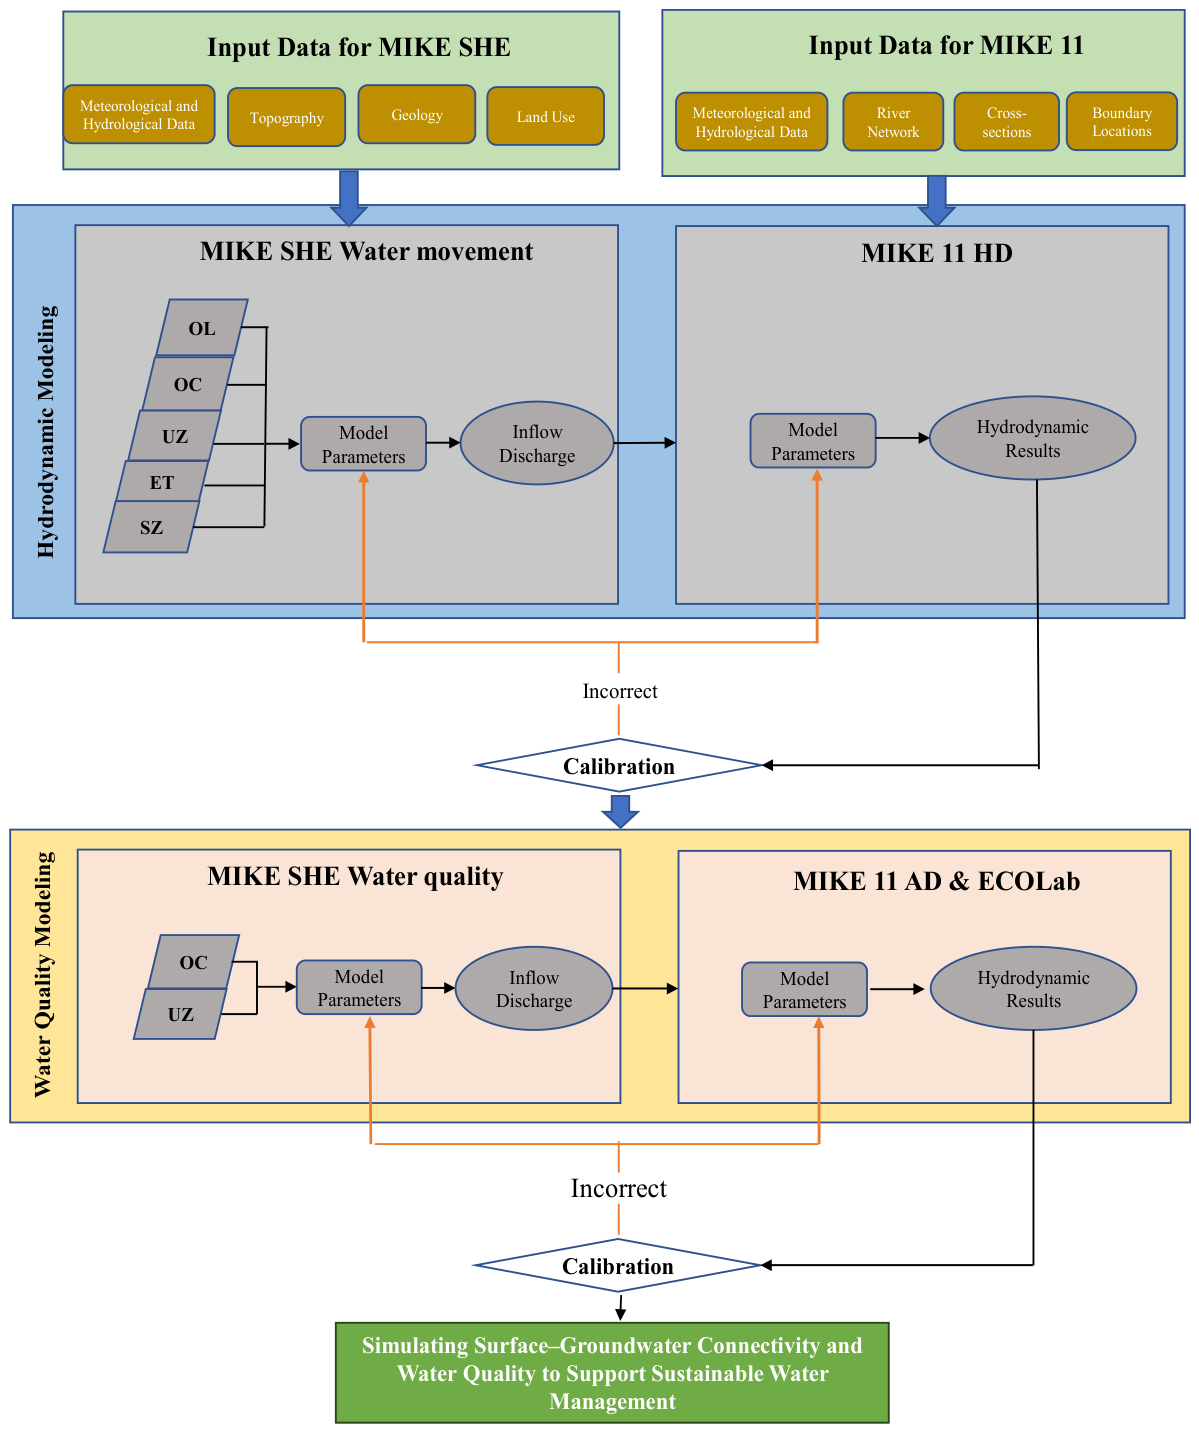
The modeling framework consisted of three integrated components: MIKE 11, ECOLab, and MIKE SHE. MIKE 11 was used to simulate river hydraulics and streamflow in the Cau river network. ECOLab was coupled with MIKE 11 to simulate the transport and transformation of water quality constituents under varying hydrodynamic conditions. MIKE SHE was dynamically linked with MIKE 11 to represent groundwater flow and groundwater–surface water interactions. The coupled MIKE SHE–MIKE 11 system enabled a bidirectional exchange of water between aquifers and river channels through river leakage and baseflow processes. Simulated groundwater fluxes from MIKE SHE were transferred to the river network in MIKE 11, while river stages calculated by MIKE 11 served as boundary conditions for groundwater–surface water exchange calculations. Water quality simulations were subsequently performed using ECOLab based on the hydrodynamic outputs from the coupled MIKE SHE–MIKE 11 framework (Figure 2).
Figure 2 illustrates the coupling structure and information exchange among MIKE SHE, MIKE 11, and ECOLab. The coupling procedure consists of three major steps. First, meteorological inputs, land surface characteristics, and hydrogeological parameters are processed within MIKE SHE to simulate groundwater recharge, groundwater storage, and subsurface flow. Second, river stages and streamflow are simulated in MIKE 11 and exchanged with MIKE SHE to calculate groundwater–surface water interactions, including baseflow contributions and river leakage. Third, hydrodynamic outputs from MIKE 11 are transferred to ECOLab, where pollutant transport and transformation processes are simulated. The resulting pollutant concentrations are subsequently linked to groundwater–surface water exchange processes, allowing the assessment of contaminant transfer between aquifers and river channels.

2.2.1. Establishment of the MIKE 11 Model

MIKE 11 was employed as the hydrodynamic engine of the modeling framework to simulate water levels, streamflow, and flow routing throughout the Cau river network. The model solves the one-dimensional Saint-Venant equations and provides the hydraulic conditions required for both groundwater–surface water exchange calculations and water quality simulations. The simulated river stages and discharges serve as dynamic boundary conditions for the coupled groundwater model and as transport drivers for pollutant movement within the river system.
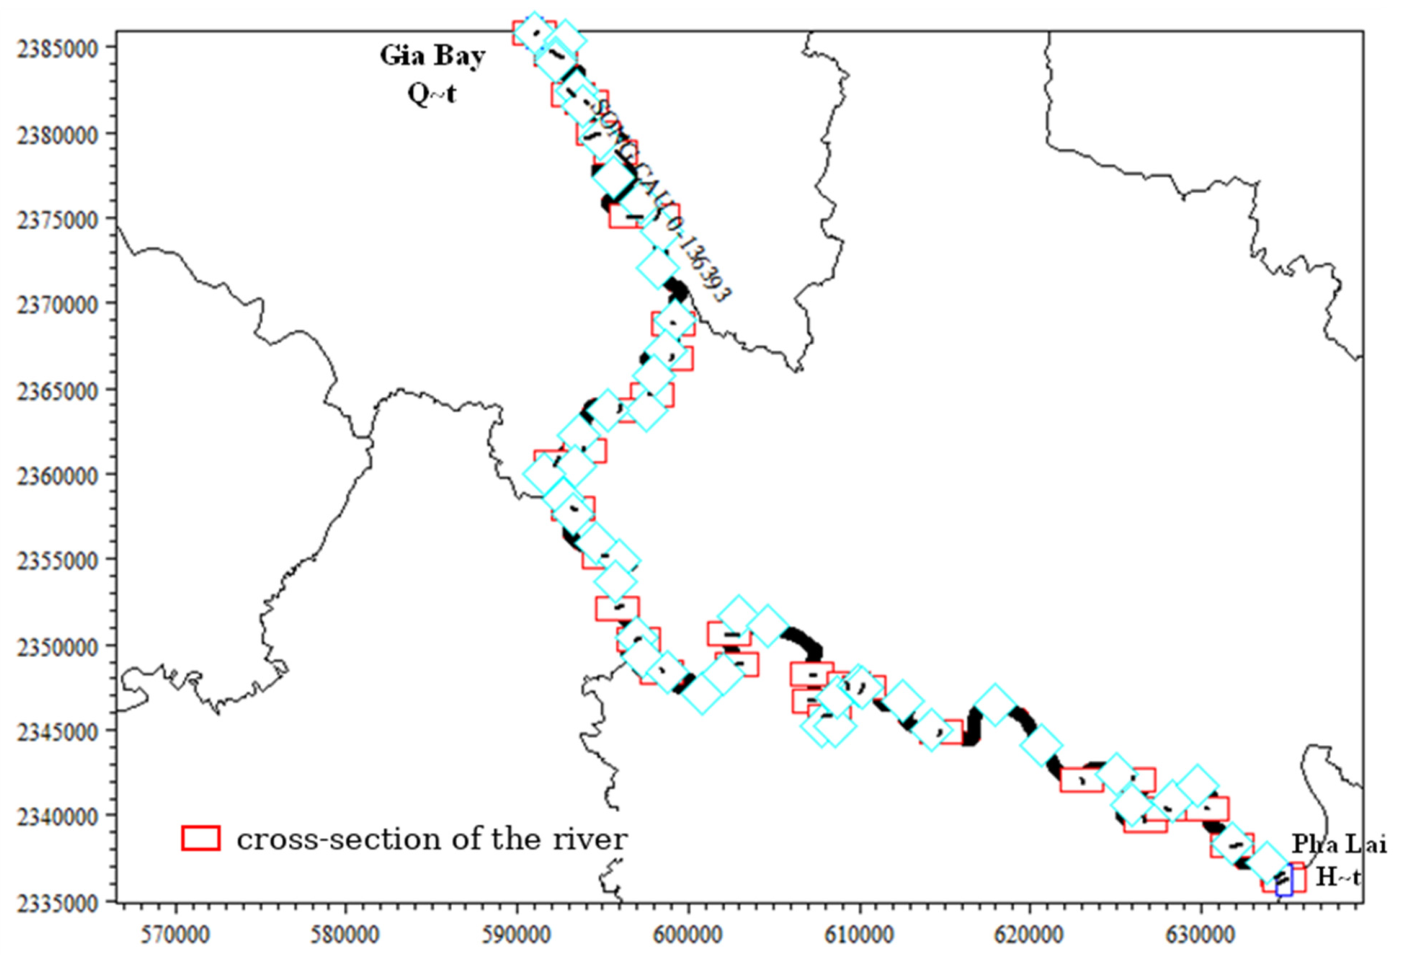
Hydrodynamic simulations using MIKE 11 (HD) were conducted for the Cau river reach bounded by the Gia Bay and Pha Lai hydrological stations. All tributaries joining the main stream were represented as point sources or distributed sources (Figure 3). Input data included 49 river cross-sections; upstream boundary discharge at the Gia Bay station; downstream boundary water level at the Pha Lai station; intermediate inflows obtained from MIKE SHE simulations; and direct discharge from local sources within the study area.
MIKE 11 ECOLab was employed as the water quality simulation module within the modeling framework. The model is based on a process-oriented approach in which water quality constituents are represented by a system of coupled differential equations describing transport, transformation, and biogeochemical reactions. In this study, the ECOLab setup included key state variables related to organic matter, dissolved oxygen (DO), biochemical oxygen demand (BOD), COD, NH4+, TN, and TP. The governing processes represented in the model included advection, dispersion, reaeration, nitrification, denitrification, organic matter decomposition, sediment oxygen demand, and pollutant exchange between surface water and groundwater.
Model parameterization was performed using literature-based values and subsequently refined through calibration against observed water quality data collected at monitoring stations within the Cau river basin. Key calibrated parameters included the first-order decay coefficients for organic matter degradation, nitrification and denitrification rates, reaeration coefficients, sediment oxygen demand rates, and longitudinal dispersion coefficients. Parameter values were iteratively adjusted to minimize discrepancies between simulated and observed concentrations of DO, BOD, COD, NH4+, TN, and TP, and other target variables during the calibration period. The final parameter set was then validated using an independent dataset to ensure model robustness and predictive capability.
Hydrological data from the Dap Cau station were used for model calibration and testing, with the Cha and Dap Cau stations serving as primary reference locations. The calibration period covered the monitoring data from January to May 2021, while the testing period was set from January to May 2022. Model parameters were calibrated using a trial-and-error procedure to identify an optimal parameter set for the MIKE 11 HD module. The Manning’s roughness coefficients were generally around 0.032 for the upstream and midstream sections, while lower values (~0.019) were assigned to many downstream segments, with some transitional reaches near the river mouth having intermediate values (~0.020). These spatial variations reflect heterogeneity in channel geometry and riverbed conditions across the basin. The calibration results indicate that the model reproduces the observed water level and discharge dynamics with satisfactory accuracy at the testing stations, thereby providing a reliable basis for subsequent hydraulic and water quality simulations.

2.2.2. Establishment of the MIKE SHE Model

Once the MIKE 11 HD and ECOLab models had been calibrated and validated, MIKE SHE was implemented at the basin scale to simulate integrated hydrological and water quality processes, with dynamic data exchange mechanisms linking it to MIKE 11 to represent surface water–groundwater–river interactions.
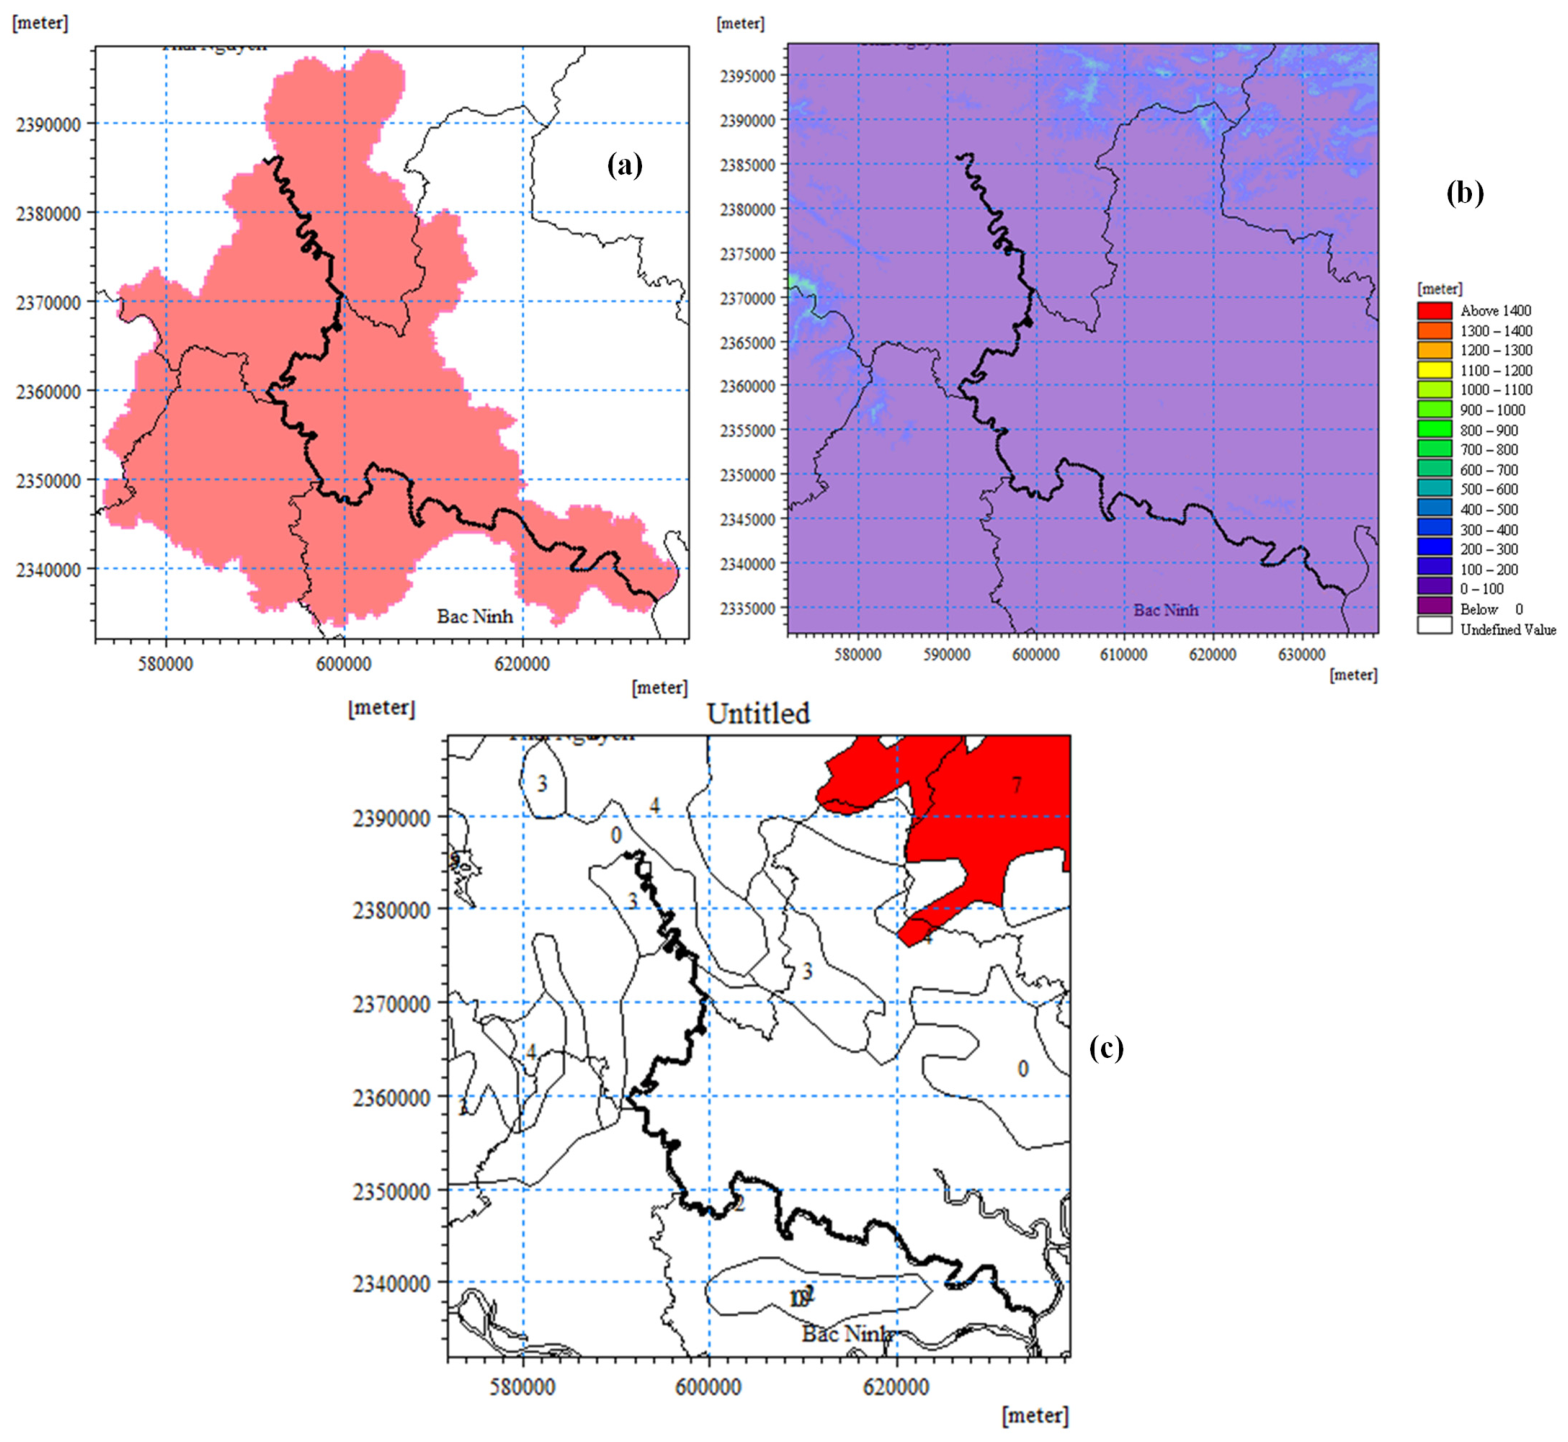
Model domain and grid structure: The modeling domain corresponded to the Cau river basin extent, bounded by 21°07′–21°58′ N and 105°38′–106°17′ E, and was represented using a WGS 84-based grid with a spatial resolution of 30 m, resulting in 222 × 222 computational cells in both horizontal directions. All raster datasets were reclassified, and vector datasets were converted into *.dfs2 format to ensure data consistency and compatibility within the modeling framework (Figure 4a,b).
Initial simulation configuration: The simulation period covered 1 January 2023 to 31 December 2024. Process-specific time steps were selected to ensure numerical stability and simulation accuracy, including an initial time step of 1 h, an overland flow (OL) time step of 1 h, an unsaturated-zone (UZ) time step of 1 h, and a saturated-zone (SZ) time step of 3 h. These settings were adopted to improve numerical convergence while maintaining computational efficiency.
Land use and land cover parameterization: This study area is predominantly characterized by paddy fields, annual cropland, rural residential land, non-agricultural land, river and water surfaces, and aquaculture areas (Figure 4c). Physically based hydrological parameters were assigned to each land-use class based on Kelliher et al. (1993) [29] and DHI (2014) [30], including the Leaf Area Index (LAI), root depth (RD), crop coefficient (Kc), and Manning’s roughness coefficient (M ≈ 20). Parameter values were defined within representative ranges for each land-use type, with LAI varying from 0 for water surfaces to 6 for perennial vegetation, root depth ranging from 100 to 800 mm, and Kc values spanning 0.4 to 1.2 (Table 1).
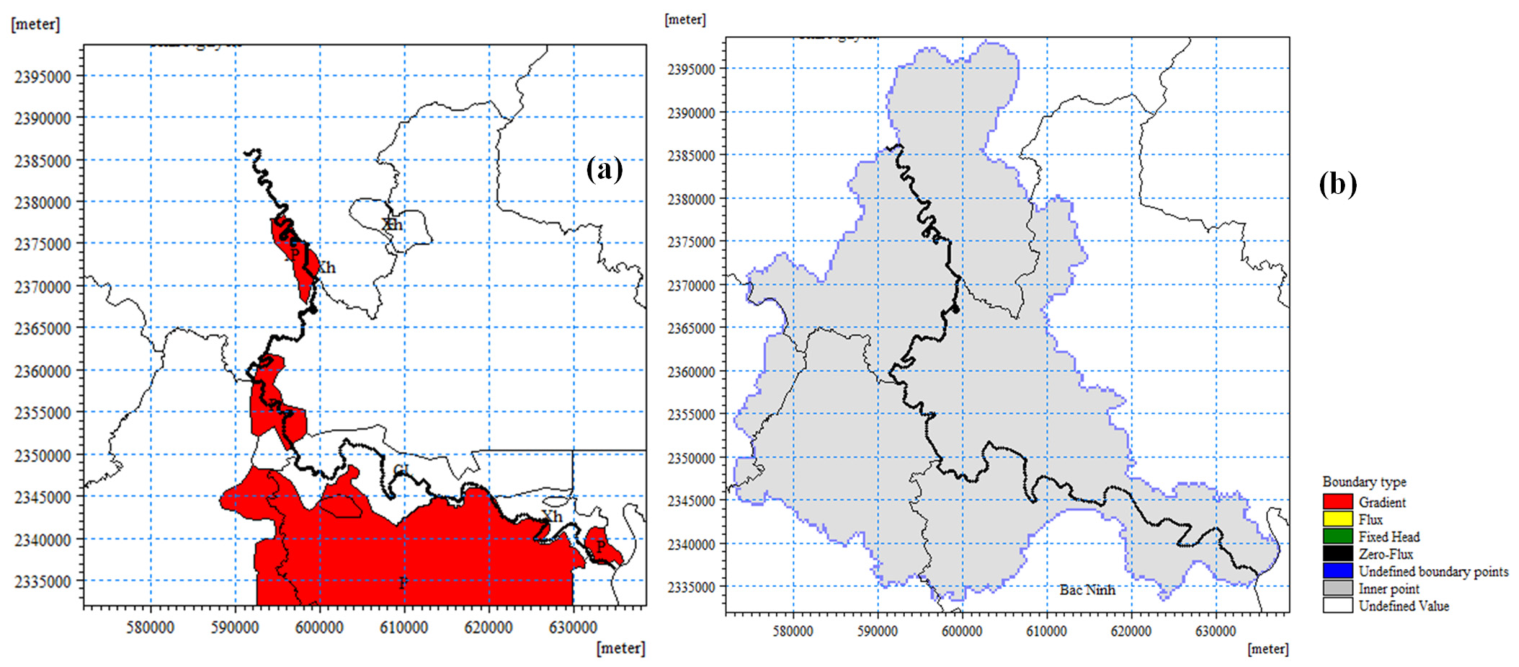
Soil data parameterization: Soil composition across the basin was derived from provincial soil maps of Thai Nguyen, Bac Ninh, and Hanoi provinces. The Thai Nguyen region is predominantly characterized by red-yellow soils, yellow-brown soils, and alluvial soils; Bac Ninh is dominated by alluvial soils, gray ferralitic soils, gley soils, and degraded gray soils; the areas adjacent to Hanoi include sandy soils, marsh soils, colluvial soils, and red-yellow soils. These soil classes were spatially integrated into the unsaturated-zone (UZ) and saturated-zone (SZ) modules of MIKE SHE, enabling the representation of spatial heterogeneity in soil hydraulic properties, including infiltration capacity and subsurface water storage. This parameterization provides a physically consistent basis for simulating vertical water fluxes, groundwater recharge, and surface–subsurface exchange processes across the basin (Figure 5).

2.2.3. Model Coupling Between MIKE SHE and MIKE 11

MIKE SHE and MIKE 11 are integral components of DHI’s MIKE ZERO framework and provide physically based representations of complementary hydrological processes operating across different spatial domains. MIKE 11 simulates one-dimensional unsteady flow in river channels [31], whereas MIKE SHE represents distributed catchment processes, including overland flow, vadose zone flow, and saturated groundwater dynamics [30]. A fully dynamic two-way coupling scheme was implemented to explicitly simulate water exchange between the river network and the surrounding land surface and groundwater systems.
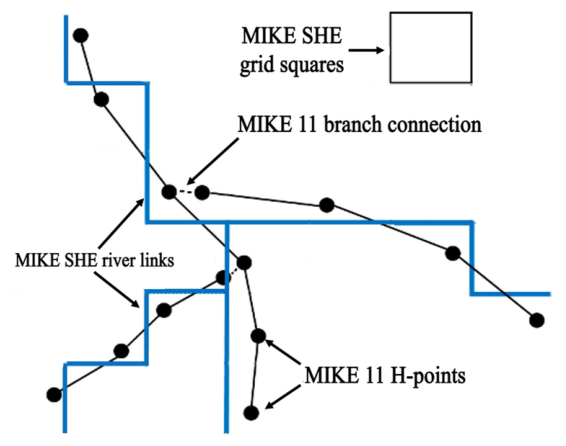
The interaction between the two models is established through river links and hydraulic exchange nodes (H-points), which facilitate the integration of the MIKE 11 river network into the MIKE SHE computational grid. Hydraulic exchange occurs exclusively at these H-points and includes riverbed leakage, lateral inflow from overland flow, and, during high-flow conditions, exchange with inundated floodplain areas. The spatial resolution of the MIKE SHE grid is critical for ensuring coupling accuracy. Therefore, a fine grid resolution of approximately 30 m was adopted to minimize geometric distortion and enhance the representation of hydraulic gradients and surface–subsurface exchange processes at the basin scale (Figure 6).
To represent the integrated groundwater–surface water system, MIKE SHE was dynamically coupled with MIKE 11 through the standard MIKE SHE–MIKE 11 linkage. The coupled framework enables two-way interactions between aquifers and river channels by simultaneously solving groundwater flow and river hydraulics. River water levels simulated by MIKE 11 are transferred to MIKE SHE and used to calculate hydraulic gradients between surface water and groundwater systems. Conversely, groundwater discharge and river leakage calculated by MIKE SHE are exchanged with MIKE 11 at each simulation time step, ensuring a consistent representation of water fluxes across the groundwater–surface water interface.
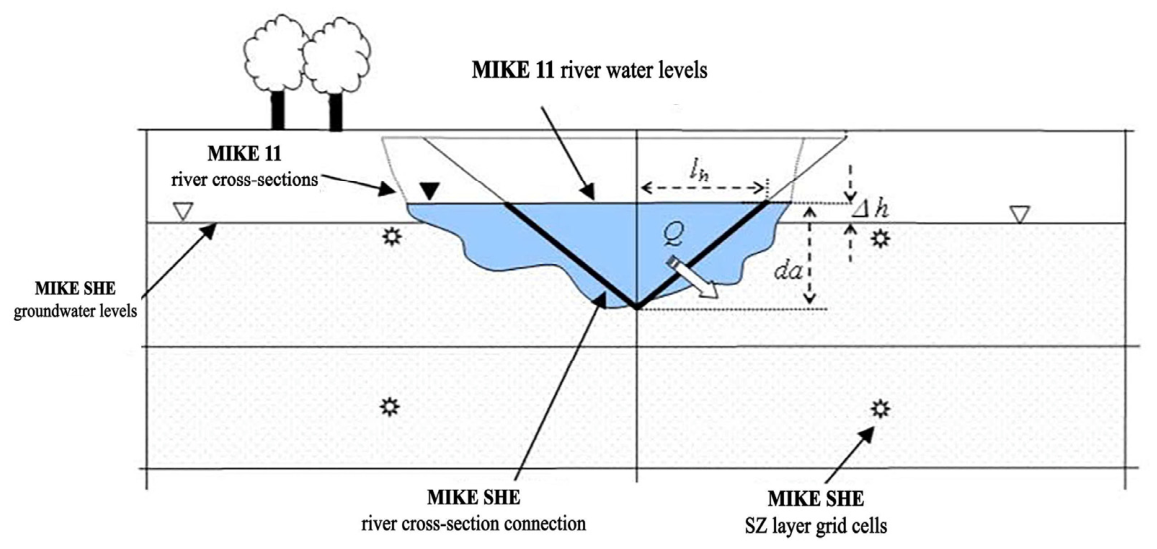
Regarding the exchange with the saturated zone, MIKE SHE simulates seepage through the riverbed based on Darcy’s law, expressed as
Q = Kleak × A × (hs − hg)
where Q is the seepage flow rate (m3/s), Kleak is the user-defined riverbed leakage coefficient (m/s), A is the riverbed contact area (m2), and hs and hg are the river water level and groundwater level at the grid cell (m), respectively.
The exchange flux represented by this formulation is controlled by the leakage coefficient, the effective river–aquifer contact area, and the hydraulic head gradient between the river and groundwater, as dynamically simulated by MIKE 11 and MIKE SHE. Flow is directed from the river to the aquifer when river stage exceeds the groundwater head and is reversed when the groundwater head exceeds the river stage (Figure 7).
Once the coupling structure between MIKE 11 and MIKE SHE has been fully established, the integrated modeling system enables synchronized data exchange at each computational time step, ensuring consistency in water levels, discharges, and seepage fluxes across the two modules. This dynamic linkage provides a robust foundation for hydrodynamic simulations, basin-scale water balance assessment, and subsequent water quality modeling.
The integration of ECOLab with the coupled MIKE SHE–MIKE 11 framework enabled the assessment of water quality impacts associated with groundwater–surface water interactions. Groundwater discharge, recharge, and river leakage fluxes simulated by MIKE SHE influenced the hydrodynamic conditions calculated by MIKE 11 and consequently affected pollutant transport processes simulated in ECOLab. This coupling allowed the model to represent the exchange of dissolved pollutants between groundwater and surface water systems and to evaluate their influence on river water quality under varying hydrological conditions.

2.2.4. Evaluation of Model Calibration and Testing Results

Model calibration and testing were conducted to identify parameter sets that adequately represent the hydrological and hydraulic characteristics of the study area. Model performance was evaluated through comparisons between simulated and observed hydrographs, where closer agreement indicates improved model reliability. The Nash–Sutcliffe Efficiency (NSE) and correlation coefficient (R) were adopted as primary quantitative metrics to assess the performance of the MIKE 11 HD module. NSE was calculated as follows:
N a s h = 1 i = 1 n X i t t X i t d 2 i = 1 n X i t d X t d ¯ 2
where Xtti is the simulated value at time i, Xtdi is the observed value at time i, and Xtbtd is the mean of the observed values. An NSE value close to 1 indicates strong agreement between simulated and observed data, whereas values approaching or below zero indicate limited model predictive capability. Typically, an NSE value above 0.8 indicates good model performance.
The correlation coefficient (R) is calculated as follows:
R 2 = x x ¯ y y ¯ x x ¯ 2 y y ¯ 2
where x and y are the values of the two data series being compared, and x ¯ and ȳ are their respective mean values.
Model calibration was conducted through a combination of manual adjustment and iterative refinement, with emphasis on key hydrological and hydraulic parameters governing surface–subsurface interactions. For MIKE SHE, the most sensitive parameters included saturated hydraulic conductivity, specific yield, and soil water retention properties of the unsaturated zone. For MIKE 11, calibration primarily involved channel roughness coefficients (Manning’s n), boundary conditions, and hydraulic structure parameters. Initial parameter ranges were defined based on the published literature and regional hydrogeological characteristics, and were then further refined against observed water level data collected at the Cha, Phuc Loc Phuong, and Dap Cau stations. The calibration process aimed to minimize discrepancies between simulated and observed water levels using performance metrics such as the NSE and R. Following calibration, the model was validated against an independent dataset to verify its robustness in reproducing the temporal dynamics of water levels under different hydrological conditions.

2.3. Data Collection

-
Calibration and testing of the integrated MIKE SHE–MIKE 11 framework were performed using hydrometeorological observations covering January 2023 to December 2024. The dataset was divided into two subsets, with the 2023 data used for model calibration and the 2024 data reserved for independent testing.
-
Meteorological forcing data consisted of daily rainfall, evaporation, and air temperature measurements. Precipitation was obtained from six meteorological stations located within and around the Cau river basin (Bac Giang, Bac Ninh, Hiep Hoa, Huu Lung, Tam Dao, and Thai Nguyen), providing adequate spatial coverage of precipitation variability. Corresponding evaporation and temperature observations from these stations were used to parameterize evapotranspiration processes in the MIKE SHE model.
-
Hydrological boundary and calibration data consisted of river discharge and water level observations from selected stations along the Cau river. Discharge data at Gia Bay station were specified as the upstream boundary condition for MIKE 11, while water level observations at Cha, Dap Cau, and Phu Lang Thuong stations were used for the calibration and testing of the coupled MIKE 11–MIKE SHE system and for performance evaluation.
-
All hydrometeorological inputs were obtained from the Viet Nam Meteorological and Hydrological Administration (VNMHA) and underwent consistency checks and quality-control procedures to ensure their reliability for subsequent hydrological and hydraulic simulation.
-
Pollutant loads were estimated using an integrated approach combining monitoring data, reported discharge information, and the spatial distribution of pollution sources across the basin. Point-source loads, including those from industrial zones, hospitals, and craft villages, were estimated based on available discharge volumes and measured pollutant concentrations derived from environmental monitoring reports provided by the Northern Environmental Monitoring Center. These loads were incorporated into the MIKE 11 model as lateral inflows or discrete point inputs at corresponding river reaches.
-
Non-point-source inputs were estimated indirectly using land use-based loading coefficients combined with surface runoff processes simulated by the MIKE SHE model. Representative pollutant generation rates were assigned to different land-use categories, including agricultural land, residential areas, and aquaculture zones, based on the published literature and regional environmental characteristics. These diffuse-source loads were dynamically linked to rainfall runoff processes, allowing temporal variations in pollutant transport to be represented under both wet- and dry-season conditions.
-
Initial pollutant concentrations within the river network were defined from observed water quality data at monitoring stations, while upstream boundary conditions were specified based on measured concentrations. During calibration, external loading estimates and key transformation parameters within the ECOLab module were iteratively adjusted to minimize discrepancies between simulated and observed concentrations of BOD5, COD, NH4+, TN, and TP. This calibration strategy ensures a consistent representation of both external pollutant inputs and in-stream biogeochemical processes throughout the modeling framework.
-
Water quality monitoring data, focusing on organic matter and nutrient parameters representative of the dominant pollution conditions in the Cau river basin, were used to calibrate and validate the MIKE 11 ECOLab and MIKE SHE water quality modules. The datasets were provided by the Northern Environmental Monitoring Center of the Department of Pollution Control, Ministry of Natural Resources and Environment (MoNRE), currently reorganized as the Ministry of Agriculture and Environment, Vietnam.
-
In 2024, two intensive monitoring campaigns (20 March–3 April and 8–23 April) were conducted to capture representative dry-season conditions, during which pollutant accumulation and surface–subsurface exchange processes are most pronounced. Water quality samples were collected from ten sites along the Cau river main stem, covering upstream to downstream sections and encompassing major tributary confluences as well as urban and industrial zones.
-
The monitored parameters included BOD5, COD, NH4+, TN, and TP, representing key indicators of organic pollution and nutrient enrichment that correspond directly to state variables within the MIKE 11 ECOLab framework. All sampling and laboratory analyses were performed in accordance with Vietnamese national standards and established QA/QC procedures to ensure data consistency and reliability.
-
For calibration and testing, the 2024 dataset was divided according to the two monitoring campaigns. Simulated concentrations were systematically compared with observations at individual stations, and key ECOLab parameters governing biogeochemical transformation processes were iteratively adjusted. The resulting optimized parameter set was considered representative of prevailing water quality conditions and provides a robust basin for subsequent scenario analysis and management-oriented application in the Cau river basin.
It should be noted that the hydrometeorological and water quality datasets used in this study cover the period 2023–2024 due to data availability constraints. Although this record length is shorter than the ideal multi-decadal datasets typically recommended for long-term simulation and climate variability assessment, the available data still include representative hydrological conditions, including both high-flow (wet season) and low-flow (dry season) periods.
Despite the relatively short observation period, the coupled modeling framework was able to successfully reproduce the observed dynamics of groundwater–surface water interactions and associated water quality variations. The results indicate that the model captures the key physical and biogeochemical processes governing pollutant transport and exchange between surface water and groundwater systems.
While a longer dataset (e.g., ≥10 years) would further improve model robustness for long-term prediction and climatic variability assessment, the present study demonstrates that even a two-year dataset can provide meaningful insights into system behavior and effectively support the evaluation of model structure, coupling mechanisms, and process representation in the Cau river basin.

3. Results

3.1. Results of Calibration and Testing MIKE 11 and MIKE SHE Models

3.1.1. Results of MIKE 11 Model Calibration and Testing

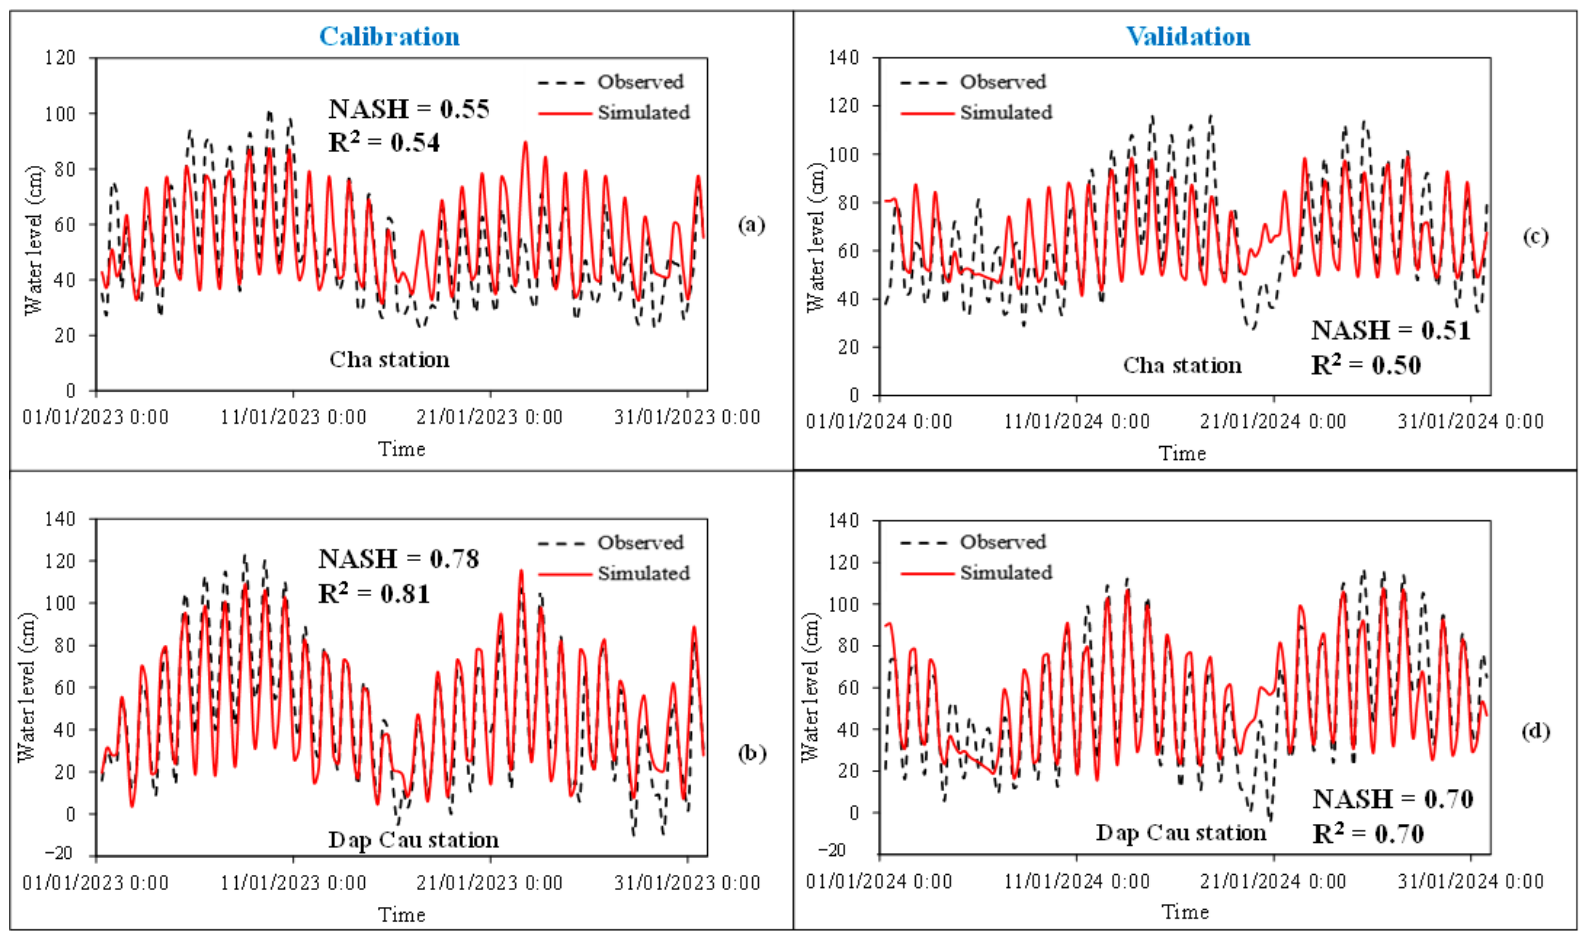
Calibration and testing of the MIKE 11 HD model at the Cha and Dap Cau stations over the 2023–2024 period (Figure 8a–d) demonstrated strong agreement between simulated and observed water level hydrographs, indicating that the model reliably reproduces the hydrodynamic characteristics of the studied river reach. During the 2023 calibration period, simulated water levels closely matched the observed temporal dynamics, with higher predictive performance at the Dap Cau station. Minor discrepancies were primarily observed during peak flows and recession periods; however, these deviations did not significantly influence the overall model performance.
Model performance was assessed using the Nash–Sutcliffe Efficiency (NSE), which yielded values of 0.55 and 0.51 at the Cha station for the calibration and testing periods, respectively, and higher values of 0.78 and 0.70 at Dap Cau. The slight reduction in NSE during testing reflects interannual hydrological variability while remaining within the generally accepted ranges for satisfactory model performance. Overall, NSE values ranging from 0.51 to 0.78 indicate that the calibrated model parameters were transferable across different hydrological conditions. These results demonstrate that the MIKE 11 HD model provides a reliable hydrodynamic basis for coupling with the advection–dispersion and ECOLab modules, thereby enabling a reliable simulation of pollutant transport and water quality dynamics in the Cau river basin.
The testing results indicate different levels of model performance among the monitoring stations. At Cha station, the model achieved NSE and R2 values of 0.51 and 0.50, respectively, while higher performance was obtained at Dap Cau station (NSE = 0.70 and R2 = 0.70). The lower performance at Cha station may be attributed to local hydraulic complexities, uncertainties in boundary conditions, and limitations in the available hydrometeorological observations used for model calibration and testing.
Nevertheless, the NSE values exceeded the commonly accepted threshold of 0.50 for satisfactory hydrological simulations, suggesting that the model adequately reproduces the overall temporal dynamics of water levels in the river system. The model therefore provides a reasonable basis for investigating groundwater–surface water exchange processes and their influence on water quality conditions at the basin scale.
The performance of the MIKE 11 HD model was evaluated using the Nash–Sutcliffe Efficiency (NSE) and the correlation coefficient (R) based on comparisons between simulated and observed time series at the Cha and Dap Cau hydrological stations. The calibration and testing results demonstrate that the adopted parameterization effectively captures the hydrodynamic processes of the river system, with NSE values ranging from 0.51 to 0.78. At the Dap Cau station, the model achieved NSE values of 0.78 during the calibration period and 0.70 during testing period, indicating good agreement between simulated and observed water levels. The slight reduction in NSE during testing reflects interannual hydrological variability but remains within the generally accepted range for satisfactory model performance, confirming the stability and transferability of the calibrated parameter set. Overall, the MIKE 11 HD model exhibits satisfactory accuracy and predictive capability to support subsequent applications, providing a reliable hydrodynamic basis for coupling with the advection–dispersion and ECOLab modules to simulate pollutant transport and evaluate water quality dynamics in the Cau river basin.

3.1.2. Results of MIKE SHE Model Calibration and Testing

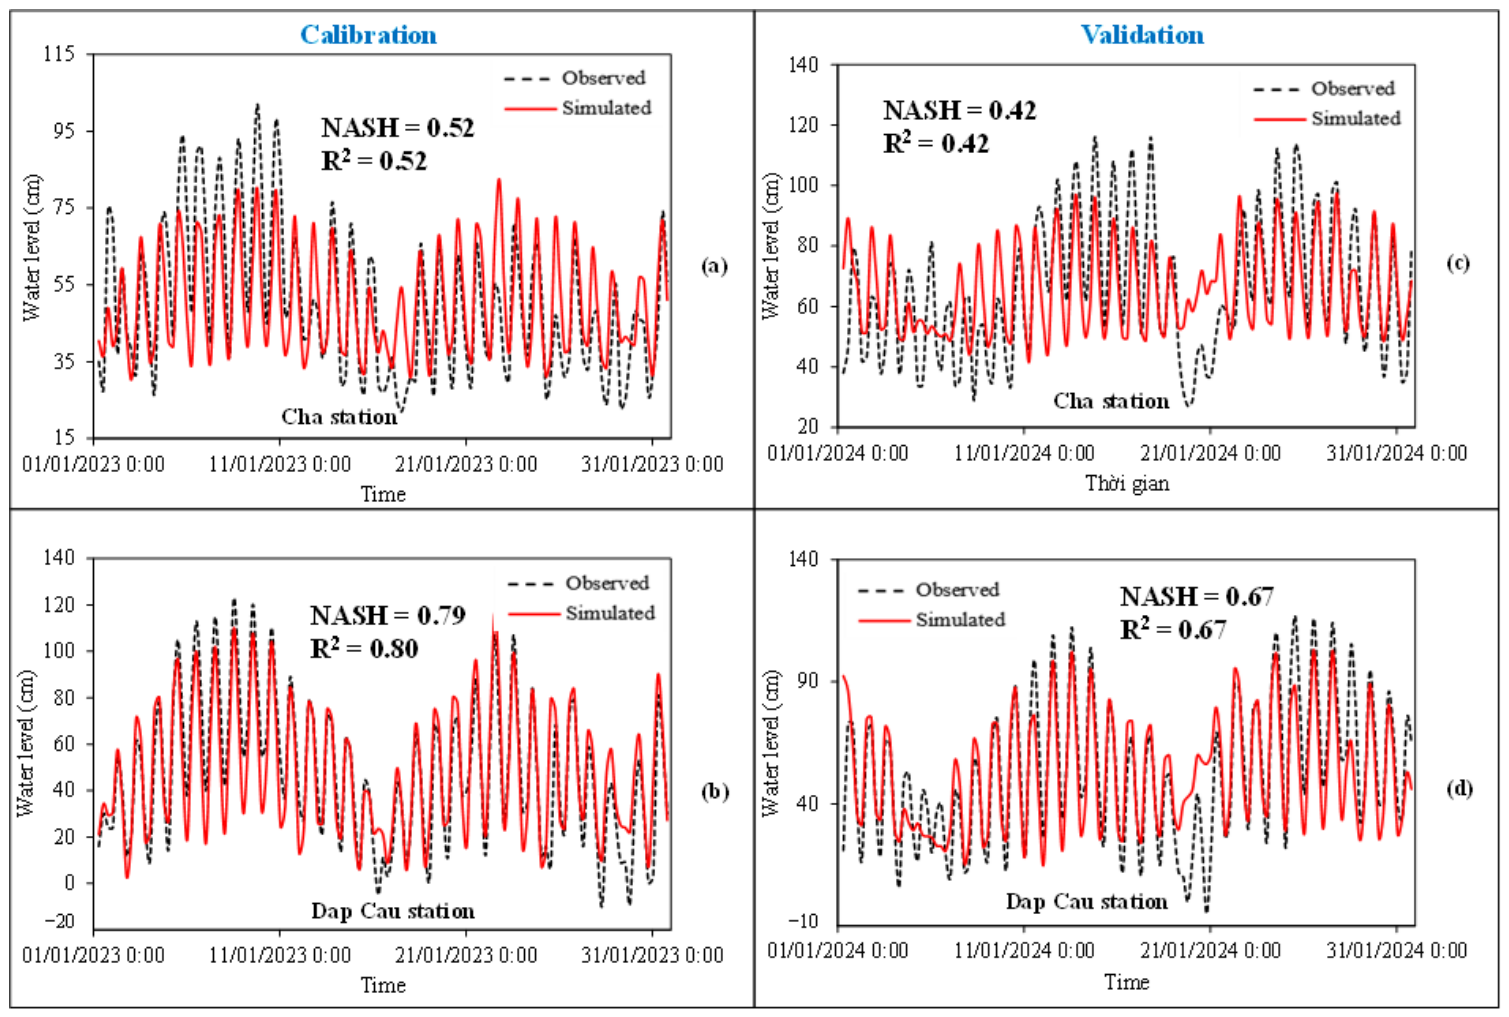
The MIKE SHE model was calibrated for the Cau river basin using hydrometeorological data from 2023 and subsequently validated against an independent dataset from 2024. Model performance was evaluated by comparing simulated and observed water-level time series at the Cha and Dap Cau hydrological stations, using the NSE coefficient as the primary performance metric. During the calibration period, simulated water levels at both stations showed good agreement with observations (Figure 9a,b). At the Cha station, the NSE value of 0.52 indicates satisfactory model performance in reproducing observed water-level dynamics. At the Dap Cau station, a higher NSE value of 0.79 reflects strong agreement between simulated and observed water levels, suggesting a reliable representation of hydrological processed in the middle–lower reaches of the basin. The simulated hydrographs demonstrate that the MIKE SHE model effectively captures the temporal variability of water levels, including both high-flow events and recession periods. Although minor discrepancies were observed during extreme hydrological conditions, the overall simulation results indicate reliable model performance. These findings confirm that the calibrated MIKE SHE model is suitable for testing and provides a robust foundation for subsequent coupled simulations of hydrodynamics and water quality transport when integrated with the MIKE 11 HD model.
Testing results for 2024 indicate that the MIKE SHE model maintained a satisfactory performance (Figure 9c,d). At the Cha station, the NSE decreased to 0.52, reflecting reduced performance under hydrological conditions that differed from those of the calibration period, while still remaining within the commonly accepted range for satisfactory model performance. At the Dap Cau station, the NSE reached 0.67 during the testing period. Although this value is lower than that obtained during calibration, it still indicated satisfactory agreement between simulated and observed water level dynamics, suggesting that the calibrated parameter set was transferable across different hydrological conditions. The modest decline in performance is consistent with the interannual hydrological variability also identified in the MIKE 11 HD simulations, suggesting that uncertainties are primarily driven by boundary conditions and climatic variability rather than structural limitations of the model. Overall, the calibration and testing of the MIKE SHE model using observations at the Cha and Dap Cau hydrological stations yielded NSE values ranging from 0.52 to 0.79, which were comparable to the performance achieved by the MIKE 11 HD model across the basin. This consistency between the surface–subsurface simulations (MIKE SHE) and river hydrodynamics (MIKE 11) confirms the internal coherence of the coupled modeling framework. Consequently, the calibrated parameter set provides a reliable basis for subsequent water quality simulations and integrated assessments of surface–subsurface interactions in the Cau river basin.
In addition to error evaluation through the NASH coefficient, the MIKE SHE model parameters were comprehensively configured for each hydrological component and watershed characteristic. Specifically, the Strickler roughness coefficient was assigned differently for each river segment 18 m1/3/s for upstream reaches, 30 m1/3/s for connecting branches, and 40 m1/3/s in the downstream reaches, reflecting spatial variations in river morphology.
For overland flow, the Strickler coefficient was defined according to soil type and land use, ranging from 16 m1/3/s (sandy soil) to 33 m1/3/s (water surface). Unsaturated- and saturated-zone flow processes were parameterized using distinct porosity and hydraulic conductivity values that represent soil structure and aquifer properties. For example, vertical hydraulic conductivity values were assigned as Kuz-Clay = 1.2 × 10⁻⁸ m/s and Kuz-Sand = 2.89 × 10⁻⁴ m/s, while the horizontal saturated hydraulic conductivity was set to Kh = 6.7 × 10⁻⁵ m/s. These parameters enabled the model to reproduce infiltration, soil water storage, and groundwater flow processes, thereby ensuring a physically based representation of the hydrological conditions of the Cau river basin (Table 2).
Calibration and testing of the MIKE SHE model for the Cau river basin yielded NSE values ranging from 0.55 to 0.79, indicating satisfactory to good model performance. The calibrated parameterization provides a consistent representation of coupled surface and subsurface flow processes and establishes a robust basis for subsequent simulations of pollutant transport, water quality dynamics, and basin-scale hydrological response. Although localized discrepancies remain, particularly during the testing period, the overall results confirm that MIKE SHE is a reliable component of the integrated hydrological–hydraulic modeling framework and is well-suited to support basin-scale water resources management. Building on this tested parameter set, the next phase of the study focuses on incorporating surface-runoff-driven pollutant transport processes within the MIKE SHE modeling system.

3.2. Results of Calibration and Testing MIKE 11 ECOLab and MIKE SHE Models

3.2.1. Results of Calibration and Testing MIKE 11 ECOLab Model

Water quality data were collected from pollutant discharge sources and monitoring locations within the study area during two intensive monitoring campaigns: the first from 20 March 2024 to 3 April 2024, and the second from 8 April 2024 to 23 April 2024. The datasets were obtained from the Water Environment Monitoring Results Report—Northern Environmental Monitoring Center, Department of Pollution Control, in April 2024. The water quality monitoring stations used for calibration and testing are shown in Figure 1. The monitoring sites were selected to represent major pollution sources, tributary confluences, and longitudinal changes in water quality along the Cau river, as follows:
-
Tra Vuon Bridge: Assesses the water quality of the Cau river as it flows through the Thai Nguyen Iron and Steel Complex area.
-
Cau May Bridge: Evaluates the water quality of the Cau river section passing through Thai Nguyen City.
-
Tan Phu: Monitors water quality before the Cau river joins the Cong river; this is also the final point of the Cau river within Thai Nguyen Province before entering Bac Ninh Province.
-
Cau Vat Bridge: Evaluates the water quality of the Cau river after the confluence with the Cong river.
-
Phuc Loc Phuong: Monitors the water quality at the confluence of the Ca Lo river and the Cau river.
-
Huong Lam: Assesses the water quality of the Cau river within Hiep Hoa District.
-
Hoa Long: Evaluates water quality after the Cau river joins the Ngu Huyen Khe river.
-
Thi Cau Bridge: Monitors the water quality of the Cau river within Bac Ninh City.
-
Thong Ha: Assesses the water quality of the Cau river before it flows past the Que Vo Industrial Park.
-
Hien Luong: Evaluates the water quality of the Cau river after passing the Que Vo Industrial Park.
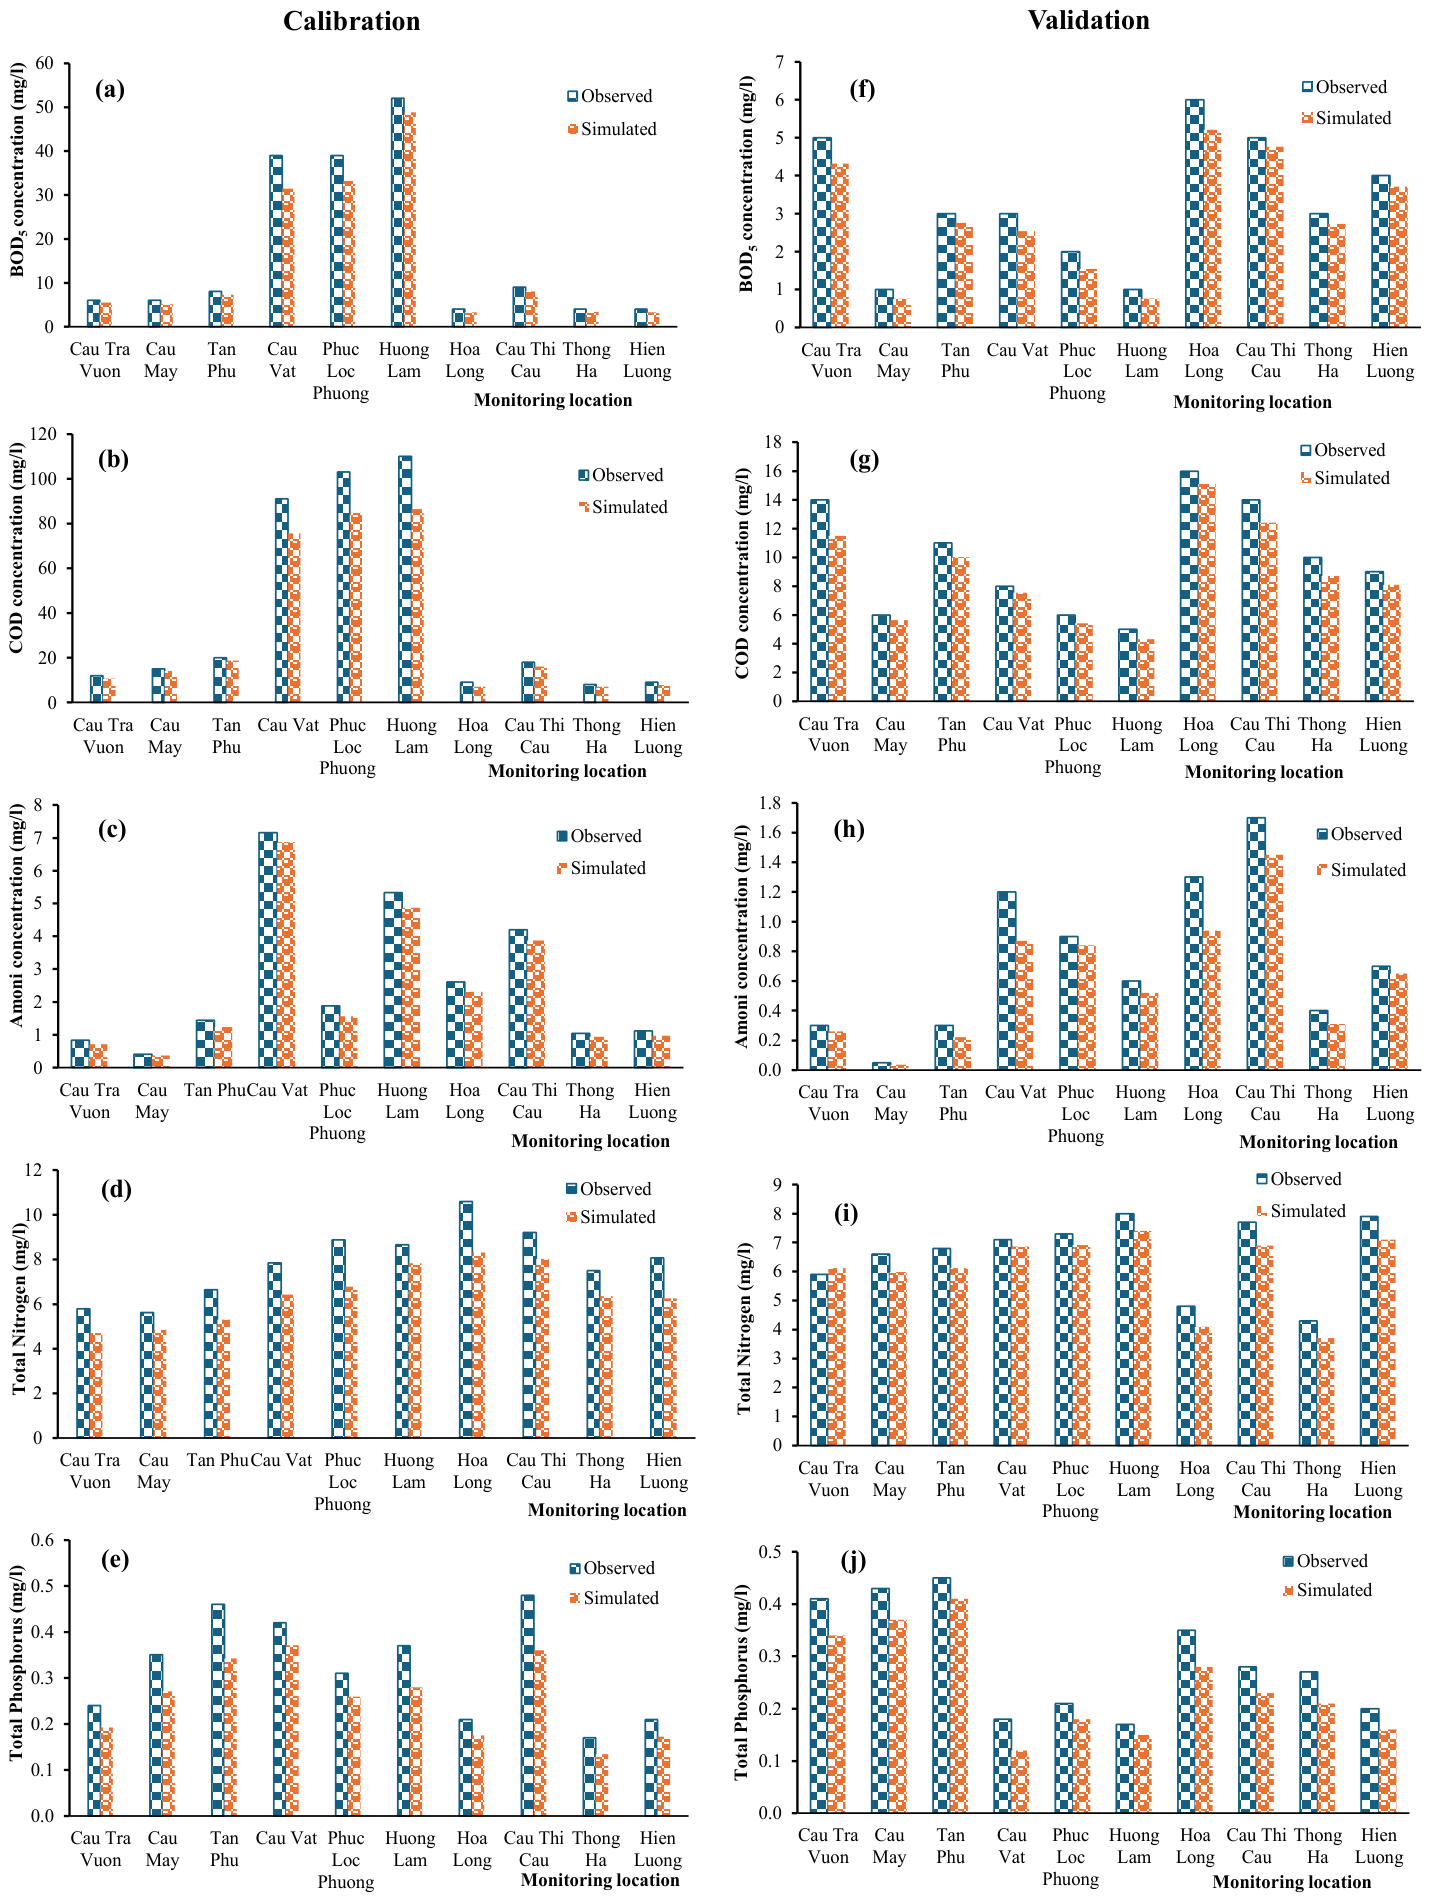
Calibration of the MIKE 11 ECOLab model focused on key water quality variables, namely, biochemical oxygen demand (BOD5), chemical oxygen demand (COD), ammonium (NH4+), TN, and TP. The calibration results are presented in Figure 10a–e and summarized in Table 3.
Simulated concentrations show good agreement with observation, with mean relative errors across monitoring sites ranging from 8% to 25%. This indicates that the calibrated parameter set effectively represented the variability and temporal dynamics of organic pollutants and nutrients within the studied river system. At several locations, low deviations (<10%), particularly for NH4+ and BOD5, demonstrate the stability and accuracy of the model. However, higher discrepancies (>20%) were observed for TP and COD at sites such as Huong Lam, Hoa Long, and Thi Cau Bridge. These deviations reflect the inherent complexity of nutrient transformation processes, which are strongly influenced by variable inputs from domestic wastewater, agricultural runoff, and hydrological conditions.
Model testing was conducted using an independent dataset from 2024 (Figure 10f–j and Table 4). The deviation between simulated and observed values generally ranged from 6% to 24%, indicating the stability and reproducibility of the calibrated parameter set. Among the evaluated parameters, BOD5 and NH4+ consistently exhibited the lowest errors, whereas TP remained the most challenging variable to simulate, with deviations reaching up to 33% at the Cau Vat bridge. Spatially, better model performance was observed at stations such as Tan Phu, Thong Ha, and Hien Luong, while larger discrepancies occurred at sites influenced by urban and craft village activities, including Hoa Long and Phuc Loc Phuong. These differences are likely associated with short-term fluctuations in domestic and industrial discharges, which are difficult to fully represent in model inputs.
Both the calibration and testing stages yielded satisfactory results, with an average error within the acceptable range (below 25%), demonstrating that the identified parameter set was representative of the study area and stable across different simulation periods. The minor difference between the two stages reflects the model’s transferability under varying hydrological conditions and pollutant loading regimes. These results indicate that the application of MIKE 11 ECOLab can effectively support the assessment of current water quality conditions, scenario analyses involving climate change and socioeconomic development, and the development of water quality zoning maps.
The calibration and testing results indicate that the MIKE 11 ECOLab model provides a reliable representation of key water quality processes, making it suitable for advanced applications such as river pollution load capacity assessment, the evaluation of additional pollutant inputs, and the analysis of climate change impacts. Although some parameters, particularly total phosphorus, remain more difficult to reproduce accurately, the calibrated parameter set effectively captures the dominant trends and spatiotemporal variability of water quality conditions. Consequently, the model provides a practical decision-support tool for water quality management and planning within the Cau river basin.

3.2.2. Results of Calibration and Testing MIKE SHE Water Quality Model

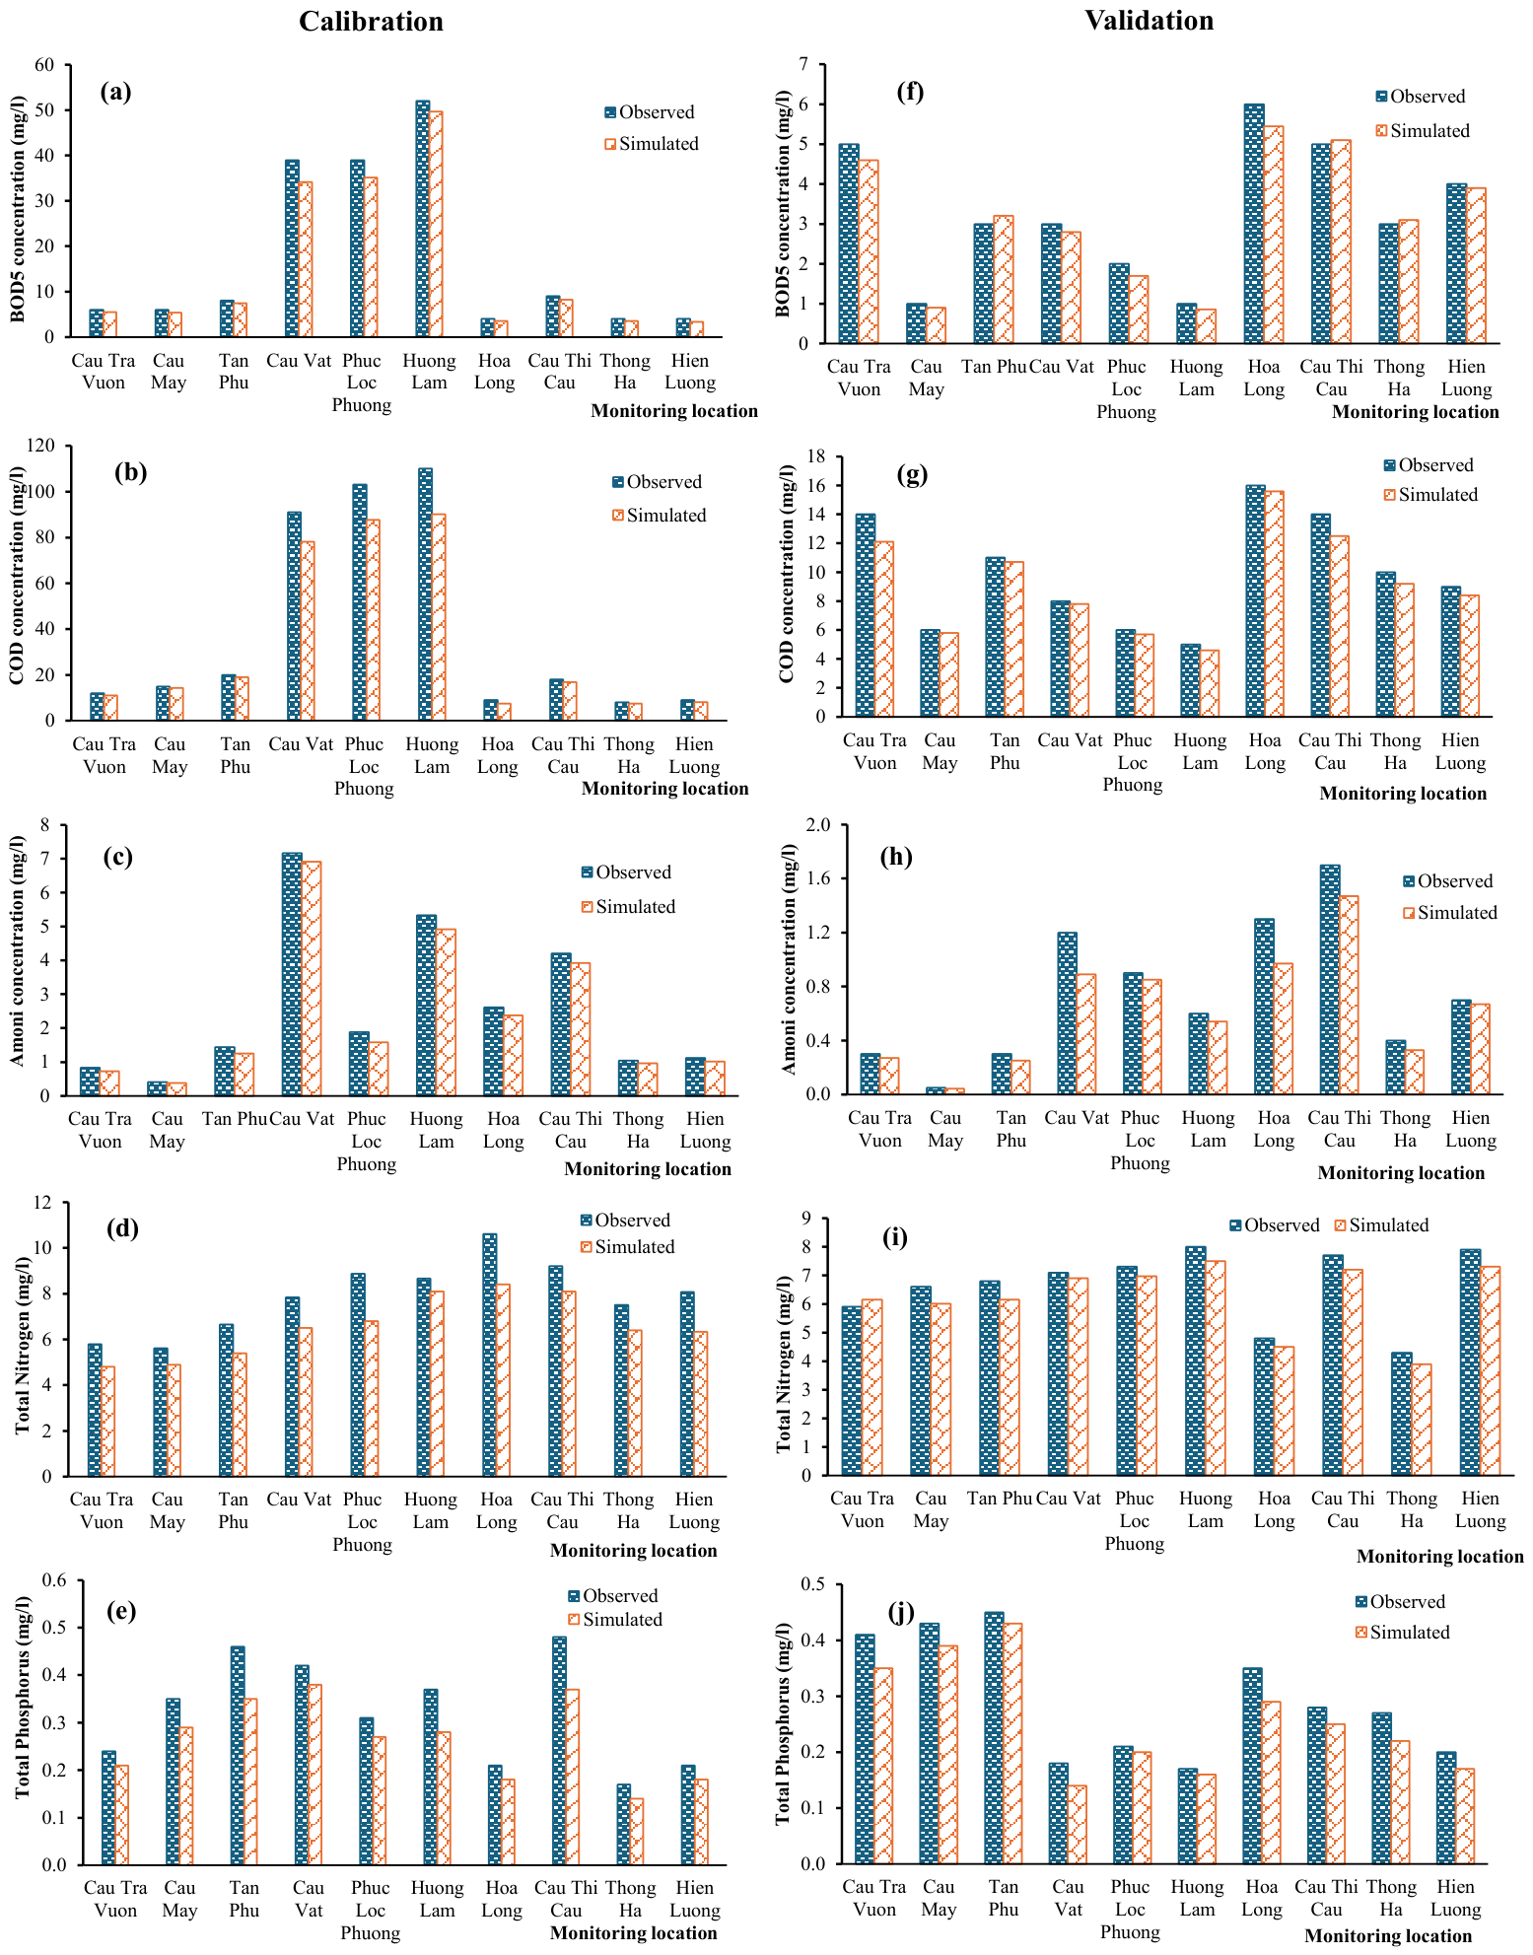
The calibration of the MIKE SHE water quality module was performed using observations from ten monitoring stations along the river, focusing on five key variables: BOD5, COD, NH4+, TN, and TP. Results for the calibration monitoring period indicate good overall agreement between simulated and observed concentrations (Figure 11a–e), with relative errors ranging from 6% to 23% (Table 5). Specifically, some stations such as Huong Lam, Tan Phu, and Thi Cau Bridge exhibited low errors (<10%) for BOD5 and COD, indicating stable and reliable simulation performance. However, higher errors were observed for nutrient parameters, particularly total phosphorus, reaching up to 24% at Tan Phu and 23% at Huong Lam, reflecting the complexity of phosphorus transformation and transport processes within the river system.
When analyzed by parameter, BOD5 and COD generally exhibited lower errors compared to NH4+, TN, and TP, which is consistent with the relatively simple representation of organic matter degradation compared with nitrification–denitrification dynamics and sediment-associated nutrient exchanges. Spatially, downstream urban stations such as Hoa Long and Thi Cau Bridge tended to show larger discrepancies, likely due to short-term fluctuations in domestic and industrial wastewater discharges, which are difficult to fully capture within the model’s input datasets. Calibration results indicate that discrepancies between simulated and observed pollutant concentrations range from 6% to 23% (Table 5), indicating that the adopted water quality parameterization is generally appropriate for the study area. The calibrated parameter set was subsequently applied to simulate the second monitoring period in 2024, and the corresponding testing results are presented below.
After calibration, the optimized parameter set was tested using an independent observation dataset in 2024. Testing results showed that discrepancies between simulated and observed concentrations generally ranged from 2% to 23%, which are generally lower than those observed during calibration, reflecting the stability and transferability of the calibrated parameter set (Figure 11 and Table 6). The BOD5 and COD parameters maintained good accuracy, with average errors of 4–11% at most stations. Notably, at Thi Cau Bridge and Hien Luong, the errors were very low (2–4%), demonstrating excellent model performance. However, ammonium (NH4+) and total phosphorus (TP) remained challenging to simulate accurately. For example, at Cau Vat, the ammonium error reached 26%, and, at Hoa Long, 23%. This suggests that biochemical processes related to nitrogen and phosphorus still exhibit high variability and remain difficult to represent precisely in the model. Testing results show that the calibrated water quality parameter set is suitable for simulating the dominant spatiotemporal patterns of pollutant dynamics in the Cau river basin.
Results from both calibration and testing phases indicate that the MIKE SHE model satisfactorily reproduced observed water quality conditions, with average errors remaining within acceptable ranges. The calibrated parameter set demonstrates stability and transferability under varying hydrological conditions. Spatial variability across monitoring stations reflects the combined influence of heterogeneous pollution sources and site-specific hydrodynamic characteristics. Model performance was consistently stronger for BOD5 and COD, suggesting that the model is well-suited for quantifying organic pollution dynamics. In contrast, simulations of nutrient-related parameters (NH4+, TN, and TP) exhibited greater uncertainty, indicating the need for some further refinement of process representation to support more detailed scenario analyses.
Compared with the MIKE 11 testing results, the MIKE SHE model exhibited lower performance at several monitoring locations. This difference can be attributed to the greater complexity of the distributed groundwater modeling framework, which incorporates spatial variability in hydrogeological properties, recharge processes, unsaturated-zone dynamics, and groundwater–surface water interactions. Uncertainties in aquifer parameters, recharge estimation, and subsurface boundary conditions may therefore contribute to discrepancies between simulated and observed groundwater levels.
Nevertheless, the model successfully reproduced the major seasonal fluctuations and long-term groundwater dynamics observed during the study period. The results suggest that the model captures the dominant groundwater flow processes and exchange mechanisms required for the assessment of groundwater–surface water interactions within the Cau river basin.

3.3. Analysis of Surface–Groundwater Hydraulic Interaction in the Study Area

Hydraulic interactions between surface water and groundwater in the study area were investigated using the physically based MIKE SHE model dynamically coupled with the river hydraulic network represented by MIKE 11. This two-way coupling framework enables a process-based representation of water exchange across surface–subsurface domains, thereby improving the reliability of hydrological assessments under varying flow conditions.
Simulation results for April 2024 revealed pronounced spatial variability in both the magnitude and direction of surface water–groundwater exchange along the Cau river. In general, most river reaches exhibited small positive exchange fluxes (0.001–0.025 m3/s), indicating river-to-aquifer recharges under low-flow conditions. At the Cha station in the upstream catchment, exchange rates remain relatively low (<0.01 m3/s), suggesting weak hydraulic connectivity, likely associated with low-permeability formations and limited infiltration during the dry season. Further downstream, at Phuc Loc Phuong, exchange fluxes increased (0.011–0.025 m3/s), reflecting enhanced hydraulic interaction where the river loses water to the aquifer through more permeable alluvial deposits and active river-bank filtration processes. In contrast, near the Dap Cau station, the exchange regime becomes more variable, with localized sections exhibiting near-zero or slightly negative fluxes (−0.009 to 0 m3/s), indicating zones where groundwater discharges back into the river (Figure 12). These results demonstrate a dynamic bidirectional exchange pattern along the Cau river, governed by spatial variations in topography, hydraulic gradients, and sediment properties. Upstream reaches function primarily as recharge zones, while middle and lower sections, particularly around Dap Cau, acted as transitional discharge zones that sustain river baseflow during dry periods.
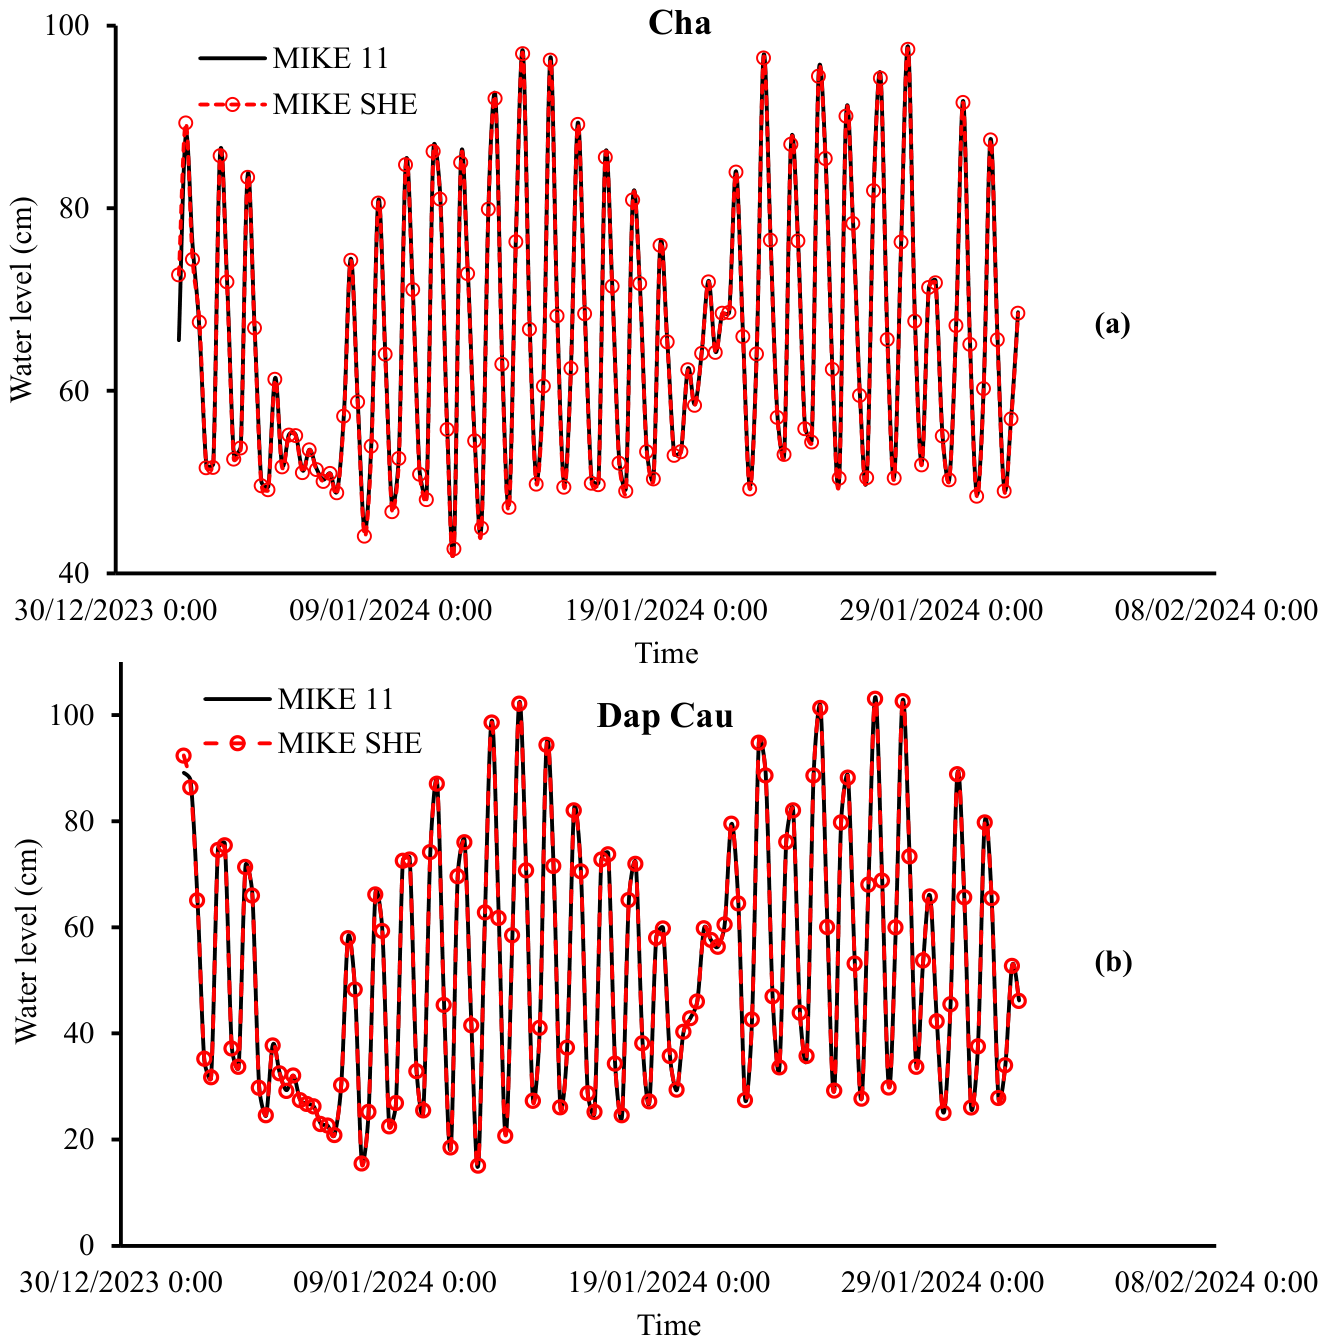
A comparison of simulated water levels obtained from MIKE 11 and MIKE SHE models (Figure 13) demonstrates strong overall agreement at both the Cha and Dap Cau stations, confirming the internal consistency of the coupled surface–groundwater interaction framework. At the Cha station (Figure 13a), water levels simulated by MIKE SHE are consistently slightly lower than those produced by MIKE 11, particularly during low-flow conditions in mid-January 2024. This systematic deviation indicates river-to-aquifer infiltration, reflecting a net loss river condition, typical of upstream reaches where groundwater recharge prevails. At the Dap Cau station (Figure 13b), located in the middle–lower reaches of the basin, both models reproduce similar temporal dynamics of water level. However, MIKE SHE occasionally produces slightly higher water levels than MIKE 11, particularly following rainfall events. This suggests short-term gain river conditions, where groundwater locally discharges into the river channel. The small but systematic discrepancies between the two simulations highlight the added value of explicitly representing surface–subsurface exchanges in MIKE SHE, which captures hydrological processes not resolved in the stand-alone MIKE 11 model. The comparative analysis demonstrates that coupling MIKE SHE with MIKE 11 improves the representation of hydraulic connectivity and river–aquifer exchange processes along the Cau river, particularly during dry-season conditions when such interactions play an important role in sustaining baseflow and regulating groundwater storage.
During the dry season, as groundwater reserves in the downstream reach of the Cau river begin to be depleted, river water becomes an important recharge source for the shallow aquifer. Model simulation indicates that, when the saturated groundwater level falls below the river stage, hydraulic gradients drive infiltration from the channel through the riverbed into the aquifer. Incorporating surface–groundwater exchange processes results in detectable, although relatively small, variations in groundwater levels at several monitoring locations. This limited magnitude suggests the coexistence of downward percolation from the unsaturated zone and upward seepage from the shallow aquifer back to the river, both of which contribute to sustaining river flow under low-flow conditions.
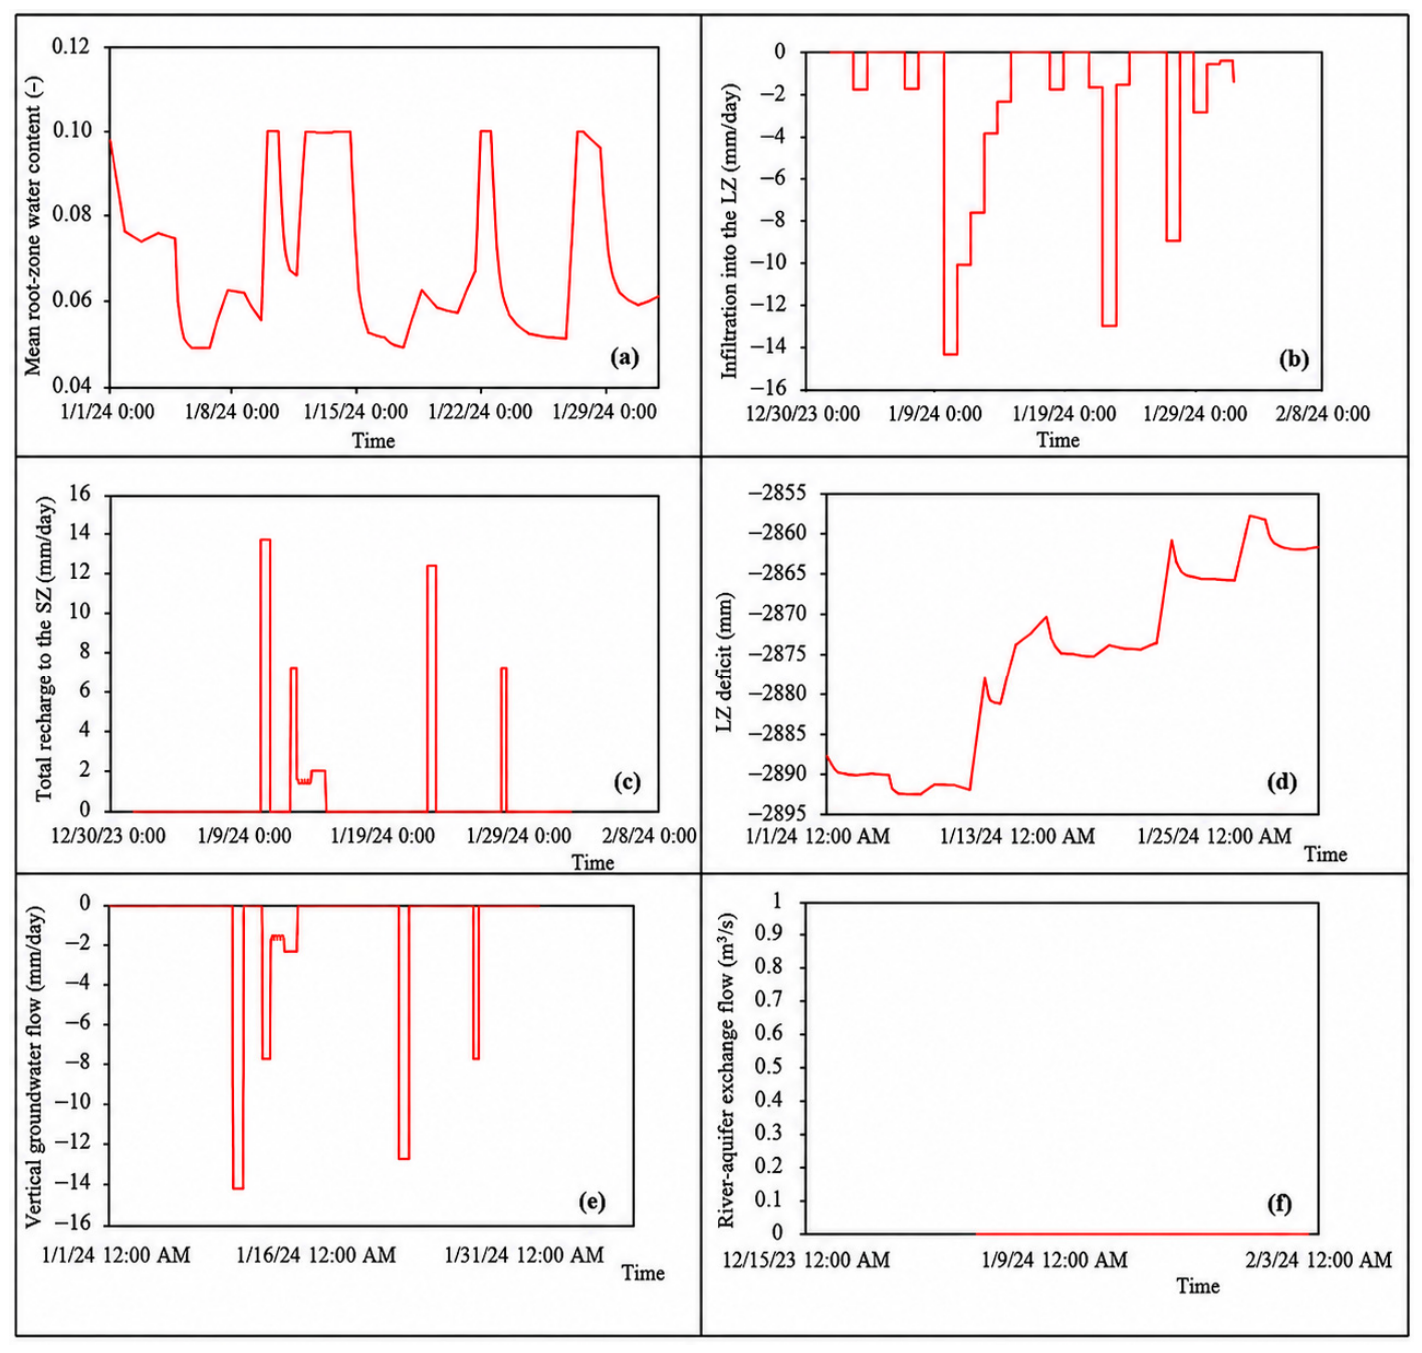
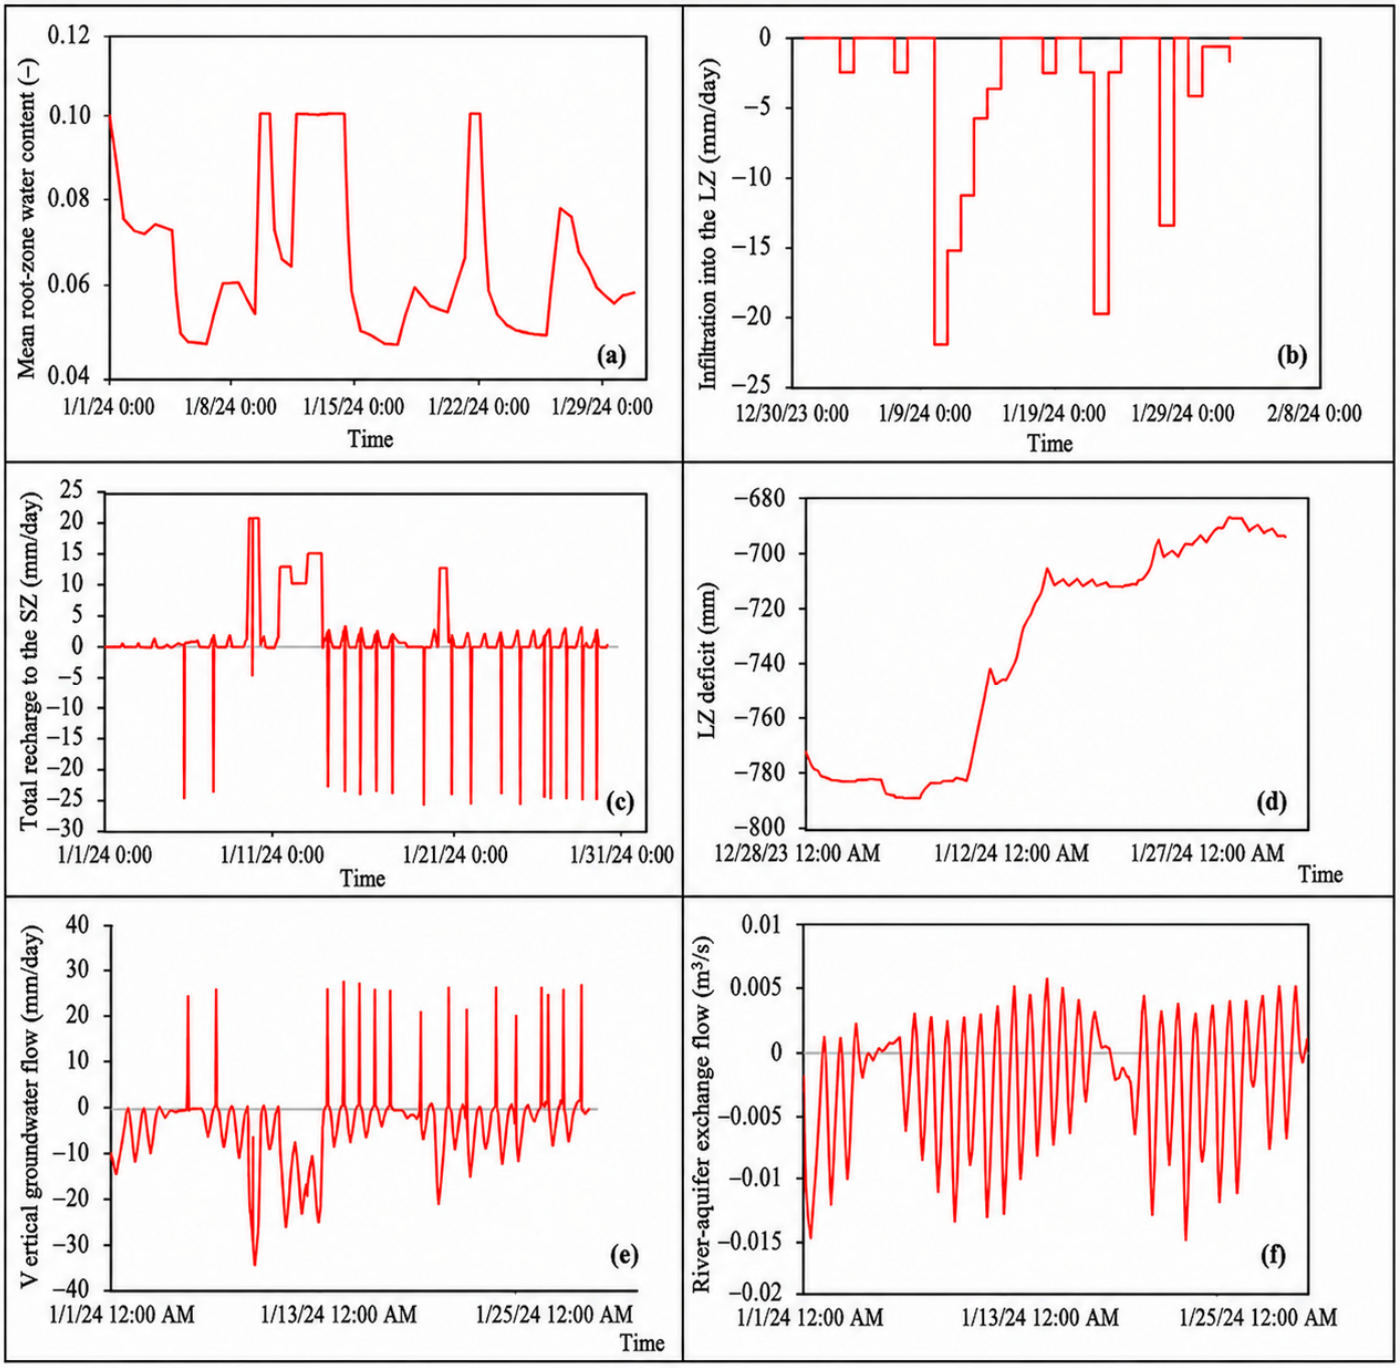
The detailed outputs comprise root-zone moisture conditions, infiltration into the unsaturated zone, total recharge to the saturated zone, soil water deficits, vertical groundwater fluxes in the z-direction, and river–aquifer exchange flows at the Cha and Dap Cau stations (Figure 14 and Figure 15).
In the MIKE SHE model, two major subsurface domains are simulated concurrently: the UZ and SZ. The UZ represents infiltration from rainfall and surface water through the soil, moisture variations within the soil layer, and recharge to the SZ. In contrast, the SZ simulates groundwater flow, interactions with rivers and lakes, and surface–groundwater exchange processes. Coupling MIKE SHE with MIKE 11 enables the simultaneous simulation of river hydraulics and groundwater dynamics, thereby improving the interpretation of the river recharge, groundwater discharge, and river–aquifer exchange mechanisms:
-
Root-zone moisture content: Simulation results at Cha (upstream) and Dap Cau (downstream) show that the root-zone moisture content fluctuated between 0.04 and 0.12 (volumetric moisture fraction). The temporal variations were broadly consistent at both stations, indicating relatively stable soil moisture conditions during the study period. These values suggest that water availability for vegetation was generally maintained; however, during short-term dry periods, moisture content decreased to approximately 0.04, indicating a potential risk of water stress for crops.
-
Infiltration into the unsaturated zone (UZ): Surface infiltration into the UZ differed between the two stations. At Cha, the maximum infiltration reaches approximately 15 mm/day, whereas, at Dap Cau, it reached up to 20 mm/day. This difference reflects the combined influence of topography, soil hydraulic properties, rainfall variability, and local hydrological conditions. The higher infiltration rate at Dap Cau suggests greater local recharge potential in the downstream area, possibly associated with more permeable alluvial deposits and stronger river–floodplain connectivity.
-
Recharge to the saturated-zone (SZ) and unsaturated-zone deficit: At Cha station, recharge to the SZ occurred almost continuously throughout the simulation period, highlighting the role of the upstream area in sustaining groundwater storage. In contrast, recharge at Dap Cau was more variable. During 10–14 January 2024, downward recharge dominated, whereas, at other times, upward water movement from the SZ to the UZ was simulated, reflecting strong fluctuations in groundwater level fluctuations influenced by river stage and flow variability. The larger UZ water deficits at Dap Cau further indicate a greater sensitivity of the downstream area to rapid changes in recharge and river–aquifer exchange conditions.
-
Vertical groundwater flow (z-direction): Vertical groundwater flow at Cha is predominantly positive throughout the simulation period, indicating downward water movement and recharge to the SZ. This pattern is consistent with the upstream characteristic, where hydraulic gradients generally favor downward percolation and groundwater replenishment. At Dap Cau, vertical flow fluctuates between positive (downward recharge) and negative (upward discharge), indicating complex river–groundwater interactions. This pattern indicates more complex surface water–groundwater interactions in the lower Cau river and provides evidence of dynamic vertical exchange between the unsaturated and saturated zones.
-
Groundwater–river exchange: The simulated river–aquifer exchange fluxes further highlights spatial differences in surface water–groundwater interactions. At Cha, upward from the aquifer to the river was negligible, and water predominantly moved from the river into the groundwater system, indicating losing-river conditions. At Dap Cau, continuous bidirectional exchange was observed: when river levels increased, river water infiltrated the aquifer, whereas, during lower river stages, groundwater discharged back into the river. This exchange mechanism helps to regulate river-stage fluctuations and sustains low flows, while also increasing the sensitivity of the shallow aquifer to changes in river hydraulic conditions.

3.4. Impact of Surface–Groundwater Interaction on Water Quality

The above analysis demonstrates that the MIKE SHE model effectively captures surface–subsurface interactions and associated pollutant exchanges between the river water column and the near-river saturated zone in the study area. Hydraulic connectivity between surface water and groundwater plays a key role in driving water quality dynamics in both systems. In this study, the MIKE modeling framework was applied to quantify these processes and assess their implications for river water quality. Specifically, MIKE 11 was used to simulate pollutant transport within the river water column, whereas MIKE SHE was employed to represent pollutant transport in the shallow saturated zone adjacent to the river, incorporating two-way hydraulic exchange between the river and the aquifer.
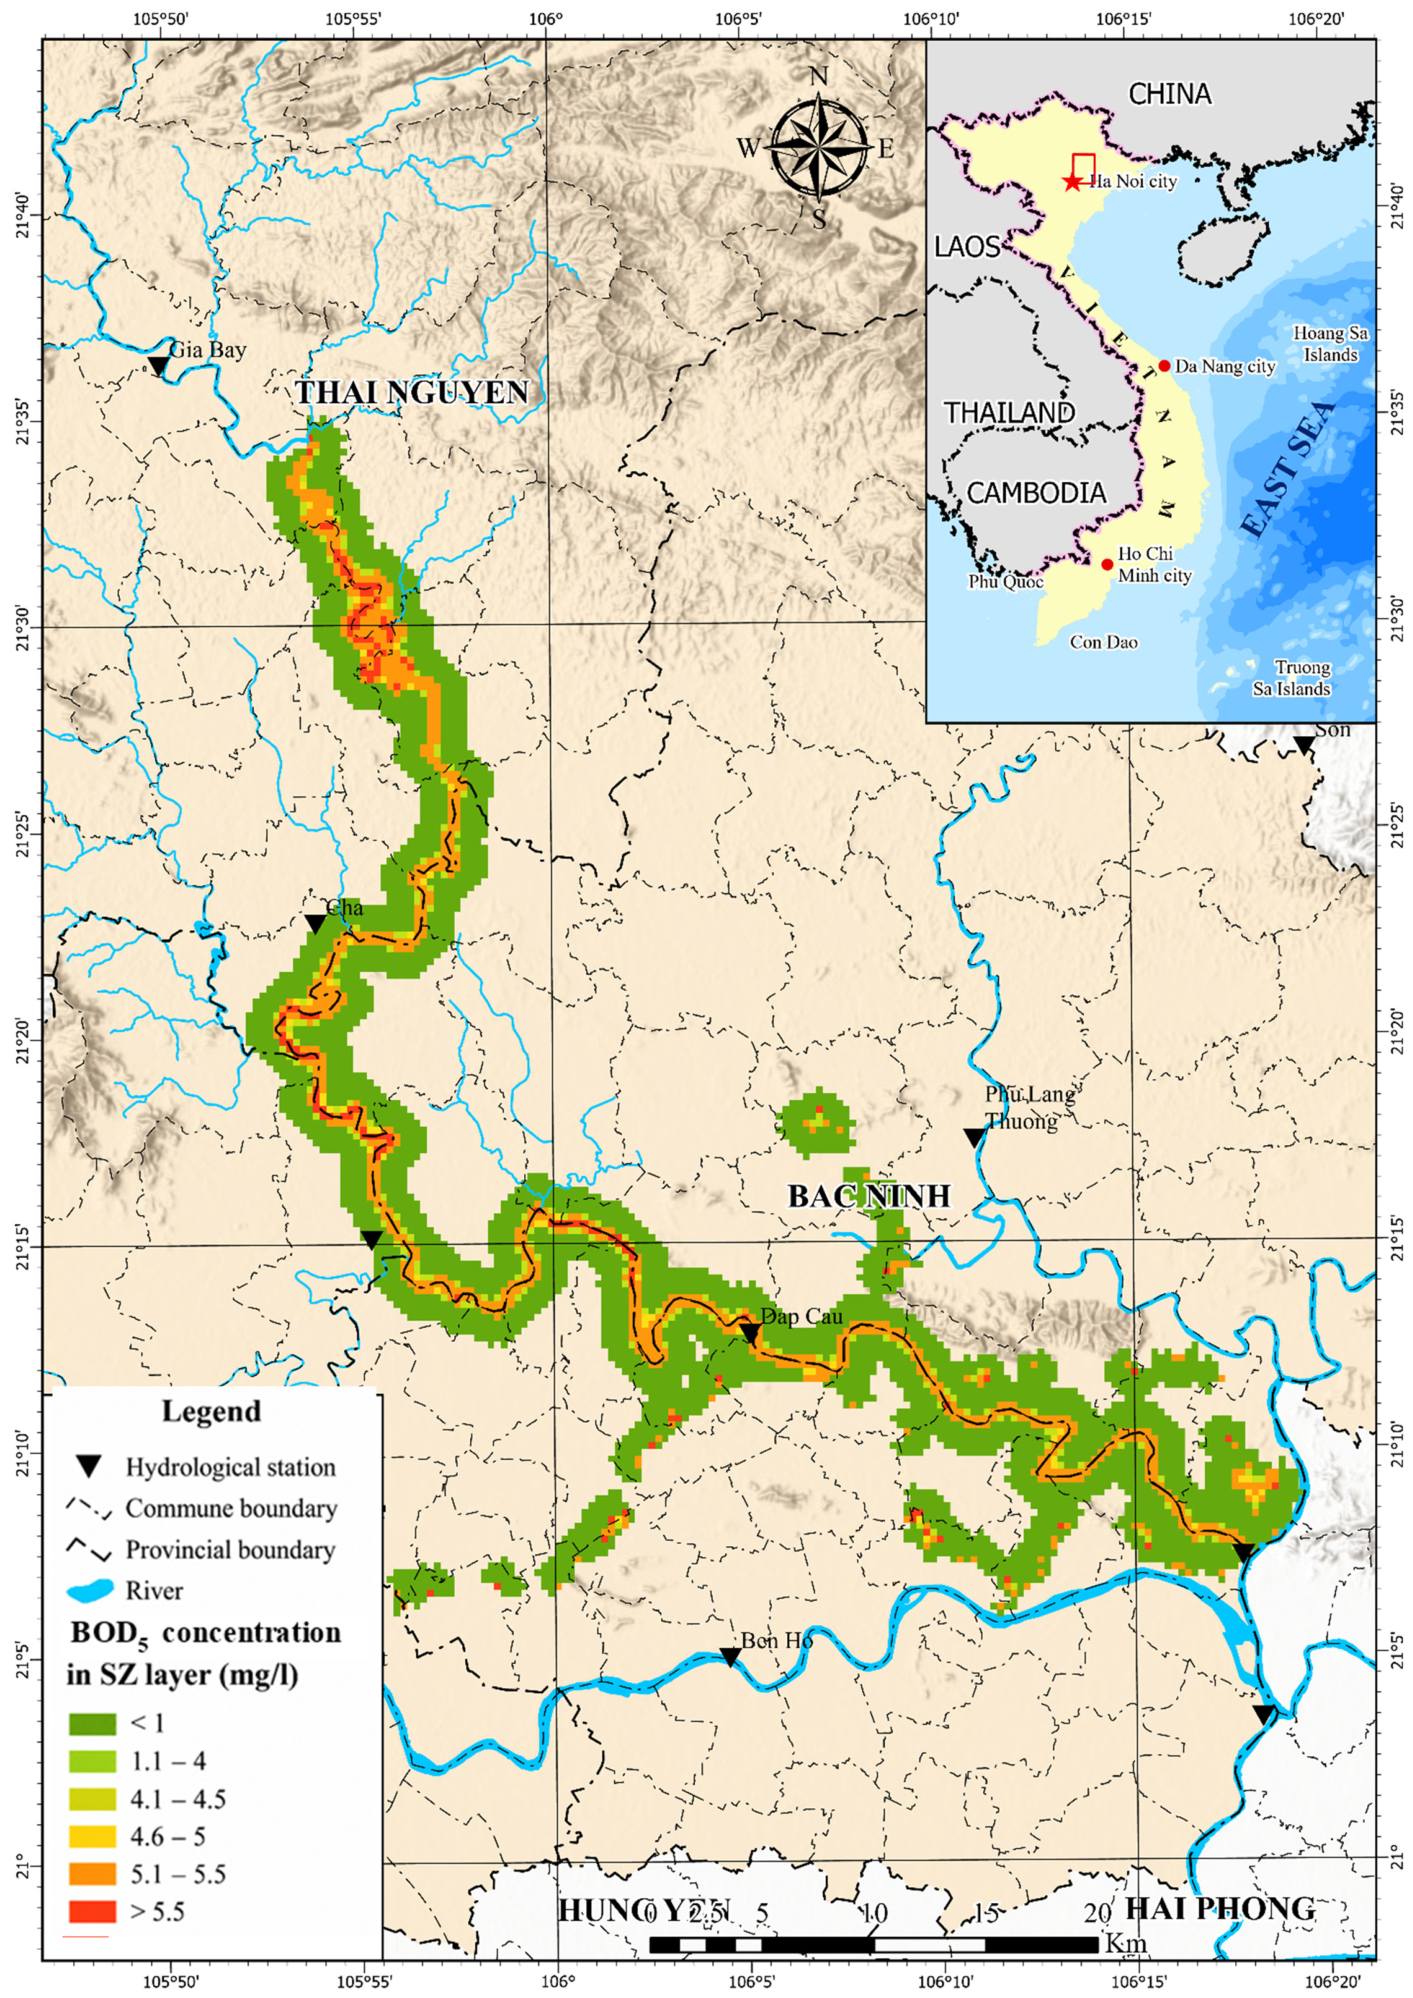
Simulation results indicate that pollutant concentrations predicted by MIKE SHE at monitoring locations are generally higher than those simulated by MIKE 11. This discrepancy reflects the explicit representation of bidirectional exchange processes between the near-river saturated zone and the river, which enhances pollutant accumulation at several locations along the Cau river. For ammonium (NH4+), total nitrogen (TN), and total phosphorus (TP), the influence of exchange processes remains relatively limited, partly due to low background concentrations in the near-bed layer. In contrast, COD and BOD5, primarily derived from domestic wastewater sources, pass through the soil into the near-river groundwater system and subsequently re-enter the river via groundwater exchange, leading to elevated concentrations in the river water. These simulated exchange dynamics of COD and BOD5 within the saturated zone are illustrated in Figure 16 and Figure 17, respectively.
Groundwater quality is generally superior to that of surface water; consequently, when river water recharges the aquifer, it can act as a vector for pollutant transport, affecting not only the immediate river cross-section but also extending laterally up to approximately 1.5 km into adjacent areas. Simulation results for BOD5 within the saturated zone (SZ) reveal clear spatial variability along the Cau river, with elevated concentrations associated with urbanized and industrialized regions. At the Cha station, BOD5 levels in the SZ remain relatively moderate, typically ranging from 4.1 to 5 mg/L, reflecting moderate organic pollution in the upper reach due to infiltration from local surface water and limited domestic wastewater inputs. Conversely, at the Dap Cau station, BOD5 concentrations are higher, often exceeding 5 mg/L, indicating the cumulative impact of pollutant inputs for the middle and lower basin, including domestic effluents and intensified interaction with the near-river groundwater system.
Because the simulations were conducted under dry-season conditions, low rainfall limited the generation of surface runoff and near-bed flows, thereby constraining the extent to which their impact on river water quality could be fully evaluated. During the rainy season, increased rainfall may enhance surface and subsurface transport pathways while also increasing dilution capacity in the river. As a result, pollutant concentrations may decrease under high-flow conditions, although additional pollutant inputs from the runoff and shallow subsurface pathways can still contribute to short-term water quality variability (Figure 16). The spatial distribution of BOD5 in the SZ therefore provides a useful basis for identifying priority monitoring areas and informing targeted management strategies, with elevated organic loads notably particularly concentrated near Dap Cau.
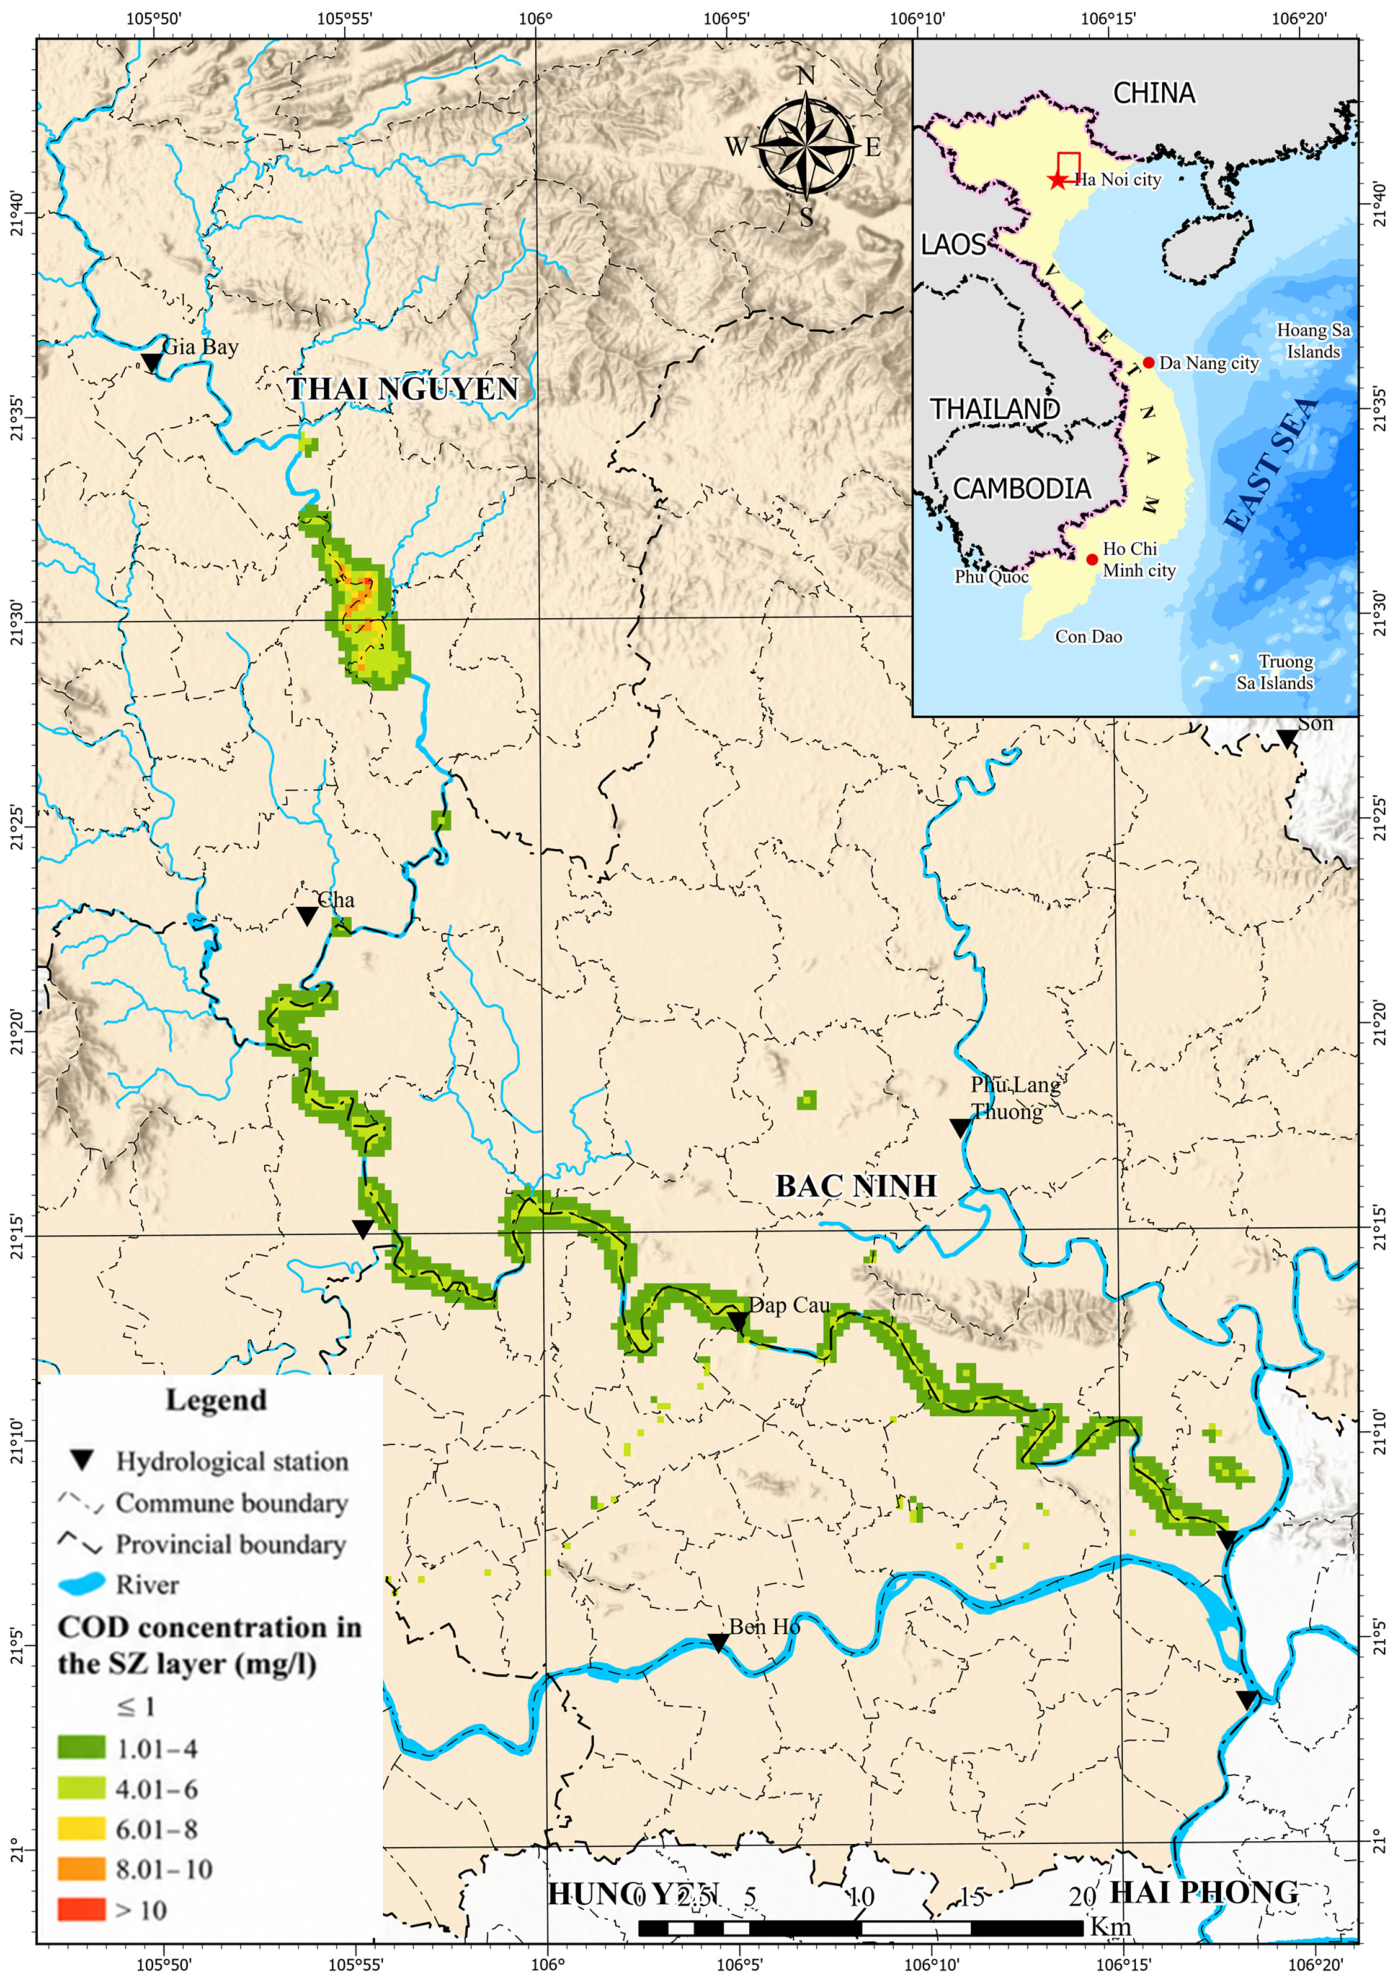
Simulation results for COD concentrations in the SZ (Figure 17) revealed pronounced spatial variability along the Cau river. Overall, COD concentrations in the SZ ranged from 1.01 to 6 mg/L, indicating generally low to moderate levels of organic pollution across most river reaches. At the Cha station, COD values are mostly within 1–4 mg/L, reflecting limited anthropogenic impact and a good self-purification capacity of the upstream aquifer. At Phuc Loc Phuong, COD concentrations increased to 4–6 mg/L, suggesting localized effects of agricultural and domestic sources entering the shallow groundwater through surface water infiltration. The highest simulated COD concentrations occur near the Dap Cau station, where values locally exceed 6 mg/L, indicating stronger organic pollution associated with urban wastewater discharges and cumulative inputs from upstream sub-basins. These results suggest that groundwater in the lower reach is more vulnerable to contamination due to intensive land use and surface–groundwater interaction. The simulated COD distribution thus highlights priority areas for groundwater quality monitoring and management, particularly around Phuc Loc Phuong and Dap Cau, where organic load accumulation in the saturated zone is most pronounced.
A comparison between the one-dimensional MIKE 11 simulation and the coupled MIKE SHE framework further highlights the importance of explicitly incorporating surface–subsurface exchange processes. The results show that pollutant concentrations simulated by MIKE 11 alone are consistently lower than those obtained from MIKE SHE at the monitoring locations. This difference is primarily attributed to the ability of MIKE SHE to represent bidirectional exchange between surface water and groundwater, thereby capturing additional pollutant transport pathways within the shallow subsurface environment. At the Cha station, hydraulic analysis indicates that a substantial proportion of river water infiltrates the subsurface, with limited upward return flow from the aquifer to the river. Consequently, the MIKE SHE simulation accounts for the transfer of pollutants from the river water column into the near-river saturated zone, where local accumulation may occur. This mechanism explains the higher pollutant concentrations simulated by MIKE SHE compared with the river-only MIKE 11 configuration. In contrast, at Dap Cau station, surface water–groundwater exchange is more balanced, resulting in smaller differences in simulate pollutant concentrations between the two modeling approaches.

4. Discussion

The coupled MIKE SHE–MIKE 11–ECOLab framework demonstrates satisfactory performance in simulating both hydrodynamics and water quality in the Cau river basin, with NSE values ranging from 0.55 to 0.79 and water quality relative errors of approximately 10–25%. These results are comparable to or slightly higher than those reported for stand-alone models such as MIKE 11 or SWAT in Vietnam, where NSE values typically range from approximately 0.50 to 0.75 [23,24,25]. This comparison suggests that the explicit coupling of surface and subsurface can improve the reliability of basin-scale hydrological and water quality simulations.
In a broader context, the model performance is consistent with international studies reporting NSE values of 0.58–0.76 for coupled surface–groundwater systems in Germany and 0.61–0.74 for SWAT–MODFLOW applications in Canada [12,15,17]. The results also align with previous MIKE SHE–MIKE 11 applications in the United States, where an improved representation of exchange fluxes and nutrient transport has been reported [10]. Despite data limitations commonly encountered in tropical developing basins, the present study achieved performance within the upper range of values reported for integrated hydrological–water quality modeling studies worldwide.
Compared with previous domestic studies relying on stand-alone MIKE 11 or MIKE SHE applications for river assimilative capacity and rainfall runoff modeling [18,21,22,23,24,25], this study represents the first fully coupled MIKE SHE–MIKE 11 application in the Cau river basin. By incorporating high-resolution land-use, soil, and distributed pollution source data, the model more accurately captures hydrological and pollutant variability, facilitating the identification of pollution hotspots and river segments influenced by groundwater exchange.
Hydrologically, the simulated river–groundwater exchange patterns were primarily governed by hydraulic gradients between river stage and groundwater levels, which vary spatially and temporally across the basin. In upstream areas, river stages were generally higher than adjacent groundwater levels, promoting river-to-aquifer infiltration and indicating predominantly losing-river conditions. In the middle and downstream reaches, exchange processes became more dynamic, with elevated river stages inducing infiltration into adjacent aquifers during high-flow periods, whereas declining river stages allowed groundwater to discharge back into the river and sustain baseflow during low-flow conditions. These bidirectional exchanges reflect the dynamic nature of surface water–groundwater interactions and are strongly influenced by river morphology, aquifer properties, hydraulic gradients, and boundary conditions.
The simulated river–groundwater exchange patterns were primarily governed by hydraulic gradients between river stage and groundwater levels, which varied spatially and temporally across the basin. In upstream areas, groundwater levels were generally higher than river stage, promoting groundwater discharge into the river and thereby sustaining baseflow conditions. In contrast, in the middle and downstream reaches, especially during high-flow periods, elevated river stages induced infiltration from the river into adjacent aquifers. These bidirectional exchanges highlight the dynamic nature of surface water–groundwater interactions and their dependence on river morphology, aquifer properties, hydraulic gradients, and boundary conditions.
These uncertainties also highlight the importance of balancing model complexity with data availability and process identifiability. Incorporating processes that are weakly constrained by observations or insufficiently supported by available data may increase parameter equifinality and predictive uncertainty without substantially improving model performance. Conversely, excluding processes that exert a significant influence on hydrological or water quality dynamics may lead to biased simulations and reduced process realism. Therefore, the modeling framework adopted in this study was designed to include only those processes that could be reasonably constrained by observations and were expected to have a measurable influence on system behavior.
Despite the strong calibration and testing performance, several limitations remain. The relatively short observation period (2023–2024) limits the representation of long-term hydroclimatic variability; biogeochemical processes governing nitrogen and phosphorus transformations are simplified; and the sparse groundwater monitoring network constrains subsurface testing. Similar limitations have been reported in other Vietnamese river basin studies [24], underscoring the need for extended monitoring and improved process representation. Furthermore, uncertainties in pollutant loading estimates and water quality process parameterization contribute to test errors of approximately 10–25% for several water quality constituents. Additional monitoring data and a more detailed characterization of pollution sources would help to improve predictive accuracy in future applications.
The simulated surface–subsurface exchange patterns revealed pronounced spatial variability along the Cau river. Upstream reaches, represented by the Cha station, predominantly functioned as recharge zones, whereas middle and downstream sections, particularly near Dap Cau, exhibited seasonally variable loss and gain river conditions controlled by river stage fluctuations. These results are consistent with previous studies on river–aquifer interactions in the Red River Delta and the Sai Gon–Dong Nai River system, which highlighted the critical role of groundwater discharge in sustaining dry-season baseflow and regulating river water levels [22,24]. However, the present study advances existing knowledge by directly quantifying exchange fluxes using Darcy-based leakage modules within MIKE SHE at a high spatial resolution of 30 m, enabling the detailed identification of groundwater-dependent river reaches that have not previously been documented for the Cau river basin [23,27].
Seasonal variability played an important role in controlling both the magnitude and direction of exchange fluxes. During the wet season, increased precipitation and river discharge enhanced hydraulic connectivity, resulting in stronger river-to-aquifer fluxes and a larger spatial extent of interaction zones. Conversely, during the dry season, reduced river discharge and declining groundwater levels constrained exchange processes, while prolonged low-flow conditions promoted pollutant accumulation and reduced dilution capacity. These findings highlight the importance of incorporating seasonal hydrological variability when assessing pollutant transport and water quality dynamics in river–aquifer systems.
The factors controlling groundwater–surface water interactions in the Cau river basin can be classified into three hierarchical groups. Hydraulic gradients, river–aquifer connectivity, and aquifer permeability constitute the dominant controls because they directly determine exchange fluxes and hydrological connectivity. Precipitation, river discharge, land-use characteristics, and seasonal hydrological variability act as secondary controls that regulate temporal changes in exchange intensity and pollutant loading. In contrast, hydrogeological heterogeneity and local environmental conditions function as auxiliary factors by influencing transport pathways, residence times, and uncertainty levels. The simulation results indicate that hydraulic gradients exert the strongest influence on exchange dynamics, while seasonal hydrological variability primarily controls the timing and magnitude of pollutant transport.
Hydraulic exchange and contaminant transport lag, although closely related, represent distinct processes within the groundwater–surface water system. Hydraulic exchange describes the movement of water driven by hydraulic gradients and controls the connectivity between surface water and groundwater. In contrast, contaminant transport lag reflects the delayed response of pollutant concentrations due to advection, dispersion, storage, and biogeochemical transformation processes. Consequently, changes in hydraulic conditions may occur immediately, whereas water quality responses can be delayed over longer periods. Distinguishing between these processes is important for interpreting monitoring data and assessing the long-term impacts of contaminant migration in connected surface water–groundwater systems.
Regarding water quality, the coupled MIKE SHE–MIKE 11 simulations produced systematically higher concentrations of BOD5, COD, NH4+, total nitrogen, and total phosphorus compared to stand-alone MIKE 11 results. This indicates that neglecting surface–subsurface exchange processes may lead to an underestimation of pollutant loads and residence times, particularly for organic and nutrient pollutants. This result is consistent with international studies emphasizing the importance of surface water–groundwater interactions in controlling pollutant accumulation, attenuation, and transport in river systems [13,15].
The results are also consistent with findings from other integrated modeling studies in similar river basins. Applications of MIKE SHE–MIKE 11 and SWAT–MODFLOW frameworks in Europe and North America have demonstrated that river stage fluctuations are a dominant driver of exchange fluxes and that coupled models generally produce more process-based representations of pollutant transport and retention than stand-alone approaches. These studies further highlight the importance of hydrological connectivity in regulating nutrient transport and retention. In comparison, the present study provides new insights into the application of integrated modeling under data-limited conditions in a tropical developing basin, where uncertainties in monitoring data and pollution sources remain significant. Importantly, this study provides one of the first quantitative assessments in Vietnam of organic pollutant accumulation and lateral transport within the shallow aquifer, with migration distances of up to approximately 1.5 km observed near the Dap Cau section an aspect not previously addressed in Cau river basin studies [23,24].
The coupled simulations in this study produced pollutant concentrations approximately 5–15% higher than those obtained from the stand-alone MIKE 11 simulations at several downstream sections, particularly for BOD5 and COD. Comparable increases associated with groundwater exchange processes have also been reported in integrated modeling studies in Europe and North America, where subsurface storage and delayed return flow were shown to increase pollutant residence times and nutrient retention within river–aquifer systems [13,15,17].
Despite the satisfactory calibration and testing performance, uncertainties remain in the estimation of pollutant loads and the representation of biogeochemical transformation processes within the coupled modeling framework. In particular, point-source pollutant inputs were derived from reported discharge inventories and monitoring datasets, while non-point-source loads were estimated using land use-based coefficients and simulated runoff processes. A brief sensitivity assessment indicates that simulated BOD5 and COD concentrations are especially sensitive to variations in external loading inputs and river–aquifer exchange coefficients, whereas TN and TP are additionally influenced by uncertainties in nutrient transformation and retention processes within the saturated zone. Variations of approximately ±10–15% in estimated pollutant loads resulted in corresponding changes of roughly 5–12% in simulated downstream concentrations, particularly near Dap Cau and Hoa Long, where pollutant accumulation is most pronounced. Nevertheless, the overall spatial distribution patterns and temporal trends remained generally consistent, suggesting that the coupled MIKE SHE–MIKE 11 framework is robust for basin-scale assessment despite uncertainties in input data and pollutant characterization. These findings also highlight the importance of improving continuous monitoring systems and refining pollutant source inventories to further enhance predictive reliability in future applications.
The independent testing results for water quality parameters indicate relative errors generally ranging between approximately 10% and 25%, suggesting fair to satisfactory model performance. Such levels of agreement are commonly reported in integrated water quality modeling studies because pollutant concentrations are influenced by multiple sources of uncertainty, including temporal variability in pollutant discharges, incomplete characterization of non-point source inputs, and simplifications in the representation of biogeochemical transformation processes. In the present study, the primary objective was to evaluate the influence of groundwater–surface water interactions on pollutant transport and water quality dynamics rather than to provide highly precise predictions of individual constituent concentrations. Therefore, the ability of the coupled MIKE SHE–MIKE 11–ECOLab framework to reproduce the overall spatial distribution patterns, seasonal variability, and relative changes in water quality conditions is considered more important than achieving exact agreement at individual monitoring points. The testing results demonstrate that the model is capable of representing these dominant processes and trends at the basin scale.
The lower testing performance of MIKE SHE relative to MIKE 11 highlights the inherent challenges associated with distributed groundwater modeling. Unlike river water levels, groundwater responses are controlled by complex subsurface processes that are often difficult to characterize due to limited observations of aquifer properties and groundwater fluxes. Similar limitations have been reported in previous applications of integrated groundwater–surface water models, where uncertainties in recharge estimation, hydraulic conductivity, and boundary conditions substantially influence simulation accuracy. MIKE SHE and MIKE 11 are fundamentally different modeling systems in terms of spatial dimensionality, process representation, and parameterization, with MIKE SHE being a distributed, physically based 2D/3D catchment-scale model and MIKE 11 a one-dimensional river hydrodynamic model. Therefore, differences in simulation outputs cannot be attributed solely to groundwater–surface water exchange processes, but also reflect inherent differences in model structure, spatial discretization, and input data aggregation. In this context, key groundwater parameters (e.g., saturated hydraulic conductivity, specific yield, and riverbed leakage coefficients) were largely derived from the literature and subject to limited calibration, leading to equifinality where multiple parameter sets can reproduce similar river stages while producing divergent groundwater heads and exchange fluxes, thereby increasing uncertainty in simulated subsurface processes and contaminant transport pathways. Moreover, the absence of direct validation against groundwater heads or exchange fluxes implies that subsurface dynamics are only indirectly constrained by river stage and water quality data; hence, the model outputs should be interpreted as plausible system representations rather than unique solutions, highlighting the need for a future integration of groundwater observations and formal uncertainty quantification approaches such as GLUE or Monte Carlo simulations to improve robustness and predictive reliability. Despite these uncertainties, the MIKE SHE simulations provide valuable information on groundwater storage dynamics, recharge processes, and groundwater–surface water exchanges. These processes constitute the key linkages required for coupling with MIKE 11 and ECOLab and for evaluating the influence of groundwater contributions on river water quality.
Although the testing performance at Cha station was lower than that at Dap Cau station, the model successfully captured the major hydrological trends and seasonal fluctuations observed during the study period. Consequently, the coupled MIKE SHE–MIKE 11–ECOLab framework remains suitable for analyzing groundwater–surface water interactions and associated water quality responses. However, uncertainties in hydraulic simulations may propagate into the water quality results, particularly at locations exhibiting complex flow conditions. Therefore, the simulated water quality concentrations should be interpreted primarily as indicators of system behavior and spatial–temporal patterns rather than exact predictions at individual monitoring points.
Overall, the coupled modeling framework provides a robust scientific basis for integrated water resources management in the Cau river basin by supporting the identification of critical monitoring locations, evaluation of pollution-control measures, and assessment of environmental impacts associated with land-use and water-resource development. By quantifying hydrological connectivity and pollutant transport processes, the framework enhances evidence-based decision-making for water quality management and environmental regulation. These capabilities contribute to the implementation of Vietnam’s National Water Security Strategy and support the achievement of Sustainable Development Goal 6 (Clean Water and Sanitation), particularly through improved water quality protection and the integrated management of surface water and groundwater resources.

5. Conclusions

This study developed and implemented an integrated hydrological–hydrodynamic modeling framework by coupling MIKE SHE and MIKE 11 to simulate surface–subsurface water interactions and evaluate their effects on water quality in the Cau river basin, northern Vietnam. The key findings and scientific contributions are summarized below:
(1)
A coupled MIKE SHE–MIKE 11 model was implemented for the Cau river basin and calibrated using hydrometeorological and water quality observations collected during 2023–2024 at Cha, Phuc Loc Phuong, and Dap Cau stations. The model achieved NSE values ranging from 0.55 to 0.79, indicating satisfactory simulation performance under data-limited conditions. Compared with the stand-alone MIKE 11 configuration, the coupled approach provided an improved representation of basin-scale hydrological processes and hydraulic connectivity between surface water and groundwater systems. These results suggest that integrated surface–subsurface modeling can enhance the reliability of hydrological and water quality assessments in complex river basins.
(2)
The simulations identified spatially heterogeneous river–aquifer interaction patterns along the Cau river. Upstream reaches were identified as persistent recharge zones, while middle and downstream reaches exhibited dynamically alternating losing and gaining conditions in response to seasonal flow regimes and hydraulic gradients. In particular, the Dap Cau section showed clear recharge–discharge switching that may contribute to sustaining river baseflow during dry periods. These findings provide some quantitative evidence of dynamic river–groundwater connectivity in the Cau river basin and complement previous regional assessments of hydrological exchange processes.
(3)
The coupled simulations further indicated that surface–subsurface interactions amplify BOD5, COD, NH4+, total nitrogen, and total phosphorus concentrations compared to stand-alone MIKE 11. The model results also suggest that infiltration from industrial and domestic wastewater sources may contribute to pollutant migration within shallow aquifers, with simulated lateral transport distances reaching approximately 1.5 km in some areas. These findings highlight the importance of considering groundwater exchange processes in basin-scale water quality assessments, as neglecting such interactions may underestimate pollutant persistence and transport pathways within river systems.
Although the integrated MIKE SHE–MIKE 11 model demonstrated satisfactory performance, several limitations remain. The relatively short observation period (2023–2024) limits the evaluation of long-term hydrological and water quality variability, while the simplified representation of pollutant transformation processes may not fully capture nutrient cycling dynamics. In addition, uncertainties in pollution source estimation, which were primarily derived from statistical inventories rather than continuous monitoring, may affect the spatial and temporal accuracy of simulated pollutant loads. A limitation of the present study is the moderate testing performance obtained at some monitoring stations, particularly Cha station. Future work should incorporate longer monitoring records, additional hydraulic observations, and refined boundary conditions to further improve model calibration and reduce uncertainty in both hydrodynamic and water quality simulations. The limited groundwater observation network also constrains the testing of subsurface flow and water quality processes. Nevertheless, the coupled modeling framework provides a useful basis for an integrated assessment of surface–subsurface hydrological interactions and water quality dynamics in the Cau river basin. From a practical perspective, the modeling framework may support water resources management and pollution control by identifying critical zones of river–groundwater interaction, supporting the optimization of monitoring networks, and informing targeted mitigation strategies. More broadly, this study demonstrates the applicability of integrated surface–subsurface modeling approaches for investigating hydrological connectivity and pollutant transport in rapidly urbanizing tropical river basins. Future studies should extend both temporal and spatial monitoring datasets to enhance the robustness of model calibration and testing, and to improve model performance assessment under a wider range of climate variability conditions. In addition, there is a need to improve the representation of biogeochemical processes and the characterization of pollution sources in order to strengthen predictive capabilities, supporting the assessment of climate change impacts, land-use transitions, and wastewater management scenarios.

Author Contributions

Conceptualization, T.T.D., T.H.T., D.Q.T., N.V.H. and N.H.M.; methodology, T.T.D., T.H.T., D.Q.T. and N.V.H.; software, T.T.D. and D.Q.T.; calibration and validation, T.T.D. and D.Q.T.; formal analysis, T.T.D., D.Q.T., N.V.H. and N.H.M.; investigation, T.T.D., T.H.T., D.Q.T. and N.V.H.; data curation, T.T.D., D.Q.T. and N.H.M.; writing—original draft preparation, T.T.D., T.H.T., D.Q.T. and N.V.H.; writing—review and editing, T.T.D., T.H.T., D.Q.T., N.V.H. and N.H.M.; visualization, T.H.T., D.Q.T. and N.V.H. All authors have read and agreed to the published version of the manuscript.

Funding

This paper presents the results of the Ph.D. thesis entitled “Study on hydrodynamic interactions of the aquatic environment, calculation of the Cau river’s assimilative capacity, and proposal of management solutions”. The author sincerely thanks Associate Professors Doan Quang Tri and Nguyen Van Hong for their guidance and support in completing this manuscript. This research was supported by the National Research Project under the Ministry of Science and Technology of Vietnam, titled “Research on the assessment and projection of water security in the Cau river basin, considering social equity, economic efficiency, resilience to water-related hazards, environmental sustainability, and governance capacity” (Grant Code: KC.14.06/21-30) as part of the program on scientific and technological research supporting water security and the safety of dams and reservoirs (Code: KC.14/21-30).

Institutional Review Board Statement

Not applicable.

Informed Consent Statement

Not applicable.

Data Availability Statement

The original contributions presented in this study are included in the article. Further inquiries can be directed to the corresponding author.

Conflicts of Interest

The authors declare no conflicts of interest.

References

  1. Li, B.; Yang, L.; Song, X.; Diamantopoulos, E. Identifying surface water and groundwater interactions using multiple experimental methods in the riparian zone of the polluted and disturbed Shaying River, China. Sci. Total Environ. 2023, 875, 162616. [Google Scholar] [CrossRef] [PubMed]
  2. Irvine, D.J.; Singha, K.; Kurylyk, B.L.; Briggs, M.A.; Sebastian, Y.; Tait, D.R.; Helton, A.M. Groundwater-Surface water interactions research: Past trends and future directions. J. Hydrol. 2024, 644, 132061. [Google Scholar] [CrossRef]
  3. Hayouni, W.; Pistre, S.; Zouari, K. Contaminants of emerging concern (CECs) as indicators of pollution and hydrological processes in an anthropized mediterranean water basin: Case of the Kasserine Basin (Central Tunisia). Sci. Total Environ. 2025, 984, 1799744. [Google Scholar] [CrossRef] [PubMed]
  4. Refsgaard, J.C.; Storm, B. MIKE SHE. In Computer Models of Watershed Hydrology; Singh, V.P., Ed.; Water Resources Publications: Lone Tree, CO, USA, 1995; pp. 809–846. [Google Scholar]
  5. Graham, D.N.; Butts, M.B. Flexible, integrated watershed modelling with MIKE SHE. In Watershed Models; Singh, V.P., Frevert, D.K., Eds.; CRC Press: Boca Raton, FL, USA, 2005; pp. 245–272. [Google Scholar]
  6. Harbaugh, A.W. MODFLOW-2005, U.S. Geological Survey Modular Ground-Water Model—The Groundwater Flow Process; U.S. Geological Survey Techniques and Methods 6-A16; The U.S. Geological Survey (USGS): Reston, VA, USA, 2005; p. 253. [Google Scholar]
  7. Hoffmann, J.; Leake, S.A.; Galloway, D.L.; Wilson, A.M. MODFLOW-2000 Ground-Water Model—User Guide to the Subsidence and Aquifer-System Compaction (SUB) Package; U.S. Geological Survey Open-File Report OFR03-233; The U.S. Geological Survey (USGS): Reston, VA, USA, 2003; pp. 1–39. [Google Scholar]
  8. Bizhanimanz, M.; Leconte, A.; Nuth, M. Modelling of shallow water table dynamics using conceptual and physically based integrated surface-water–groundwater hydrologic models. Hydrol. Earth Syst. Sci. 2019, 23, 2245–2260. [Google Scholar] [CrossRef]
  9. Jimenez, M.; Velásquez, N.; Jimenez, J.E.; Barco, J.; Blessent, D.; López-Sánchez, J.; Castrillón, S.C.; Valenzuela, C.; Therrien, R.; Boico, V.F.; et al. Sequential surface and subsurface flow modeling in a tropical aquifer under different rainfall scenarios. Environ. Modell. Softw. 2022, 149, 105328. [Google Scholar] [CrossRef]
  10. Zhao, H.; Zhang, J.; James, R.T.; Laing, J. Application of MIKE SHE/MIKE 11 Model to Structural BMPs in S191 Basin, Florida. J. Environ. Inf. 2012, 19, 10–19. [Google Scholar] [CrossRef]
  11. Prucha, B.; Graham, D.; Watson, M.; Avenant, M.; Esterhuyse, S.; Joubert, A.; Kemp, M.; King, J.; Le Roux, P.; Redelinghuys, N.; et al. MIKE-SHE integrated groundwater and surface water model used to simulate scenario hydrology for input to DRIFT-ARID: The Mokolo River case study. Water SA 2016, 42, 384–398. [Google Scholar] [CrossRef]
  12. Waseem, M.; Kachholz, F.; Klehr, W.; Tränckner, J. Suitability of a coupled hydrologic and hydraulic model to simulate surface water and groundwater hydrology in a typical North-Eastern Germany lowland catchment. Appl. Sci. 2020, 10, 1281. [Google Scholar] [CrossRef]
  13. Yang, Y.; Yuan, Y.; Xiong, G.; Yin, Z.; Guo, Y.; Song, J.; Zhu, X.; Wu, J.; Wang, J.; Wu, J. Patterns of nitrate load variability under surface water-groundwater interactions in agriculturally intensive valley watersheds. Water Res. 2024, 267, 122474. [Google Scholar] [CrossRef] [PubMed]
  14. Arheimer, B.; Olsson, J. Integration and Coupling of Hydrological Models with Water Quality Models: Applications in Europe; Swedish Meteorological and Hydrological Institute (SMHI): Norrköping, Sweden, 2003; pp. 1–49. [Google Scholar]
  15. Waseem, M.; Schilling, J.; Kachholz, F.; Tränckner, J. Improved Representation of flow and water quality in a North-Eastern German lowland catchment by combining low-frequency monitored data with hydrological modelling. Sustainability 2020, 12, 4812. [Google Scholar] [CrossRef]
  16. Bailey, R.T.; Tasdighi, A.; Park, S.; Tavakoli-kivi, S.; Abitew, T.; Jeong, J.; Green, C.H.M.; Worqlul, A.W. APEX-MODFLOW: A New integrated model to simulate hydrological processes in watershed systems. Environ. Modell. Softw. 2021, 143, 105093. [Google Scholar] [CrossRef]
  17. Chunn, D.; Faramarzi, M.; Smerdon, B.; Alessi, D.S. Application of an integrated SWAT–MODFLOW model to evaluate potential impacts of climate change and water withdrawals on groundwater–surface water interactions in West-Central Alberta. Water 2019, 11, 110. [Google Scholar] [CrossRef]
  18. The, T.H.; Tri, D.Q.; Tuyet, Q.T.T.; Nhat, N.V.; Duc, P.T. Research on applying MIKE 11 model to assess the quality of wastewater receiving sources from industrial parks to Cam Giang River, Hai Duong. J. Hyro-Meteorol. 2022, 744, 67–80. [Google Scholar] [CrossRef]
  19. Doan, Q.T.; Nguyen, T.M.L.; Quach, T.T.T.; Tran, A.P.; Nguyen, C.D. Assessment of water quality in coastal establishments under the impact of an industrial zone in Hai Phong, Vietnam. Phys. Chem. Earth. A/B/C 2019, 113, 100–114. [Google Scholar] [CrossRef]
  20. Doan, Q.T.; Nguyen, T.M.L.; Tran, H.T.; Kandasamy, J. Application of 1D-2D coupled modeling in water quality assessment: A case study in Ca Mau Peninsula, Vietnam. Phys. Chem. Earth. A/B/C 2019, 113, 83–99. [Google Scholar] [CrossRef]
  21. Vo, N.D.; Gourbesville, P. Application of deterministic distributed hydrological model for large catchment: A case study at Vu Gia Thu Bon catchment, Vietnam. J. Hydroinf. 2016, 18, 885–904. [Google Scholar] [CrossRef]
  22. Lee, S.K.; Dang, T.A.; Tran, T.H. Combining rainfall–runoff and hydrodynamic models for simulating flow under the impact of climate change to the lower Sai Gon-Dong Nai River basin. Paddy Water Environ. 2018, 16, 457–465. [Google Scholar] [CrossRef]
  23. Son, C.T.; Giang, N.T.H.; Thao, T.P.; Nui, N.H.; Lam, N.T.; Cong, V.H. Assessment of Cau River water quality assessment using a combination of water quality and pollution indices. J. Water Supply Res. Technol. AQUA 2020, 69, 160–172. [Google Scholar] [CrossRef]
  24. Tran, V.B.; Ishidaira, H.; Nakamura, T.; Do, T.N.; Nishida, K. Estimation of nitrogen load with multi-pollution sources using the SWAT Model: A case study in the Cau River Basin in Northern Vietnam. J. Water Environ. Technol. 2017, 15, 106–119. [Google Scholar] [CrossRef]
  25. Chinh, L.V.; Hiramatsu, K.; Harada, M.; Cuu, N.T.; Lan, T.T. Estimation of water environment capacity in the Cau River Basin, Vietnam using the Streeter–Phelps Model. J. Fac. Agric. Kyushu Univ. 2017, 62, 163–169. [Google Scholar] [CrossRef] [PubMed]
  26. Vietnamese Ministry of Natural Resources and Environment (MONRE). Vietnam National Environmental Report 2006: Status of Three Water Basin: Cau River, Nhue—Day River and Dong Nai River. 2006, p. 74. Available online: http://documents.worldbank.org/curated/en/637281468308963359/pdf/404180VN0Env0M19190001PUBLIC1optmzd.pdf (accessed on 2 May 2026).
  27. Ministry of Natural Resources and Environment (MoNRE). Report on the Assessment of Surface Water Quality in the Cau River Basin Based on Results Obtained During the Period 2010–2012; Ministry of Natural Resources and Environment: Beijing, China, 2012. [Google Scholar]
  28. Department of Environment, Ministry of Agriculture and Environment. Report on Air and Water Environmental Quality in Northern Vietnam, First Monitoring Campaign of 2024. 2024. Available online: https://vea.mae.gov.vn/quan-trac-moi-truong-dinh-ky/10707/bao-cao-chat-luong-moi-truong-khong-khi-va-nuoc-khu-vuc-mien-bac-dot-1-nam-2024?utm_source=chatgpt.com (accessed on 25 April 2024).
  29. Kelliher, F.M.; Leuning, R.; Schulze, E.D. Evaporation and canopy characteristics of coniferous forests and grasslands. Oecologia 1993, 95, 153–163. [Google Scholar] [CrossRef] [PubMed]
  30. DHI. MIKE SHE User Manual; DHI Water & Environment: Hørsholm, Denmark, 2014. [Google Scholar]
  31. DHI. MIKE_11_Short_Introduction-Tutorial; DHI Water & Environment: Hørsholm, Denmark, 2014. [Google Scholar]
Figure 1. Location of hydrometeorological stations and water quality monitoring stations in the study area.
Sustainability 18 07089 g001
Figure 2. Coupled modeling framework integrating MIKE SHE, MIKE 11, and ECOLab for simulating groundwater flow, river hydraulics, groundwater–surface water interactions, and water quality processes in the Cau river basin.
Sustainability 18 07089 g002
Figure 3. Hydraulic network diagram of the MIKE 11 model in the study area.
Sustainability 18 07089 g003
Figure 4. (a) Setup of model domain and grid structure; (b) setup of topography in the model; (c) setup of vegetation data in the model.
Sustainability 18 07089 g004
Figure 5. (a) P-2-Layer UZ soil (unsaturated flow); (b) outer boundary conditions (saturated zone).
Sustainability 18 07089 g005
Figure 6. Connection of river branches in MIKE 11 and MIKE SHE [30].
Sustainability 18 07089 g006
Figure 7. Connection between river and groundwater in MIKE 11 and MIKE SHE.
Sustainability 18 07089 g007
Figure 8. Calibration and testing results of the MIKE 11 model: (a,c) Cha station; (b,d) Dap Cau station.
Sustainability 18 07089 g008
Figure 9. Calibration and testing results of the MIKE SHE model (2023): (a,c) Cha station; (b,d) Dap Cau station.
Sustainability 18 07089 g009
Figure 10. Results of the MIKE 11 ECOLab model calibration and testing: (a,f) BOD5; (b,g) COD; (c,h) ammonium; (d,i) total nitrogen; (e,j) total phosphorus.
Sustainability 18 07089 g010
Figure 11. Results of the MIKE SHE model calibration and testing: (a,f) BOD5; (b,g) COD; (c,h) ammonium; (d,i) total nitrogen; (e,j) total phosphorus.
Sustainability 18 07089 g011
Figure 12. Water exchange between subsurface layers (m3/s).
Sustainability 18 07089 g012
Figure 13. Water level variations before and after surface–groundwater interaction: (a) Cha; (b) Dap Cau.
Sustainability 18 07089 g013
Figure 14. MIKE SHE simulation results at Cha station: (a) root-zone water level; (b) infiltration into the unsaturated zone (UZ); (c) total recharge to the saturated zone (SZ); (d) water deficit in the unsaturated zone; (e) vertical groundwater flow (z-direction); (f) groundwater–river exchange flow.
Sustainability 18 07089 g014
Figure 15. MIKE SHE simulation results at Dap Cau station: (a) root-zone water level; (b) infiltration into the unsaturated zone (UZ); (c) total recharge to the saturated zone (SZ); (d) water deficit in the unsaturated zone; (e) vertical groundwater flow (z-direction); (f) groundwater–river exchange flow.
Sustainability 18 07089 g015
Figure 16. Simulation results of BOD5 concentrations in the saturated zone.
Sustainability 18 07089 g016
Figure 17. Simulation results of COD concentrations in the saturated zone.
Sustainability 18 07089 g017
Table 1. Evaporation coefficients for different land-cover types.
ParameterPerennial CropsRiversAnnual CropsPaddy FieldsRural Residential LandNon-Agricultural LandAquaculture Areas
LAIa,b,c601.5210.80.8
RDa,b,c (m)8000200200100100100
Kca,b,c1110.411.21.2
Table 2. Key parameter settings of the MIKE SHE model for the Cau river basin.
ParameterUnitOptimal Value
Riverbed roughness—Strickler coefficient
Upper Cau riverm1/3/s18
Connecting branchm1/3/s30
Lower Cau riverm1/3/s40
Overland flow—Strickler coefficient
Alluvial soilm1/3/s25
Grey feralit soilm1/3/s18
Sandy soilm1/3/s16
Yellow-red soilm1/3/s18
Degraded grey soilm1/3/s18
Rural residential landm1/3/s25
Non-agricultural landm1/3/s22
Perennial cropsm1/3/s20
Annual cropsm1/3/s18
Wet ricem1/3/s27
Water surfacem1/3/s33
Unsaturated zone—Soil porosity
Kuz-Claym/s1.2 × 10−8
Kuz-Silty claym/s2.45 × 10−6
Kuz-Sandy loamm/s8.5 × 10−6
Kuz-Plastic claym/s2.085 × 10−4
Kuz-Sandm/s2.89 × 10−4
Saturated zone
Kh-Horizontal hydraulic conductivitym/s6.7 × 10−5
Table 3. Evaluation results of water quality model calibration errors.
NoMonitoring SitePollutant Parameters
BOD5CODAmmoniumTotal NTotal P
1Cau Tra Vuon−9%−11%−14%−19%−20%
2Cau May−14%−7%−12%−14%−23%
3Tan Phu−9%−6%−15%−20%−26%
4Cau Vat−19%−17%−4%−18%−12%
5Phuc Loc Phuong−15%−18%−17%−24%−16%
6Huong Lam−6%−21%−9%−10%−24%
7Hoa Long−17%−22%−11%−22%−17%
8Cau Thi Cau−11%−11%−8%−13%−25%
9Thong Ha−16%−12%−10%−15%−21%
10Hien Luong−18%−13%−13%−22%−18%
Table 4. Evaluation results of water quality model testing errors.
NoMonitoring SitePollutant Parameters
BOD5CODAmmoniumTotal NTotal P
1Cau Tra Vuon−14%−18%−13%4%−17%
2Cau May−25%−6%−28%−9%−14%
3Tan Phu−8%−9%−26%−10%−9%
4Cau Vat−15%−6%−28%−3%−33%
5Phuc Loc Phuong−23%−10%−7%−5%−14%
6Huong Lam−24%−14%−13%−7%−12%
7Hoa Long−13%−6%−28%−15%−20%
8Cau Thi Cau−5%−11%−15%−10%−18%
9Thong Ha−9%−13%−23%−14%−22%
10Hien Luong−7%−10%−7%−10%−20%
Table 5. Evaluation results of calibration errors for the MIKE SHE water quality model.
NoMonitoring SiteMonitoring Site
BOD5CODAmmoniumTotal NTotal P
1Cau Tra Vuon8%8%12%17%13%
2Cau May11%5%7%13%17%
3Tan Phu7%5%13%19%24%
4Cau Vat12%14%3%17%10%
5Phuc Loc Phuong10%15%16%23%13%
6Huong Lam4%18%8%6%23%
7Hoa Long11%16%9%21%14%
8Cau Thi Cau9%6%7%12%23%
9Thong Ha12%6%8%15%18%
10Hien Luong16%10%10%21%14%
Table 6. Evaluation results of testing errors for the MIKE SHE water quality model.
Monitoring SiteMonitoring Site
BOD5CODAmmoniumTotal NTotal P
Cau Tra Vuon8%14%10%4%15%
Cau May10%3%14%9%9%
Tan Phu7%4%17%10%4%
Cau Vat7%5%26%3%22%
Phuc Loc Phuong15%5%6%5%5%
Huong Lam14%8%10%6%6%
Hoa Long9%3%23%7%17%
Cau Thi Cau2%11%14%6%11%
Thong Ha5%8%18%9%19%
Hien Luong4%7%4%8%15%
Disclaimer/Publisher’s Note: The statements, opinions and data contained in all publications are solely those of the individual author(s) and contributor(s) and not of MDPI and/or the editor(s). MDPI and/or the editor(s) disclaim responsibility for any injury to people or property resulting from any ideas, methods, instructions or products referred to in the content.