Article

Operational Energy Performance of LEED-Certified Buildings: A City-Scale Benchmarking Analysis in Philadelphia

by
Sorena Vosoughkhosravi
* and
Gulbin Ozcan-Deniz
Department of Construction Management, College of Architecture, Design & Engineering, Thomas Jefferson University, 4201 Henry Ave, SEED Center, Suite 123, Philadelphia, PA 19144, USA
*
Author to whom correspondence should be addressed.
Sustainability 2026, 18(14), 7086; https://doi.org/10.3390/su18147086
Submission received: 28 May 2026 / Revised: 6 July 2026 / Accepted: 8 July 2026 / Published: 10 July 2026
(This article belongs to the Special Issue Built Environment and Sustainable Energy Efficiency)

Abstract

As one of the top contributors to global environmental impact, the building and construction sector has significant potential to mitigate resource consumption both during and after construction. The Leadership in Energy and Environmental Design (LEED) certification has formalized this mitigation process, but it remains unclear whether the operational performance of LEED-certified buildings matches their theoretical design in reducing environmental impacts and advancing sustainable development in the built environment. This study contributes to the growing body of knowledge on real-world building performance by evaluating the operational energy use of LEED-certified buildings in Philadelphia relative to their immediate urban neighbors. The methodology includes identifying buildings from the Philadelphia Large Building Energy Benchmarking dataset, along with U.S. Green Building Council (USGBC) certification records, and analyzing LEED-certified buildings in comparison with their functionally similar non-LEED buildings in proximity. The research employs a multi-dimensional analytical framework grounded in the Energy and Atmosphere (EA) credit structure of LEED. In raw city-wide terms, certified buildings used far more energy per floor area than non-certified buildings (79.4 vs. 22.7 kWh/sq ft), but this gap largely reflects differences in building function, size, and location. After structural clustering and geographically constrained matching, certified buildings still showed a higher mean energy use intensity, by roughly 56 to 59 kWh/sq ft across all neighborhood sizes (k = 3, 5, 10). However, none of these differences was statistically significant at the 95% level. This apparent gap was not uniform: it was concentrated in large, service-intensive types such as healthcare and public/cultural facilities, rather than observed across all building categories. The results therefore provide no evidence that certified buildings outperform comparable non-certified peers in operational energy use, rather than positive evidence that they underperform. By utilizing large-scale benchmarking data and comparative analytical methods, this work enhances understanding of the effectiveness of LEED-related energy interventions and supports evidence-based decision-making for policymakers, designers, contractors, and building owners seeking to improve energy performance in existing buildings.

1. Introduction and Background

Over the past two decades, the worldwide growth of the construction industry has significantly increased energy consumption, raising global environmental concerns. According to the most recent Global Status Report for Buildings and Construction, the sector now accounts for approximately 32% of global energy consumption and 34% of energy-related carbon dioxide emissions, highlighting its central role in achieving international climate mitigation goals [1]. As one of the top contributors, the construction industry has numerous opportunities to reduce resource consumption. Green rating systems, such as Leadership in Energy and Environmental Design (LEED), have supported reductions in building energy consumption by promoting performance-based design strategies and life-cycle assessment (LCA) of environmental impacts.
LEED, a widely recognized rating system, promotes high-efficiency design and effective system operation to achieve numerically proven reductions in energy consumption in buildings. The LEED Energy and Atmosphere (EA) category requires an improvement in building energy performance through optimized HVAC systems, efficient lighting, high-performance building envelopes, and advanced energy metering and monitoring [2]. USGBC states that LEED-certified buildings consume significantly less energy compared to their non-green counterparts, reporting averages of 20–25% less energy consumption. These measurable energy savings are valid when the LEED requirements for energy modeling, commissioning, and compliance with international standards such as ASHRAE 90.1 are fully met. However, the LEED-based design is not always carried over into operations.
The literature suggests that the operational performance of LEED-certified buildings may not match their theoretical design. Former studies focused on the operational performance of LEED-certified buildings to determine whether post-occupancy energy performance aligns with predicted design performance. Turner and Frankel [3] evaluated the operational performance of 121 LEED-certified buildings and found that more than 50% of the buildings exhibited energy use different from their design-stage energy models. The actual energy consumption was found to be 25% higher than the theoretical design. In a similar sense, Ribeiro et al. [4] reviewed 36 previous works selected through reliable databases. Their comparison compared the design and operational energy performances within these studies and found substantial discrepancies between the two. They highlighted that contextual and behavioral factors play a critical role in explaining why LEED buildings frequently fail to achieve their anticipated performance levels. Variations in occupant behavior, maintenance practices, climatic conditions, and control system operation introduce uncertainties that are not fully captured during modeling, leading to a systematic overestimation of energy savings. The authors clearly emphasized that LEED design compliance does not guarantee efficient energy performance and noted a gap between energy simulations and the actual operational energy performance of LEED-certified buildings.
Empirical comparisons between LEED-certified and conventional buildings have produced a body of evidence that is, at times, internally inconsistent. In an early benchmark study, Newsham et al. [5] re-analyzed measured energy data for 100 LEED-certified commercial and institutional buildings and reported that, on average, certified projects consumed 18–39% less energy per floor area than their conventional counterparts. However, between 28% and 35% of LEED buildings actually used more energy than matched non-certified peers, raising early concerns about the robustness of aggregate savings claims.
Scofield [6,7] challenged the strength of these conclusions through a series of site- and source-energy analyses. He demonstrated that when source energy and proper matching of building types were taken into account, the apparent advantage of LEED-certified offices in the U.S. commercial stock and in New York City largely disappeared, and at certain certification levels, their greenhouse gas emissions were statistically indistinguishable from those of non-certified buildings. More recent multi-city evidence has partially reconciled these conflicting findings. In another study, Scofield et al. [8] analyzed 4417 commercial office buildings across ten major U.S. cities and reported aggregate site energy savings of about 11% but only around 7% reductions in source energy and greenhouse gas emissions for LEED-certified offices, with substantial variability across cities and certification levels. Hu [9] reached a starkly different conclusion using the Washington, D.C. benchmarking dataset, reporting that LEED-certified office buildings exhibited higher site and source energy use intensity than their non-certified peers at every certification level, highlighting how comparative outcomes can vary based on dataset construction and matching strategy. Complementing these large-sample analyses, smaller climate- and use-specific studies have produced results that are similarly consistent. Oates and Sullivan [10] surveyed roughly half of Arizona’s LEED New Construction population and found considerable scatter between modeled and measured energy performance in a hot-dry climate. Also, Vosoughkhosravi et al. [11] compared a LEED-Silver residential college building with seven non-certified peers on a university campus and observed that the certified building recorded higher measured energy consumption despite reporting better occupant comfort, a discrepancy that the authors traced to its low score in the EA category.
Recent research further demonstrates the mismatch between predicted and actual energy performance in LEED-certified buildings. A comprehensive comparative assessment by Tsirovasilis et al. [12] analyzed post-occupancy outcomes across major rating systems and found that LEED-certified buildings often underperform their modeled energy expectations by 15–30% during operation. This considerable difference in results was attributed to the limitations of design-stage simulation tools, which rely on idealized assumptions about occupancy schedules, plug loads, and system operation that rarely reflect real conditions. Additionally, the study emphasized that certification frameworks focus on compliance during the design and construction phases, while insufficient attention is given to continuous performance verification after occupancy. As a result, discrepancies between predicted and measured energy consumption persist, undermining the credibility of simulation-based performance claims and highlighting the need for dynamic, data-driven operational assessment approaches. Other studies supported these results by highlighting the uncertainties in occupant behavior, modeling assumptions, and environmental inputs. For example, Chiang and Calautit [13] showed that conventional simulation models can deviate by up to 45% from measured energy use due to their reliance on deterministic assumptions, particularly ignoring dynamic occupant interactions such as window operation and adaptive comfort responses. Similarly, Esmaeilzadeh and Hamdy [14] created a prediction framework to quantify variations in occupant-controlled parameters. They focused on thermostat setpoints, occupancy schedules, and occupancy activity levels, which caused energy performance deviations of up to 50%, highlighting the sensitivity of simulation outcomes in relation to the user behavior. Complementing these findings, Sood et al. [15] emphasized that simplified occupancy representations in simulation tools are a major source of error, as real-world occupancy patterns are highly variable and can significantly alter energy demand across building zones, thereby amplifying the gap between estimated and actual consumption. Collectively, these studies indicate that the energy performance gap is not merely a result of technical inefficiencies but rather a systemic issue rooted in oversimplified modeling practices, insufficient integration of occupant dynamics, and limited incorporation of real-world variability, all of which challenge the reliability of design-stage predictions in LEED-certified buildings.
Beyond head-to-head energy comparisons, the literature has increasingly focused on characterizing the mechanisms that drive the divergence between design intent and operational reality. Menezes et al. [16] used post-occupancy evaluation data from non-domestic buildings to demonstrate that a substantial portion of the so-called performance gap is rooted in unrealistic assumptions about occupancy behavior and facilities management embedded in design-stage energy models, and showed that combining monitoring data with predictive modeling could bring estimates to within 3% of measured electricity consumption. Building on this argument, de Wilde [17] formalized the gap between predicted and measured energy performance as a multi-causal phenomenon rooted in modeling simplifications, construction quality, and operational practices, and proposed a structured investigative framework that has since shaped much of the field. Wu et al. [18] extended this perspective by integrating system dynamics with energy simulation in a Chinese green office building and showed that managerial and behavioral factors propagate across the design, construction, and operation phases, amplifying performance gaps that purely technical models fail to capture.
A complementary line of research has examined whether the broader expected benefits of certification, such as improved indoor environmental quality (IEQ) and occupant satisfaction, are reliably achieved in practice. Altomonte and Schiavon [19] analyzed more than 21,000 occupant responses from 144 office buildings, and found no statistically significant difference in overall satisfaction between LEED-certified and non-certified facilities, with users of certified offices reporting higher satisfaction with air quality but lower satisfaction with the amount of light. Pastore and Andersen [20] reported similar limitations in four green buildings in Switzerland, where measured environmental factors largely complied with norm prescriptions. However, occupant satisfaction repeatedly fell below the conventional 80% threshold. Synthesizing across these and many other case studies, Geng et al. [21] reviewed 106 post-occupancy studies of green buildings worldwide and concluded that, although certified buildings generally outperform conventional stock, a significant gap persists between designed and operational energy use, with outcomes that vary widely across climates and rating systems. At the level of the rating systems themselves, comparative analyses have highlighted important structural differences in how environmental performance is assessed. Asdrubali et al. [22] compared LEED with the Italian ITACA protocol on two residential buildings and identified meaningful divergences in how each scheme weighted energy performance, indoor comfort, and site-related criteria, while Awadh [23] extended this critique across LEED, BREEAM, GSAS, and Estidama, arguing that differences in credit weighting and regional emphasis can lead to substantially different sustainability outcomes for otherwise comparable projects. Parallel to these comparative critiques, data-driven and city-scale approaches to building energy performance have matured rapidly; Kontokosta and Tull [24] demonstrated that machine-learning models trained on building energy disclosure data can credibly predict energy use intensity across an entire urban building stock, providing a scalable foundation for evidence-based policy evaluation and post-certification verification. Taken together, the empirical heterogeneity of reported LEED outcomes, the persistence of the design-operation gap, and the increasing availability of urban-scale benchmarking data underscore the need for studies that carefully pair matched comparison strategies with the disaggregated structure of LEED credit categories in dense urban contexts.
Despite the expanding literature on the green building performance gap, empirical comparisons between certified and conventional structures remain internally inconsistent and mixed. Previous large-sample studies often rely on aggregate city-wide datasets or broad certification levels without concurrently isolating specific physical building attributes and localized neighborhood confounding factors. This methodological limitation introduces considerable uncertainty, as operational energy performance is highly sensitive to variations in occupant behavior, location, building archetypes, and functional demands. Moreover, treating green certification as a binary status or relying solely on aggregate tiers creates an analytical blind spot regarding the internal credit allocations that dictate actual efficiency. Furthermore, although some studies have focused on large dynamic cities, like New York City and Washington DC, there is a lack of large-scale analysis in other U.S. major cities. Consequently, there remains a distinct lack of research that utilizes a disaggregated credit structure to evaluate whether design-stage points correspond to actual operational outcomes, especially in large cities.
To address these limitations, this study develops a multi-dimensional, data-driven analytical framework designed to adjust for structural and spatial variables, thereby characterizing the operational energy performance associated with green certification once these confounders are taken into account. Although prior work has applied matching, clustering, and municipal disclosure data to building energy questions, these techniques have generally been deployed in isolation rather than as an integrated comparative design. Analyses of certified buildings using city benchmarking data have typically matched on broad building type or certification tier at the stock level [6,7,8,9], which controls for function but not for the localized neighborhood conditions that shape measured energy demand. Data-driven studies of urban building stocks, in turn, have used machine-learning models to predict energy use intensity across an entire city [24] or have constructed archetype clusters for simulation and policy evaluation [25,26], but neither approach produces a matched certified versus non-certified contrast at the individual-building level. The present study differs in combining these elements into a single sequential pipeline: feature screening identifies the structural drivers of energy use, K-means clustering establishes functional archetypes, a geographically constrained nearest-neighbor procedure restricts each comparison to local within-cluster peers, and a disaggregated correlation analysis links EA credit achievement to measured outcomes. The integration of clustering-based structural filtering with a distance-capped local matching framework, combined with credit-level performance analysis, provides a structured approach for examining building performance across a major U.S. city beyond the traditionally examined contexts of New York City and Washington, D.C.
The novelty of this approach lies in its sequential matching architecture. First, a dual-model feature engineering approach utilizing Random Forest and Lasso Regression identifies the primary independent building attributes that consistently drive urban energy demand. Second, a K-Means clustering algorithm segments the building stock into distinct structural cohorts based on these identified drivers, establishing uniform building archetypes to eliminate physical confounding effects. Third, a geographically constrained K-nearest neighbor matching procedure restricts comparisons to local control structures within a strict 1000 m caliper distance, insulating the performance evaluation from neighborhood-level heterogeneity. Finally, this framework moves beyond aggregate tiers by incorporating a normalized correlation analysis of specific scorecard credits, directly evaluating the predictive capacity of EA category achievements against measured utility outcomes.
Using this framework, the objective of this study is to evaluate the city-scale operational energy consumption and energy use intensity of LEED-certified buildings relative to functionally and geographically comparable peers in Philadelphia, Pennsylvania (PA). Philadelphia provides an especially suitable urban laboratory due to its highly heterogeneous building stock and its public release of comprehensive, building-level energy benchmarking data. By implementing rigorous structural and local-matching controls, this research examines whether certification-driven design strategies translate into measurable energy reductions in dense urban environments. Ultimately, this work clarifies the systemic performance gap observed in green building literature, providing empirical, evidence-based insights for policymakers and practitioners as contemporary certification frameworks, such as the newly introduced LEED v5 standards, shift toward operational accountability and continuous performance monitoring.
It is important to delineate the scope of this contribution. The present study evaluates measured operational energy use in detail, and does not investigate embodied carbon, construction and material efficiency, water use, waste reduction, indoor environmental quality, life-cycle impacts, or circular construction practices in detail. These dimensions constitute equally important components of green performance and are frequently assessed in the sustainable construction literature through measures such as material efficiency, recycled content, durability, and permeability [27]. Accordingly, the findings reported here should be interpreted as evidence concerning operational energy benchmarking.

2. Materials and Methods

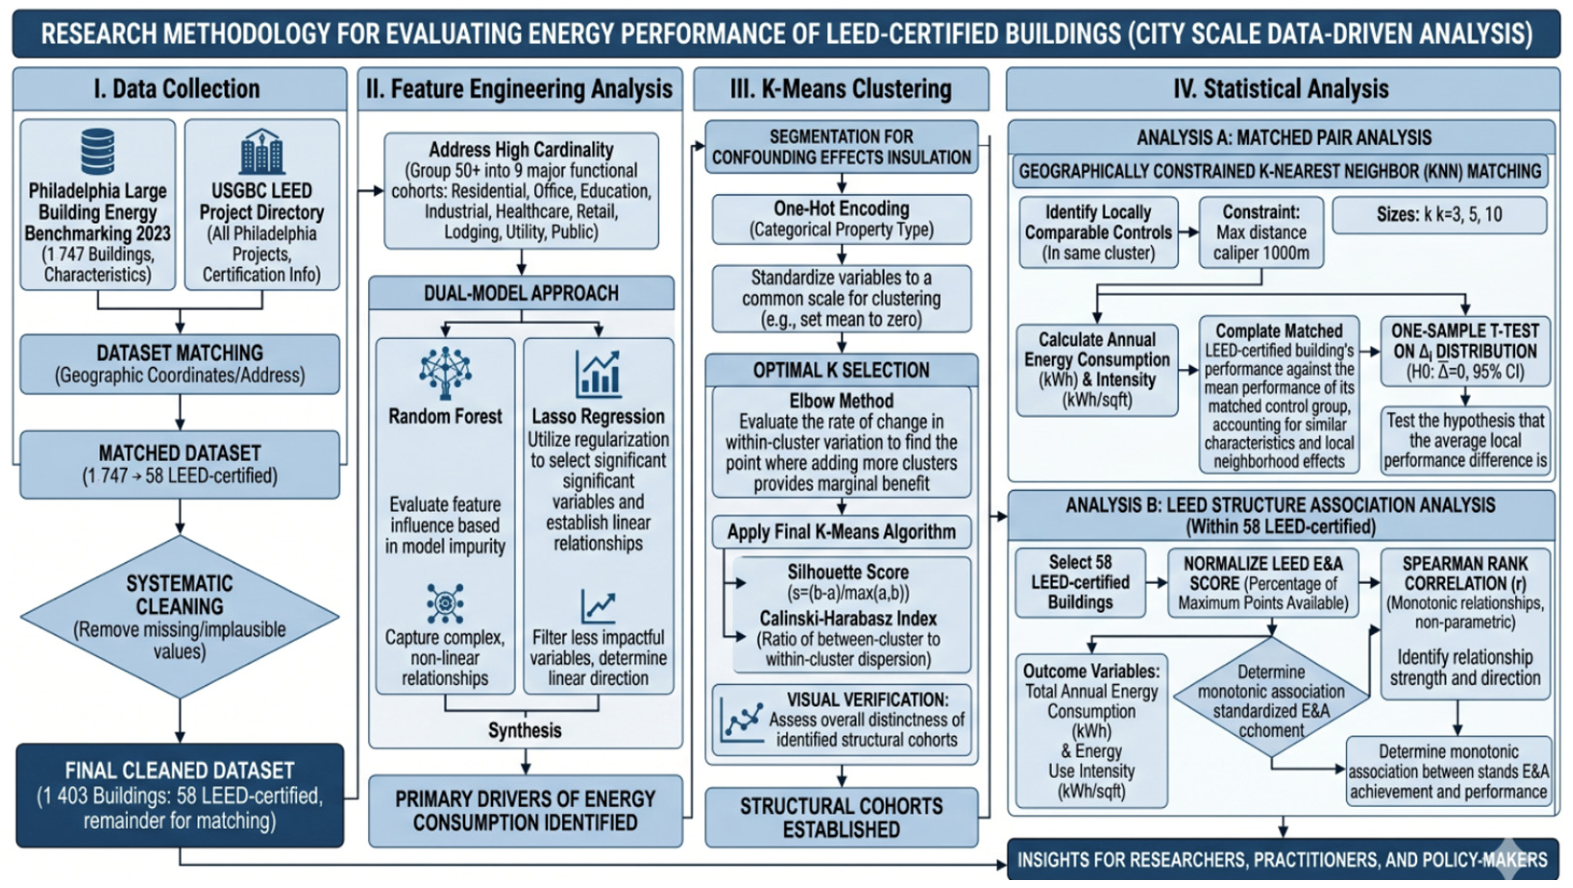
This study evaluates the energy performance of LEED-certified buildings at the city scale through a data-driven analysis. Figure 1 shows the research methodology in detail. Initially, it identifies the most impactful variables affecting energy consumption using feature engineering and machine learning modeling. Next, the study clusters the buildings considering the impactful variables. Finally, it evaluates the energy consumption of LEED-certified buildings using statistical analysis and provides useful insights for researchers, practitioners, and policymakers.

2.1. Data Collection

To conduct this analysis, this study focuses on the city of Philadelphia, PA. Philadelphia provides an especially suitable context for evaluating LEED performance at the city scale because it contains a highly heterogeneous building stock, a wide range of commercial and multifamily property types, and substantial variation in neighborhood socioeconomic and urban-form characteristics. The city’s dense urban core, mixed-use districts, and diverse residential and industrial areas create a natural laboratory for examining how certified buildings perform relative to their non-certified counterparts under different contextual conditions. Moreover, Philadelphia is one of the few U.S. cities that publicly releases comprehensive, building-level energy benchmarking data, enabling empirical analysis at a scale that is rarely possible elsewhere. In this regard, two primary datasets are assembled to construct the analytical sample for this study. The first source is the Philadelphia Large Building Energy Benchmarking 2023 dataset, from which annual operational characteristics were obtained for 1747 large commercial and multifamily buildings subject to the city’s benchmarking requirements. Reported variables included site energy use, water consumption, gross floor area, primary building type, construction year, full street address, and geographical location [28]. These records provide the foundational operational and physical attributes used in the analysis. The second source is the U.S. Green Building Council (USGBC) LEED Project Directory, from which all LEED-certified projects located within the City of Philadelphia can be extracted [29]. This dataset contains information about LEED-certified buildings, including certification level, size, full street address, and LEED scorecards.
The first step in this analysis is to match these two datasets and identify detailed information on LEED-certified buildings, including their annual energy consumption. In this regard, geographic coordinate information is used to match LEED projects to buildings in the first benchmarking dataset. Through this spatial and textual matching process, 58 buildings were identified as both benchmarked and LEED-certified. For these buildings, certification level and category-specific LEED scores (e.g., EA) were incorporated. Both datasets underwent a systematic, multi-stage cleaning and reconciliation process prior to analysis. In the first stage, the raw benchmarking records were screened for completeness and plausibility across the variables required for the analysis, namely annual energy consumption, gross floor area, construction year, and geographic coordinates. Records lacking valid geographic coordinates, and therefore not assignable to a spatial location, were removed, as spatial position is required for both the neighborhood-level matching procedure and the merge with the certification directory. Records reporting implausible construction years, such as placeholder or out-of-range values, were likewise excluded. Energy values were retained only where at least one valid metered fuel stream (electricity, natural gas, or fuel oil) was reported, and the three fuel streams were summed to a common basis after converting each to kilowatt-hours. This first stage reduced the initial pool of 1747 benchmarked buildings to 1403 records suitable for analysis.
Because gross floor area exerts a dominant influence on both total energy use and the derivation of energy use intensity, missing or zero floor-area entries were not discarded but were instead recovered wherever possible from external authoritative sources, including municipal property records, publicly available building listings, and mapped building footprints. This recovery step preserved buildings that would otherwise have been lost to listwise deletion and avoided systematically excluding structures whose benchmarking submissions were incomplete in this single field. After reconciliation, the analytical sample comprised 1403 buildings, including the 58 LEED-certified buildings and a large pool of non-LEED buildings used for the subsequent clustering and matching procedures. Property-type classifications were consolidated from the original benchmarking categories into broader functional groups, as described in Section 2.2, and each retained building was assigned to a structural cluster as described in Section 2.3. This curated dataset served as the basis for all analytical steps described in the following sections.

2.2. Feature Engineering Analysis

After carefully integrating, cleaning, and creating the new dataset, the next stage of the analysis focuses on quantifying the influence of various building characteristics on total energy consumption. Building energy demand is a complex phenomenon driven by a combination of physical, functional, and spatial factors. LEED encourages improvements across different parts of buildings, including energy infrastructure (e.g., HVAC systems, insulation levels, etc.). However, variables beyond energy infrastructure can affect energy consumption, and they are outside the scope of LEED, such as building size. It should be noted that the building-level attributes available in the benchmarking disclosure describe whole-building operational and physical characteristics rather than component-level envelope properties. Direct measures of envelope thermal resistance, wall and roof assembly U-values, and the optical properties of glazing—each of which influences the heat-transfer behavior targeted by the EA category—are not reported in the publicly released dataset and therefore cannot be incorporated as explicit predictors. The analysis consequently treats energy performance at the whole-building operational scale, where the combined effect of envelope, glazing, and mechanical systems is expressed through metered consumption, rather than decomposing demand into individual thermal-transfer pathways. The influence of these component-level characteristics is thus captured only implicitly, through measured energy use and through the structural attributes used to define comparable building archetypes.
To consider the specific impact of LEED certification on building energy consumption and to make a fair comparison between the energy consumption of LEED-certified and non-LEED-certified buildings, it is important to isolate the impact of these variables on energy consumption. To this end, we must first establish which variables, such as building size, age, etc., can significantly impact energy use. A substantial body of research addressing this question draws on the concept of building energy archetypes. Building archetypes are simplified, representative models that cluster buildings with similar characteristics to enable large-scale analysis, simulation, and policy evaluation. Archetype frameworks identify the building attributes that most consistently drive variation in energy demand. In these studies, building characteristics play a central role, with variables such as building age (reflecting construction standards and retrofits), building size (affecting total and intensity-based energy use), building type (which shapes occupancy and operational patterns), and geometric features such as shape or compactness (influencing heat loss and gain) repeatedly shown to be among the most influential determinants of energy consumption (refs. [25,26,30]). Because archetype research clusters buildings with similar characteristics and isolates the structural and operational features that most strongly influence energy use, it provides a clear foundation for identifying which variables must be controlled for when evaluating the independent effect of LEED certification. In other words, the same characteristics that define archetypes are precisely the characteristics that must be accounted for to ensure that differences in energy consumption between LEED and non-LEED buildings are not simply the result of underlying building attributes.
The dataset utilized for this study contains a wide array of building-level metrics. The dependent variable, total energy consumption, is calculated by aggregating electricity, natural gas, and fuel oil usage, all converted to a common unit of kilowatt-hours (kWh). The available building characteristics as independent variables are summarized in Table 1.
Total energy consumption is selected as the primary dependent variable for feature identification because the objective of this stage is to define structural archetypes for clustering, a task in which the absolute scale of a building is itself a defining characteristic. It is recognized, however, that total energy consumption reflects energy load rather than energy efficiency, and that floor area is therefore expected to exert a strong influence by construction. To confirm that the identified drivers are not solely artifacts of this load–size relationship, the feature importance analysis is repeated using intensity- and carbon-based dependent variables.
Archetype literature suggests that the available building characteristics in our dataset might have potential impacts on building energy consumption. To confirm this impact and assess the importance of these variables, a dual-model feature engineering approach is employed. This allows for capturing both the complex, non-linear relationships often found in urban systems and the direct, linear magnitudes of specific attributes. However, to implement this approach and assess the impact of the variables in Table 1 on energy consumption, a significant challenge is the high cardinality of property types; our dataset initially contained over 50 distinct functional classifications. To prevent model overfitting and to ensure statistical significance, a grouping strategy is implemented. Functional types with similar energy intensity profiles, such as grouping various types of medical clinics and laboratories into a “Healthcare” category, are consolidated into broader functional cohorts. This process reduces noise while preserving the fundamental relationship between a building’s purpose and its energy demand. As a result, property types are categorized into 9 major groups of Residential, Office, Education, Industrial, Healthcare, Retail, Lodging, Utility, and Public. After this data preparation step, the approach is ready to be implemented.
The first method utilizes Random Forest, an ensemble machine learning algorithm that constructs a multitude of decision trees during training. In the context of building energy, Random Forest is particularly valuable because energy consumption is rarely linear; for instance, the relationship between building age and energy use may be punctuated by specific historical changes in building codes or insulation standards. The importance of a variable in this model is determined by the Mean Decrease in Impurity. As the algorithm splits the data into branches, it calculates how much each variable contributes to reducing the overall variance (impurity) of the predicted energy values. A variable is considered “important” if it consistently appears at the top of the decision trees across the entire forest. The importance score for a feature Xj is calculated as the sum of the impurity decreases across all nodes m where Xj was used to split the data, as shown in (1), where p(m) is the proportion of samples reaching node m and Δ i is the decrease in impurity.
I X j = T m T , v s m = X j p m Δ i s m , m
While Random Forest identifies which variables are influential, it does not explicitly provide the direction or linear magnitude of that influence. To complement this, Lasso Regression is utilized.
Lasso is a linear model that includes a regularization penalty (l1 penalty), which prevents overfitting by shrinking the coefficients of less impactful variables to zero. This method is essential for feature selection because it effectively filters out variables that do not contribute significantly to the model’s predictive power. The Lasso objective function minimizes (2):
i = 1 n y i β 0 j = 1 p β j x i j 2 + λ j = 1 p β j
In this formula, the first part represents the standard residual sum of squares, while the second part λ j = 1 p β j is the penalty term. The indicator of importance in this model is the absolute value of the standardized coefficient β . A larger coefficient indicates a stronger linear impact on energy consumption, while a positive or negative sign tells us whether those variable increases or decreases the building’s energy footprint.
The two methods are expected to produce partially divergent rankings, and this divergence is methodologically informative rather than contradictory. Lasso regression is a linear estimator with an L1 penalty that, in the presence of correlated or nonlinearly related predictors, tends to retain a single representative variable while shrinking the coefficients of the remainder toward zero. Because geographic coordinates are mutually correlated and are also associated with property type, and because construction year relates to energy use nonlinearly through successive eras of building codes and retrofit standards, a linear penalty may reduce such predictors to zero even when they carry genuine explanatory information. By contrast, Random Forest partitions the data through nonlinear thresholds and interaction effects and distributes importance according to impurity reduction, allowing it to register contributions that a linear penalty tends to suppress. The two methods are therefore treated as complementary rather than competing: a variable identified as important by both is regarded as a robust and approximately linear driver, whereas a variable to which Random Forest assigns substantial importance but Lasso does not is interpreted as exerting a real but nonlinear or interaction-dependent influence. Under this decision rule, predictors that are influential in either model are eligible to inform the subsequent analysis, with variables describing structural attributes retained for the clustering procedure in Section 2.3 and variables describing spatial position reserved for the neighborhood-level matching procedure in Section 2.4, where proximity is treated directly rather than as a clustering dimension. This separation reflects the distinction between the influence of a variable and its appropriate analytical role. The feature-screening step establishes that spatial position is associated with energy demand, but a high importance score does not by itself imply that a variable should serve as a clustering dimension. Clustering is used here to define structural archetypes, cohorts that share physical and functional characteristics such as size, age, and function so that certified and non-certified buildings can later be compared within structurally homogeneous groups. Incorporating latitude and longitude as clustering inputs would embed geographic distance into the definition of these archetypes, producing cohorts defined jointly by what a building is and where it is located. This would conflate structural similarity with spatial proximity and would partially pre-empt the dedicated neighborhood-level comparison that follows, in which spatial context is the specific quantity of interest. Therefore, spatial position is deliberately withheld from the clustering stage and instead carried forward to the matching procedure, where proximity can be treated explicitly and on its own terms rather than as one undifferentiated component of structural distance. In this design, the structural and spatial dimensions of comparability are handled sequentially and kept analytically distinct, rather than being merged into a single similarity metric. By synthesizing the results of these two methods, we can confidently identify the primary drivers of energy consumption in our dataset, providing a rigorous justification for the variables used in our subsequent matching and clustering procedures.
The feature-ranking procedures are applied in an exploratory capacity to identify the variables most strongly associated with energy use, rather than as deployed predictive models, and the reported importance values are therefore interpreted as relative rankings rather than as calibrated predictions. The Random Forest is implemented with 300 estimators and a fixed random seed, with predictors standardized prior to fitting, and the Lasso regression is applied to standardized predictors using an L1 penalty selected by cross-validation. To assess the stability of the resulting feature rankings, the Random Forest is refitted across ten random seeds; the importance attributed to the dominant predictor, total floor area, varies by less than one percentage point across seeds (mean 43.4%, standard deviation 0.6%), indicating that the variable ordering is robust to stochastic variation in model fitting. A five-fold cross-validation of the Random Forest yields a modest coefficient of determination, consistent with the use of these models for variable identification rather than precise energy prediction.
The credibility of the feature-selection step is further supported by its grounding in prior empirical work. As established above, the building-archetype literature consistently identifies a specific set of structural attributes as the dominant determinants of energy demand [25,26,30]; the present procedure is therefore evaluated not only by its internal stability across random seeds but by whether the attributes it elevates are consistent with these independently established drivers. Convergence between the two methods, where Random Forest and Lasso are expected to corroborate one another on the most strongly contributing predictors provides an additional internal consistency check. Because these models are applied for variable identification rather than calibrated prediction, their adequacy is assessed through this combination of stability and concordance with established findings rather than through out-of-sample predictive accuracy.

2.3. K-Means Clustering

Following the identification of the primary drivers of energy consumption in the preceding analysis, a multidimensional clustering procedure is implemented. The main goal of this stage is to segment the building stock into distinct structural cohorts. By grouping buildings that share structurally similar physical and functional characteristics, the subsequent comparison between LEED-certified and non-LEED structures is insulated from much of the confounding effect of those variables, thereby supporting a more equitable performance evaluation. It is acknowledged that cluster membership reflects approximate similarity within the selected feature space rather than exact equivalence across all building attributes.
K-Means clustering is adopted for this segmentation because it offers an interpretable and computationally efficient partitioning of the building stock and integrates naturally with the standardized, primarily continuous feature space employed here. It is recognized that alternative approaches, including k-prototypes, hierarchical clustering with Gower distance, coarsened exact matching, exact matching by property type, and propensity score matching, are also suited to datasets that combine continuous and categorical attributes. K-Means is selected over these alternatives because the analytical objective at this stage is the construction of broad structural archetypes rather than precise one-to-one statistical matching, a function that is subsequently performed by the geographically constrained nearest-neighbor procedure described in Section 2.4. Moreover, because the resulting clusters proved to be highly homogeneous by functional type, with several clusters composed almost entirely of a single property type, the partition effectively approximates exact matching on building function while simultaneously retaining continuous structural information on size and age. The adequacy of the resulting partition is assessed quantitatively through internal validation metrics and qualitatively through visual inspection, as described below. The broader challenge of grouping a heterogeneous urban building stock into comparable structural categories has been addressed through a range of data-driven and deep-learning approaches in recent city-scale studies [31], and related work on multisensor data integration in the built environment illustrates the wider methodological context of structural classification [32]. The broader methodological emphasis on transparent, interpretable model-based assessment and on controlled, benchmark-style comparison in civil engineering systems is further reflected in recent studies employing explainable feature-importance analysis [33] and systematically controlled experimental benchmarking [34].
To prepare the dataset for algorithmic clustering, the categorical property types are first transformed into numerical representations through one-hot encoding. This process generates binary indicator variables for each broad functional category, allowing the functional purpose of a structure to be processed as a mathematical distance. Because the remaining structural features (like year built and total floor area) operate on vastly different numerical scales, a standardization procedure is applied. Without this step, the large magnitudes associated with square footage would disproportionately influence the clustering results, effectively silencing the impact of building age. Each feature is transformed to a mean of zero and a standard deviation of one using the following Z-score normalization, shown in (3), where x represents the raw value μ is the mean of the feature, and σ is the standard deviation.
z = x μ σ
The selection of the optimal number of clusters, k, is a critical decision to balance granularity with statistical power. To determine this value, the elbow method is utilized. In this approach, a series of K-Means models is executed with the number of clusters ranging from 2 to 15. For each iteration, the within-cluster sum of squares (WCSS), also known as inertia, is calculated. Inertia measures the sum of squared distances between each data point and its assigned cluster centroid, defined by the objective function shown in (4), where k is the number of clusters, Cj is the jth cluster, and μ j is the centroid of that cluster.
J = j = 1 k x C j | x μ j | 2
The optimal k is identified at the “elbow” point of the resulting curve, where the rate of decrease in inertia significantly diminishes, indicating that adding further clusters provides marginal descriptive benefit. Because the elbow criterion is partly visual and can admit a range of plausible values, the number of clusters is not determined by inertia alone. The candidate partition is additionally evaluated against internal validation indices, namely the Silhouette Score and the Calinski–Harabasz Index; against its stability under repeated initialization with different random seeds; and, decisively, against the functional interpretability of the resulting clusters. Because the structural features include building function, a partition is regarded as preferable when its clusters correspond to coherent, single-function building archetypes rather than to statistically separable but functionally mixed groupings. The selected number of clusters is therefore the value at which the inertia curve stabilizes and the resulting partition yields the most functionally homogeneous and operationally interpretable archetypes, since these archetypes form the basis for the matched comparison and must be meaningful as building categories, not merely as numerical clusters. The specific validation values and the composition of the resulting clusters are reported in Section 3.1.
Once the optimal k is established, the final K-Means algorithm is applied to assign every building in the dataset to a specific structural cluster. The clustering is performed with standardized features, a fixed random seed, and ten centroid initializations to mitigate sensitivity to starting conditions. To verify that the resulting partition is not an artifact of a particular random initialization, the K-Means procedure is repeated across ten random seeds. The importance of reporting validation structure, parameter settings, and sensitivity analyses when data-driven models inform engineering conclusions has been emphasized in recent computational modeling studies [35]. To ensure the mathematical integrity and distinctness of these groups, two rigorous validation metrics are computed: the Silhouette Score and the Calinski-Harabasz Index. The Silhouette Score evaluates how similar an object is to its own cluster compared to other clusters. It is calculated for each point according to (5), where a is the average distance to other points in the same cluster and b is the average distance to points in the nearest neighboring cluster.
s = b a m a x a , b
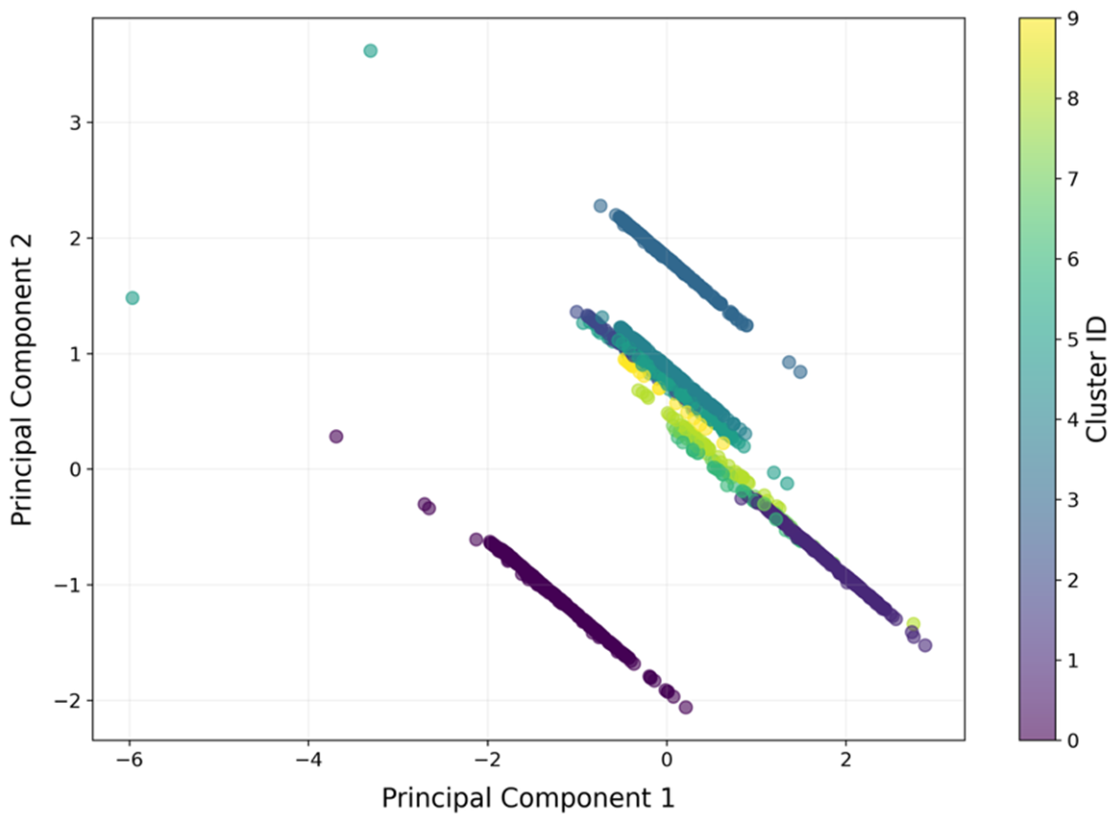
A high score confirms that the buildings are well-matched to their structural peers. Simultaneously, the Calinski-Harabasz Index is used to assess the ratio of between-cluster dispersion to within-cluster dispersion, providing further evidence of cluster separation. Given that clustering occurs in a high-dimensional space defined by age, size, and multiple property categories, a Principal Component Analysis (PCA) is performed for visualization. PCA reduces the complex feature set into two principal components that capture the maximum variance in the data. This projection allows the structural separation of the cohorts to be visually verified in a two-dimensional plane, providing a final qualitative proof that the algorithm has successfully identified distinct building archetypes within Philadelphia’s urban fabric. By completing this structural segmentation, a refined analytical framework is established, enabling precise matching of LEED-certified projects with their most relevant non-LEED counterparts.

2.4. Statistical Analysis

The next step in the analysis focuses on comparing the energy consumption of LEED-certified buildings with that of similar non-LEED buildings. In this regard, first, each LEED-certified building is compared with non-LEED buildings in its cluster, as described in Section 2.3. The reason is to conduct a fairer, more accurate comparison between the energy consumption of buildings with the same characteristics. However, comparison solely based on similar characteristics might not be sufficient; the neighborhood-level effect also needs to be considered. Thus, to isolate building-level performance differences from broader neighborhood effects, a geographically constrained K-nearest neighbor (KNN) matching procedure is implemented. The objective of this step is the construction of locally comparable control groups for each LEED-certified building. Because resource consumption and transit access are strongly shaped by spatial context, comparisons between LEED and non-LEED buildings across the entire city would confound certification effects with neighborhood heterogeneity. Spatial matching is therefore employed as a principled approach to restrict comparisons to buildings that share similar locational environments [36,37]. For each LEED-certified building i , the k geographically closest non-LEED buildings that are in their cluster from the previous section analysis are identified using great-circle (haversine) distance calculated from latitude and longitude coordinates. Let d i j denote the haversine distance between building i and candidate control building j . Distances are computed in (6), where ϕ and λ represent latitude and longitude in radians and R denotes the Earth’s radius. For each treated building, the k non-LEED buildings with the smallest d i j are selected as candidate controls.
d i j = 2 R a r c s i n ( S i n 2 ϕ i ϕ j 2 + cos ϕ i cos ϕ j s i n 2 λ i λ j 2
To ensure that matches reflect meaningful neighborhood similarity rather than distant parts of the city, a maximum distance constraint (caliper) of 1000 m is imposed. This caliper is intended to reduce, rather than fully eliminate, neighborhood-level heterogeneity, since spatial proximity constrains but does not completely equalize the local environmental conditions that influence energy demand. This radius corresponds to established spatial scales in urban research. Distances near 1000 m approximate a ten- to twenty-minute walking catchment and are frequently employed in studies of transit accessibility and neighborhood effects [38,39]. Additionally, up to three neighborhood sizes, k = 3 , 5 , 10 , are evaluated. Smaller values of k preserve close spatial comparability but may increase variance, whereas larger k values improve stability of control means at the cost of slightly broader geographic inclusion. Sensitivity testing across multiple k values are recommended in nearest-neighbor matching to evaluate robustness to specification choices [40]. A LEED building is compared to up to k non-LEED buildings within the specified caliper distance.
To ensure transparency of the matching procedure, diagnostic statistics are computed for each neighborhood size. Of the 58 LEED-certified buildings, 53 have at least one non-LEED structural peer within the 1000 m caliper and are therefore retained for the matched comparison; the remaining 5 buildings, for which no same-cluster control falls within the caliper, are excluded from the matched analysis. Because matching is performed in a single direction, in which each LEED-certified building searches for its non-LEED peers, exclusion can occur only on the certified side when no qualifying control exists within the caliper. The number of unique non-LEED controls employed increases with k, from 115 at k = 3 to 160 at k = 5 and 225 at k = 10, and a portion of these controls serves as a comparator for more than one certified building, yielding reuse ratios of 1.30, 1.45, and 1.80, respectively. Matched distances remain modest at every neighborhood size, with median values of 227 m, 268 m, and 348 m for k = 3, 5, and 10, confirming that comparisons are drawn from buildings in close spatial proximity. At k = 10, sparsely populated clusters occasionally contain fewer than ten qualifying peers, such that the mean number of matched neighbors per certified building is 7.62 rather than the nominal target of ten. These diagnostics are summarized in Table 2.
For each building, annual energy consumption (kWh) and annual energy intensity (kWh/sq ft) are calculated based on the building’s size. Subsequently, for each LEED building i , and for each outcome variable Y (total energy use or energy intensity), a matched local difference is calculated in (7), where N k ( i ) denotes the set of k nearest non-LEED neighbors within the caliper distance.
Δ i = Y i L E E D 1 k j j N k i Y j C O N T R O L
The average of these differences across all eligible LEED buildings provides an estimate of the mean local difference in outcomes between certified and matched non-certified buildings in (8).
Δ ¯ = 1 N i = 1 N Δ i
The null hypothesis H 0 : Δ ¯ = 0 is tested using a one-sample t-test on the distribution of Δ i . Confidence interval (95%) is constructed around Δ ¯ to assess statistical precision. This approach treats each LEED building as its own matched comparison unit, thereby reducing—though not eliminating—bias from neighborhood-level confounding and enabling inference on average within-area differences in measured energy use rather than on a causal effect of certification.
To assess whether the matching procedure produces credible counterfactual groups, covariate balance is evaluated before and after matching using standardized mean differences (SMD). Before matching, LEED-certified buildings differ from the full non-LEED pool most notably in geographic position and scale. After comparisons are restricted to same-cluster peers within the caliper, balance improves across all covariates, with the most pronounced improvement observed for geographic location, where the latitude SMD declines from 0.62 to 0.10. Balance improved markedly for floor area (SMD reduced from 0.56 to 0.20) and for geographic location, while residual imbalance remained for construction year (SMD ≈ 0.43), indicating that certified buildings in this sample tended to be somewhat newer than even their matched controls. This residual difference is acknowledged as a limitation and is revisited in the discussion of operational confounders. The full balance diagnostics are reported in Table 3.
The logic of this design parallels the matching estimators used in program evaluation, where treated units are compared to their nearest control units to approximate counterfactual outcomes [37,40]. In contrast to propensity score matching, geographic proximity is leveraged directly, which is appropriate when spatial context is the primary confounder of interest. Given strong spatial dependence in urban outcomes such as resource consumption and transit availability, restricting comparisons to proximate buildings reduces omitted variable bias associated with unobserved neighborhood characteristics [36]. The outcome will indicate whether there is a significant difference in energy consumption between LEED-certified and non-LEED buildings at the city level.
The final stage of the analysis examines whether measured energy consumption is associated with the specific structure of LEED certification. LEED evaluates buildings across multiple credit categories, such as Sustainable Sites (SS), Water Efficiency (WE), Materials and Resources (MR), and EA, each of which contains several credits that award points for meeting defined performance criteria. Because energy performance is directly targeted within the EA category, the level of achievement in this category is expected to be the most relevant indicator of a building’s potential operational energy efficiency. However, LEED certifications are issued under different rating system versions (e.g., LEED v3, LEED v4) and project types (e.g., New Construction, Existing Buildings), and each version–type combination assigns different maximum point values to each category. As a result, raw category scores cannot be compared directly across buildings certified under different systems. To address this comparability issue, each building’s EA score is normalized by expressing the achieved points as a percentage of the maximum points available under its respective rating system. It is acknowledged, however, that normalization addresses differences in the maximum points available but does not fully equalize the underlying technical requirements, since the baselines, energy modeling rules, and commissioning expectations embedded in the EA category differ across rating system versions. The normalized EA percentage is therefore treated as an approximate measure of comparability, and its robustness is examined through version-stratified and sensitivity analyses, as reported in Section 3.2. This normalized percentage provides a consistent measure of energy-related credit achievement and enables cross-building comparison regardless of certification version or project type. Using this standardized metric, the analysis evaluates whether higher EA achievement corresponds to improved measured energy performance. Two outcome variables are considered for the 58 LEED-certified buildings with complete data: total annual energy consumption (kWh) and energy use intensity (kWh/sq ft).
Before selecting the appropriate correlation method, the distributional properties of all three variables, the EA percentage score, total energy consumption, and energy use intensity are assessed using the Shapiro–Wilk test. All variables exhibit significant departures from normality (p < 0.001), indicating skewed distributions and ruling out the use of Pearson correlation, which assumes bivariate normality and is sensitive to outliers. Accordingly, Spearman’s rank correlation is employed. This non-parametric method evaluates the strength and direction of monotonic relationships without imposing distributional assumptions. The Spearman correlation coefficient r is calculated as shown in (9).
r = 1 6 d 2 n n 2 1
where di is the difference between the rank of the ith observation in each variable and n is the number of observations. Statistical significance is assessed at the conventional α = 0.05 threshold.
Across these stages, the analytical claims supported by each method differ in kind and are interpreted accordingly. The feature-screening procedures are exploratory and associational: they rank the variables most strongly related to energy use to inform the construction of structural archetypes, and are not used as calibrated predictive models. The geographically constrained matching procedure produces adjusted comparisons between certified and non-certified buildings that share structural and spatial characteristics; because certification is not randomly assigned and several operational factors are unmeasured, the resulting differences are interpreted as conditional associations after adjustment for observable confounders rather than as causal effects of certification. The credit-level analysis is likewise associational, assessing whether achievement in the EA category co-varies monotonically with measured energy outcomes, without implying a predictive or causal relationship. This study is therefore designed to establish whether certification is associated with measurable differences in operational energy use under structural and spatial controls, and not to identify the causal mechanism by which certification does or does not affect energy performance.
For transparency and reproducibility of this methodology, the hyperparameters and configuration settings of all models used in the analysis, together with the stability checks applied to each, are summarized in Table 4.

3. Results and Discussions

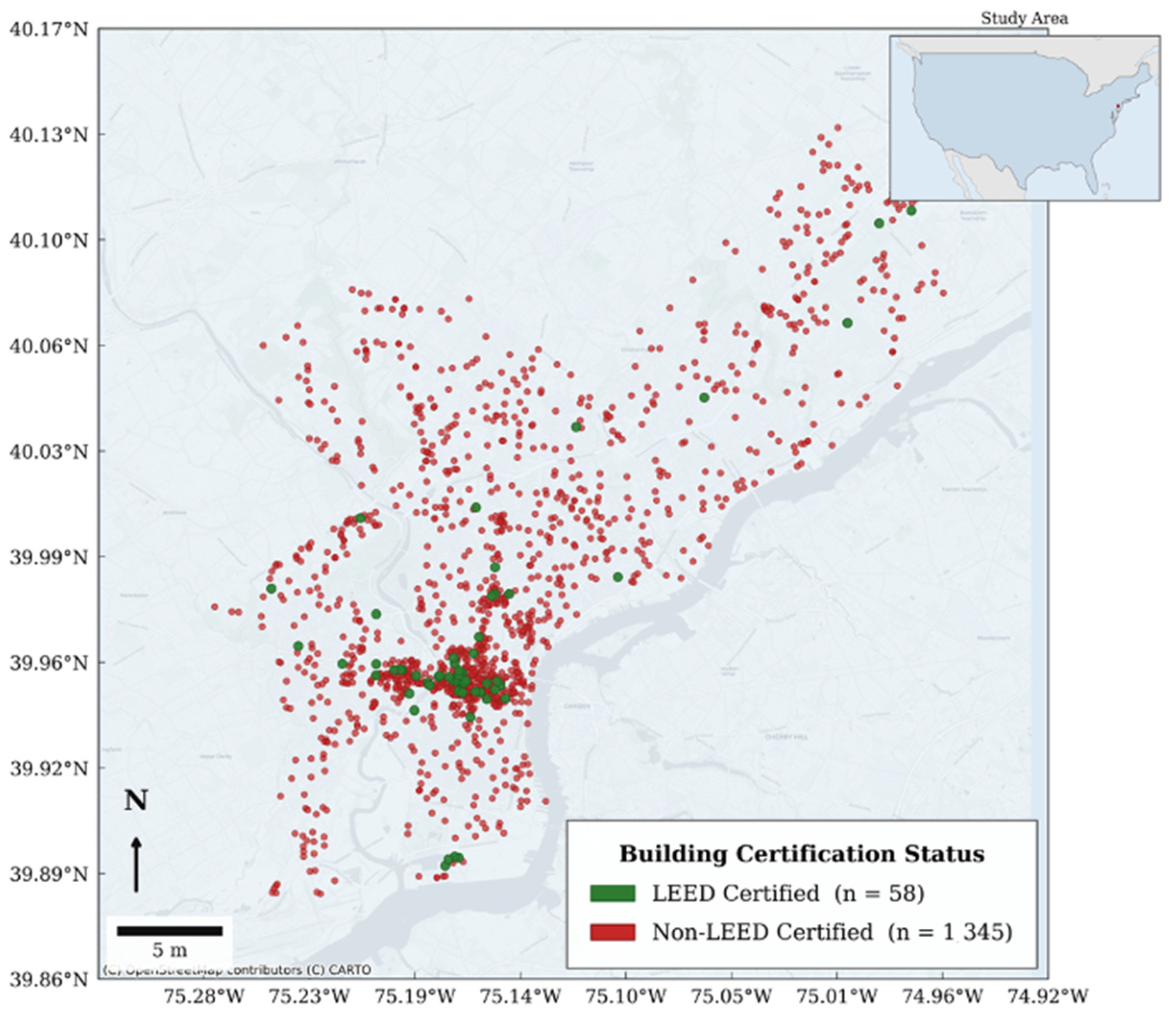
In this study, 1403 buildings, including 58 LEED-certified buildings were analyzed. According to the results, the analyzed sample included 25 Gold, 18 Silver, 9 Certified, and 6 Platinum LEED-certified buildings. Figure 2 shows the distribution of LEED-certified and non-LEED buildings in the city of Philadelphia.

3.1. Feature Engineering and Clustering Analysis

After data preparation, two feature engineering analyses were conducted on the dataset to investigate the impact of each feature on energy consumption, using Random Forest and Lasso. Table 5 shows the results of this analysis.
According to Table 5, the total floor area has the most significant impact on energy consumption. Following that, there are the buildings’ location and age. Regarding property type, although the impact is less than the others, it is not zero, especially considering the non-linear impact from Random Forest. Therefore, three features of total floor area, year built, and property type were selected for K-Means clustering. Since the location factors (longitude and latitude) also have a non-zero impact in Random Forest, they were kept for a more detailed neighborhood analysis in the next step.
To confirm that these drivers were not merely artifacts of the relationship between building size and total energy load, the Random Forest feature importance analysis was repeated using four intensity- and carbon-based dependent variables: site energy use intensity, source energy use intensity, weather-normalized site energy use intensity, and greenhouse gas emission intensity. The results, summarized in Table 5, confirmed that the importance of total floor area declined substantially when the dependent variable was normalized by area, falling from approximately 34% under the total-energy specification to roughly 25% under the energy intensity specifications. This decline is consistent with the expectation that part of the floor area effect in the total-energy model reflects energy load rather than energy efficiency. Nevertheless, total floor area remained among the two most influential predictors under every intensity formulation, while the importance of geographic location and property type increased and the importance of building age remained stable. These results indicated that the structural features selected for clustering, total floor area, year built, and property type, capture genuine drivers of building energy performance rather than a mechanical consequence of building scale, and that geographic location remained an important determinant warranting its inclusion in the subsequent neighborhood-level matching step.
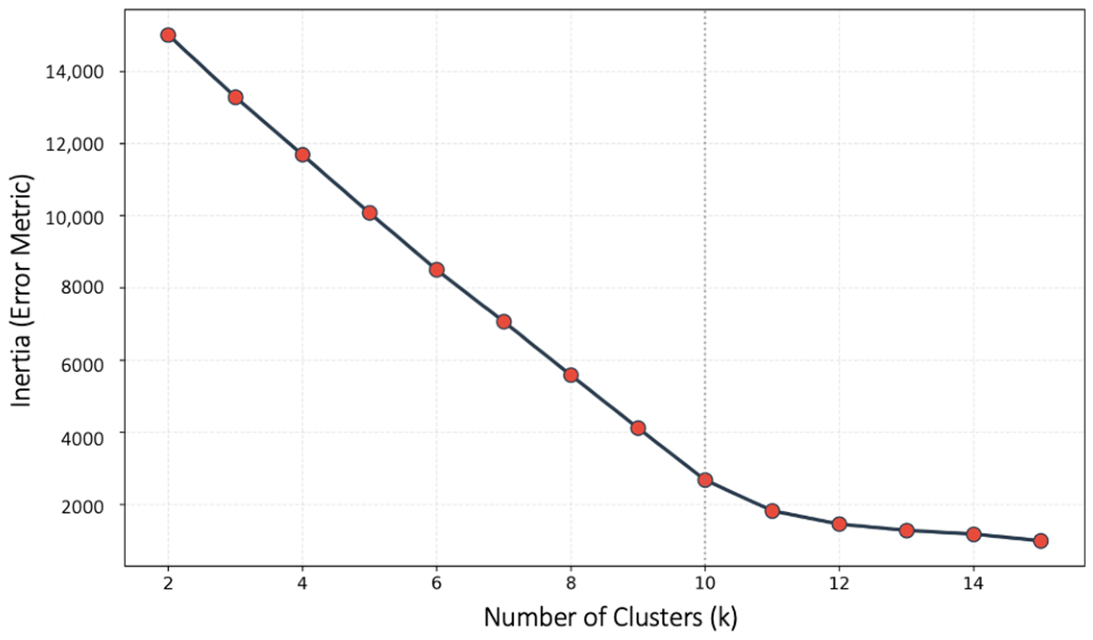
The first step in the K-Means clustering analysis was to identify the optimal number of clusters. To this end, as described in the Methodology section, the elbow graph method was applied, considering three features of total floor area, year built, and property type to find out the optimum number of clusters. In this regard, Figure 3 shows the elbow graph.
In Figure 3, the x-axis represents the number of clusters (k), while the y-axis shows the inertia, which is the within-cluster sum of squared distances (i.e., an error metric indicating how compact the clusters are). As expected, inertia decreases as the number of clusters increases, since adding more clusters reduces the distance between data points and their assigned centroids. However, this reduction is not uniform. The curve shows a relatively steep decline in inertia from k = 2 to approximately k = 9, indicating that adding clusters in this range significantly improves the clustering quality. Beyond this point, the rate of decrease becomes much smaller, and the curve starts to flatten. This transition point, commonly referred to as the “elbow,” suggests a balance between model complexity and clustering performance. In this case, the elbow is observed at k = 10, where further increases in the number of clusters result in only marginal improvements. Therefore, k = 10 was selected as the optimal number of clusters for this study. This choice ensures that the clustering captures the data’s underlying structure without introducing unnecessary complexity.
To further evaluate the quality and robustness of the clustering results, both quantitative performance indicators and a visual inspection were considered. The clustering achieved a Silhouette Score of 0.69, indicating strong separation between clusters and high internal cohesion. In addition, the Calinski–Harabasz (CH) Index reached 819.40, further confirming that the clusters are both well-separated and compact. Beyond these internal indices, the partition at k = 10 produced the most functionally coherent grouping of the candidate solutions: as detailed in Table 6, each of the ten clusters is dominated almost entirely by a single property type, with nine clusters composed exclusively of one functional category and the tenth predominantly of offices. This near-complete functional separation provided the decisive justification for selecting k = 10, since it confirms that the algorithm recovered interpretable building archetypes rather than statistically arbitrary partitions, directly supporting the matched comparison that follows. These numerical indicators are supported by the visual evidence shown in Figure 4, which shows the clusters projected into a two-dimensional space using Principal Component Analysis (PCA). In this projection, each point represents a building, colored by its assigned cluster. Despite the dimensionality reduction, the clusters remain relatively distinct, with clear groupings and limited overlap between them. This consistency between the quantitative metrics and the visual pattern suggests that the selected clustering structure (k = 10) effectively captures meaningful patterns in the data and provides a reliable basis for subsequent analysis.
The outcome of this step is 10 clusters that each contain buildings with similar characteristics. The descriptive characteristics of each cluster, including the number of buildings, the number of LEED-certified buildings, the median and interquartile range of floor area, the median construction year, the dominant property types, and the median energy intensity, are summarized in Table 6.
Cluster 1 is a residential cluster. It is dominated almost entirely by multifamily housing, with a few senior living and dormitory buildings. These buildings are generally mid-aged, with a median construction year around 1973, and they tend to be moderately large, with a median size of about 110,250 ft2. Cluster 2 is an education cluster. It is made up mostly of K–12 schools, with some colleges and libraries. These are generally older buildings, with a median year built around 1956, and are typically medium-sized, with a median floor area of about 87,662 ft2. Cluster 3 is a very clear lodging cluster, consisting entirely of hotels. These buildings are relatively newer than many other clusters, with a median year built around 1983, and they are generally large, with a median size of about 208,197 ft2. Cluster 4 is a broad mixed/other-use cluster. It includes a variety of uses such as supermarkets, municipal buildings, strip malls, mixed-use properties, and other miscellaneous buildings. The buildings are mostly mid-aged, with a median year built around 1974, and are medium-sized, with a median area of about 112,440 ft2. Cluster 5 is an industrial cluster. It mainly includes non-refrigerated warehouses, self-storage facilities, distribution centers, and manufacturing buildings. These are mostly older industrial buildings, with a median year built around 1975, and they are moderate in size, with a median floor area of 98,685 ft2.
Cluster 6 is primarily an office cluster. Almost all buildings in this group are offices. They are generally older, with a median year built around 1973, but this cluster stands out because it contains some very large office buildings. Its median size is about 196,162 ft2, while the mean is much higher due to a few very large properties. Cluster 7 is a utility-type cluster, composed mainly of parking structures and data centers. These are among the oldest clusters, with a median year built around 1950, and their size is moderately large, with a median of about 120,800 ft2. Cluster 8 is a public/cultural cluster. It includes museums, recreation buildings, performing arts buildings, and worship facilities. These buildings are generally older, with a median construction year around 1956, and are medium-sized, with a median floor area of about 113,364 ft2. Cluster 9 is the healthcare cluster. It includes medical offices, hospitals, and laboratories. These buildings are mostly older to mid-aged, with a median year built around 1965, and they tend to be among the largest buildings, with a median size of about 207,920 ft2. Cluster 10 is a retail cluster composed entirely of retail stores. Compared with several other clusters, these buildings are somewhat newer, with a median construction year around 1991.5, and they are generally the smallest group in scale, with a median floor area of about 115,856 ft2.

3.2. Energy Analysis

According to the results, the average annual energy consumption of non-LEED buildings is 3988,172 kWh, while this number is 10,199,730 kWh for LEED-certified buildings. Also, regarding average annual energy consumption per sqft, non-LEED buildings consume 22.68 kWh/sq ft, while LEED-certified buildings’ usage is 79.40 kWh/sq ft. Although LEED-certified buildings appear to consume more energy than their non-LEED counterparts, we still need more detailed analysis to reach a conclusion. The magnitude of this raw gap warrants explanation before proceeding, as a difference of this size could in principle indicate a data irregularity rather than a genuine performance difference.
Two features of the sample account for it. First, the comparison is structurally unbalanced: the 58 certified buildings are not a representative cross-section of the 1403-building stock but are concentrated in large, service-intensive functional types, whereas the non-certified pool is dominated by low-intensity uses. As the cluster descriptions in Table 6 show, the healthcare cluster alone carries a median intensity of roughly 42 kWh/sq ft, several times that of the residential and industrial clusters (approximately 13 and 5 kWh/sq ft) that make up the bulk of the non-certified stock. Therefore, a raw city-wide average contrasts a functionally intensive certified subset against a functionally light non-certified majority, and much of the apparent gap reflects this difference in building function rather than a difference attributable to certification. Second, the certified mean is strongly right-skewed by a small number of very high-intensity records: the median intensity of certified buildings is far closer to that of non-certified buildings than the means suggest, indicating that the raw average is pulled upward by a few extreme observations rather than by a systematic shift across the certified sample. Thus, the raw city-wide comparison is best understood as a composition effect compounded by skew, not as evidence of a uniform efficiency deficit, and it is precisely this confounding that the structural clustering and geographically constrained matching described below are designed to remove.
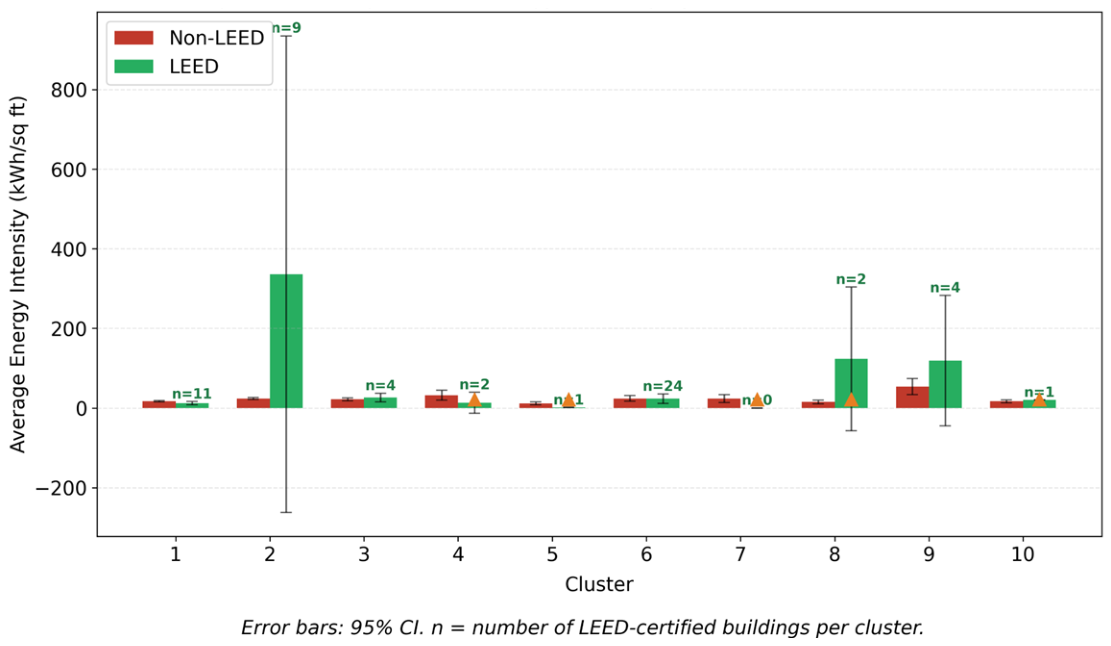
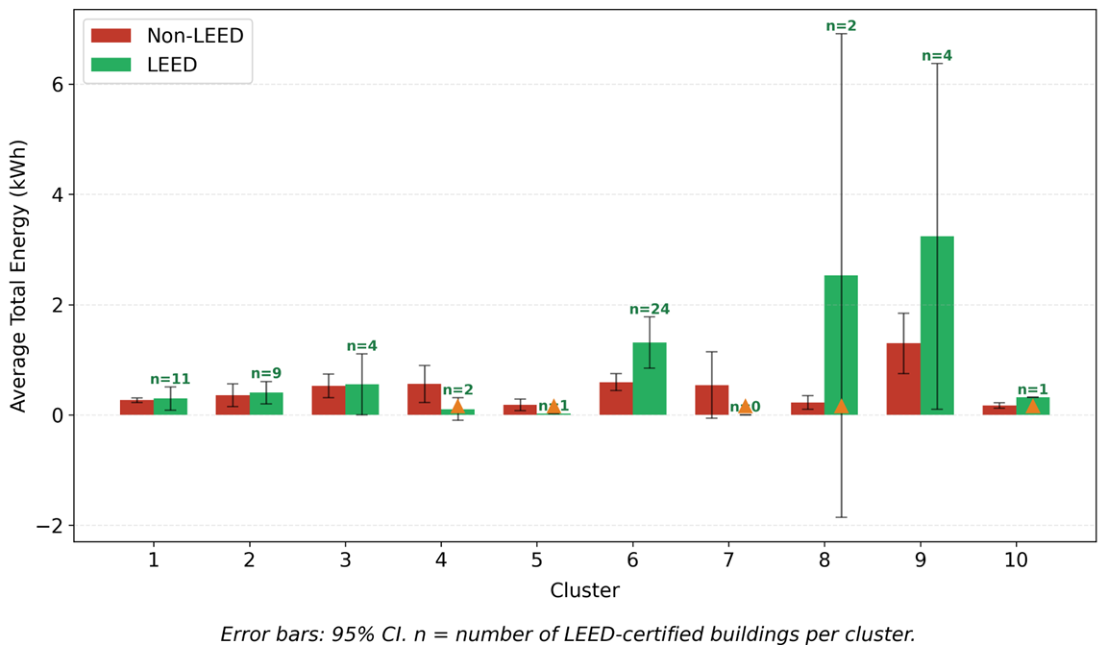
Building clusters was highlighted in the next step. In this step, the average energy consumption of non-LEED and LEED-certified buildings in each of the 10 clusters was compared to provide a fairer comparison among buildings. Figure 5 shows average annual energy consumption for non-LEED and LEED-certified buildings in clusters.
Similarly, Figure 6 illustrates average annual energy consumption per sq ft across different building clusters.
When the results are interpreted in light of cluster attributes, the higher energy use of LEED-certified buildings appears to be concentrated mainly in clusters with large, complex, and service-intensive building types. This is especially evident in Cluster 8 (public/cultural), and Cluster 9 (healthcare) where LEED-certified buildings show notably higher total energy consumption and higher energy intensity than non-LEED buildings. These clusters include buildings such as museums, recreation and worship facilities, hospitals, laboratories, and retail stores, all of which can have high operational demands due to long operating hours, specialized systems, ventilation requirements, or occupant-intensive use. Cluster 6, which is primarily office buildings, also shows higher total energy use for LEED-certified buildings, likely reflecting the presence of very large office properties in that cluster. In contrast, the differences between LEED and non-LEED buildings are much smaller in clusters such as Cluster 1 (residential) and Cluster 3 (lodging), where average energy use is relatively comparable. In some clusters, such as Cluster 4 (mixed-use/other) and Cluster 5 (industrial), LEED-certified buildings appear to have lower energy use. Overall, these cluster-level comparisons suggest that the higher overall average energy consumption of LEED-certified buildings is not consistent across all building types, and that building function, size, and operational complexity play an important role in shaping the observed differences between LEED-certified and non-LEED buildings.
These cluster-level patterns can be connected to the operational characteristics that distinguish high-intensity building functions. In the healthcare cluster, the elevated energy use of certified buildings is consistent with the operational profile of hospitals and laboratories, which maintain continuous climate control, operate specialized mechanical systems such as high-rate ventilation and air-change requirements for clinical and laboratory spaces, and sustain plug and process loads from medical and research equipment that are largely independent of envelope or lighting efficiency measures. Because these loads are driven by function rather than by design-stage efficiency provisions, the energy savings achievable through certification strategies are inherently constrained in this building type. A similar logic applies to the public and cultural cluster, where museums, performing-arts venues, and worship and recreation facilities combine extended and irregular operating hours with large, often single-volume conditioned spaces and variable occupant loads, conditions that raise baseline energy demand irrespective of certification status. In contrast, the clusters in which certified and non-certified buildings performed comparably, such as residential and lodging, are characterized by more regular occupancy schedules and standardized mechanical systems, where efficiency measures rewarded by certification can translate more directly into measured savings. This interpretation indicates that the observed differences are shaped substantially by the operational intensity intrinsic to particular building functions.
This interpretation can be framed more precisely through the established distinction between regulated and unregulated building energy loads. Energy modeling under standards such as ASHRAE 90.1, which forms the technical basis of the EA category, primarily governs regulated loads—the fixed building services such as heating, cooling, ventilation, and interior lighting that the design team specifies and controls. Plug loads and specialized process loads, by contrast, including medical imaging and laboratory equipment, server and data-processing loads, and other tenant-installed systems, are treated as unregulated: they fall largely outside the scope of the energy model and of the efficiency measures the certification rewards [16]. In service-intensive functional types, these unregulated process loads can constitute a substantial and growing share of total consumption, so that even a building with efficient regulated systems may record high measured intensity driven by end uses the certification never addressed. A related mechanism arises from the separation between base-building and tenant scopes. Where certification is pursued for the core and shell—the developer-controlled structure and central systems—the energy-intensive fit-out is frequently designed and installed later by tenants, outside the certified scope and outside the design-stage energy model. In sectors characterized by intensive equipment loads and bespoke tenant fit-outs, such as healthcare and certain public and cultural facilities, this division of responsibility can leave a large portion of operational demand uncaptured by the certification process, offering a plausible account of why certified buildings in precisely these clusters show no measured energy advantage over their structural and spatial peers.
It must be emphasized, nonetheless, that the benchmarking dataset does not contain direct measures of several operational factors that strongly influence energy use, including operating hours, occupancy density, plug loads, ventilation rates, tenant mix, district energy supply, commissioning status, and building management practices. Because certified buildings in this sample are concentrated in functionally demanding, high-occupancy uses, their higher measured intensity may partly reflect more intensive patterns of use rather than lower inherent efficiency. The clustering procedure controls for building function and the matched comparison controls for spatial context, but neither can fully isolate the independent effect of certification from these unmeasured operational drivers. The observed differences are therefore best understood as descriptive of raw operational energy intensity rather than as a clean estimate of the certification effect net of use intensity.
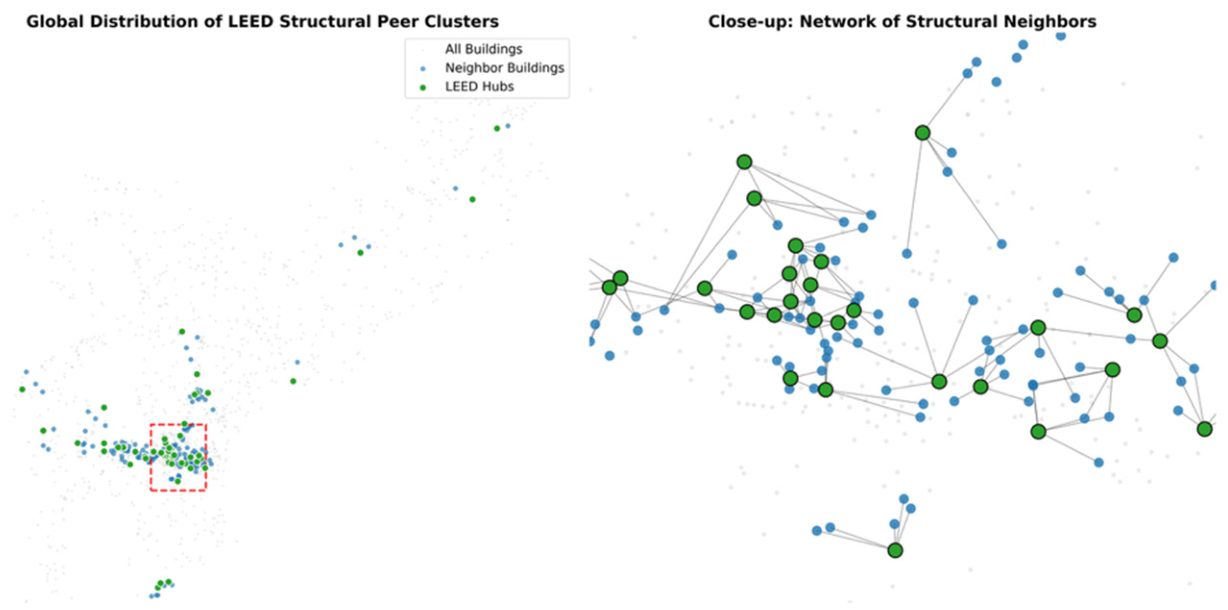
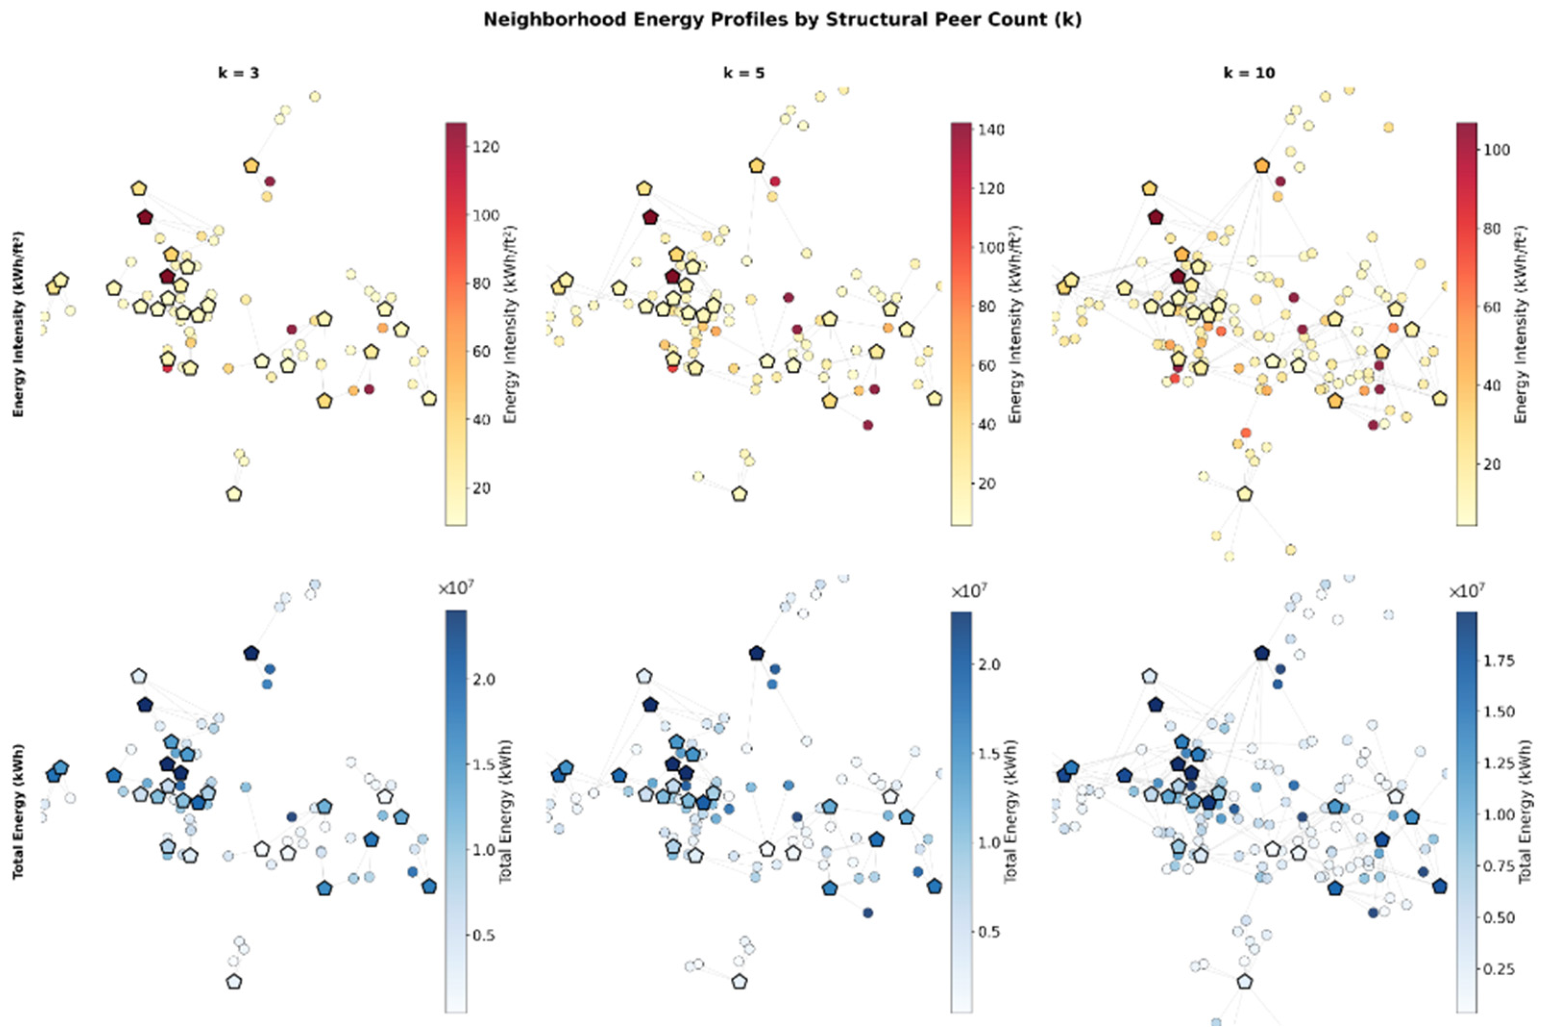
Although the recent analysis provided a fairer comparison, the location factor of the buildings has still not been considered. According to the Section 3.1 analysis results, the location factor is one of the major contributors to energy consumption in the city-level analysis. Therefore, the last step of the analysis focused on the cluster and neighborhood analysis as described in the Methodology. In this regard, each LEED-certified building’s energy usage was compared to nearby 3, 5, and 10 non-LEED buildings from the same building cluster in a radius of 1000 m. As an example, Figure 7 displays a network of structural neighbors for k = 5 neighbors around the LEED-certified buildings. We had similar networks for k = 3 and k = 10 as well.
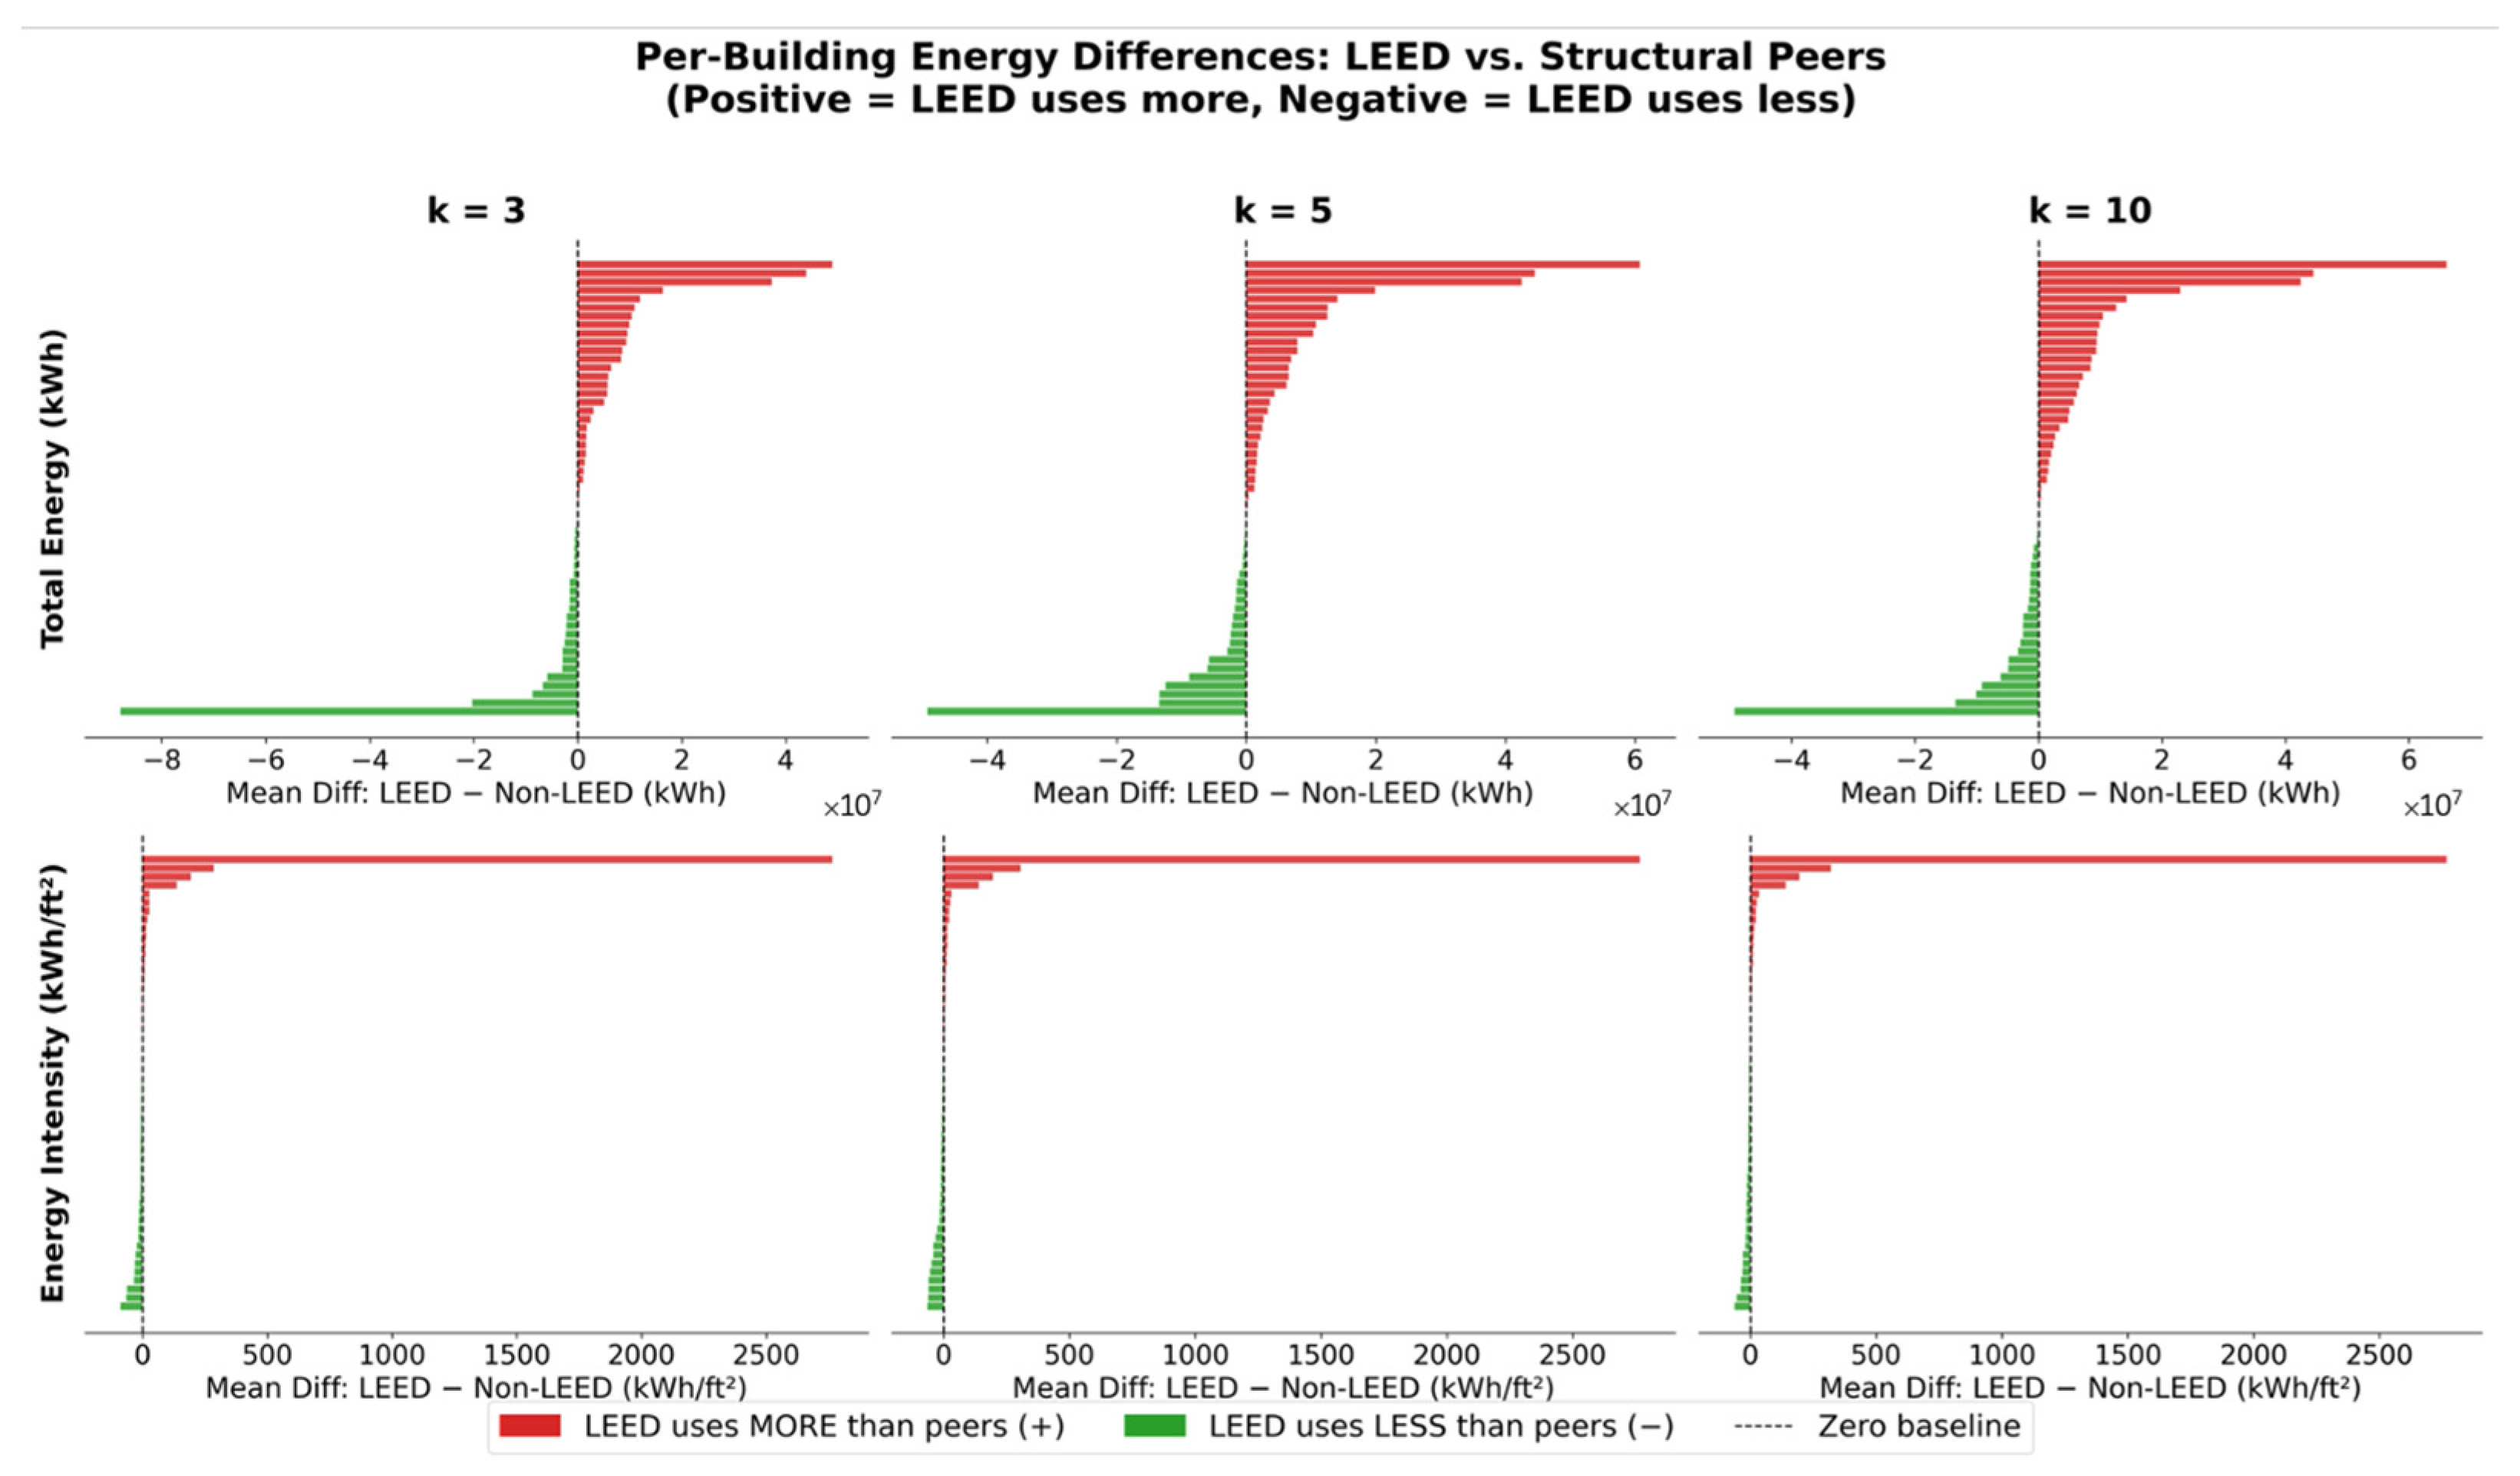
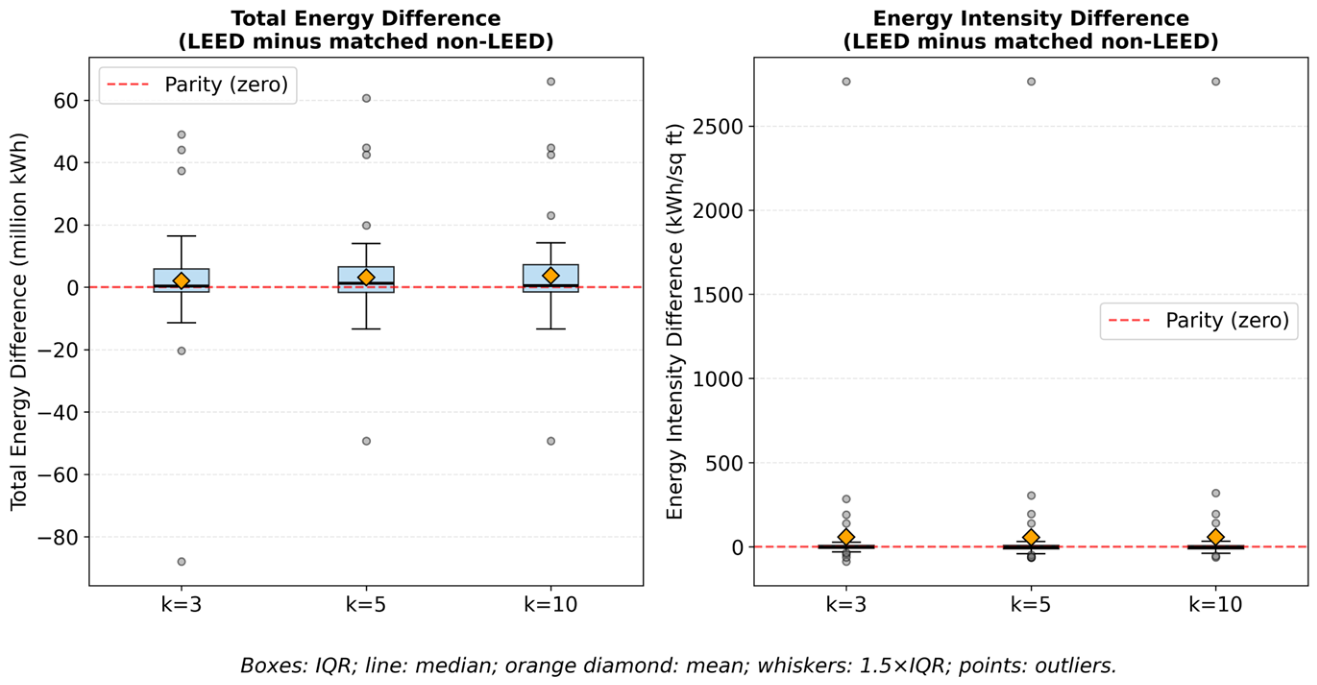
Building on the cluster-specific findings, the final stage of the analysis integrated spatial proximity to account for the localized urban conditions that drive energy demand. By utilizing a geographically constrained K-nearest neighbor (KNN) matching procedure, each LEED-certified building was compared against its most direct structural peers within a 1000 m radius. Figure 8 illustrates the resulting neighborhood energy profiles across three distinct peer counts (k = 3, 5, 10), visualizing the spatial connectivity between certified “hubs” and their non-certified counterparts. This mapping highlights that even when controlling for both building archetype and neighborhood context, LEED-certified structures often reside in high-intensity nodes compared to the surrounding building stock.
The distribution of these energy performance gaps is further detailed in Figure 9, which presents the per-building differences in total energy consumption and intensity. The waterfall visualizations reveal a bifurcated performance landscape: while a subset of LEED-certified buildings (represented in green) successfully achieves lower energy use than their local structural peers, a larger portion (represented in red) exhibits higher consumption. Notably, the magnitude of overconsumption in red-performing LEED buildings is larger than the savings observed in green-performing ones, which heavily skews the aggregate city-scale results. For total energy use, these differences are particularly pronounced, suggesting that a few high-intensity certified projects contribute disproportionately to the LEED sample’s overall energy footprint.
To make the distribution of these per-building differences explicit, Figure 10 presents the same matched differences as boxplots for each neighborhood size. While the median matched difference lies near or slightly below zero, particularly for energy intensity, a long upper tail reflects a subset of certified buildings with substantially higher consumption than their structural peers. The divergence between the mean (orange marker) and the median in each panel confirms that the positive average differences are driven disproportionately by a small number of high-intensity certified projects rather than by a systematic tendency across the sample.
The statistical synthesis of these comparisons, summarized in Table 7, provides a comprehensive assessment of the LEED effect in Philadelphia. Across all tested neighborhood sizes (k = 3, 5, and 10), the mean difference in total energy consumption remained positive, indicating that LEED buildings, on average, use more energy than their immediate neighbors. For k = 3, the mean difference was approximately 2.1 million kWh (p = 0.372), which grew to 3.74 million kWh as the comparison group expanded to k = 10. Interestingly, at the k = 10 level, the p-value for total energy consumption reached 0.0802, suggesting that the higher energy use of LEED buildings is statistically significant at the 90% confidence level, though it does not meet the more stringent 95% threshold. Similarly, the energy intensity metric (kWh per sq ft) consistently showed that LEED buildings consumed roughly 56–59 units more than their peers, regardless of the number of neighbors considered.
Because matched energy differences are typically right-skewed and sensitive to a small number of extreme buildings, the robustness of the t-test results was examined using a battery of complementary methods, summarized in Table 7. For each comparison, effect sizes (Cohen’s d), standard deviations, medians, and both parametric and bootstrapped 95% confidence intervals were computed, alongside Wilcoxon signed-rank tests, 10% trimmed means, and sensitivity analyses excluding the most extreme 5% of buildings. The two outcome variables behaved differently under these checks. For energy use intensity, all methods agreed that no significant difference existed between certified and non-certified buildings; although the mean difference was positive, the median difference was marginally negative (approximately −3 to −4 kWh/sq ft), the trimmed means were near zero, and neither the Wilcoxon tests (p = 0.28–0.48) nor the outlier-excluded tests (p = 0.65–0.997) approached significance. The positive mean intensity difference was therefore attributable to a small number of high-intensity certified buildings rather than to a systematic tendency. For total energy consumption, the effect was more sensitive to extreme observations: the raw t-tests were non-significant (p = 0.080–0.378), the Wilcoxon tests were closer to significance (p = 0.055–0.104), and excluding the most extreme 5% of buildings rendered the difference statistically significant at every neighborhood size (p = 0.006–0.025). This indicated that the higher total energy use of certified buildings was concentrated in, but not solely driven by, a small number of very large, high-consumption certified projects. Because the same non-certified controls were reused across multiple matches, a sign-flip permutation test was additionally conducted for the k = 10 total-energy comparison; the resulting p-value (0.079) closely matched the parametric result, indicating that control reuse did not materially distort inference. Finally, given that six related hypothesis tests were conducted across two outcomes and three neighborhood sizes, multiple-comparison corrections were applied, and neither Bonferroni nor Benjamini–Hochberg correction yielded any significant result (all corrected p > 0.34). Taken together, these robustness analyses did not alter the study’s central conclusion: on a floor-area-normalized basis, certified and non-certified buildings performed equivalently, and the only evidence of higher energy use among certified buildings concerned absolute total consumption, was contingent on the inclusion or exclusion of extreme observations, and did not survive correction for multiple comparisons.
The findings indicate an apparent performance gap rather than a statistically confirmed one: LEED-certified buildings in Philadelphia showed no measurable energy savings, and their mean energy use and intensity were directionally higher than those of non-LEED buildings of similar size, age, and function. It should be emphasized that none of these differences were statistically significant at the 95% level (Table 7); the strongest result, total energy use at k = 10, was significant only at the 90% level (p = 0.080). These comparisons therefore describe a consistent directional pattern in the matched sample, not a confirmed effect of certification. While the initial raw data suggested a massive gap, the implementation of K-means clustering and spatial matching confirmed that these differences persist even when the comparison is restricted to the most relevant structural and geographical peers. Because the gap is not statistically significant, these results are best interpreted as the absence of a detectable LEED advantage rather than as evidence of a certification penalty. This null finding is itself notable, given that USGBC reports average energy savings of 20–25% for certified buildings. The data suggest that the certification’s intended energy efficiency is frequently offset by the inherent complexity of buildings seeking LEED status. Specifically, Clusters 8 (public/cultural) and 9 (healthcare) showed the most dramatic disparities. These facilities often operate 24/7 and feature specialized ventilation systems that may inherently limit the practical savings achievable solely through sustainable design.
From a policy perspective, these results highlight the performance gap often discussed in green building literature, where design-based ratings do not always translate into operational reality. For practitioners and city planners, this emphasizes the need for post-occupancy evaluations and a shift from rewarding potential efficiency toward rewarding measured performance. Furthermore, the spatial analysis reveals that LEED buildings are heavily concentrated in the dense urban core of Philadelphia, where energy intensity is naturally elevated by factors such as the urban heat island effect and higher occupant density. However, because the KNN matching procedure utilized a 1000 m caliper to substantially reduce the influence of these localized environmental conditions, the higher consumption metrics reported in Table 7 are unlikely to be explained by broad geographic context alone. It should be acknowledged, nonetheless, that spatial proximity does not constitute complete control for neighborhood energy mechanisms. Distance alone does not equalize urban heat island exposure, building density, street-canyon form, shading, local land surface temperature, transit access, or the intensity of socioeconomic activity, and recent evidence indicates that such urban thermal and landscape mechanisms can be nonlinear and spatially heterogeneous rather than uniform across a given radius [41]. The caliper therefore restricts comparisons to locally similar environments but should not be interpreted as full statistical control for every neighborhood-level driver of energy use. This suggests that the certification framework itself may not sufficiently prioritize the most effective energy-reduction strategies for this specific urban climate.
A critical finding in this analysis is that LEED-certified buildings in the sample achieve an average satisfaction of only 31.53% of the available points in the EA category. When viewed alongside the satisfaction levels of other LEED categories—Location & Transportation (58.57%), Sustainable Sites (66.12%), Water Efficiency (53.29%), Material & Resources (39.31%), Indoor Environmental Quality (54.60%), Innovation (78.74%), Regional Priority (44.23%), and Integrative Process (27.27%)—the EA category stands out as one of the weakest areas of achievement. Because the total points available in each category vary across rating system versions and project types, these percentages provide a standardized basis for comparison. The notably low EA satisfaction rate is consistent with the possibility that energy-related credits contribute less to certification outcomes in this sample than credits in other categories. It should be emphasized, however, that the available data do not include the detailed credit-level scorecards or certification pathways that would be required to demonstrate strategic point-seeking, and this interpretation is therefore offered as a hypothesis warranting further investigation rather than as an established finding. To examine whether EA credit achievement corresponds to actual energy outcomes, a correlation analysis is conducted for the 58 LEED-certified buildings with complete data. Table 8 shows the results of this analysis. The results indicate a negligible and non-significant association between the EA percentage score and energy use intensity (r = 0.085, p = 0.551). The relationship between the EA score and total annual energy consumption is similarly weak and non-significant (r = 0.203, p = 0.148), a pattern likely influenced by building size, as larger buildings tend to consume more energy in absolute terms while also having greater capacity to pursue EA-related design strategies or renewable energy credits. Overall, the EA credit score carries virtually no predictive signal for measured operational energy performance. This outcome implies that LEED certification may often be achieved through points in categories such as Location & Transportation or Sustainable Sites, or that EA credits primarily reward design intentions and procurement strategies rather than measurable reductions in actual energy use. Lack of appropriate maintenance and a lack of a follow-up policy from LEED to evaluate the buildings years after construction finished can be another reason for this. Taken together, these findings indicate that, in this sample, certification status and measured operational energy performance may diverge, particularly where post-occupancy verification is limited or where high-intensity building uses are not fully accounted for. This divergence does not, in itself, constitute evidence of misleading disclosure or strategic credit-seeking by building owners, and no such inference is drawn here; establishing intent would require credit-level and disclosure data beyond those available in this study. The broader question of environmental credibility and the conditions under which sustainability claims are subject to external scrutiny has been examined in the greenwashing literature [42], but the present analysis speaks only to the observed divergence between certification and measured energy outcomes, not to its underlying motivations.
To examine whether this absence of association was an artifact of pooling buildings certified under different rating system versions or representing different building functions, the correlation analysis was repeated within version strata, within functional strata, and under several sensitivity specifications. Among the buildings with available data, 38 were certified under LEED v3 (2009), 13 under legacy v2 pathways, and 7 under LEED v4. Within the largest single-version subgroup, LEED v3 (n = 36), the association between EA achievement and energy use intensity remained negligible and non-significant (r = 0.020, p = 0.907), and the same pattern held for the legacy v2 subgroup (r = 0.304, p = 0.393, n = 10) and the v4 subgroup (r = −0.029, p = 0.957, n = 6); excluding v4 buildings did not alter the result (r = 0.130, p = 0.390, n = 46). A parallel stratification by building function, the dimension most likely to govern operational energy demand, was conducted using ENERGY STAR property-type classifications. The only functional category with a sufficiently large subgroup, office buildings (n = 23), likewise exhibited no significant association (r = 0.048, p = 0.826), while the remaining functional categories contained too few certified buildings to support reliable subgroup inference. It should be noted that stratification by LEED rating-system pathway, such as New Construction, Existing Buildings, or Core and Shell, was not feasible, as pathway-level metadata were unavailable for all but one of the certified buildings. The consistent absence of a significant relationship across both version and functional strata indicates that the weak EA–energy association is not an artifact of combining incommensurable rating systems or heterogeneous building functions, although the small size of several subgroups limits statistical power.
The buildings within our analytical sample reflect a cross-section of the LEED program’s evolution, having been certified under versions ranging from v2 and v3 (2009) to the more contemporary v4 and v4.1 standards. In the legacy v2 and v3 systems, the EA category was primarily governed by a prerequisite for minimum energy performance and credits for “Optimizing Energy Performance,” which relied heavily on simulated cost savings relative to ASHRAE 90.1-2004 or 2007 standards. As the framework transitioned to v4 and v4.1, stringency increased by adopting ASHRAE 90.1-2010 and 2016 as baselines, while introducing source energy and greenhouse gas (GHG) emissions as additional evaluation metrics. However, despite these incremental shifts toward more rigorous modeling, these systems still allowed for considerable flexibility, often enabling buildings to achieve certification by focusing on categories outside of energy performance, a trend evidenced by our finding that the buildings in this study achieved an average satisfaction of only 31.53% for EA credits.
The recently introduced LEED v5 rating system, released in April 2025, represents a fundamental pivot intended to address exactly this observed performance gap. Unlike its predecessors, which focused largely on design-phase energy cost predictions, LEED v5 places decarbonization and operational reality at the center of the certification process. A transformative addition is the new prerequisite, Operational Carbon Projection and Decarbonization Plan (EAp1), which mandates that every project team develop and document a 25-year strategy for sustained carbon reduction. Furthermore, v5 raises the performance baseline to ASHRAE 90.1-2019 or 2022, effectively setting a much higher bar for what constitutes “minimum” efficiency. These improvements in the EA category are likely to have a profound impact on the actual energy savings of future LEED-certified buildings in urban environments like Philadelphia. By requiring project teams to register with the Arc platform for real-time performance monitoring, LEED v5 ensures that simulated design metrics must eventually align with actual operational data. This shift away from one-time documentation toward ongoing accountability directly targets the “performance paradox” we identified in our study. Additionally, the new mandate for full electrification and 100% renewable energy offsets for Platinum-level projects reduces the extent to which high-intensity buildings can attain top certification tiers primarily through credits unrelated to operational energy performance. By prioritizing measurable carbon performance as a baseline expectation, LEED v5 may help align certification outcomes more closely with measured operational performance in complex urban building stocks. Whether these provisions will, in practice, close the performance gap identified here remains an open empirical question that can only be resolved once a sufficient number of v5-certified buildings have accumulated multiple years of operational data. The present results should therefore be read as motivating, rather than confirming, the direction of reform embodied in LEED v5.


4. Conclusions and Limitations

This study evaluated the city-scale operational energy performance of LEED-certified buildings in Philadelphia relative to functionally and geographically comparable non-certified peers, using dual-model feature screening, K-means clustering (k = 10), and geographically constrained nearest-neighbor matching across 1403 buildings, of which 58 were LEED-certified.
On a floor-area-normalized basis, certified buildings showed no measurable advantage: the mean intensity difference was directionally unfavorable, roughly 56 to 59 kWh/sq ft across all neighborhood sizes (k = 3, 5, 10), yet none was significant at the 95% level and the median differences were marginally negative (about −3 to −4 kWh/sq ft), indicating absence of a detectable benefit rather than a penalty. The raw city-wide gap—79.4 versus 22.7 kWh/sq ft—proved a composition and skew artifact, arising because certified buildings concentrate in large, service-intensive types and a few high-intensity records inflate their mean. This higher consumption was concentrated in the healthcare and public/cultural clusters, where extended hours, specialized ventilation, and equipment-driven process loads raise baseline demand largely independently of the measures certification rewards; the only comparison approaching significance was total energy at k = 10 (p = 0.080), contingent on a few extreme buildings. Energy and Atmosphere achievement did not predict measured performance, showing negligible, non-significant associations with intensity (Spearman ρ = 0.085, p = 0.551) and total energy (ρ = 0.203, p = 0.148), with certified buildings satisfying only 31.53% of available EA points on average.
These results are best understood as a city-specific account of the gap between certification and measured operation, not a general verdict on green certification. The central implication is that design-stage modeling and one-time documentation are insufficient predictors of operational performance, and that urban policy may benefit from greater emphasis on post-occupancy verification and operational accountability. The findings also motivate, rather than confirm, the reform embodied in the LEED v5 framework introduced in April 2025, whose emphasis on measured carbon performance and continuous monitoring directly targets this gap; whether those provisions close it remains resolvable only once v5-certified buildings accumulate multi-year data. Confirming whether Philadelphia’s patterns generalize would require comparative analysis across additional cities.
Several limitations apply. The 58 certified buildings are few relative to the non-certified pool, and sparse subgroups such as Platinum-level certifications limit subgroup inference. The annual benchmarking data also lack granularity on operating hours, occupancy density, plug and process loads, ventilation rates, tenant mix, renovation and commissioning history, management practices, and envelope and glazing properties; absent from the public Philadelphia dataset, these could be addressed only indirectly through structural clustering and may explain part of the higher raw intensity. As a single “natural laboratory,” Philadelphia’s findings are further tied to its building stock, climate, and socioeconomic context and may differ where utility rates or climate demands differ. Finally, reliance on self-reported data introduces accuracy limits, though systematic cleaning removed implausible values.

Author Contributions

Conceptualization, S.V. and G.O.-D.; methodology, S.V. and G.O.-D.; software, S.V.; validation, S.V. and G.O.-D.; formal analysis, S.V.; investigation, S.V.; resources, S.V. and G.O.-D.; data curation, S.V.; writing—original draft preparation, S.V. and G.O.-D.; writing—review and editing, S.V. and G.O.-D.; visualization, S.V.; supervision, G.O.-D.; project administration, S.V. and G.O.-D. All authors have read and agreed to the published version of the manuscript.

Funding

This research received no external funding.

Institutional Review Board Statement

Not applicable.

Informed Consent Statement

Not applicable.

Data Availability Statement

The data presented in this study are available on request from the corresponding author.

Acknowledgments

During the preparation of this manuscript/study, the authors used ChatGPT GPT 5.5 and Gemini 3.5 Flash for the purposes of improving readability and language. The authors have reviewed and edited the output and take full responsibility for the content of this publication.

Conflicts of Interest

The authors declare no conflicts of interest.

Abbreviations

The following abbreviations are used in this manuscript:
ASHRAEAmerican Society of Heating, Refrigerating and Air-Conditioning Engineers
EAEnergy and Atmosphere
GHGGreenhouse Gas
HVACHeating, Ventilation, and Air Conditioning
IEQIndoor Environmental Quality
KNNK-Nearest Neighbor
LCALife-Cycle Assessment
LEEDLeadership in Energy and Environmental Design
PCAPrincipal Component Analysis
USGBCU.S. Green Building Council
WCSSWithin-Cluster Sum of Squares
SSSustainable Sites
WEWater Efficiency

References

  1. Global Status Report for Buildings and Construction 2024/2025. 2025. Available online: https://globalabc.org/sites/default/files/2025-03/Global-Status-Report-2024_2025.pdf (accessed on 1 April 2026).
  2. USGBC. LEED Rating System. 2026. Available online: https://www.usgbc.org/leed (accessed on 1 April 2026).
  3. Turner, C.; Frankel, M. Energy Performance of LEED for New Construction Buildings; New Buildings Institute: White Salmon, WA, USA, 2008. [Google Scholar]
  4. Leite Ribeiro, L.M.; Piccinini Scolaro, T.; Ghisi, E. LEED Certification in Building Energy Efficiency: A Review of Its Performance Efficacy and Global Applicability. Sustainability 2025, 17, 1876. [Google Scholar] [CrossRef]
  5. Newsham, G.R.; Mancini, S.; Birt, B.J. Do LEED-Certified Buildings Save Energy? Yes, but…. Energy Build. 2009, 41, 897–905. [Google Scholar] [CrossRef]
  6. Scofield, J.H. Do LEED-Certified Buildings Save Energy? Not Really…. Energy Build. 2009, 41, 1386–1390. [Google Scholar] [CrossRef]
  7. Scofield, J.H. Efficacy of LEED-Certification in Reducing Energy Consumption and Greenhouse Gas Emission for Large New York City Office Buildings. Energy Build. 2013, 67, 517–524. [Google Scholar] [CrossRef]
  8. Scofield, J.; Brodnitz, S.; Cornell, J.; Liang, T.; Scofield, T. Energy and Greenhouse Gas Savings for LEED-Certified U.S. Office Buildings. Energies 2021, 14, 749. [Google Scholar] [CrossRef]
  9. Hu, M. 2019 Energy Benchmarking Data for LEED-Certified Buildings in Washington, D.C.: Simulation and Reality. J. Build. Eng. 2021, 42, 102475. [Google Scholar] [CrossRef]
  10. Oates, D.; Sullivan, K.T. Postoccupancy Energy Consumption Survey of Arizona’s LEED New Construction Population. J. Constr. Eng. Manag. 2012, 138, 742–750. [Google Scholar] [CrossRef]
  11. Vosoughkhosravi, S.; Dixon-Grasso, L.; Jafari, A. The Impact of LEED Certification on Energy Performance and Occupant Satisfaction: A Case Study of Residential College Buildings. J. Build. Eng. 2022, 59, 105097. [Google Scholar] [CrossRef]
  12. Tsirovasilis, E.; Katafygiotou, M.; Psathiti, C. Comparative Assessment of LEED, BREEAM, and WELL: Advancing Sustainable Built Environments. Energies 2025, 18, 4322. [Google Scholar] [CrossRef]
  13. Chiang, C.-L.; Calautit, J. Reducing Building Energy Performance Gap: Integrating Agent-Based Modelling and Building Performance Simulation. Buildings 2025, 15, 1728. [Google Scholar] [CrossRef]
  14. Esmaeilzadeh, A.; Hamdy, M. Dynamic Building Performance Gap Related to Occupant Behaviors: A Framework to Predict the Impacts of Possible Causal Factors. Energy Build. 2025, 347, 116340. [Google Scholar] [CrossRef]
  15. Sood, D.; Alhindawi, I.; Ali, U.; McGrath, J.A.; Byrne, M.A.; Finn, D.; O’Donnell, J. Simulation-Based Evaluation of Occupancy on Energy Consumption of Multi-Scale Residential Building Archetypes. J. Build. Eng. 2023, 75, 106872. [Google Scholar] [CrossRef]
  16. Menezes, A.C.; Cripps, A.; Bouchlaghem, D.; Buswell, R. Predicted vs. Actual Energy Performance of Non-Domestic Buildings: Using Post-Occupancy Evaluation Data to Reduce the Performance Gap. Appl. Energy 2012, 97, 355–364. [Google Scholar] [CrossRef]
  17. de Wilde, P. The Gap between Predicted and Measured Energy Performance of Buildings: A Framework for Investigation. Autom. Constr. 2014, 41, 40–49. [Google Scholar] [CrossRef]
  18. Wu, X.; Lin, B.; Papachristos, G.; Liu, P.; Zimmermann, N. A Holistic Approach to Evaluate Building Performance Gap of Green Office Buildings: A Case Study in China. Build. Environ. 2020, 175, 106819. [Google Scholar] [CrossRef]
  19. Altomonte, S.; Schiavon, S. Occupant Satisfaction in LEED and Non-LEED Certified Buildings. Build. Environ. 2013, 68, 66–76. [Google Scholar] [CrossRef]
  20. Pastore, L.; Andersen, M. Building Energy Certification versus User Satisfaction with the Indoor Environment: Findings from a Multi-Site Post-Occupancy Evaluation (POE) in Switzerland. Build. Environ. 2019, 150, 60–74. [Google Scholar] [CrossRef]
  21. Geng, Y.; Ji, W.; Wang, Z.; Lin, B.; Zhu, Y. A Review of Operating Performance in Green Buildings: Energy Use, Indoor Environmental Quality and Occupant Satisfaction. Energy Build. 2019, 183, 500–514. [Google Scholar] [CrossRef]
  22. Asdrubali, F.; Baldinelli, G.; Bianchi, F.; Sambuco, S. A Comparison between Environmental Sustainability Rating Systems LEED and ITACA for Residential Buildings. Build. Environ. 2015, 86, 98–108. [Google Scholar] [CrossRef]
  23. Awadh, O. Sustainability and Green Building Rating Systems: LEED, BREEAM, GSAS and Estidama Critical Analysis. J. Build. Eng. 2017, 11, 25–29. [Google Scholar] [CrossRef]
  24. Kontokosta, C.E.; Tull, C. A Data-Driven Predictive Model of City-Scale Energy Use in Buildings. Appl. Energy 2017, 197, 303–317. [Google Scholar] [CrossRef]
  25. Ali, U.; Shamsi, M.H.; Hoare, C.; Mangina, E.; O’Donnell, J. A Data-Driven Approach for Multi-Scale Building Archetypes Development. Energy Build. 2019, 202, 109364. [Google Scholar] [CrossRef]
  26. Ali, U.; Shamsi, M.H.; Alshehri, F.; Mangina, E.; O’Donnell, J. Comparative Analysis of Machine Learning Algorithms for Building Archetypes Development in Urban Building Energy Modeling; ASHRAE: Peachtree Corners, GA, USA, 2018. [Google Scholar]
  27. Trung, N.T.; Alemi, N.; Haido, J.H.; Shariati, M.; Baradaran, S.; Yousif, S.T. Reduction of Cement Consumption by Producing Smart Green Concretes with Natural Zeolites. Smart Struct. Syst. 2019, 24, 415–425. [Google Scholar] [CrossRef]
  28. Large Building Energy Benchmarking Data. 2023. Available online: https://opendataphilly.org/datasets/large-building-energy-benchmarking-data/ (accessed on 10 March 2026).
  29. LEED Project Directory. Available online: https://www.usgbc.org/projects (accessed on 1 April 2026).
  30. Akin, S.; Chrysogonus Nwagwu, C.; Heeren, N.; Hertwich, E. Archetype-Based Energy and Material Use Estimation for the Residential Buildings in Arab Gulf Countries. Energy Build. 2023, 298, 113537. [Google Scholar] [CrossRef]
  31. Xu, Z.; Liang, C.; Mu, Z.; Tian, Y.; Gu, D. Structural Type Identification of City-Scale Building Groups Based on Deep Learning. J. Comput. Civ. Eng. 2026, 40, 04025119. [Google Scholar] [CrossRef]
  32. Xu, Z.; Wang, Y.; Fan, J.; Tian, Y.; Shi, Z.; Jin, N. BrIMs-Based 3D Semantic Segmentation of Bridge Components Leveraging Multisensor Fusion. J. Comput. Civ. Eng. 2026, 40, 04026012. [Google Scholar] [CrossRef]
  33. Wu, G.; Tan, Y.; Xu, Z.; Yuan, Z.; Zhang, J.; He, Y.; Wang, C. XAI-Aided Method for Accurately Assessing the Stability of Unlined Double Tunnels in Rock Masses. Transp. Geotech. 2026, 61, 102052. [Google Scholar] [CrossRef]
  34. Tong, L.; Fu, L.; Wu, B.; Xu, C.; Lim, C.W.; Ding, H. Particle Shape Effect on Creep and Fluidity of Granular Packing. J. Eng. Mech. 2025, 151, 04025. [Google Scholar] [CrossRef]
  35. Shariati, M.; Mafipour, M.S.; Ghahremani, B.; Azarhomayun, F.; Ahmadi, M.; Trung, N.T.; Shariati, A. A Novel Hybrid Extreme Learning Machine–Grey Wolf Optimizer (ELM-GWO) Model to Predict Compressive Strength of Concrete with Partial Replacements for Cement. Eng. Comput. 2022, 38, 757–779. [Google Scholar] [CrossRef]
  36. Anselin, L. Spatial Econometrics: Methods and Models; Studies in Operational Regional Science; Springer: Dordrecht, The Netherlands, 1988; Volume 4. [Google Scholar]
  37. Rosenbaum, P.R.; Rubin, D.B. The Central Role of the Propensity Score in Observational Studies for Causal Effects. Biometrika 1983, 70, 41–55. [Google Scholar] [CrossRef]
  38. Cervero, R.; Kockelman, K. Travel Demand and the 3Ds: Density, Diversity, and Design. Transp. Res. Part D Transp. Environ. 1997, 2, 199–219. [Google Scholar] [CrossRef]
  39. Ewing, R.; Cervero, R. Travel and the Built Environment: A Meta-Analysis. J. Am. Plan. Assoc. 2010, 76, 265–294. [Google Scholar] [CrossRef]
  40. Abadie, A.; Imbens, G.W. Bias-Corrected Matching Estimators for Average Treatment Effects. J. Bus. Econ. Stat. 2011, 29, 1–11. [Google Scholar] [CrossRef]
  41. An, Q.; Dong, Y.; Dong, W.; Xiao, S. Spatiotemporal Dynamics and Nonlinear Landscape-Driven Mechanisms of Urban Heat Islands in a Winter City: A Case Study of Harbin, China. Sustain. Cities Soc. 2025, 133, 106842. [Google Scholar] [CrossRef]
  42. He, Q.; Liu, M.; Fang, X.; Iqbal, N. Public Environmental Attention and Corporate Greenwashing in China. Politicka Ekon. 2026. Online ahead of print. [Google Scholar] [CrossRef]
Figure 1. Research methodology flowchart.
Sustainability 18 07086 g001
Figure 2. Spatial distribution of LEED-certified (green) and non-LEED (red) buildings.
Sustainability 18 07086 g002
Figure 3. Elbow graph.
Sustainability 18 07086 g003
Figure 4. Principal component analysis.
Sustainability 18 07086 g004
Figure 5. Average annual energy consumption across building clusters.
Sustainability 18 07086 g005
Figure 6. Average annual energy consumption per sqft across building clusters.
Sustainability 18 07086 g006
Figure 7. Network of structural neighbors for k = 5. Each green node represents a LEED-certified building, and connected gray nodes represent its matched non-LEED structural peers within the 1000 m caliper. Edges link each certified building to its matched controls; controls connected to more than one certified building (reused controls) appear as shared nodes. Across all certified buildings, 160 unique non-LEED controls were used at k = 5, a portion of which served as comparators for multiple certified buildings (reuse ratio 1.45). Edge lengths are not drawn to geographic scale; matched distances at k = 5 had a median of 268 m.
Sustainability 18 07086 g007
Figure 8. Neighborhood energy profiles by structural peer count (k).
Sustainability 18 07086 g008
Figure 9. Energy difference between LEED-certified and non-LEED buildings.
Sustainability 18 07086 g009
Figure 10. Distribution of per-building matched energy differences (LEED-certified minus mean of matched non-LEED peers) for k = 3, 5, and 10. Boxes denote the interquartile range, the central line the median, the orange diamond the mean, whiskers the 1.5 × IQR range, and individual points the outliers. The dashed line at zero indicates parity.
Sustainability 18 07086 g010
Table 1. Building characteristics potentially impact energy consumption.
VariableDescriptionType
Total Floor AreaThe gross square footage of the building.Continuous
Year BuiltThe original year of construction, representing the building’s vintage.Continuous
Latitude/LongitudeGeographical coordinates representing the spatial siting of the project.Continuous
Number of BuildingsThe count of individual structures within a single portfolio ID.Discrete
Property TypeThe primary functional use of the building (e.g., Office, School).Categorical
Table 2. Matching diagnostics.
KLEED MatchedExcludedUnique ControlsMatch SlotsReuse RatioMean Dis. (m)Median Dist. (m)Ave. Neighbors
35351151491.303092272.81
55351602321.453422684.38
105352254041.803983487.66
Table 3. Features balance check.
CovariateSMD Before MatchingSMD After Matching
Floor area0.5560.200
Year built0.5170.428
Energy intensity0.2280.201
Latitude−0.6240.102
Longitude−0.2860.125
Table 4. Models’ hyperparameters and configurations.
StageModel/MethodHyperparameterValue/SettingStability Check (Reported)
Feature screeningRandom ForestEstimators (trees)300Top-predictor importance stable across 10 seeds (mean 43.4%, SD 0.6%)
Random seedFixed
Predictor scalingStandardized
Importance metricMean Decrease in Impurity
Validation5-fold cross-validation
Lasso RegressionPenaltyL1
λ (regularization)Selected by cross-validation
Predictor scalingStandardized
ClusteringK-Meansk tested (elbow)2–15Silhouette; Calinski–Harabasz
Centroid initializations10
Random seedFixed
Feature encodingOne-hot (property type)
Feature scalingZ-score normalization
Spatial matchingGeographically constrained KNNNeighbors k3, 5, 10Results reported at all three k (sensitivity)
Distance metricHaversine (great-circle)
Caliper1000 m
Match directionOne-directional (LEED → non-LEED)
Statistical testingHypothesis testsMean-difference testOne-sample t-testWilcoxon, trimmed-mean, outlier-excluded, permutation, and Bonferroni/BH corrections also reported
Significance level95% (α = 0.05)
Normality testShapiro–Wilk
Correlation methodSpearman rank (α = 0.05)
Table 5. Feature Engineering Results.
VariableRandom Forest ImpactLasso Coefficient (Direction)
Total EnergySite EUISource EUIWx-Norm Site EUIGHG IntensityTotal Energy
Total Floor Area33.90%25.3%24.1%25.0%60.1%+211,931 (Large size → High Energy)
Latitude (Location)18.80%15.4%14.0%14.6%11.6%Zeroed (Non-linear impact)
Longitude (Location)16.80%24.8%28.2%25.0%15.1%Zeroed (Non-linear impact)
Year Built (Age)15.00%17.5%17.8%18.1%5.1%Zeroed (Non-linear impact)
Property type6.80%16.7%15.7%17.0%8.0%Zeroed (Non-linear impact)
Number of Buildings1.82%0.4%0.3%0.5%0.1%Zeroed (Non-linear impact)
Table 6. Descriptive characteristics of the ten structural clusters.
ClusterDescriptionN (Total)N (LEED)Median Floor (ft2)IQR (ft2)Median Year BuiltMedian EUIDominant Type
1Residential44411110,25083,821–174,645197312.6Multifamily housing
2Education288987,66171,242–152,442195620K-12/college
3Lodging394208,197105,078–283,450198319.8Hotels
4Mixed/other2432112,44087,822–188,832197411.3Mixed-use/municipal
5Industrial136198,68569,587–161,05119754.7Warehouse/storage
6Office12024196,162105,750–591,321197315.4Office
7Utility400120,80065,213–217,525195010Parking/data center
8Public/cultural282113,36481,955–145,920195613.5Museums/worship
9Healthcare474207,920144,621–276,535196542Hospital/laboratory
10Retail181115,85583,224–137,119199117.7Retail
Table 7. t-test Results.
kMetricnMean_DiffMedianSDCohen_dt_Test_pCI95_LowCI95_HighWilcoxon_pTrimmed_mean_10pctOutlier_excl_p
3Total Energy (kWh)532,086,450.9
LEED +
354,273.817,086,560.90.1220.3781−2,513,707.66,686,609.40.10431,956,458.30.0063
5Total Energy (kWh)533,153,710.7
LEED +
1,241,597.414,933,1560.2110.1302−866,693.77,174,115.10.09171,922,5480.0251
10Total Energy (kWh)533,740,945.6
LEED +
435,54815,262,865.70.2450.0802−368,225.57,850,116.60.05532,228,964.60.0068
3Energy Intensity (kWh/ft2)5358.1
LEED +
−3.33830.1520.2747−45161.20.4816−1.50.8514
5Energy Intensity (kWh/ft2)5356.4
LEED +
−3.8383.80.1470.2893−46.9159.80.3413−3.40.6529
10Energy Intensity (kWh/ft2)5359
LEED +
−4.4383.40.1540.2678−44.2162.2 −2.50.997
Table 8. Spearman rank correlations.
RelationshipSpearman ρp
EA% vs. energy use intensity (kWh/sq ft)0.0850.551
EA% vs. total energy (kWh)0.2030.148
Disclaimer/Publisher’s Note: The statements, opinions and data contained in all publications are solely those of the individual author(s) and contributor(s) and not of MDPI and/or the editor(s). MDPI and/or the editor(s) disclaim responsibility for any injury to people or property resulting from any ideas, methods, instructions or products referred to in the content.