Article

Energy Management of a Smart Multi-Carrier Energy Hub Systems for Low Carbon Emissions with a Carbon Capture Unit


1
Department of Electrical Engineering, Faculty of Engineering, Sohag University, Sohag 82524, Egypt
2
Department of Electrical Engineering, University of Jaén, EPS Linares, 23700 Linares, Jaén, Spain
3
College of Engineering, Ahlia University, Manama P.O. Box 10878, Bahrain
4
Department of Electrical Engineering, Faculty of Engineering, Qena University, Qena 83523, Egypt
5
Department of Electrical Engineering, American University of Sharjah, Sharjah 26666, United Arab Emirates
*
Author to whom correspondence should be addressed.
Sustainability 2026, 18(14), 6975; https://doi.org/10.3390/su18146975
Submission received: 19 May 2026 / Revised: 25 June 2026 / Accepted: 6 July 2026 / Published: 8 July 2026

Abstract

The energy management (EM) of smart multi-carrier energy hub (SMCEH) systems for cost and emission reduction remains a challenging problem due to the diversity of renewable energy resources (RERs), varying load demands, and the stochastic nature of these resources. This paper addresses the EM problem of SMCEHs to minimize operational costs and greenhouse gas (GHG) emissions using the particle swarm optimization (PSO) algorithm. The studied SMCEHs are designed to simultaneously supply electrical, cooling, and thermal demands. The hub system comprises wind turbines (WTs), photovoltaic (PV) panels, gas turbines (GT), electric chillers (EC), gas boilers (GBs), absorption chillers (AC), battery storage systems, and thermal storage units. To assess system performance and the impact of key technologies, three case studies are investigated: (i) EM of SMCEHs without RERs, (ii) EM of SMCEHs with RERs, and (iii) EM of SMCEHs with RERs and an integrated carbon capture unit (CCU). These scenarios enable a systematic evaluation of the role of renewable integration and carbon capture in enhancing system performance. The results demonstrate that incorporating RERs into SMCEHs leads to a substantial reduction in both operational costs and GHG emissions. Furthermore, the integration of a CCU provides additional emission reductions, underscoring its effectiveness in supporting the low-carbon operation of SMCEHs. The obtained results show that integrating RERs into SMCEH decreases the total cost and emissions by 64.12% and 7.95%, respectively, compared to the scenario without RERs. Furthermore, the integration of the CCU into SMCEHs provides a 39.36% reduction in total costs and a 72.57% decrease in CO2 emissions. The suggested energy management solution promotes a sustainable and low-carbon emission system by maximum utilization of the RERs and CCU.

1. Introduction

Recently, numerous research works focused on energy management of MCEHs to reduce system costs, including operational costs, electricity purchasing from the electric network, and the cost of the consumed gas used to feed different equipment, such as gas turbines and gas boilers, and also to reduce carbon dioxide emissions; furthermore, they aim to maximize the utilization of the RERs and improve economic efficiency. Some economic studies consider carbon emissions to reflect environmental effects [1]. For instance, the authors in [2] proposed an interval-based framework to decrease the deviation and operational costs of a multi-carrier energy hub that supplies multiple load demands, such as heating demand (HD), electricity demand (ED), cooling demand (CD), and water demand. However, the total emissions produced were not considered in this paper. In [3], a dual-objective optimization framework was presented that incorporates environmental and economic considerations within an MCEH system to feed multiple loads: electric load, heating load, water load, and gas load. This work aimed to reduce operational and emission costs. However, the cooling hub was not considered. Ref. [4] assessed the economic–environmental operation of an MCEH system with electrical, heating, water, and cooling hubs to maximize the synergy and efficiency of the distribution networks. The authors proposed a multi-objective decision-making method to reduce total operating costs.
The authors in [5] suggested a multi-decision-making model to reduce the carbon capture and power generation costs of the integrated multi-carrier energy hub. In [6], a two-layer framework was suggested to assign the best configuration of an MCEH system. The aim of the first layer was to increase the revenue from using WTs and PV units, while the aim of the second layer was to reduce emissions. Ref. [7] introduced a mixed-integer non-linear programming to optimize the gas and electricity networks that serve electrical, heating, and gas demands. This method aimed to reduce overall costs, including the costs of energy conversion, generation, and purchased gas and electricity. However, a cooling hub was not considered in this paper. The authors in [8] developed a hybrid information gap decision theory to solve the energy management of an MCEH system that feeds various loads, such as electric load, gas load, and heating load. The limitation of this paper is that emission reduction was not considered. Moreover, the cooling hub was not taken into account.
L. Xu [9] applied a modified particle swarm optimization (PSO) to an MCEH system that serves electrical and heating loads to improve sustainability and efficiency. The proposed mode simultaneously reduces emissions and operational costs. However, the cooling hub was not considered in this paper. Lorestani et al. [10] applied PSO for the optimal operating plan of a decentralized MCEH for annual gross expenditures minimization. In terms of consumed gas cost reduction and enhancement of utilization of renewable energy resources and power-to-gas low-carbon operation, power-to-gas (P2G) technology plays an important role in MCEHs operation with the high penetration of RERs and emission reduction. Yun Y et al. [11] employed a two-stage model of power-to-gas equipment coupling to facilitate low-carbon MCEH system operations. In [12], Li X et al. applied P2G and carbon capture technologies to an integrated energy system that included a hybrid centralized PV system and CHP to reduce costs and emissions; Meysam et al. [13] evaluated the role of P2G technology within integrated gas–electricity systems. Their findings demonstrate that incorporating P2G significantly reduces wind power curtailment while enhancing overall economic performance. The shortage of this paper is that the other types of RERs, such as PV, were not considered.
Zhang G et al. [14] proposed a carbon cycle system that combines P2G, CCU, and a CO2 cycle. In this system, the curtailment rate of RER and the emissions were reduced considerably. In [15], an efficient model was suggested for low-carbon operation with integration of P2G heat recovery and CCU to minimize total operational costs of the system. He et al. [16] proposed a co-optimization framework of two energy systems considering P2G technology. The authors in [17] proposed a multi-objective design model for energy hubs considering load growth, variation in energy price, and converter degradation. They proved that integrating P2G improves design accuracy and reduces CO2 emissions. In [18], a fundamental model of a carbon capture power plant based on CCS technology was developed to evaluate the moderating effect of mitigation policies on CCS and identify feasible policy portfolios to improve the efficiency of CCS mitigation. Simultaneously, Cui et al. [19] presented an operational framework for a carbon capture power plant that integrates power-to-gas and carbon storage technologies.
The authors in [20] proposed an energy management model of an MCEH system based on the coupling characteristics of P2G and WTs under gas fluctuations. An excellent model was presented. A CSP–P2G–CHP-like operation system was built, which helps to reduce the uncertainty of WTs and PVs and enhance their capacity to use a large percentage of clean energy [21]. Chen L et al. [22] presented an efficient framework for a thermal, gas, and electric energy system that combines energy storage and P2G technology. The framework integrates WTs, PVs, P2G units, and energy storage in order to maximize the internal resource usage and enhance the efficiency of the studied energy system in terms of the power-to-gas low-carbon operation.
According to the research mentioned in Table 1, it is viable to extend CCS with P2G technology to an MCEH system, including a combined heat and power unit and RERs to utilize surplus RER energy and reduce CO2 emissions. The primary contributions can be outlined as follows:
-
A multi-objective energy management framework is developed for an SMCEH supplying electrical, cooling, and thermal demands, aiming to simultaneously minimize operational costs and emissions.
-
The proposed formulation explicitly integrates renewable energy resources (RERs), the CCS, and the P2G technologies within the SMCEH modeling and optimization process.
-
A comprehensive techno-economic and environmental assessment is performed to quantify the impacts of incorporating RERs, CCS, and P2G on the overall performance of the SMCEH system.
The rest of the paper is organized as follows: modeling of the MCEH system is presented in Section 2. Section 3 focuses on clarifying the optimization function of energy management of MCEH. Section 4 presents the mathematical equations of the PSO algorithm. The problem-solving methodology is explained in Section 5. Then, Section 6 lists the results and discussion. Finally, Section 7 presents the conclusions of this work.

2. System Description

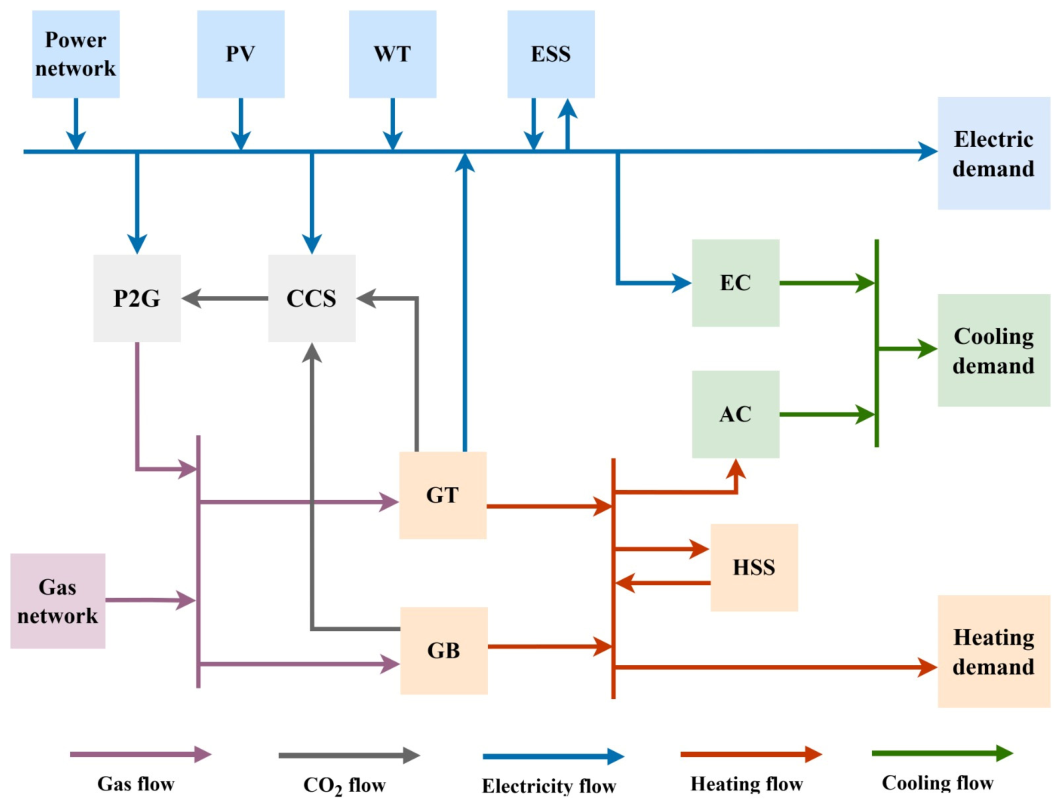
The studied MCEH system comprises three types of loads: electrical, heating, and cooling. The SMCEH comprises a set of units including PV panels, WTs, GBs, a GT, a CCS, a P2G unit, ECs, ACs, EESs, and HSSs. The electrical demand is supplied by the main power grid, WTs, PVs, and the GT, while the heating demand is provided by the GT, GBs, and the HSS; the cooling demand is supplied by the AC and EC. Figure 1 displays the MCEH system.

2.1. Electrical Hub

2.1.1. Gas Turbine

The gas turbine is fueled by natural gas to provide electricity and heat simultaneously. The generated electrical and thermal power, as well as the emissions, can be described as follows [23]:
P e G T ( t ) = η g e G T × G G T ( t )
P h G T ( t ) = η g h G T × G G T ( t )
M C O 2 G T t = φ e G T × P e G T ( t ) + φ h G T × P h G T ( t )
in which
0 P e G T ( t ) P m a x G T
where P e G T is the electrical output of the GT, P h G T is its thermal output, M C O 2 G T refers to produced emissions; η g h G T and η g e G T are the thermal and electrical conversion coefficients; G G T ( t ) is the fuel input for the GT at time t; φ e G T and φ h G T refer to electrical and thermal carbon emission coefficients. P m a x G T refers to the maximum electrical power output of GT.

2.1.2. Photovoltaic Plant

The PV panels are a generation unit that converts the solar irradiance into electric energy. The output of a PV panel ( P P V ) is based on the surrounding temperature and solar irradiance. Modeling of PV panels’ power can be assigned using Equations (5)–(9) [24]:
T c e l l t = T a m b t + G s ( t ) × T n o c t 20 0.8
I ( t ) = G s × ( t ) I S C + K i T c e l l + 20
V ( t ) = V o c K v × T c e l l t
F F = V m p p × I m p p V o c × I S C
P P V ( t ) = N P V × F F × V ( t ) × I ( t )
where T c e l l is the cell operating temperature, T a m b represents the surrounding temperature, T n o c t   refers to the nominal operating cell temperature, G s denotes the incident solar irradiance. V t and I t denote the terminal voltage and current, respectively, I S C represents the short circuit current, V o c stands for the open circuit voltage, I m p p refers to the current at the maximum point, V m p p refers to the voltage at the maximum point, F F is the form factor, K i , K v are current and voltage temperature coefficients, respectively. N P V is the number of modules.

2.1.3. Wind Turbine

The velocity of wind at a specified height ( h ) can be estimated as follows [1]:
V h = V h o × h h o α
where V h and V h o refer to the wind velocities measured at height h and h o , respectively. α refers to the shear coefficient that is affected by ground roughness, whose value ranges from 0.14 to 0.25 and is typically 1/7. The power generated by wind turbines can be expressed as follows [1]:
P W T ( t ) = N w t × 0 ,                                                                             v t v in   P r a t e d ( v t 3 v in   3 ) ( v r 3 v in   3 ) ,               v in v t v r a t e d P r a t e d ,                                                     v r a t e d v t v out   0 ,                                                                               v t v out  
where P W T stands for the generated power by the WTs. P r a t e d refers to the wind-rated power, v t stands for the instantaneous wind velocity, and v r a t e d , v out , and v in are the wind velocities at the rated, cut-off, and cut-in points, respectively. N w t refers to the total number of WT units used to form a wind turbine farm.

2.1.4. Energy Storage System (ESS)

To counteract the significant variations in power provided by RERs, ESSs are used to store electric energy. When the power generated by the RERs exceeds the loads, the excess energy produced by the RERs can be stored by these units. Additionally, energy is stored while the cost of purchasing it is low, and released to the load when the cost of energy is high. The energy storage system’s mathematical model is developed as follows [25]:
E E S S ( t ) = E E S S ( t 1 ) + ( P E S S , c h a ( t ) × η E S S , c h a )     ( P E S S , d i s t η E S S , d i s )
E E S S , m i n   E E S S ( t ) E E S S , m a x  
0 P E S S , c h a t P E S S , c h a m a x × k E S S , c h a
0 P E S S , d i s ( t ) P E S S , d i s m a x × k E S S , d i s
E E S S ( 1 ) = E E S S ( 24 )
where E E S S is the rated capacity of the energy storage unit, P E S S , c h a denotes the charging power of the ESS, and P E S S , d i s is the discharging power of the ESS. η e S S , c h a and η E S S , d i s represent the efficiencies of charging and discharging of the storage unit, respectively. E E S S , m i n is the minimum capacity level of ESS; E E S S , m a x represents the maximum capacity level of ESS. The amount of stored energy is bounded between the minimum and maximum amounts in time variation, which is constrained in (13). The charging and discharging power cannot exceed their maximum amounts, as shown in (14) and (15). It is also shown that the ESS cannot charge and discharge simultaneously. k E S S , c h a ,   k E S S , d i s refer to a binary variable that limits the charging and discharging power. Equation (16) demonstrates that the energy portion in ESS should be equal in the first and last hours of the dispatch period.

2.2. Heating Hub

The heating hub uses a GB, a GT, and a heat storage system (HSS) to provide the required heat energy to the users. The gas turbine’s output heat power can be calculated using Equation (2).

2.2.1. Gas Boiler

A gas boiler (GB) is a heating device that burns natural gas or liquefied petroleum gas to generate hot water or steam for space heating. The output heat power of the GB and the carbon emissions can be calculated as follows [23]:
H G B t = G G B t × η G B
M C O 2 G B t = φ G B × H G B t
where H G B refers to the output heat power of the GB, G G B refers to the consumed natural gas by GB, and η G B represents the gas boiler efficiency for generating heat. M C O 2 G B t is the gas boiler carbon emission. φ G B refers to the carbon emission coefficient of GB, which equals 0.359 (kg/kWh) [26]. There are some constraints to the H G B t that should be considered; they are defined as follows [27]:
0 H G B t H G B m a x t
Here, the amount of H G B t is constrained by the maximum amount of H G B m a x t .

2.2.2. Heat Storage System (HSS)

Once the energy storage device is charged, it can be considered a load, and once released, it can be thought of as a source of energy [1]. When the thermal demand is low, surplus recovered waste heat is accumulated in the heat storage system (HSS). During periods of increased heating demand, the stored thermal energy is discharged to satisfy the users’ heat requirements. HSSs can reduce thermal energy waste to some extent, address the issues brought up by the discrepancy between energy heat supply and demand in terms of geography, time, or intensity, and increase the efficiency of energy in electric cooling and heating comprehensive energy systems. Representation of HSS can be described using the following [25]:
H H S S ( t ) = H H S S ( t 1 ) + ( P H S S , s t o ( t ) × η H S S , s t o )     ( P H S S , r e l t η H S S , r e l )
H H S S , m i n H H S S ( t ) H H S S , m a x
0 P H S S , s t o t P H S S , s t o m a x × k H S S , s t o
0 P H S S , r e l ( t ) P H S S , r e l m a x × k H S S , r e l
H H S S ( 1 ) = H H S S ( 24 )
where H H S S refers to the heat storage capacity of the HSS. H H S S , m i n represents the minimum capacity level of HSS, H H S S , m a x is the maximum capacity level of HSS. P H S S , s t o and P H S S , r e l refer to the stored and released heat energies of the HSS, respectively. η H S S , s t o   and η H S S ,   r e l denote the storing and releasing efficiencies of the HSS, respectively.

2.3. Cooling Hub

The EC and the AC are used to provide the cooling energy to the cooling demand.

2.3.1. Electric Chiller

The EC takes the electrical power from the power hub and converts it to cooling energy, which is presented as follows [23]:
P E C ( t ) × C O P E C = C E C ( t )
0 P E C ( t ) P E C m a x    
where C E C t refers to the output cooling power of the EC, P E C ( t ) is the electric energy consumed by the EC. C O P E C stands for the performance coefficient of EC. Equation (26) represents the input power limits to the EC.

2.3.2. Absorption Chiller

The AC is a thermally driven refrigeration system that utilizes heat to produce cooling. The mathematical model of the AC with its coefficient performance can be presented as follows [23]:
H A C ( t ) × C O P A C = C A C ( t )
0 H A C ( t ) H A C m a x      
where C A C refers to the output cooling power of the AC, H A C represents the absorbed heat energy by AC. C O P A C refers to the performance coefficient of AC. Equation (28) limits the input heat to the AC.

2.4. P2G–CCS Coupling Operation Mechanism

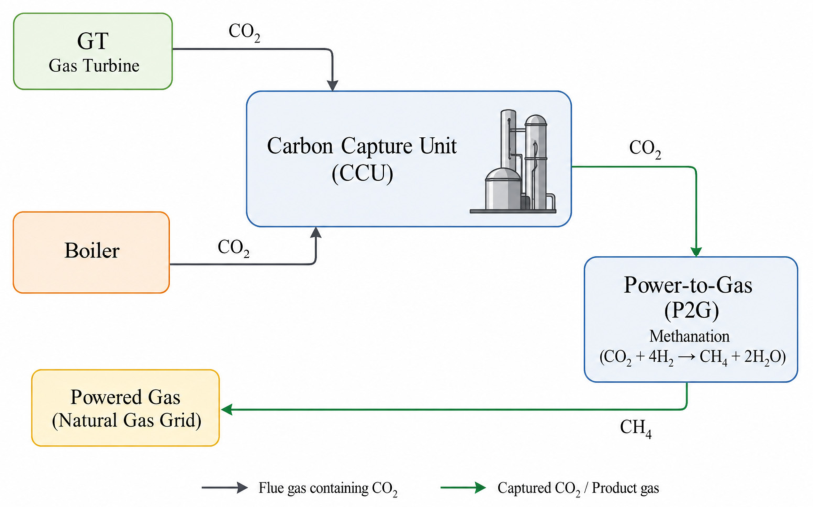
To improve system performance, this work integrates P2G and CCS technologies. The P2G process facilitates energy exchange between the electricity and gas infrastructures through electricity-to-gas conversion, while CCS technology decreases carbon emissions by capturing CO2 produced during system operation. The CCS and the P2G unit operate in a synergistic manner where the CCS captures CO2 emitted from the gas turbine and the boiler supplies it to the methanation reactor, while the P2G system converts the electricity into hydrogen through water electrolysis. The captured CO2 and produced hydrogen react in the methanation process to generate synthetic methane (CH4), which can be injected into the natural gas network. Figure 2 shows the coupling operation of CCS and P2G units.

2.4.1. Carbon Capture System Modeling

The amount of CO2 captured by the carbon capture unit can be expressed as
M C O 2 t t = M C O 2 G T t + M C O 2 G B t
M C O 2 C C S t = M C O 2 t t × η C C S
In the formula, M C O 2 t t is the total amount of CO2. M C O 2 G T t and M C O 2 G B t are the CO2 emissions of the GT and GB, respectively. M C O 2 C C S refers to the amount of CO2 captured by the carbon capture unit. η C C S is the CO2 capture efficiency of CCS, which equals 0.65 [28]. In addition, the electricity consumption of the CCS process at time t can be calculated as follows [28]:
P C C S t = M C O 2 C C S t × C C S
where P C C S represents the operating power of the carbon capture unit. C C S refers to the energy consumption coefficient required for the carbon capture unit to capture CO2, which equals 0.21 (kWh/kg CO2) [20].

2.4.2. Power-to-Gas Unit (P2G)

The P2G technology enhances the coordination between electrical and natural gas systems through the conversion of electrical power into natural gas, leading to more efficient energy utilization. The gas power produced by P2G can be calculated as follows [29]:
P P 2 G t = M C O 2 C C S t μ P 2 G
G P 2 G t = P P 2 G t × P 2 G
where P P 2 G represents the electrical power consumed by P2G; μ P 2 G refers to the conversion coefficient of electricity and carbon; G P 2 G refers to the natural gas generated by the P2G unit at time t; P 2 G represents the conversion efficiency of P2G.

3. Problem Formulation

3.1. Objective Function

The primary goal of energy management of MCEHs is to minimize the total cost, which encompasses the daily operation cost, the energy procurement expenses, the emissions cost, and the gas procurement cost. The minimized function can be represented by the following equation:
M i n i m i z e   F = F o p + F g r i d + F g a s + F c o 2
where F o p represents the operational cost of all units. F g r i d stands for the energy cost from or to the power grid. F g a s refers to the cost of the consumed gas. F c o 2 describes the cost associated with carbon emission. Each term in the formula is defined as follows:
F o p = F G T + F P V + F W T + F G B + F E S S + F H S S + F E C + F A C     = t = 1 24 ( γ G T × P G T t + γ P V × P P V t + γ W T × P W T t + γ G B × H G B t     + γ E S S × P E S S t + γ H S S × P H S S t + γ E C × C E C t + γ A C × C A C ( t ) )
F g r i d = t = 1 24 P g r i d , b u y t × γ b u y t P g r i d , s e l l t × γ s e l l ( t )
F g a s = γ g a s × t = 1 24 G g G T t + G g G B ( t )
F c o 2 = γ c o 2 × t = 1 24 M C O 2 t t = γ c o 2 × t = 1 24 M C O 2 G T t + M C O 2 G B t
where γ G T , γ P V , γ W T , γ G B ,   γ E S S , γ H S S , γ E C , and γ A C are the operational cost coefficients of GT, PV, WT, GB, ESS, HSS, EC, and AC, respectively. P g r i d , b u y and P g r i d , s e l l stand for the produced and the sold energies from or to the main power grid. γ b u y and γ s e l l are the time of use (TOU) prices of procured and sold energy. γ g a s refers to the natural gas unit price, γ c o 2 refers to the treatment cost of emission (USD/Kg).

3.2. The Operating Constraints

The balance of electrical, thermal, cooling, and gas power must be taken into account in addition to the operational limitations of each unit in the MCEH. These can be represented as follows:
  • Electrical Power Balance Constraint
P e G T ( t ) + P P V t + P W T t + P E S S , d i s t + P g r i d , b u y t = P E D t + P E S S , c h a t + P E C t + P C C S t + P P 2 G t + P g r i d , s e l l t
where P E D t donates the total electric load demand.
  • Thermal Power Balance Constraint
P h G T t + H G B t + P H S S , r e l t = H H D t + P H S S , s t o t + H A C ( t )
where H H D t donates the total heating load demand.
  • Cooling Power Balance Constraint
C A C t + C E C t = C C D ( t )
C C D t donates the total cooling load demand.
  • Gas Power Balance Constraint
G G T t + G G B t = G P 2 G t + G b u y t
where G P 2 G t and G b u y t refer to the gas produced by the P2G unit and the gas purchased from the gas network.

4. Particle Swarm Optimization (PSO)

The PSO algorithm was selected for the energy management of the SMCEH problem, as it is a robust optimization algorithm with the ability to find the best and accurate solutions of the non-linear and non-convex optimization problems with superior convergence speed. PSO models individuals as particles moving through a search space, where they are considered to have no mass or volume. Each particle’s motion is characterized by its position and velocity, both of which are iteratively updated based on the particle’s own experience as well as the collective experience of the swarm [6]. To better understand this process, consider a general global optimization problem, which can be represented as follows:
min = f x ,           x = ( x 1 ,   x 2 ,   x 3 ,   ,   x n )
The position ( x i ) and the velocity ( v i ) of the ith population are indicated as
x i = ( x i 1 ,   x i 2 ,   x i 3 ,   ,   x i n )
v i = ( v i 1 ,   v i 2 ,   v i 3 ,   ,   v i n )
The particle’s best position for all iterations is
p b e s t = ( p i 1 ,   p i 2 ,   p i 3 ,   . , p i n )  
And the best global position in the search space is
g b e s t = ( g b e s t 1 ,   g b e s t 2 ,   g b e s t 3 ,   . , g b e s t n )  
The populations’ positions and their velocities are updated as follows [30]:
v i ( t + 1 ) = v i ( t ) + β 1 ×   g b e s t ( t ) x i ( t )   + α 2 ×   p b e s t , i ( t ) x i ( t )  
x i ( t + 1 ) = x i ( t ) + v i ( t + 1 )
where 1 and 2 stand for two random variables. β and α refer to the acceleration constants. Each individual updates the current position.

5. Methodology

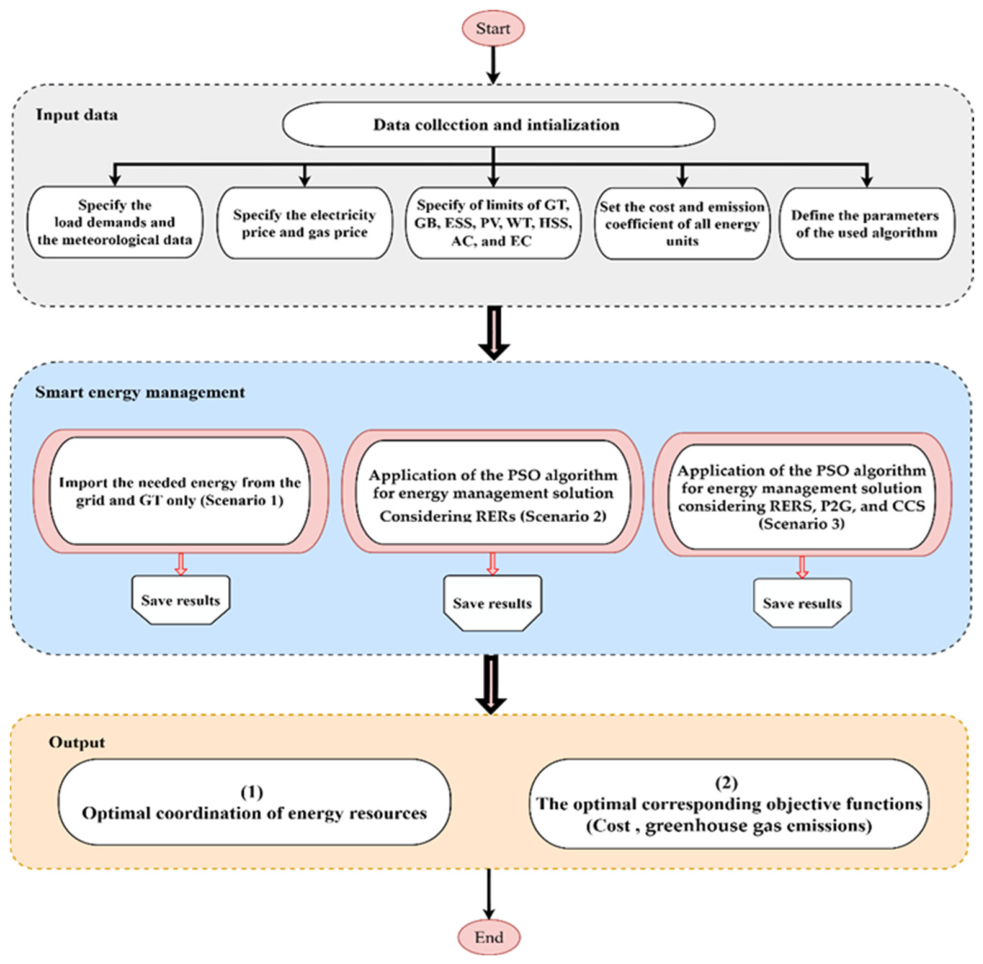
This study adopts a structured optimization framework for optimal scheduling and operation of the MCEH system. Figure 2 demonstrates the proposed optimization methodology for the MCHE system. The overall methodology is structured into three main stages: data acquisition and initialization, energy management through optimization, and performance evaluation.

5.1. Data Acquisition and Initialization

In this stage, all necessary input data and system parameters are collected and initialized to accurately represent the operational environment of the MCEH system. This includes the specification of electrical, heating, and cooling demands, in addition to the time-of-use electricity price and natural gas price. The operational constraints and capacity limits of all system components are also established, including the GT, GBs, PV panels, WTs, EESs, HSSs, Acs, and Ecs. Furthermore, cost coefficients and carbon emission factors associated with each energy unit are determined. Finally, the control parameters of the optimization algorithm are configured to ensure convergence and computational efficiency.

5.2. Energy Management via Optimization

The second stage aims to find the optimal scheduling of the MCEH system using the PSO algorithm. The optimization process aims to achieve an optimal balance between economic performance and environmental impact under different operational scenarios.
The three distinct scenarios can be presented as follows:
  • Scenario 1 (Conventional Operation):
    The system operates using conventional energy sources, where the load demand is primarily satisfied by the power grid and gas turbine units without incorporating RERs or advanced energy management strategies.
  • Scenario 2 (Integration of RERs):
    RERs, including wind and photovoltaic generation, are integrated into the system. The PSO algorithm is applied to optimally coordinate energy flows and to improve system efficiency while reducing operational costs and emissions.
  • Scenario 3 (Integrated Low-Carbon Operation):
    In this scenario, advanced technologies such as P2G and CCS are incorporated alongside RERs. The PSO-based optimization framework is utilized to simultaneously minimize system operating costs and carbon emissions, enabling a low-carbon operational strategy.
For each scenario, the optimization algorithm iteratively updates decision variables, including power generation, energy storage scheduling, and load allocation, until convergence is achieved. The resulting optimal solutions are recorded for further analysis.

5.3. Performance Evaluation and Output Analysis

In the final stage, the optimization results obtained from each scenario are analyzed and compared to evaluate system performance. The key outputs include
  • Optimal coordination and scheduling of energy resources:
    Determination of the most efficient scheduling and allocation of energy sources within the system.
  • Objective function evaluation:
    Assessment of total operational cost and greenhouse gas emissions as primary performance indicators. This comparative analysis enables the identification of the most effective operational strategy in terms of both economic efficiency and environmental sustainability.
The procedure of the proposed solution framework is depicted in Figure 3.

6. Simulation Results and Analysis

The energy management of the MCEH system is solved for cost and emission reduction concurrently. The topology of the MCEH system is presented in Figure 1. The studied system includes multiple energy sources, PV units, WTs, a gas turbine, a gas boiler, a P2G unit, and a CCS unit. The energy management solution strategy aims to achieve optimal coordination among various energy units. The PSO is utilized to solve the energy management problem, where the selected parameters of the PSO, including β ,   α , the maximum number of iterations, and particles of PSO are 2, 2, 70, and 500, respectively. The simulations were executed using MATLAB software (MATLAB 2021a) on a 2.1 GHz Core i5 PC with 16 GB RAM. Three scenarios are discussed and studied to evaluate the influence of integrating RERs, P2G, and CCS with the energy management solution.

6.1. Parameters and Input Data

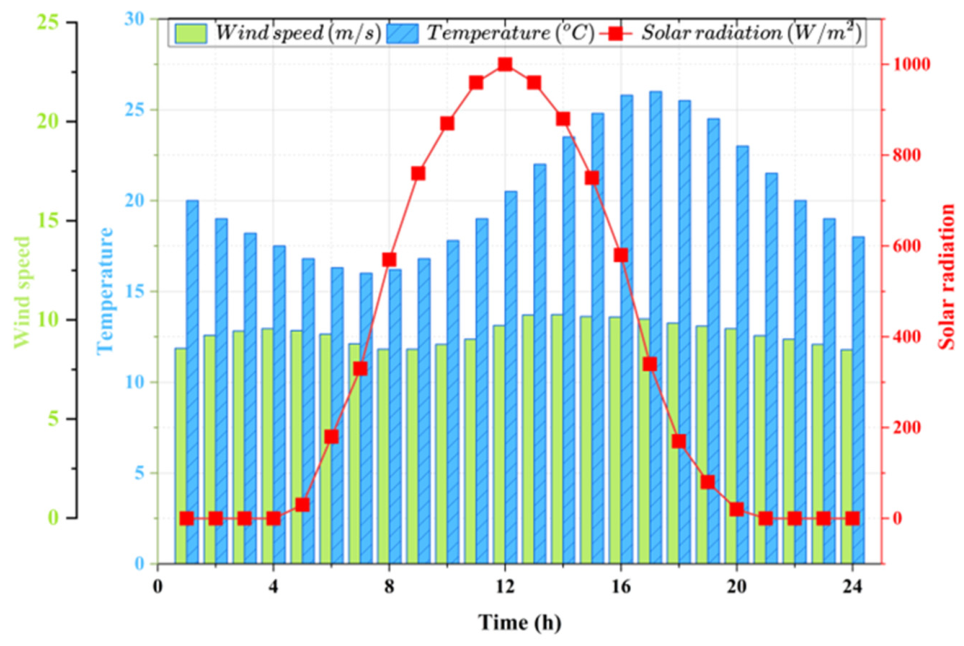
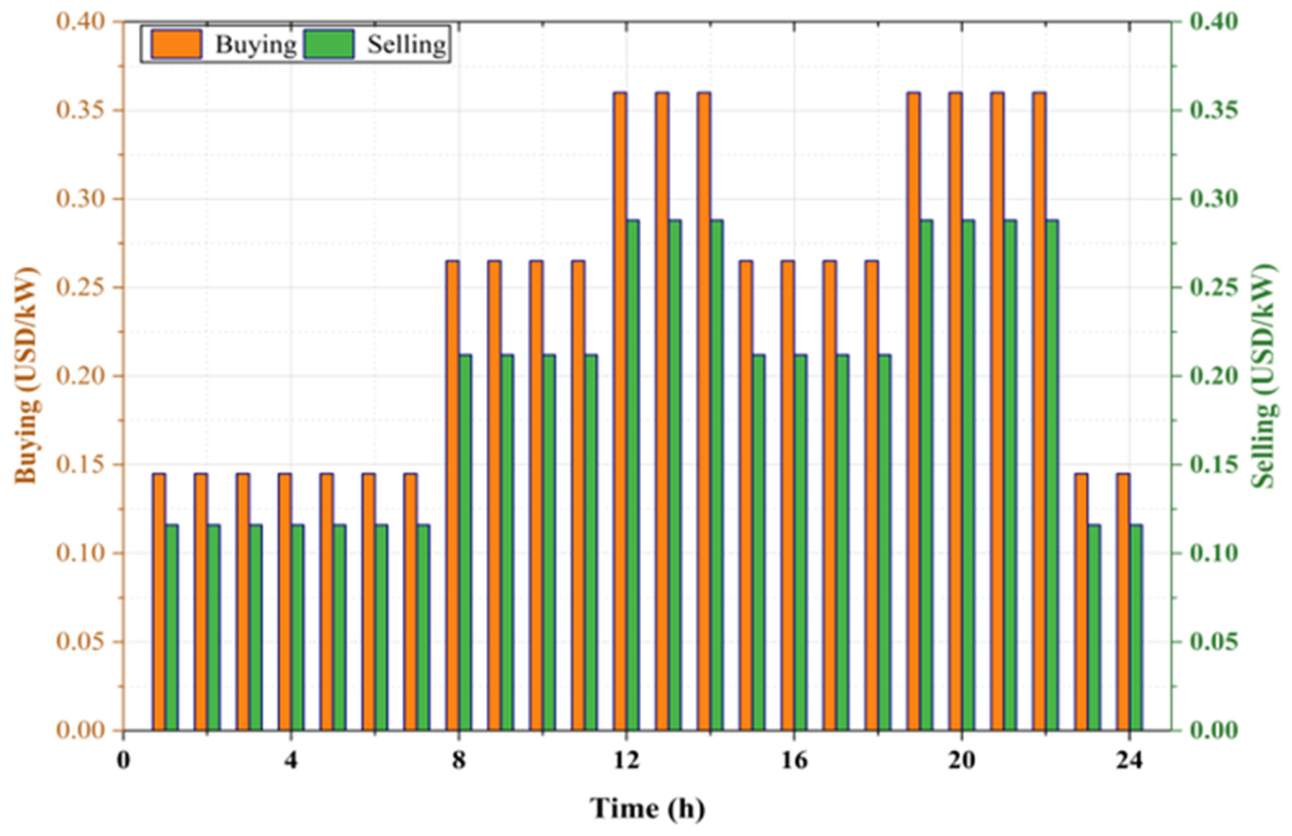
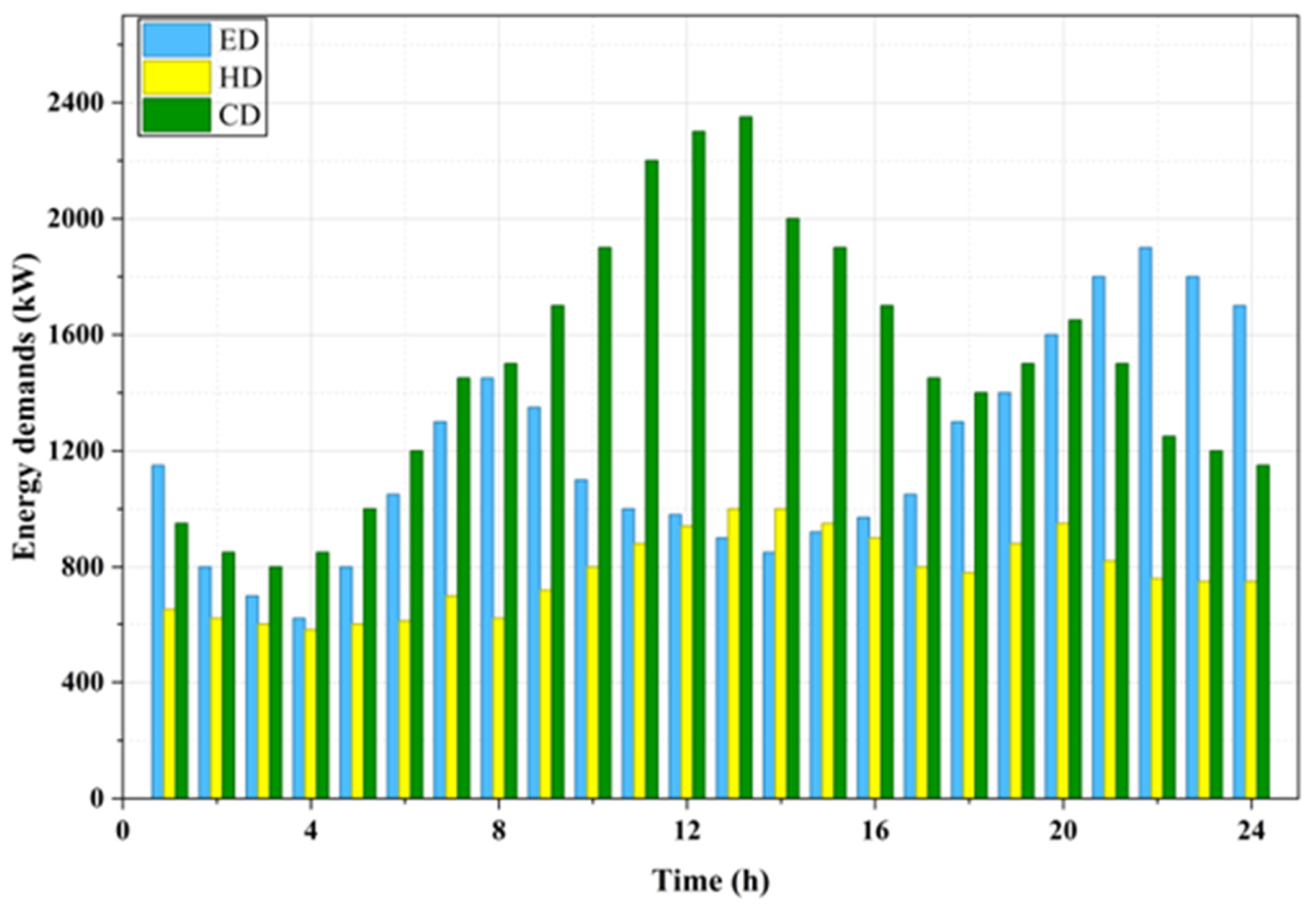
This section lists the system parameters used in this work. The economic and technical data, including the parameters of energy units, are depicted in Table 2. The prices of buying and selling energy are displayed in Figure 4 [23]. Additionally, Figure 5 shows the profile of all load demands [23]. The ambient temperature, solar radiation, and wind speed are presented in Figure 6 [31,32].

6.2. Case Studies and Simulation Results

Three scenarios are discussed and studied to evaluate the influence of the integration of RERs, P2G, and CCS with the energy management solution and validate the effectiveness of the suggested solution methodology, which are listed as follows:
  • Scenario 1: Energy management without incorporating RERs.
  • Scenario 2: Energy management with the incorporation of RERs.
  • Scenario 3: Energy management of the MCEH system considering RERs, an integrated CCS unit, and P2G technology.
The studied scenarios are discussed in detail as follows, and the results of the three scenarios are tabulated in Table 3.

6.2.1. Scenario 1

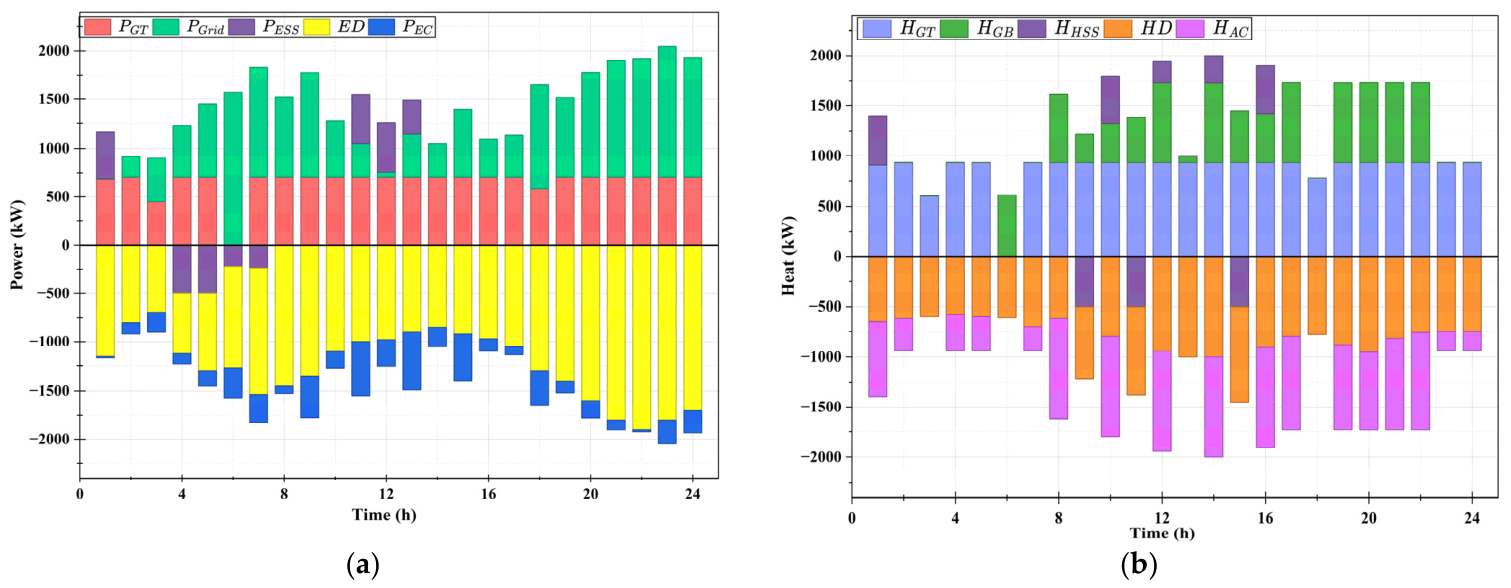
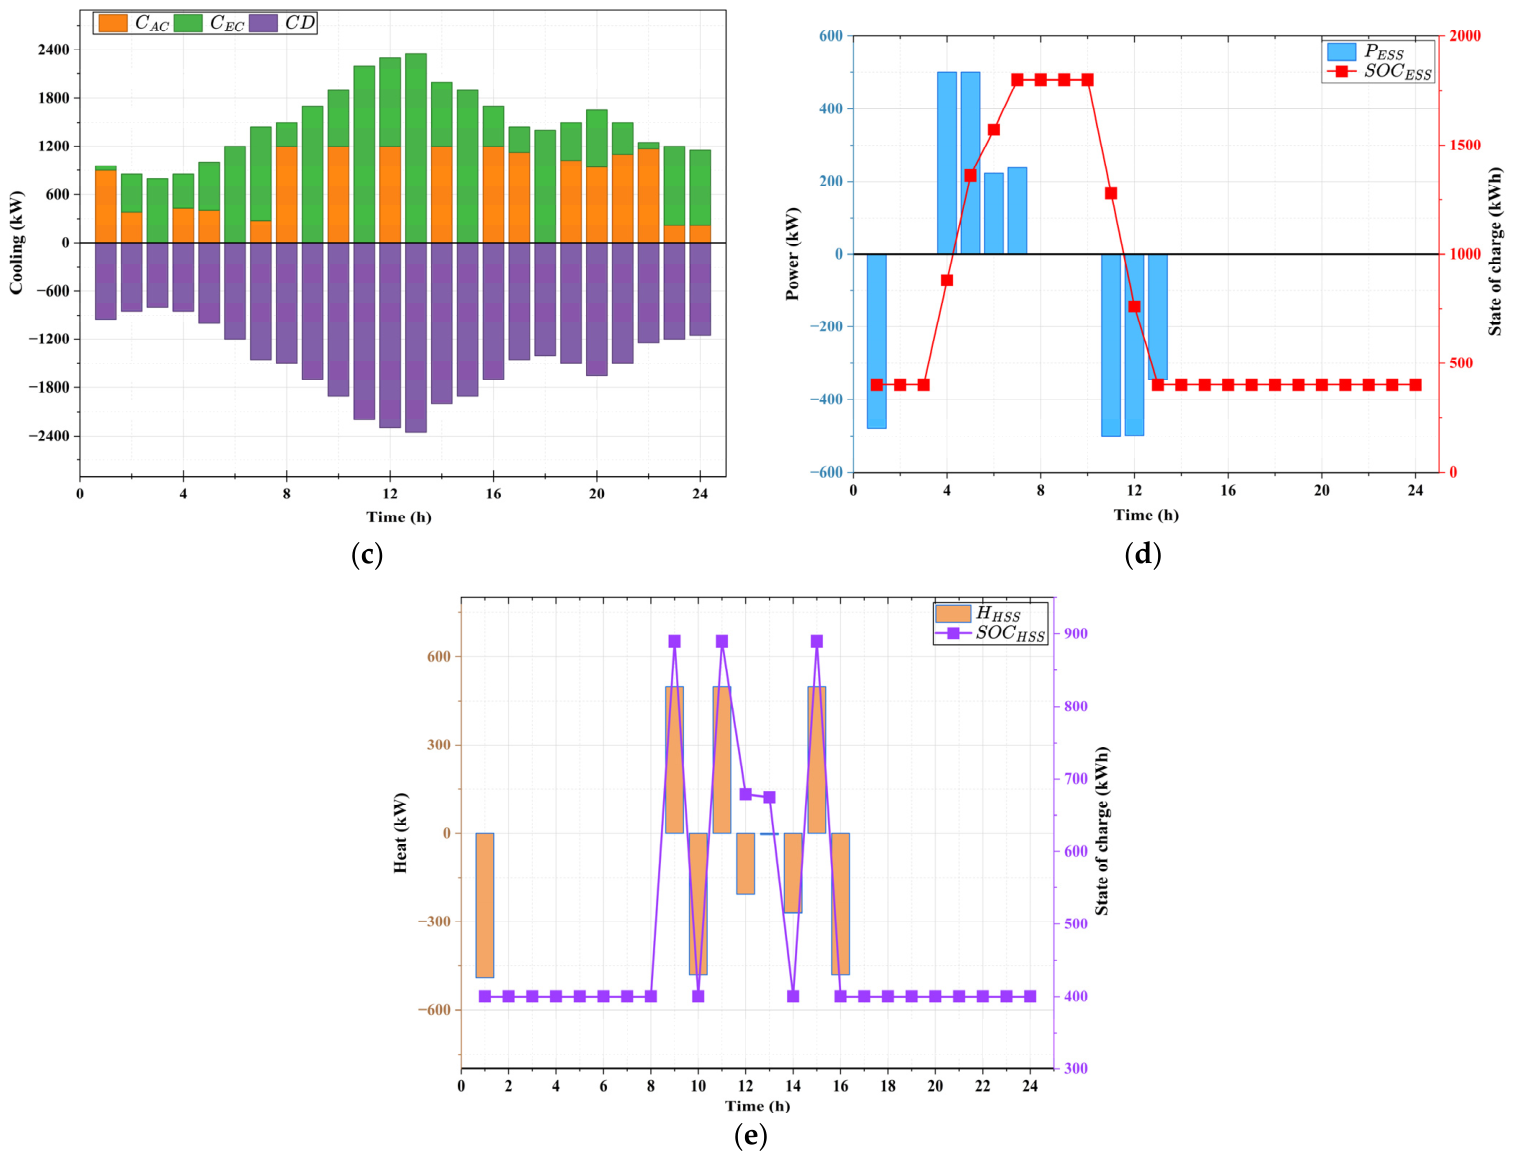
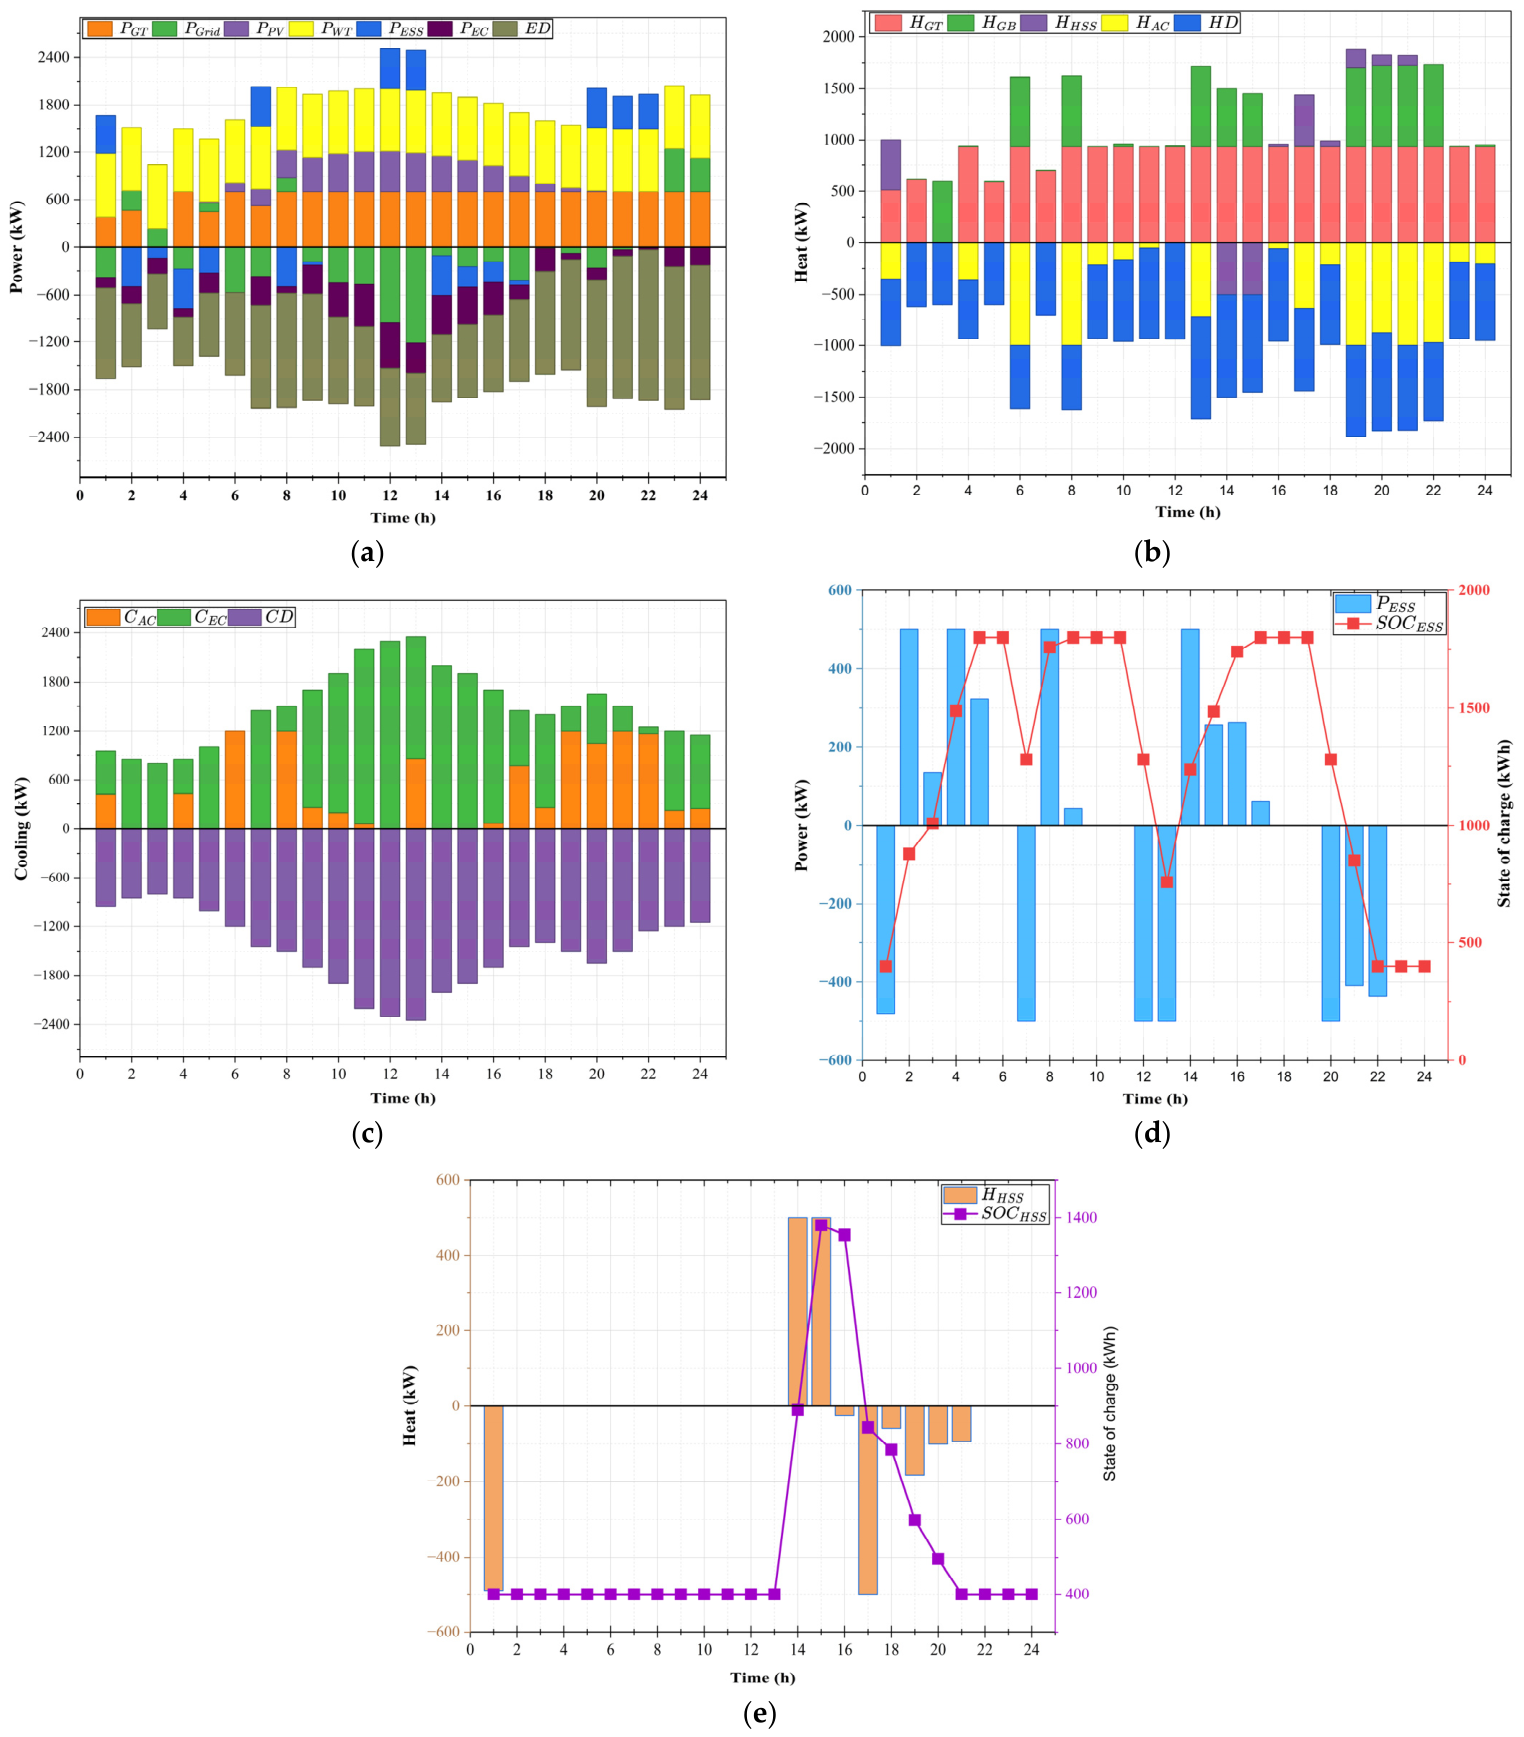
The energy management is solved for cost and emission reduction without inclusion of RERs, P2G, or CCS; in this scenario, the required energy is supplied by the GT and the main power grid. According to Table 2, the total emissions and cost for this scenario are 14.547 tons and 7578.799 USD, respectively. It should be noted that this scenario has the lowest cost, in which the operating costs of P2G and CCS, or the operating costs of RERs, are not considered. Thus, the integration of RERs, P2G, and CCS units will increase the system operational cost in scenarios 2 and 3. As shown in Table 3, the buying energy cost from the main power grid is 4341.975 USD. The cost of buying energy is high in this scenario due to the absence of RERs, where the required energy is provided by the GT and the grid. Therefore, the total consumption of gas in this scenario is high. Figure 7 shows the optimal dispatch of all units for this scenario. It is important to emphasize that an hourly energy balance is maintained throughout the day-ahead scheduling period, which means that the total power generation is equal to the aggregate load demand, which validates the success of the proposed solution framework. According to Figure 4 and Figure 7, the energy storage system charges at low energy pricing while discharging at high energy pricing. The optimal coordination of all units of this scenario is illustrated in Figure 7.

6.2.2. Scenario 2

The RERs are integrated into the MCEH system in this scenario. As shown in Table 3, the total emissions and costs are 13.390 tons and 2719.407 USD, respectively. The operating cost in this scenario is 1244.650 USD, which is higher than the operating cost of scenario 1. This is due to the integration of the RERs, where the operating costs of the RERs are considered due to the high power produced by PV and WT; the cost of the main power grid is reduced by 74.77% compared to scenario 1. Furthermore, the gas consumed by GT and GB is reduced from 62,476.309 kW to 58,234.023 kW. When comparing the results of scenario 1 and scenario 2, it is evident that the integration of RERs can minimize the total emissions and costs by 7.95% and 64.18%, respectively, as listed in the second column of Table 3. The optimal scheduling of all units of the MCEH system, including GT, GB, RERs (PV and WT), EC, AC, and storage systems (ESS and HSS), is presented in Figure 8. It should be noted that the system components clearly satisfy and balance the load demands, including ED, CD, HD, and every hour, confirming the effectiveness of the suggested solution methodology.
As per the results of scenario 1 and scenario 2, it is evident that the integration of RERs can reduce the emissions and costs by 7.953% and 64.118%, respectively, as listed in the second column of Table 3.

6.2.3. Scenario 3

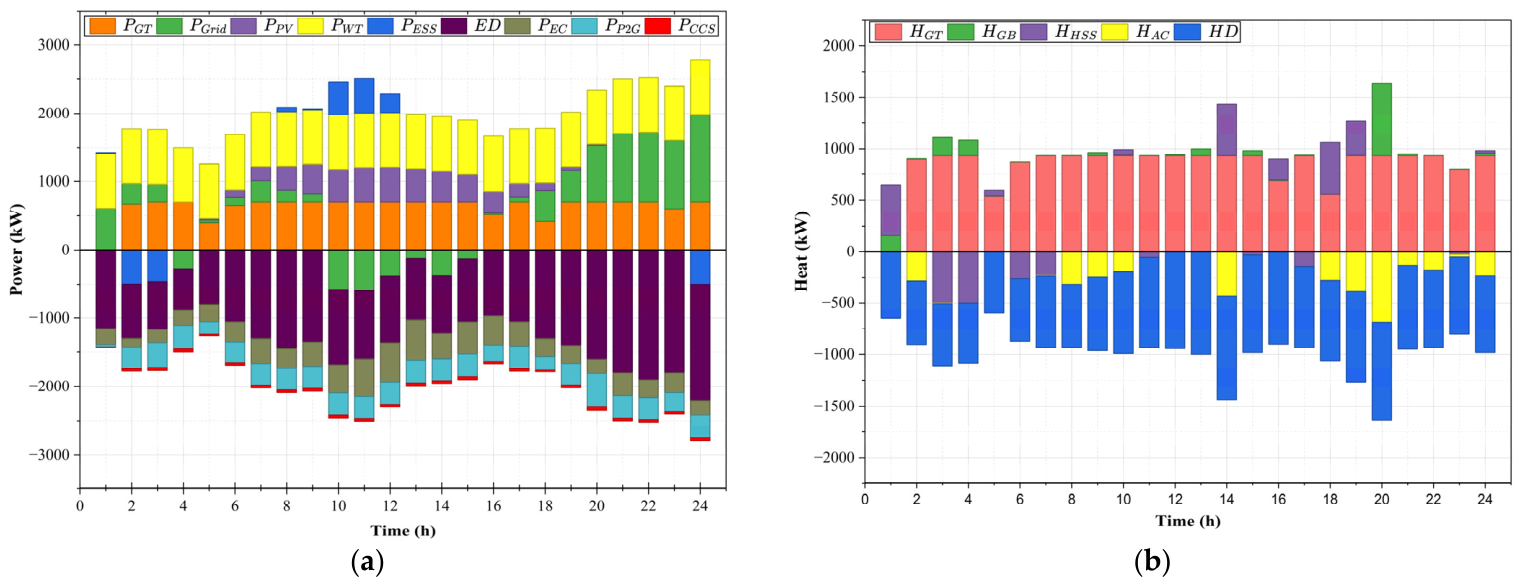
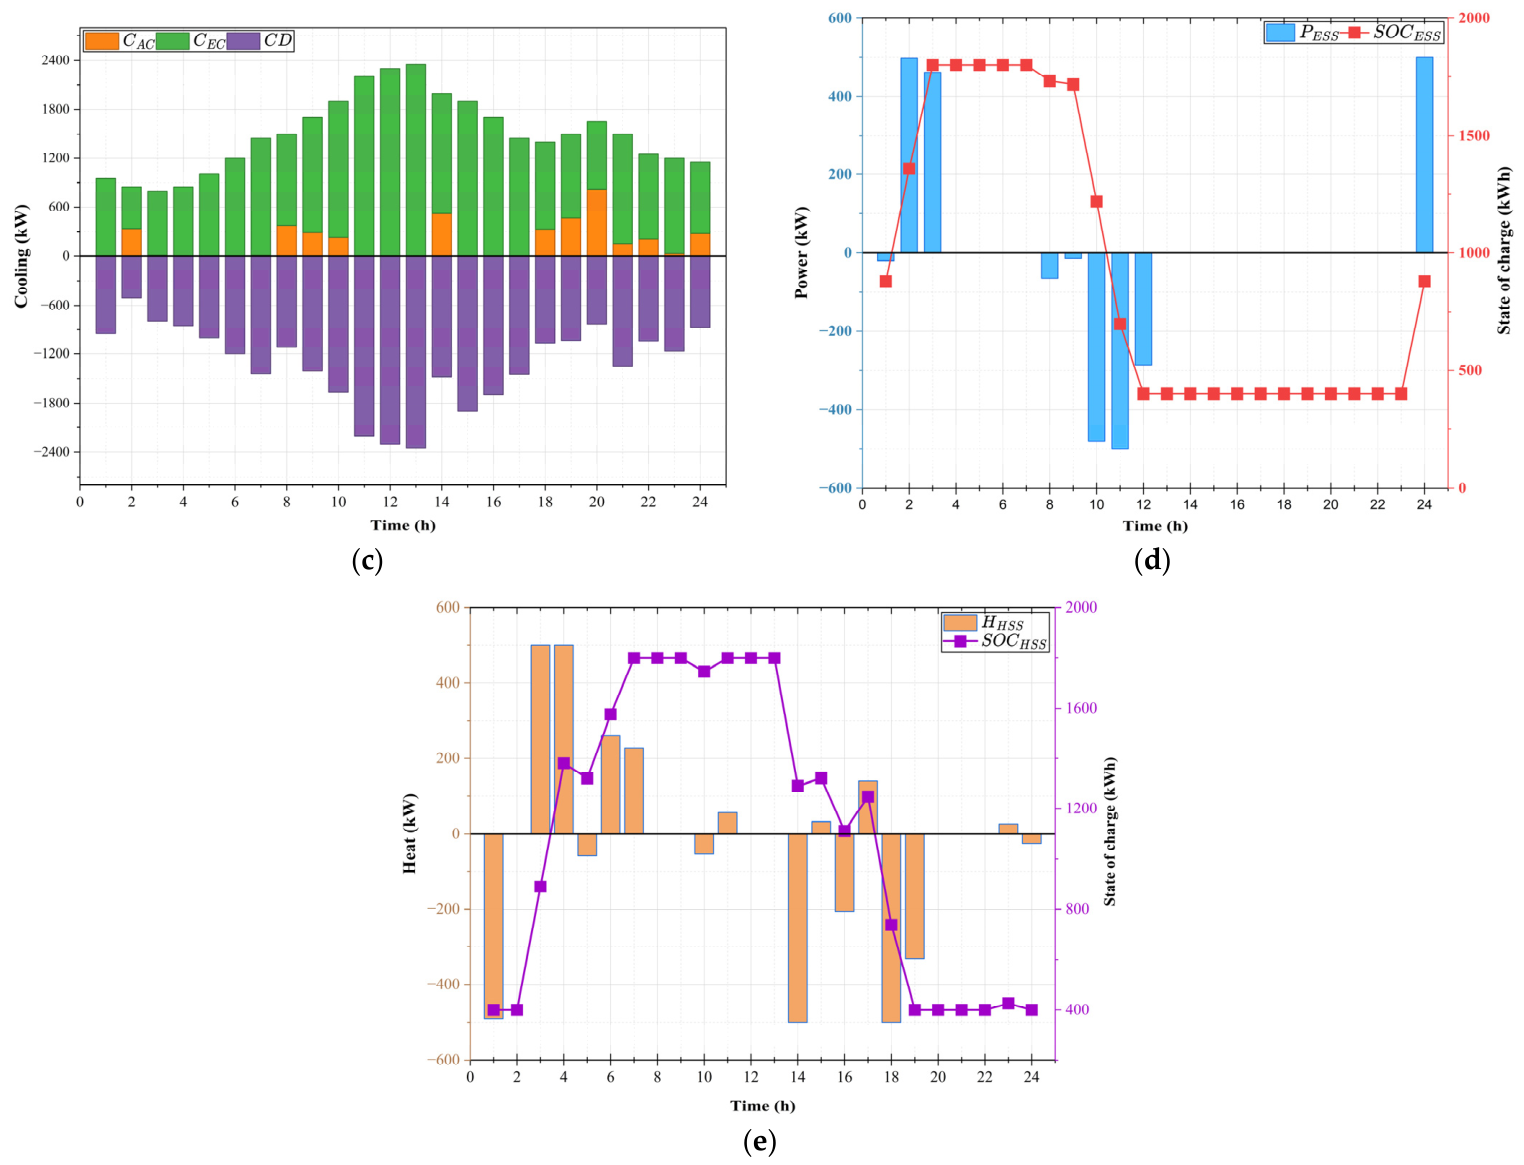
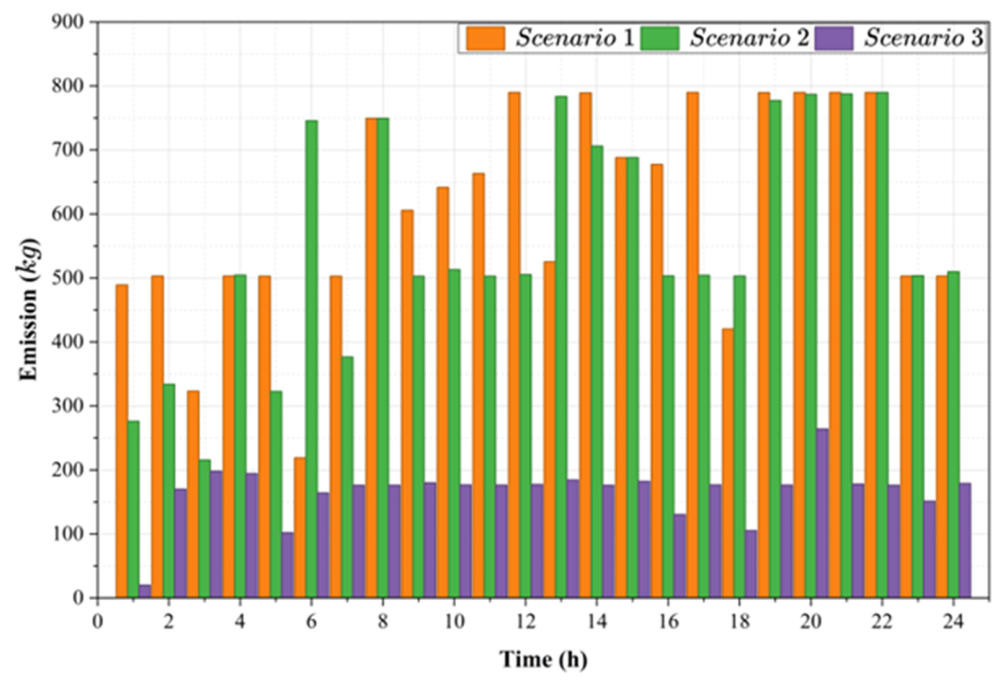
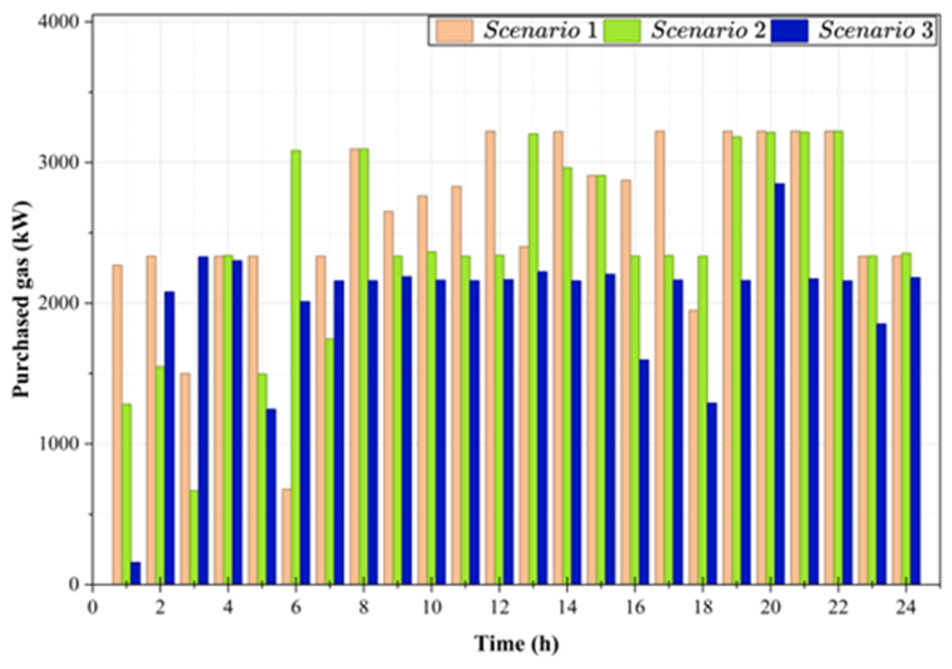
In this scenario, the CCS and P2G are considered, and the RERs are integrated into the system. As evidenced by Table 3, the emissions are reduced from 13.39 tons to 3.99 tons. In other words, considering the integrated carbon capture system and power-to-gas technology decreases emissions by 72.57% and 70.2% compared to scenario 1 and scenario 2, respectively. It should be noted that the total cost in this scenario is decreased by 39.37% compared to scenario 1, but it is slightly increased compared to scenario 2 due to the required energy for CCS and P2G units. According to Table 3, the integration of CCS and P2G technology into the MCEH system can reduce not only the emissions but also the gas consumption required for the gas turbine and gas boiler. Figure 9 displayed the optimal coordination for all units of the MCEH system for this scenario. As evidenced by Figure 9, the generated energy equals the load demands, which confirms that the energy is balanced for each hour. The simulation results indicate that scenario 3 significantly outperforms scenarios 1 and 2 in terms of environmental impact, as the included CCS system enables effective carbon capture and drastically reduces overall emissions, as shown in Figure 10. In terms of economy, scenario 3 has 39.37% reduction in total cost compared to scenario 1. Also, the lowest fuel gas consumption for scenario 3 is 48,127.931 kW, which is 22.97% and 17.35% lower than scenario 1 and scenario 2, respectively, as depicted in Table 3 and Figure 11.
Finally, the reductions in operating costs and emissions were achieved via optimal scheduling of integrated energy hub components by application of the PSO. As per the studied scenarios, the PSO maximized utilization of the renewable energy along with optimal scheduling of the integrated energy hub resources; it can achieve 7.95% reduction in cost and 64.12% reduction in emissions. In addition to that, optimizing the system operation using the PSO with utilization of the P2G unit and CCS along with RERs can reduce the operation cost and the emitted CO2 considerably; here, the CO2 produced by the gas turbine and boiler was collected by CCS and converted to methane (CH4), which returned to the gas grid, achieving simultaneous 39.37% and 72.57% reductions in costs and emissions, respectively. The carbon emission intensity (CEI) can be calculated as a function of the total emissions and the total supplied energy, including the electrical, cooling, and heating energy ( C E I = M c o 2   / s u p p l i e d _ e n e r g y ). The CEI for the studied scenarios is tabulated in Table 4. It is clear that the C E I decreased by 22.33% with integration of the RERs and decreased by 70.20% with CCS and P2G.
In this section, the energy management of the MCHE system is solved considering the dynamic inverter efficiency by using the P2G and CCS units for cost and emission reductions. Modeling the dynamic inverter efficiency can be represented as follows [36]:
η i n v e r t e r t = η n o m i n a l η r e f e r e n c e × ( 0.0162 × ζ 0.0059 ζ + 0.9858 )
in which
ζ = P D C t P D C 0
P D C 0 = P A C 0 η n o m i n a l
P A C t = P D C t × η i n v e r t e r t
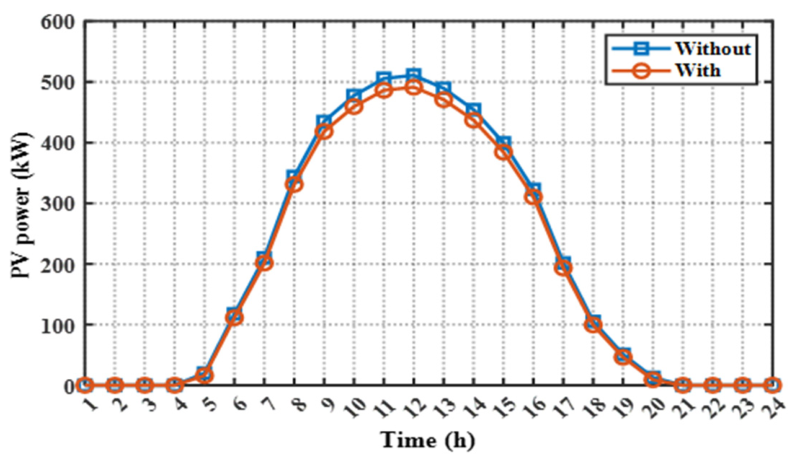
where P d c ( t ) donates the DC power input to the inverter at time t . P d c o is the rated DC power of the inverter. η i n v e r t e r t is the instantaneous inverter efficiency at time t . η n o m i n a l is the nominal efficiency of the inverter. ζ is the normalized load ratio. η r e f e r e n c e is the reference efficiency that is defined by the manufacturer. The nominal and reference efficiencies are selected to be 0.96 and 0.9637, respectively. Figure 12 shows the output power of PV panels with and without considering the dynamic inverter efficiency. It is evident that the output power decreased when considering the dynamic inverter efficiency. The total costs and the emissions for this case are $4636.6 and 3.9903 tons, respectively. Consequently, the costs and emissions slightly increased compared to the third scenario, which were $4595.260 and 3.990 tons, respectively.
To validate the performance of the PSO, the obtained results by the proposed PSO were compared to those obtained by other optimization algorithms for scenario 3, including other recent optimization methods like Sand Cat Swarm Optimization (SCSO) [37], Sine Cosine Algorithm (SCA) [38], Harris Hawks Optimization (HHO) [39], and Parrot optimizer [40]. The numbers of maximum iterations, populations, and trial runs are 500, 70, and 25 for all algorithms. Table 5 shows the statistical results for the comparative optimization techniques, including the best, worst, and mean. As per the results listed in Table 5, the PSO is superior based on the best and mean values for solving the energy management problem.

6.3. Sensitivity Analysis

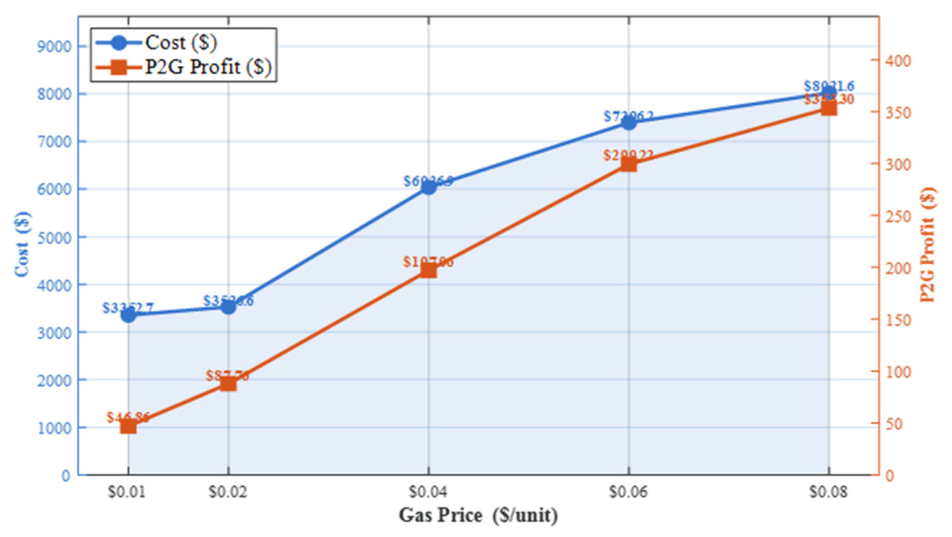
In this section, the energy management of the SMCEH is solved considering variations in a set of parameters, including gas price, gas turbine efficiency, and integration rate of RERs. This includes a comprehensive sensitivity analysis for variation in the natural gas price on the total cost and the power-to-gas profitability. The variation in cost and power-to-gas profitability with variation in natural gas is depicted in Figure 13. Referring to Figure 13, it is clear that the cost and the power-to-gas profitability increased with increasing of the natural gas price, where the increase in the gas price from $0.01 to 0.08 led to an increase in the operational costs from $3352.7 to $8021.6, while the P2G profit increased from $46.86 to $353.3.
Here, the energy management of the SMCEH is solved under different integration rates or penetration levels of the renewable energy. Table 6 lists the total operational costs and emissions under different penetration levels of the PV and WTs. According to Table 6, the total costs decreased from $6670.90 to $4297.50 with increasing of penetration level of PV units from 10% to 50%, while the emissions decreased from 4539.60 kg to 4188.00 kg. Likewise, the total costs decreased from $9767.90 to $4484.20 with increasing of penetration level of WTs from 10.52% to 42.11%, while the emissions decreased from 4689.50 kg to 4033.30 kg.
Additionally, the energy management of the SMCEH is solved under variations in the equipment utilization rate, where the electrical efficiency of the gas turbine is varied from 30% to 40%, and the results are listed in Table 7. It can be seen that increasing the efficiency of the gas turbine leads to a notable reduction in total operational costs and emissions.

7. Conclusions

This study presents an energy management framework for SMCEH systems that incorporates RERs, CCS, and P2G technologies using the PSO algorithm. The integrated framework supports sustainable energy transitions by enabling efficient coupling of clean energy resources with multi-sector energy demands. The main findings of this work can be summarized as follows:
  • The integration of RERs alone leads to a significant reduction in total operational cost by 64.12% and a decrease in total emissions by 7.953% compared to the base scenario (i.e., without RERs, CCS, and P2G technologies). These results clearly demonstrate that the incorporation of RERs is an effective and viable solution from both economic and environmental perspectives, supporting the development of sustainable and low-carbon energy management strategies for SMCEHs.
  • The simultaneous integration of RERs with CCS and P2G technologies reduces the total cost by 39.37% and total emissions by 72.57% compared to the base scenario.
  • The proposed energy management approach provides a robust framework for achieving sustainable system operation with low carbon emissions.
The main limitation of this work is that the proposed farmwork was presented for the day-ahead deterministic energy management without considering the uncertainties of the system. Thus, future work will focus on stochastic energy management of the SMCEH system, considering uncertainties of renewable generation, electricity prices, and load demand.

Author Contributions

Conceptualization, A.R. (Ahmed Ragab) and M.E.; methodology, M.E. and A.A.; software, A.R. (Ahmed Ragab) and H.H.A.; validation, M.E. and A.M.K.; formal analysis, A.M.K.; investigation, A.R. (Ahmed Ragab) and A.A.; resources, M.E.; data curation, H.H.A.; writing—original draft preparation, A.R. (Ahmed Ragab); writing—review and editing, A.A., M.E., and A.R. (Ahmed Refai); visualization, A.R. (Ahmed Refai); funding acquisition, A.A. and M.E. All authors have read and agreed to the published version of the manuscript.

Funding

This research received no external funding.

Institutional Review Board Statement

Not applicable.

Informed Consent Statement

Not applicable.

Data Availability Statement

Data will be available upon request.

Conflicts of Interest

The authors declare no conflicts of interest.

References

  1. Zhang, B.; Wang, J.; Li, Z.; Gao, T.; Zhang, W.; Xu, C.; Ju, X. Optimal configuration scheme for multi-hybrid energy storage system containing ground source heat pumps and hydrogen-doped gas turbine. Energy 2025, 321, 135425. [Google Scholar]
  2. Dolatnia, A.; Sarvari, P.; Sarmadi, B.K.; Baghramian, A. An interval-based model for stochastic optimal scheduling of multi carrier energy hubs in the presence of multiple sources of uncertainty. Electr. Power Syst. Res. 2025, 242, 111447. [Google Scholar] [CrossRef]
  3. Huang, A.; Bi, Q.; Dai, L. Integrated economic and environmental optimization for industrial consumers: A dual-objective approach with multi-carrier energy systems and fuzzy decision-making. Energy 2025, 324, 135787. [Google Scholar]
  4. Karimi, H.; Bidgoli, M.M.; Jadid, S. Optimal electrical, heating, cooling, and water management of integrated multi-energy systems considering demand-side management. Electr. Power Syst. Res. 2023, 220, 109353. [Google Scholar]
  5. Zhang, G.; Ge, Y.; Ye, Z.; Al-Bahrani, M. Multi-objective planning of energy hub on economic aspects and resources with heat and power sources, energizable, electric vehicle and hydrogen storage system due to uncertainties and demand response. J. Energy Storage 2023, 57, 106160. [Google Scholar]
  6. Wei, D.; Zhang, Z.; Zhang, W.; Yang, Y.; Yang, Z. Optimization of multi-energy complementary power generation system configuration based on particle swarm optimization. Energy Rep. 2024, 12, 2257–2269. [Google Scholar] [CrossRef]
  7. Jalalian, H.; Moghaddam, M.S.; Vahedi, M.; Davarzani, R.; Hoseinpour, H. Optimization of integrated energy systems for enhanced grid flexibility using the Meerkat optimization algorithm. Int. J. Electr. Power Energy Syst. 2025, 172, 111263. [Google Scholar] [CrossRef]
  8. Najafi, A.; Pourakbari-Kasmaei, M.; Jasinski, M.; Lehtonen, M.; Leonowicz, Z. A medium-term hybrid IGDT-Robust optimization model for optimal self scheduling of multi-carrier energy systems. Energy 2022, 238, 121661. [Google Scholar]
  9. Xu, L. Optimizing energy hub systems: A comprehensive analysis of integration, efficiency, and sustainability. Comput. Electr. Eng. 2024, 120, 109779. [Google Scholar] [CrossRef]
  10. Lorestani, A.; Gharehpetian, G.; Nazari, M.H. Optimal sizing and techno-economic analysis of energy-and cost-efficient standalone multi-carrier microgrid. Energy 2019, 178, 751–764. [Google Scholar] [CrossRef]
  11. Yun, Y.; Zhang, D.; Yang, S.; Li, Y.; Yan, J. Low-carbon optimal dispatch of integrated energy system considering the operation of oxy-fuel combustion coupled with power-to-gas and hydrogen-doped gas equipment. Energy 2023, 283, 129127. [Google Scholar]
  12. Li, X.; Li, T.; Liu, L.; Wang, Z.; Li, X.; Huang, J.; Huang, J.; Guo, P.; Xiong, W. Operation optimization for integrated energy system based on hybrid CSP-CHP considering power-to-gas technology and carbon capture system. J. Clean. Prod. 2023, 391, 136119. [Google Scholar]
  13. Qadrdan, M.; Abeysekera, M.; Chaudry, M.; Wu, J.; Jenkins, N. Role of power-to-gas in an integrated gas and electricity system in Great Britain. Int. J. Hydrogen Energy 2015, 40, 5763–5775. [Google Scholar]
  14. Zhang, G.; Wang, W.; Chen, Z.; Li, R.; Niu, Y. Modeling and optimal dispatch of a carbon-cycle integrated energy system for low-carbon and economic operation. Energy 2022, 240, 122795. [Google Scholar]
  15. Chen, W.; Zhang, J.; Li, F.; Zhang, R.; Qi, S.; Li, G.; Wang, C. Low carbon economic dispatch of integrated energy system considering power-to-gas heat recovery and carbon capture. Energies 2023, 16, 3472. [Google Scholar]
  16. He, C.; Liu, T.; Wu, L.; Shahidehpour, M. Robust coordination of interdependent electricity and natural gas systems in day-ahead scheduling for facilitating volatile renewable generations via power-to-gas technology. J. Mod. Power Syst. Clean Energy 2017, 5, 375–388. [Google Scholar]
  17. Mansouri, S.A.; Nematbakhsh, E.; Ahmarinejad, A.; Jordehi, A.R.; Javadi, M.S.; Matin, S.A.A. A Multi-objective dynamic framework for design of energy hub by considering energy storage system, power-to-gas technology and integrated demand response program. J. Energy Storage 2022, 50, 104206. [Google Scholar]
  18. Yang, L.; Zhang, J.; Li, X.; Zhu, N.; Liu, Y. The moderating effect of emission reduction policies on CCS mitigation efficiency. Appl. Energy 2024, 376, 124303. [Google Scholar] [CrossRef]
  19. Cui, Y.; Xu, Y.; Huang, T.; Wang, Y.; Cheng, D.; Zhao, Y. Low-carbon economic dispatch of integrated energy systems that incorporate CCPP-P2G and PDR considering dynamic carbon trading price. J. Clean. Prod. 2023, 423, 138812. [Google Scholar]
  20. Guo, L.; Wang, Y.; Teng, Y.; Zhang, Y.; Li, D.; Dong, H.; Meng, X. Operation optimization of integrated energy system coupled with wind power and power to gas. Appl. Therm. Eng. 2025, 284, 129123. [Google Scholar] [CrossRef]
  21. Yi, T.; Ren, W. Low carbon economy scheduling of integrated energy system considering the mutual response of supply and demand. Sustain. Energy Grids Netw. 2024, 38, 101279. [Google Scholar] [CrossRef]
  22. Chen, L.; Liu, K.; Zhao, K.; Hu, L.; Liu, Z. Optimal scheduling of electricity-hydrogen-thermal integrated energy system with P2G for source-load coordination under carbon market environment. Energy Rep. 2025, 13, 2269–2276. [Google Scholar]
  23. Cao, Y.; Wang, Q.; Du, J.; Nojavan, S.; Jermsittiparsert, K.; Ghadimi, N. Optimal operation of CCHP and renewable generation-based energy hub considering environmental perspective: An epsilon constraint and fuzzy methods. Sustain. Energy Grids Netw. 2019, 20, 100274. [Google Scholar] [CrossRef]
  24. Alshawaf, M.; Poudineh, R.; Alhajeri, N.S. Solar PV in Kuwait: The effect of ambient temperature and sandstorms on output variability and uncertainty. Renew. Sustain. Energy Rev. 2020, 134, 110346. [Google Scholar] [CrossRef]
  25. Karimi, H.; Jadid, S.; Hasanzadeh, S. Optimal-sustainable multi-energy management of microgrid systems considering integration of renewable energy resources: A multi-layer four-objective optimization. Sustain. Prod. Consum. 2023, 36, 126–138. [Google Scholar]
  26. Zhang, J.; Zhang, T.; Pan, F.; Yang, Y.; Feng, L.; Huang, Y. Optimization scheduling method for multi-energy complementary based on green certificate-carbon trading mechanism and comprehensive demand response. Energy Rep. 2025, 13, 40–58. [Google Scholar] [CrossRef]
  27. Ragab, A.; Mohamed, E.; Amin, H.H.; Kassem, A.M.; Abdelfatah, A.; Refai, A. Enhanced Quadratic Interpolation Optimization: Resilient Management of Multi-Carrier Energy Hubs with Hydrogen Vehicles. Sustainability 2026, 18, 3592. [Google Scholar] [CrossRef]
  28. Wu, Q.; Li, C. Modeling and operation optimization of hydrogen-based integrated energy system with refined power-to-gas and carbon-capture-storage technologies under carbon trading. Energy 2023, 270, 126832. [Google Scholar]
  29. Chen, M.; Lu, H.; Chang, X.; Liao, H. An optimization on an integrated energy system of combined heat and power, carbon capture system and power to gas by considering flexible load. Energy 2023, 273, 127203. [Google Scholar] [CrossRef]
  30. Farah, A.; Hassan, H.; Abdelshafy, A.M.; M. Mohamed, A. Optimal scheduling of hybrid multi-carrier system feeding electrical/thermal load based on particle swarm algorithm. Sustainability 2020, 12, 4701. [Google Scholar]
  31. Sahoo, A.; Hota, P.K. Impact of energy storage system and distributed energy resources on bidding strategy of micro-grid in deregulated environment. J. Energy Storage 2021, 43, 103230. [Google Scholar] [CrossRef]
  32. Luo, Z.; Yang, S.; Xie, N.; Xie, W.; Liu, J.; Agbodjan, Y.S.; Liu, Z. Multi-objective capacity optimization of a distributed energy system considering economy, environment and energy. Energy Convers. Manag. 2019, 200, 112081. [Google Scholar] [CrossRef]
  33. Ma, T.; Wu, J.; Hao, L.; Lee, W.-J.; Yan, H.; Li, D. The optimal structure planning and energy management strategies of smart multi energy systems. Energy 2018, 160, 122–141. [Google Scholar] [CrossRef]
  34. Carr, S.J.; Thanapalan, K.K.; Zhang, F.; Guwy, A.J.; Maddy, J.; Gusig, L.-O.; Premier, G.C. Integration of wind power and hydrogen hybrid electric vehicles into electric grids. In Sustainability in Energy and Buildings: Proceedings of the 4th International Conference in Sustainability in Energy and Buildings (SEB’ 12); Springer: Berlin/Heidelberg, Germany, 2013; pp. 261–270. [Google Scholar]
  35. Tran, T.T.; Smith, A.D. Stochastic optimization for integration of renewable energy technologies in district energy systems for cost-effective use. Energies 2019, 12, 533. [Google Scholar] [CrossRef]
  36. Dobos, A.P. PVWatts Version 5 Manual; NREL/TP-6A20-62641; National Renewable Energy Laboratory (NREL): Golden, CO, USA, 2014.
  37. Seyyedabbasi, A.; Kiani, F. Sand Cat swarm optimization: A nature-inspired algorithm to solve global optimization problems. Eng. Comput. 2023, 39, 2627–2651. [Google Scholar]
  38. Mirjalili, S. SCA: A sine cosine algorithm for solving optimization problems. Knowl.-Based Syst. 2016, 96, 120–133. [Google Scholar] [CrossRef]
  39. Heidari, A.A.; Mirjalili, S.; Faris, H.; Aljarah, I.; Mafarja, M.; Chen, H. Harris hawks optimization: Algorithm and applications. Future Gener. Comput. Syst. 2019, 97, 849–872. [Google Scholar] [CrossRef]
  40. Lian, J.; Hui, G.; Ma, L.; Zhu, T.; Wu, X.; Heidari, A.A.; Chen, Y.; Chen, H. Parrot optimizer: Algorithm and applications to medical problems. Comput. Biol. Med. 2024, 172, 108064. [Google Scholar] [CrossRef] [PubMed]
Figure 1. The construction of the MCEH system studied.
Sustainability 18 06975 g001
Figure 2. The combination of CCU and P2G units.
Sustainability 18 06975 g002
Figure 3. Flowchart of the proposed optimization methodology for the MCEH system.
Sustainability 18 06975 g003
Figure 4. The TOU electricity prices.
Sustainability 18 06975 g004
Figure 5. The electrical, heating, and cooling demands of the MCEH system.
Sustainability 18 06975 g005
Figure 6. The daily profile of solar radiation, ambient temperature, and wind speed.
Sustainability 18 06975 g006
Figure 7. The optimal coordination of all units of the MCEH for scenario 1: (a) ED, (b) HD, (c) CD, (d) ESS, and (e) HSS.
Sustainability 18 06975 g007aSustainability 18 06975 g007b
Figure 8. The optimal coordination of all units of the MCEH for scenario 2: (a) ED, (b) HD, (c) CD, (d) ESS, and (e) HSS.
Sustainability 18 06975 g008
Figure 9. The optimal coordination of all units of the MCEH for scenario 3: (a) ED, (b) HD, (c) CD, (d) ESS, and (e) HSS.
Sustainability 18 06975 g009aSustainability 18 06975 g009b
Figure 10. CO2 emissions for all scenarios.
Sustainability 18 06975 g010
Figure 11. Comparison of purchasing gas for all scenarios.
Sustainability 18 06975 g011
Figure 12. The output power of PV panels with and without the dynamic inverter efficiency.
Sustainability 18 06975 g012
Figure 13. Variations in cost and P2G profit relative to changes in the natural gas price.
Sustainability 18 06975 g013
Table 1. Literature review for solving SMCEH with CCS and P2G.
Ref.RERsCCSP2GObjectivesStorage
Systems
Scenario
Analysis
Sensitivity AnalysisLoad Demands
PVWTCostEmissionESSHSS EDHDCD
[11]
[12]
[13]
[14]
[15]
[16]
[17]
[18]
[19]
[20]
[21]
[22]
This work
Table 2. The parameters of the system’s units.
UnitParameterValueUnitParameterValue
GT [26,33] η e , g t 0.3AC [1,23] C O P A C 1.2
η h , g t 0.5 γ A C (USD/kW)0.0002
γ G T (USD/kW)0.0033 H A C m a x (kW)1000
P m a x G T (kW)1000EC [1,23] C O P E C   4
φ e G T (kg/kWh)0.7182 γ E C (USD/kW)0.0015
WT [34,35] P w r   (kW)200 P E C m a x (kW)500
v cin (m/s)4ESS [23,35] η E S S , c h a 0.96
v cout (m/s)25 η E S S , d i s 0.96
v r (m/s)11.5 E S E S S , r a t   (kWh)1800
N W T 2 E S E S S , m i n   ( k W h ) 400
K W T (USD/kW)0.0312 E S E S S , m a x   ( k W h ) 1800
PV [24,35] N P V 1800 P E S S , c h , m a x (kWh)500
V o c 38.4 P E S S , d i s , m a x (kWh)500
I S C 8.79 γ E S S (USD/kW)0.0267
V m p p 30.4HSS [23,35] η H S S , c h 0.98
I m p p 8.24 H H S S , m i n   ( k W h ) 400
T n o t 46 η H S S , d i s 0.98
K v 0.33 H H S S , r a t   (kWh) 1800
K i 0.6 P H S S , c h , m a x (kWh)800
γ p v (USD/kW)0.0332 P H S S , d i s , m a x (kWh)800
GB [26,35] η G B 0.9 γ H S S (USD/kW)0.0267
γ G B (USD/kW)0.0234CCS [28] C C S 0.12
φ G B (kg/kW)0.359 η C C S 0.65
P2G [29] μ P 2 G (kg/kWh)1.02
P 2 G 0.55
Table 3. The obtained simulation results of all scenarios.
ItemScenario 1Scenario 2Scenario 3
Cost of buying energy (USD)4341.975274.0701990.546
Cost of selling energy (USD)0.001369.518561.788
Operational cost (USD)478.8011244.6501064.980
Purchased gas (kW)62,476.30958,234.02348,127.931
Cost of purchased gas (USD)2711.4722527.3572088.752
Emission (ton)14.54713.3903.990
Total cost (USD)7578.7992719.4074595.260
Emission reduction-7.95%72.57%
Cost reduction-64.12%39.37%
Table 4. CEI for different scenarios.
ItemScenario 1Scenario 2Scenario 3
Total emissions (kg)14,547.013,390.263990.30
s u p p l i e d _ e n e r g y (kWh)82,298.097,533.097,533.0
CEI (kg/kWh)0.176760.137290.04091
Table 5. Statistical comparison between PSO and other comparative algorithms.
AlgorithmAverageBest SolutionWorst Solution
PSO365,563.2104,955.8706,198.0
SCA446,591.1306,664.3606,587.6
HHO645,821.7605,667.4705,769.0
SCSO846,764.8706,762.8906,771.3
PO626,376.9306,114.41,006,516.3
Table 6. The total costs and emissions under different penetration levels of RERs.
PVsIntegration rateNo of PVTotal Cost (USD)Emissions (kg)
10%7606670.904539.60
20%15205403.804460.70
30%22804716.804370.40
40%30404403.104282.60
50%38004297.504188.00
WTsIntegration rateNo of WTTotal Cost USDEmissions (kg)
10.52%19767.904689.50
21.05%28836.504422.70
31.58%37649.304397.80
42.11%44484.204033.30
Table 7. Total costs and emissions under different GT efficiencies.
GT EfficiencyTotal Cost (USD)Emissions (kg)
30%6152.904761.50
35%5408.104747.30
40%4352.804629.00
Disclaimer/Publisher’s Note: The statements, opinions and data contained in all publications are solely those of the individual author(s) and contributor(s) and not of MDPI and/or the editor(s). MDPI and/or the editor(s) disclaim responsibility for any injury to people or property resulting from any ideas, methods, instructions or products referred to in the content.