Article

Liveable Street: Exploring the Impact Path for Built Environment on Fine-Grained Pedestrian Activity Under Video-Based Deep Learning


1
School of Architecture and Spatial Planning, Anhui Jianzhu University, Hefei 230601, China
2
State Key Laboratory of Automotive Safety & Energy, School of Vehicle and Mobility, Beihang University, Beijing 100191, China
3
School of Architecture, Tsinghua University, Beijing 100084, China
4
School of Architecture, Huaqiao University, Xiamen 361021, China
*
Authors to whom correspondence should be addressed.
Sustainability 2026, 18(14), 6977; https://doi.org/10.3390/su18146977
Submission received: 3 June 2026 / Revised: 25 June 2026 / Accepted: 4 July 2026 / Published: 8 July 2026

Abstract

Walking is essential for daily physical activity, yet most existing studies focus on pedestrian counts while neglecting varied on-street activities, largely owing to data shortages. Targeting this gap, the research defines walking activity quality as the occurrence likelihood of walking-related activities and explores built environment influences. It adopts deep-learning video recognition to capture fine-grained pedestrian behaviours and quantifies walkability via activity quality. Structural equation modelling (SEM) is applied to decode causal links between urban design quality, pedestrian volume and activity quality. According to the results, urban design qualities exhibit a more pronounced influence on activity quality compared to pedestrian volume. Among a broad array of 20 physical features examined, interface density, the quantity of street furniture, walkway width, and shading rate all demonstrated significant positive effects on stationary activities. Interestingly, higher interface density and shorter crossing distances facilitated the occurrence of social activities, whereas the proportion of ground-floor windows had a notable negative impact on social activities. The findings of this study can directly inform the development of sustainable and liveable streets.

1. Introduction

Empirical evidence has validated the physical and mental health benefits associated with pedestrian walking [1,2,3]. Improving street walkability stimulates active walking behaviours and curbs urban transport-related energy use, rendering it a core research priority for urban designers and policymakers pursuing sustainable urban development [4,5]. Conceptually, walkability describes the amenity and pedestrian-friendliness of built environments, which substantially motivates diverse walking trips spanning mandatory utilitarian travel, discretionary recreation and social interaction [6]. Driven by its practical implications, an expanding body of literature has focused on the identification and quantitative evaluation of street-level walkability [7,8].
Walkability is a perception-driven construct contingent on individuals’ subjective environmental appraisal, rendering its objective quantification empirically challenging. Nevertheless, quantitative evaluation remains indispensable to underpin evidence-based street design interventions conducive to pedestrian-friendly environments [9,10]. Pedestrian count stands as a conventional proxy for walkability assessment, wherein foot traffic magnitude reflects on-site pedestrian activity intensity [11]. Despite its simplicity and cost efficiency, this metric overlooks pedestrians’ underlying visit motivations and lingering preferences [12]; dense pedestrian flow may stem from deficient alternative travel corridors instead of intrinsic street attractiveness [13]. Accordingly, characterizing the category and frequency of on-street pedestrian behaviours is pivotal, given their intimate linkage to street vitality [14]. Against this backdrop, this study advocates a multi-dimensional walkability assessment framework integrating pedestrian volume and behavioural patterns, which enables refined interpretation of pedestrian experiences and facilitates targeted street design optimisation.
Traditional walkability quantification has depended heavily on questionnaire surveys, imposing substantial financial and labour burdens on researchers and urban practitioners [15]. Driven by advances in sensing techniques and global navigation satellite systems, big-data-derived passive sensing datasets have gradually dominated contemporary walkability evaluation [16,17]. Emerging research leverages computer vision paired with street-view imagery to extract pedestrian counts for walkability appraisal [11]. Though such imagery is publicly accessible at low procurement costs, it only furnishes instantaneous, geographically fragmented snapshots of on-street conditions [18]. Additionally, most street-view data are captured via vehicle-mounted cameras along arterial roads, failing to sufficiently record detailed sidewalk scenarios [19]. In contrast, field-recorded video footage covers full-range street environments with convenient acquisition, yet automated quantification of diverse pedestrian activities from video remains technically problematic. Hence, robust algorithms for fine-grained identification and statistical measurement of heterogeneous street activities are urgently required to lay a solid analytical foundation for multi-faceted walkability evaluation.
Built-environment determinants of walkability are hierarchically split into neighbourhood- and street-scale attributes [20]. Neighbourhood-scale characteristics are encapsulated by the canonical D-variable framework encompassing density, land-use diversity, destination accessibility and network distance, which dictate the availability of daily travel origins and destinations and exert favourable effects on walkability. By contrast, street-scale attributes correspond to urban design qualities centred on intrinsic sidewalk configurations [21,22], including street enclosure, transparency and imageability that collectively shape in-situ walking satisfaction [18]. Superior urban design is empirically verified to promote street walkability. Prior scholarship has predominantly adopted ordinary linear regression to calibrate environment–walkability correlations, with walkability simplified into a single indicator [23]. Existing literature has corroborated the positive linkage between urban design quality and pedestrian volume [6,24,25,26], yet scarce research unpacks built-environment effects from the lens of activity-based walkability quality. This research gap necessitates systematic dissection of disparate pathways via which multi-scale built environments modulate walkability across multiple dimensions.
In summary, the present study aims to empirically measure walkability in the capital core area (CCA) of Beijing and explore their impact factors using multi-source data. Our research objectives are to (1) measure the walkability from the perspective of pedes-trian activity quality; (2) extract pedestrians’ walking activities from the video data; (3) describe the urban design quality at the street level; (4) use a structural equation model to explore relationship between walkability and environmental factors. The contributions of this study can be summarized as follows:
  • Comprehensive walkability indicators: Beyond simple pedestrian volume, this study develops seven refined indicators for evaluating walking activity quality to capture diverse stationary and lingering pedestrian behaviours. Compared with conventional rough activity classification schemes, these subdivided behavioural metrics support deeper analysis of how street spaces accommodate multiple types of pedestrian activities, especially for the unique context of large-city old urban cores.
  • Video-based deep learning framework: A novel deep learning framework is introduced for fine-grained walking activity classification. This framework enables the recognition and counting of different predefined pedestrian activities using video data, improving efficiency and accuracy. The framework can also be extended to utilize videos collected by traffic cameras.
  • Collection of urban design quality features: Twenty finely classified quantitative built-environment indicators characterizing street-scale urban design attributes are extracted from multi-source datasets. Differing from general walkability measurement systems, these indicators are specially customized for mature old urban core districts, which helps systematically unpack the influence paths linking urban design features to varied pedestrian activities and offers transferable references for analogous old-town areas in other cities.
  • Exploration of walkability and environmental features relationship: The study employs structural equation modelling (SEM) to investigate the association between walkability and urban design quality. The model considers the eight walkability indicators as dependent variables, urban design qualities as independent variables, and D-variables as control variables. The SEM analysis allows for understanding the causality between variables and visualizing the potential correlation of pedestrian volume and activity quality through the paths.
The rest of the paper is organized as follows. Section 2 reviews the measurement of walkability, pedestrian activity and data observation. Section 3 introduces the data and methodology. Section 4 and Section 5 give the results and discuss how the results can be implied in reality, respectively. Section 6 summarize the paper.

2. Literature Review

2.1. How to Indicate Walkability?

Over recent decades, rapid modernization has disrupted the originally stable built form of old urban areas, triggering substantial changes to street interfaces, spatial scales and other physical environments. These old districts have also witnessed a fast-growing motorization trend, which further reshapes residents’ pedestrian behaviours [17]. Such urban restructuring has coincided with marked declines in urban dwellers’ physical activity, with approximately one-third of urban adults suffering from insufficient physical exercise [27]. Mounting empirical evidence confirms that routine walking and other moderate physical activities deliver comprehensive health gains: these interventions lower risks of obesity and chronic illnesses while advancing physical and psychological wellness [28]. Accordingly, enabling active lifestyles within urban built environments constitutes a vital prerequisite for safeguarding public health [29]. As an easily accessible mode of physical exercise, walking seamlessly blends into people’s everyday schedules [30]. Against this context, scholars spanning urban design, transportation planning and public health have devoted extensive efforts to street walkability research for stimulating non-motorised walking behaviours [31].
Walkability is a perceptual construct describing environment-specific walking comfort, which mirrors pedestrians’ subjective inclination to conduct on-site walking activities. By contrast, pedestrian volume, an objective and readily obtainable metric quantifying foot traffic within a defined spatial scope, is widely adopted as a conventional proxy for walkability assessment [12,32]. In their longitudinal investigation, Cambra and Moura quantified variations in pedestrian flows triggered by built-environment regeneration schemes [33]. Despite its prevalent application, volume-based evaluation only captures the quantity of walking trips and neglects dwell willingness—a core determinant of long-term street vibrancy [21]. High pedestrian throughput on a given street may merely stem from a lack of alternative travel routes rather than inherent street appeal.
As highlighted by Gehl, highly walkable urban spaces are capable of accommodating high-quality pedestrian-oriented behaviours encompassing stationary and lingering activities [13]. Lingering activities consist of low-speed or semi-static street behaviours conducted within confined zones without predefined travel purposes, exemplified by casual strolling for window -shopping or sightseeing. In contrast, stationary activities denote immobile behaviours occurring at fixed roadside locations with negligible physical displacement, including standing and short-term seating. Researchers have proposed various classifications of stationary and lingering activities. Mehta has suggested that these postures include standing, sitting, lying down, talking, eating and drinking, shopping, smoking, selling, playing games, and so on [12]. Gehl divided the stationary activity into waiting for the bus, eating, commercial activities, cultural activities, sports, etc. [13]. The postures include standing, sitting, lying down, and others. Chen and Xu divided stationary activities into commercial and social types [34,35]. Yu divides stationary activities into three categories, which are practical stay, random social stay, and free compound stay [36]. However, the above classification is mainly for public activities rather than pedestrian activities. In this study, we aim to measure the walkability of a street from the combined perspectives of activity quantity and activity quality. Specifically, we aim to provide a comprehensive classification of pedestrian activities, and analyse the relationship between activity quality and activity quantity, and their impact factors. Activity quality in this research is defined as the comprehensive liveability of pedestrian space, which inherently contains three mutually complementary dimensions: diversity of activity types, sufficiency of activity supply, and reasonable matching between activity functions and spatial carriers. Social activity, stationary activity and commercial stationary activity are not independent attributes but sub-dimensions that jointly reflect the richness and balance of human activities on streets.

2.2. What Impact the Walkability?

A body of existing literature has identified and quantified built-environment indicators conducive to constructing pedestrian-friendly streetscapes [37,38]. One dominant research stream centres on how neighbourhood-scale built-environment attributes shape walkability, which are commonly encapsulated by the canonical D-variable framework covering density, land-use diversity and urban design metrics [39,40,41]. Focusing on middle-aged and older adults across Brisbane, Loh et al. explored how neighbourhood disadvantage proxied by diverse built-environment conditions correlates with physical functioning under varying neighbourhood walkability levels [23]. Likewise, Hino et al. adopted a longitudinal design to unpack linkages between built-environment attributes and temporal shifts in walkability measured via elderly daily step counts [42]. Nevertheless, neighbourhood-level built environments entail lengthy and capital-intensive regeneration cycles, rendering relevant renovation interventions economically and practically challenging to implement [32].
A separate cluster of scholarship investigates the nexus between walkability and street-scale urban design qualities that define the physical configuration of individual road segments and intersections. Well-crafted urban design fosters lively, functional public realms and substantially modulates on-site pedestrian experiences [43]. To operationalize urban design quality quantitatively, Ewing and Handy proposed five core dimensions: imageability, enclosure, transparency, complexity and human scale, and empirically validated their positive contributions to street walkability [6]. Given that streets serve as primary public spaces for rest and convenient road crossing, the Commission for Architecture and the Built Environment (CABE) supplemented public-space quality as an additional assessment dimension for walkability quantification. As such urban design qualities are perceptual and inherently unmeasurable in a direct manner, researchers commonly decompose each dimension into multiple observable physical indicators for quantitative computation [32].
The causal relationship between walkability and features at the neighbourhood-scale and street-scale have been provided. The relationship was mainly examined by using some linear regression models, such as multiple linear regression or the multilevel linear regression model [2,23]. These models can only measure a dependent variable, and, thus, the walkability must be represented by a single variable, such as walkability index, while the walkability can be indicated from many perspectives. Although multiple linear regression models can be built to measures different relationships, these linear re-gression models will only capture the association between a single dependent variable and independent variables, ignoring the relationship between independent variables and independent variables, independent variables and dependent variables, dependent variables and dependent variables.
Building upon prior research and addressing its inherent limitations, this study adopts structural equation modelling (SEM) to quantify the correlations between walkability and its multiple influencing factors, with variables at both street and neighbourhood scales incorporated as independent predictors. The physical features and perceptual features are represented by the observed and latent variables, receptively. The walkability is indicated from the volume and activity perspectives. By using the model, we can not only measure the causal relationship between dependent variables and independent variables, but also analyse the relationship between observed variables and latent variables, and the relationship between dependent variables.

3. Materials and Methods

3.1. Study Area

Empirical validations regarding the efficacy of urban design qualities have been widely conducted across megacities in numerous developed economies, including the United States, South Korea and Australia [32,36,40]. By contrast, relevant research remains scarce for developing nations, exemplified by China, where the modal share of walking in major urban centres has sustained a continual downtrend and levelled off at approximately 31%, as documented in the Comprehensive Survey of Chinese Traffic [44]. Against this backdrop, China’s dense population, sophisticated urban construction and historic conservation priorities render its large cities valuable research settings in which to explore walkability from an urban design quality perspective.
Renowned for the Forbidden City and historic neighbourhoods alongside contemporary commercial hubs, Beijing’s capital core area (CCA) features a dual-structured street network: major road frameworks remain largely intact, whereas auxiliary hutong alleys have undergone dramatic reshaping via demolition, route adjustment, roadway expansion or downsizing [45]. Concurrent building renewal and modernisation have further transformed local streetscapes. Collectively, shifts in street layout and roadside physical settings have created a complicated pedestrian environment within the CCA.
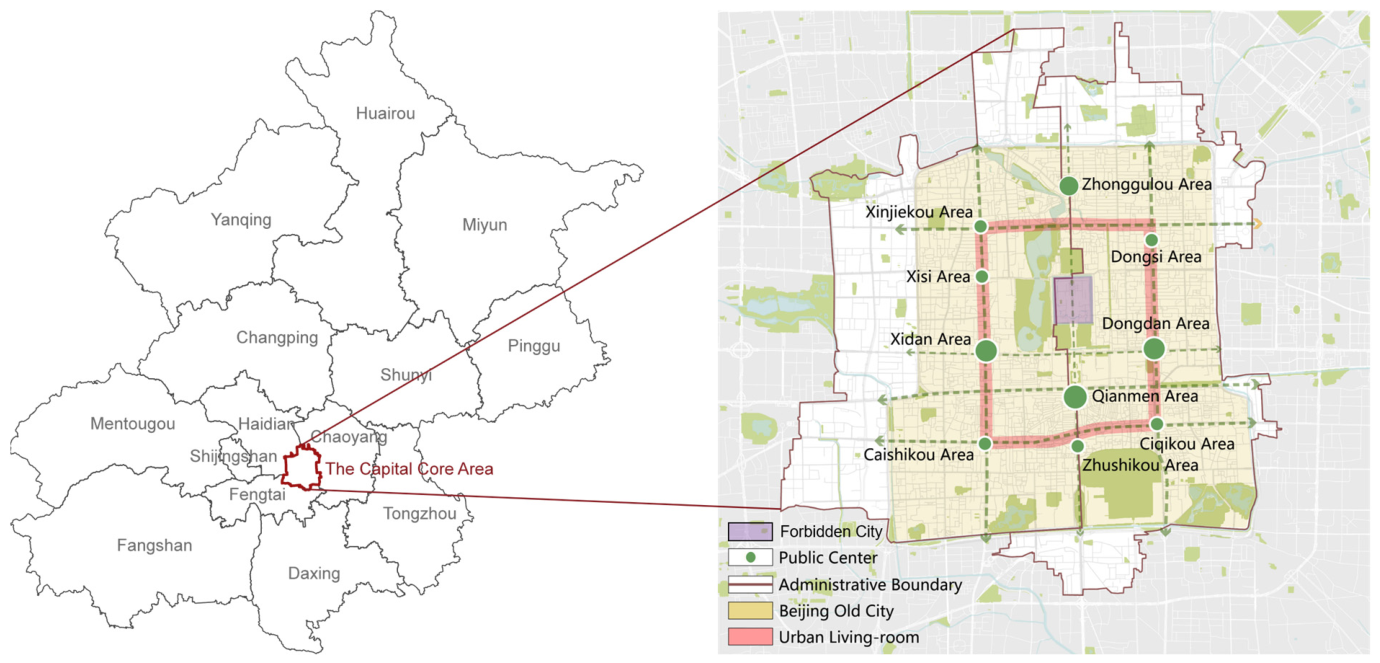
As Beijing’s most densely built and populous district, the CCA sees most pedestrian flows concentrated on arterial streets, with only sparse foot traffic penetrating inner alleys. Scarce stationary outdoor activities further restrain public space vitality. While local authorities have invested considerably in walkability enhancement, abundant cultural heritage and vernacular courtyard housing constrain large-scale built-environment renovations such as adjusting street-network density or restructuring land-use configurations (Figure 1), posing substantial obstacles to systematic walkability upgrading.
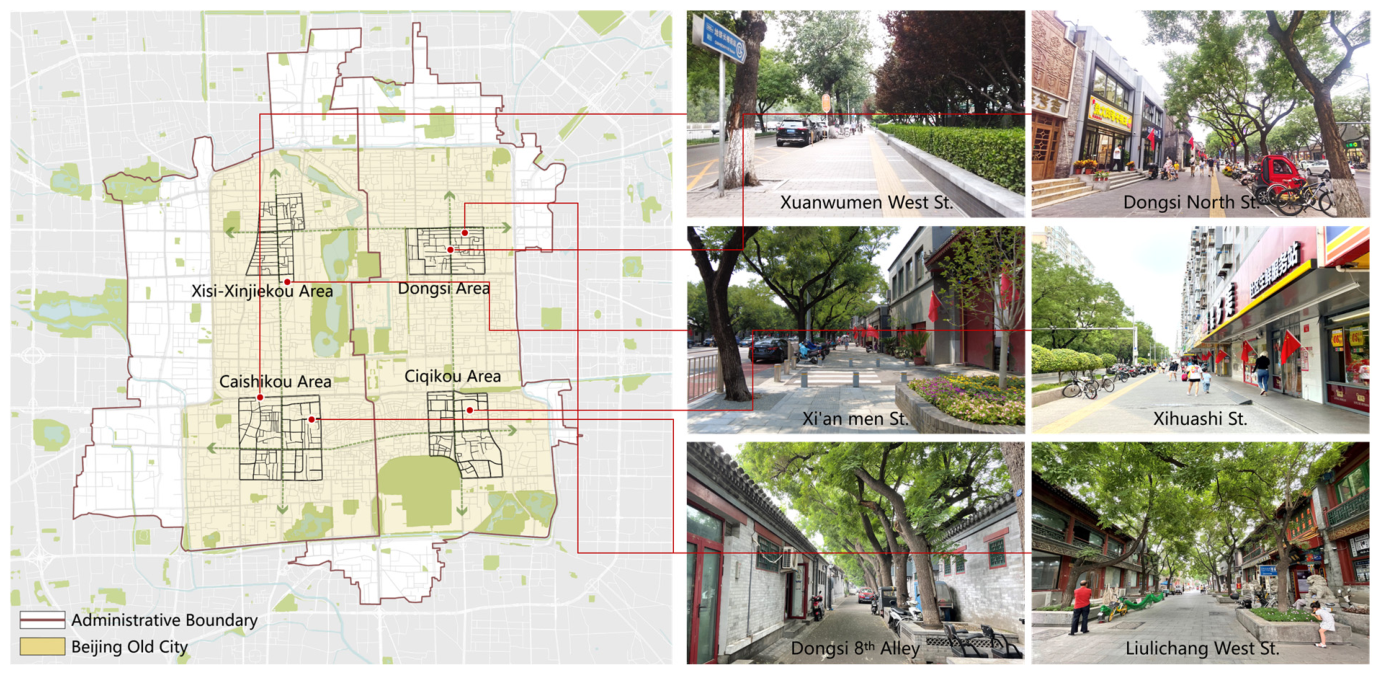
Against such contextual constraints, this research targets the CCA and adopts a micro streetscape analytical framework grounded in the Beijing Main Function Zone Planning [46]. Four typical subdistricts within the CCA are selected as empirical cases: Xisi–Xinjiekou, Dongsi, Caishikou and Ciqikou (Figure 2). Covering diversified street typologies blending historic urban fabric with modern development and mixed living patterns, these case sites constitute a well-represented dataset to support in-depth quantitative analysis.

3.2. Walking Activity Data Collection

To ensure the stability and reliability of the research data, certain limitations are set for data collection, including specific time, climate conditions, recording method, camera route and angle. In this study, data on pedestrians walking activities are collected by recording videos along a specific trajectory during sunny weekends in May. Prior to formal field surveys, preliminary site reconnaissance was implemented across all research sites, and 14 recruited volunteers received standardized training for on-site investigation. For each street, activity data are collected during two periods in one day and take the average value for analysis: 9:00–12:00 and 15:00–18:00. The long-term practice of our project team in Beijing has shown that the selected time period is the representative peak time period for leisure walking and slow-moving activities on the Beijing streets. Additionally, three typical street-view photos are taken. All field videos are captured from fully open public urban streets under public sightseeing and pedestrian scenarios with the intention of avoiding capturing pedestrians’ faces as much as possible. Volunteers walked slowly through the street and took a video to record the pedestrian activity along the middle of the sidewalk, the duration of each video is approximately 5 to 10 min. We have filmed activity videos of a total of 374 streets. Streets with a length under 20 m and unreachable streets are excluded, resulting in a total of 1134 street view photos and 756 video files from 358 street samples collected in the investigation.
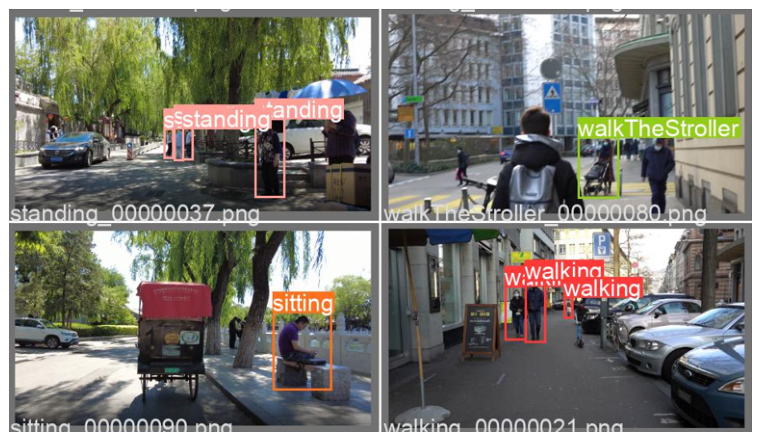
To recognize pedestrian activities, the study proposes an activity recognition tool based on Yolov5, known for its large computing capacity and high precision in capturing the posture of pedestrians. The videos are divided into separate images, with each image corresponding to a specific frame in the video. For each image, we utilize a deep learning approach to classify pedestrian activities by identifying their postures, encompassing walking, standing, sitting, and social interactions (Table 1). The number of each type of pedestrian activity is determined by comparing the change in the centre position of each pedestrian between two consecutive images. To train the deep learning method, a random selection of 1522 images from 20 videos was made, with each pedestrian labelled with a pedestrian activity and a rectangle representing their location. Out of these, 1075 images are used as the training set, while the remaining 447 images are used as the test set, containing a total of 2976 and 1214 objects, respectively (Table 2). The activity recognition results demonstrated in Figure 3 show that each pedestrian is enclosed within a rectangle and recognized with an activity label.
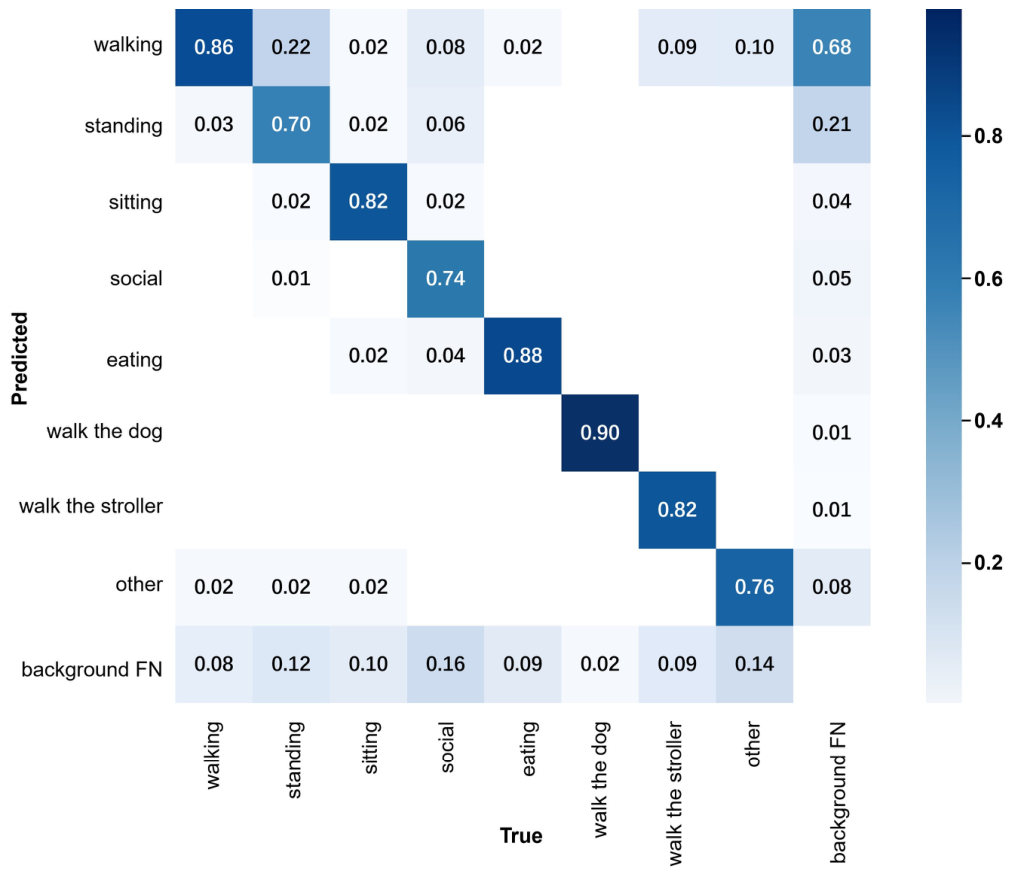
The normalized confusion matrix validates the performance of the fine-grained pedestrian behaviour recognition model. The overall accuracy is high, with most categories achieving over 70% class-specific accuracy, indicating stable performance in complex street environments (Figure 4). The model performs best on behaviours with distinct visual cues, such as walking the dog (0.90), eating (0.88), and walking (0.86). Minor misclassifications are concentrated in static or context-dependent behaviours. Standing (0.70) shows some confusion with walking and other activities, while social interaction (0.74) exhibits moderate ambiguity with other static postures. These errors are consistent with the inherent challenges of inferring behavioural intent from single-frame images, rather than representing model failure.
Once the deep learning model is trained, we utilize the activity recognition tool to process the videos and generate an Excel file containing the count of different activity poses. In this study, the YOLOv5 model automatically screened potentially confusing samples with low classification confidence for secondary manual verification. All ambiguous frames were independently identified by two trained researchers under blind conditions without viewing the model’s preliminary predictions. Unified classification criteria for similar pedestrian behaviours were formulated to reduce subjective deviation. Only 5.2% of the total recognized samples required manual correction. The inter-rater Kappa coefficient reached 0.81, demonstrating high consistency and reliability of manual judgment. After thorough testing, the activity recognition tool achieves an accuracy rate exceeding 85%, meeting the precision requirements for collecting data on a large scale. The activity values of each street during the morning and afternoon periods are averaged to derive pedestrian behaviour variables data. To facilitate the subsequent structural equation model analysis, the activity data are transformed into five grades using the natural break-point method. This conversion assigns scores ranging from 1 to 5 points to the data, aiding in the seamless integration of the variables into the structural equation model calculation.

3.3. Quantifying the Influential Factors of Walkability

3.3.1. Structural Equation Model

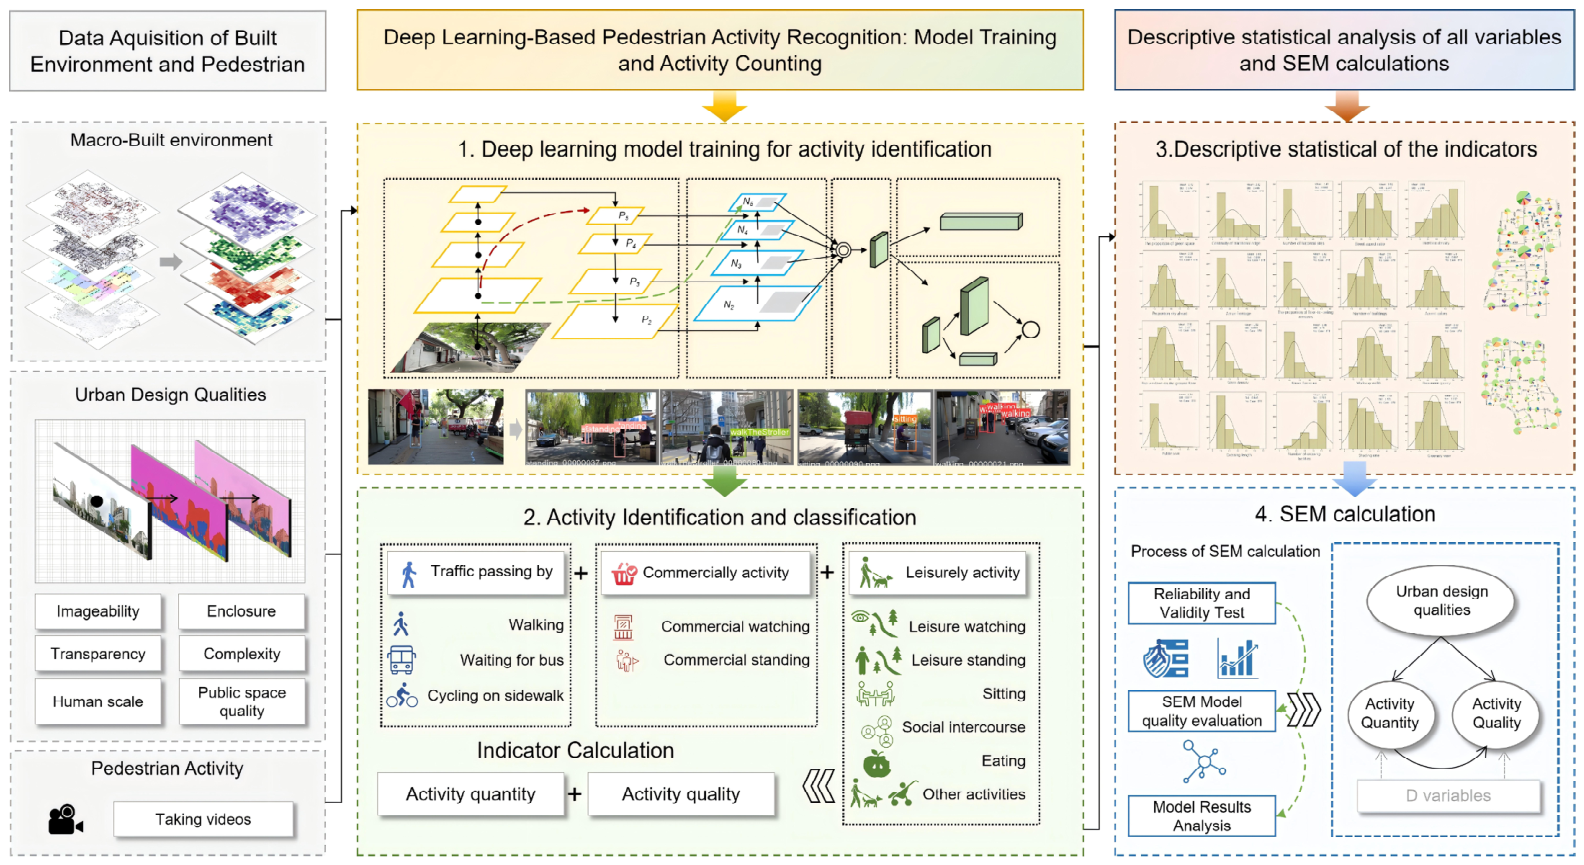
In this study, we utilize the structural equation modelling (SEM) method to investigate the associations between walkability and various impact factors. SEM is a statistical modelling technique used to analyse relationships between observed and latent variables, which combines elements of factor analysis and multiple regression analysis to examine complex relationships among variables. Within the model, the walkability is indicated by activity quantity and activity quality. Both of these are taken as the dependent variables simultaneously, while the urban design qualities are the impact factors. Furthermore, to consider the possible impacts of the built environment factors at the macro-level, we also include the D variables as control variables in the analysis. The indicators for each variable are as follows and the workflow is shown in Figure 5.
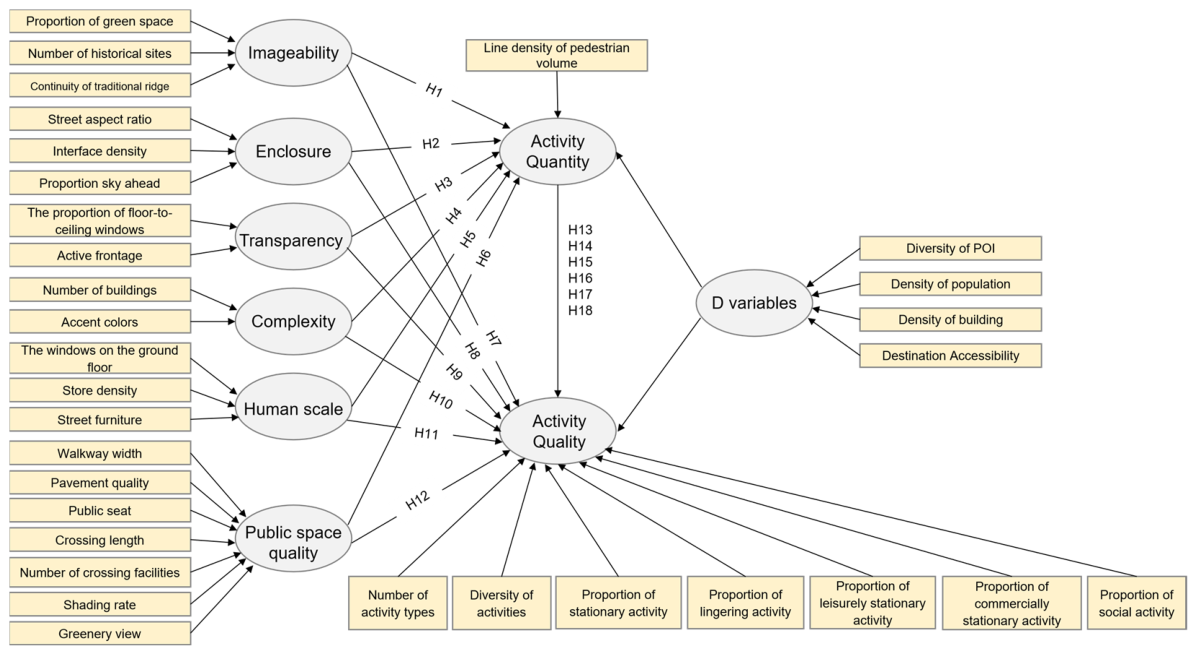
By using the SEM method, the direct and indirect relationships between independent and dependent variables are represented by a path diagram, as shown in Figure 6. The observed variables and the latent variables are represented as rectangles and ovals, respectively. The arrows are used to represent the relationships between variables, where their direction indicates the hypothesized causal relationships between variables. Within Figure 6, the H1–H6 and H7–H12 paths represent the direct impact of the urban design qualities on the activity quantity and the activity quality, respectively. The H13–H18 path represents the indirect effect of urban design qualities on activity quality via the mediating variable of activity quantity. In this study, we utilize the path coefficients of the statistical model to classify the relationship between the various variables.

3.3.2. Dependent Variables

According to established studies by Gehl and other scholars, we adopt both activity quantity and activity quality to characterize walkability from complementary perspectives (Table 3). Considering the characteristics of the SEM model, both activity quantity and activity quality are taken as the dependent variables simultaneously. The activity quantity in this study reflects the magnitude of pedestrian flow scale; activity quality is defined as the comprehensive optimization level of pedestrian behavioural diversity, behavioural richness, and rational spatial utilization of street spaces, which focuses on evaluating the intrinsic quality of street space serving pedestrian activities rather than merely counting pedestrian numbers. The number of activity types and diversity of activity reflect the functional diversity of street pedestrian behaviours; the proportion of stationary and lingering activity characterizes the street’s capacity for accommodating prolonged pedestrian stay and social interaction; and the proportions of commercial stationary activity, social activity, and leisure activity represent the degree of functional matching between street physical environments and pedestrian behavioural demands.
Specifically, in this study, pedestrian activities are further divided into three categories: transportation activities, commercially activities, and leisurely activities (Table 1). Transportation activities describe pedestrian activities related to transport modes, including walking, cycling, and waiting for cars. Commercially activities indicate the willingness of pedestrians to undertake commercial purposes, such as window viewing and shopping queues. Leisurely activities contain leisure waiting and watching, leisure stops, sitting and rest, social interaction, dining, and other activities. To aid in activity recognition based on machine learning, the recognizable gestures of different activities are summarized in Table 1.

3.3.3. Independent Variable

In this study, the urban design qualities are assessed by six indicators, including imageability, enclosure, human scale, transparency, complexity, and public space quality. These indicators cannot be indirectly observed, and thus they are further represented by using 20 physical features which are listed in Table 4 with details on their measurement and sources.
The urban design qualities are mainly derived from multi-source data, including the statistical calculation of the current topographic map, the current status survey statistics, and the image recognition based on street view images. For street view recognition, we use the semantic segmentation tool provided by the High-Performance Spatial Computational Intelligence Lab, which has the advantages of high recognition accuracy and comprehensive recognition elements, including sky, buildings, windows, plants, streetlights, signs, and another 150 kinds of element [47]. The study uses the Likert five-point scale for variables assignment, so that the processed data are comparable under the same dimension, and the calculation results of the structural equation model will be more objective.
Table 4. Urban design qualities and the variable computation.
Urban Design QualitiesDescriptionPhysical FeaturesComputationData Source
ImageabilityThose characteristics make a location unique, recognized, and unforgettable.The proportion of green spaceThe ratio of the length of parks, squares, and other green spaces along a street toward the street’s length.Field research
Number of historical sitesThe number of national, municipal, and district-level cultural protection units and historical buildings along the street.Regulatory Plan of the Capital Core Area [48]
Continuity of traditional ridgeThe ratio of the length of the traditional ridge to the total length of the street.Field research
EnclosureThe degree to which buildings, walls, trees, and other vertical objects visually border a street.Street aspect ratioH/LField research
Interface densityThe ratio of the length of buildings to the total length of the street.Field research
Proportion sky aheadThe proportion of the sky in the street view image.Field research
TransparencyThe degree to which pedestrians can see or perceive things beyond the edge of the street.The proportion of floor-to-ceiling windowsThe proportion of the floor-to-ceiling windows on the first and second floors along the street.Field research
Active frontage(Open facade length × 1.25 + transparent facade length × 1 + transparent window length × 0.75)/total building length × 100%Field research
ComplexityVisual diversity of street space.Number of buildingsThe number of buildings per 100 m.Field research
Accent coloursThe number of dominant colours of buildings.Field research
Human scaleSize, texture, and visibility of micro-built environment elements that correspond to the pedestrian scale.The windows on the ground floorThe proportion of windows on the ground floor to the total street wall.Field research
Store densityThe number of store entrances per 100 m.Field research
Street furnitureThe number of types of street furniture on the street. Combined with the relevant planning, the street furniture is divided into five categories: flower beds, public art, public seats, garbage cans, and signs.Field research
Public space qualityThe characteristic of the street space encourages staying and lingering.Walkway widthThe width of the sidewalk.Field research
Pavement qualityThe proportion of the length of the non-damaged street.Field research
Public seatPublic seat density = (formal seat length × 1 + first type of auxiliary seat length × 0.5 + second type of auxiliary seat length × 0.25)/sidewalk length × 100Field research
Crossing lengthLength of the zebra crossing.Field research
Number of crossing facilitiesAverage interval length of crossing facilities.Field research
Shading rateThe proportion of shaded area shaded by the canopy.Field research
Greenery viewThe proportion of green plants of sight.Field research

3.3.4. Control Variables

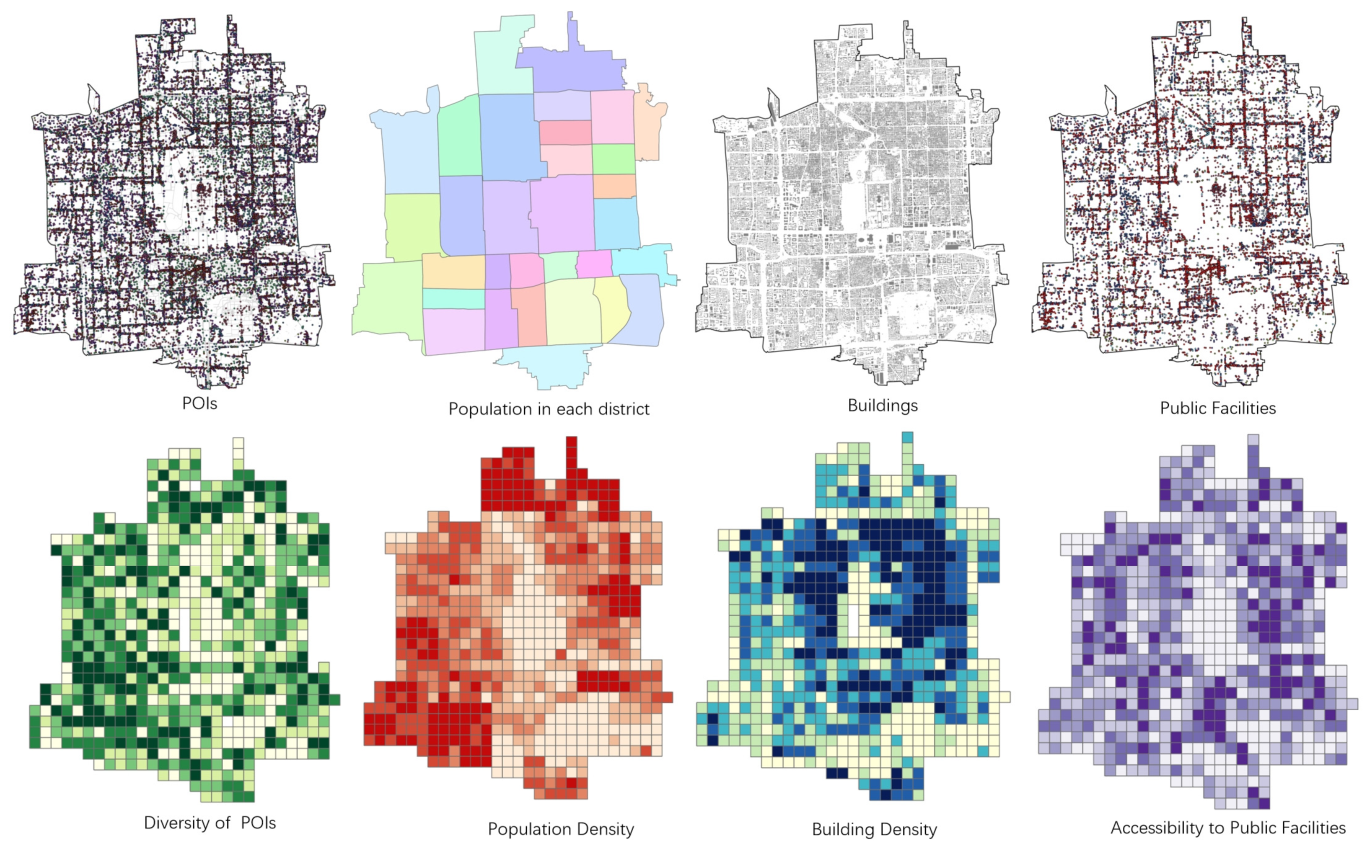
The built environment features, such as land use and accessibility of the streets, have been confirmed to have a significant impact on pedestrian behaviour [6]. In order to make the result of the statistical model more accurate and credible, we add built environment features as control variables, including a diversity of points of interest (POIs), population density, building density, and accessibility to public facilities [38]. The D variables calculation results are shown in Figure 7.

4. Results

4.1. Descriptive Results

4.1.1. Urban Design Qualities

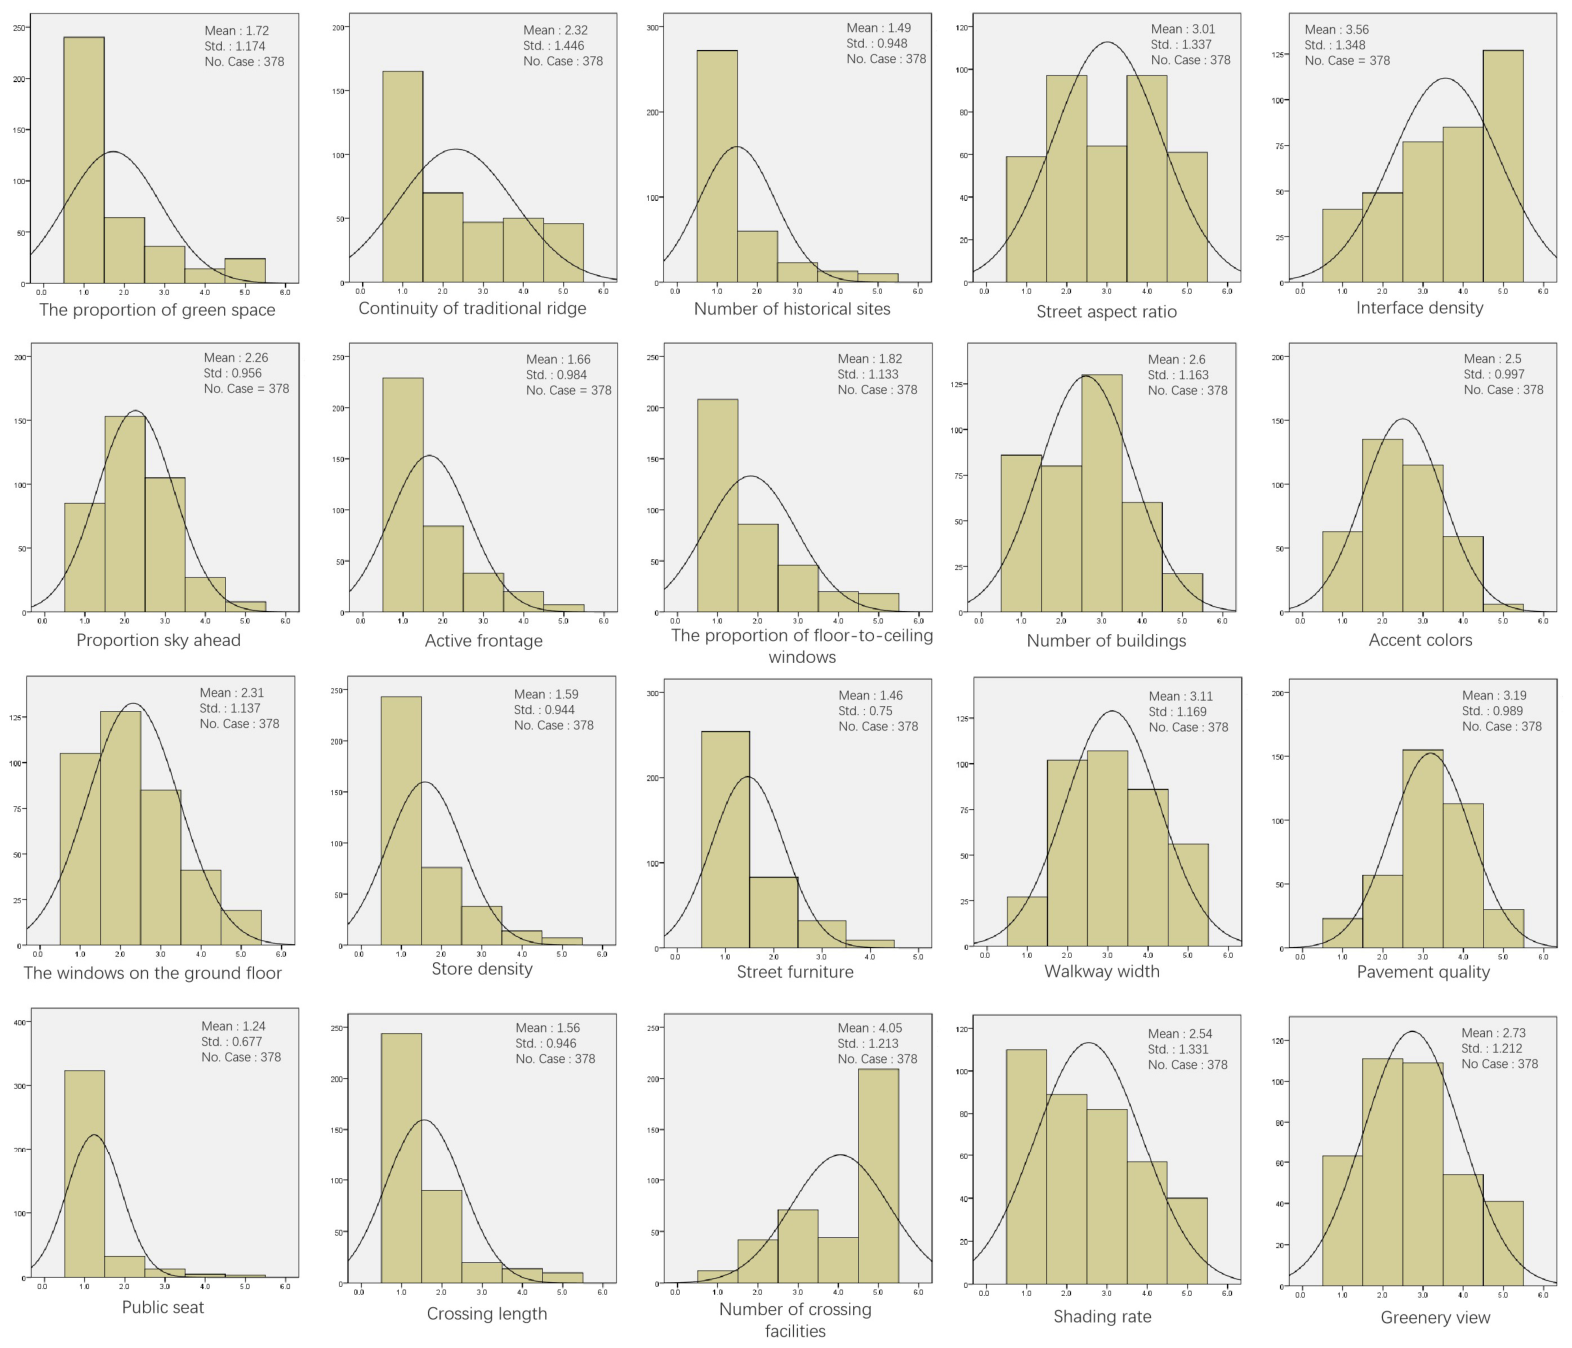
Through the descriptive statistics of the calculation results of the urban design qualities, it can be found that the urban design qualities of most streets are moderate. The frequency statistics show that the scoring results of most physical features are concentrated in 1–2 points (Figure 8), and there is obvious polarization in the interface quality and transparency between different streets. For example, the quality of the alleys in Xisi area is better than that of Caishikou area. There are 80 streets with poor pavement quality, of which 23 are seriously damaged, and most of them are located in the Caishikou area. The high-transparency streets in the four districts are distributed around the edge of districts, and the transparency of the inner streets in each district is generally low. The results also show the lack of essential facilities to support various activities in the streets. Only a few streets have specially arranged formal seats. It is found that among all 358 streets, only 51 of them have public seats, and most of them are informal seats, such as the border of flower beds that are seriously polluted. There are only 16 streets equipped with formal seats that most pedestrians prefer to use.

4.1.2. Activity Quantity

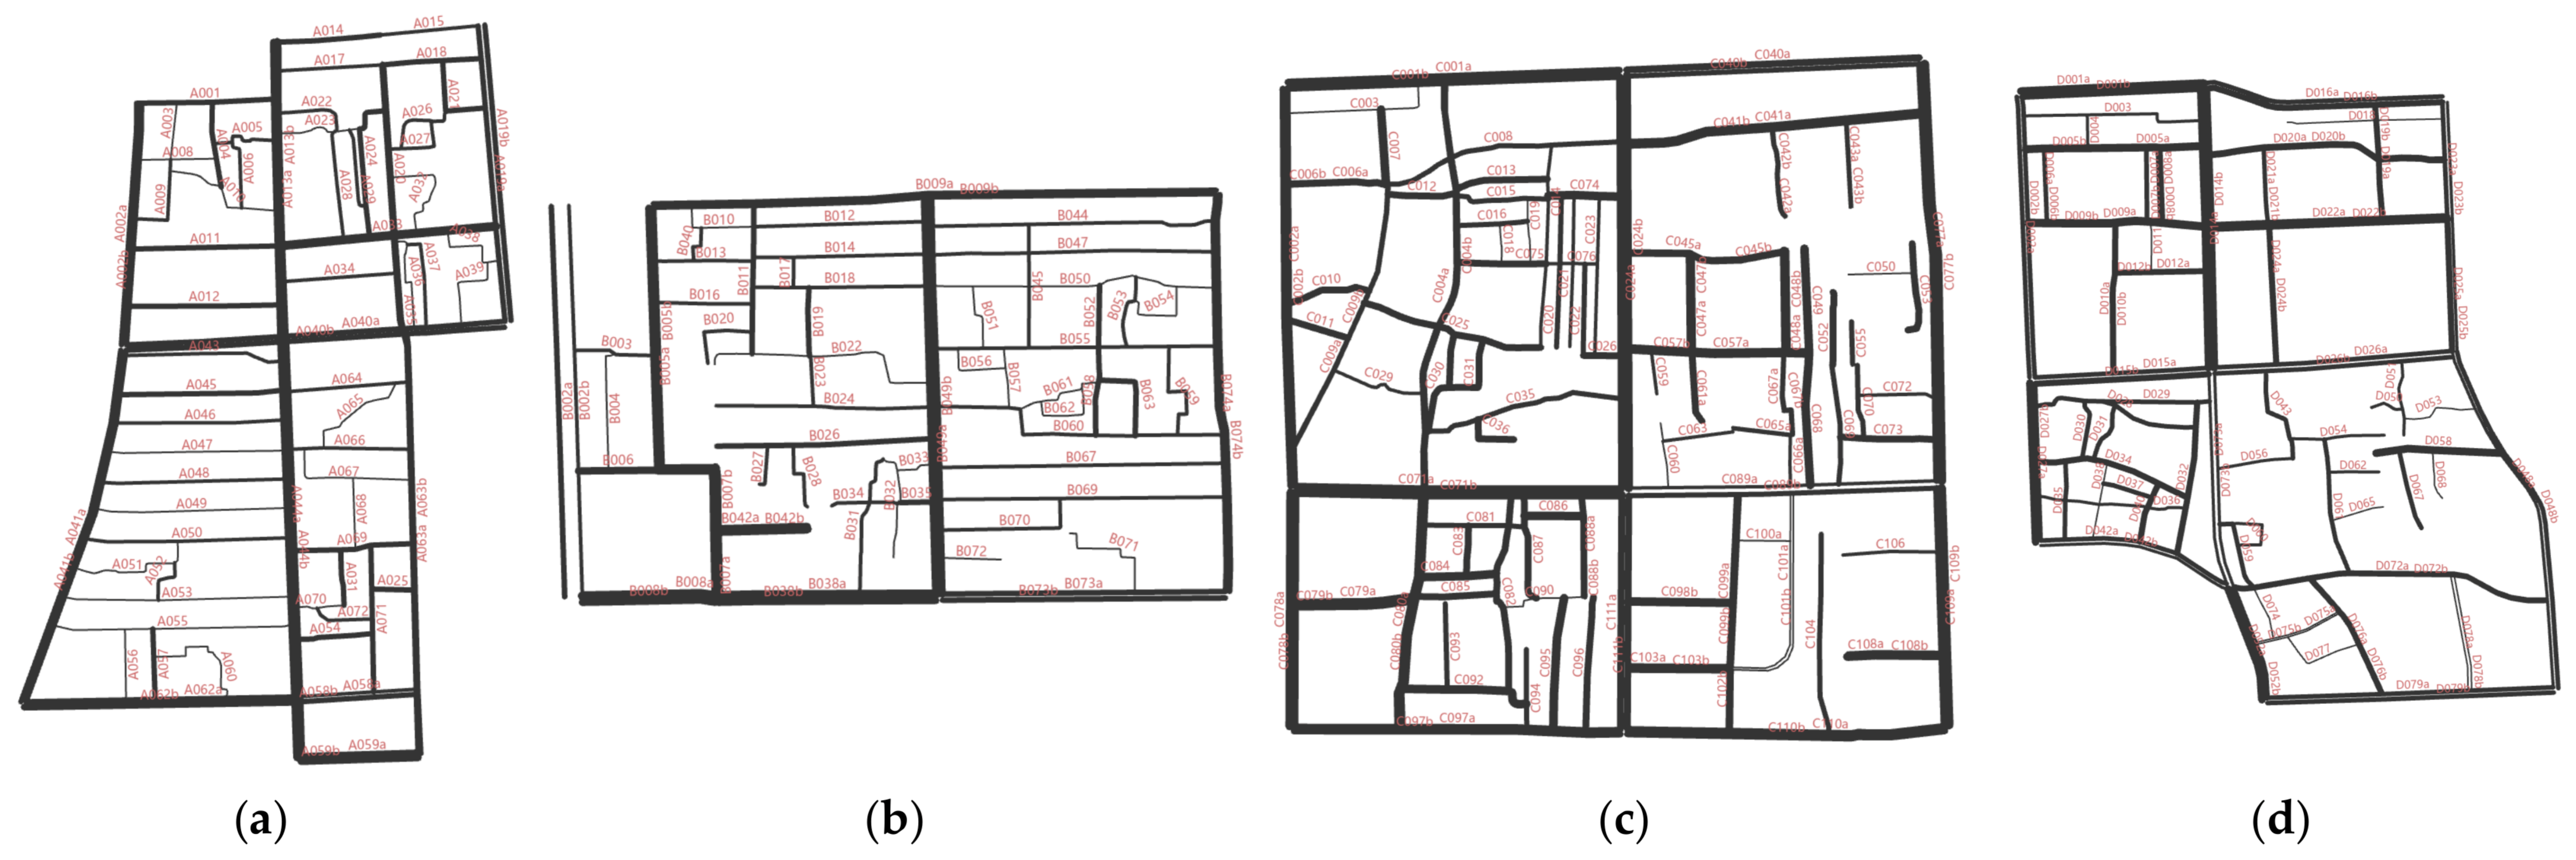
Figure 9 shows the spatial distribution of pedestrian volume on each street of the selected four areas. It can be found that the major streets at the regional border are filled with pedestrians and bustling with pedestrian activities. Compared with these major streets, the interior alleys have less pedestrians and are quieter. For example, the major streets, such as Xinjiekou South Street in Xisi-Xinjiekou area (Figure 9a), Dongsi North Street in Dongsi area (Figure 9b), and Chongwenmenwai Street in Ciqikou area (Figure 9d), have a higher concentration of people. The amount of activity on either sidewalk of the same street might vary greatly, such as Xinjiekou South Street, Chongwenmen West Street, Xi’anmen Street, Wusi Street, Dongchunshu Hu, etc. This phenomenon may be caused by the stark variations in urban design qualities on different sides of the street, such as differences in transparency and human scale.

4.1.3. Activity Quality

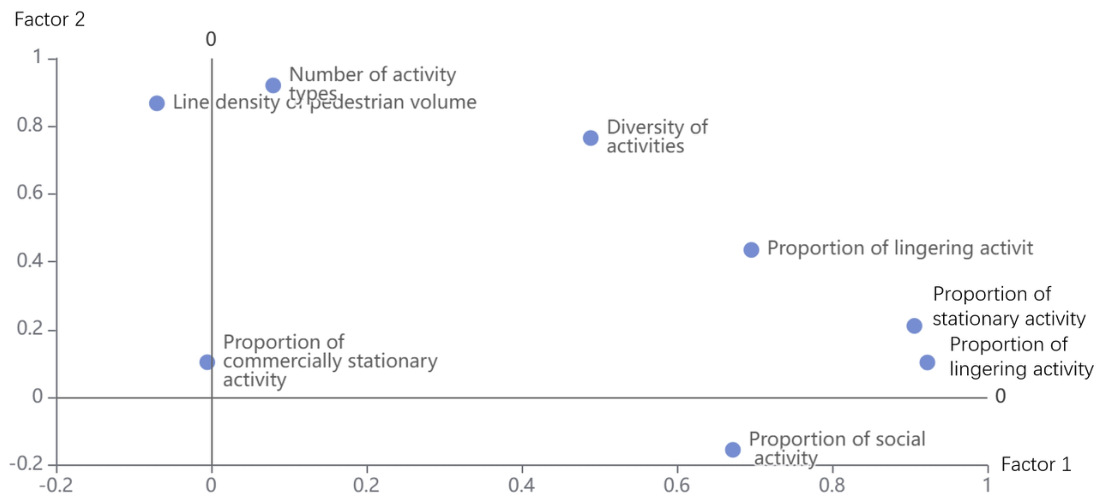
This study performed confirmatory factor analysis (CFA) to empirically validate the construct of activity quality and avoid subjective assumptions regarding indicator compatibility. The CFA results show that all selected activity indicators exhibit significant positive factor loadings on the latent activity quality variable, with acceptable composite reliability and convergent validity (Figure 10). These findings confirm that the adopted indicators collectively measure a unified concept of pedestrian-space activity quality, rather than capturing unrelated independent features, thereby verifying the rationality of the indicator system.
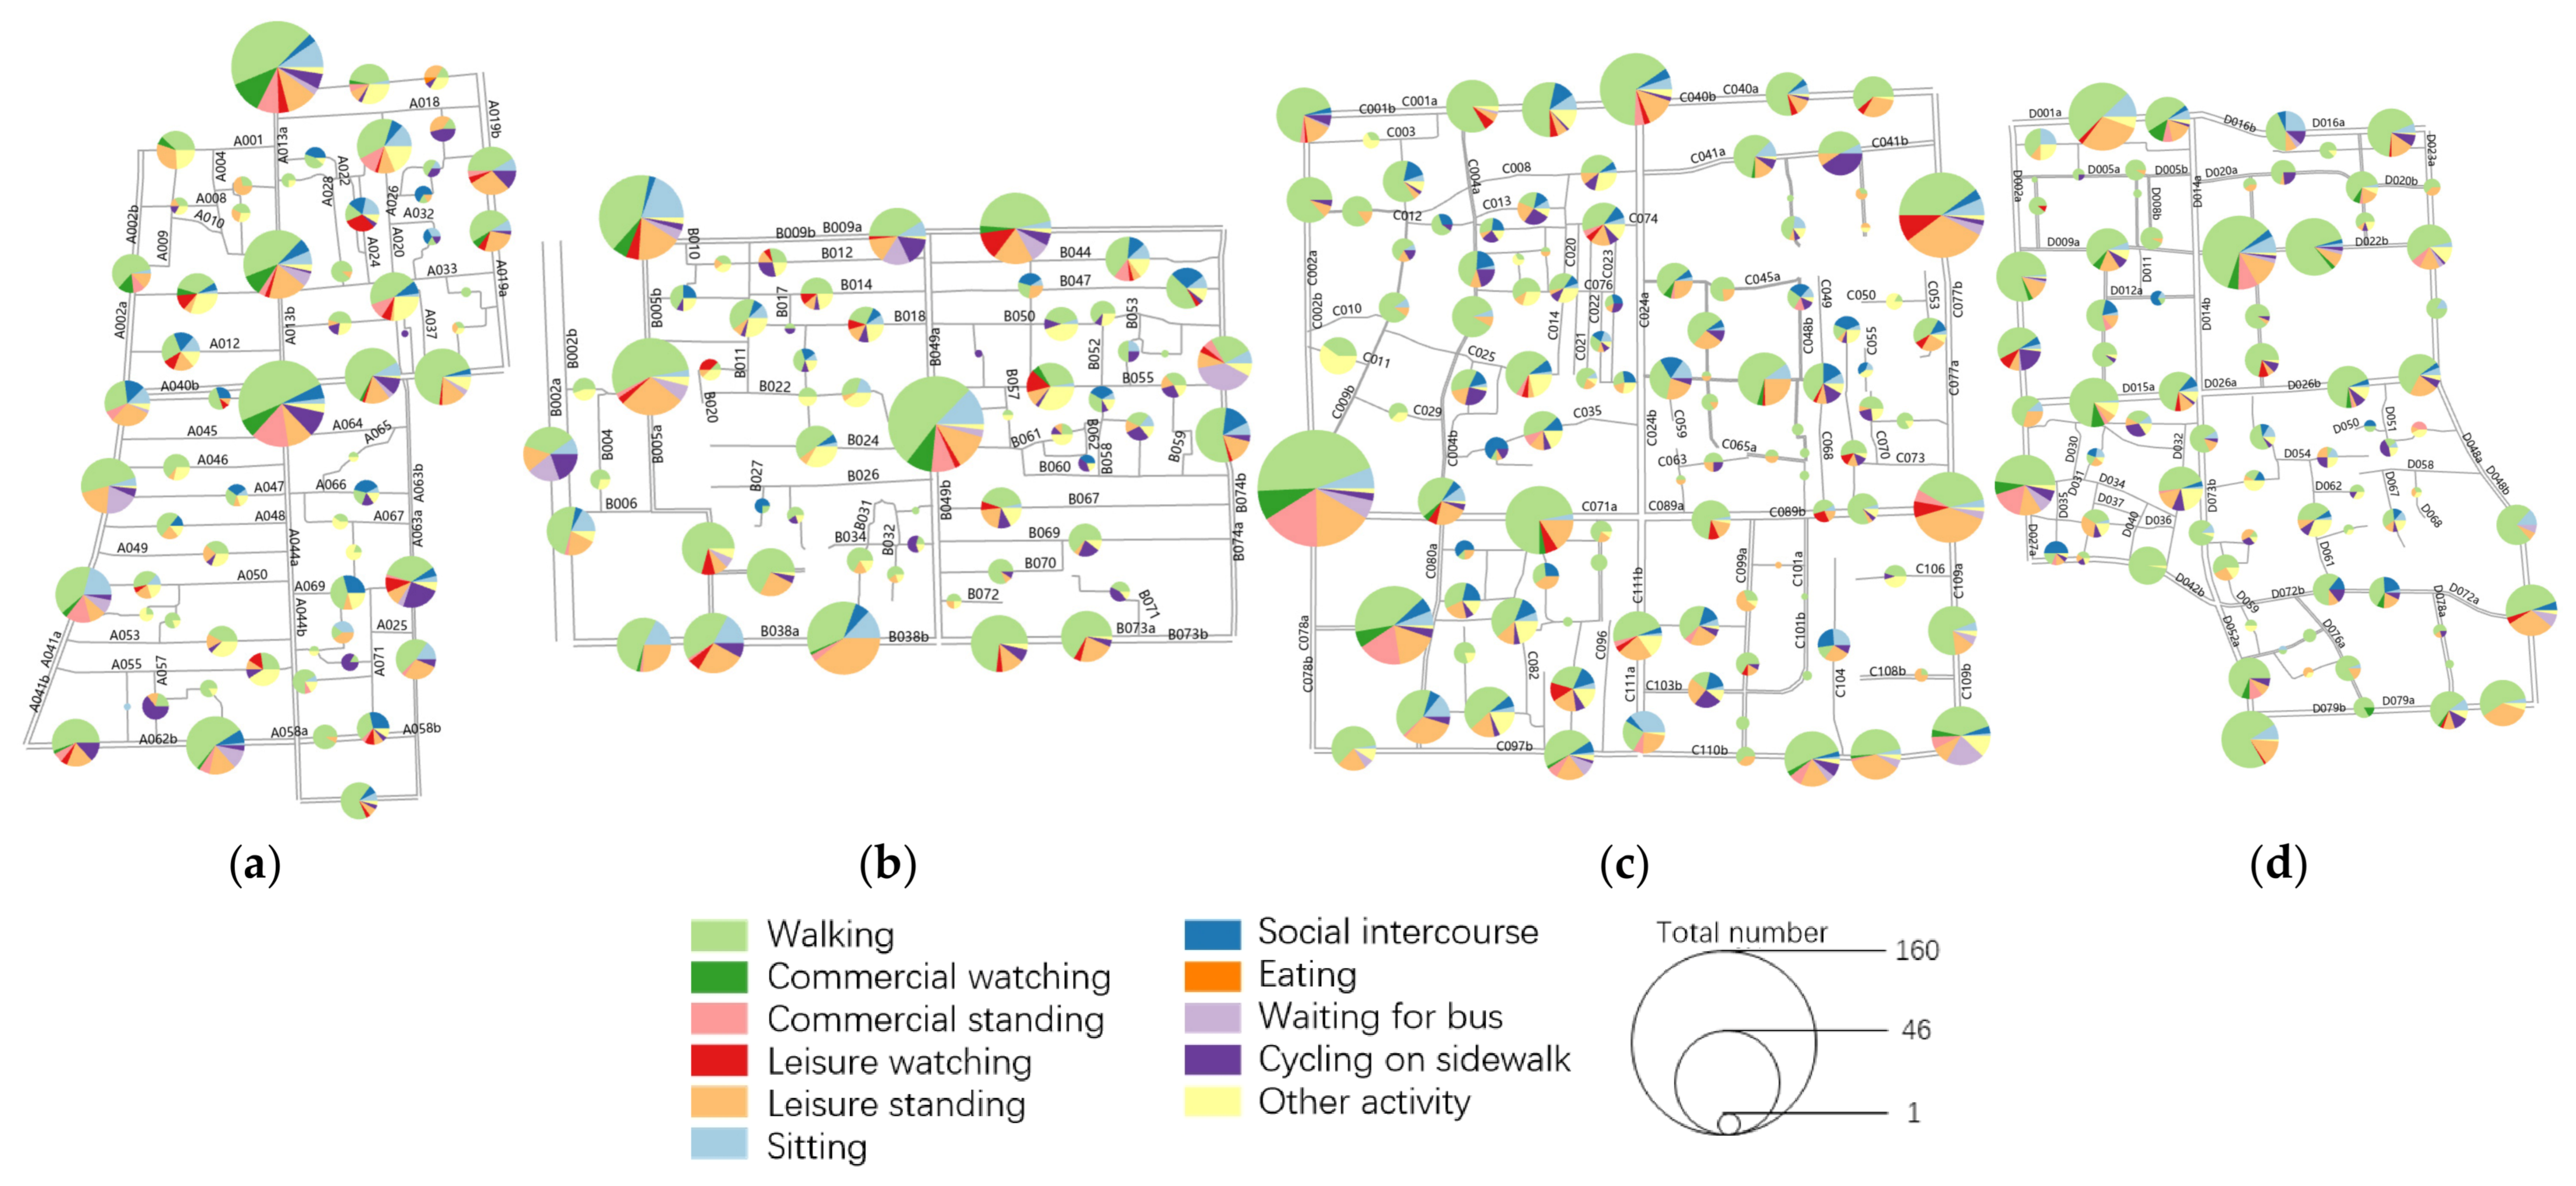
The distributions of different types of pedestrian activities on these streets are shown in Figure 11. The results show fewer activity categories on the streets. Within these activities, passing by is the primary traffic purpose on streets, while leisure standing, sitting and social activities appear less frequently. In Xisi area, for instance, probably due to the lack of stationary facilities, there are more people standing for leisure, fewer sitting and staying in the streets, and most pedestrians sit on motor vehicles and road piers. The investigation of four sub-centres in the CCA reveals that fewer social activities are found on the streets than have been discovered in studies conducted in other countries. There are fewer lingering activities on the streets, and traffic activities take up the majority of the available space. The Xisi and Dongsi areas have a higher percentage of lingering activities, while Caishikou and Ciqikou account for a small proportion of lingering activities, and there are fewer stationary activities. Sanitation is the most prevalent activity, followed by walking dogs, less frequent activities included children playing and walking the strollers.

4.2. Model Quality Test

4.2.1. Reliability and Validity Test

In order to ensure high-quality calculations, it is required to test the validity and reliability of the indicators, prior to the structural equation model’s calculation. The reliability coefficient value is 0.740, which is higher than 0.7, indicating that the estimated sample has a high level of reliability [49]. To determine whether each component of the built environment is reasonable and significant, validity tests might be utilized. The calculation results showed that the KMO value is 0.860, which is greater than 0.6. The common factor variances of the measurement index items are all higher than 0.4, indicating that it is possible to extract and process the information from each measurement index. In other words, the survey data are highly reliable, and the structural equation model calculation could proceed.

4.2.2. SEM Quality Evaluation

The obtained variables data are imported into Smart PLS, where an SEM model is built using the previously specified parameters (Figure 6). The value of each index is the input feature, and then the bias correction and acceleration (BCa) bootstrap method is used to calculate the results. As the built-environment indicators constitute a mixed-type measurement system, items with low CITC values were screened out accordingly. To optimize the robustness of the final SEM specification, indicators exhibiting low CITC scores (i.e., items poorly correlated with remaining measurement variables) were excluded from the model. The continuation of the traditional ridge, proportion sky ahead, street aspect ratio, number of buildings, and number of crossing facilities were eliminated because of their weak correlation with other indicators. After removing indicators with low CITC values, the model operates well. Calculation outcomes were summarized into the SEM evaluation coefficient table (Table 5), which serves to statistically verify the existence of the proposed hypothetical path relationships.
The maximum R2 value for the latent variable is then obtained using the PLS algorithm calculation and path weighting. The range of the R2 value is typically 0 to 1, and the greater the value, the more efficient the structural equation model used in the study as an explanatory tool. The estimated findings reveal that activity quantity and activity quality had R2 values of 0.387 and 0.649, respectively (Table 5). In terms of the quantity of activities, the urban design qualities have a moderate explanatory capacity; while the quality of activities have considerable explanatory potential.
The path coefficient is determined by the T-value and p-value. When the T-value is greater than 1.96 and the p-value is less than 0.05, the path is significant, i.e., the hypothesis is valid. From the calculated results of the model (Table 5), seven of them are calculated to be significant. The imageability-activity quantity path does not show significance; the imageability-activity quality path shows significance; the enclosure-activity quantity path does not show significance and the enclosure-activity quality path shows significance; the transparency-activity quantity path shows significance, and the transparency-activity quality path does not show significance; the complexity-activity quantity path and complexity-activity quality paths does not show significance; human scale-activity quantity and human scale-activity quality paths show significance; public space quality-activity quantity and public space quality-activity quality paths show significance. Among the hypothesized six paths with mediating variables, three of them are calculated to be significant (Table 6), including the transparency-activity quantity-activity quality path, the human scale-activity quantity-activity quality path, and the public space quality-activity quantity-activity quality path.
In conclusion, imageability, enclosure, transparency, human scale and public space quality show significant correlations with pedestrian behaviours. Urban design attributes are associated with pedestrian activity quality through the intermediate variable of activity quantity. Specifically, perceptual characteristics of built environments correlate with pedestrian activity quantity, and higher activity quantity tends to correspond to richer and more diversified pedestrian activities. The path estimation results between activity quality and pedestrian volume indicate a bidirectional feedback loop: elevated street activity quality is capable of attracting greater pedestrian volumes, whereas concentrated pedestrian flows can further foster spontaneous social and stationary activities. On this basis, core built-environment indicators closely linked to pedestrian activities are further summarised and analysed according to the calculated results of the structural equation model, as shown in Table 7.

4.3. SEM Results

4.3.1. Imageability

According to model results in Table 5, imageability presents a statistically significant correlation with activity quality (T = 3.367, p = 0.001), whereas its correlation with activity quantity is insignificant (T = 1.513, p = 0.130). This statistical pattern coincides with the empirical conclusion from a New York-based study [50], which reported no obvious association between imageability and pedestrian volume. Differing from that prior evidence, our dataset indicates a notable statistical linkage between imageability and pedestrian activity quality.
In terms of physical environmental attributes, the quantity of historic buildings and green spaces is statistically correlated with the diversity of activity types (Table 7). The abundance of historic landmarks shows strong statistical association with richer activity categories. One plausible interpretation is that historic street segments such as Huguosi Street and Dazhiqiao Alley easily attract sightseeing, stationary viewing and other related activities. Streets equipped with abundant green space correspond to more diverse activity types yet lower shares of lingering behaviour. Most sample streets with large-scale green belts belong to arterial transit corridors dominated by passing travel demand, which statistically corresponds to fewer long-stay pedestrian activities.

4.3.2. Enclosure

The results indicate that enclosure shows no statistically significant correlation with activity quantity (T = 0.642, p = 0.521), while it is significantly correlated with activity quality (T = 2.293, p = 0.022). This statistical trend is consistent with a previous study [51], which reported insignificant association between enclosure and pedestrian volume. Our data also reveal a notable statistical linkage between enclosure and activity quality. Interface density presents strong statistical correlations with activity diversity and the share of lingering activities. Statistically, higher street interface density tends to correspond to richer activity types. By contrast, large vacant street spaces are generally associated with poorer diversification of on-street activities. Comfort and perceived safety brought by compact interface layout is commonly linked to longer staying and social interaction, which explains why streets such as North Xisi Street and North Dongsi Street, with high interface density, correspond to abundant lingering and social behaviours.

4.3.3. Transparency

Transparency is significantly correlated with activity quantity (T = 2.512, p = 0.012) but shows insignificant correlation with activity quality (T = 0.274, p = 0.784). Meanwhile, transparency links to activity quality indirectly via activity quantity as the mediating variable (T = 2.470, p = 0.014). In addition, the proportion of floor-to-ceiling windows and active frontage along streets have evident statistical associations with activity abundance, matching the findings from most existing studies [32,45]. After controlling for macro background factors, transparency correlates positively with pedestrian quantity and further links to urban design attributes associated with pedestrian volume.
The path coefficient between active frontage and pedestrian density reaches 0.463 (Table 7), demonstrating that active frontage presents the strongest statistical correlation with activity quantity among selected indicators. Compared with window ratio, store proportion has a more prominent association with pedestrian volume. Meanwhile, activity quantity is statistically associated with perceived environmental quality, while pedestrian density correlates with activity category richness, the proportion of leisure activities, and commercial stationary share. The dataset suggests that dense pedestrian flow tends to correspond to more commercial lingering behaviours without obvious linkage to social activities.

4.3.4. Complexity

Complexity shows insignificant correlations with both activity quantity (T = 0.954, p = 0.340) and activity quality (T = 0.616, p = 0.538), consistent with the outcomes of prior empirical research [32,45,46].

4.3.5. Human Scale

Human scale has significant statistical correlations with both activity quantity (T = 2.544, p = 0.011) and activity quality (T = 2.843, p = 0.004), and it is linked indirectly to activity quality through the mediating path of activity quantity (T = 2.539, p = 0.011). Different from relevant research conducted in cities of the United States and South Korea, where human scale bears a weak association with pedestrian volume, this indicator presents prominent statistical relevance to pedestrian activity quantity and quality within Beijing’s historic core streets.
Ground-floor shop windows, retail stores and street furniture correlate with pedestrian density, activity category diversity, and the share of stationary behaviours, and these facilities tend to correspond to abundant standing and sitting activities on streets. Shop and ground-floor window ratios are negatively correlated with social activities and leisure lingering, while positively correlated with commercial stationary behaviours. This counterintuitive result can be explained from the built environment perspective. Dense retail frontages draw crowds for short commercial stays, squeezing limited sidewalk space. Such streets usually lack shade and seating, with narrow usable pedestrian widths occupied by shops and shoppers. The busy, transient atmosphere discourages relaxed, spontaneous social lingering.

4.3.6. Public Space Quality

Public space quality has significant statistical correlations with activity quantity (T = 3.123, p = 0.002) and activity quality (T = 2.820, p = 0.005), and it also connects indirectly with activity quality via activity quantity as mediator (T = 2.89, p = 0.001). Walkway width, pavement condition, public bench configuration, crossing span, shading ratio and green visibility all present notable associations with pedestrian activity characteristics. Wider pedestrian paths are statistically linked to higher pedestrian density and larger crowd capacity. Walkway width, pavement quality, bench layout, shading and green visibility collectively correspond to diversified on-street activities; streets with adequate tree shading and green landscapes tend to match richer activity types, and well-paved streets equipped with scattered benches generally correspond to more varied pedestrian behaviours. Among these indicators, walkway width and shading level show strong statistical relevance to standing and sitting frequency, namely, sufficient space and favourable micro-environment tend to correspond to more stationary and lingering behaviours.

5. Discussion

Street walkability has attracted extensive research attention in recent years. Nevertheless, the majority of existing studies centre on pedestrian volume evaluation, whereas few investigations focus on walking activity quality. Accordingly, this study constructs an analytical framework to explore the associations between fine-grained walking activity types and built-environment characteristics, facilitating a more holistic interpretation of street walkability. To overcome computational obstacles associated with fine-grained data, an innovative deep learning architecture is employed for the identification and quantitative statistics of walking activities. We used this tool to extract pedestrian activity data for 358 streets in Beijing, and the tool can be extended to other cities for pedestrian activity analysis. The findings provide direct evidence of which streetscape features attract pedestrians to stay, linger, and chat with others.
  • Human scale and public space quality may be the most important urban design qualities in encouraging people to gather in streets, as they show a substantial effect on the quantity and quality of activities. That is, people care more about the perceived fine-scale quality of the street at the slow speed of walking. The model calculation results validate the results of other previous studies, that is, transparency has a substantial effect on the activity quantity [32,46]. In addition, our study also complements previous studies by revealing that imageability and enclosure are not only important for pedestrian volume, but also essential for walking activity quality.
  • The study chose 20 distinct physical features as measuring indicators. The results of the model indicate that 14 elements of the built environment have a substantial impact on the quantity and quality of activities. The results show that there are more stationary and lingering activities on streets with higher interface density and shorter crossing lengths and that more commercially activities occur in the streets with more windows, stores, and higher greenery viewing rates. The interface density, street furniture, walkway width, and greenery view can encourage pedestrians to stay on this street. Pedestrians prefer to socialize on streets with higher interface density and shorter crossing lengths. Social activities are usually less frequent on sidewalks of expressways, even though there are more greenery and trees on these expressways. Interestingly, higher interface density and shorter crossing length favoured the occurrence of social activity, while the proportion of ground floor window had a significant negative effect on social activity. A possible explanation for this might be that the higher proportion of ground floor windows could lead to many commercially stationary pedestrians. Additionally, a large number of commercial pedestrians occupy more street space, which is not conducive to social activities.
Beijing’s street guidelines do not make specific provisions on the street-scale physical features. The model identifies the effects of different physical features on different types of stationary activities through fine-grained data analysis. The results of this study can help Beijing’s street guidelines to set standards for walkable feature improvement. For example, some streets have not yet fulfilled the traffic demand, and there are streets that are in poor condition. This area is still in the process of enhancing traffic demand and taking stationary activity demand into account. It should be upgraded in terms of pavement renewal, interface density enhancement, and the street furniture. For residential areas, efforts should be made to improve the environment to support the local residents’ staying and social needs, such as by enriching the street furniture and improving the transparency of the interface. The windows on the ground floor of main streets can be appropriately raised to increase the opportunities for active sight contact indoors and outdoors, and the alleys should focus on enriching the types of street furniture to support residents staying and sitting.
The samples of this study have been selected mainly to measure representative areas in Beijing’s central area. In future studies, it could be further expanded to cover all streets in the whole central area to further increase the practical reference value of the research results. In addition, the four areas selected for the study have different social and historical contexts, thus creating some variability in urban design qualities and activity status. The different historical backgrounds could be further explored in future studies to provide references for the promotion of the walkability of the areas. The deep learning model could be further optimized for fine-grained behaviour recognition [52,53]. In the future, we will expand samples and research scenarios, improve the recognition method, and explore the influencing mechanism of street spatial factors on pedestrian activities.

6. Conclusions

This study performs fine-grained quantification of walkability and pedestrian activities as well as their correlation analysis based on dynamic monitoring and activity identification. We first define the concept of walking activity quality and verify via empirical datasets that urban design attributes exert a stronger influence on activity quality, with pedestrian flow serving as another influential factor. Machine learning algorithms are adopted to boost the precision and computational efficiency of fine-grained activity datasets, and the structural equation model (SEM) is further applied to quantify the causal relationships among urban design qualities, pedestrian volume and activity quality.
Empirical findings reveal that pedestrians prefer spaces with distinctive contextual value to engage in stationary and social activities. Accordingly, the analytical results demonstrate that specific physical street features are critical to encouraging pedestrian lingering behaviours.
The empirical results of this study establish a robust theoretical and practical foundation for the formulation of street design criteria, the renewal of human-oriented streetscapes, and the advancement of sustainable urban construction. Furthermore, the analytical framework developed herein can be generalized to other cities featuring analogous old urban districts, supplying actionable decision-making references for the optimization of pedestrian-centric public spaces.
Notably, this study has two limitations worthy of discussion for follow-up research. For one thing, the analysis is built upon cross-sectional data, which limits our capacity to fully disentangle reciprocal causal relationships between street activity quality and pedestrian volume. The observed unidirectional correlation mainly captures the dominant spatial supply-driven linkage within the study area, while potential bidirectional interactions may still coexist. Longitudinal time-series data could be adopted in future work to further unpack these mutual feedback mechanisms. For another, all video recordings were captured on mild sunny weekends in May, a time window featuring peak pedestrian activity that helps capture typical street usage characteristics to a certain degree. However, the dataset does not incorporate weekday traffic, nighttime scenes, varying seasons or diverse weather conditions, which means the quantitative correlation coefficients obtained may not be directly applicable to all temporal and climatic contexts.

Author Contributions

Conceptualization, M.Z. and L.B.; methodology, M.Z. and L.B.; software, M.Z. and A.L.; validation, M.Z., H.W. and A.L.; formal analysis, M.Z.; investigation, M.Z.; resources, M.Z. and A.L.; data curation, M.Z.; writing—original draft preparation, M.Z. and A.L.; writing—review and editing, M.Z., H.W. and A.L.; visualization, M.Z.; supervision, L.B. and A.L.; project administration, M.Z.; funding acquisition, M.Z. and L.B. All authors have read and agreed to the published version of the manuscript.

Funding

This research was supported by the National Natural Science Foundation of China (No. 52408045), the financial support of Scientific Research Funds of Anhui Jianzhu University under (2023QDZ08), the Anhui Province University Outstanding Scientific Research and Innovation Team (2022AH010021).

Institutional Review Board Statement

The study was conducted in accordance with the Declaration of Helsinki and approved by the Science and Technology Ethics Committee of Anhui Jianzhu University (protocol code 2026012 and date of approval is 17 May 2026).

Informed Consent Statement

Not applicable.

Data Availability Statement

The data are unavailable due to the confidentiality of the terrain data.

Acknowledgments

Thanks for the support of the School of Architecture at Tsinghua University, the School of Architecture and Spatial Planning at Anhui Jianzhu University and the Anhui Provincial Engineering Research Center for Regional Environmental Health and Spatial Intelligent Perception.

Conflicts of Interest

The authors declare no conflicts of interest.

Abbreviations

The following abbreviations are used in this manuscript:
CCACapital core area
SEMStructural equation modelling

References

  1. Xiong, K.; Guan, C.; Ghaffarianhoseini, A.; Cheshmehzangi, A.; Zahed, L.M.; Prasad, D.; He, B.-J. Cool walkable and cyclable community planning for heat-resilient transportation system: An empirical analysis. Sustain. Cities Soc. 2025, 130, 106658. [Google Scholar] [CrossRef]
  2. Li, Y.; Yabuki, N.; Fukuda, T. Measuring visual walkability perception using panoramic street view images, virtual reality, and deep learning. Sustain. Cities Soc. 2022, 86, 104140. [Google Scholar] [CrossRef]
  3. Elzeni, M.M.; ELMokadem, A.A.; Badawy, N.M. Impact of urban morphology on pedestrians: A review of urban approaches. Cities 2022, 129, 103840. [Google Scholar] [CrossRef]
  4. Li, Y.; Yabuki, N.; Fukuda, T. Integrating GIS, deep learning, and environmental sensors for multicriteria evaluation of urban street walkability. Landsc. Urban Plan. 2023, 230, 104603. [Google Scholar] [CrossRef]
  5. Hamidi, N. How Walkable Mixed-Use Urbanism Affects Environmental, Social, and Economic Sustainability. Int. J. Sustain. Appl. Sci. Eng. 2025, 2, 25–38. [Google Scholar]
  6. Ewing, R.; Handy, S. Measuring the unmeasurable: Urban design qualities related to walkability. J. Urban Des. 2009, 14, 65–84. [Google Scholar] [CrossRef]
  7. Mehrinejad Khotbehsara, E.; Yu, R.; Somasundaraswaran, K.; Askarizad, R.; Kolbe-Alexander, T. The walkable environment: A systematic review through the lens of Space Syntax as an integrated approach. Smart Sustain. Built Environ. 2025. Epub ahead of printing. [Google Scholar] [CrossRef]
  8. Aghaabbasi, M.; Moeinaddini, M.; Shah, M.Z.; Asadi-Shekari, Z.; Kermani, M.A. Evaluating the capability of walkability audit tools for assessing sidewalks. Sustain. Cities Soc. 2018, 37, 475–484. [Google Scholar] [CrossRef]
  9. Sepehri, B.; Adibhesami, M.A.; Gadyuchkova, R.; Ababneh, A.; Parvanehdehkordi, A. Walkable cities for all: Enhancing citizens’ rights, health, and climate adaptations. Cities Health 2025, 1–30. [Google Scholar] [CrossRef]
  10. Arellana, J.; Saltarín, M.; Larrañaga, A.M.; Alvarez, V.; Henao, C.A. Urban walkability considering pedestrians’ perceptions of the built environment: A 10-year review and a case study in a medium-sized city in Latin America. Transp. Rev. 2020, 40, 183–203. [Google Scholar]
  11. Chen, L.; Lu, Y.; Ye, Y.; Xiao, Y.; Yang, L. Examining the association between the built environment and pedestrian volume using street view images. Cities 2022, 127, 103734. [Google Scholar] [CrossRef]
  12. Mehta, V.; Bosson, J.K. Revisiting lively streets: Social interactions in public space. J. Plan. Educ. Res. 2021, 41, 160–172. [Google Scholar]
  13. Gehl, J. Cities for People; Island Press: Washington, DC, USA, 2013. [Google Scholar]
  14. Sharifi, E.; Boland, J. Passive activity observation (PAO) method to estimate outdoor thermal adaptation in public space: Case studies in Australian cities. Int. J. Biometeorol. 2020, 64, 231–242. [Google Scholar] [PubMed]
  15. Cerrone, D.; Baeza, J.L.; Lehtovuori, P. Optional and necessary activities: Operationalising Jan Gehl’s analysis of urban space with Foursquare data. Int. J. Knowl.-Based Dev. 2020, 11, 68–79. [Google Scholar] [CrossRef]
  16. Norouzipour, N.; Khalili, A.; Shemirani, S.M.M. Feasibility study of walkable routes and operationalization of sustainable urban design. J. Urban Plan. Dev. 2025, 151, 05025015. [Google Scholar] [CrossRef]
  17. Zhou, W.; Yu, W.; Qian, Y.; Han, L.; Pickett, S.T.; Wang, J.; Ouyang, Z. Beyond city expansion: Multi-scale environmental impacts of urban megaregion formation in China. Natl. Sci. Rev. 2022, 9, nwab107. [Google Scholar] [PubMed]
  18. Xiao, Y.; Song, M. How are urban design qualities associated with perceived walkability? An AI approach using street view images and deep learning. Int. J. Urban Sci. 2025, 29, 66–91. [Google Scholar]
  19. Park, K.; Ki, D.; Lee, S. Toward automated and comprehensive walkability audits with street view images: Leveraging virtual reality for enhanced semantic segmentation. ISPRS J. Photogramm. Remote Sens. 2025, 223, 78–90. [Google Scholar] [CrossRef]
  20. Ma, H.; Li, J.; Ye, X. Deep learning meets urban design: Assessing streetscape aesthetic and design quality through AI and cluster analysis. Cities 2025, 162, 105939. [Google Scholar] [CrossRef]
  21. Chan, E.T.; Schwanen, T.; Banister, D. Towards a multiple-scenario approach for walkability assessment: An empirical application in Shenzhen, China. Sustain. Cities Soc. 2021, 71, 102949. [Google Scholar] [CrossRef]
  22. Forsyth, A. What is a walkable place? The walkability debate in urban design. Urban Des. Int. 2015, 20, 274–292. [Google Scholar] [CrossRef]
  23. Loh, V.H.; Rachele, J.N.; Brown, W.J.; Ghani, F.; Washington, S.; Turrell, G. The potential for walkability to narrow neighbourhood socioeconomic inequalities in physical function: A case study of middle-aged to older adults in Brisbane, Australia. Health Place 2019, 56, 99–105. [Google Scholar] [CrossRef] [PubMed]
  24. Wan, Y.K.P. Understanding tourists’ perceived urban design qualities. J. Vacat. Mark. 2026, 32, 633–651. [Google Scholar]
  25. Ma, Y.; Tu, T.; Long, Y. Different perspectives are indispensable for public space quality: Exploring the relationship between urban design quality and physical disorder. Environ. Plan. B Urban Anal. City Sci. 2025, 52, 2153–2170. [Google Scholar] [CrossRef]
  26. Song, J.; Wei, H.; Wang, S. Impact of ground-floor façade functionality and permeability on pedestrian behaviour and social interactions: A mixed-methods study enhancing urban environmental quality. Urban Des. Int. 2026, 1–14. [Google Scholar] [CrossRef]
  27. Chen, L.; Lu, Y.; Sheng, Q.; Ye, Y.; Wang, R.; Liu, Y. Estimating pedestrian volume using Street View images: A large-scale validation test. Comput. Environ. Urban Syst. 2020, 81, 101481. [Google Scholar] [CrossRef]
  28. Azeez, S.A.; Mustafa, F.A.; Ahmed, R.M. A meta-analysis of evidence synthesis for a healthy campus built environment by adopting active design approaches to promote physical activity. Buildings 2023, 13, 1224. [Google Scholar] [CrossRef]
  29. Yang, H.; Zhang, Q.; Helbich, M.; Lu, Y.; He, D.; Ettema, D.; Chen, L. Examining non-linear associations between built environments around workplace and adults’ walking behaviour in Shanghai, China. Transp. Res. Part A Policy Pract. 2022, 155, 234–246. [Google Scholar] [CrossRef]
  30. Kamalo, M.A.; ElMokadem, A.A.; Elzeni, M.M.; Hussein, H.A.A. A Dual-Method Validation Framework for Assessing Urban Design Qualities (UDQs) in Public Spaces: A Case Study of Misr Plaza, Port Said. JES J. Eng. Sci. 2026, 54. [Google Scholar] [CrossRef]
  31. Rajina, R.V.; Naseer, M. Walking in a Sustainable Environment: Assessing Walkability to Public Transport in Calicut, India. In Emerging Agenda in Sustainable Infrastructure Development; Routledge: London, UK, 2026; pp. 200–217. [Google Scholar]
  32. Hamidi, S.; Moazzeni, S. Examining the relationship between urban design qualities and walking behavior: Empirical evidence from Dallas, TX. Sustainability 2019, 11, 2720. [Google Scholar] [CrossRef]
  33. Cambra, P.; Moura, F. How does walkability change relate to walking behavior change? Effects of a street improvement in pedestrian volumes and walking experience. J. Transp. Health 2020, 16, 100797. [Google Scholar] [CrossRef]
  34. Chen, Y.; Zhao, X. Research on the ground floor interface of the street from the perspective of pedestrians: Taking huaihai road in shanghai as an example. Urban Plan. 2014, 38, 24–31. [Google Scholar]
  35. Xu, L.; Kang, Q. The influence of space and interface characteristics of commercial streets on pedestrians’ staying activities: Taking Nanjing west road in shanghai as an example. Urban Plan. J. 2014, 104–111. [Google Scholar]
  36. Yu, H. A Study on the Staying of Pedestrian Space in Commercial Streets. Master’s Thesis, Tongji University, Shanghai, China, 2008. [Google Scholar]
  37. Cheng, S.; Xiang, Z.; Ban, P. Who Truly Benefits from Community Walkability? Social Differentiation of the Walking Environment in Kunming, China. Land 2026, 15, 283. [Google Scholar] [CrossRef]
  38. Yildirim, O.C.; Sungur, A.; Gulec Ozer, D. Understanding measurement of walkability in urban environments: A systematic review and research agenda. Int. J. Urban Sci. 2026, 30, 197–226. [Google Scholar]
  39. Cervero, R.; Kockelman, K. Travel demand and the 3Ds: Density, diversity, and design. Transp. Res. Part D Transp. Environ. 1997, 2, 199–219. [Google Scholar] [CrossRef]
  40. Wu, T.; Teng, J.; Chen, E. Built Environment Effects on Hub-Oriented Travel Demands under Accessibility-Demand Mismatch: An Empirical Study in Shanghai, China. J. Transp. Eng. Part A Syst. 2026, 152, 04025127. [Google Scholar] [CrossRef]
  41. Shateri Benam, A.; Furno, A.; El Faouzi, N.-E. Unraveling urban multi-modal travel patterns and anomalies: A data-driven approach. Urban Plan. Transp. Res. 2025, 13, 2481962. [Google Scholar] [CrossRef]
  42. Hino, K.; Usui, H.; Hanazato, M. Three-year longitudinal association between built environmental factors and decline in older adults’ step count: Gaining insights for age-friendly urban planning and design. Int. J. Environ. Res. Public Health 2020, 17, 4247. [Google Scholar] [CrossRef] [PubMed]
  43. Jeon, J.; Woo, A. Deep learning analysis of street panorama images to evaluate the streetscape walkability of neighborhoods for subsidized families in Seoul, Korea. Landsc. Urban Plan. 2023, 230, 104631. [Google Scholar] [CrossRef]
  44. Beijing Transport Research Center. Comprehensive Survey of Chinese Traffic: 2021 Beijing Transport Development Annual Report. 2021. Available online: https://www.bjtrc.org.cn/List/index/cid/7.html (accessed on 2 June 2026).
  45. Zhou, M.; Wei, H.; Bian, L. Research on the Evolution of Street Network Form in the Capital Core Area Based on the History of Syntactic Morphology. Urban Probl. 2021, 23–31. [Google Scholar] [CrossRef]
  46. Beijing Municipal People’s Government. Beijing Main Function Zone Planning, Document No. Jing Zheng Fa〔2012〕21. 2012. Available online: http://www.beijing.gov.cn/zhengce/zhengcefagui/202012/t20201203_2156201.html (accessed on 2 June 2026).
  47. Yao, Y.; Liang, Z.; Yuan, Z.; Liu, P.; Bie, Y.; Zhang, J.; Wang, R.; Wang, J.; Guan, Q. A human-machine adversarial scoring framework for urban perception assessment using street-view images. Int. J. Geogr. Inf. Sci. 2019, 33, 2363–2384. [Google Scholar]
  48. Beijing Municipal Commission of Planning and Natural Resources. Master Plan of Beijing (2016–2035). 2017. Available online: https://ghzrzyw.beijing.gov.cn/zhengwuxinxi/gzdt/sj/201912/t20191223_1421777.html (accessed on 2 June 2026).
  49. Liu, Y. Research on the Publicity Evaluation of Life Street Based on Spatial Justice—A Case Study of the Central District in Handan City. Master’s Thesis, Hebei University of Engineering, Handan, China, 2022. [Google Scholar]
  50. Ewing, R.; Clemente, O.; Neckerman, K.M.; Purciel-Hill, M.; Quinn, J.W.; Rundle, A. Measuring Urban Design: Metrics for Livable Places; Springer: Berlin/Heidelberg, Germany, 2013. [Google Scholar]
  51. Ameli, S.H.; Hamidi, S.; Garfinkel-Castro, A.; Ewing, R. Do better urban design qualities lead to more walking in Salt Lake City, Utah? J. Urban Des. 2015, 20, 393–410. [Google Scholar] [CrossRef]
  52. Li, A.; Tan, Y.; Zhang, W.; Wang, K.; Qu, X. An Integrated Framework of Routing and Rebalancing for RoboTaxi Systems. Transp. Res. C Emerg. Technol. 2026, 183, 105415. [Google Scholar] [CrossRef]
  53. Tan, Y.; Qian, S.; Li, A.; Yu, H.; Gao, J. Efficient and Stable Ride-Pooling through a Multi-Level Coalition Formation Game. Commun. Transp. Res. 2025, 5, 100220. [Google Scholar] [CrossRef]
Figure 1. Location and public space skeleton of the CCA:Yellow areas represent the scope of Beijing’s old urban district; green dashed lines denote main arterial roads; red axes stand for the public living ring of the city.
Sustainability 18 06977 g001
Figure 2. Study area:The left panel shows the location distribution of the four survey areas, and the right panel presents typical street view photos of these surveyed zones.
Sustainability 18 06977 g002
Figure 3. Activity identify result.
Sustainability 18 06977 g003
Figure 4. Classification confusion matrix.
Sustainability 18 06977 g004
Figure 5. Technology workflow of the study.
Sustainability 18 06977 g005
Figure 6. Structural equation modelling.
Sustainability 18 06977 g006
Figure 7. D variables in CCA:Darker colors correspond to higher numerical values.
Sustainability 18 06977 g007
Figure 8. Frequency distribution histogram of 20 physical features.
Sustainability 18 06977 g008
Figure 9. Spatial distribution of pedestrian volume: (a) Spatial distribution of pedestrian volume in Xisi-Xinjiekou area; (b) Spatial distribution of pedestrian volume in Dongsi area; (c) Spatial distribution of pedestrian volume in Caishikou area; (d) Spatial distribution of pedestrian volume in Ciqikou area. The thickness represents the number of people on the street. The thicker the line, the more people on the street.
Sustainability 18 06977 g009
Figure 10. Factor loading plot of walking activities.
Sustainability 18 06977 g010
Figure 11. Spatial distribution of walking activities: (a) Spatial distribution of walking activities in Xisi-Xinjiekou area; (b) Spatial distribution of walking activities in Dongsi area; (c) Spatial distribution of walking activities in Caishikou area; (d) Spatial distribution of walking activities in Ciqikou area.
Sustainability 18 06977 g011
Table 1. Classification of activities.
ActivityClassificationRecognized Gesture
Traffic passing byWalkingWalking
Waiting for busStanding/sitting
Cycling on sidewalkCycling
Commercially activityCommercial watchingWalking
Commercial standingStanding
Leisurely activityLeisure watchingWalking
Leisure standingStanding
SittingSitting
Social intercourseChatting
EatingEating
Other activitiesWalking the dog, walking a stroller, running
Table 2. The number of distinct objects in the training set and test set.
Activity TypesTraining SetTest Set
Walking1468641
Standing517202
Sitting231100
Social15750
Eating12343
Walking the dog12845
Walking the stroller11634
Others23699
Table 3. Pedestrian behaviour variables.
TypesVariablesDefinition
Activity quantityLine density of pedestrian volumeThe number of all pedestrians per unit length in each street, including walking, standing, sitting and other activities.
Activity qualityNumber of activity typesThe number of categories of activity within each street.
Diversity of activitiesSimpson’s index for activity categories within each street.
The proportion of stationary activityThe proportion of stationary activities to the total number of pedestrians in each street.
The proportion of lingering activityThe proportion of lingering activities to the total number of pedestrians in each street.
The proportion of leisurely stationary activityThe proportion of leisurely stationary activities to the total number of pedestrians in each street.
The proportion of commercially stationary activityThe proportion of commercially stationary activities to the total number of pedestrians in each street.
The proportion of social activityThe proportion of social activities to the total number of pedestrians in each street.
Table 5. SEM path calculation result.
PathRelationshipT Valuep ValueCoefficientR2Decision
H1Imageability → Activity quantity1.5130.130−0.0710.387No
H2Enclosure → Activity quantity0.6420.521−0.036No
H3Transparency → Activity quantity2.2840.0220.200 *Yes
H4Complexity → Activity quantity0.9840.3250.052No
H5Human scale → Activity quantity2.5440.0110.253 *Yes
H6Public space quality → Activity quantity3.1230.0020.198 **Yes
H7Imageability → Activity quality3.3670.0010.135 ***0.649Yes
H8Enclosure → Activity quality2.2930.0220.093 *Yes
H9Transparency → Activity quality0.5980.550.045 No
H10Complexity → Activity quality0.5590.5770.022 No
H11Human scale → Activity quality2.8430.0040.243 ** Yes
H12Public space quality → Activity quality2.820.0050.154 ** Yes
When T > 1.96, p < 0.05 means the path is significant: * p < 0.05, ** p < 0.01, *** p < 0.001, indicating statistical significance at the 5%, 1%, and 0.1% levels, respectively.
Table 6. SEM mediating effect evaluation coefficient.
Independent VariableMediatorDependent VariableDirect EffectIndirect EffectGeneral EffectVAFDecision
ImageabilityActivity quantityActivity quality0.147
(3.768)
−0.035
(1.491)
0.112−0.313No
Enclosure0.100
(2.458)
−0.018
(0.701)
0.082−0.220No
Transparency0.002
(0.274)
0.102
(2.470)
0.1040.981Yes
Complexity0.025
(0.538)
0.025
(0.966)
0.0500.500No
Human scale0.222
(2.625)
0.121
(2.531)
0.3430.353Yes
Public space quality0.149
(2.806)
0.098
(3.080)
0.2470.397Yes
When T > 1.96, the mediating effect is significant and VAF indicates the magnitude of the mediating effect. When VAF < 0.2, there is no mediation effect. When 0.2 < VAF < 0.8, this indicates a partial mediation effect. When VAF > 0.8, this indicates a complete mediation effect.
Table 7. Structural equation model mediating effect evaluation coefficient.
Line Density of Pedestrian VolumeNumber of Activity
Types
Diversity of
Activities
Proportion
of Stationary Activity
Proportion of Lingering ActivityProportion of Leisurely Stationary
Activity
Proportion of
Commercially Stationary
Activity
Proportion of Social
Activity
Proportion of green space---0.259 **0.022−0.152 **−0.018−0.180 **0.015−0.144 **
Number of historical sites---0.196 **0.187 **0.0570.0550.0340.038−0.032
Interface density---0.106 *0.243 **0.259 **0.184 **0.233 **0.0930.151 **
The proportion of floor-to-ceiling windows0.076---------------------
Active frontage0.463 **---------------------
The windows on the ground floor0.299 **0.579 **0.357 **0.0200.179 **0.1060.215 **−0.116 *
Store density0.211 **0.599 **0.335 **0.0080.126 **−0.147 **0.302 **−0.164 *
Street furniture0.162 **0.431 **0.238 **0.0000.112 *−0.0870.094−0.089
Walkway width0.180 *0.239 **0.214 **0.0800.131 **0.0410.0510.050
Pavement quality0.0820.263 **0.082−0.108 *−0.003−0.172 **0.083−0.140 **
Public seat−0.0160.275 **0.109 *−0.0300.073−0.0880.036−0.049
Crossing length−0.304 *0.392 **−0.0910.156 **0.0150.209 **0.0590.178 **
Shading rate0.170 *0.343 **0.2040.0630.131 *−0.103 *0.055−0.122 *
Greenery view−0.0330.333 **0.221 **−0.0350.138 *−0.0920.109 *−0.102
* p < 0.05, ** p < 0.01, indicating statistical significance at the 5%, and 1% levels, respectively.
Disclaimer/Publisher’s Note: The statements, opinions and data contained in all publications are solely those of the individual author(s) and contributor(s) and not of MDPI and/or the editor(s). MDPI and/or the editor(s) disclaim responsibility for any injury to people or property resulting from any ideas, methods, instructions or products referred to in the content.