Article

Impacts of Changing Beach and Dune Configurations on Communities: A Case Study of the Atlantic Coast of East Central Florida

by
Samantha Houser
1,
Hyun Jung Cho
1,*,
Kelly M. San Antonio
1 and
Siddharth S. Parida
2
1
Department of Integrated Environmental Science, Bethune-Cookman University, 640 Dr. Mary McLeod Bethune Blvd, Daytona Beach, FL 32114, USA
2
Department of Civil Engineering, Embry-Riddle Aeronautical University, 1 Aerospace Boulevard, Daytona Beach, FL 32114, USA
*
Author to whom correspondence should be addressed.
Sustainability 2026, 18(13), 6891; https://doi.org/10.3390/su18136891
Submission received: 31 May 2026 / Revised: 26 June 2026 / Accepted: 1 July 2026 / Published: 7 July 2026

Abstract

Barrier islands along Florida’s Atlantic coast are increasingly threatened by sea-level rise, intensified hurricanes, shoreline armoring, and rapid coastal development. This study examined how beach and dune configurations varied in relation to coastal elevation patterns, NDVI-based surface greenness, and stakeholder perceptions across the East Central Florida Atlantic coast. Light Detection and Ranging (LiDAR) elevation datasets (2016, 2022, 2024), National Agriculture Imagery Program (NAIP)-derived Normalized Difference Vegetation Index (NDVI) analyses (2015, 2019, 2023), and stakeholder survey data from two coastal resilience workshops conducted in Volusia County in November 2024 were assessed to evaluate geomorphic change, vegetation-greenness patterns, and public perceptions of shoreline management strategies. Results showed descriptive differences among shoreline-type groups. Seawall-backed sites experienced the greatest net elevation loss (−0.529 m averaged over two sites) and a small negative mean transect-level NDVI change (−0.034) between 2015 and 2023, while natural dune sites showed an overall elevation gain (0.255 m averaged over three sites), despite some site-level loss after the 2022 hurricanes, and no net mean transect-level NDVI change (0.000) over the same NDVI period. Because the LiDAR and NDVI datasets are not temporally matched, these patterns are interpreted as complementary rather than causal lines of evidence. Stakeholder survey responses demonstrated that most respondents recognized the importance of dunes and coastal vegetation for resilience, but also expressed concerns about effectiveness, long-term maintenance, and cost of natural or hybrid solutions. Overall, the findings suggest that natural and minimally armored shorelines may retain greater capacity for elevation and vegetation-greenness recovery than hardened coastal systems, while also emphasizing the need for adaptive, conservation-based coastal management strategies that account for both physical shoreline conditions and stakeholder concerns.

1. Introduction

Barrier islands are dynamic coastal landforms, constantly changing from shifts in wind, rain patterns and sea level fluctuations, resulting in vertical and horizontal sand movement [1]. They form parallel to shorelines and play a critical role in buffering mainland communities and wildlife from storm surges, flooding, and erosion [2,3]. These islands not only provide physical protection but also support diverse ecosystems such as estuaries, salt marshes, and wetlands that sustain numerous species and overall biodiversity. Since they are shaped by wave energy, sediment supply, and human modification, their stability is highly sensitive to climate-driven disturbances. Barrier islands provide storm and flood protection, contribute to local economies and fisheries, and filter water, which improves water quality for surrounding human populations [3,4].
Barrier islands sustain important coastal ecosystems such as estuaries, salt marshes, and other wetlands/uplands that contain many endemic species [3]. These species rely on plant and dune formations. In barrier island systems, dune plant growth and sand accretion result in dune formation, land stabilization, and a reduction in wave energy/erosion [4]. Dune plants are able to modify the physical environment by trapping moving sediment and overall enhancing the topography of the barrier island landscape [4].
However, over time, geomorphic thresholds (referring to the point at which a landform undergoes significant or abrupt change due to stress exceeding resistance) can be crossed [3]. This can occur from natural changes, increasing infrastructure being built on coastlines, and population migration. Seventy-four percent of barrier islands are found in the Northern Hemisphere [5]. In terms of total length of barrier island shorelines, the United States has approximately 24% of all barrier islands, with 405 islands [5]. Florida alone is home to 80 barrier islands, hosting and supporting large resident and tourist populations [6]. Each of these barrier islands consists of features that include a sandy beach facing the ocean or Gulf, dunes, barrier flats, marshes, and lagoons. Understanding their formation, status, and the environmental factors affecting them is vital for coastal resilience planning.
Florida has one of the fastest-growing coastal populations in the United States, and barrier islands have become focal points of this expansion. For reference, Florida has seen an increase from 16 million people to over 23 million from 2000 to 2024 [7]. Much of this growth has been concentrated in coastal counties, with barrier islands seeing an increase in residential, tourism, and infrastructure development as migration towards the coast has intensified. This influx of population places people and infrastructure at a higher risk of coastal hazards, such as tropical storms and flooding, while also altering the natural processes that maintain islands. Hardened structures on coastlines prevent sediment transport, reduce dune mobility, and constrain the natural capacity of islands to migrate landward, increasing community exposure and ecological degradation [8].
Global climate change has intensified the pressures on barrier islands and associated ecosystems. This includes rising sea levels, more frequent high-intensity hurricanes, stronger storm surges, and heavier rainfall, which accelerate erosion, saltwater intrusion, and habitat loss [2,9]. These changes not only disrupt natural processes like sediment transport and nutrient cycling but also increase risks to human communities through property loss, population displacement, and economic damage, as highlighted by recent hurricanes, such as Ian and Nicole in 2022 and Milton in 2024 [10].
In response to these natural disasters and rising sea levels, coastal communities employ both soft stabilization measures (e.g., beach and dune renourishment) and hard infrastructure (groins, jetties, seawalls). While strategies such as seawalls protect human property, they often accelerate beach narrowing or ‘coastal squeeze,’ impacting natural habitats and long-term resilience [11]. The tradeoff of degradation to coastlines for protection presents the need for management approaches that balance community protection with ecosystem preservation. Due to the degradation of coastlines and intensified natural disasters, many coastal communities such as those along East Florida’s coast are losing their beaches.
Once these hard structures are installed, an unnatural barrier to the natural movement of sediment on the beach is created [12]. Sediment that would typically be available in the littoral zone is impounded by hard structures like seawalls, revetments, and sandbags, because wave energy is deflected, which leads to a trend of erosion in the littoral zone. In turn, these effects are exacerbated by storms through elevated water levels and energetic wave conditions, leading to beach narrowing in front of fixed structures [11]. Therefore, shoreline armoring can have negative ecological consequences by altering nutrient cycles, reducing productivity, and shifting species assemblages [13].
Vegetation-based dune restoration shows promising results as a resilience strategy. Sigren et al. [14] found that rooted dune vegetation reduced erosion volume by over 30% and increased dune stability by 180%. Nature-based solutions like these enhance both storm protection and habitat availability, but their implementation requires balancing community priorities and conservation goals. Living shorelines are built to accommodate natural coastal processes in the area by using native plants, shellfish, or other naturally occurring elements. Studies in New England and the mid-Atlantic regions of the US also found that properties with living shorelines or natural shorelines had less damage compared to hardened shorelines, and homeowners spent less money on shoreline installation and maintenance [13].
In a study performed in Florida by Barry et al. [13], an address-based survey of waterfront property owners was conducted to explore their satisfaction with their current shoreline and driving factors behind how they manage and protect their shoreline. They found that the most important factor driving shoreline management decisions was perceived effectiveness [13]. There was a clear perception that natural and living shorelines are not as effective at preventing erosion as armored solutions. This common misconception of hardened shorelines protecting more successfully is found across other studies [15,16]. Armored shorelines had the highest protection score assigned by homeowners (4/5) compared to the other types of shorelines assessed (natural, hybrid, and living shoreline), which suggests that there may be a general lack of understanding about the structural and cost effectiveness of nature-based shorelines [13]. Although the authors did not test effectiveness of seawall protection against natural disasters in the study, it is stated in other literature that shoreline armoring can reduce the resilience of human communities to coastal hazards [8,17].
Previously documented work in San Antonio et al. [18] shows that natural sand dunes were more resilient than armored dunes. San Antonio et al. [18] evaluated vegetation and elevation in their study at multiple sites, highlighting that natural locations experienced less impact to vegetation and elevation and higher resiliency. Further expanding on San Antonio et al.’s [18] work, this study uses different methods to analyze elevation and vegetation data, includes more locations, and contains a human dimension that was not focused on in the previous work.
Although previous work in East Central Florida has compared natural and armored dunes after recent hurricanes, fewer studies have combined multi-year LiDAR elevation analysis, NAIP-derived NDVI analysis, and stakeholder perception data across the broader Volusia–Flagler–St. Johns barrier island corridor. This study therefore evaluates: (1) how elevation patterns varied among seawall, combination, and natural shoreline settings; (2) how NDVI-based surface greenness changed across the available NAIP years; and (3) how Volusia County stakeholders perceive nature-based and hybrid shoreline-management options. Because the site numbers are small and the LiDAR and NDVI years are not matched, the study is framed as an exploratory integrated case study rather than a formal hypothesis-testing comparison.

2. Materials and Methods

This study analyzes multi-sensor remote sensing datasets and workshop/survey data to assess changes in dune height and vegetation, as well as stakeholder perspectives from Volusia County residents for nature-based solutions.

2.1. Study Area

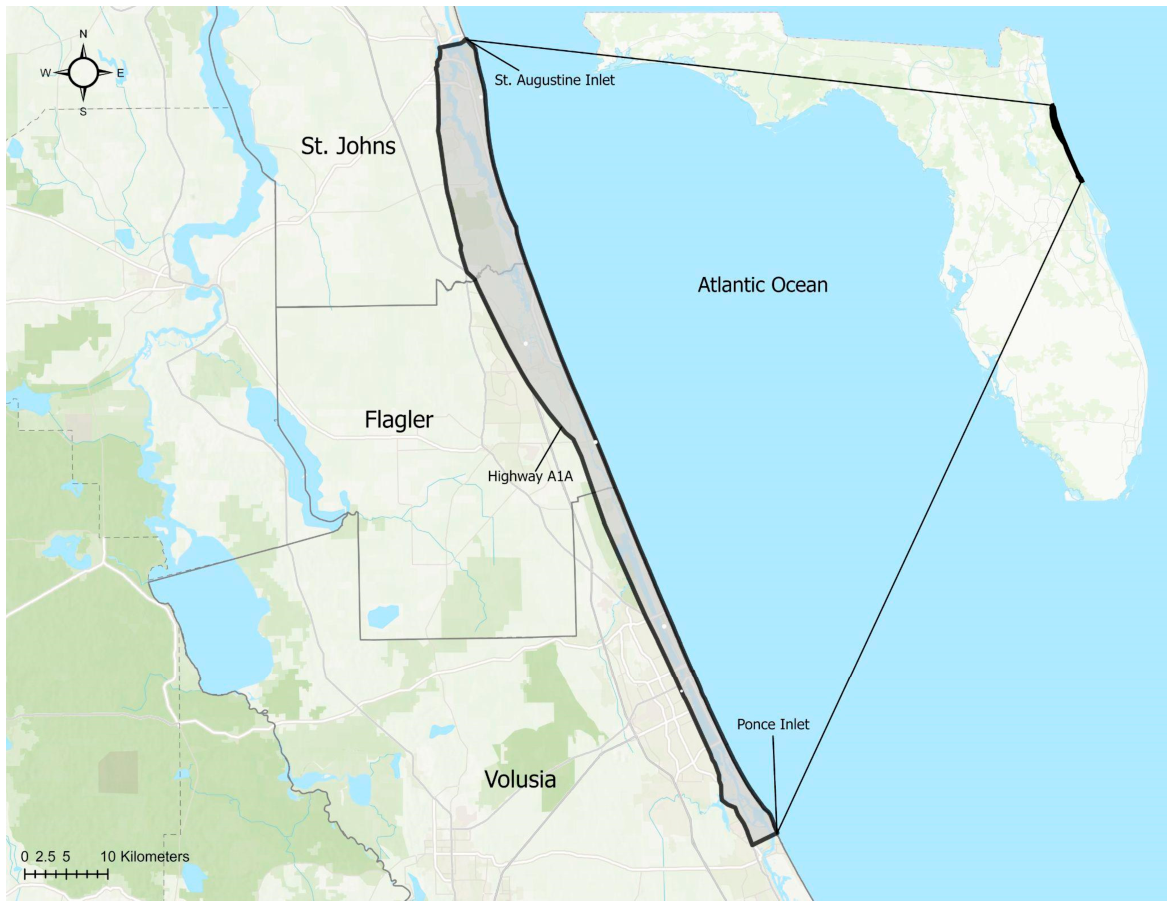
The spatial boundary for this research encompasses both the nearshore coastal beaches and continuous barrier island system of Volusia, Flagler, and St. Johns counties, Florida (Figure 1). The study area occupies the central portion of Florida, with the Atlantic Ocean to the east and mainland to the west of Highway A1A (Figure 1). The study location shown in Figure 1 extends along the Atlantic coastline from Ponce Inlet in Volusia County to St. Augustine Inlet in St. Johns County, representing approximately 80 km of the coastline. The extent of the research was chosen to integrate shoreline changes and assess different types of shorelines. The Atlantic Coast is considered a high-energy environment, characterized by strong ocean currents, persistent winds, and powerful waves [19]. Specifically, the region is characterized by dynamic dune morphology, dense coastal development, and various state and local parks.

2.2. Changes in Beach Configuration Using Satellite and LiDAR Data

The study’s timeframe, 2015–2024, was chosen to depict changes over the past decade and captures impacts from the strong hurricanes in 2016 (Hurricane Matthew, 8 October 2016), 2022 (hurricanes Ian and Nicole, 28 September 2022 and 10 November 2022, respectively), and 2024 (Hurricane Milton, 9 October 2024) that impacted the study area in the past decade. The LiDAR data obtained from the National Oceanic & Atmospheric Administration (NOAA) Digital Coast (https://coast.noaa.gov/digitalcoast/data/home.html, accessed on 10 March 2025) were collected immediately after these hurricanes in 2016, 2022 (post Hurricane Nicole), and 2024 (post Hurricane Milton). Since LiDAR data collection by NOAA Digital Coast are collected based on project needs, often as a response to natural disasters, 2016, 2022, and 2024 were the years analyzed within the study’s decadal timeframe.
The 2016 LiDAR data (collected between the dates of 19 May and 20 July) were collected as part of the National Coastal Mapping Program (NCMP) to depict the elevations above and below the water in the Florida coastal zone (2016 Topobathy LiDAR, accessed on 10 January 2025; Table 1). The 2022 and 2024 LiDAR data were collected in support of the Federal Emergency Management Agency to assess changes in elevation above and below the water along the coast of Florida post-hurricane; 2022 data (collected between the dates of 21 November and 29 November) were collected post Hurricane Nicole, and 2024 data (collected between the dates of 25 October and 17 November) were collected post Hurricane Milton (2022 Topobathy LiDAR, https://www.fisheries.noaa.gov/inport/item/71753 (accessed on 10 January 2025), and 2024 Topobathy LiDAR, https://www.fisheries.noaa.gov/inport/item/73831 (accessed on 10 January 2025), Table 1). Because data from these years were collected in response to storms, this can introduce temporary vertical errors beyond the normal error ranges, due to weather conditions [20]. All the survey operations were collected by the U.S. Army Corps of Engineers using the Coastal Zone Mapping and Imaging LiDAR (CZMIL) system, which is a sensor development effort within the National Coastal Mapping Program (NCMP) that produces high-quality, high-resolution information products. All three years of LiDAR data were horizontally referenced to the UTM Zone 17N NAD83 (2011), coming in one-meter resolution, and vertically referenced to the North American Vertical Datum of 1988 (NAVD88) (Table 1). The 2016 data came in ±9.5 cm vertical accuracy, and the 2022 and 2024 data came in ±20 cm vertical accuracy. This means that any value that is at or near zero should be treated as negligible or within measurement uncertainty.
The National Agricultural Imagery Program (NAIP) data, which were obtained from the United States Geological Survey EarthExplorer (https://earthexplorer.usgs.gov/, accessed on 10 December 2025), are administered by the U.S. Department of Agriculture (USDA)’s Farm Production & Conservation Business Center (FPAC-BC) Geospatial Enterprise Operations (GEO). NAIP data come in four-band spectral resolution, containing red (band 1), green (band 2), blue (band 3), and near infrared (band 4) (Four Band Digital Imagery, accessed on 11 January 2026). The data collected by the USDA are based on agricultural and programmatic needs, with data collection flights carried out on a rotating schedule and updated for most states every two to three years (USGS EROS NAIP, accessed on 12 January 2026). The NAIP data used for the research were collected on 12 November 2015 (one-meter resolution), 29 November 2019 (0.60 m resolution) and 17 January 2023 (0.30 m resolution) (Table 1). All three years analyzed were horizontally referenced to match the LiDAR data, UTM Zone 17N NAD83 (2011), and vertically referenced to the North American Vertical Datum of 1988 (NAVD88).
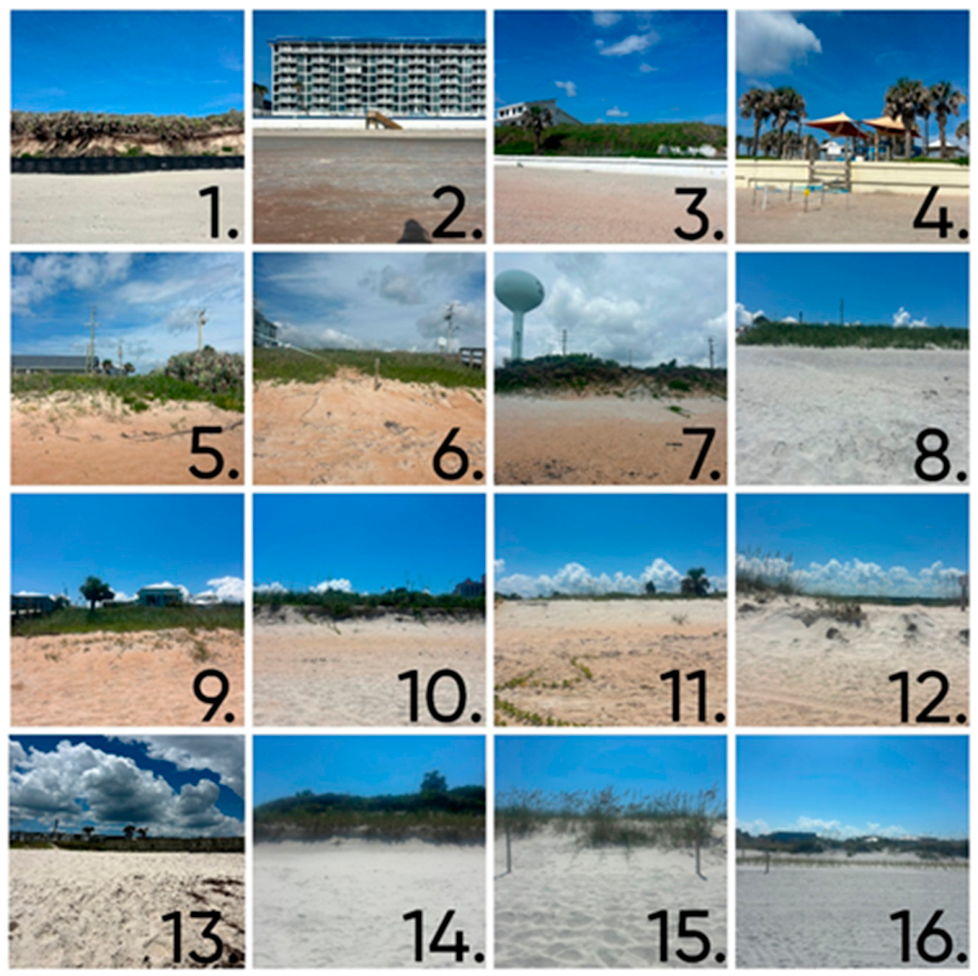
To evaluate dune configuration and changes in elevation profiles, transect locations were chosen to analyze different shoreline types (seawall, natural dunes, combination and construction zones). Transect locations were chosen based on accessibility, different shoreline types, and the amount of infrastructure on the barrier island. Due to limitations with accessibility, 16 total transect locations were chosen to cover the study area. After sixteen locations were chosen (six for Volusia, seven for Flagler, three for St. Johns counties), the shoreline type and a site description were recorded at each location, and pictures were taken from each cardinal direction (pictures facing west are shown in Figure 2), with GPS coordinates exported to ArcGIS Pro 3.3.1 (Environmental Systems Research Institute, 2025) (Table 1).
Of the sixteen transect locations collected, six were located in Volusia County, seven in Flagler County, and three in St. Johns County (Figure 2). All transect locations were within the study boundary’s extent from Ponce Inlet to St. Augustine Inlet (Figure 1). Table 1 includes short descriptions of each location starting from the southernmost end of the boundary at Ponce Inlet to the northernmost end at St. Augustine Inlet.
The 2016, 2022, and 2024 LiDAR data were analyzed at the sixteen transect locations. For each site (Table 2), five line transects were drawn perpendicular to the shoreline in ArcGIS Pro, following the general approach used by San Antonio et al. [18]. The five transects per site were placed 15 m apart because beach-access width and site geometry were limited at many locations; this spacing was intended to capture within-site profile variability, not to establish statistically independent replicate sites. Table 2 indicates the transect lengths (m) for each site. Transect lengths differed based on the cross-shore distance between Highway A1A and the mapped waterline/reference layer, and each transect extended from the east edge of Highway A1A to the start of the waterline in the imagery hybrid reference layer provided in ArcGIS Pro. This vector tile layer provides a world reference overlay with labels, boundaries, and roads, collected by a variety of third-party commercial providers and government agencies, and published by Esri Inc. Because infrastructure occurs between the beach and Highway A1A at some locations, some transects include higher proportions of non-beach surface than others. Therefore, cross-shore domain selection and waterline position are treated as methodological limitations when interpreting mean elevation change.
The sixteen transect locations were also used to assess changes in Normalized Difference Vegetation Index (NDVI), which were calculated from the NAIP data (Equation (1)). The four-band NAIP data were downloaded and uploaded to ArcGIS Pro for analysis. The NDVI (Equation (1)) was calculated for each year. The NDVI indirectly measures vegetation chlorophyll contents and leaf structural health by analyzing the difference between red and near-infrared light reflected from plants:
N D V I = R e f l e c t a n c e N e a r   I n f r a r e d R e f l e c t a n c e R e d R e f l e c t a n c e N e a r   I n f r a r e d + R e f l e c t a n c e R e d
This formula produces a value between −1 and +1, with higher numbers generally indicating healthier or denser vegetation, while values near zero or negative may indicate bare soil, sand, rocks, water, wet sand, shade, or specular reflectance from hard infrastructure. With this in mind, positive NDVI values are interpreted as a proxy for surface greenness rather than as a definitive measure of dune vegetation composition or stability.

2.3. LiDAR and Satellite Imagery Data Analysis

After creating the transect lines for each location, points spaced one meter apart were generated along each line to extract elevation values from the LiDAR data and NDVI values from the NAIP data. The elevation data at the points were exported into Microsoft Excel spreadsheets. Beach profiles were visually compared by site to evaluate cross-shore profile shape, dune-crest position, foreshore lowering or accretion, and whether changes were consistent across the five transects at each site. These qualitative profile comparisons were used together with mean elevation, standard deviation, and mean change summaries, rather than as a substitute for quantitative reporting.
The same transect lines at each site used with the elevation data were also used for the NDVI analysis. The NDVI data collected and used for this analysis were from the years 2015, 2019, and 2023, which were calculated from the NAIP imagery. The process and analyses described in the paragraph above were also completed with the NDVI data. NDVI values should be interpreted cautiously, as the index measures relative surface ‘greenness’ and photosynthetic activity rather than vegetation presence. While NDVI values above 0 generally correspond to greater vegetation cover, this does not distinguish between plant species or non-vegetated surfaces. Moreover, the NDVI data used for this research from 2015, 2019, and 2023, were all taken in the late fall—wintertime based on the USDA’s agricultural and programmatic needs (November, November, and January, respectively), where vegetation coverage changes are fewer due to seasonality. Consequently, the NDVI should be interpreted as a spectral proxy for surface greenness and not as a definitive measure of dune vegetation composition, density, or stability.
To evaluate how various shoreline types impact beach/dune morphology and vegetation dynamics, transects were categorized into three shoreline types: seawall, combination (areas containing both hardened shoreline structures and natural dune features), and natural shorelines. A subset of transects representing each shoreline type was selected for detailed analysis to ensure that the transects clearly reflected the dominant shoreline condition at each site and allowed for consistent comparisons across shoreline management types. In total, two transect locations were selected within seawall-dominated areas (only two in total for this study based on accessibility within the study’s boundary), three transect locations within combination shoreline areas, and three transect locations within natural shoreline areas.
Because the number of independent transect locations within each shoreline category was small (two seawall locations, three combination locations, and three natural locations for the shoreline-type summaries) and because points and transects are spatially nested within sites, the shoreline-type comparisons are presented as descriptive summaries rather than formal inferential tests. Point-level data were used to construct within-site profiles; transect-level and site-level summaries were used to describe patterns. We therefore report mean values, standard deviations, ranges, and net changes by site and shoreline type, while avoiding causal or population-level claims that would require a larger, fully replicated sampling design.

2.4. Stakeholder Meeting Surveys

Two stakeholder workshops were conducted to assess community perceptions related to coastal resilience and sustainable management of the beachfront infrastructure in Volusia County. The first workshop was conducted on 13 November 2024 at Brannon Center in New Smyrna Beach (105 S Riverside Dr, New Smyrna Beach, FL 32168), Florida, and the second workshop was conducted on 25 November 2024 at Ponce Inlet Community Center (4670 S Peninsula Dr, Ponce Inlet, FL 32127) in Ponce Inlet, Florida.
The workshops were conducted to identify properties for pilot implementation and monitoring as part of a National Science Foundation (NSF)-funded research project titled ‘CIVIC-PG Track A: Co-designing toward Coastal Resilience: a Hybrid Approach for restoring Hurricane and Climate Change-prone Seawall and Dune’ (NSF Abstract, 2024; NSF Award #2431268). The workshop goals, targeting Volusia County’s coastal residents and natural resource users, were to engage with diverse stakeholders to discuss the future of the local coastlines, co-design nature-based solutions for shoreline protection, and adopt designs that align with federal, state, and local regulation.
Before the workshops could be conducted, the research project had to be reviewed by the Institutional Review Board (IRB) at Embry-Riddle Aeronautical University (the lead institution for the NSF project) to ensure that ethical practices were to be conducted with human subjects (IRB ERAU, 2024). Since the involvement of human subjects was minimal, the project was exempt. Social and behavioral research training through the Collaborative Institution Training Initiative (CITI) program was completed by all the members working on the project to provide professional development training, compliance, and research ethics.
Each workshop lasted approximately three hours, consisting of presentations, discussions and feedback, and optional surveys that stakeholders could participate in. The surveys consisted of seven subsections: description of the stakeholder role (community member, government organization), stakeholder perspective and knowledge, perception of living seawalls, impact on property and community, ecological and environmental concerns, regulations, policies and permitting, and community engagement and support. The questions were formatted as multiple choice with four options or short answers.

2.5. Stakeholder Perspective Data Analysis

The workshop survey consisted of 34 multiple-choice and short-answer questions that took respondents 10–15 min to complete. Five of the questions were yes or no responses and six were written responses. The remaining 22 questions were multiple choice with four answers, with six of the questions allowing for the option to select more than one answer.
The responses were all voluntary and remained anonymous unless participants were interested in further participation in the study. The survey responses were collected from a Qualtrics survey that participants accessed by scanning a QR code. Stakeholder survey responses were then converted to Excel and reviewed for completeness prior to analysis. Questions that were left unanswered were kept and categorized as ‘no response.’ For each survey question, responses were summarized using frequency counts to document the number of participants selecting each response option. These raw counts were then used to generate table summaries to answer the following questions:
  • What is the general demographic of community members participating in the workshops?
  • What are stakeholders’ perceptions of nature-based solutions?
  • What are the ecological and environmental concerns of the stakeholders?
The survey results were from only Volusia County residents because the targeted project area for the NSF-funded workshops was within that county. Among the three counties (Figure 1) in this study, Volusia County has the most developed shorelines, with highly sought-after public beaches and high-rise beachfront buildings. Therefore, the survey results cannot be assumed to represent all three counties in the study or other coastal community perspectives.

3. Results

3.1. Elevation Changes

LiDAR analysis revealed spatial and temporal patterns of beach and dune elevation change across the decadal period, with pronounced erosion from major storm seasons. Using the LiDAR-derived elevation data, the 2022 shorelines appeared to be retreated compared to the 2016 shorelines. The extent of change varied depending on shoreline armoring and dune width.
Mean elevation change differed noticeably among shoreline types across all time intervals, with the greatest elevation loss at seawall sites, intermediate loss at combination sites, and net accretion at the selected natural sites (Table 3). From 2016 to 2022, seawall-backed transects experienced the greatest mean elevation loss (−0.536 m), followed by combination transects (−0.415 m), while natural transects showed a mean elevation gain (0.162 m) (Table 3). Between 2022 and 2024, elevation change was minimal at seawall sites (0.007 m), whereas combination and natural transects showed mean gains of 0.113 m and 0.093 m, respectively. The 0.007 m and 0.093 m changes are within or near the stated LiDAR vertical uncertainty and should therefore be interpreted cautiously. Across the eight-year period (2016–2024), seawall transects demonstrated a net elevation loss of −0.529 m and combination transects lost −0.302 m overall. In contrast, the selected natural transects showed a cumulative mean elevation gain of 0.255 m over the same period (Table 3 and Table 4).
Each group of five transects for all the beach profiles was used to compare beach profiles across the three years (2016, 2022, 2024). Starting with the natural locations, Al Weeks Park (#5) exhibited the highest elevation difference at one location along the beach profile, with 1.57 m of erosion between 2016 and 2024. Capistrano Drive (#6) showed the highest erosion, at 1.56 m, between 2016 and 2022. For Gamble Rogers (#7), the highest elevation loss was 1.32 m. A1A Oceanshore (#8) showed an elevation gain between 2022 and 2024, with the highest gain being 3.1 m. At North 13th and Oceanshore (#9), the highest elevation loss was between 2016 and 2022, at 0.58 m. Old Salt Park (#10) showed a great amount of retreat and had the highest elevation loss between 2016 and 2024, at 1.92 m. Mala Compra Park (#11) retreated back but also gained a maximum of 1.92 m between 2016 and 2024. The primary dunes at Washington Oaks Park (#12) retreated back as well, but gained a maximum of 2.36 m between 2016 and 2024. Fort Matanzas (#14) lost 4.4 m near the primary dune structure from 2016 to 2022. Crescent Beach (#15) lost a maximum of 3.2 m in elevation between 2016 and 2022, and D Lane (#16) remained relatively stable across the three years analyzed.
At the (seawall/dune) combination locations, Ponce Preserve Walkway exhibited the highest elevation difference at one location along the beach profile, with 3.22 m of erosion between 2016 and 2022. Williams Avenue (#3) had the greatest loss, at 1.42 m, between 2016 and 2022. Between 2016 and 2022, Marineland Beach (#13) lost a maximum of 2.08 m. At the two seawall locations, Sunglow Fishing Pier (#2) showed the highest erosion between 2016 and 2022 at 1.45 m, and Riptides (#4) at 0.98 m between 2016 and 2022.
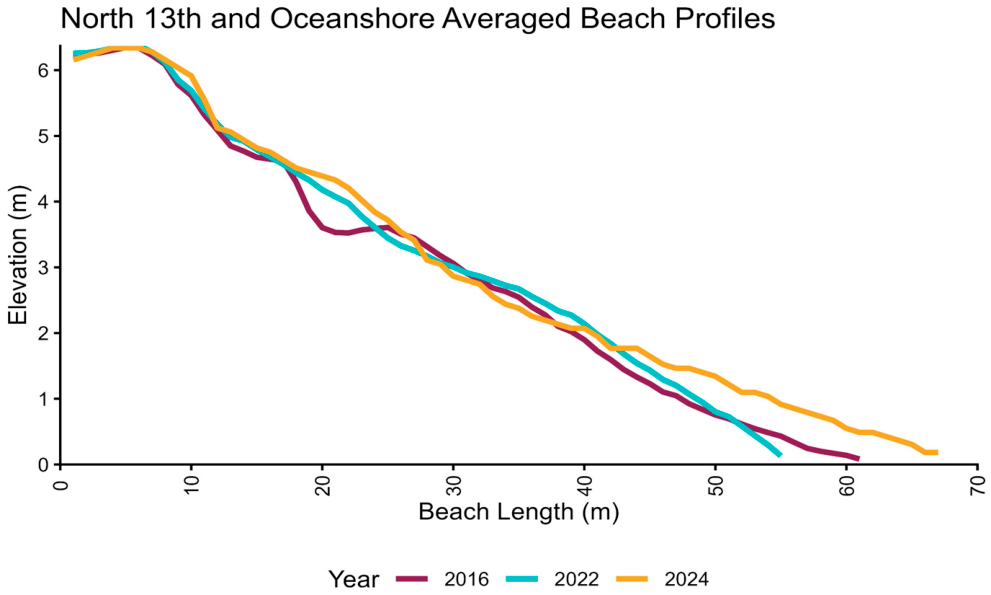
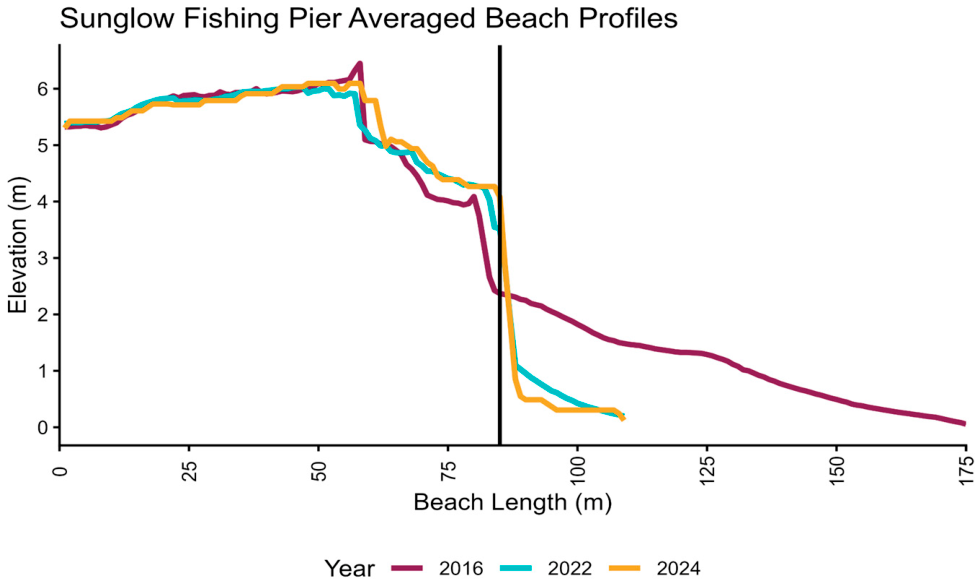
All the transect locations were analyzed to visualize the changes between 2016, 2022 and 2024. The two figures that follow (Figure 3 and Figure 4) show two contrasted beach profile elevations (natural vs. seawall) and are visualized here because they are fairly representative of each shoreline type. The North 13th and Oceanshore site is a representation of a relatively natural and stable beach profile over time (Figure 3). While there are some minor fluctuations in elevation, particularly in the mid- to lower part of the beach, there are no major losses or extreme changes across the profile. Figure 4 shows the averaged beach profiles at the Sunglow Fishing Pier site, which represents a seawall-backed shoreline. Notably, there is about a 1.5 m elevation difference between the earlier profile and the more recent profiles (Figure 4).

3.2. Vegetation Changes

Normalized Difference Vegetation Index (NDVI) values were calculated for 16 beach and dune transects across Volusia, Flagler, and St. Johns counties for the years 2015, 2019, and 2023. Mean NDVI values, standard deviations, and interannual changes were used to quantify spatial and temporal patterns in vegetation cover across shoreline types.
Changes in NDVI varied modestly among shoreline types across the study period (Table 5). From 2015 to 2019, the NDVI declined at all shoreline types, with the greatest mean decrease observed at seawall transects (−0.138), followed by natural (−0.070) and combination transects (−0.035) (Table 5). Between 2019 and 2023, the NDVI increased across all shoreline types, with gains at seawall transects (0.103), natural transects (0.069), and combination transects (0.044) (Table 5). Over the full period (2015–2023), net NDVI change was minimal across shoreline types, with seawall transects showing a slight overall decrease (−0.034), combination transects showing a small net increase (0.009), and natural transects exhibiting no net change (0.000). Overall, the NDVI reductions observed between 2015 and 2019 were partially offset by increases between 2019 and 2023, but these values should be interpreted as surface-greenness patterns rather than direct measures of vegetation composition or ecological resilience.
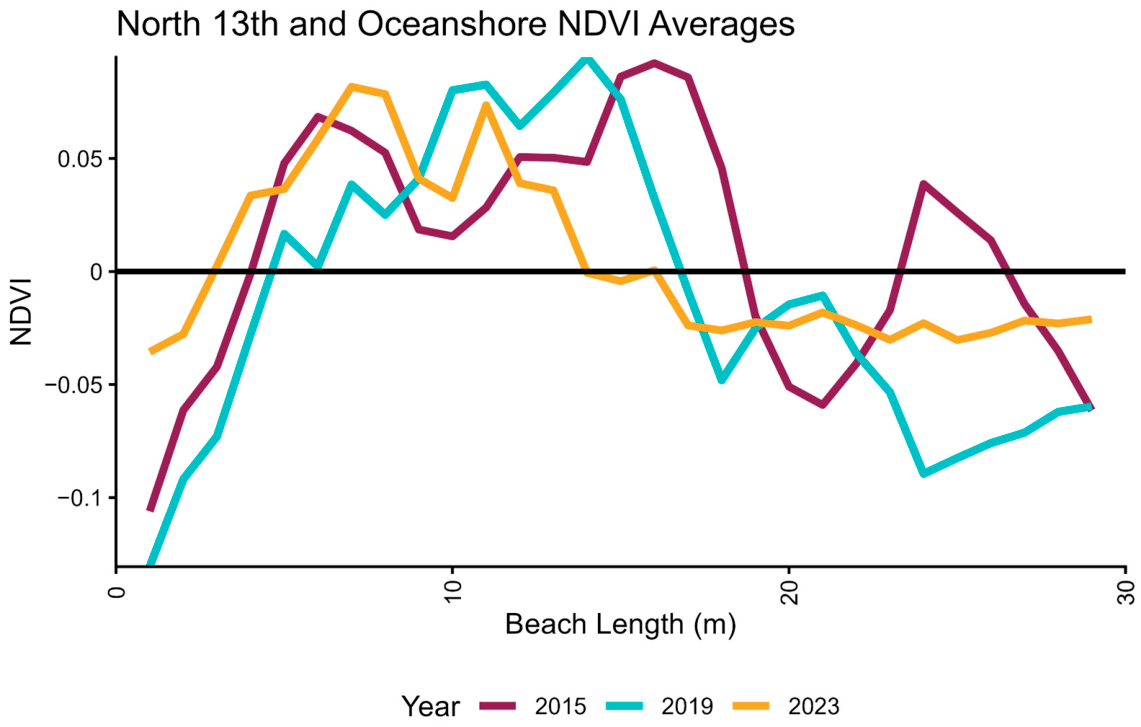
NDVI responses varied by shoreline configuration. Seawall-dominated transects exhibited consistently negative mean NDVI values across all years (Table 5 and Table 6). Combination barrier transects exhibited small changes; Ponce Preserve Walkway showed a net NDVI increase of +0.063, Williams Avenue increased by +0.027, and Marineland Beach exhibited a net decline of −0.063 (Table 6). Natural dune systems exhibited the widest range of NDVI responses. Net NDVI change at natural sites ranged from −0.110 at Mala Compra Park to +0.118 at Crescent Beach. Several natural transects exhibited relatively small net changes near zero, including North 13th and Oceanshore (−0.007) (Figure 5) and Fort Matanzas (−0.002) (Table 6).
Across all transects and years, mean NDVI values ranged from −0.409 ± 0.302 at Riptides in 2019 to 0.293 ± 0.068 at Fort Matanzas in 2019. Many transects exhibited negative mean values in 2015 and 2019, with partial recovery observed in 2023. Between 2015 and 2019, most transects experienced declines in mean NDVI. Declines during this period ranged from −0.006 at Al Weeks Park to −0.255 at Riptides. The largest decreases were observed at Riptides (−0.255), D Lane (−0.186), and Washington Oaks Park (−0.165). Between 2019 and 2023, NDVI increased along the majority of transects. Mean NDVI gains during this period ranged from +0.014 (Gamble Rogers State Park) to +0.248 (D Lane). Several sites that exhibited declines between 2015 and 2019 showed partial increases in NDVI by 2023, including Crescent Beach (+0.175) and A1A Ocean Club (+0.216).
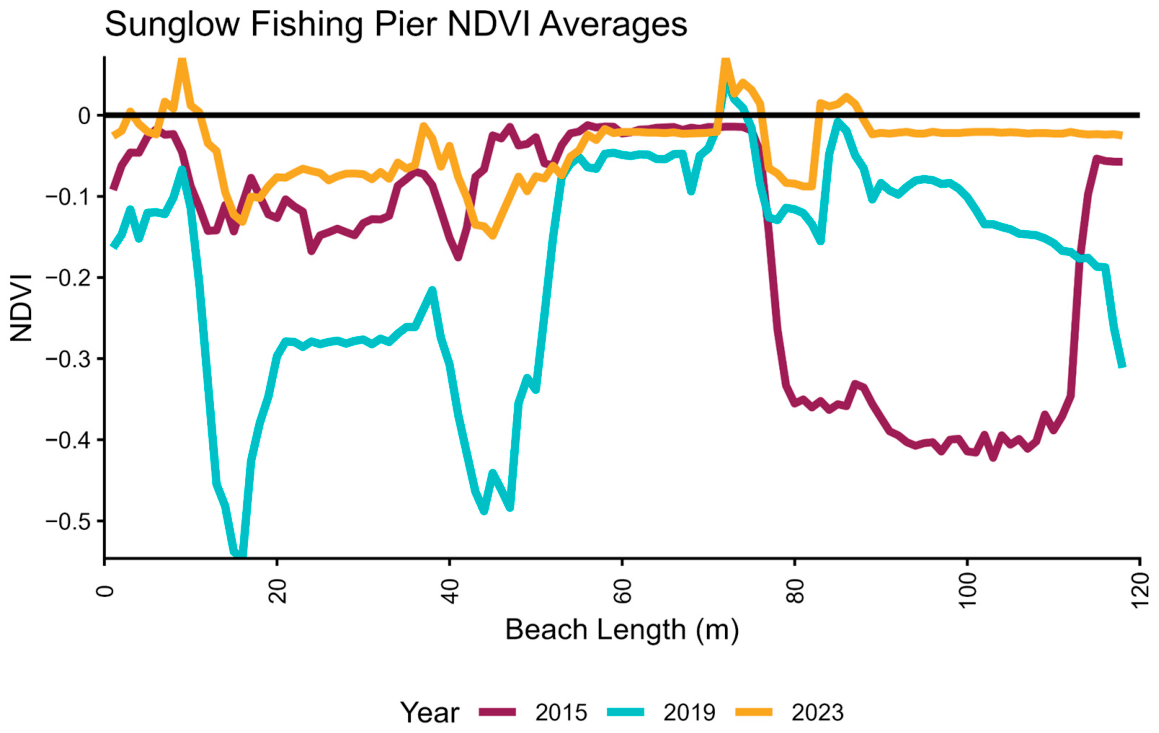
At North 13th and Oceanshore, NDVI values varied across the cross-shore profile over time (Figure 5). The seaward portions of the transect exhibited lower NDVI values in 2019 and 2023 compared to portions of the 2015 profile, while landward sections showed relatively similar or slightly higher NDVI values among years. At Sunglow Fishing Pier, NDVI values along the seaward portion of the profile generally became more negative through time, particularly between approximately 75 and 115 m along the transect (Figure 6). In 2023, higher NDVI values were present farther inland within the profile, while the front portions remained lower relative to earlier years.

3.3. Stakeholder Perspectives of Coastal Change and Habitat Impacts

The stakeholder workshop survey data from two workshops conducted in November 2024 in Volusia County, FL, were used to identify which perceptions, concerns and coastal priorities were most closely related. There were 28 total survey respondents (community members (54%), consultants (7%), homeowners (21%), board members (11%), university employees (4%)) out of roughly 150 community members that attended.
First, 96% (27 out of 28) of respondents indicated that maintaining natural ecosystems, such as dunes and coastal vegetation, is extremely important for coastal resilience. This shows strong public recognition of the protective and ecological value of these systems. When asked about climate change, 60% (17 out of 28) of respondents felt it is extremely significant in contributing to coastal erosion in Volusia County. However, this contrasts sharply with perceptions of preparedness. Only about 21% (6 out of 28) of respondents felt that their community is extremely or moderately prepared for future coastal storms and extreme weather events.
The second section of the survey focused on stakeholder perceptions of living seawalls as a hybrid coastal defense strategy. Table 7 summarizes respondents’ initial impressions of living seawalls, with 79% of respondents finding it very promising as a hybrid coastal defense solution. Respondents addressed their main concerns with a living seawall: effectiveness during storms (89%), long-term maintenance (75%), and cost (54%).
Table 8 summarizes stakeholder responses related to ecological and environmental considerations associated with coastal protection strategies. A total of 93% of respondents recognize the importance of vegetation on coastlines for coastal protection, and 96% believe that balancing environmental conservation with coastal protection efforts is moderately or extremely important.

4. Discussion

This study evaluated changes in beach width, shoreline type, dune elevation, and NDVI-based surface greenness and assessed stakeholder priorities along Florida’s Atlantic coast. The study used sixteen transect locations to extract LiDAR and NDVI values from beach profiles, and stakeholder perspective data from Volusia County workshops. The results reveal spatial variability in dune elevation change and vegetation-greenness patterns along an approximately 80 km segment of a barrier island system, with some sites experiencing pronounced morphological shifts over time (Table 3 and Table 4). Stakeholder responses further emphasized concerns related to erosion, storm impacts, and habitat protection. Combined, these findings highlight complex and site-specific relationships among coastal morphology, shoreline management, and public perception.

4.1. Geomorphic Change and Coastal Resilience

Across the sixteen transect locations, eleven sites exhibited net elevation loss over the study period, with the most pronounced erosion occurring between 2016 and 2022, likely reflecting the cumulative influence of Hurricane Matthew (October 2016), Hurricane Ian (September 2022), and Hurricane Nicole (November 2022). Natural dune systems may adjust to geomorphic change with greater flexibility than seawall-backed locations because they allow for sediment exchange, dune migration, and vegetation recovery [21,22]. However, the study was designed around shoreline-type contrasts within a continuous barrier island corridor, not around county-level inference. County differences in development density, nourishment history, beach driving, access, and storm exposure are therefore treated as contextual factors rather than as statistically tested explanatory variables. The widespread elevation loss observed across many transects likely reflects not only recent hurricane impacts, but also increasing pressure on barrier island systems from intensified coastal development and sea-level rise.
Shoreline type presented a strong differentiator in elevation response (Table 5). All seawall transects experienced net elevation loss. The locations that experienced the highest loss in elevation occurred in Volusia County, where these beaches lost more than an estimated 6.6 million cubic yards of sand due to hurricanes in recent years (estimation carried out by management rather than a peer-reviewed estimation) [23]. In response to these weather events, Volusia County worked to create placement projects in 2024 and 2025, which involved 700,000 cubic yards of beach-quality material from within Ponce Inlet [24]. Volusia County placement project locations correspond with two locations analyzed in this study: Ponce Preserve Walkway and Sunglow Fishing Pier. Although these transect locations correspond with these beach renourishment projects, this should be interpreted as only a part of a multitude of drivers effecting elevation change. While seawalls may provide short-term protection for infrastructure, they can also alter natural coastal processes by limiting dune migration and increasing beach narrowing [11]. The continued need for nourishment and sand placement projects within these areas further illustrates how developed shorelines often require ongoing human intervention to maintain beach width and recreational space [25].
In contrast, while some natural dune sites also lost elevation, the selected natural shoreline group was the only shoreline type to show a positive mean net elevation change across the study period (0.255 m). This pattern should be interpreted descriptively and with attention to site-specific factors, including nourishment, sand placement, access, and beach-use intensity. It nevertheless suggests that geographic flexibility, sediment exchange, and vegetation-mediated dune building can contribute to coastal adaptability where natural dune processes remain intact [21,22].
Analysis of NDVI values from 2015 to 2023 revealed differences in surface-greenness dynamics across transects (Table 5), reflecting variation in shoreline type, potential disturbances, seasonality, and the capacity for vegetation to persist or reestablish after storms. Seawall-dominated transects exhibited consistently negative mean NDVI values across all years, which may indicate bare sand, wet sand, water, shade, hard infrastructure, or limited vegetation cover. In contrast, several natural dune systems maintained higher or more variable NDVI values, which is consistent with the interpretation that intact dune systems can support vegetation persistence [18]. However, NDVI alone does not establish vegetation composition, density, or ecological resilience, and the non-matched LiDAR and NDVI years prevent direct causal coupling between elevation and greenness change.
The stronger surface-greenness patterns observed at some natural and combination sites also highlight the potential value of hybridized shoreline approaches that incorporate vegetation and nature-based solutions alongside some structural protection. Unlike fully hardened shorelines, these approaches may allow for some sediment movement and vegetation establishment while providing protection for developed areas [8,13]. Stakeholder responses further support the management relevance of this issue, as participants expressed strong support for balancing environmental conservation with coastal protection efforts (96%, 27 out of 28), indicating interest in approaches that maintain both ecological function and shoreline protection [13].
NDVI and LiDAR values were extracted along five fixed transect lines that were generated in ArcGIS and therefore represent vegetation and elevation conditions that are within the cross-shore dune profiles that are landward to Highway A1A. However, since they were calculated along five linear transects rather than across the entire dune, they reflect the averaged vegetation and elevation at those specific points on lines. Lateral heterogeneity in the dune vegetation, such as trails or access paths, dense patches outside the transect lines, or localized sand deposits, could influence mean NDVI values without fully representing site-wide vegetation coverage.
The majority of sites exhibited some degree of vegetation recovery between 2019 and 2023, even at the locations with elevation loss. Volusia County, where there is high population density, infrastructure and beach driving in the southern locations (Riptides, Sunglow Fishing Pier), exhibited consistent net elevation and vegetation loss (Figure 4 and Figure 6) [8,26]. These locations suggest that while limited vegetation regrowth may occur, hardened shorelines may restrict meaningful geomorphic or ecological stabilization [8,26].
Of note, changes in elevation and NDVI differed by shoreline type (Table 3 and Table 5), with selected natural transects showing net elevation gain and no net mean NDVI loss over the study period, whereas seawall-backed transects experienced net elevation loss and consistently low or negative NDVI values. These patterns are consistent with findings that natural foredune systems can exhibit greater morphological resilience and recovery potential due to sediment transport and structural support from vegetation [22]. Treating the erosion interval (2016–2022) and the subsequent recovery interval (2022–2024) as distinct phases is supported by multi-decadal, transect-scale evidence that erosion and recovery are governed by different controls, such that a site’s susceptibility to erosion does not by itself predict its capacity to rebuild, and that resolving erosion-accretion behavior transect by transect is informative for coastal vulnerability and disaster-risk assessment [23]. Natural dune systems maintain dynamic feedback between sediment transport and accretion, which may help recovery following storm impacts [22].
Taken together, the elevation and NDVI results are consistent with the interpretation that natural barrier systems can provide greater long-term adaptive capacity than heavily hardened systems (Table 3 and Table 5). Hardened systems, including seawall or combination sites, showed persistent elevation loss and more limited surface greenness relative to selected natural systems, consistent with work demonstrating that coastal armoring alters nearshore processes [22]. These patterns should be interpreted cautiously because of small category sample sizes, nested transect structure, LiDAR measurement uncertainty, different NAIP resolutions, and non-synchronous LiDAR and NDVI acquisition years.

4.2. Stakeholder Perspectives on Coastal Management and Habitat Resilience

Stakeholder responses revealed important insights into how coastal residents and community members perceive changing beach and dune configurations and their relationship to ecological habitat (Table 7 and Table 8). While many respondents emphasize the importance of protecting infrastructure and maintaining recreational beach access, there was also a recognition that natural dune systems provide protective and ecological value (Table 7 and Table 8).
Stakeholder responses showed broad interest in shoreline-management approaches that balance infrastructure protection, dune restoration, and environmental conservation. These approaches are often viewed as less intrusive than shoreline armoring and more compatible with maintaining beach aesthetics and recreational access [12]. However, because the survey sample was small, voluntary, and limited to two Volusia County workshops, the results should be interpreted as stakeholder perception data rather than as a representative survey of all coastal residents across the three-county study region.
However, stakeholder prioritization of infrastructure protection may also contribute to support for hardened shoreline structures in high-density areas, as seen in previous studies, such as Barry et al. [13,27]. Armoring can provide short-term protection for property but may limit natural sediment transport and prevent landward beach migration during storm events, resulting in habitat compression [27]. Stakeholder choices on how to armor their property are directly influenced by the Florida Department of Environmental Protection’s Coastal Construction Control Line Program (CCCL). This program regulates structures and activities that can cause beach erosion, destabilize dunes, damage upland properties or interfere with public access, but the regulations held can also interfere with homeowners’ ability to implement site-specific protective structures. When considered alongside the natural vs. barrier shoreline types, stakeholder preferences for structural stabilization highlight potential tradeoffs between humans and habitat resilience.
In addition to individual management actions, coastal resilience is strongly influenced by the collective functioning of natural barrier systems [28,29]. Beaches, dunes, nearshore sandbars, and coastal vegetation operate together as an integrated protective system that dissipates wave energy and reduces storm impacts [13,28,29]. When these features remain continuous alongshore, they allow sediment to move naturally and enable the coastline to adjust dynamically to storms and sea-level rise [28,29]. In contrast, fragmented or heavily modified coastlines may weaken the overall protective capacity of the shoreline. As a result, isolated restoration efforts may provide localized benefits but are often less effective than management strategies that maintain or restore barrier systems at broader spatial scales.
This concept of collective resilience is particularly relevant within the study area, where protected natural regions such as state parks (i.e., Gamble Rogers State Park and North Peninsula State Park) occur alongside developed shoreline segments (Table 1). Maintaining networks of natural beaches and dune systems allows sediment transport processes to operate across the coastline, recover from natural disasters both in elevation and in vegetation, and provide important habitat continuity for coastal wildlife [10,12].
Overall, the stakeholder survey results complement the geomorphic patterns identified in this study but do not directly test statistical associations between public perceptions and site-level elevation or NDVI change. Participants recognized the protective value of natural dune systems, expressed concern regarding erosion, and highlighted the importance of conservation-based coastal management strategies. These perceptions are consistent with the LiDAR and NDVI analyses, which suggest that natural or minimally armored shorelines may have greater potential for recovery following storm disturbance. The integration of stakeholder perspectives with physical and ecological indicators therefore provides a broader understanding of coastal change and emphasizes the importance of incorporating both environmental data and community priorities into future shoreline management decisions.

5. Conclusions

This study examined the changes in beach and dune configurations and perceptions held by Volusia County stakeholders along Florida’s Central Atlantic coast. By evaluating LiDAR-derived elevation change, NDVI-based vegetation analysis, and stakeholder perspectives, this research provides a multi-dimensional understanding of how geomorphic and ecological processes interact across the barrier island system between Ponce Inlet and St. Augustine Inlet.
LiDAR analysis revealed considerable spatial variability in elevation change across the study region; seawall-backed sites experienced net elevation loss between 2016 and 2024, combination sites showed intermediate net loss, and the selected natural shoreline group showed mean net elevation gain. In addition, the armored locations within this study had little to no surface greenness, as reflected in the NDVI values, emphasizing the importance of dune vegetation in maintenance, stability, and recovery after storm events [14]. A previous study within the East Central Florida barrier island system [18] also observed higher erosion (i.e., elevation loss) at armored sites compared to natural sites.
The stakeholder survey responses emphasized the importance of balancing coastal protection, recreation, and ecological conservation within Volusia County. Many respondents recognized the role of natural dunes and vegetation in protecting shorelines and supporting habitat, suggesting public awareness of nature-based coastal management approaches (Table 7 and Table 8).
Findings from the spatial analysis further support these perceptions. At the broader landscape scale of this study, natural shoreline sections appeared relatively stable in terms of elevation change and vegetation dynamics compared to more heavily modified areas. However, these patterns may not translate directly to decisions made at the individual property scale, where management actions often prioritize localized protection measures such as seawalls or other hardened infrastructure.
This disconnect between landscape-scale ecological outcomes and small-scale decision-making highlights the need for more coordinated coastal management approaches and the reduction in barriers to achieve federal approval of alternative, hybrid solutions. Fragmented, site-specific shoreline interventions may provide short-term protection for individual properties but can disrupt natural sediment transport, narrow beaches, and reduce habitat availability across adjacent shoreline sections. As a result, these localized solutions may ultimately undermine broader ecosystem stability and resilience.
Moving forward, effective coastal management will require coordinated, large-scale strategies that consider barrier island systems as interconnected landscapes rather than isolated sections of shoreline. Maintaining connected dune systems, preserving vegetated shorelines, and incorporating ecological considerations into coastal management strategies and coastline protection will be critical for sustaining both wildlife habitat and shoreline resiliency in the face of ongoing climate change and coastal pressures.


Author Contributions

Conceptualization, H.J.C. and S.H.; methodology, S.H., H.J.C. and K.M.S.A.; software, S.H., H.J.C., K.M.S.A. and S.S.P.; validation, S.H., H.J.C. and K.M.S.A.; formal analysis, S.H.; investigation, S.H., H.J.C., K.M.S.A. and S.S.P.; resources, H.J.C. and S.S.P.; data curation, S.H.; writing—S.H. and H.J.C.; writing—review and editing, S.H., H.J.C., K.M.S.A. and S.S.P.; visualization, S.H.; supervision, H.J.C. and K.M.S.A.; project administration, H.J.C. and S.S.P.; funding acquisition, H.J.C., S.S.P. and K.M.S.A. All authors have read and agreed to the published version of the manuscript.

Funding

This publication was made possible by the National Oceanic and Atmospheric Administration, Office of Education Educational Partnership Program, and Educational Partnership Program award (NA21SEC4810004); the NASA MUREP DEAP project, funded by the National Aeronautics and Space Administration 80 NSSC 23 M 0053); and the National Science Foundation (NSF Award ID: 2431268). Its contents are solely the responsibility of the award recipient and do not necessarily represent the official views of the U.S. Department of Commerce, NOAA, NASA, or NSF.

Institutional Review Board Statement

Ethical review and approval were waived for this study by the Institutional Review Board of Embry-Riddle Aeronautical University because this research falls under the EXEMPT category as per 45 CFR 46.104.

Informed Consent Statement

Informed consent was obtained from all subjects involved in the study.

Data Availability Statement

The original data presented in the study will be openly available at NOAA National Centers for Environmental Information (NCEI). The dataset was submitted to NCEI on 12 May 2026 (submission ID: 12F81D).

Conflicts of Interest

The authors declare no conflicts of interest.

References

  1. Komar, P.D. Handbook of Coastal Processes and Erosion; CRC Press: London, UK, 2018. [Google Scholar]
  2. Michener, W.K.; Blood, E.R.; Bildstein, K.L.; Brinson, M.M.; Gardner, L.R. Climate Change, Hurricanes and Tropical Storms, and Rising Sea Level in Coastal Wetlands. Ecol. Appl. 1997, 7, 770–801. [Google Scholar] [CrossRef]
  3. Vinent, O.D.; Schaffer, B.E.; Rodriguez-Iturbe, I. Stochastic Dynamics of Barrier Island Elevation. Proc. Natl. Acad. Sci. USA 2021, 118, e2013349118. [Google Scholar] [PubMed]
  4. Sabo, A.B.; Cornish, M.R.; Castorani, M.C.N.; Zinnert, J.C. Drivers of Dune Formation Control Ecosystem Function and Response to Disturbance in a Barrier Island System. Sci. Rep. 2024, 14, 11405. [Google Scholar] [CrossRef] [PubMed]
  5. Stutz, M.L.; Pilkey, O.H. Open-Ocean Barrier Islands: Global Influence of Climatic, Oceanographic, and Depositional Settings. J. Coast. Res. 2011, 27, 207–222. [Google Scholar] [CrossRef]
  6. Available online: https://www.miamiherald.com/news/local/environment/climate-change/article312870949.html (accessed on 29 May 2026).
  7. US Census Bureau State Population Totals and Components of Change: 2020–2025. Available online: https://www.census.gov/data/datasets/time-series/demo/popest/2020s-state-total.html (accessed on 29 May 2026).
  8. Gittman, R.K.; Scyphers, S.B.; Smith, C.S.; Neylan, I.P.; Grabowski, J.H. Ecological Consequences of Shoreline Hardening: A Meta-Analysis. Bioscience 2016, 66, 763–773. [Google Scholar] [CrossRef] [PubMed]
  9. Spiske, M.; Pilarczyk, J.E.; Mitchell, S.; Halley, R.B.; Otai, T. Coastal Erosion and Sediment Reworking Caused by Hurricane Irma—Implications for Storm Impact on Low-lying Tropical Islands. Earth Surf. Process. Landf. 2022, 47, 891–907. [Google Scholar]
  10. Salim, M.Z.; Kafy, A.A.; Altuwaijri, H.A.; Miah, M.T.; Jodder, P.K.; Rahaman, Z.A. Quantitative Assessment of Hurricane Ian’s Damage on Urban Vegetation Dynamics Utilizing Landsat 9 in Fort Myers, Florida. Phys. Chem. Earth 2024, 136, 103750. [Google Scholar] [CrossRef]
  11. Romine, B.M.; Fletcher, C.H. Armoring on Eroding Coasts Leads to Beach Narrowing and Loss on Oahu, Hawaii. In Pitfalls of Shoreline Stabilization; Springer: Dordrecht, The Netherlands, 2012; pp. 141–164. [Google Scholar]
  12. Monroe, M.; Carthy, R.; Hill, M. Coastal Armoring Impacts on Beaches and Sea Turtles. EDIS 2023, 2023. [Google Scholar] [CrossRef]
  13. Barry, S.C.; Reynolds, L.K.; Braswell, A.E.; Gittman, R.K.; Scyphers, S.B.; Smyth, A.R. Perceived Effectiveness Drives Shoreline Decision-Making for Florida’s Waterfront Property Owners. Ocean Coast. Manag. 2024, 258, 107353. [Google Scholar]
  14. Sigren, J.M. Coastal Sand Dunes and Dune Vegetation: Restoration, Erosion, and Storm Protection. Available online: https://sargcoop.org/wp-content/uploads/2014/12/Figlus-2014-Coastal-sand-dunes-and-dune-vegetation_-Restoration-erosion-and-storm-protection.pdf (accessed on 29 May 2026).
  15. Guthrie, A.G.; Stafford, S.; Scheld, A.M.; Nunez, K.; Bilkovic, D.M. Property Owner Shoreline Modification Decisions Vary Based on Their Perceptions of Shoreline Change and Interests in Ecological Benefits. Front. Mar. Sci. 2023, 10, 1031012. [Google Scholar] [CrossRef]
  16. O’Donnell, K.L.; Tomiczek, T.; Scyphers, S.B. Resident Perceptions and Parcel-Level Performance Outcomes of Mangroves, Beaches, and Hardened Shorelines after Hurricane Irma in the Lower Florida Keys. Front. Environ. Sci. 2022, 10, 734993. [Google Scholar] [CrossRef]
  17. O’Connell, J.F. Shoreline Armoring Impacts and Management Along the Shores of Massachusetts and Kauai, Hawaii. Available online: https://pubs.usgs.gov/sir/2010/5254/pdf/sir20105254_chap7.pdf (accessed on 29 May 2026).
  18. San Antonio, K.M.; Burow, D.; Cho, H.J.; McCarthy, M.J.; Medeiros, S.C.; Zhou, Y.; Herrero, H.V. Data-Driven Assessment of the Impact of Hurricanes Ian and Nicole: Natural and Armored Dunes in the Aftermath of Hurricanes on Florida’s Central East Coast. Remote Sens. 2024, 16, 1557. [Google Scholar]
  19. Ahn, S.; Neary, V.S. Non-Stationary Historical Trends in Wave Energy Climate for Coastal Waters of the United States. Ocean Eng. 2020, 216, 108044. [Google Scholar] [CrossRef]
  20. Han, M.; Enwright, N.M.; Gesch, D.B.; Stoker, J.M.; Danielson, J.J.; Amante, C.J. Assessing the vertical accuracy of digital elevation models by quality level and land cover. Remote Sens. 2024, 15, 667–677. [Google Scholar] [CrossRef]
  21. Feagin, R.A.; Figlus, J.; Zinnert, J.C.; Sigren, J.; Martínez, M.L.; Silva, R.; Smith, W.K.; Cox, D.; Young, D.R.; Carter, G. Going with the Flow or against the Grain? The Promise of Vegetation for Protecting Beaches, Dunes, and Barrier Islands from Erosion. Front. Ecol. Environ. 2015, 13, 203–210. [Google Scholar] [CrossRef]
  22. Hapke, C.J.; Kratzmann, M.G.; Himmelstoss, E.A. Geomorphic and Human Influence on Large-Scale Coastal Change. Geomorphology 2013, 199, 160–170. [Google Scholar] [CrossRef]
  23. Durap, A. Multi-decadal spatiotemporal shoreline vulnerability assessment (1987–2025): Integrating erosion-accretion dynamics for disaster risk reduction across 90 coastal transects. Ideas 2025, 121, 22981–23019. [Google Scholar] [CrossRef]
  24. Volusia County. 2026–2027 Volusia County Sand Placement Projects. Available online: https://www.volusia.org/services/public-works/coastal-division/sand-placement-project/index.stml (accessed on 29 May 2026).
  25. Olsen Associates, Inc. Flagler County, FL, Beach and Dune Management Study; Olsen Associates, Inc.: Jacksonville, FL, USA, 2022; 151p. [Google Scholar]
  26. Feagin, R.A.; Furman, M.; Salgado, K.; Martinez, M.L.; Innocenti, R.A.; Eubanks, K.; Figlus, J.; Huff, T.P.; Sigren, J.; Silva, R. The Role of Beach and Sand Dune Vegetation in Mediating Wave Run up Erosion. Estuar. Coast. Shelf Sci. 2019, 219, 97–106. [Google Scholar] [CrossRef]
  27. Defeo, O.; McLachlan, A.; Schoeman, D.S.; Schlacher, T.A.; Dugan, J.; Jones, A.; Lastra, M.; Scapini, F. Threats to Sandy Beach Ecosystems: A Review. Estuar. Coast. Shelf Sci. 2009, 81, 1–12. [Google Scholar] [CrossRef]
  28. Pilkey, O.H.; Neal, W.J.; Kelley, J.T.; Cooper, J.A.G. The World’s Beaches: A Global Guide to the Science of the Shoreline; University of California Press: Berkeley, CA, USA, 2011. [Google Scholar]
  29. Masselink, G.; Hughes, M.G. Introduction to Coastal Processes and Geomorphology; Arnold: London, UK, 2003. [Google Scholar]
Figure 1. Map of the state of Florida with an expanded view of the research study boundary and the three counties involved (St. Johns, Flagler, and Volusia). The study area begins north at St. Augustine Inlet in St. John’s County, moving south until Ponce Inlet in Volusia County, and extends west from the coastline, including any barrier islands. The study area’s western boundary is Highway A1A.
Sustainability 18 06891 g001
Figure 2. Photographs of barrier structures at each transect location. Images are arranged geographically from south to north, beginning in the top left: (1.) Ponce Preserve Walkway; (2.) Sunglow Fishing Pier; (3.) Williams Avenue; (4.) Riptides; (5.) Al Weeks Park; (6.) Capistrano Drive; (7.) Gamble Rogers State Park; (8.) A1A Oceanshore; (9.) 13th and Oceanshore; (10.) Old Salt Park; (11.) Mala Compra Park; (12.) Washington Oaks Park; (13.) Marineland Trail; (14.) Fort Matanzas Beach Access Drive; (15.) Crescent Beach; (16.) D Lane (photo credits: Samantha Houser, June–July 2025).
Sustainability 18 06891 g002
Figure 3. Averaged beach profiles for 2016 (purple), 2022 (blue) and 2024 (yellow) at North 13th and Oceanshore (Flagler County) for the entire beach length. This location is a representation of a natural site.
Sustainability 18 06891 g003
Figure 4. Averaged beach profiles for 2016 (purple), 2022 (blue) and 2024 (yellow) at Sunglow Fishing Pier (Volusia County) for the entire beach length. This location is a representation of a seawall site, with a black vertical line indicating where the seawall is located.
Sustainability 18 06891 g004
Figure 5. Mean NDVI values for 2015, 2019, and 2023 along North 13th and Oceanshore transects. Profiles represent the average of five transects spaced 15 m apart, and the horizontal line delineates NDVI at 0.00.
Sustainability 18 06891 g005
Figure 6. Mean NDVI values for 2015, 2019, and 2023 along Sunglow Fishing Pier transects. Profiles represent the average of five transects spaced 15 m apart, and the horizontal line delineates NDVI at 0.00.
Sustainability 18 06891 g006
Table 1. Summary of image datasets, including imagery type, primary analysis purpose, years available, and spatial resolution.
Imagery TypeAnalysisYearsSpatial Resolution
LiDARElevation2016, 2022, 20241.00 m
NAIPVegetation2015, 2019, 20231.00 m, 0.60 m, 0.30 m, respectively
Table 2. Transect locations beginning in the southernmost location in Volusia County and ending in the northernmost location in St. Johns County. Each transect has a GPS coordinate, county, beach length (from Highway A1A to the high tide line), correlated description and shoreline type.
Transect Locations (South to North)GPS
Coordinates
CountyBeach LengthBeach DescriptionShoreline Type
1. Ponce Preserve Walkway80.9481437° W 29.1168742° NVolusia210Natural dunes with sandbagsCombination
2. Sunglow Fishing Pier80.9665218° W 29.1493728° NVolusia235Seawall with high amounts of surrounding infrastructure and beach drivingSeawall
3. Williams Avenue81.0224133° W 29.2588888° NVolusia150Combination of natural dunes with some wall structureCombination
4. Riptides81.0279148° W 29.2704207° NVolusia105Seawall in front of playground with only four-wheel beach driving allowedSeawall
5. Al Weeks Park81.0589010° W 29.3344826° NVolusia120Natural dunes with high amounts of vegetationNatural
6. Capistrano Drive81.0779304° W 29.3741953° NVolusia110Natural dunes, soft sand, no beach driving allowedNatural
7. Gamble Rogers State Park81.1061900° W 29.4355989° NFlagler70Natural dunes, soft sand, no beach driving allowedNatural
8. A1A Ocean Club81.1240278° W 29.4746348° NFlagler30Natural dunesNatural
9. North 13th and Oceanshore81.1317387° W 29.4906018° NFlagler70Gradual slope, natural dunesNatural
10. Old Salt Park81.1855044° W 29.6053854° NFlagler60Natural dunes with some businesses nearbyNatural
11. Mala Compra Park81.1899990° W 29.6164864° NFlagler95Natural dunes with little beach accessNatural
12. Washington Oaks Park81.1988678° W 29.6363606° NFlagler115Natural dunesNatural
13. Marineland Trail81.2096699° W 29.6625165° NFlagler125Natural dunesCombination
14. Fort Matanzas Beach Access Drive81.2305946° W 29.7174076° NSt. Johns320Rocky shoreline, many shorebirdsNatural
15. Crescent Beach81.2513390° W 29.7693411° NSt. Johns320Natural dunesNatural
16. D Lane81.2643709° W 29.8431129° NSt. Johns425Natural dunes with little slopeNatural
Table 3. Mean elevation change (m) by shoreline type across study intervals (2016–2022, 2022–2024) and overall net change (2016–2024), averaged across two locations for seawall (10 total transects), three for combination (15 total transects), and three for natural (15 total transects). Negative values indicate elevation loss, while positive values indicate elevation gain.
Shoreline Type2016–20222022–20242016–2024 (Overall)
Seawall−0.5360.007−0.529
Combination−0.4150.11−0.302
Natural0.1620.0930.255
Values are descriptive shoreline-type summaries based on the selected transect locations. No inferential significance is assigned; changes near or below LiDAR vertical uncertainty should be interpreted cautiously.
Table 4. Summarized elevation data by transect location, county, year, and shoreline type.
Transect LocationCountyYearMean Elevation (m)Standard Deviation (m)YearsMean Change (m)Maximum Elevation Change (m)Minimum Elevation Change (m)Shoreline Type
Ponce Preserve WalkwayVolusia20165.0700.9372016–2022−0.8600.255−3.222Combination
20224.2101.6802022–20240.2161.278−0.164
20244.4201.5802016–2024−0.6440.223−3.137
Sunglow Fishing PierVolusia20164.5501.6202016–2022−0.1951.373−1.411Seawall
20224.3502.0502022–20240.0150.736−0.480
20244.3702.1302016–2024−0.1811.843−1.763
Williams AvenueVolusia20164.3201.5402016–2022−0.4160.116−1.418Combination
20223.9002.0002022–20240.0630.805−0.273
20243.9701.9102016–2024−0.3530.231−1.234
RiptidesVolusia20161.5300.3522016–2022−0.876−0.752−0.979Seawall
20220.6580.3732022–2024−0.0010.198−0.218
20240.6580.4672016–2024−0.877−0.633−1.092
Al Weeks ParkVolusia20162.6401.2802016–2022−0.1380.468−1.136Natural
20222.5101.2602022–2024−0.3650.246−0.897
20242.1401.4502016–2024−0.5030.507−1.570
Capistrano DriveVolusia20163.1601.6502016–20220.1130.570−0.599Natural
20223.2701.7202022–2024−0.4740.169−1.198
20242.8002.1002016–2024−0.3610.590−1.020
Gamble RogersFlagler20164.6101.0002016–2022−0.4440.113−1.317Natural
20224.1701.2702022–2024−0.0311.565−0.214
20244.1301.3302016–2024−0.4750.260−0.961
A1A Ocean ClubFlagler20161.7301.9202016–20220.2380.645−0.191Natural
20221.9701.8102022–20241.5133.0620.146
20243.4801.7502016–20241.7522.8720.240
North 13th and OceanshoreFlagler20164.7201.1802016–20220.0840.576−0.582Natural
20224.8001.1702022–20240.0791.038−0.299
20244.8801.1402016–20240.1620.798−0.206
Old Salt ParkFlagler20163.7600.2472016–2022−0.0780.673−1.132Natural
20223.6800.5292022–2024−0.3560.070−1.223
20243.3300.9222016–2024−0.4330.632−1.917
Mala Compra ParkFlagler20162.6900.3822016–20220.4081.591−0.968Natural
20223.1000.6242022–20240.2100.946−0.218
20243.3100.8352016–20240.6181.949−1.098
Washington Oaks ParkFlagler20161.8300.6122016–20220.4731.682−0.981Natural
20222.3000.6992022–20240.0900.704−0.386
20242.3900.9892016–20240.5272.361−0.636
Marineland BeachFlagler20163.0600.3352016–20220.0310.435−2.077Combination
20223.0900.3332022–20240.0611.328−2.467
20243.1500.5592016–20240.0920.882−2.273
Fort MatanzasSt. Johns20164.5601.2402016–2022−0.0320.148−4.447Natural
20224.5301.2402022–20240.0071.315−0.911
20244.5401.2502016–2024−0.0260.368−4.537
Crescent BeachSt. Johns20163.7400.5022016–2022−0.0050.467−3.193Natural
20223.7400.5122022–2024−0.0111.940−0.228
20243.7300.5032016–2024−0.0160.680−2.600
D LaneSt. Johns20163.0400.2362016–2022−0.0150.782−1.916Natural
20223.0200.2362022–20240.0101.375−1.357
20243.0300.2452016–2024−0.0051.075−1.403
Mean overall change depicted at each location are in bold.
Table 5. Mean change in NDVI by shoreline type across study intervals (2015–2019, 2019–2023) and overall net change (2015–2023), averaged across two locations for seawall (10 total transects), three for combination (15 total transects), and three for natural (15 total transects). Negative values indicate decreases in vegetation greenness, while positive values indicate increases.
Shoreline Type2015–20192019–20232015–2023 (Overall)
Seawall−0.1380.103−0.034
Combination−0.0350.0440.009
Natural−0.0700.0690.000
Values are descriptive shoreline-type summaries based on the selected transect locations. No inferential significance is assigned; NDVI comparisons should be interpreted in light of different NAIP resolutions, winter acquisition dates, and mixed-pixel effects.
Table 6. Summarized vegetation data by transect location, county, year, and shoreline type.
Transect LocationCountyYearMean NDVIStandard DeviationYearsMean ChangeShoreline Type
Ponce Preserve WalkwayVolusia20150.0680.0652015–20190.013Combination
20190.0810.1112019–20230.05
20230.1310.1022015–20230.063
Sunglow Fishing PierVolusia2015−0.1620.1482015–2019−0.02Seawall
2019−0.1820.1352019–20230.142
2023−0.040.0412015–20230.123
Williams AvenueVolusia2015−0.0470.0612015–2019−0.078Combination
2019−0.1250.1912019–20230.105
2023−0.020.0692015–20230.027
RiptidesVolusia2015−0.1540.1572015–2019−0.255Seawall
2019−0.4090.3022019–20230.064
2023−0.3450.2462015–2023−0.19
Al Weeks ParkVolusia2015−0.0290.082015–2019−0.006Natural
2019−0.4090.3022019–20230.064
2023−0.3450.2462015–2023−0.19
Capistrano DriveVolusia2015−0.0510.0532015–2019−0.071Natural
2019−0.1220.0712019–20230.081
2023−0.0410.0742015–20230.01
Gamble Rogers State ParkFlagler2015−0.0210.0912015–20190.002Natural
2019−0.0190.0542019–20230.014
2023−0.0050.0352015–20230.016
A1A Ocean ClubFlagler2015−0.0990.1122015–2019−0.16Natural
2019−0.2590.2012019–20230.216
2023−0.0430.042015–20230.055
North 13th and OceanshoreFlagler20150.0110.0532015–2019−0.022Natural
2019−0.0110.0632019–20230.016
20230.0050.0372015–2023−0.007
Old Salt ParkFlagler20153.7600.2472016–2022−0.078Natural
20193.6800.5292022–2024−0.356
20233.3300.9222016–2024−0.433
Mala Compra ParkFlagler20152.6900.3822016–20220.408Natural
20193.1000.6242022–20240.210
20233.3100.8352016–20240.618
Washington Oaks ParkFlagler20151.8300.6122016–20220.473Natural
20192.3000.6992022–20240.090
20232.3900.9892016–20240.527
Marineland BeachFlagler20153.0600.3352016–20220.031Combination
20193.0900.3332022–20240.061
20233.1500.5592016–20240.092
Fort MatanzasSt. Johns20154.5601.2402016–2022−0.032Natural
20194.5301.2402022–20240.007
20234.5401.2502016–2024−0.026
Crescent BeachSt. Johns20153.7400.5022016–2022−0.005Natural
20193.7400.5122022–2024−0.011
20233.7300.5032016–2024−0.016
D LaneSt. Johns20153.0400.2362016–2022−0.015Natural
20193.0200.2362022–20240.010
20233.0300.2452016–2024−0.005
Mean overall change depicted at each location are in bold.
Table 7. Four of the survey questions used to gauge stakeholder perceptions of living seawalls, with responses from the two workshops conducted in November 2024.
What Are Your Initial Thoughts on the Living Seawall Concept as a Hybrid Coastal Defense Solution?What Concerns, If Any, Do You Have About Integrating Living Seawalls into Volusia County’s Shoreline? (You Can Choose More than One)In Your Opinion, What Are the Primary Concerns Related to Using Natural Elements like Sand Dunes for Shoreline Protection? (You May Choose More than One)How Do You Feel About the Potential Tradeoffs Between Hard Infrastructure (e.g., Seawalls) and Natural Solutions?
Very promising—22Cost—15Effectiveness during storms—25I prefer a balanced approach (both hard and
natural)—17
Moderately interesting—4Environmental impacts—7Long-term maintenance—21I prefer more natural
solutions—9
Slightly skeptical—1Effectiveness—16Aesthetic impact—8I prefer more hard infrastructure—1
Unnecessary or ineffective—1I have no concerns—4None—2Unsure—1
Table 8. Ecological and environmental concerns held by the stakeholders based on two workshops conducted in November 2024.
What Are Your Thoughts on the Role of Vegetation in Stabilizing Dunes and Providing Habitat for Wildlife?How Important Is It to Balance Environmental Conservation with Coastal Protection Efforts?Are You Concerned About the Impact that Hybrid Structures (Living Seawalls) Might Have on Local Wildlife or Sediment Transport?
Essential for coastal
protection—26
Extremely important—20Extremely concerned—2
Helpful, but not critical—2Moderately important—7Moderately concerned—9
Minimal importance—0Slightly important—1Slightly concerned—11
Unnecessary—0Not important at all—0Not concerned at all—5
Disclaimer/Publisher’s Note: The statements, opinions and data contained in all publications are solely those of the individual author(s) and contributor(s) and not of MDPI and/or the editor(s). MDPI and/or the editor(s) disclaim responsibility for any injury to people or property resulting from any ideas, methods, instructions or products referred to in the content.