1. Introduction
Japan is one of the world’s most seismically active countries and consequently faces an exceptionally high risk of earthquake-induced tsunami disasters. In particular, the Great East Japan Earthquake of 2011 caused more than 20,000 fatalities and missing persons due to the tsunami, and the scale of destruction shocked both Japan and the international community [
1,
2]. More recently, the 2024 Noto Peninsula Earthquake (Reiwa 6) recorded a maximum seismic intensity of 7 on the Japan Meteorological Agency (JMA) scale in Wajima City and Shika Town, Ishikawa Prefecture, resulting in more than 700 deaths (including indirect disaster-related deaths) [
3]. In coastal areas, tsunamis occur on cycles ranging from several decades to once a century, and each event repeatedly produces severe human and material losses. Against this backdrop, tsunami disaster-prevention education is critically important.
Tsunami education must go beyond teaching the physical mechanisms of tsunami generation; it should foster “behavioral change” that enables individuals to protect their own lives. However, current disaster-prevention education often relies heavily on lecture-based, one-way information delivery, making it difficult for learners to engage actively. In many communities and municipalities, common approaches include confirming inundation zones using hazard maps, conducting field walks to identify hazardous locations, and checking evacuation routes and annotating them on maps. Yet these methods make it difficult for participants to form a concrete image of where inundation would actually reach when compared with the real landscape. To address such limitations, the application of Information and Communication Technology (ICT) and digital technologies in education has recently attracted increasing attention [
4].
Among ICT-based disaster-prevention methods, technologies such as virtual reality (VR), augmented reality (AR), and geographic information systems (GIS) enable intuitive and experiential learning, contributing substantially to improved understanding and motivation. In tsunami education, which inherently involves spatial information, visually understanding local topography and evacuation routes is essential, and studies have highlighted the effectiveness of these technologies [
5,
6]. In this context, the use of 3D scanning, which can realistically reproduce real-world terrain and streetscapes—offers high practical value for educational settings. A 3D scanner captures the geometry of objects and terrain with high precision and generates three-dimensional digital models. Laser-based systems can acquire data at high accuracy and have been applied across diverse fields including architecture, medicine, and cultural heritage conservation. In recent years, portable 3D scanners have become available at price points that make them feasible for general educational use. They have also been used for post-disaster investigation; for example, following the 2011 disaster, tsunami height, inundation extent, and flow characteristics were mapped in detail using terrestrial laser scanning (TLS) from the rooftops of surviving buildings together with eyewitness video footage [
7].
In tsunami disaster-prevention education, 3D scanning makes it possible to scan local terrain, buildings, and evacuation routes and reproduce them digitally. This allows learners to grasp, in an intuitive manner, elevation differences, building layouts, and the presence of visual and physical obstruction features that are difficult to capture through abstract maps or aerial photographs alone. Moreover, by using 3D maps and models derived from scan data to conduct interactive group learning and simulation-based workshops, educators can promote active and collaborative learning.
Experiential learning enables learners to acquire knowledge through action and observation; it is indispensable in domains such as disaster education, where effective “action” is ultimately required. Tsunami education using 3D scanning is therefore promising as a means of realizing dialogic and experiential learning. A sequence of learning activities—scanning the community and examining evacuation scenarios—can strongly motivate participants and enhance their agency. By enabling participants to perceive disaster risks and evacuation realities as “real,” such approaches are expected to cultivate deeper risk awareness and stronger motivation to act. Additionally, dialogic implementation is known to make disaster-prevention education more effective by fostering participants’ ownership and initiative [
8].
Based on this background, the aim of this study is to explore the preliminary educational effects of an experiential evacuation training program for local residents using a point-cloud-derived 3D model of an actual district. Using pre- and post-experience questionnaires, this study examines changes in residents’ perceived risk recognition, spatial understanding of hazardous locations and evacuation routes, self-efficacy, and evacuation-related behavioral intentions. The training includes not only tsunami inundation but also road blockages caused by building collapse and debris. Specifically, using pre- and post-experience questionnaires, we assess changes in: (1) risk perception, (2) spatial understanding of hazardous locations and evacuation routes, (3) self-efficacy, and (4) evacuation behavioral intentions. Furthermore, we analyze how perceived fidelity and trustworthiness of the measurement-based 3D model relates to learning outcomes and improved behavioral intentions, thereby examining how a measurement-based 3D model can be used in resident-focused disaster-prevention education.
The overarching significance of this study lies in advancing the potential of digital technologies in disaster education and establishing an educational method that cultivates the capabilities needed to protect lives. National policies also emphasize disaster-prevention education that promotes voluntary and proactive engagement [
9] and note expectations for education that leverages advanced technologies [
10]. To foster the ability to act autonomously during disasters, it is necessary to provide more effective learning environments in everyday contexts. By using 3D scanning to systematize knowledge acquisition, it becomes possible to ensure active learning, achieve place-based experiential learning, and deliver disaster education that is retained as durable knowledge.
This study has three key features: (1) it realizes education aligned with national educational policies; (2) it provides an engaging learning environment that helps participants sustain attention and maintain engagement; and (3) it enables experiences that approximate real disaster conditions through the proposed disaster-prevention education approach.
From the perspective of sustainability, fostering disaster-resilient communities is an integral part of sustainable development, as emphasized by Sustainable Development Goal 11 (Sustainable Cities and Communities). A point-cloud-derived 3D urban model offers a reusable, low-cost, and transferable educational asset that can be repeatedly used and shared across communities, supporting the long-term continuity of locally grounded disaster-prevention education. By strengthening residents’ place-based risk awareness and self-directed evacuation capacity, this approach contributes to the social sustainability and long-term resilience of coastal communities.
3. Materials and Methods
3.1. Study Area Selection
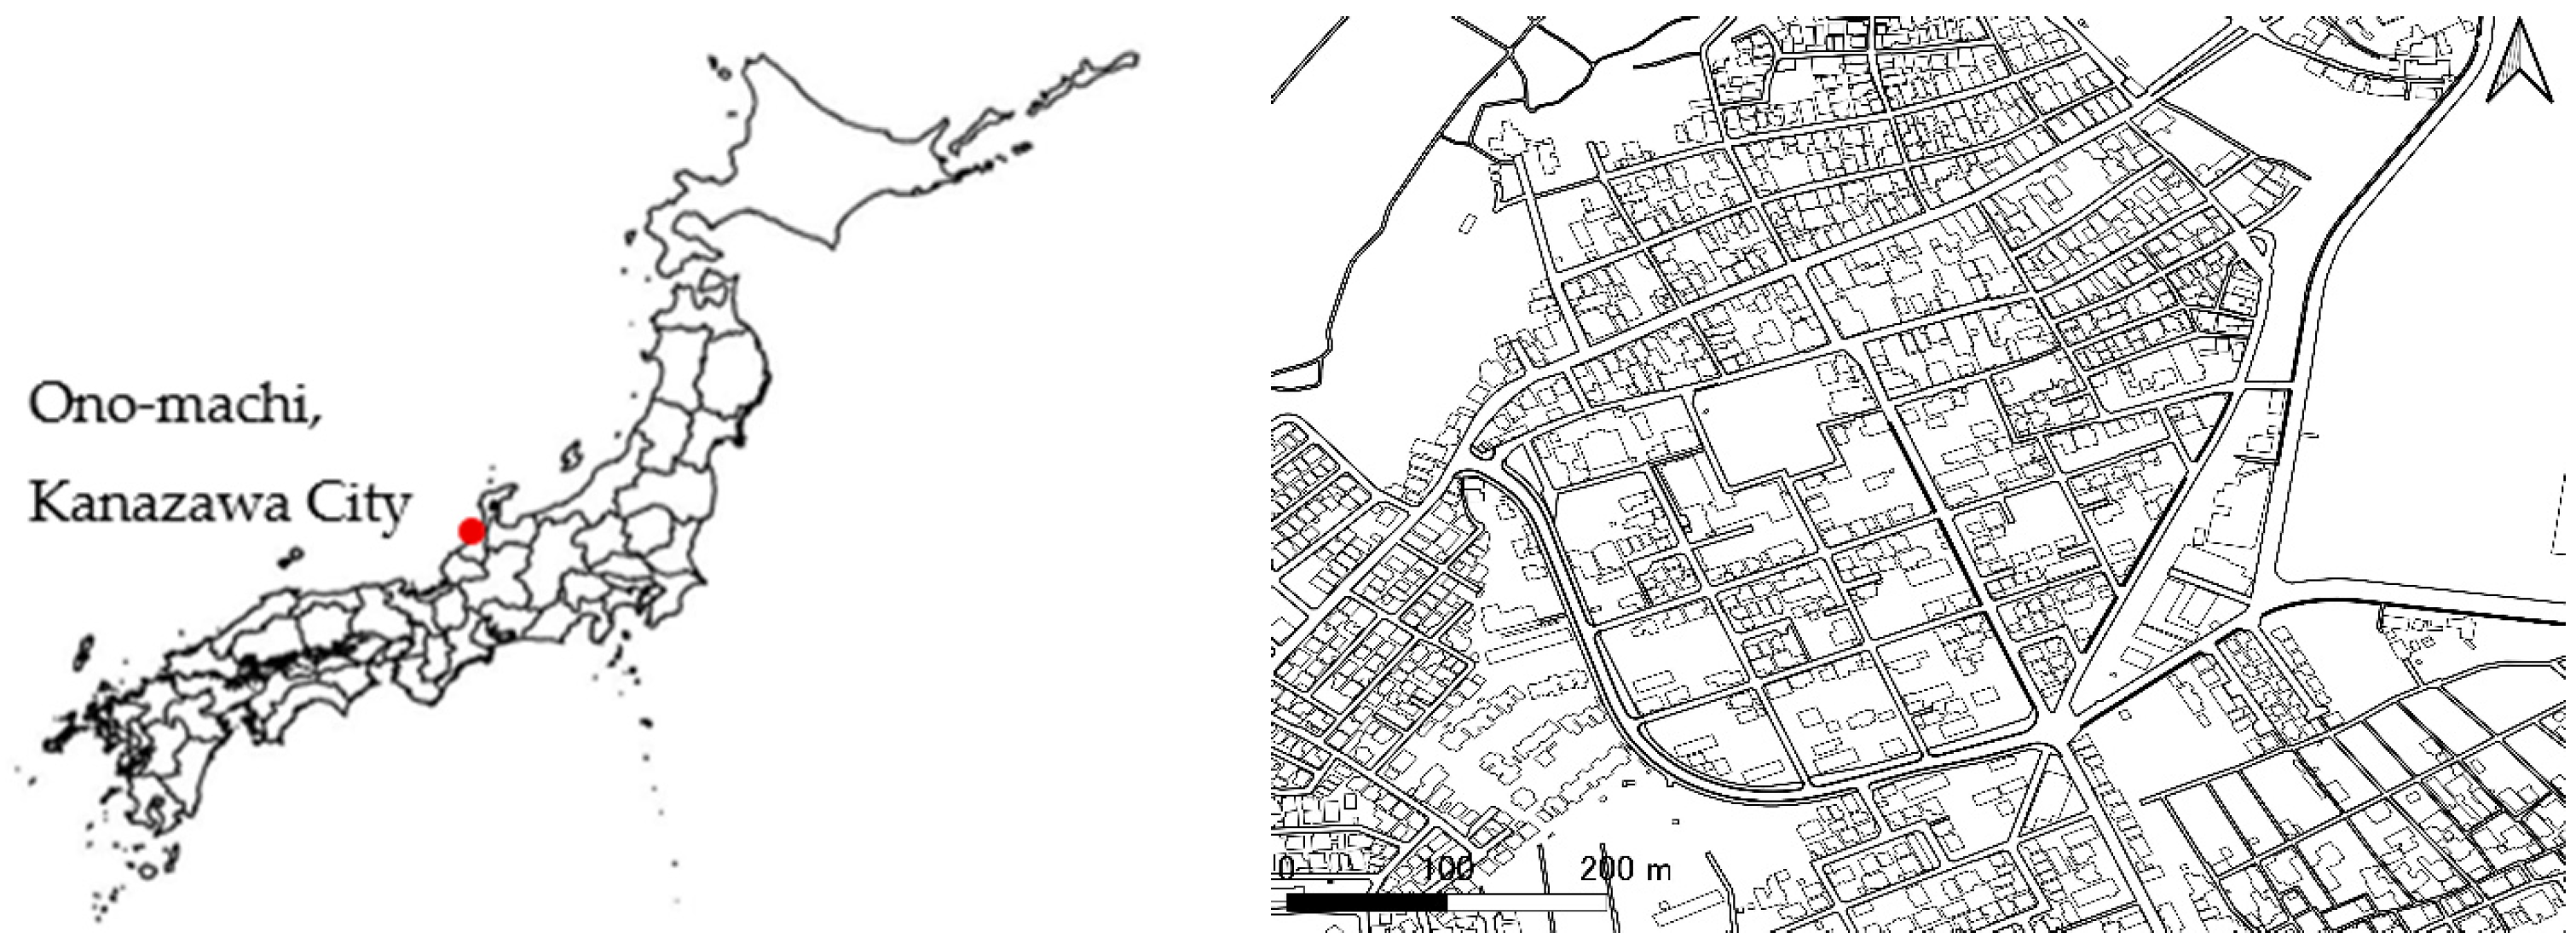
A tsunami-prone study area was selected to examine the effectiveness of a point-cloud-based 3D evacuation experience. We chose Ono-machi in Kanazawa City, Ishikawa Prefecture, Japan (
Figure 1). Ono-machi is located along the Sea of Japan coast and has historically developed as a port town. During the Kaga Domain era, it prospered as a stopover port for Kitamae-bune trading ships, and today the area remains active in fisheries, seafood processing, and tourism, sustaining valuable local resources and a well-established community.
At the same time, Ono-machi faces risks typical of low-lying coastal districts, including potential tsunami impacts triggered by large earthquakes. In recent years, seismic activity around the Noto Peninsula and adjacent offshore areas has drawn increasing attention, highlighting the need to strengthen tsunami disaster-prevention measures along the Ishikawa coastline. The district contains dense residential neighborhoods along the shoreline, and port and fishing facilities that support the local economy. While the town center preserves a historic streetscape that attracts many visitors, evacuation planning is challenged by narrow streets and complex local topography, which may constrain safe and efficient evacuation during a tsunami event.
3.2. Point-Cloud Survey Using a 3D Scanner
Surveying the entirety of Ono-machi would generate extremely large point-cloud datasets and could substantially hinder subsequent processing. Therefore, rather than attempting full coverage, we limited the survey extent to a practical area. The selected area encompasses the tsunami inundation assumption zone [
51] and the routes to the designated evacuation site(s), while also including adjacent streets so that alternative evacuation paths can be considered.
Point clouds were acquired using a terrestrial laser scanner (Leica BLK360; Leica Geosystems AG, Heerbrugg, Switzerland). The BLK360 is widely used across multiple domains due to its lightweight design, high mobility, and user-friendly operation, making it particularly suitable for rapid data capture in the field and for surveys in constrained spaces. The resulting point-cloud data can be integrated with diverse applications such as VR and BIM, enabling digital-twin construction and advanced analyses. The BLK360 has been applied in many contexts, including digital documentation and exhibition of cultural heritage, creation of digital sets for media production, improving the efficiency of surveying workflows, and construction-site applications; comparative evaluations against other devices have also been reported [
52,
53].
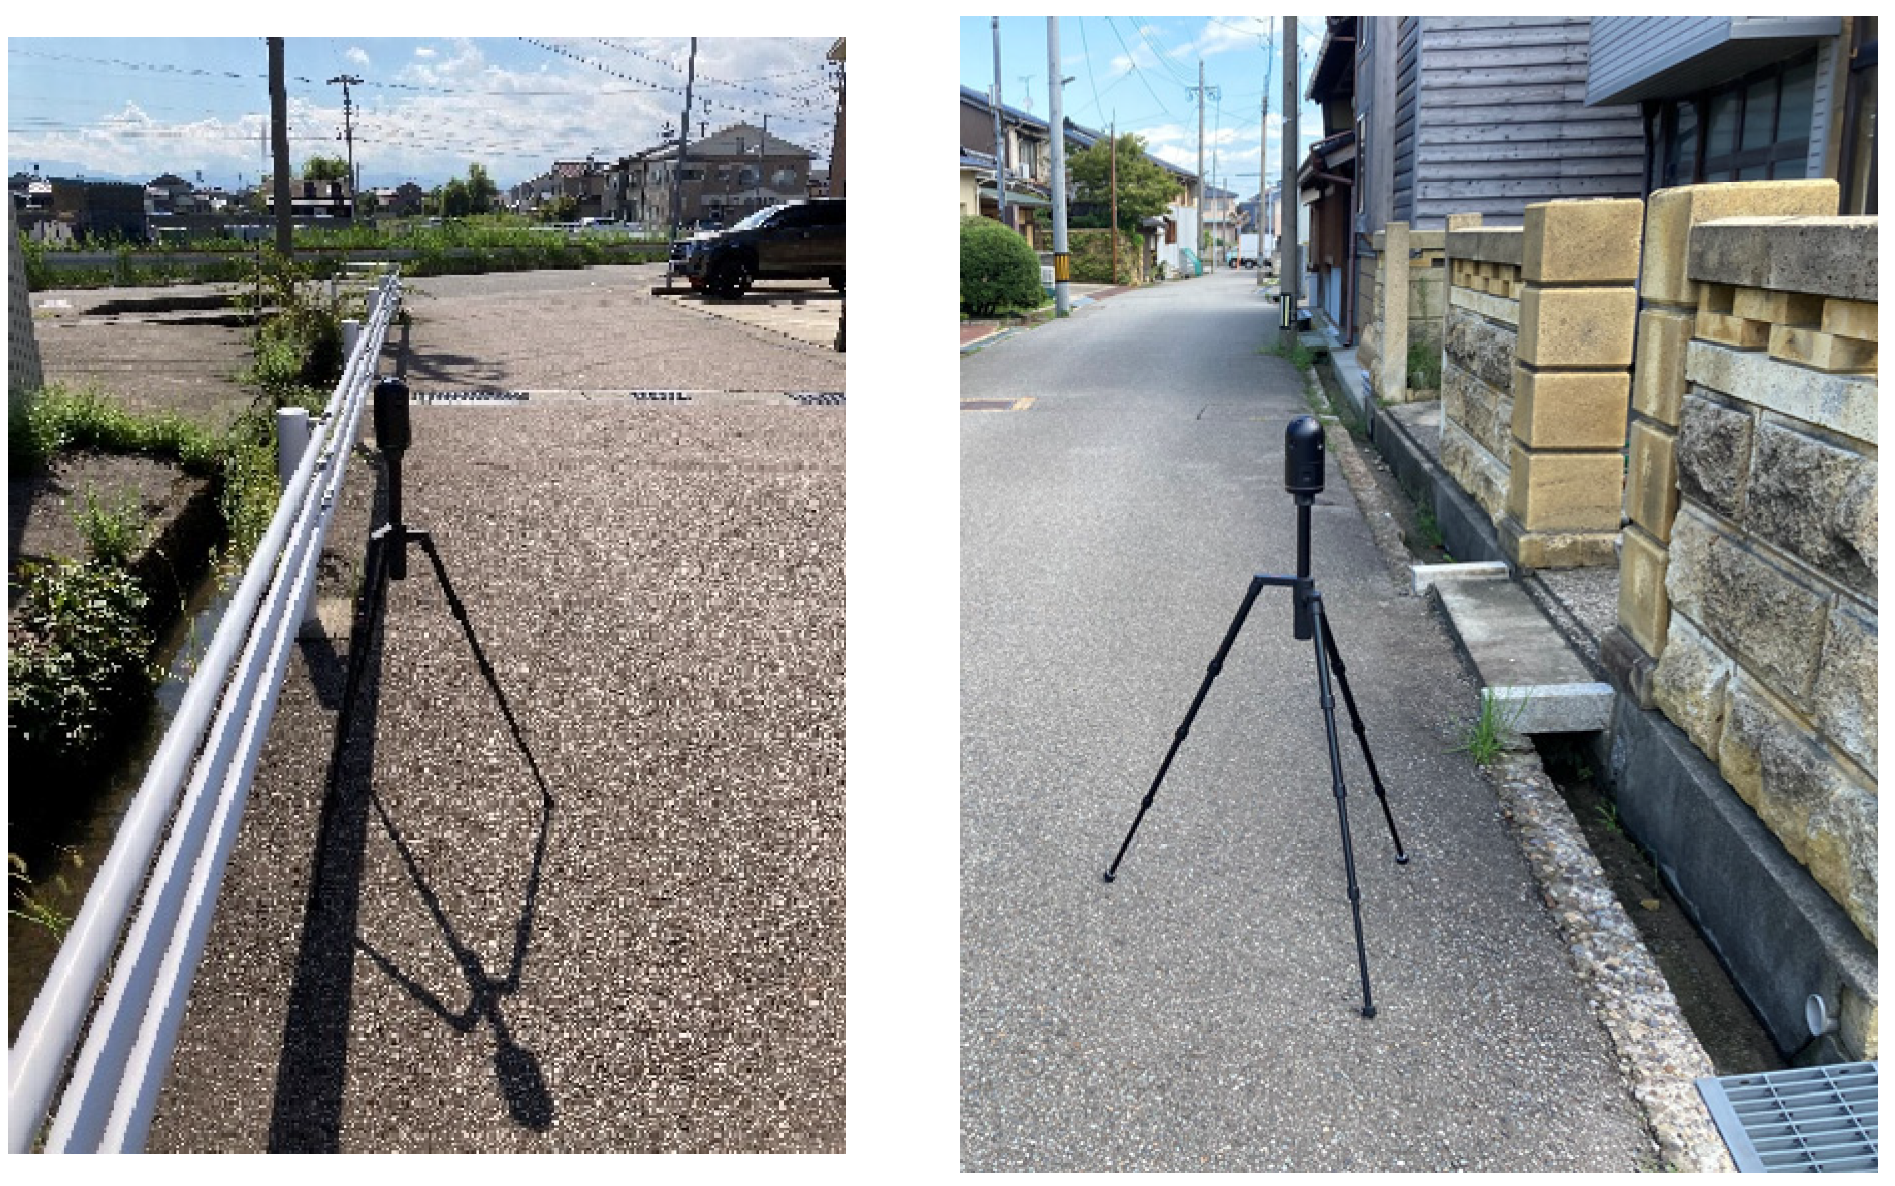
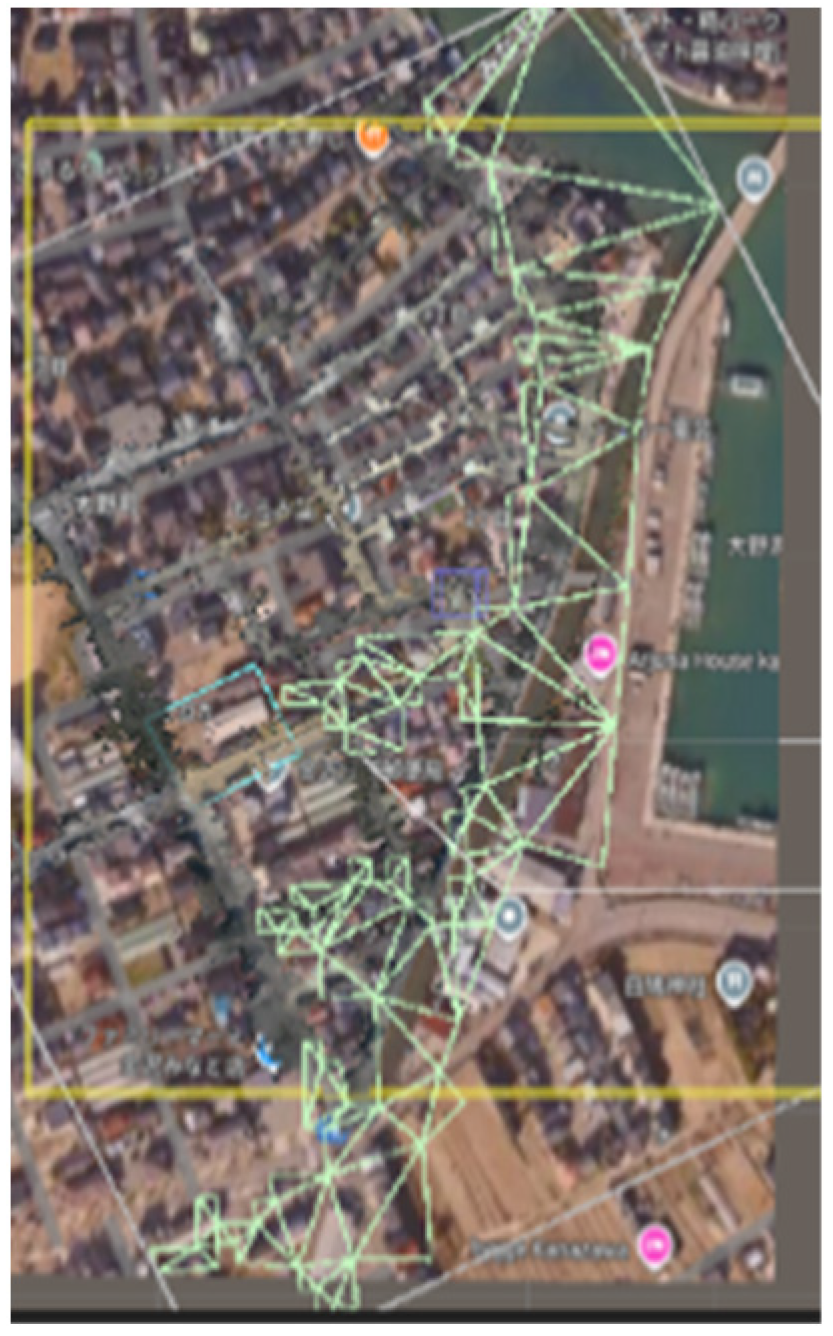
For data acquisition, the scanner was placed at locations that did not obstruct vehicles or pedestrians, and scanning was initiated from each station. After completing a scan at one station, the team moved approximately 3 m to the next station and repeated the process until the target area was covered (
Figure 2). An iPad was used to control the scanner and to verify the scanning status at each station during the survey. Four BLK360 units and four iPads were prepared, and surveys were conducted by a team of three to four people. Field campaigns were carried out eight times between July and August 2025, resulting in a total of 652 scan stations.
3.3. Point-Cloud Registration, Noise Removal, and 3D Meshing
To visualize the streetscape with high geometric fidelity, the acquired point clouds were processed through registration (integration), noise removal, and conversion to a 3D mesh. The Leica Cyclone software (version 2025.0.0) suite was used for this workflow: Leica Cyclone FIELD 360 [
54], Leica Cyclone REGISTER 360 [
55], and Leica Cyclone 3DR [
56]. Because point-cloud processing is computationally intensive, a high-performance workstation was required; the PC specifications used in this study are summarized in
Table 1.
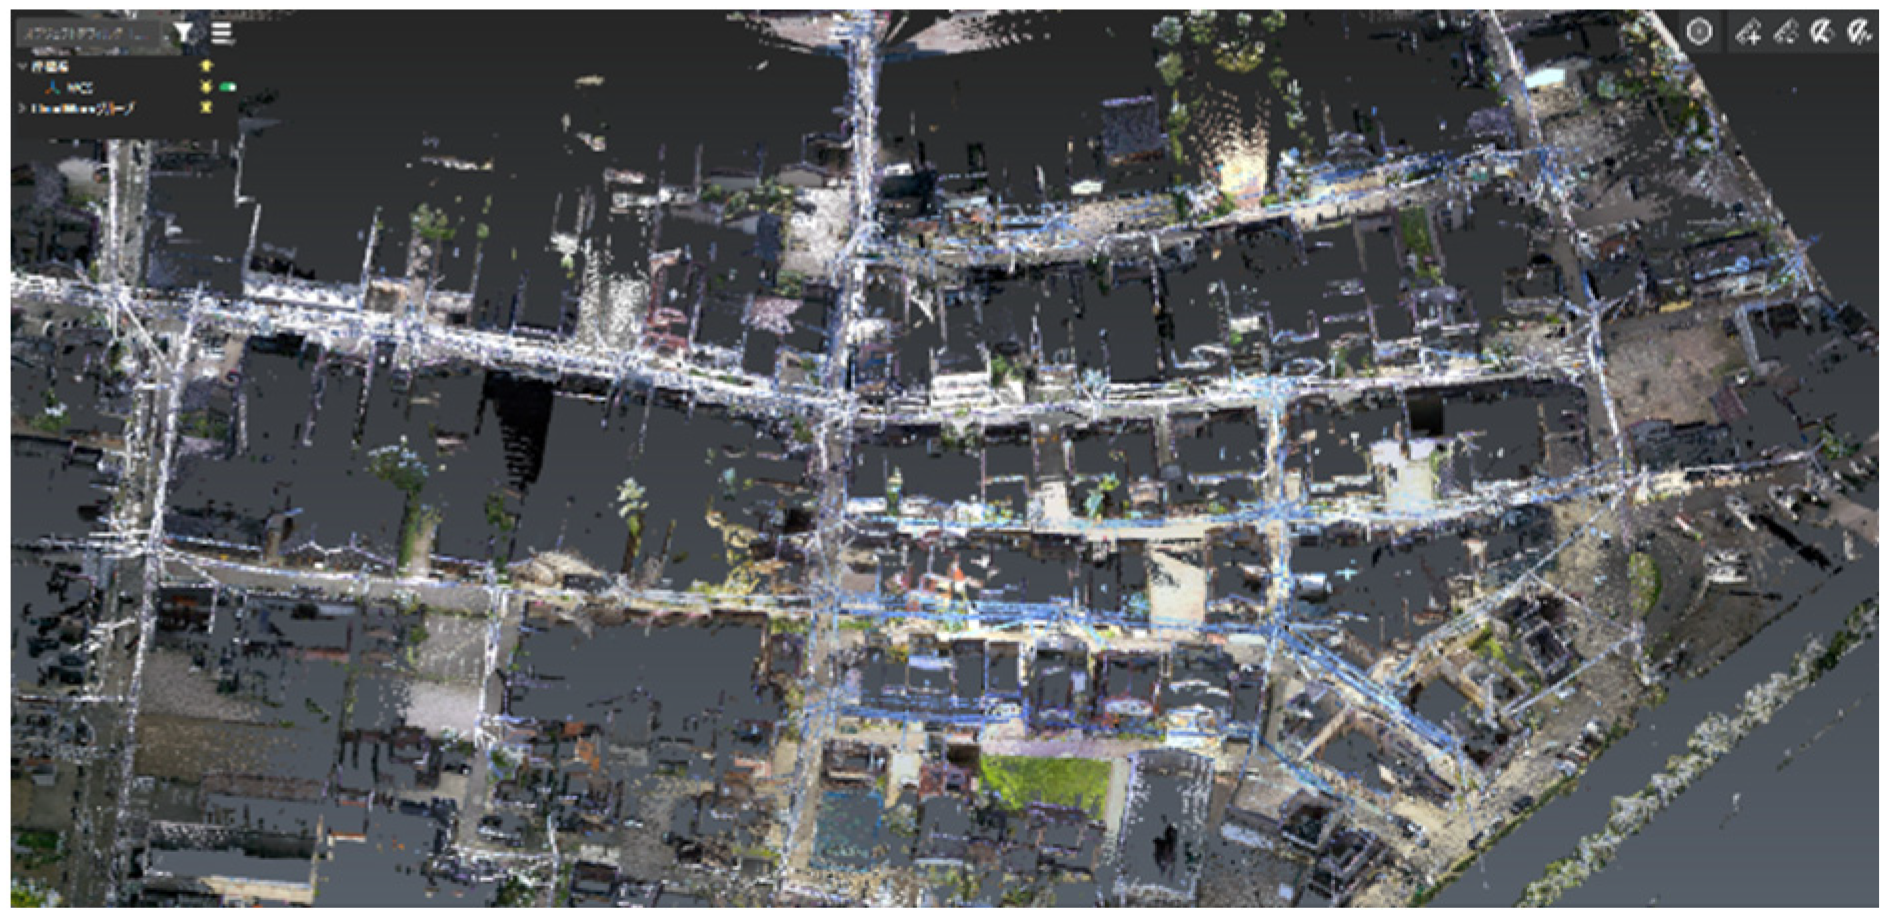
First, the point-cloud data captured with the Leica BLK360 were imported into Leica Cyclone FIELD 360 (
Figure 3). As the scans are initially displayed around their respective acquisition locations, small lateral misalignments may occur during field capture. To minimize such misalignment, Leica Cyclone FIELD 360 installed on the iPad was used to check scan connectivity on site and to make incremental adjustments so that adjacent scans overlapped consistently.
Next, Leica Cyclone REGISTER 360 was used to integrate the point clouds from all scan stations (
Figure 4). This process—referred to as
registration—aligns individual scans into a unified coordinate space based on shared targets (e.g., spherical markers or planar targets) and/or geometric feature correspondences. The bundle error was 0.009 m, the overlap was 45%, and the strength was 55%.
In Leica Cyclone REGISTER 360, multiple scans are grouped as links and jointly optimized through a bundle adjustment, which simultaneously corrects scan positions and orientations across the dataset. A critical factor for robust alignment is overlap: the greater the shared area between adjacent scans, the more stable the automatic matching becomes.
Two complementary registration strategies can be used in combination: (1) target-based registration (e.g., spherical targets and checkerboards) and (2) cloud-to-cloud registration, which aligns scans by matching geometric features within the point clouds. In target-based workflows, identical targets detected in each scan are associated using the Match Targets function; incorrect correspondences can be removed and reassigned manually as needed. Overlap quality is internally quantified (e.g., by the number of shared points and match ratios between neighboring scans) and can be inspected through link colors and registration quality indicators within the software.
In Leica Cyclone 3DR, the workflow begins by importing the registered point-cloud data generated in Cyclone REGISTER 360 via [Import], and confirming the coordinate system and units before placing the dataset in the project (
Figure 5). Next, performing a CloudWorx project conversion reorganizes the point cloud into a structure that is easier to link with CAD workflows, allowing lightweight referencing while preserving station information as well as intensity and color attributes. After conversion, outliers and artifacts are removed using [Cleaning] tools: isolated points, dynamic-object contamination, and reflective noise are filtered out; irrelevant areas are clipped; and, where necessary, thinning and/or density normalization is applied. Surface generation is performed using [Surface Modeling] → Scan to Mesh, in which surface normals are estimated and the point cloud is triangulated to generate polygonal faces. Finally, the model is exported as OBJ/FBX for downstream use. Once noise removal is complete, the processed model is exported in obj format.
After registration, consistency was evaluated using residual errors and link-quality indicators. When links exceeded the acceptance threshold, we examined potential causes—insufficient overlap at the relevant station, contamination by moving objects, and/or incorrect target correspondences—and iteratively refined the dataset by disabling the problematic link, re-registering the affected scans, and re-optimizing the bundle adjustment until global accuracy stabilized. In addition, scan alignment was visually inspected from multiple viewpoints (e.g., top and side views) to verify overlap and to confirm that no double images were present in linear features such as building façades and guardrails. Finally, the integrated point cloud was exported in a format that preserves essential attributes (color and intensity) and scale, in preparation for downstream processing in Cyclone 3DR (noise removal and meshing) and subsequent import into Unity (2022.3.36f1). Through this workflow, we generated a highly accurate, measurement-based integrated point-cloud dataset reflecting the real environment and established a 3D simulation-ready virtual setting as the foundation for tsunami disaster-prevention education.
3.4. Simulation Development: Import into Unity, Fluid Configuration, and Walk-Through Setup
The 3D streetscape model exported in obj format was imported into the Unity Editor by placing the file in the Assets folder. After import, the model scale and materials were adjusted and verified to ensure correct visualization and spatial consistency within Unity.
Tsunami inundation behavior was reproduced in Unity using Zibra Liquid. After installing the package, a Zibra Liquid object was added to the scene, and a Liquid Container (bounding box) defining the simulation domain was positioned to cover the target area. The container size was tuned to the minimum necessary extent that included the building blocks, roads, and river corridor. In this study, the purpose of these models is not to reproduce engineering-accurate hydrodynamic or structural responses, but to convey key qualitative features relevant to evacuation decision-making (e.g., spatial extent of inundation).
To generate the inflow representing tsunami intrusion, an Emitter was added and configured by specifying the outlet position, orientation, and discharge rate. For tsunami-like phenomena in which water volume rises rapidly within a short period, a time-varying discharge profile provides a more realistic representation than a constant-rate inflow.
For collision handling, colliders were assigned to the terrain and building meshes and registered as Zibra Colliders/Manipulators, enabling the flow to interact with the environment and be blocked by walls and other obstacles (
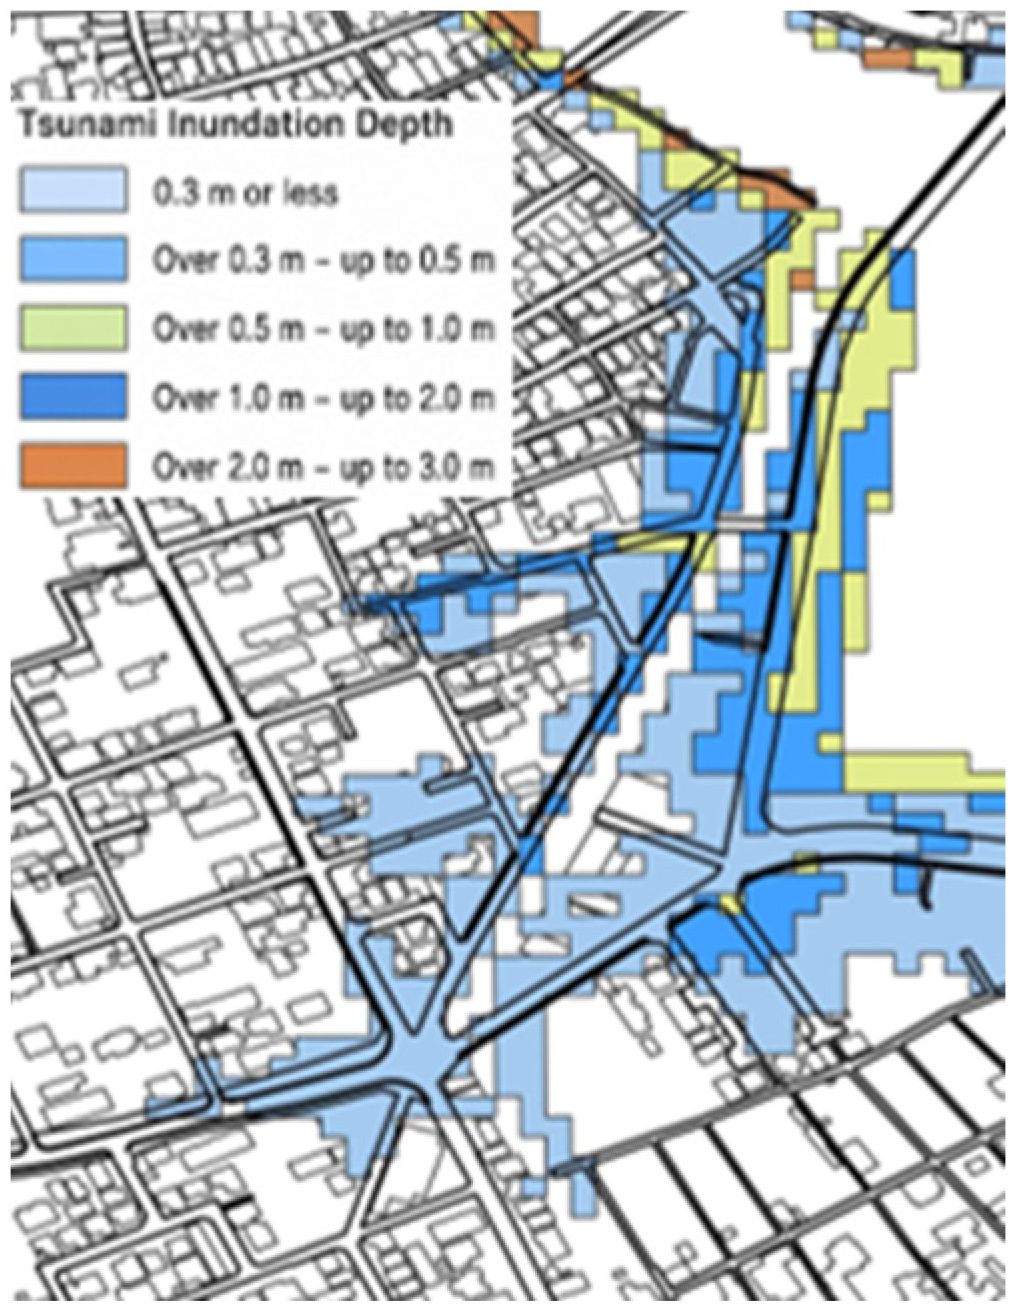
Figure 6). Through these settings, we constructed an experiential learning environment in which participants can intuitively understand tsunami approach direction, inundation extent, and flow behavior on a realistic streetscape derived from point-cloud measurements. The inundation scenario was configured with reference to the Kanazawa City published tsunami inundation assumption zone (
Figure 7). The Zibra Liquid simulation was not designed as a physically calibrated hydrodynamic model. The purpose of the inundation representation was educational visualization, namely to help participants recognize the approximate spatial extent and direction of tsunami inundation in relation to the published tsunami inundation assumption zone. Therefore, parameters such as flow velocity, discharge volume, arrival time, and water depth should not be interpreted as engineering predictions.
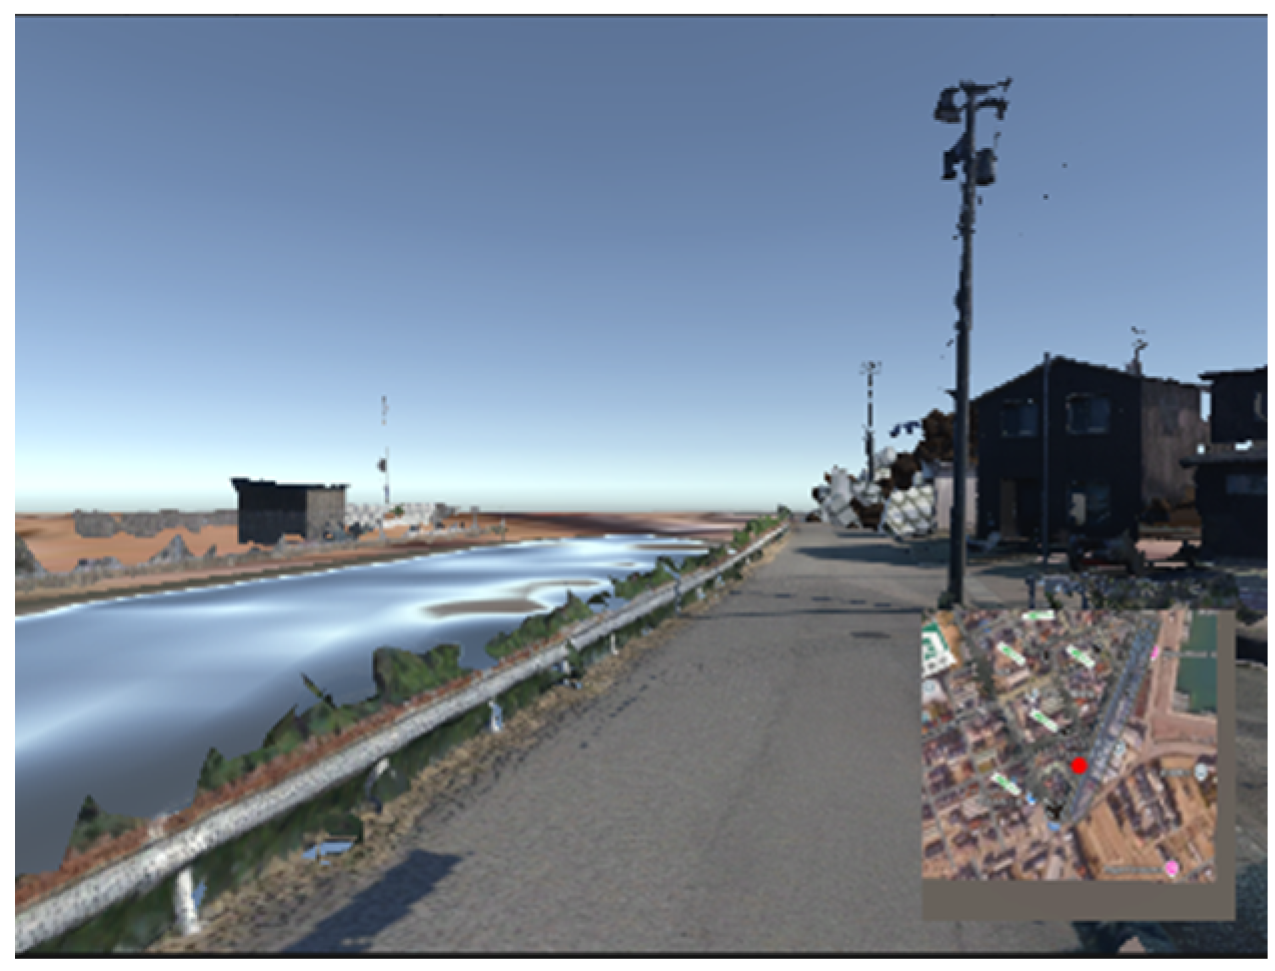
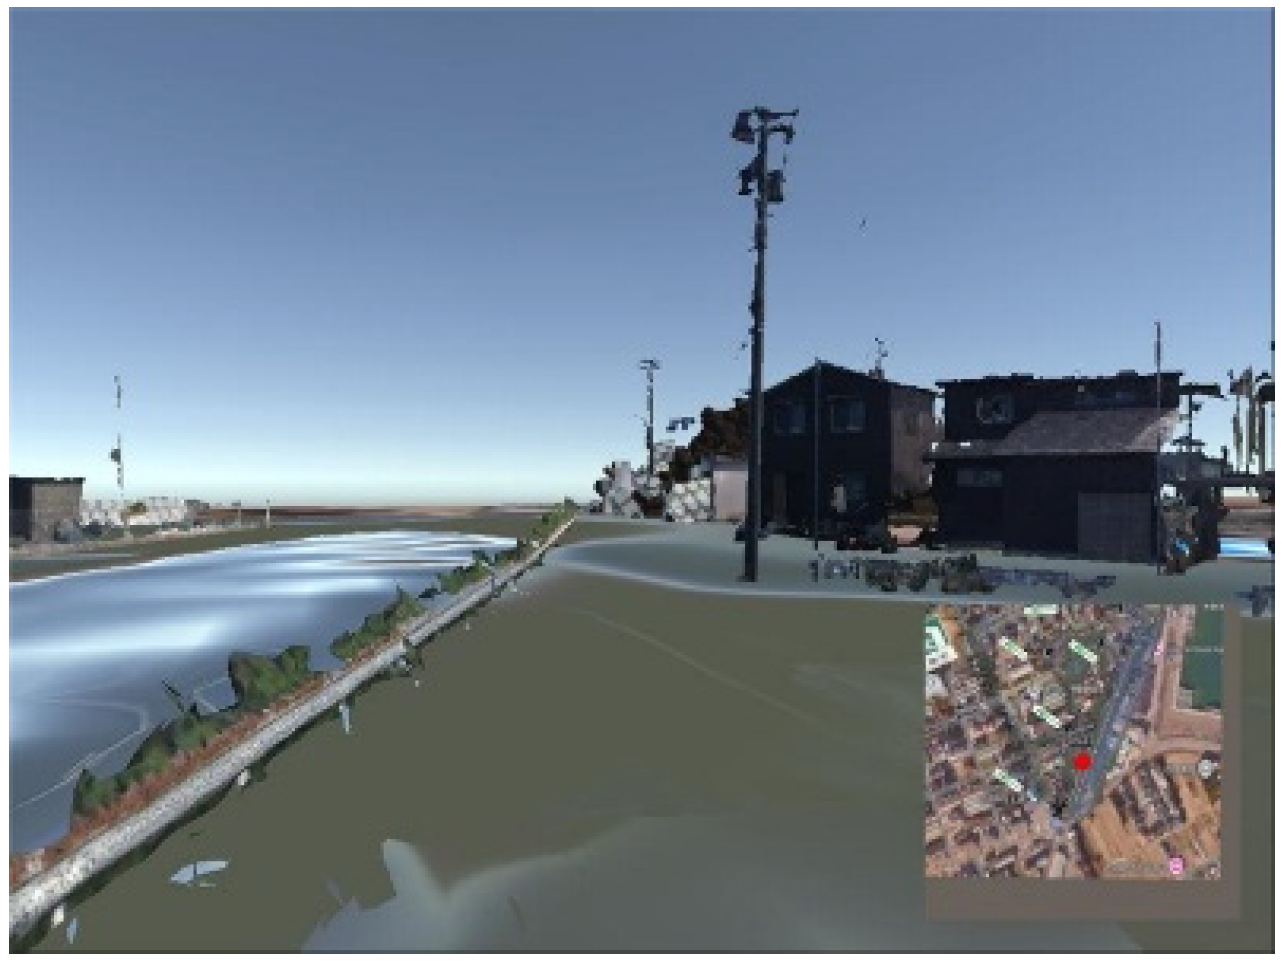
To compare how the presence of tsunami inundation influences evacuation decision-making, we implemented two experimental conditions—“tsunami” and “no-tsunami”—within the same Unity scene using the Zibra Liquid-based fluid model (
Figure 8 and
Figure 9). In the tsunami condition, participants were able to visually understand the expected inundation extent based on the published tsunami inundation assumption zone.
During the experience, participants could switch between conditions by pressing the Enter key, enabling immediate, within-location comparisons of perception and route-choice behavior under inundated versus non-inundated circumstances. This implementation provided an experimental platform for evaluating the effects of inundation information on spatial understanding, risk perception, and the consideration of alternative routes, in combination with verbal protocols, behavioral logs, and questionnaire-based measures.
We configured the fluid scenario to account for river run-up, which is a critical mechanism in real tsunami events, rather than assuming uniform inland inundation from the shoreline. By driving the inflow along the river channel, the simulation allows the wave to penetrate inland and enables users to visually recognize possible changes in inundation movement and apparent water-level conditions around bridges and channel constrictions. For the walk-through configuration, we implemented custom scripts developed in Visual Studio (2022) and imported them into Unity. The scripts were written in C# and placed in the Assets/Scripts directory. To provide intuitive movement control, JoyToKey (v7.3) was used to map controller inputs to keyboard commands for navigation. Because the point-cloud-derived streetscape model contains small height irregularities, we developed an additional script to stabilize the user viewpoint by keeping the camera (and thus the user’s perceived eye height) constant during movement.
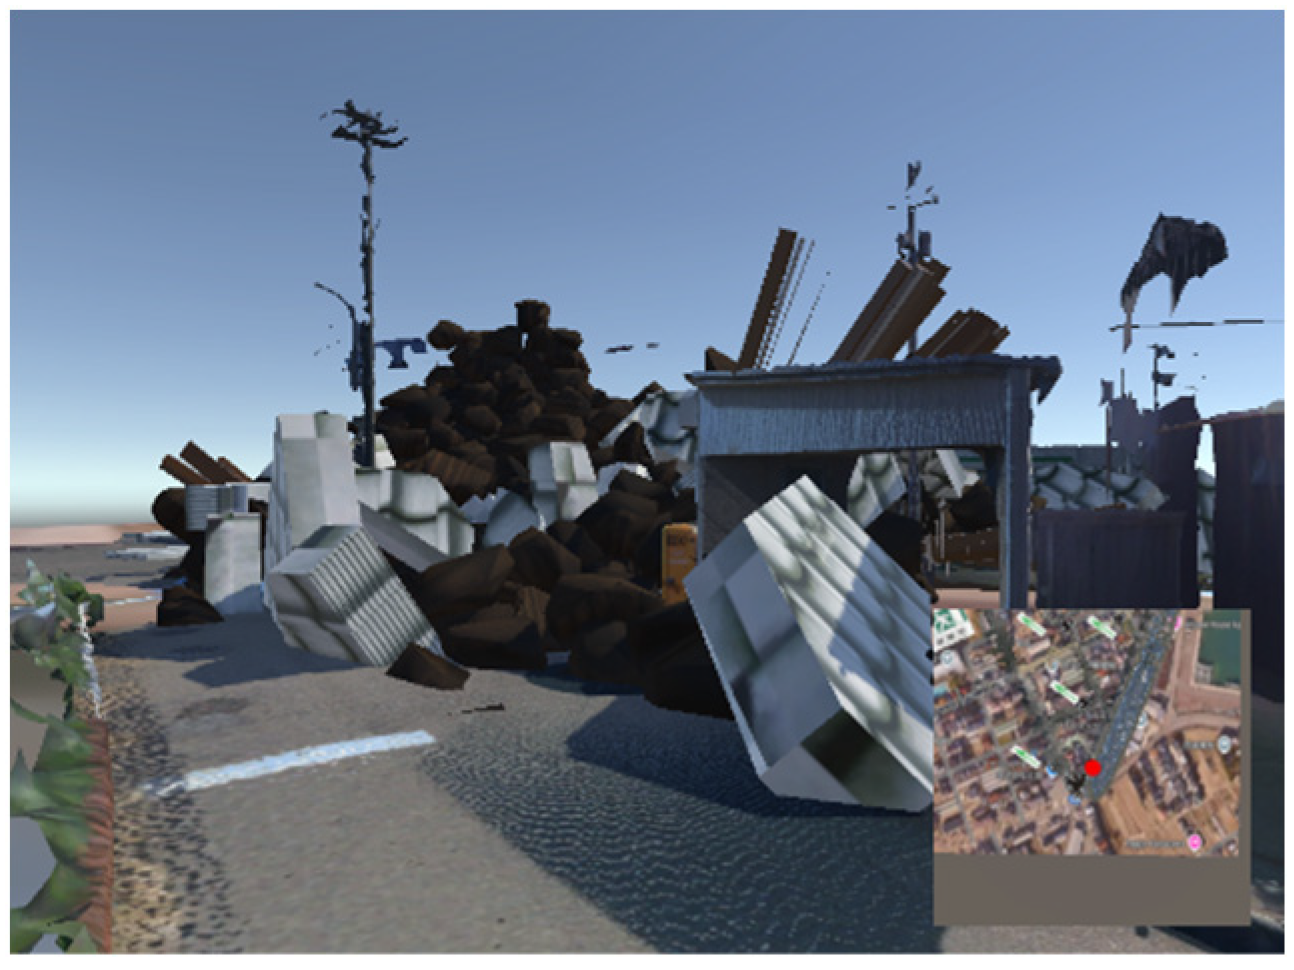
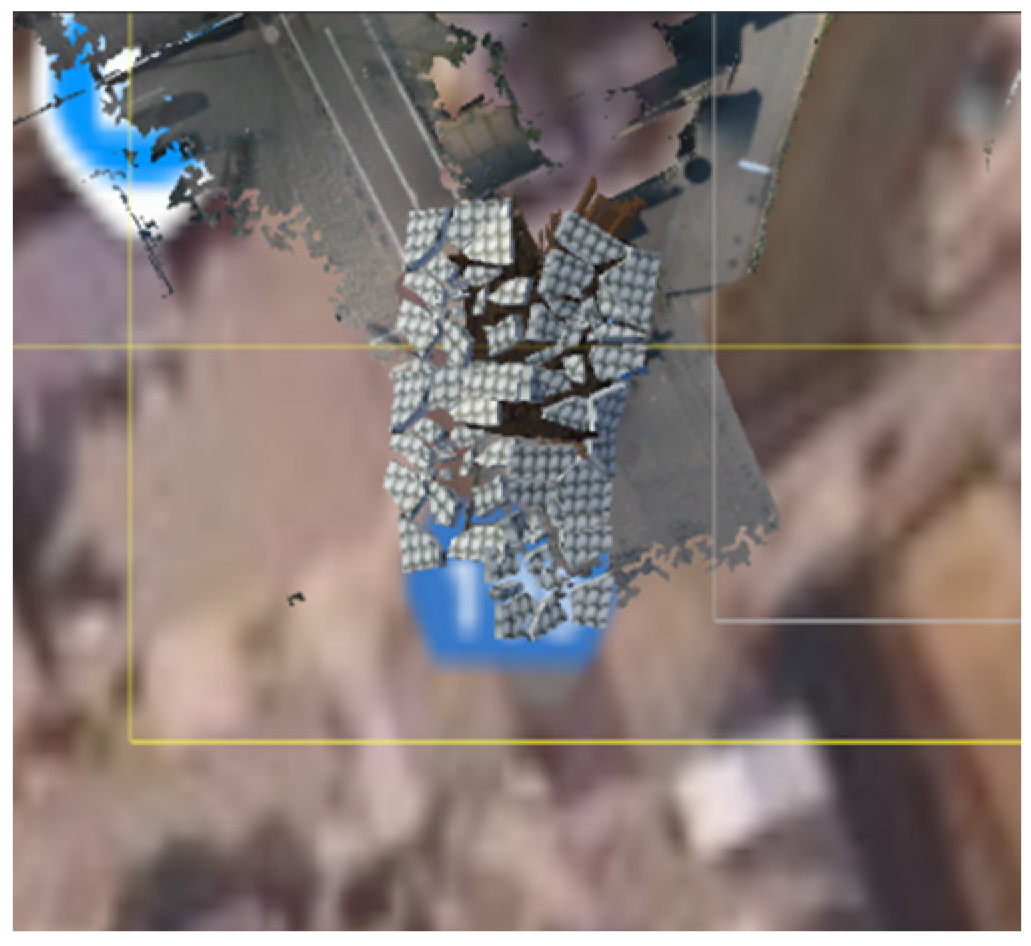
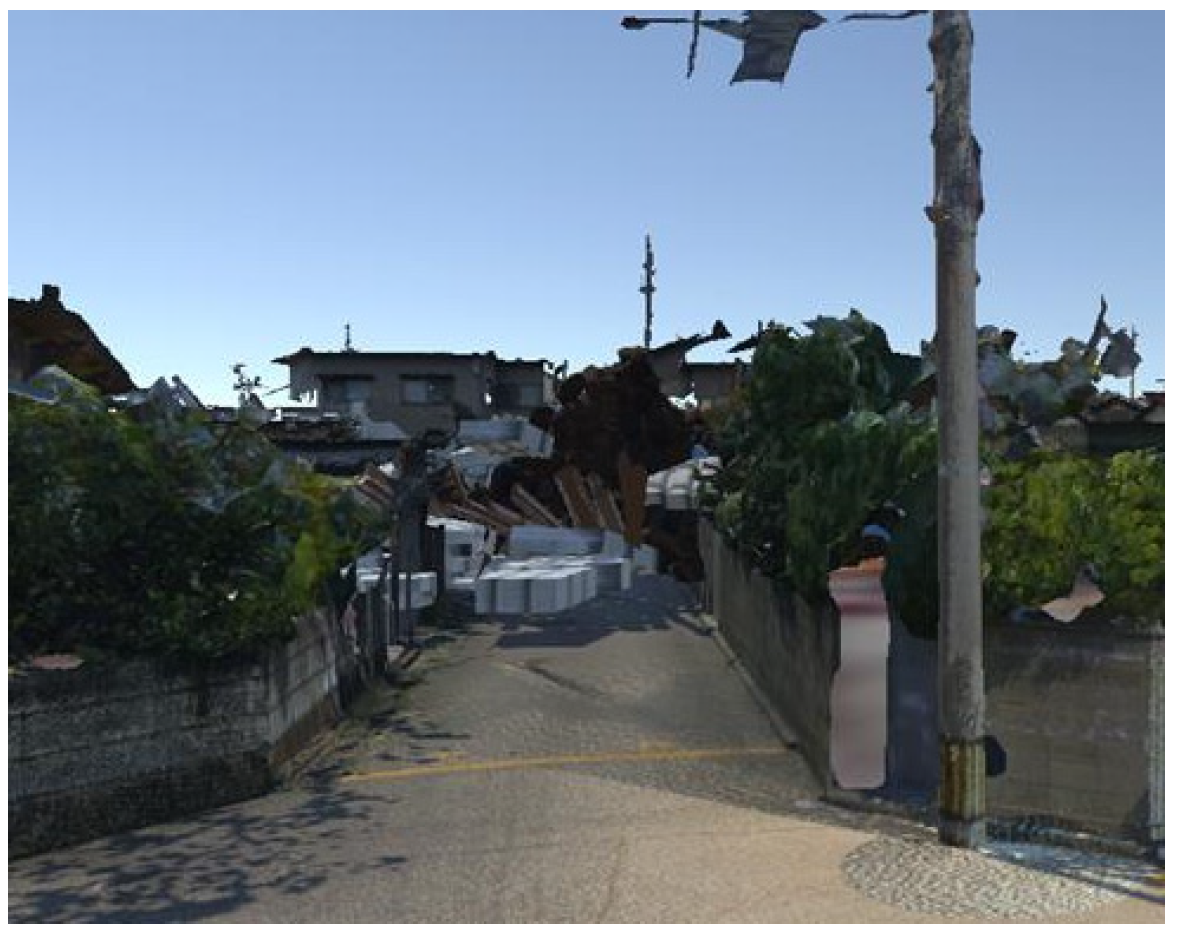
To reproduce building collapse and enable learners to perceive changes in accessibility that directly affect evacuation behavior, we introduced a physics-based destruction representation in Unity. Using RayFire (1.80), collapse was not treated as a uniform fragmentation process; instead, buildings were decomposed into components such as the roof, exterior walls (including the structural frame/columns). We assigned different polygon subdivision densities and fracture patterns to each component to reflect differences in material and structural behavior (
Figure 10). For example, roof elements were modeled to produce relatively large fragments that tend to fall and accumulate, whereas regions around windows were modeled to fragment into smaller pieces. This approach avoided monotonous debris fields and allowed the simulation to reproduce evacuation-relevant environmental changes after collapse, including localized road blockages, reduced effective street width, and loss of visibility (
Figure 11 and
Figure 12).
In practice, fracture settings were adjusted as follows: columns used Splinters to encourage vertical cracking with a lower Amount; and the main building body used Voronoi with a higher Amount to increase fragmentation complexity.
While RayFire provides physically based destruction, real-time fracture simulation is computationally demanding. When executed concurrently with a point-cloud-derived urban block model, it can cause substantial framerate drops, thereby disrupting the continuity of the experiential learning process. To address this issue, we pre-recorded (cached) the collapse animation using Unity’s recording/cache functionality and adopted a playback-based approach in which the recorded motion is triggered at runtime by a “start playback” event. This method ensures both reproducibility (i.e., identical collapse behavior under the same condition) and stable performance, making the system more suitable for deployment in educational settings.
In addition, collapse representation should not be limited to enhancing visual realism; it must be explicitly linked to the learning objectives of evacuation planning. Accordingly, we defined approximately five locations within the district where collapse-induced route obstruction could occur, where residents would be expected to consider alternative routes. At these locations, debris accumulation and collapsed structural elements alter the passable space, requiring participants to make decisions based on an assumed “impassable” state—such as detouring, connecting to higher ground, and maintaining safe visibility.
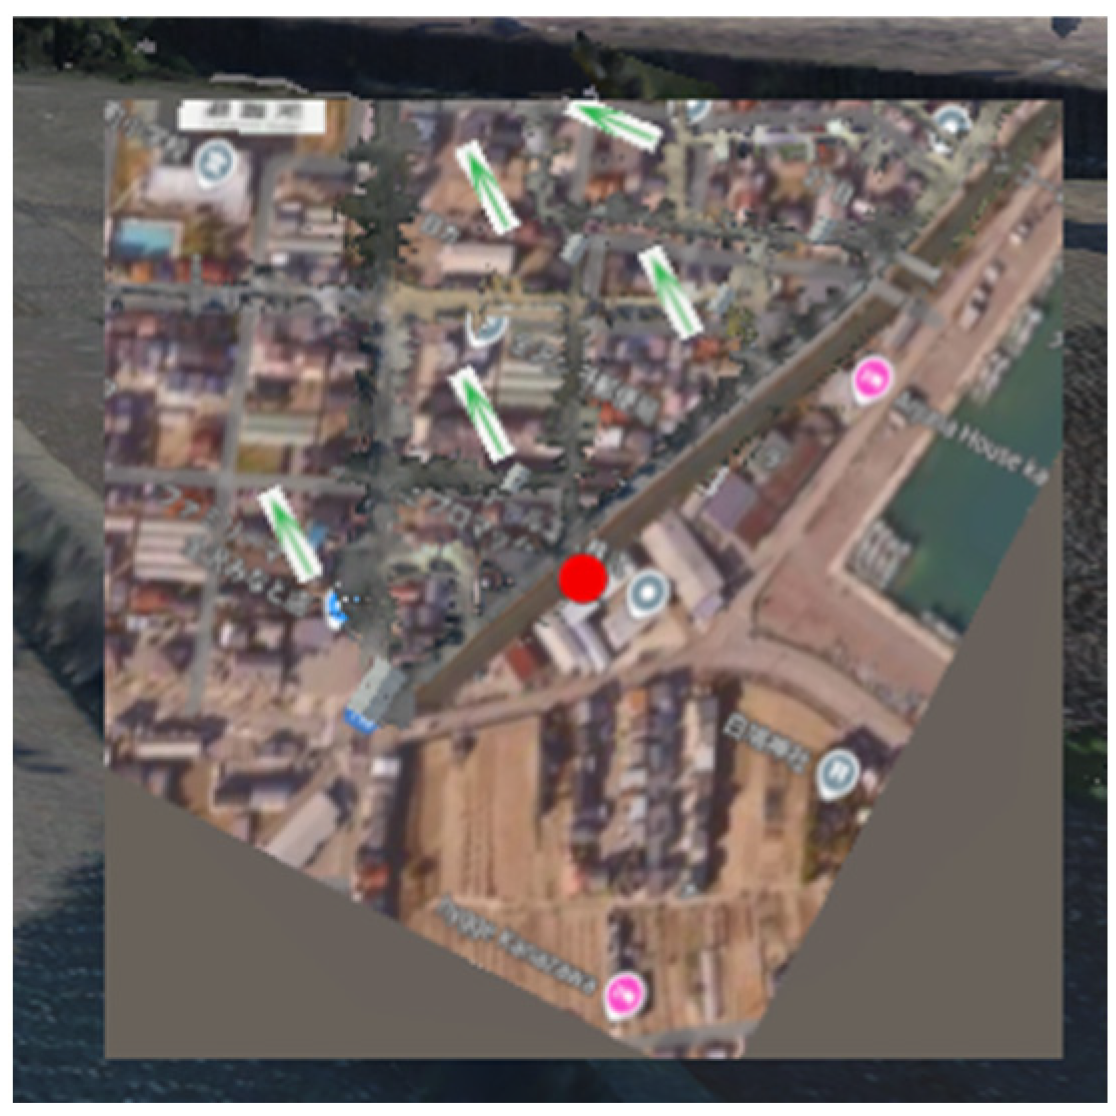
To prevent learning loss caused by participants becoming disoriented in the 3D environment, we continuously displayed an aerial-photo-based minimap (overview map) in the lower-right corner of the screen (
Figure 13). Although the point-cloud-based streetscape closely resembles the real environment, first-time users may find it difficult to grasp the overall spatial structure when the viewpoint is fixed at street level, which can shift exploratory behavior toward resolving “getting lost” rather than learning evacuation strategies. The minimap therefore provides an overview reference that supports both local (walk-through) and global (district-scale) spatial cognition simultaneously. The participant’s position is shown as a red marker that follows movement in real time, facilitating identification of current location and understanding of the relative relationship to the destination (distance and direction). This reduces cognitive load devoted to spatial orientation and enables participants to allocate attention to the intended learning task evacuation decision-making and alternative route planning based on inundation extent and collapse locations. Moreover, aerial imagery intuitively conveys building layout and road geometry and functions as a paper-map-like reference frame, which may also connect naturally to residents’ existing spatial memory. In this way, the minimap contributes not only to usability but also to more effective information presentation that supports situational awareness and decision-making processes during disasters.
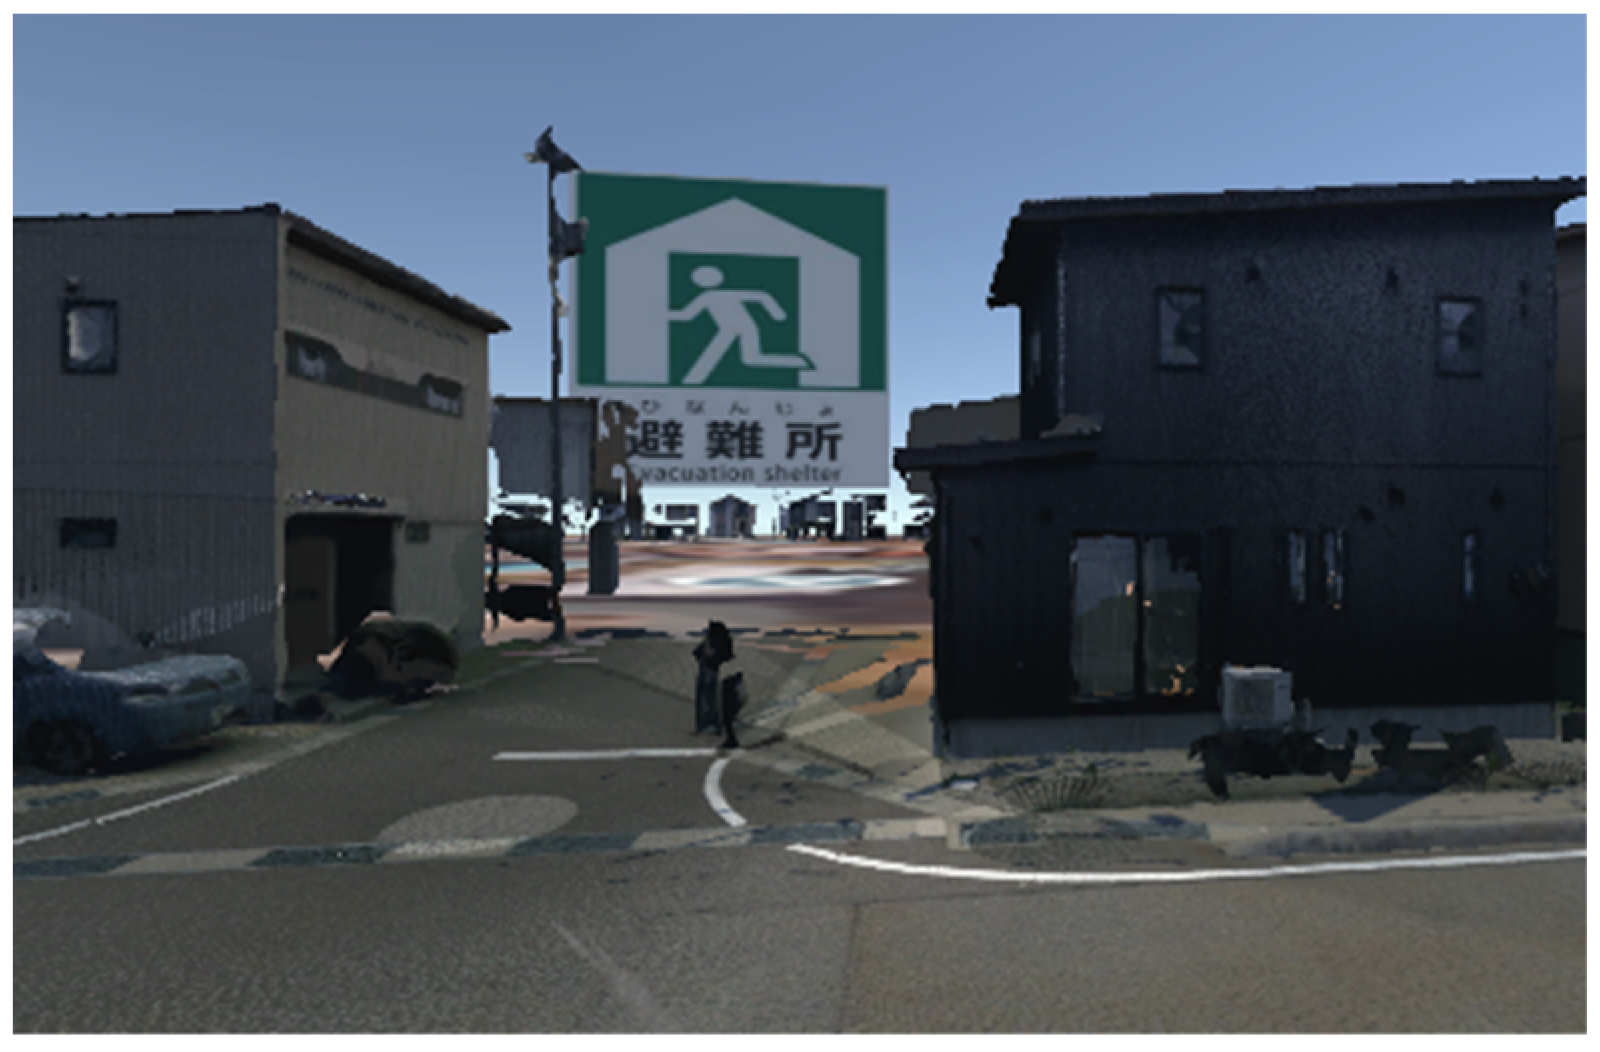
To support participants’ understanding of evacuation behavior, we placed visual guidance elements in the simulation, including pictograms indicating the evacuation shelter and arrows indicating evacuation direction [
57] (
Figure 14,
Figure 15 and
Figure 16). These elements were designed with reference to the national framework for disaster-prevention signs and symbols and were adopted as standardized representations that can be interpreted intuitively by a wide range of users. Standardization of signage helps reduce variability in interpretation attributable to differences in age or local familiarity, thereby contributing to shorter search times and faster decision-making in emergency contexts. In addition, by presenting directional information within the user’s field of view, the system supports wayfinding even when route changes are required due to inundation or collapse-related blockages. This encourages participants to consider alternative routes and promotes learning that emphasizes proactive, self-directed evacuation decision-making.
3.5. Experiment: Experience with the Developed Simulation
Before the experience, participants were informed that the inundation and collapse representations were intended for educational visualization and should not be interpreted as engineering predictions of actual tsunami flow velocity, water depth, arrival time, or structural failure processes. The simulation was designed to support recognition of the approximate inundation area, possible obstruction points, and the need to consider alternative routes, rather than to teach physically calibrated tsunami behavior.
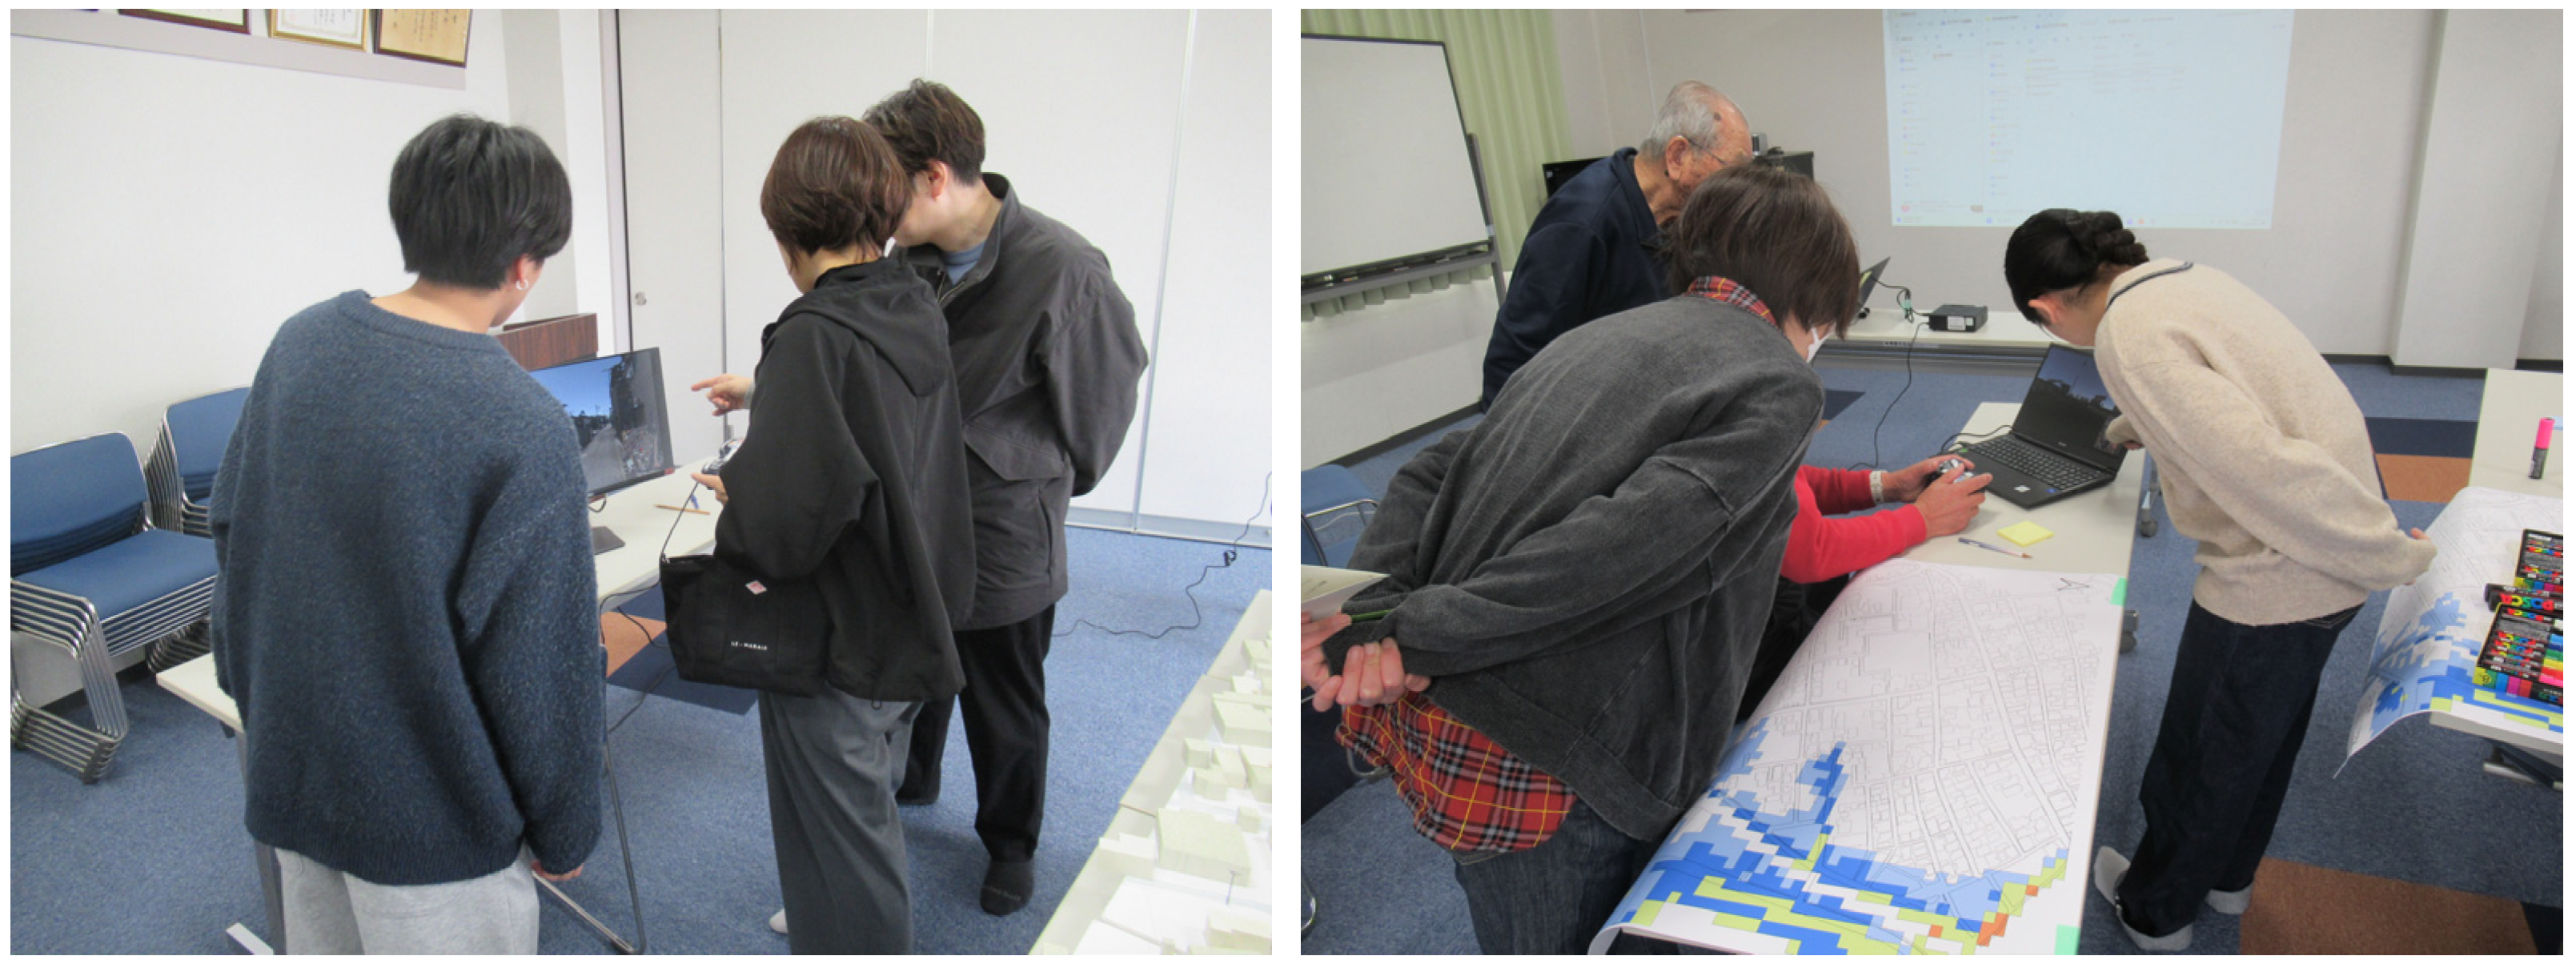
The experience was implemented as a desktop-based 3D simulation rather than an HMD-based VR system. Participants viewed the reconstructed urban environment on a PC monitor and navigated the scene using a controller. Accordingly, the system differs from immersive VR in terms of field of view, embodied perception, and motion-sickness risk. The training session was conducted on 29 March 2026. To emphasize discussion and collaborative reflection, participants took part individually or in small groups of two to four. When participants took part in groups, one participant operated the controller while the group discussed evacuation decisions and carried out the tsunami evacuation training (
Figure 17). The training used a Unity-built application exported from the development environment. When the application was launched, the scenario began automatically with an audio announcement stating that a tsunami had occurred and instructing participants to start evacuating. Movement was controlled with the controller’s stick input, enabling participants to navigate the desktop-based 3D streetscape with intuitive camera control.
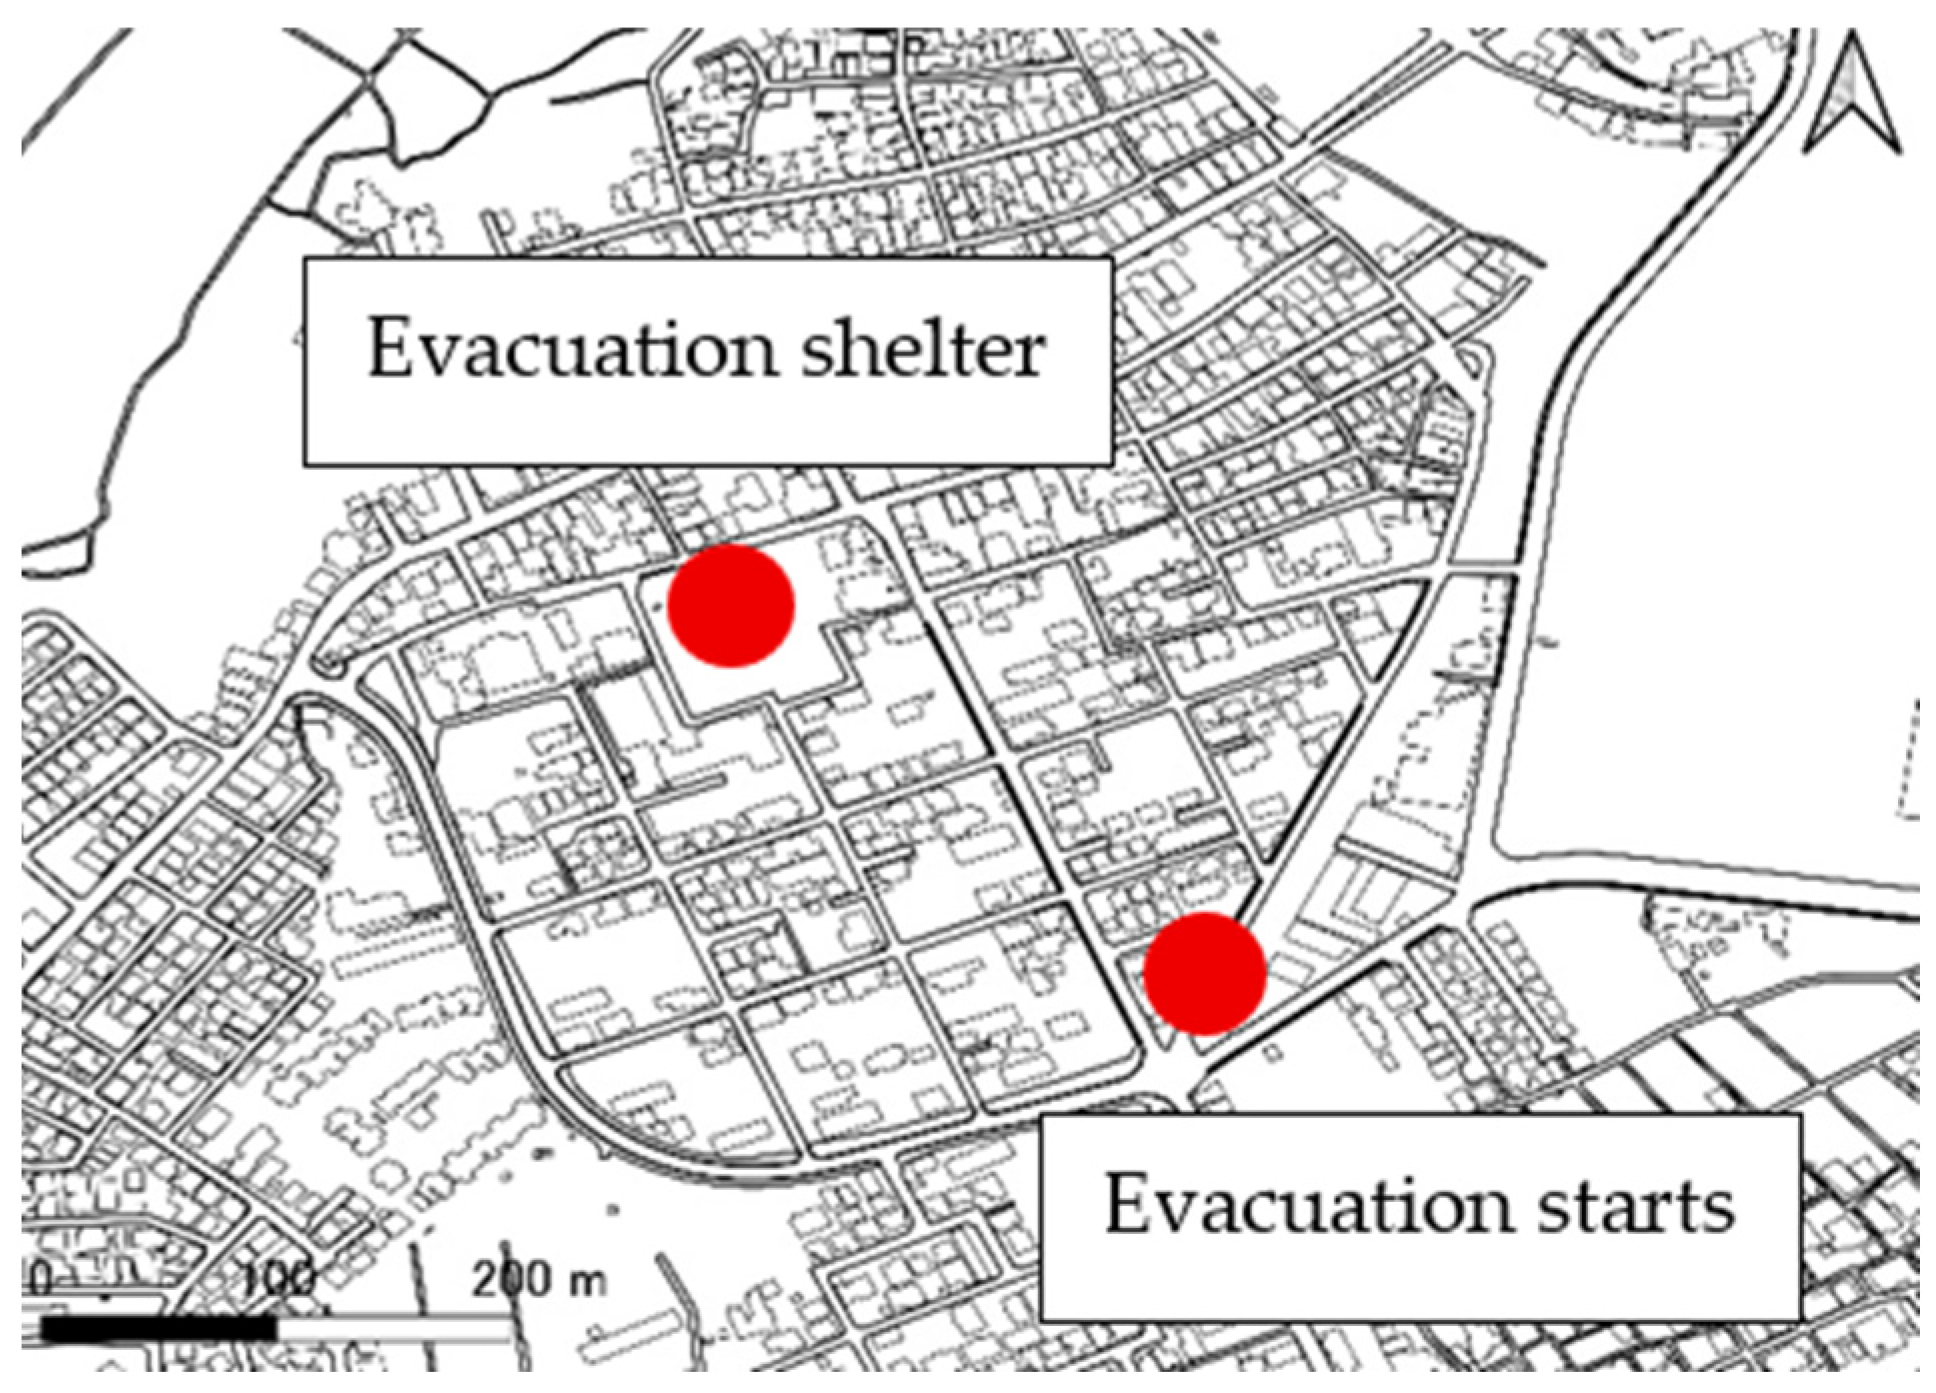
The evacuation starting point was set near Kanazawa Port, with an explicit focus on helping participants understand the spatial extent of the predicted tsunami inundation area. After confirming the inundation zone, participants initiated evacuation toward the designated shelter, Ono-machi Elementary School (
Figure 18). During navigation, participants were instructed to avoid entering inundated areas. In addition, because building collapse is a plausible hazard during tsunami evacuation, several buildings were intentionally collapsed within the simulation to create road blockages, requiring participants to detour rather than follow the shortest route. The training ended when participants arrived at the elementary school after exploring several possible routes.
A key feature of this training is that it enables participants to intuitively understand characteristics that are difficult to grasp through conventional two-dimensional materials such as paper maps—for example, street narrowness—through embodied movement in a 3D environment. In particular, by introducing dynamic obstacles such as road closures caused by building collapse, participants were required to make situational, adaptive decisions rather than simply memorizing a fixed route. To examine how this experience contributed to the personalization of risk awareness (i.e., making it feel personally relevant), we analyze responses from a post-experience questionnaire.
Questionnaire surveys were administered before and after the training experience. All questionnaire items were rated on a five-point Likert scale, with higher scores indicating stronger agreement or more positive evaluations. Missing responses were excluded on an item-by-item basis; therefore, the number of valid responses differed across items. Free-response comments were reviewed and categorized thematically by the authors to summarize major themes related to hazard recognition, behavioral intention, safety, and requests for improvement.
3.6. Questionnaire Design and Statistical Analysis
The questionnaire items were developed based on the learning objectives of the program and prior studies on tsunami evacuation education, disaster-prevention learning, and ICT-based educational environments. The items were designed to measure perceived hazard recognition, spatial understanding, self-efficacy, usability, perceived realism and reliability of the 3D model, behavioral intention, and factors promoting learning. To ensure content validity, the questionnaire was reviewed by the authors, including researchers with expertise in disaster prevention, urban planning, and 3D visualization.
Because the items used five-point Likert scales and only a limited number of complete pairs were available, we examined pre–post changes with the Wilcoxon signed-rank test for conceptually corresponding item pairs, and computed effect sizes as r = Z/√N. Since the same five corresponding item pairs were compared, multiple testing could increase the risk of Type I error inflation. Therefore, we applied a Bonferroni-adjusted significance threshold of α = 0.01 in addition to reporting the uncorrected p-values. We treated these analyses as exploratory, given the small sample and the fact that some pre- and post-experience items corresponded conceptually rather than being identical.
We also computed Cronbach’s alpha for each multi-item construct. Given the small sample, we read these coefficients as supplementary indicators rather than as definitive evidence of scale reliability.
4. Results
Twenty-five residents participated in the experience. The demographic characteristics, residential background, and prior disaster-prevention experience of the participants are summarized in
Table 2. Of these, 23 completed the pre-experience survey, 24 completed the post-experience survey, and 22 provided complete pre/post pairs. The exploratory pre–post statistical analysis was conducted using the 22 complete paired responses. For item pairs with missing post-experience responses, the number of valid pairs was adjusted accordingly. One participant discontinued after the pre-survey, and two participants joined the session after the pre-survey had been administered and therefore provided post-experience responses only. Demographic distributions reported below are based on all 25 participants, including non-responses with valid demographic data. Participants in their 50s and 70s accounted for the largest proportions, with seven participants in each group (28% each), followed by those in their 40s and 80s, with four participants in each group (16% each). Participants in their 60s represented the smallest group, with two participants (8%). Overall, the participants were predominantly middle-aged and older adults, particularly those in their 50s to 70s, suggesting that many of the participants were local residents with a relatively high level of awareness of disaster prevention.
The majority of participants had seen a hazard map (68%); however, only 12.0% reported that they understood its contents. This finding suggests that, while hazard maps were relatively familiar to participants, many had not developed a sufficiently deep understanding of the information presented in them.
Regarding prior experience with disaster prevention education, including lectures, study sessions, and hands-on events, 16 participants answered “yes” (64%), whereas eight answered “no” (32%); one participant did not respond. Although more than half of the participants had previously participated in some form of disaster prevention education, their participation in the present experience suggests a need for alternative learning approaches that go beyond conventional paper-based materials and lecture-style instruction.
In terms of prior experience with 3D models, VR, games, or related technologies, 15 participants reported no experience (60%), eight reported limited experience (32%), and no participants reported frequent experience; two participants did not respond. This result indicates that most participants were unfamiliar with 3D/VR technologies and that, for many, the present program may have been their first experience with desktop-based 3D disaster-prevention learning.
4.1. Pre-Experience Perceptions (D Items, N = 23)
Table 3 presents the descriptive statistics for the six items related to disaster prevention knowledge and confidence measured before the experience using a five-point Likert scale (
N = 23). In particular, D1, which measured participants’ awareness of hazardous locations, showed the lowest mean score (M = 2.65). This suggests that participants did not have a sufficient understanding of specific hazardous locations within their own living areas. Although D4, which measured self-efficacy, showed the 2nd highest mean score among the six items (M = 3.00), it remained at the midpoint of the scale. Therefore, participants’ confidence in their ability to take appropriate evacuation actions was not sufficiently high before the experience.
4.2. Perceptions of Disaster Prevention Learning (E Items, N = 23)
Table 4 shows the descriptive statistics for the E items, which assessed participants’ awareness and self-evaluated abilities regarding disaster prevention learning before the experience. E1, representing a locally grounded risk awareness, showed a relatively high mean score (M = 3.83), whereas E4, representing the clarity of evacuation timing, showed the lowest mean score (M = 3.00).
These findings suggest that participants already tended to regard disasters as personally relevant before the experience. However, the criteria for determining when to initiate evacuation remained unclear. This indicates a potential gap between general disaster awareness and the ability to make concrete evacuation decisions.
4.3. Post-Experience Learning Effects (F Items, N = 22–24)
Table 5 presents the descriptive statistics for the F items, which measured the learning effects after the experience. The number of valid responses ranged from 22 to 24 across the items because of missing responses and one discontinued case.
F1, which assessed participants’ understanding of hazardous locations, showed the highest mean score (M = 4.29). This suggests that the 3D model was particularly effective in helping participants visually recognize hazardous locations. Although F4, which assessed the clarification of evacuation timing, showed the lowest mean score among the F items (M = 3.67), it still increased by 0.76 points compared with the corresponding pre-experience item D3 (M = 2.91).
4.4. Changes in Conceptually Corresponding Pre- and Post-Experience Items
An exploratory pre–post comparison was conducted using the complete paired responses (
Table 6). Because the questionnaire items were measured on five-point Likert scales and the sample size was limited, the Wilcoxon signed-rank test was used. We conducted a descriptive comparison between pre-experience items and conceptually corresponding post-experience items.
This descriptive trend suggests that the experiential learning program using the 3D model may have helped participants recognize and understand hazardous locations more concretely.
The largest improvement was observed for D1–F1, which assessed the understanding of hazardous locations, with a mean increase of 1.591 points, p < 0.001, and an effect size of r = 0.718. These results indicate that the experience helped participants identify local hazardous locations more clearly and reflect on possible evacuation routes. However, because the sample size was small and the item pairs were conceptually corresponding rather than identical, these results should be interpreted as exploratory.
We report the Cronbach’s alpha values in
Table 7 only as a rough reference. With 22–24 valid responses per item group, these coefficients can vary considerably, so we do not treat them as firm evidence of scale reliability. They are included only to give a supplementary sense of response consistency, and confirming the reliability of these scales will require larger samples.
4.5. Evaluation of the 3D Model (G Items, N = 24)
Table 8 presents the evaluation results for the eight items related to the reproducibility, reliability, and educational usefulness of the 3D laser scanner-derived model.
Among the items, G4, which assessed whether the 3D model could make evacuation behavior more concrete than paper maps, and G5, which assessed the sense of reliability derived from the fact that the model was based on measurement data, both showed the highest mean scores (M = 4.58). These results suggest that the measurement-based streetscape model was perceived as concrete and useful for imagining evacuation situations.
Although G2, which assessed the understanding of terrain and elevation differences, showed a slightly lower mean score (M = 3.88), this may reflect the local characteristics of the study area, where steep topographical changes are relatively limited.
Although G8 received a relatively high score, this result should be interpreted carefully. A high perceived realism score does not indicate that the inundation and collapse simulations were physically accurate. Rather, it suggests that participants perceived the visual scenario as concrete and useful for imagining evacuation situations. To avoid overconfidence or misunderstanding, educational implementations of this system should explicitly explain that the simulated water movement, water depth, flow velocity, arrival time, and collapse behavior are simplified visual representations and not objective predictions of actual disaster dynamics.
4.6. Usability, Behavioral Intention, and Factors Promoting Learning
The score for ease of operation, H1 (M = 3.67), was lower than those of the other items, suggesting that controller operation may have placed a burden on older participants (
Table 9).
The intention to consider mutual assistance with neighbors, I5 (M = 4.63), and the intention to participate in local disaster prevention drills, I4 (M = 4.46), received especially high evaluations.
Among these items, J1, which assessed whether participants were able to regard the disaster as personally relevant, showed the highest mean score (M = 4.65).
These results indicate that the experience was not merely perceived as easy to understand but was associated with the formation of behavioral intentions and a sense of personal relevance among participants.
4.7. Safety and Summary of Free-Response Comments
Regarding discomfort associated with the desktop-based 3D experience, 23 of 25 participants (two responses were missing, 92.0%) reported no discomfort; among valid responses, all 23 reported no discomfort (
Table 10). No participants reported severe discomfort. Although some variation was observed among participants, the overall score was not excessively high.
These results suggest that the system can be implemented as an educational tool for local residents while maintaining a high sense of realism and ensuring an acceptable level of safety.
In the free-response comments, participants mentioned hazardous locations such as riverside areas, impassable roads, and areas with many old buildings. As actions they wished to take after the experience, many participants referred to confirming evacuation routes, discussing evacuation with family members, and reviewing disaster preparedness measures.
On the other hand, participants also suggested several areas for improvement, including enhanced operational support, more detailed visual and scenario representations, and the expansion of the experience area to better reflect local conditions.
5. Discussion
The exploratory statistical analysis partially supported the descriptive findings. The largest and most robust improvement was observed in the D1–F1 pair, which assessed participants’ understanding of hazardous locations. In addition, the D2–F3 pair, which was related to the consideration of detours and alternative routes, remained statistically significant after applying the Bonferroni-adjusted threshold. Other corresponding pairs showed positive descriptive changes, but they should be interpreted as exploratory trends because they did not remain statistically significant after adjustment for multiple comparisons. These findings suggest that the point-cloud-derived 3D urban model may be particularly effective in helping residents transform abstract hazard awareness into concrete, place-based recognition, while its effects on broader behavioral intentions require further validation with larger samples.
One of the clearest descriptive findings was the reported improvement in participants’ understanding of hazardous locations. In the descriptive comparison between conceptually corresponding pre- and post-experience items, the D1–F1 pair showed the largest increase (+1.59), suggesting that the real-space visualization provided by the 3D model helped participants connect general tsunami-risk information with familiar streets and evacuation routes, such as “areas around one’s own home” and “roads actually used for evacuation.”
In particular, multiple comments in the free-response section referred to riverside areas and impassable locations. This indicates that participants did not merely form a general impression of risk but developed a place-based understanding of hazards.
The relatively high scores for F2 and F3 also suggest that participants did more than memorize routes; they also considered why a route should be selected and how to change routes when roads became impassable. This effect can be interpreted as resulting from the integrated presentation of road width, visibility, the sense of enclosure created by buildings, and the presence of obstacles within a walking-perspective 3D environment, environmental elements that are difficult to fully grasp from two-dimensional paper maps.
In contrast, although clarification of evacuation timing improved from D3 to F4, the degree of improvement was smaller than that observed for other items. This may be because the decision of when to start evacuation depends not only on spatial information but also on the integration of multiple factors, such as warnings, surrounding conditions, family composition, and time of day. Therefore, the 3D model alone may not have been sufficient to fully support this type of temporal decision-making.
This result suggests that while the 3D model was effective in supporting participants’ understanding of “where hazards are located” and “which routes should be used,” additional information is needed to support decisions regarding “when to act.” Future improvements may include time-series representations of inundation progression and available evacuation time, integration with warning information, and the presentation of multiple evacuation scenarios.
In the G items, both the superiority over paper maps (G4) and the sense of reliability based on measurement data (G5) showed high mean scores of 4.58. This indicates that the educational value of the 3D laser scanner-derived model was not limited to its visual realism. Rather, the fact that the model was based on actual measurements may have functioned as information that supported the validity and reliability of the learning content for participants.
In this survey, 80% of the participants had lived in the area for 21 years or longer. The fact that these long-term residents, who were highly familiar with the local environment, evaluated the model as being close to the actual impression of the site is particularly meaningful. This finding suggests that both measurement accuracy and local specificity are important for enhancing the persuasiveness of educational content.
Although the overall evaluation of the H items was high, it is important to note that H1, “The operation was easy to understand,” remained at 3.67. Many participants were unfamiliar with 3D/VR experiences, and the free-response comments included statements such as “I did not know how to operate it” and “Controller operation is difficult for older adults.” This suggests a limitation in directly applying game-like interfaces to the main target population of disaster prevention education.
However, the intention to recommend the experience to others (H6) was high, with a mean score of 4.50. This suggests that although participants experienced some operational difficulties, they strongly recognized the value of the experience itself. Therefore, future improvements should focus less on changing the direction of the content itself and more on optimizing operational support and user guidance for older adults and beginners.
The scores for behavioral intention, represented by the I items, were generally high. In particular, items related to community-oriented behavior, such as the intention to consider mutual assistance with neighbors and to participate in local disaster prevention drills, received relatively high evaluations. These responses indicate that the experience encouraged participants to think beyond their own evacuation and consider mutual assistance and local drills.
Furthermore, the frequent references in the free-response comments to family discussions and route confirmation indicate that the experience was not limited to learning during the session itself. Rather, the experience appears to have prompted some participants to discuss evacuation with family members and to check routes in the actual town. This suggests that experiential disaster prevention education contributes to disseminate knowledge and awareness from individual participants to their families and neighboring residents.
Among the J items, “I was able to regard the disaster as personally relevant” received the highest evaluation. Participants also highly evaluated the ability to visualize hazards concretely and the effectiveness of the experiential learning format. Entering a 3D model that reproduced their own living environment and confirming evacuation routes and hazardous locations within it appears to have transformed disaster prevention from a general issue into a more immediate and personal concern.
This effect can be understood as a form of learning based on local specificity, which is difficult to achieve using generic CG models or fictional urban environments. In other words, the value of the 3D model lies not only in its precise reproduction of reality but also in its ability to evoke a locally grounded risk awareness by connecting the learning experience with participants’ own memories and everyday experiences.
From the perspective of safety, discomfort associated with the desktop-based 3D experience was rarely observed, suggesting that the system has a high level of feasibility for implementation in disaster prevention education for local residents.
This result may indicate that a certain level of tension contributed to the sense of realism and learning effect. At the same time, it also suggests that future implementation will require difficulty adjustment and support systems according to participant characteristics, particularly when the program is introduced to broader groups of residents.
This study examined a desktop-based tsunami evacuation learning program that uses a point-cloud-derived streetscape. While many studies have employed VR for disaster education, research that constructs highly realistic 3D models has also been reported [
58,
59,
60]. However, these efforts often remain at the level of passive viewing (e.g., watching videos), whereas the present approach combines a 3D environment with collaborative learning, which likely increased participants’ engagement and willingness to participate actively. Given that interactive discussion has been shown to enhance educational effectiveness [
8], the present results support the effectiveness of such an approach for tsunami disaster education as well. The findings of this study should be interpreted primarily as evidence of educational and cognitive effects rather than as evidence of evacuation optimization. The system was designed to support residents’ place-based hazard recognition, evacuation-related reflection, and behavioral intentions through interaction with a locally reconstructed 3D environment. Therefore, the primary contribution of this study is not the development of an evacuation-route optimization algorithm, but the design and exploratory evaluation of an experiential learning environment that helps residents understand local hazards and reflect on evacuation decisions. Nevertheless, the point-cloud-derived urban model contributes to support more advanced spatial analyses. Future work should integrate GIS-based network analysis or pathfinding algorithms to compare residents’ selected routes with computationally derived optimal or safer routes. Such an approach would make it possible to evaluate not only subjective changes in hazard recognition and behavioral intention, but also the relationship between participants’ route-choice behavior and spatially optimized evacuation routes.
Although unmanned aerial vehicle (UAV) photogrammetry can efficiently cover wider areas and is useful for macroscopic route identification, terrestrial laser scanning was selected in this study because the educational objective required street-level geometric fidelity. In particular, road width, visibility at corners, the sense of enclosure created by buildings, steps, and potential blockage points are experienced from the pedestrian perspective and are difficult to reproduce sufficiently using aerial data alone. Therefore, the value of TLS in this study lies not in wide-area efficiency but in its ability to reproduce evacuation-relevant street-level spatial conditions. Future implementations should consider a hybrid workflow that combines UAV photogrammetry for wide-area modeling with TLS for critical street-level segments, such as narrow roads, intersections, riverfront areas, and evacuation bottlenecks. Future work should also explicitly integrate flood-prone zones, road-blockage points, and possible detour routes as spatial layers within the 3D model and link them to GIS-based route analysis. This would allow the system to present not only an experiential visualization of inundation but also a more analytically grounded comparison between predicted hazard zones, evacuation routes, and participant route choices. This study has several limitations. First, the sample size was limited to 25 participants, and only 22 participants provided complete pre–post paired responses. Therefore, the findings should not be interpreted as statistically generalizable to all coastal communities. Rather, this study should be regarded as an exploratory community-based case study that provides preliminary evidence regarding the educational potential of point-cloud-derived 3D urban models. In addition, the study relied primarily on self-reported questionnaire responses; therefore, future studies should incorporate larger samples, control or comparison groups, validated questionnaire scales, and behavioral or spatial-log data.
The design itself was a single-group pre–post comparison without a control group, so we cannot fully rule out confounding factors such as Hawthorne, history, or maturation effects. In particular, the study cannot conclusively demonstrate the incremental educational benefit of the point-cloud-derived 3D model compared with conventional paper maps, hazard maps, or generic CG-based models. Accordingly, the findings should be interpreted as preliminary evidence of perceived educational effects, rather than as causal evidence of superiority over other media. Future studies should employ controlled designs, such as comparisons with paper-map-based training or generic 3D/CG models, to clarify the unique contribution of locally measured point-cloud-derived models. Participant age and digital literacy are a second concern. The participants in this study were middle-aged and older local residents, and no participants under 40 years of age were included. Because the system uses a desktop-based 3D environment and controller-based operation, digital literacy and prior experience with 3D interfaces may influence usability, perceived realism, and learning outcomes. The relatively lower score for ease of operation may therefore reflect, at least in part, the age composition of the sample rather than the usability of the system alone. Consequently, the findings should not be generalized to younger populations or digitally experienced users without further investigation. Future studies should include younger participants, students, and users with diverse levels of digital literacy to examine how age and prior experience affect learning effects and operability. Finally, the tsunami inundation and building-collapse representations were not physically calibrated. The Zibra Liquid (2.1.5) simulation was used to visualize the approximate spatial extent and direction of inundation based on the published tsunami inundation assumption zone, but parameters such as water depth, flow velocity, discharge volume, and arrival time were not validated against hydrodynamic simulation results or observed tsunami data. Therefore, the system should not be used to teach precise physical tsunami behavior or engineering-level risk prediction. In future implementations, the simulation should be combined with clear instructional warnings, hazard-map information, and, where possible, validated hydrodynamic models to reduce the risk that participants misinterpret simplified visual effects as accurate physical laws.





 ,
,