1. Introduction
Against the backdrop of the global wave of carbon neutrality and the rigid constraints of China’s dual-carbon strategy, the automotive industry, as a pillar industry of the national economy, contributes more than 70% of carbon emissions in China’s transportation sector. Its low-carbon transition has thus become a core pathway toward the high-quality and sustainable development of the national industrial system [
1,
2]. China has ranked first in global automobile production and sales for 15 consecutive years. In 2025, the country’s automobile production and sales reached 34.531 million and 34.40 million units, respectively, of which NEVs accounted for 47.9% of total production and sales. The industry has formally entered a new stage of long-term coexistence and in-depth competition between FVs and NEVs [
3,
4]. In this context, how to guide automotive manufacturers to balance compliance costs and market competitiveness through market-oriented policy tools, and how to formulate optimal production and operation strategies, have become critical issues in industrial practice and academic research.
To solve the incentive dilemma for industrial transition after the phase-out of financial subsidies for NEVs, China formally implemented the Dual-Credit Policy in 2017, which has been revised twice in 2020 and 2023 to form a dynamically adjusted industry credit management system. The core of the policy is to establish a long-term mechanism of “restricting high-carbon emissions and incentivizing low-carbon development” through the market-oriented linkage of two major systems: Corporate Average Fuel Consumption (CAFC) credits and new energy vehicle (NEV) credits [
5,
6,
7]. Specifically, negative CAFC credits must be offset through self-owned carried-over credits, transfers from affiliated enterprises, or the purchase of positive NEV credits; negative NEV credits can only be offset by purchasing positive NEV credits from the market. The required NEV credit ratios for the 2026 and 2027 assessment years have been set at 48% and 58%, respectively [
8], marking a comprehensive shift in the policy’s core orientation from “encouraging scale expansion” to “promoting quality upgrading”. As a result, manufacturers’ energy consumption decisions are deeply bound to their credit compliance costs and operating profits.
From the perspective of the practical development of China’s automotive industry, the Dual-Credit Policy has profoundly reshaped the production and operation logic of automotive manufacturers. The energy consumption level of vehicles has become a core variable for manufacturers to balance compliance requirements and market competitiveness, and multiple verifiable typical practical cases have emerged in the industry. First, leading domestic automakers have achieved a win–win situation of compliance and revenue through the upgrading of energy consumption levels. Relying on core technologies such as Blade Battery and DM-i Super Hybrid technology, BYD has simultaneously improved the core quality (including safety and driving range) of its battery electric vehicle (BEV) models and the fuel economy of its hybrid models. It ranked first in the industry in terms of the scale of positive NEV credits for two consecutive years from 2023 to 2024 [
9,
10], and generated more than 2.5 billion yuan in revenue from credit transactions in 2024, forming a positive cycle of “energy efficiency upgrading-credit surplus-revenue reinvestment-technological iteration” [
11]. In response to the credit constraints on low-range models in the 2023 version of the policy, SAIC-GM-Wuling discontinued the low-range, low-configuration versions of the Hongguang MINIEV and launched upgraded models equipped with fast-charging and long-range batteries [
12]. Through energy efficiency optimization, it simultaneously achieved credit compliance and stable market share. Second, joint venture brands and traditional FV manufacturers have initiated quality transformation under policy pressure. Between 2020 and 2022, joint venture enterprises such as FAW-Volkswagen and SAIC-Volkswagen accumulated a negative CAFC credit gap of more than one million points due to the excessively high proportion of FV sales and the lag in energy efficiency upgrading of their models. In 2021 alone, they spent more than 3 billion yuan on purchasing positive NEV credits. Under this pressure, these enterprises have, on the one hand, improved the fuel economy of their FVs and reduced the negative CAFC credit gap by upgrading high-efficiency fuel engines such as the EA211 1.5T EVO; on the other hand, they have accelerated the technological iteration and quality upgrading of their ID. series BEV models, gradually realizing independent and controllable credit compliance [
13]. Third, the policy has promoted the survival of the fittest in the industry. Some small and medium-sized automakers, unable to complete the energy efficiency upgrading of FVs and quality breakthrough of NEVs to meet the Dual-Credit Policy compliance requirements, eventually fell into operational crisis or even exited the market, serving as typical samples of policy-forced clearance of low-quality production capacity.
This study adopts a three-stage methodological framework: (1) Theoretical modeling: We construct profit-maximization models for FV and NEV manufacturers under the Dual-Credit Policy, deriving closed-form optimal solutions and critical thresholds through mathematical derivation. This framework characterizes the directional impact mechanisms of policy parameters on enterprise decisions. (2) Numerical simulation: We calibrate the model using real industrial parameters to visualize the theoretical results and conduct a sensitivity analysis. (3) Empirical testing: We use a two-way fixed effects model with instrumental variables to verify the theoretical propositions using firm-level panel data. This mixed-methods approach combines the rigor of theoretical analysis with the realism of empirical validation, ensuring the reliability and practical relevance of our conclusions.
The remainder of this paper is organized as follows:
Section 2 reviews the relevant literature and clarifies the current research gaps as well as the contributions of this paper.
Section 3 describes the problem and presents the model assumptions.
Section 4 establishes and solves the optimal decision-making models for both FV and NEV manufacturers.
Section 5 presents the numerical simulations and sensitivity analysis.
Section 6 reports the empirical tests and results.
Section 7 discusses the findings, practical implications, and limitations. Finally,
Section 8 concludes the paper.
2. Literature Review
A large body of existing academic research on the Dual-Credit Policy has been conducted. Some scholars argue that the policy can effectively reduce the production scale of FVs while promoting the popularization of NEVs. Hu et al. [
14] constructed a decision optimization model for fuel economy level and FV production, and found that the market price of NEV credits has a significant impact on FV output; when the credit price is low, FV production may not necessarily decline due to factors such as market expansion. Wang et al. [
15] constructed an R&D investment model for automobile manufacturers with joint production of dual vehicle models, arguing that manufacturers should not rely on low credit transaction prices, but instead improve R&D efficiency, reduce redundant investment, and increase technological R&D to promote low-energy consumption and NEV models so as to achieve transformation, upgrading and smooth replacement relying on the Dual-Credit Policy. Using a difference-in-differences (DID) model, Liang et al. [
16] explored the differential impact of the Dual-Credit Policy on BEV manufacturers and traditional automobile manufacturers, and found that traditional automakers must reduce vehicle fuel consumption and increase NEV production to meet the policy requirements. Using PSM-DID with a quasi-natural experiment design, Zhao et al. [
17] confirm that the dual-credit policy effectively enhances the operational performance of Chinese listed NEV firms via increased R&D and sales. The policy exerts stronger impacts on state-owned, large and long-exposed enterprises. HU et al. [
18,
19,
20] conducted research on the supply chain composed of NEV manufacturers and battery suppliers, confirming that the Dual-Credit Policy has a significant impact on the innovation capability of automakers. Meanwhile, although rising credit transaction prices will lower the selling price of NEVs, manufacturers can obtain additional revenue from credits, thereby achieving overall profit growth. Hui et al. [
21] built a tripartite evolutionary game-system dynamics model for China’s NEV industry. They found that Dual-Credit Policy intensity, innovation capacity, demand-innovation synergy and stakeholder coordination jointly determine innovation strategies, supply chain stability and policy performance, with demand-innovation matching and multi-agent coordination being more critical for upstream innovation than policy pressure alone. Li et al. [
22] constructed a multi-scenario production and pricing decision-making model for conventional fuel vehicle manufacturers, and analyzed their optimal output, optimal pricing and achievable optimal profit under different strategies across various markets and policy requirements. The study found that the Dual-Credit Policy can increase the sales price of conventional fuel vehicles and lower the price of new energy vehicles. Pu et al. [
23] adopted game theory to construct four Dual-Credit Policy (DCP) scenarios and analyze fuel vehicle (FV) and new energy vehicle (NEV) manufacturers’ low-carbon strategies. They verified that DCP regulatory targets greatly impact credit prices, retail prices, emission reductions, market demand, firm profits and overall carbon emissions. Manufacturers gain maximum profits under NEV-only regulation, while joint regulation of both vehicle types cuts total carbon emissions the most yet reduces corporate profits. YI et al. [
24] argued that although rising credit market prices can drive manufacturers to increase R&D investment, effectively reduce average fuel consumption, and contribute to social carbon emission reduction, they will also push up the wholesale price of FVs, which may not ultimately lead to an improvement in social welfare.
While existing research on China’s DCP has extensively explored its impacts on the automotive industry, two critical research gaps remain. First, most studies treat vehicle energy consumption as an exogenous parameter, focusing on production transformation, pricing, and supply chain coordination, while lacking a two-dimensional analysis of endogenous energy consumption decisions covering both FVs and NEVs. They also largely overlook the sustained market share of FVs in the medium to long term, which will remain above 40% until 2030 according to industry forecasts. Second, existing analyses are mostly based on the pre-2020 policy framework, with few dynamic studies incorporating the 2023 DCP amendments and the 2026–2027 NEV credit ratio requirements, failing to align with the policy’s core goal of high-quality development.
This paper addresses these gaps with three key innovations. First, methodologically, we treat vehicle energy consumption as the core endogenous decision variable, construct a dual-dimensional production decision model for both FV and NEV manufacturers, and validate it through a unified framework of mathematical derivation, numerical simulation, and empirical testing. This fills the research gap of prioritizing output over quality and NEVs over FVs, and enriches the theoretical system of manufacturers’ production decisions under the DCP. Second, our study has strong policy timeliness: we incorporate the 2023 DCP revisions, 2026–2027 credit rules, and real-world parameters including credit price volatility and market structure changes, making our findings highly compatible with China’s current automotive industry policy environment. Third, this research holds strategic practical significance: amid ongoing geopolitical turbulence in the Middle East and high global energy prices, optimizing the DCP to guide automakers’ energy efficiency improvements can reduce oil consumption in China’s transportation sector, lower reliance on international energy markets, safeguard national energy security, and underpin the sustainable advancement of the automotive industry.
3. Problem Description and Assumptions
Consider an automotive market consisting of one traditional fuel vehicle (FV) manufacturer and one new energy vehicle (NEV) manufacturer. As a benchmark analytical framework, we assume each manufacturer produces only one representative vehicle model to isolate the core incentive mechanism of the Dual-Credit Policy (DCP) on energy consumption decisions.
For the traditional fuel vehicle (FV) manufacturer, per-vehicle CAFC credits
are defined in strict compliance with the Measures for the Parallel Administration of Average Fuel Consumption and New Energy Vehicle Credits of Passenger Vehicle Enterprises [
5] and the national standard GB 27999-2025 Fuel Consumption Evaluation Methods and Targets for Passenger Cars [
25]. Per official regulatory provisions, an enterprise’s total annual CAFC credits equal the production-weighted gap between the corporate average fuel consumption target and actual fuel consumption:
. where
is the production-weighted corporate average fuel consumption target (derived from curb-weight-based model targets per GB 27999-2025),
is the actual production-weighted average fuel consumption, and
is the total annual production volume. The official unit of total CAFC credits is “credits”. Under our benchmark single-model setting, the production-weighted corporate average and its target reduce directly to the representative model’s actual fuel consumption
and model-specific target
(both in L/100 km), as production weighting is trivial for a single product line. Dividing total credits by production volume yields per-vehicle CAFC credits:
.
The unit of represents credits per vehicle. Under uniform production weighting, a 1 L/100 km difference between and corresponds exactly to 1 credit per vehicle produced, fully consistent with official accounting logic. When , and the vehicle generates positive CAFC credits transferable to affiliated enterprises; when , and negative credits must be offset by purchasing NEV credits from the market. The admissible range of is .
For the NEV manufacturer, each vehicle generates per-vehicle NEV credits
(
), calculated per official MIIT rules based on driving range, electricity consumption, battery energy density, and low-temperature performance [
8].
is a comprehensive indicator that positively correlates with NEV energy efficiency: higher energy efficiency (lower electricity consumption, longer driving range) corresponds to a larger
. This paper uses
as the proxy for NEV energy efficiency level, and uses
as the metric for FV energy consumption level.
The required NEV credit ratio is (). The internal transfer price of CAFC credits among affiliated enterprises is , and the market transaction price of NEV credits is , where . The unit profits of FVs and NEVs are and respectively, and sales volumes are and respectively. Based on the above settings, the following assumptions are made:
Assumption 1. All vehicles produced by the manufacturers can be fully absorbed by the market, i.e., production volume equals consumer demand. All positive credits generated can be fully sold on the market.
Justification. This market-clearing assumption is a standard approach in single-period classical operations management models (e.g., [22,23]). It is deliberately adopted to isolate the pure incentive effects of the DCP on energy efficiency decisions without the confounding mathematical complexities introduced by inventory holding costs and stochastic demand. The implications of relaxing this assumption under market saturation are thoroughly discussed in the Limitations section. Assumption 2. We consider production activities within a single cycle. No CAFC credits are carried over from previous years, and all positive credits generated must be sold or used for compliance within the same cycle.
Justification. This static framework allows us to derive closed-form optimal solutions and clear threshold effects. A multi-period model with credit carry-over would capture dynamic R&D and inter-temporal credit allocation, which we leave for future research.
Assumption 3. To examine the impact of the Dual-Credit Policy on automobile production, this paper assumes that the sales volume of FVs is mainly determined by the fuel consumption level
, and the sales volume of NEVs is mainly determined by the energy efficiency level . In general, for the same vehicle model with unchanged price, lower fuel consumption of FVs will generally attract more consumers to purchase, thereby increasing vehicle sales. Similarly, higher energy efficiency performance of NEVs will also attract more consumers and increase sales. Therefore, we assume that the sales functions of FVs
and NEVs
take a linear form, with the following formulas:
where
represents the sensitivity of FV sales to fuel consumption (
;
represents the sensitivity of NEV sales to energy efficiency (
;
and
represent the natural sales volume of FVs and NEVs, respectively
. Since the sales volume of FVs cannot be negative,
, corresponding to the upper limit of fuel consumption
.
Justification. We adopt linear demand functions that link FV sales only to fuel consumption and NEV sales only to energy efficiency. This specification is widely used in industrial organization literature because it captures the first-order effect of product attributes on demand and allows for closed-form analytical solutions. While real-world automobile demand is influenced by multiple factors (price, brand value, charging infrastructure, government subsidies, etc.), these factors can be captured by the intercept terms (S2 and S4) of the demand functions without altering the monotonic relationship between energy performance and sales. Our empirical results confirm a significant linear correlation between energy efficiency and sales in the Chinese automobile market, supporting the validity of this assumption. The simplification enables us to derive clear threshold effects, which are the core contribution of this study.
Assumption 4. Similarly, to examine the impact of the Dual-Credit Policy on automobile production, this paper assumes that the price and cost of FVs are mainly affected by their own fuel consumption level , and the price and cost of NEVs are mainly affected by their own energy efficiency level
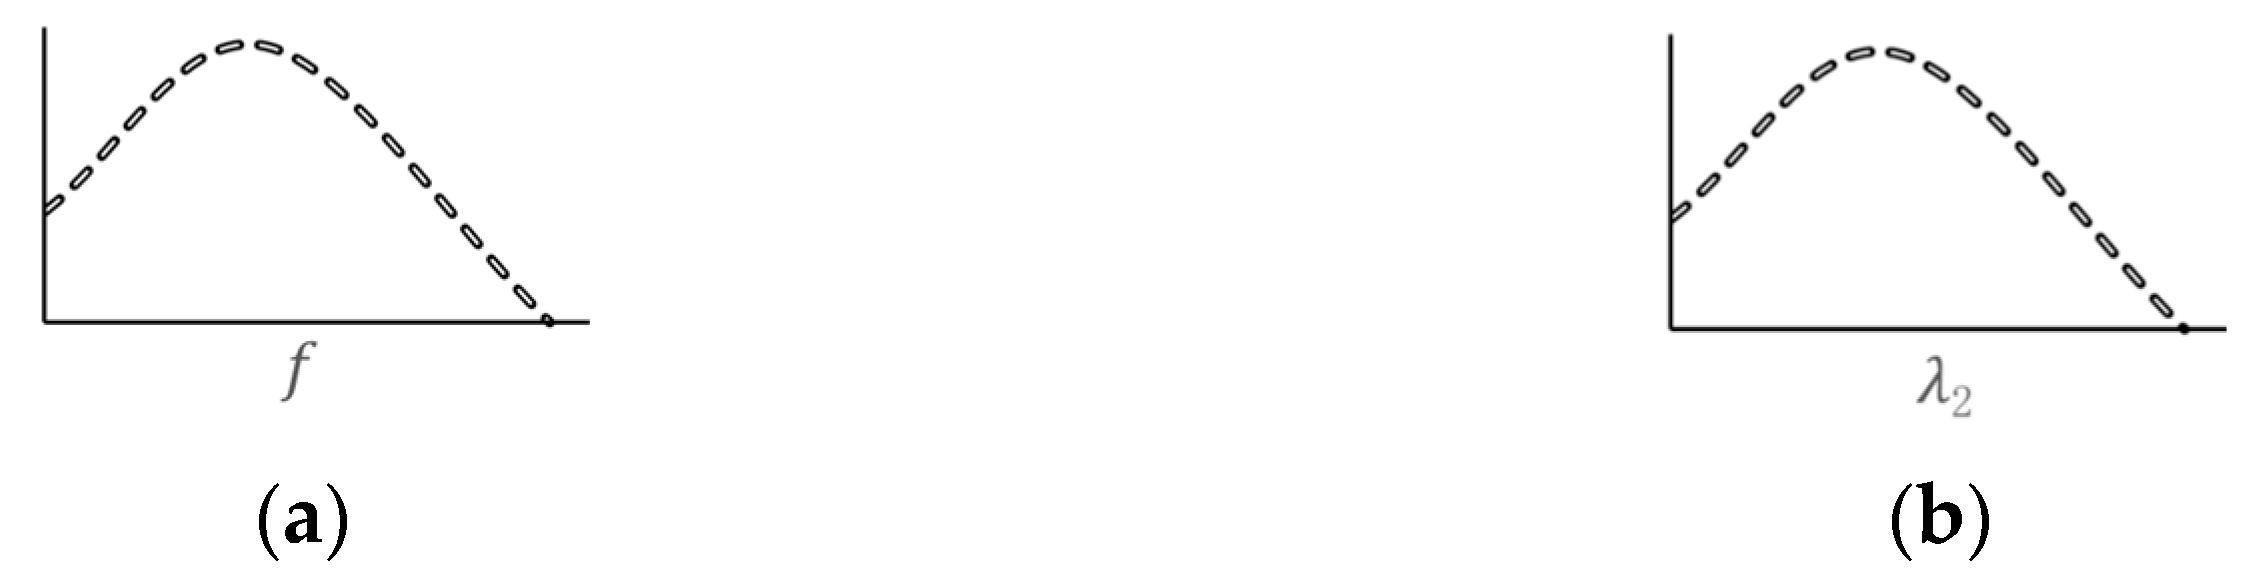
, without considering other influencing factors. In general, for the same vehicle model, lower fuel consumption leads to higher manufacturing difficulty, higher cost, and thus higher selling price; the same applies to NEVs, where higher energy efficiency leads to higher manufacturing difficulty, higher cost, and higher selling price. According to practical conditions, as the fuel consumption of FVs further decreases and the energy efficiency of NEVs further increases, the manufacturing cost will increase at an accelerated rate, and the vehicle price will also increase at an accelerated rate. Since profit equals price minus cost, we assume that the profit functions of FVs and NEVs take a quadratic form, with the following formulas: For Equation (3), represents the intensity of price loss of FVs with rising fuel consumption; represents the linear marginal revenue per unit of rising fuel consumption (10,000 yuan per unit fuel consumption); represents the base profit of FVs. Specifically, the profit function (3) indicates that when the fuel consumption level is lower than a certain critical value , as the fuel consumption continues to decrease, the growth rate of manufacturing cost is generally higher than that of vehicle price, and the enterprise’s profit will gradually decrease. When the fuel consumption level is higher than the critical value , as the fuel consumption continues to increase, the decline rate of vehicle price is generally higher than that of cost, and the enterprise’s profit will also gradually decrease, even leading to losses.
For Equation (4), represents the intensity of increasing manufacturing cost with rising energy efficiency of NEVs; represents the linear marginal revenue per unit of rising energy efficiency (10,000 yuan per unit energy efficiency); represents the base profit of low-energy efficiency NEVs. Specifically, the profit function (4) indicates that when the energy efficiency level is lower than a certain critical value , as the energy efficiency continues to decrease, the decline rate of vehicle price is generally higher than that of cost, and the enterprise’s profit will gradually decrease. When the energy efficiency level is higher than the critical value , as the energy efficiency continues to increase, the growth rate of manufacturing cost is generally higher than that of price, and the enterprise’s profit will also gradually decrease, even leading to losses.
The profit changes in FVs and NEVs are shown in
Figure 1a and
Figure 1b, respectively.
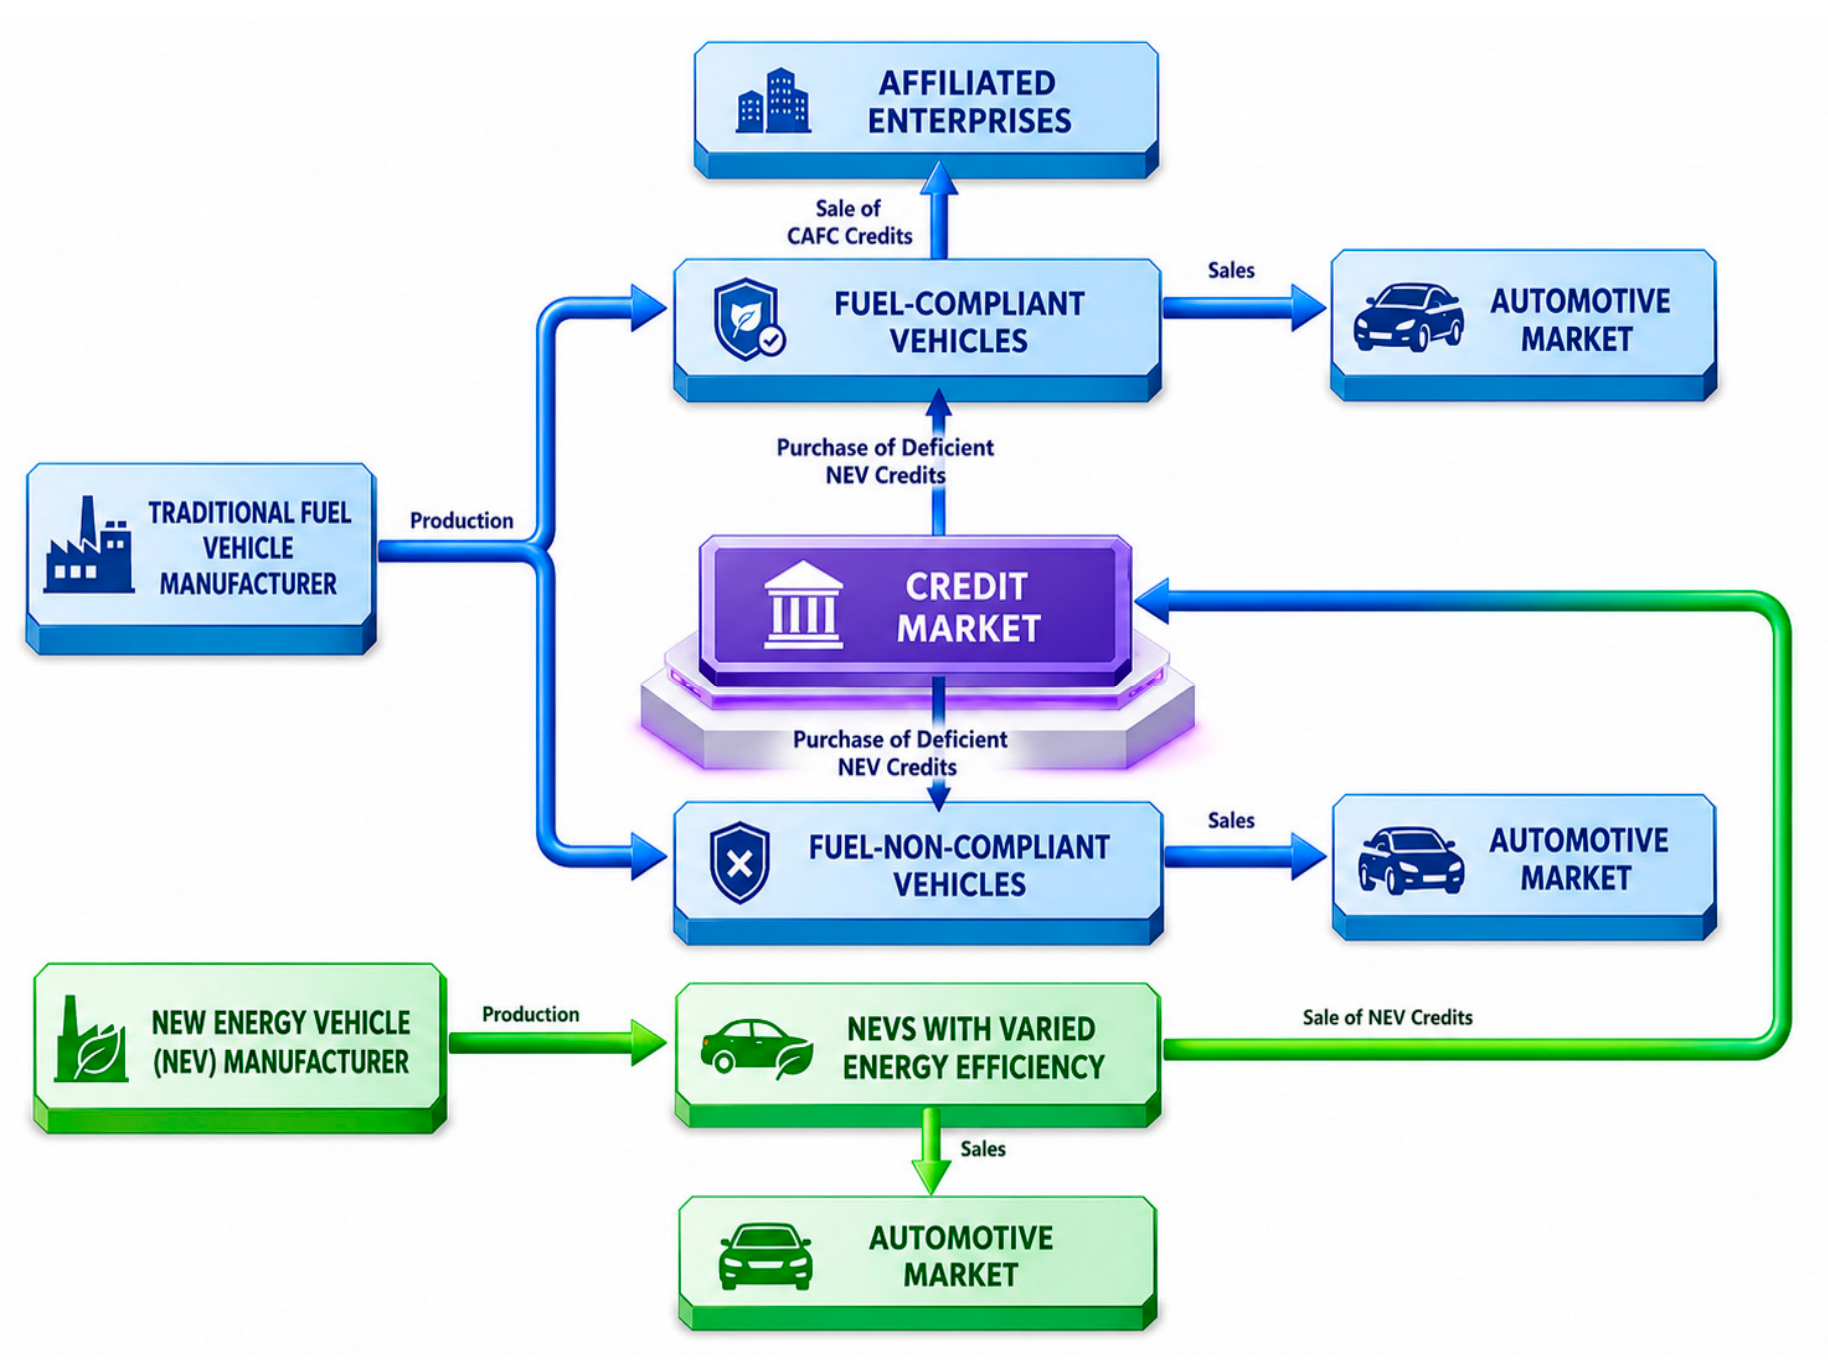
Under the Dual-Credit Policy, traditional FV manufacturers must consider whether the fuel consumption of their vehicles meets the standard when producing the same model, while NEV manufacturers must consider whether the energy efficiency performance of their vehicles meets the expected economic benefits. Based on the above, the stakeholder interest relationship diagram of each manufacturer is obtained (
Figure 2). Next, we will analyze the optimal production decision models for FV and NEV manufacturers, respectively.
5. Numerical Simulation Analysis
This paper uses numerical analysis to further verify the above conclusions and intuitively demonstrates the optimal energy consumption production decisions of FV and NEV manufacturers under different conditions through numerical examples.
The numerical simulation in this section serves as an illustrative example of the theoretical model’s behavior under realistic parameter values, rather than an independent empirical validation of the model. All parameters are calibrated based on public industry data, and the robustness of core conclusions is verified via sensitivity analysis. The specific parameter settings are shown in
Table 1 and
Table 2.
All parameters in this study are selected based on three criteria:
Policy authenticity: All policy-related parameters (Q0, a, Pₙ) are directly taken from official MIIT documents and actual market transaction data.
Industrial realism: Cost and revenue parameters are calibrated to match the average level of China’s automotive industry in 2024, based on public annual reports and industry white papers.
Model tractability: Sales volume parameters are normalized to simplify numerical analysis while preserving the relative magnitudes of different effects.
The robustness of our conclusions to parameter variations has been extensively verified through sensitivity analyses presented in
Section 5.3. All core findings remain valid across the entire range of parameter values consistent with industrial reality.
5.1. Numerical Simulation Analysis of Optimal Production Decisions for Fuel Vehicle Manufacturers
According to the parameter assignment in
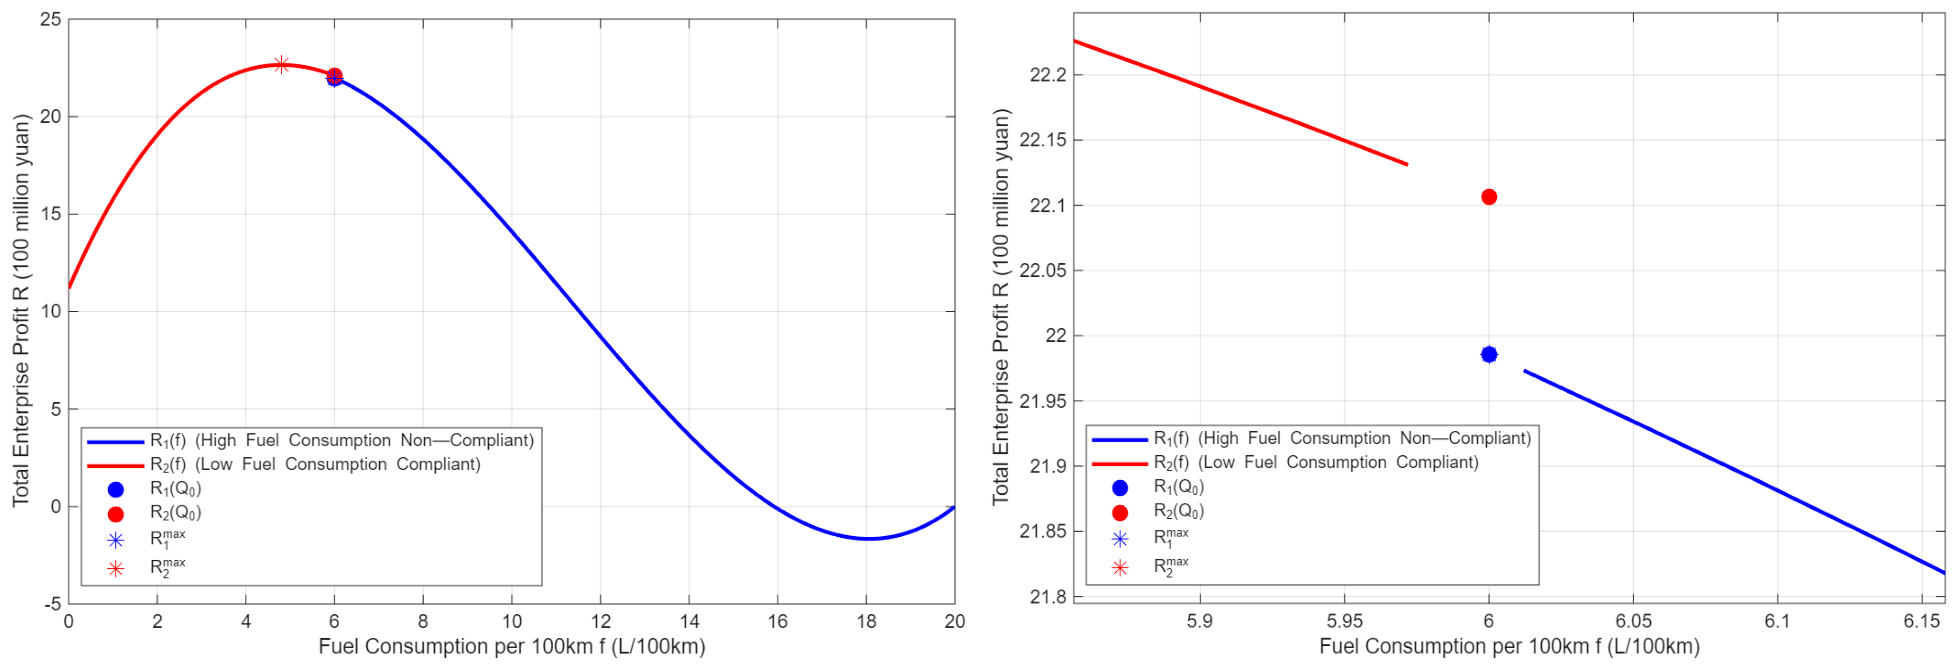
Table 1, we use MATLAB R2025a to conduct numerical simulations of the FV manufacturer’s profit function. The results are shown in
Figure 3. In the high-fuel-consumption (non-compliant) scenario (
),
first decreases and then increases over the domain
, with a single interior minimum point, and profit drops to 0 at the right boundary
. The unconstrained global maximum point of
(the interior optimum
) lies to the left of
, outside the valid domain of the non-compliant scenario. Therefore, under the constraint
, the maximum profit is achieved at the left boundary
, which is a boundary optimum.
In the low-fuel-consumption (compliant) scenario (), follows an inverted-U shape (first increasing, then decreasing) with a unique interior maximum point . At , million yuan , which verifies that the compliant strategy yields strictly higher profit at the threshold point of the fuel consumption standard.
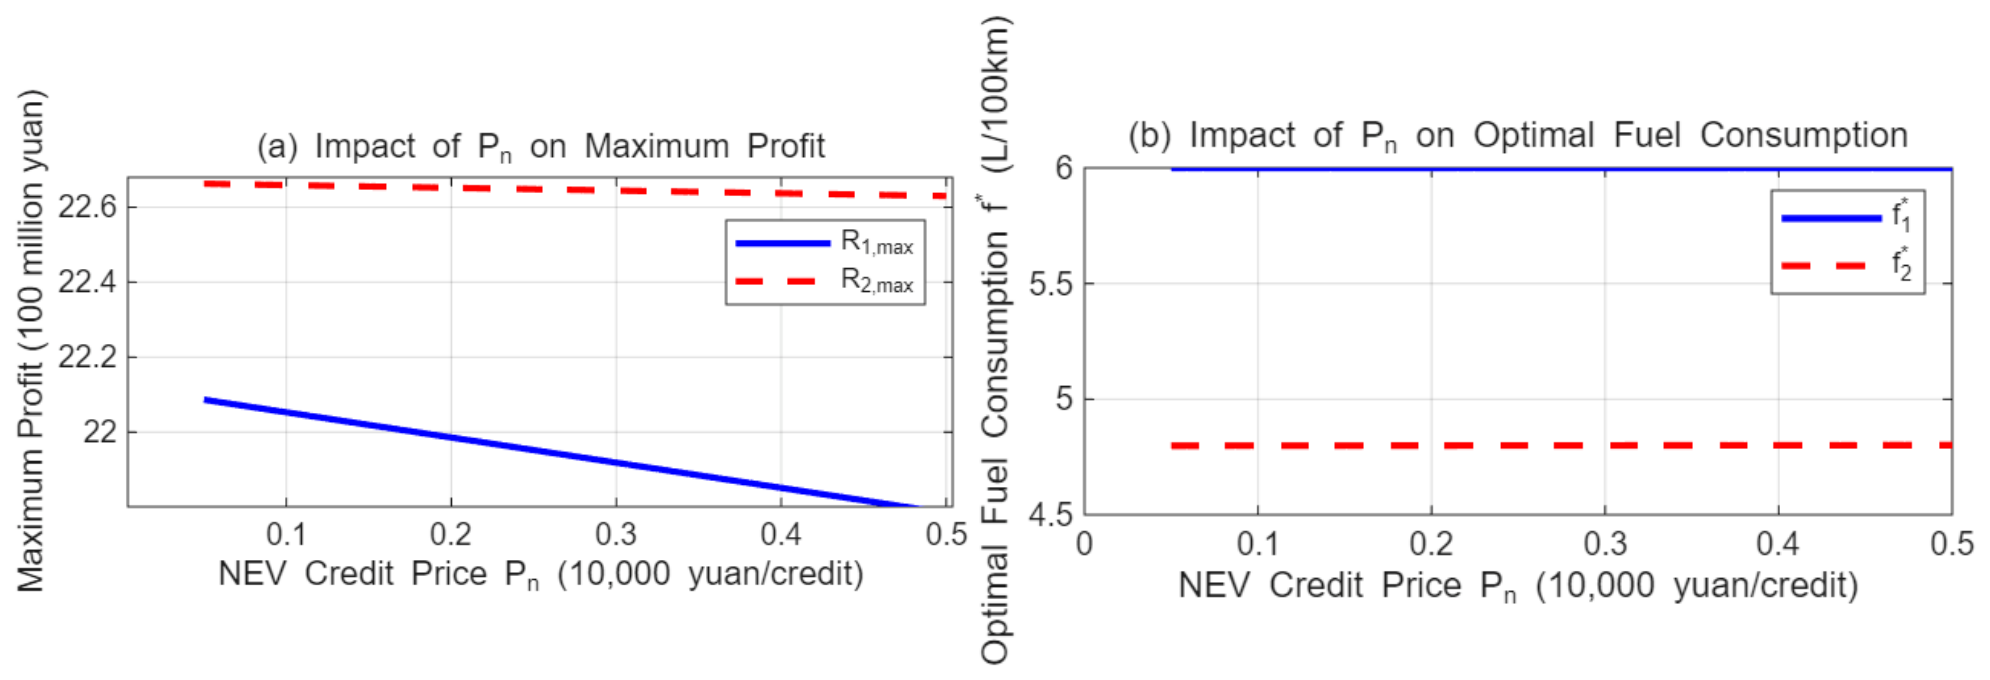
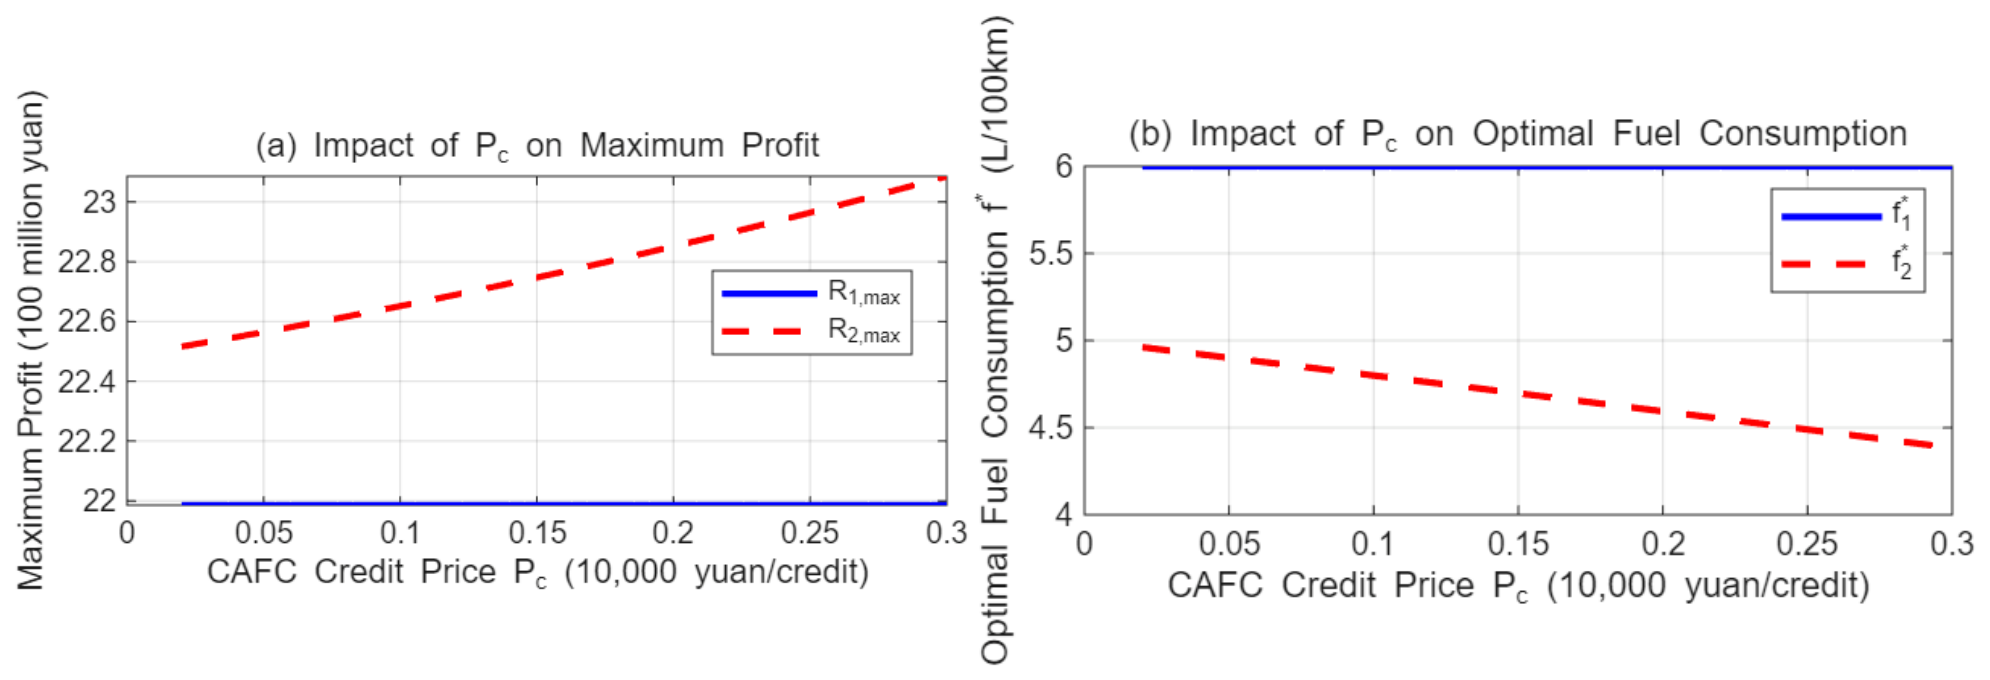
At the same time, we use numerical simulation to analyze the impact of NEV credit price
, CAFC credit price
, and NEV credit ratio requirement
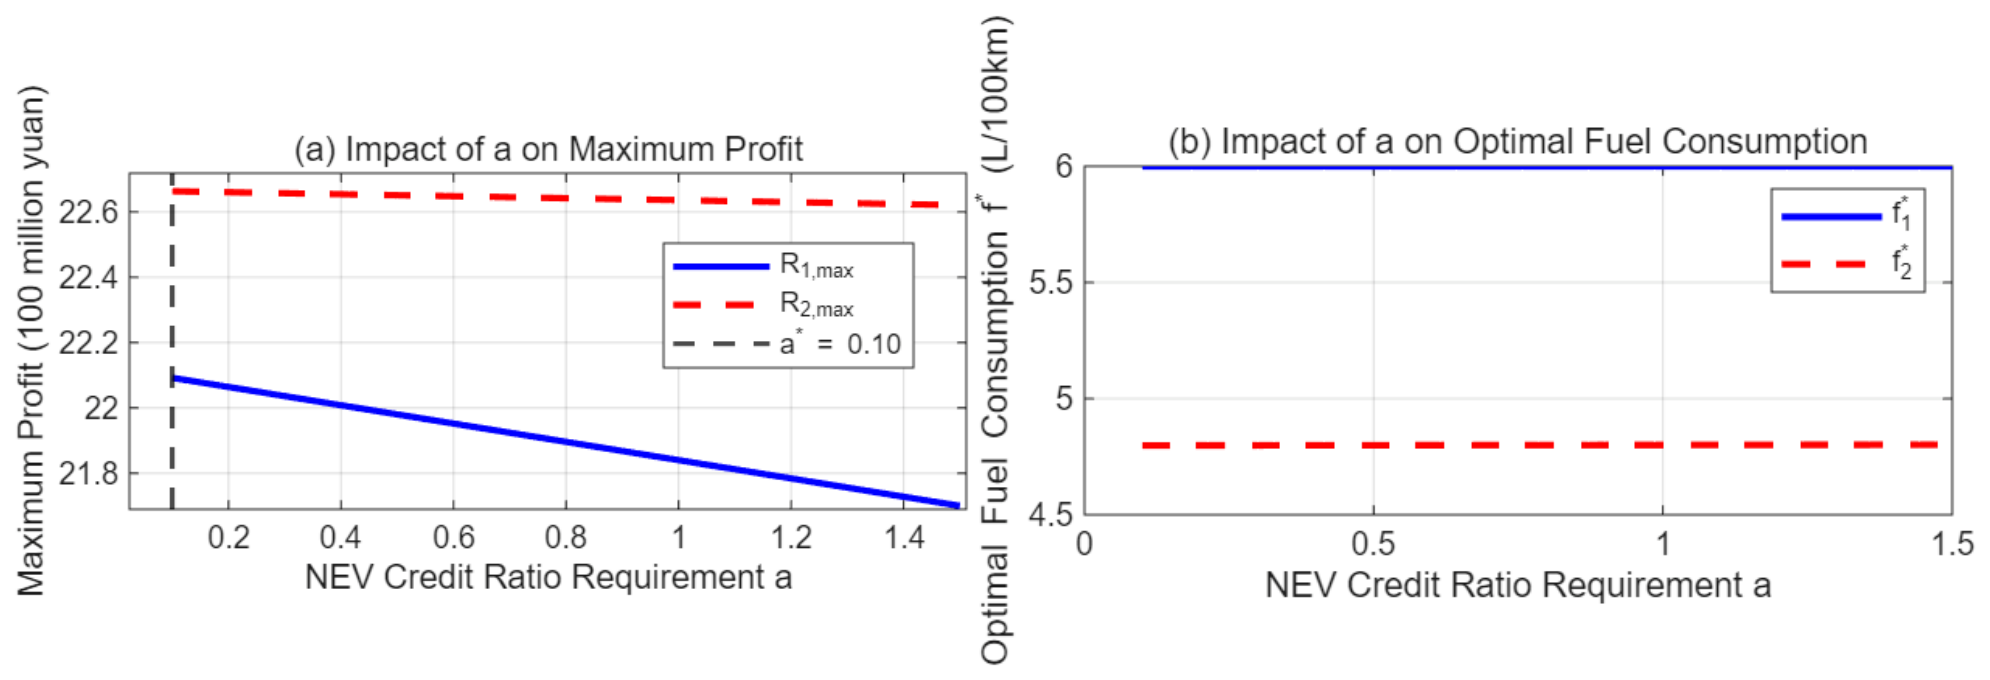
on the manufacturer’s decisions, with the results shown in
Figure 4,
Figure 5 and
Figure 6. It can be seen from these figures that an increase in
significantly reduces the maximum profit of the high fuel consumption strategy, but has an extremely weak impact on the profit of the low fuel consumption strategy. An increase in
significantly increases the maximum profit of the low fuel consumption strategy, but has no direct impact on the high fuel consumption strategy. An increase in both types of credit prices drives down the optimal fuel consumption level, continuously strengthening the advantage of the low fuel consumption strategy. An increase in
has a negative inhibitory effect on the profits of both strategies, and the intensity of the negative impact on the high fuel consumption strategy is 10 times that on the low fuel consumption strategy. There exists a unique critical value
, and when
, the low fuel consumption strategy is always the dominant choice. The above results fully verify Proposition 1 and Proposition 2.
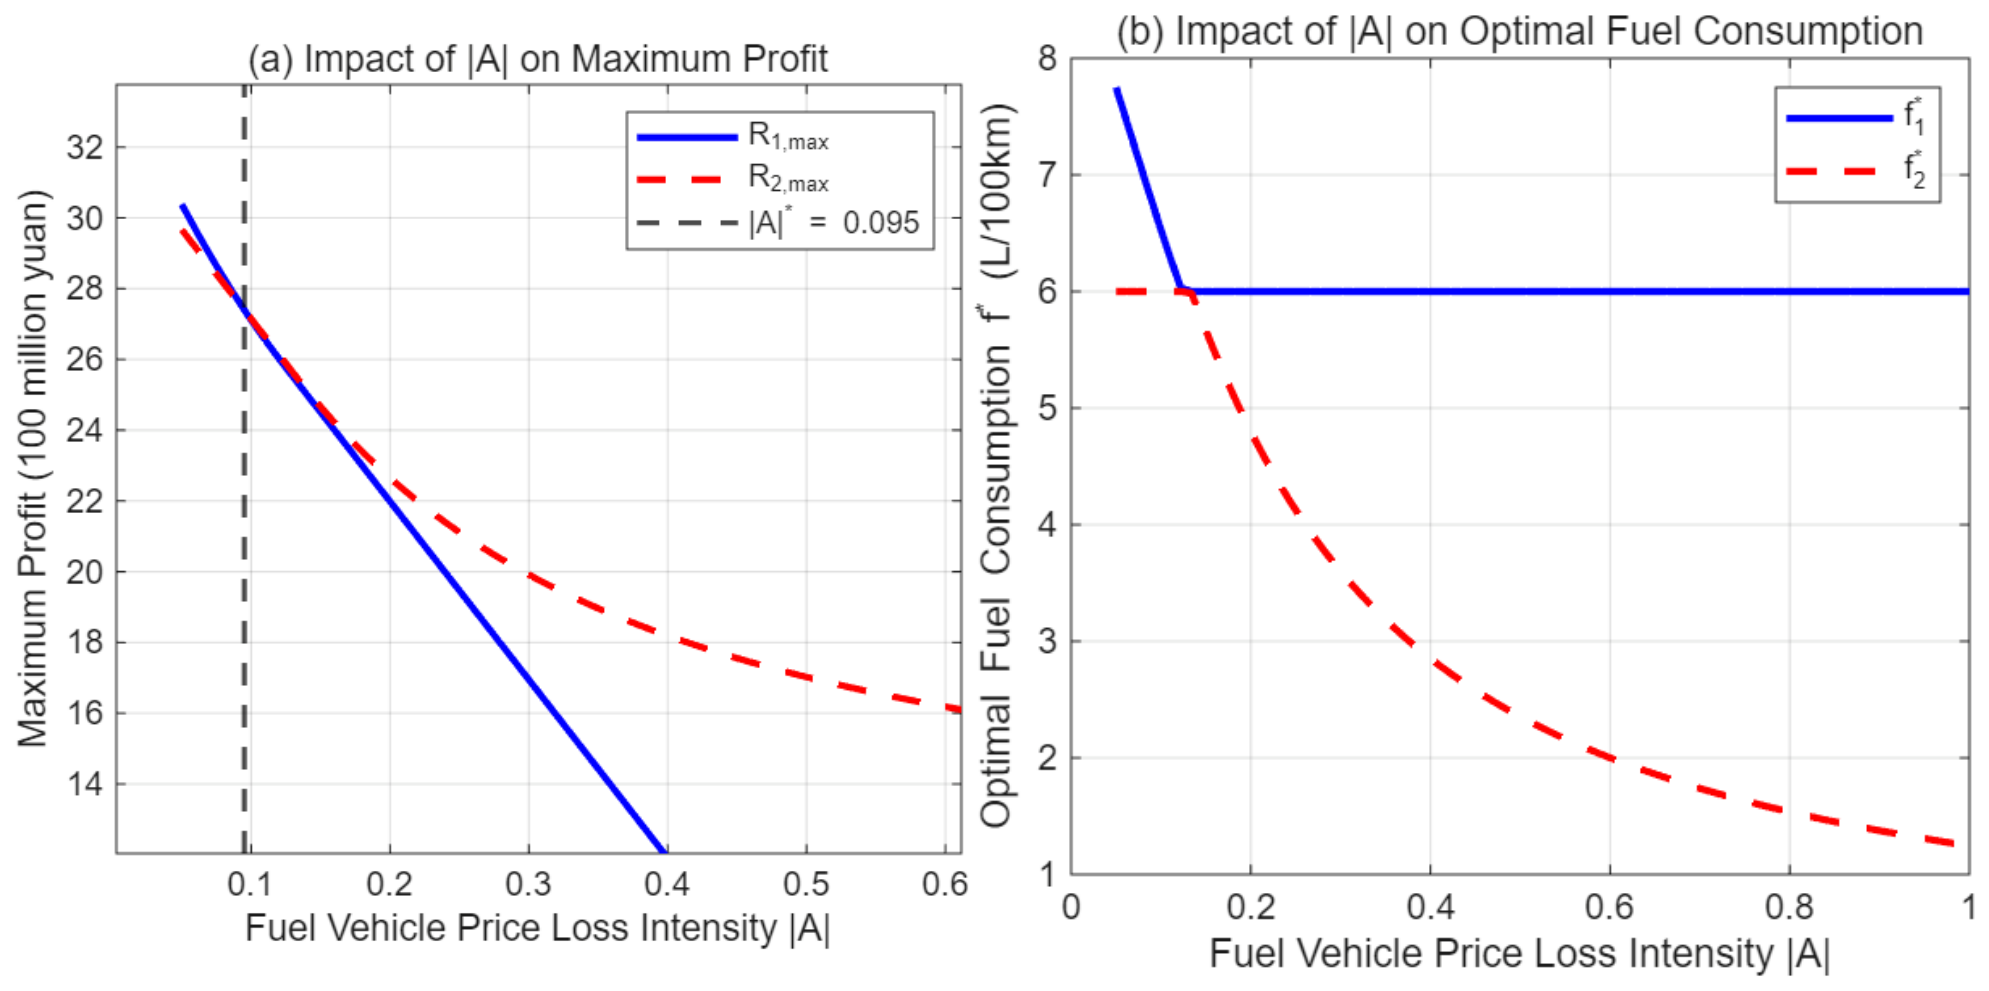
Furthermore, we use numerical simulation to analyze the impact of fuel consumption standards, price loss intensity, and fuel consumption sales sensitivity coefficient.
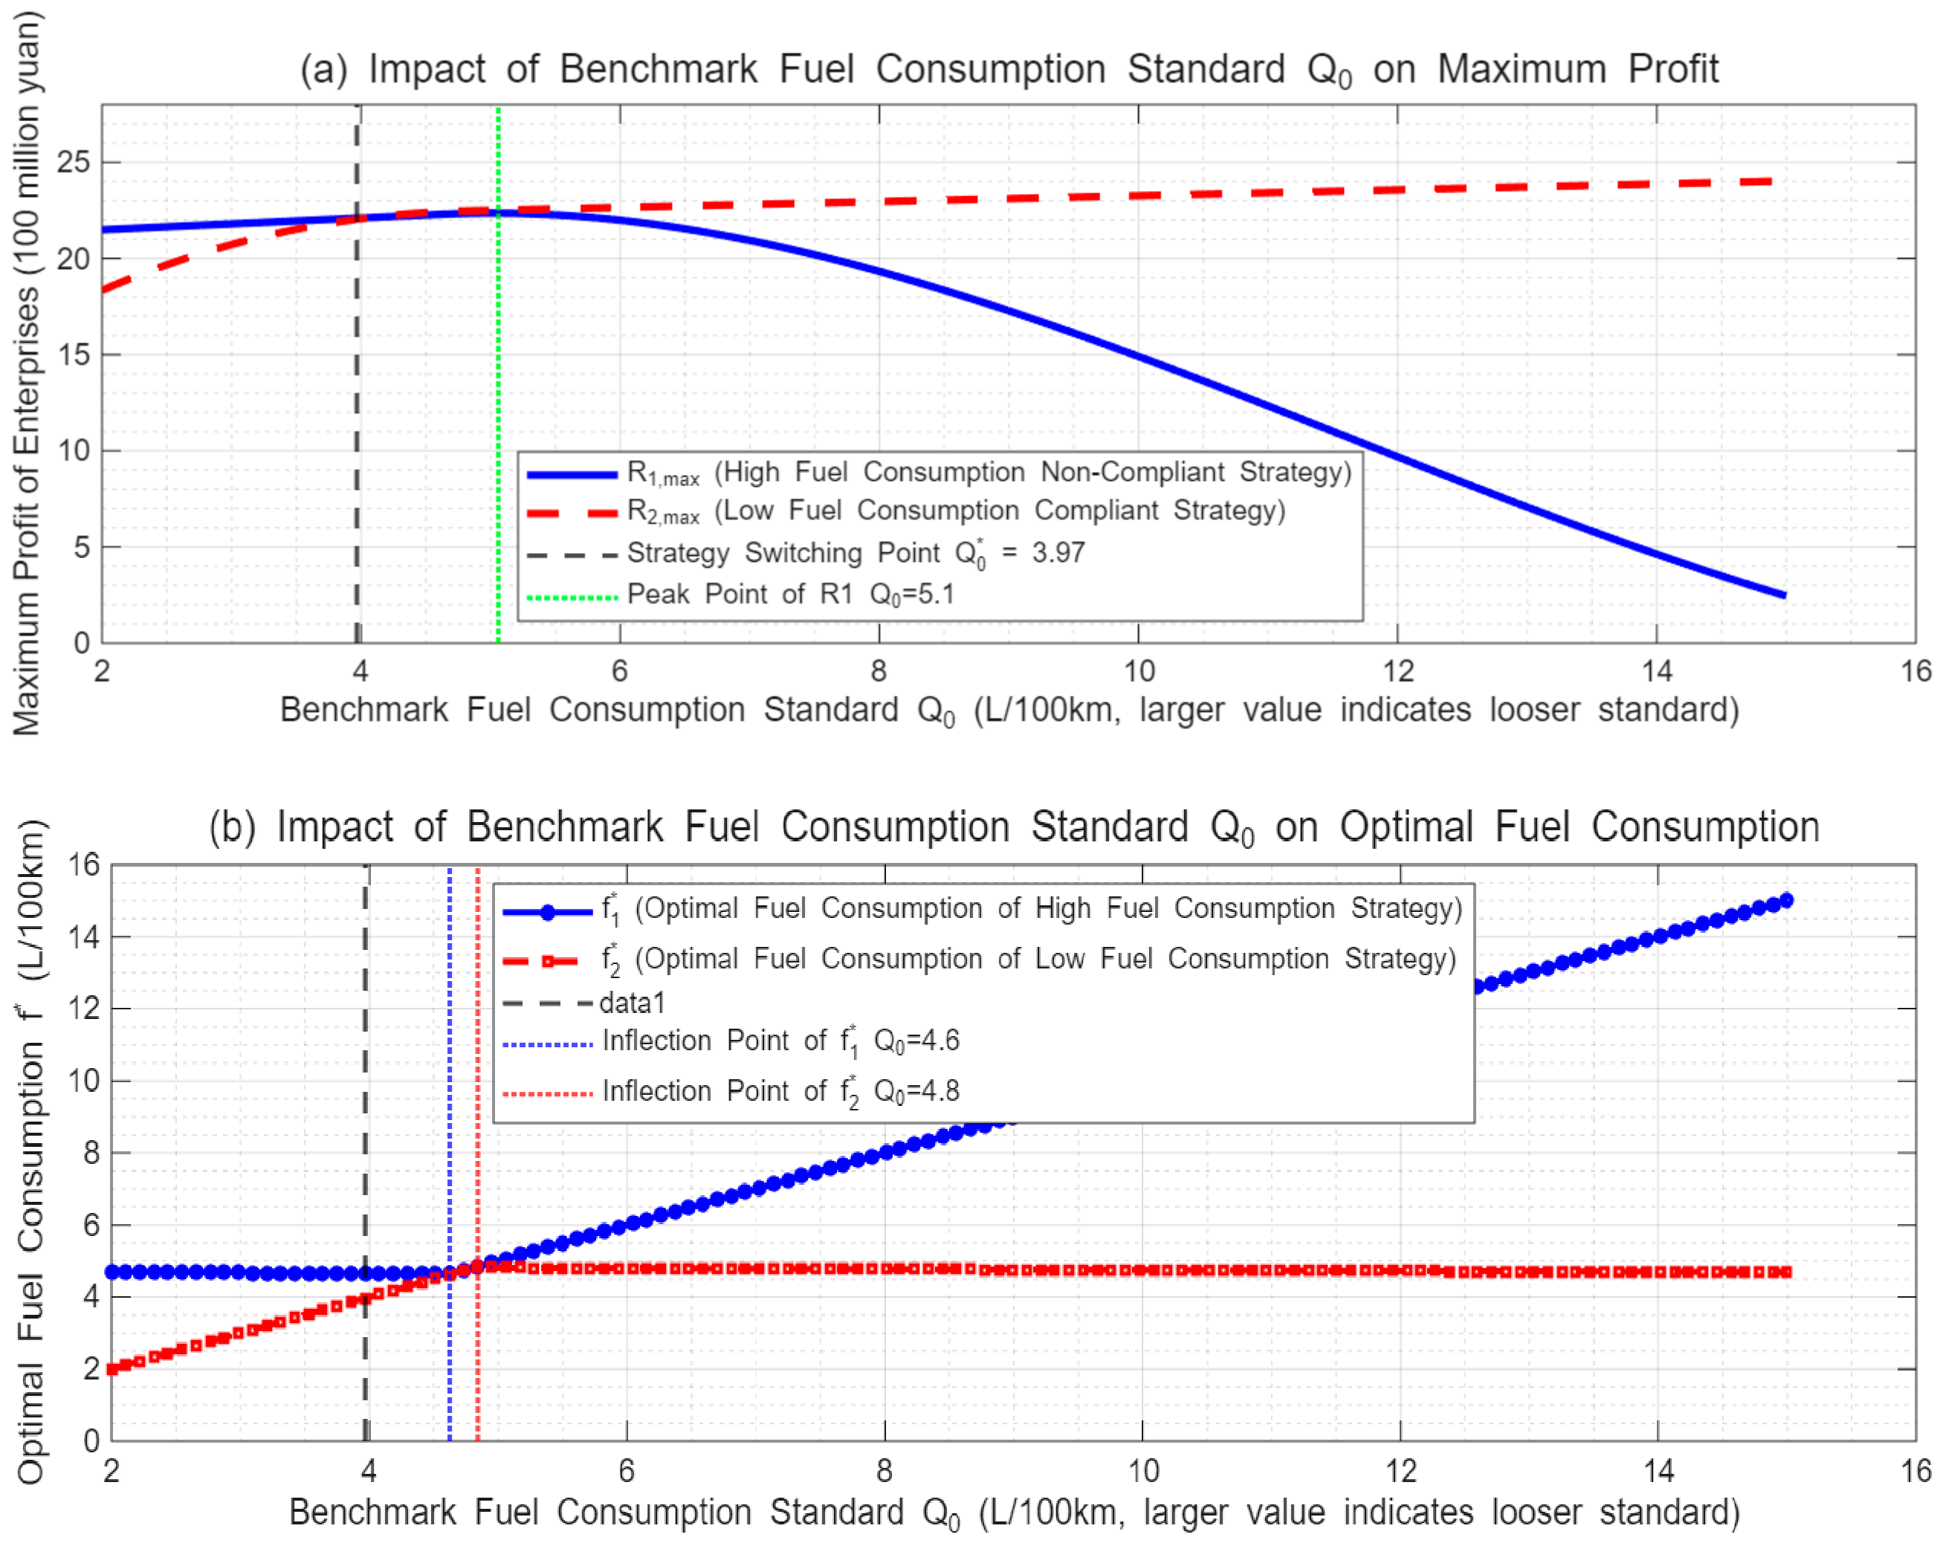
Figure 7 simulates the impact of the fuel consumption standard
: the maximum profit of the low fuel consumption strategy increases linearly with the relaxation of
; the maximum profit of the high fuel consumption strategy shows a single-peak pattern of first increasing then decreasing, with the peak appearing at
. The optimal fuel consumption of both strategies is non-decreasing with
, and there exists a unique critical value
within the industrial feasible interval, which divides the dominance intervals of the two strategies.
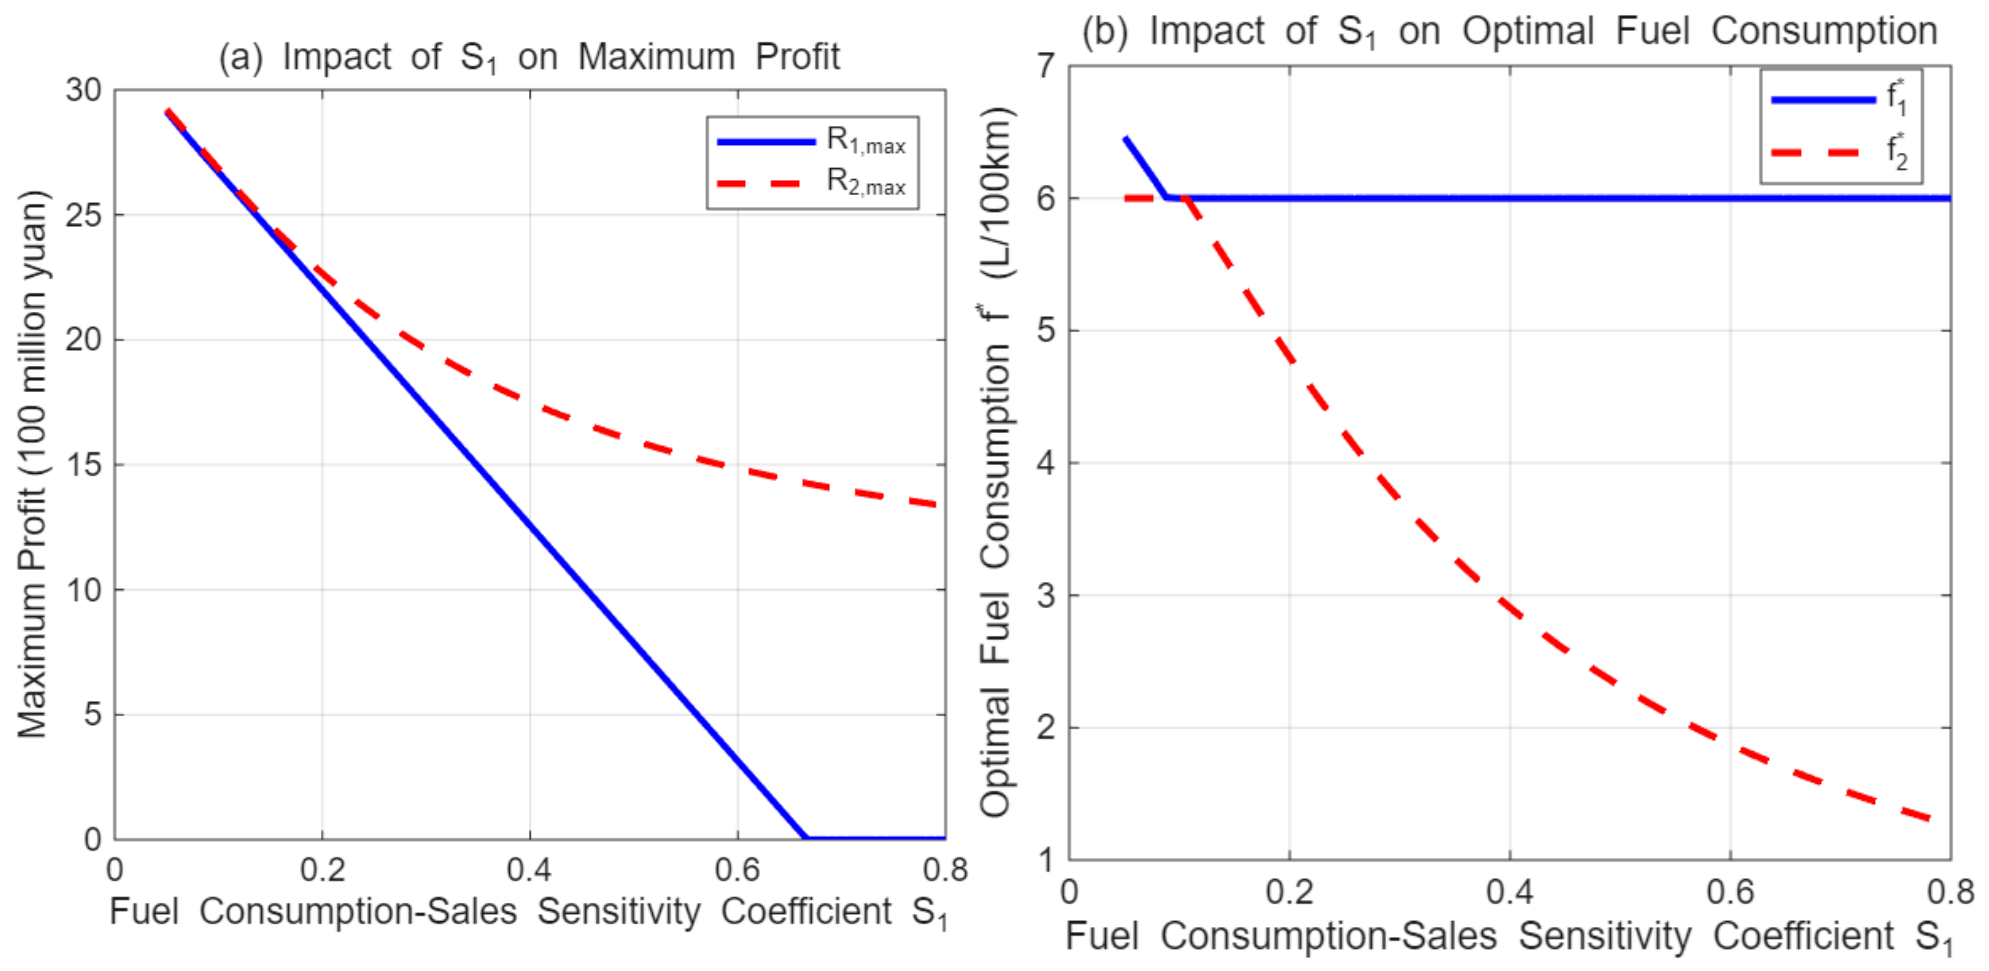
Figure 8 and
Figure 9 simulate the impact of the price loss intensity
and the fuel consumption sales sensitivity coefficient
respectively; an increase in both has a negative inhibitory effect on the profits of both strategies, with a stronger inhibitory effect on the high fuel consumption strategy, and simultaneously drives the optimal fuel consumption level to strictly decrease. There exists a unique critical value for both, and the low fuel consumption strategy is always dominant after exceeding the critical value. The above results verify Proposition 3–6.
5.2. Numerical Simulation Analysis of Optimal Production Decisions for New Energy Vehicle Manufacturers
For NEV manufacturers, according to the parameter assignment in
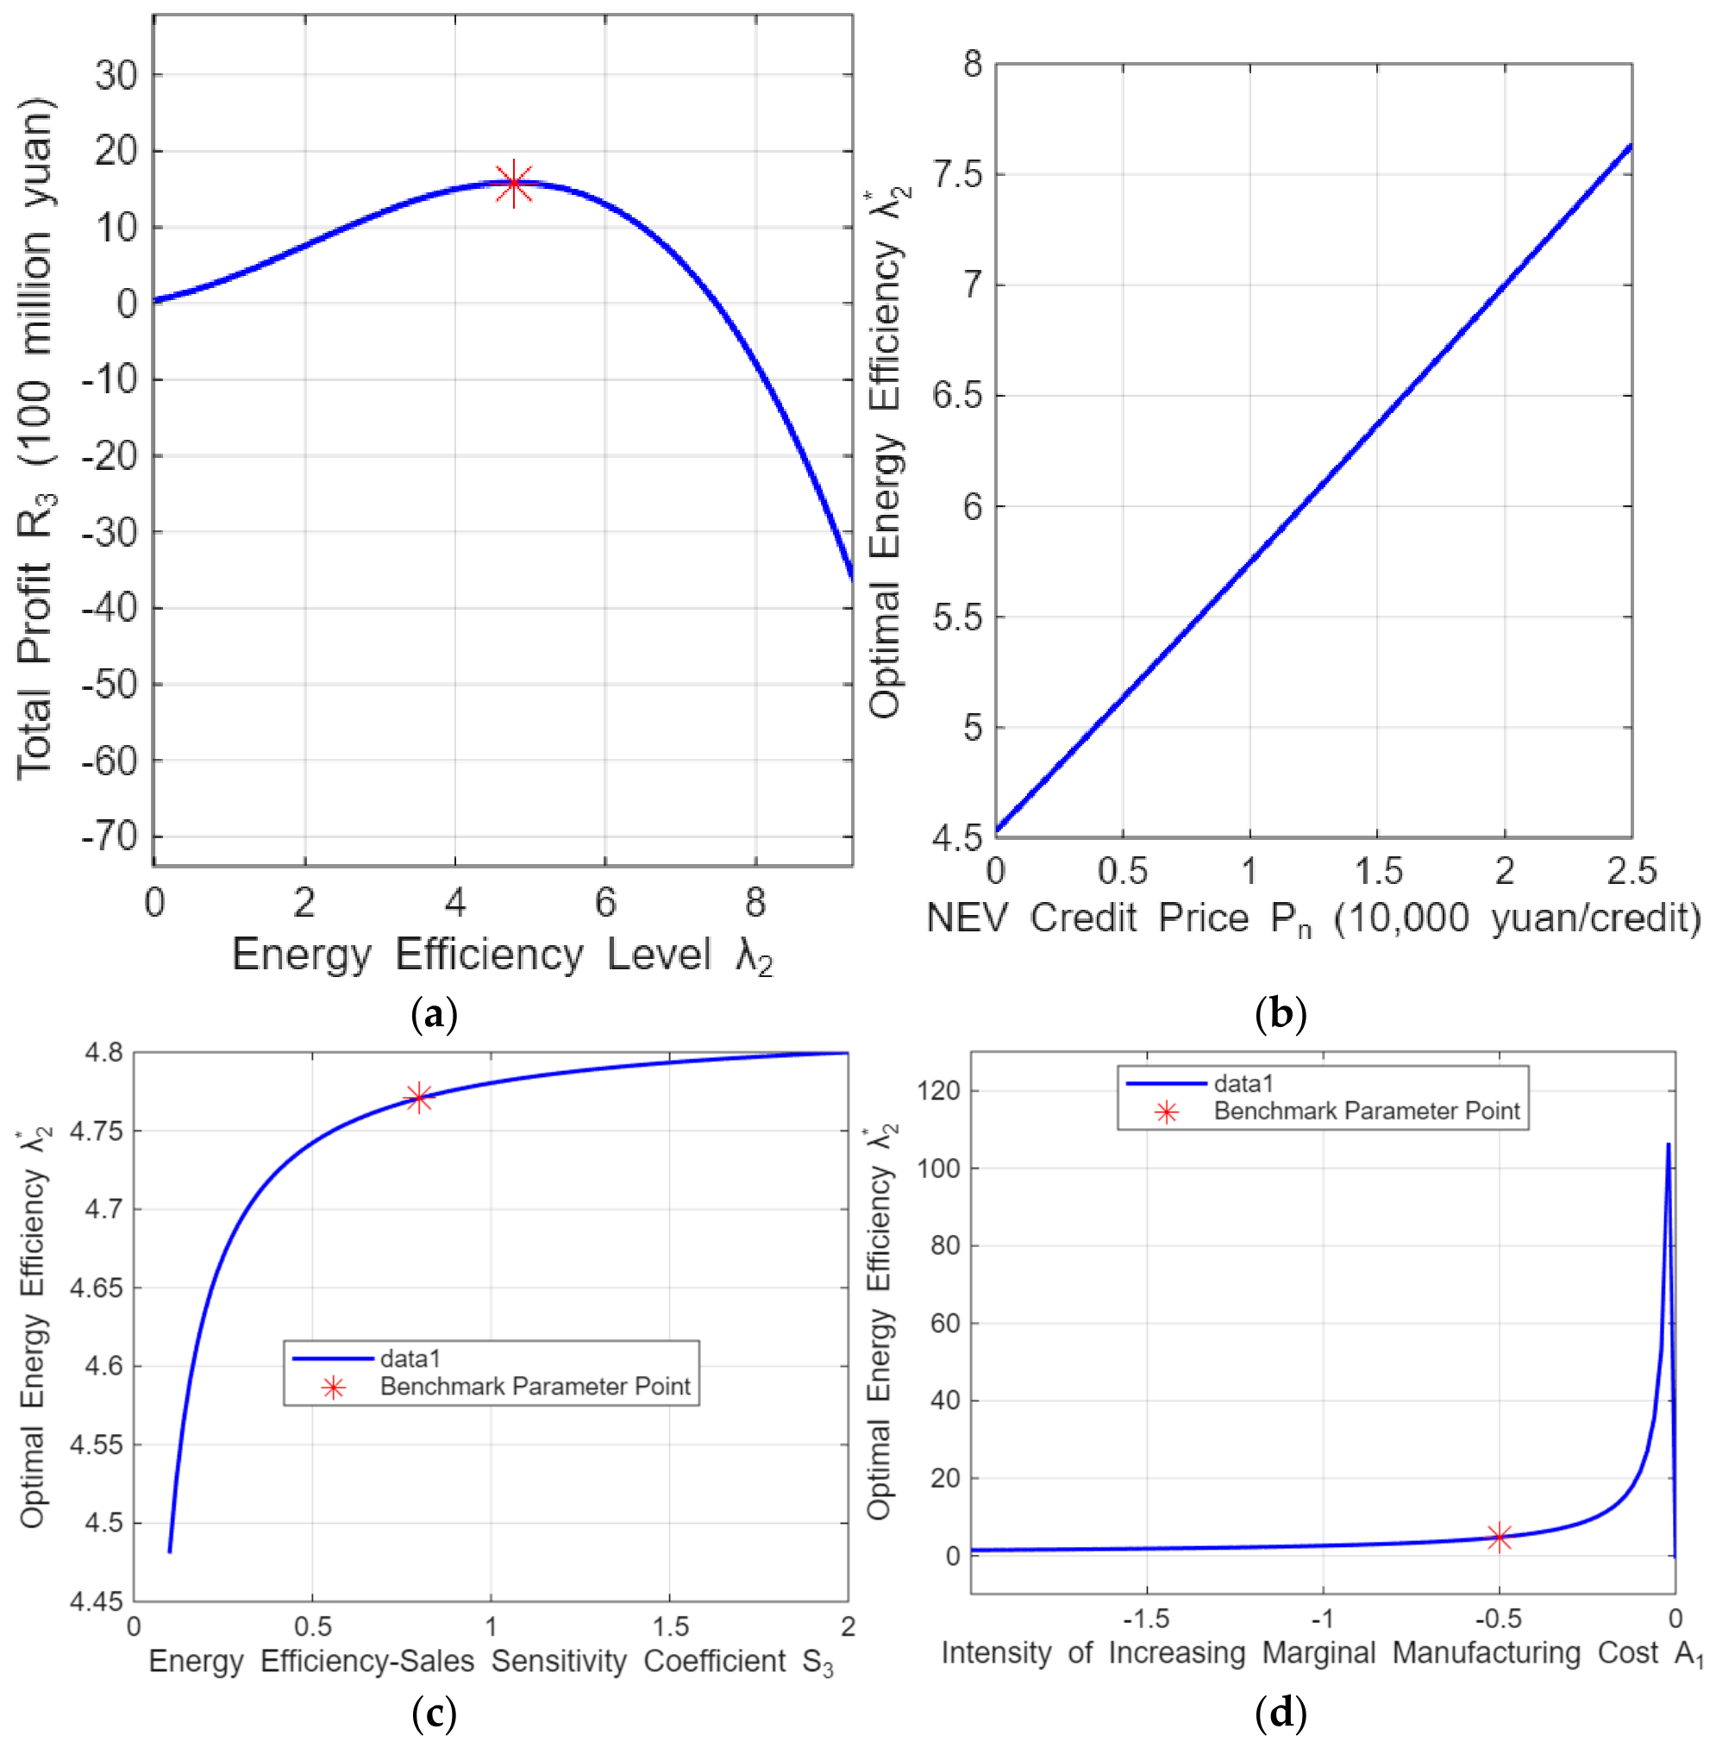
Table 2, we use MATLAB software to conduct numerical simulation analysis of the impact of NEV energy efficiency level on the manufacturer’s profit, and the results are shown in
Figure 10. It can be seen from
Figure 10a that the profit curve presents a standard single-peak shape, with a unique global optimal energy efficiency point
, which verifies the economic feasibility of the optimal solution.
Furthermore, we use numerical simulation to analyze the impact of NEV credit price, energy efficiency sales sensitivity coefficient, and R&D cost intensity on the production decisions of NEV manufacturers.
Figure 10b simulates the impact of the NEV credit price
: the optimal energy efficiency level shows a strictly linear increase with the rise of
, with no downward interval, which verifies the positive incentive effect of credit price on the energy efficiency upgrading of manufacturers, fully consistent with Proposition 7.
Figure 10c simulates the impact of the energy efficiency sales sensitivity coefficient
: the optimal energy efficiency level continues to increase with the rise of
, and the energy efficiency preference on the market demand side forms a significant positive pull on the technological upgrading of manufacturers, which verifies Proposition 8.
Figure 10d simulates the impact of the R&D cost intensity
: the optimal energy efficiency level continues to decrease with the rise of
, and the higher the marginal R&D cost of energy efficiency improvement, the lower the optimal energy efficiency level of manufacturers, which verifies Proposition 9.
5.3. Sensitivity Analysis of Critical Thresholds
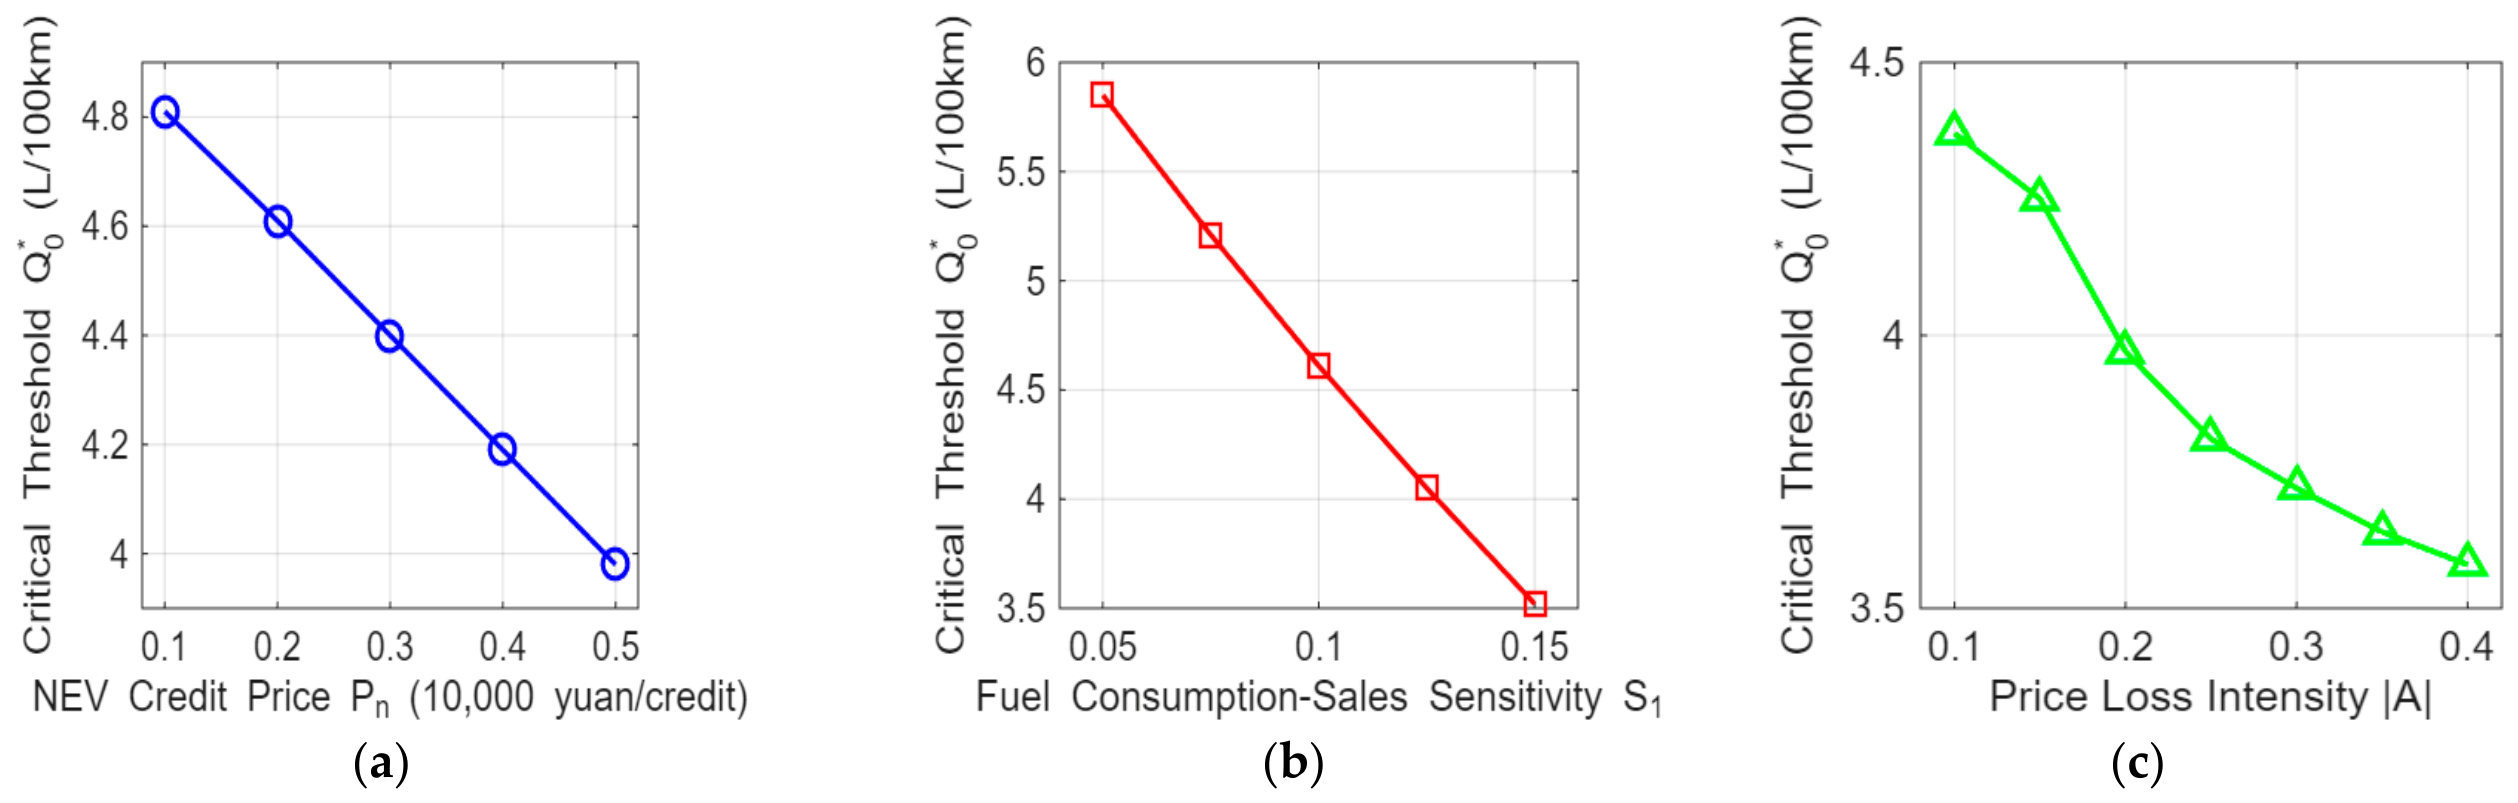
To evaluate the robustness of the critical thresholds identified in the theoretical model, we conduct a sensitivity analysis for the most policy-relevant threshold, i.e., the fuel consumption standard threshold
that determines the dominance of compliant vs. non-compliant strategies. We test how
changes with variations in three key parameters: NEV credit price (
), fuel consumption sales sensitivity (
), and price loss intensity (
). The results are presented in
Figure 11.
The sensitivity analysis shows that decreases monotonically from 4.81 to 3.98 L/100 km as increases from 0.1 to 0.5 ten thousand yuan/credit. This indicates that higher credit prices make the compliant strategy more attractive, lowering the threshold fuel consumption standard; decreases from 5.85 to 3.52 L/100 km as increases from 0.05 to 0.15. Higher consumer sensitivity to fuel consumption strengthens the market incentive for low-consumption vehicles. decreases from 4.37 to 3.58 L/100 km as increases from 0.1 to 0.4. Higher price penalties for high-consumption vehicles also favor the compliant strategy.
Importantly, all threshold values remain within the narrow interval of 3.5–6 L/100 km, which is consistent with China’s historical fuel consumption standards (the 2021 target was 5.0 L/100 km, the 2025 target is 4.0 L/100 km). This confirms that the critical thresholds are robust to reasonable parameter perturbations and are not artifacts of specific parameter choices. The results also provide policymakers with a range of feasible values for setting future fuel consumption standards.
6. Empirical Test
In the previous sections, we derived the optimal energy consumption decision model of automotive manufacturers under the Dual-Credit Policy through theoretical modeling and conducted numerical simulation analysis. In this section, using firm-level panel data of Chinese listed passenger vehicle manufacturers, we conduct an empirical test to examine the correlation between policy exposure and firms’ energy decisions and to provide real-world evidence supporting the theoretical mechanism. Given that real enterprises are mostly multi-product mixed firms, the empirical analysis serves as an aggregated-level consistency check rather than a strict structural validation of the single-product theoretical model.
6.1. Research Design
6.1.1. Sample and Data
We take A-share-listed passenger vehicle manufacturers in China from 2017 to 2024 as the research sample. After excluding ST enterprises, enterprises whose main business is not complete vehicle production, and samples with missing data, we finally obtain 22 manufacturers with 176 firm-year observations. Data are sourced from MIIT annual credit announcements, the CSMAR Database, CATARC, and CAAM. All continuous variables are Winsorized at the 1% and 99% levels to mitigate outlier bias. Standard errors are clustered at the firm level to account for serial correlation within firms.
6.1.2. Variable Definition
To avoid perfect collinearity between national-level policy variables and year fixed effects, we construct firm-level policy exposure variables by interacting national policy variables with the firm’s lagged FV sales share. This captures heterogeneous policy impacts on firms with different product structures, and aligns the empirical setting more closely with the multi-product reality of real manufacturers. Detailed definitions and theoretical mappings of all core variables are summarized in
Table 3.
6.1.3. Benchmark Model
We construct a two-way fixed effects panel model as the benchmark specification. We control for firm fixed effects (to absorb time-invariant firm heterogeneity) and year fixed effects (to absorb common macro shocks). Firm-level policy exposure variables vary across both firms and years, so they are not collinear with year fixed effects.
FV fuel consumption decision model:
where
is firm fixed effect,
is year fixed effect, and
is the error term.
NEV energy efficiency decision model:
6.1.4. Instrumental Variable Strategy
To address potential endogeneity (reverse causality and omitted variable bias), we adopt IV-2SLS with two Bartik-style shift-share instruments:
IV1: Initial FV share × international lithium price. We use each firm’s FV sales share in 2017 (the first sample year, pre-determined) multiplied by the annual average spot price of international lithium carbonate. Lithium is the core raw material for power batteries; its price affects NEV production costs and industry-wide credit supply, thus correlating with market credit prices. The initial firm structure is pre-determined, and the global lithium price is exogenous to individual Chinese automakers, satisfying the exclusion restriction.
IV2: Initial FV share × national NEV promotion policy index. We use the initial FV share multiplied by a national-level NEV promotion policy intensity index. Policy intensity affects overall NEV adoption and credit demand, correlating with credit prices, but is exogenous to individual firm decisions.
We acknowledge that these shift-share instruments may not fully satisfy the strict exclusion restriction. For example, lithium prices may also affect firms’ NEV R&D decisions through battery cost channels, and the NEV promotion policy index may influence market demand directly. We therefore treat the IV-2SLS estimation as a robustness check to mitigate endogeneity bias, rather than a perfect identification of causal effects. The results should be interpreted with appropriate caution.
6.2. Benchmark Regression Results
The baseline regression results for FV manufacturers’ fuel consumption decisions are reported in
Table 4.
The baseline regression results for NEV manufacturers’ energy efficiency decisions are shown in
Table 5.
Consistent with theoretical expectations, higher NEV credit price exposure, CAFC credit price exposure, NEV quota exposure, R&D intensity, and fuel consumption sales sensitivity all significantly reduce average FV fuel consumption. Looser fuel consumption standard exposure significantly increases optimal fuel consumption levels. The coefficient patterns of credit prices, quota requirements, fuel consumption standards and demand sensitivity are consistent with the predictions of Propositions 1–4 and 6.
For NEV manufacturers, NEV credit price exposure, R&D intensity, and energy efficiency sales sensitivity all have significantly positive coefficients. The positive associations of credit price exposure and demand sensitivity with energy efficiency are consistent with the predictions of Propositions 7 and 8. The negative coefficient of R&D intensity in the FV model and the positive coefficient in the NEV model align with the theoretical expectation that higher R&D capacity reduces the cost of energy efficiency upgrading. However, they do not constitute a direct structural test of Propositions 5 and 9.
6.3. Endogeneity Treatment
The IV-2SLS estimation results and corresponding diagnostic statistics are presented in
Table 6.
The first-stage F-statistic and Kleibergen–Paap F-statistic both exceed the Stock–Yogo 10% critical value of 19.93, rejecting the weak instrument hypothesis. The Hansen J overidentification test p-values are both greater than 0.1, failing to reject the null hypothesis of valid instruments. The endogeneity test rejects the null of exogeneity at the 5% level, confirming that IV estimation is necessary.
After addressing endogeneity, the core coefficients remain significant and have the expected signs, with slightly larger magnitudes than the benchmark results. After mitigating endogeneity bias, the estimated association between credit price exposure and manufacturers’ energy consumption decisions remains statistically significant, consistent with theoretical predictions.
6.4. Robustness Check and Heterogeneity Analysis
6.4.1. Alternative Variable Robustness Test
We conduct a robustness check by replacing core explained variables: we replace the FV fuel consumption indicator with the enterprise’s fuel consumption compliance rate, and replace the NEV energy efficiency indicator with the average driving range of models, then re-run the benchmark regression. The results show that the signs and significance of core explanatory variables are consistent with the benchmark regression, with only small changes in the absolute values of coefficients, indicating that the core conclusions of this paper have high robustness.
6.4.2. Heterogeneity Analysis
We conduct sub-sample regressions from two dimensions to examine heterogeneous policy effects. All sub-samples retain the same sign of core coefficients as the benchmark regression, confirming good external validity of the conclusions.
- (1)
Enterprise Scale: Grouped by the median of operating revenue, the inhibitory effect of credit price exposure on fuel consumption is significantly stronger for large enterprises (coefficient −0.312, significant at 1%) than for small and-medium-sized enterprises (coefficient −0.164, significant at 10%). This is consistent with the theoretical model: large firms face lower marginal costs of energy efficiency upgrading and respond more flexibly to policy incentives.
- (2)
Ownership Nature: Private and joint venture enterprises show stronger sensitivity to credit prices (coefficient −0.307, significant at 1%) than state-owned enterprises (coefficient −0.198, significant at 5%). Market-oriented firms align their decisions more closely with profit-maximization logic, while state-owned enterprises make more gradual adjustments due to broader policy responsibilities.
6.5. Threshold Effect Test
To empirically verify the piecewise characteristics and critical threshold effects derived from the theoretical model, we adopt the panel threshold model proposed by Hansen (1999) to test the nonlinear relationship between the Dual-Credit Policy and manufacturers’ energy decisions.
6.5.1. Model Specification
Taking firm-level NEV credit price exposure as the core threshold variable, we construct a single-threshold panel model for FV manufacturers’ fuel consumption decisions:
where
is the threshold value to be estimated,
is the indicator function (equals 1 when the condition holds, 0 otherwise), and all other variables are consistent with the benchmark model (20). The model can be extended to a multi-threshold framework if multiple thresholds are detected. We use the bootstrap method (300 replications) to test the significance of threshold effects and determine the number of thresholds.
For NEV manufacturers, we similarly construct a threshold model with per-vehicle NEV credits as the explained variable to verify whether the incentive effect of credit prices has nonlinear characteristics.
6.5.2. Threshold Existence Test
We sequentially test for the existence of zero, one, and two thresholds. The test results for FV manufacturers are reported in
Table 7.
The results show that the single-threshold effect is significant at the 1% level, while the double-threshold effect is not statistically significant. We therefore adopt the single-threshold model for analysis. The estimated threshold value of NEV credit price exposure is 0.087, with a 95% confidence interval of [0.079, 0.095].
For the NEV sample, the single-threshold test yields an F-statistic of 9.26 with a p-value of 0.342, indicating no significant threshold effect. This is consistent with the theoretical prediction that the incentive effect of credit prices on NEV energy efficiency is monotonically positive, supporting the linear specification of the benchmark model.
6.5.3. Threshold Regression Results and Interpretation
The single-threshold regression results for FV manufacturers are presented in
Table 8.
The results confirm a significant piecewise threshold effect:
When NEV credit price exposure is below the threshold (0.087), the inhibitory effect of credit prices on FV fuel consumption is relatively weak, with a coefficient of −0.124, only significant at the 10% level. When credit price exposure exceeds the threshold, the inhibitory effect is substantially strengthened, with a coefficient of −0.358, significant at the 1% level. The magnitude of the effect is nearly three times that of the low-exposure regime.
This empirical finding is highly consistent with the theoretical propositions. When credit prices are low, manufacturers may prefer to maintain high fuel consumption and purchase credits for compliance (non-compliant strategy); when credit prices rise above the critical threshold, the cost of non-compliance becomes too high, and manufacturers switch to the low-fuel-consumption compliant strategy, leading to a significant drop in average fuel consumption. This pattern is consistent with the critical threshold effect and strategy switching mechanism derived from the theoretical model.