Article

Assessment of Transition-Related Energy Security Instability in European Union Countries Using the DESRI Framework

by
Magdalena Tutak
1,*,
Jarosław Brodny
2,* and
Wieslaw Wes Grebski
3
1
Faculty of Mining, Safety Engineering and Industrial Automation, Silesian University of Technology, 44-100 Gliwice, Poland
2
Faculty of Organization and Management, Silesian University of Technology, 44-100 Gliwice, Poland
3
Penn State Hazleton, The Pennsylvania State University, 76 University Drive, Hazleton, PA 18202, USA
*
Authors to whom correspondence should be addressed.
Sustainability 2026, 18(13), 6749; https://doi.org/10.3390/su18136749
Submission received: 8 June 2026 / Revised: 24 June 2026 / Accepted: 25 June 2026 / Published: 3 July 2026
(This article belongs to the Special Issue Energy Security and Sustainable Energy Development)

Abstract

The article addresses the assessment of energy security instability associated with the energy transition process in the EU-27 countries under decarbonisation conditions. It introduces the original Dynamic Energy Security Risk Index (DESRI), interpreted as a synthetic measure of transition-related instability in the field of energy security. The index is structured around five analytical pillars: external dependence and security of supply, the climate and emissions dimension, efficiency and demand-related factors, structural and transformational characteristics of the energy mix, and the economic and social dimension. The empirical analysis covers the EU-27 countries over the period 2013–2023 and is based on 17 indicators obtained from European statistical sources. The dynamic nature of the model is captured through logarithmic rates of change, volatility analysis using a rolling time window, and the multilevel aggregation of instability components at the indicator and pillar levels. The results demonstrate that transition-related instability in the European Union varies considerably across both countries and time. The lowest DESRI values were recorded, among others, in Italy in 2018, Portugal in 2021, Belgium in 2017, and Austria in 2016, indicating relatively stable transition trajectories in those years. By contrast, the highest levels of instability occurred in Estonia in 2017–2018 and Luxembourg in 2022–2023, reflecting rapid and irregular changes in selected dimensions of the energy transition. The analysis also revealed periods of accumulated transition-related instability, particularly in 2017–2019 and 2021–2022, when the irregularity of transition pathways increased simultaneously in numerous countries. These findings show that energy transition-related instability depends not only on the level of transition advancement but also on the pace, volatility, and irregularity of structural changes. Countries with a relatively favourable static energy security or decarbonisation profile may therefore exhibit elevated dynamic instability when the transition proceeds rapidly or unevenly or requires intensive infrastructural, regulatory, and social adjustments. The article’s main contribution is the development of a replicable dynamic assessment framework that complements conventional static approaches to energy security analysis by identifying instability embedded in transition trajectories. DESRI provides an additional comparative perspective for monitoring the energy transition in the European Union. It may also support the identification of countries and policy areas requiring particular attention regarding security of supply, decarbonisation, demand-side efficiency, structural change, and the social acceptability of transition costs.

1. Introduction

Energy security constitutes one of the key pillars of the economic, social, and political stability of individual countries. Traditionally, it has been primarily associated with ensuring the continuity of energy supply at acceptable costs and with limiting dependence on external sources [1,2]. However, in recent years the significance of this concept has undergone a fundamental evolution, mainly due to the growing social awareness of the need to protect the natural environment [3,4]. As a result of this process, renewable energy sources have been developing, and the importance of energy efficiency has been steadily increasing [5,6]. All these phenomena, together with increasingly ambitious climate targets adopted by various international bodies, have led to a significant acceleration of energy transition processes. A very important aspect of this transition is that energy security is increasingly perceived as a complex, dynamic, and multidimensional process rather than as a phenomenon that can be adequately described solely by static indicator values. This perspective is further reinforced by the dynamically changing geopolitical situation worldwide [7,8].
This change in the understanding of energy security is particularly evident in the European Union, which is implementing an ambitious plan to decarbonize its economy [9,10]. At the same time, the EU seeks to reduce its dependence on imports of energy resources, reform the energy market, and maintain the social acceptability of the costs of the transition. The energy crises of recent years, especially after 2020 (the COVID-19 pandemic and the war in Ukraine), have shown that even systems considered relatively secure can become vulnerable to shocks (e.g., price shocks), supply disruptions, or regulatory pressure within a short period of time. In this context, it becomes necessary to move beyond classical approaches to assessing energy security in favour of more dynamic ones that are capable of capturing the dynamics of ongoing changes. Such analyses require consideration of the pace, direction, and instability of these changes.
The traditional approach to energy security assessment, most often based on static indicator values, may lead to misleading conclusions under current conditions of rapid change. Therefore, it becomes crucial to shift the focus from assessing the “state” of energy security to assessing the temporal instability of transition-related processes, understood as a function of the pace, variability, and irregularity of structural change.
With reference to this highly important and timely issue, the objective of the present study was formulated. Its aim is to propose and empirically test a composite framework for assessing transition-related instability in selected dimensions associated with energy security, using the example of European Union countries. For this purpose, the study introduces the Dynamic Energy Security Risk Index (DESRI), which is interpreted here as a composite measure of transition-related energy security instability.
In this study, transition-related instability and risk are treated as related but distinct concepts. Transition-related instability refers to the observed pace, volatility, and irregularity of changes over time in selected energy security and energy transition indicators. It is therefore an empirically measurable characteristic of transition trajectories. Risk, by contrast, is understood as a potential vulnerability or pressure that may arise when these changes are rapid, uneven, or difficult for the energy system, economy, or society to absorb. DESRI does not therefore measure risk in the strict probabilistic sense, understood as the probability and consequences of a specific disruptive event. Instead, it measures dynamic instability that may signal elevated transition-related risk in selected dimensions of energy security.
To achieve the stated objective, the following research questions were formulated:
  • RQ(1): How do EU-27 countries differ with respect to transition-related instability in key dimensions associated with energy security?
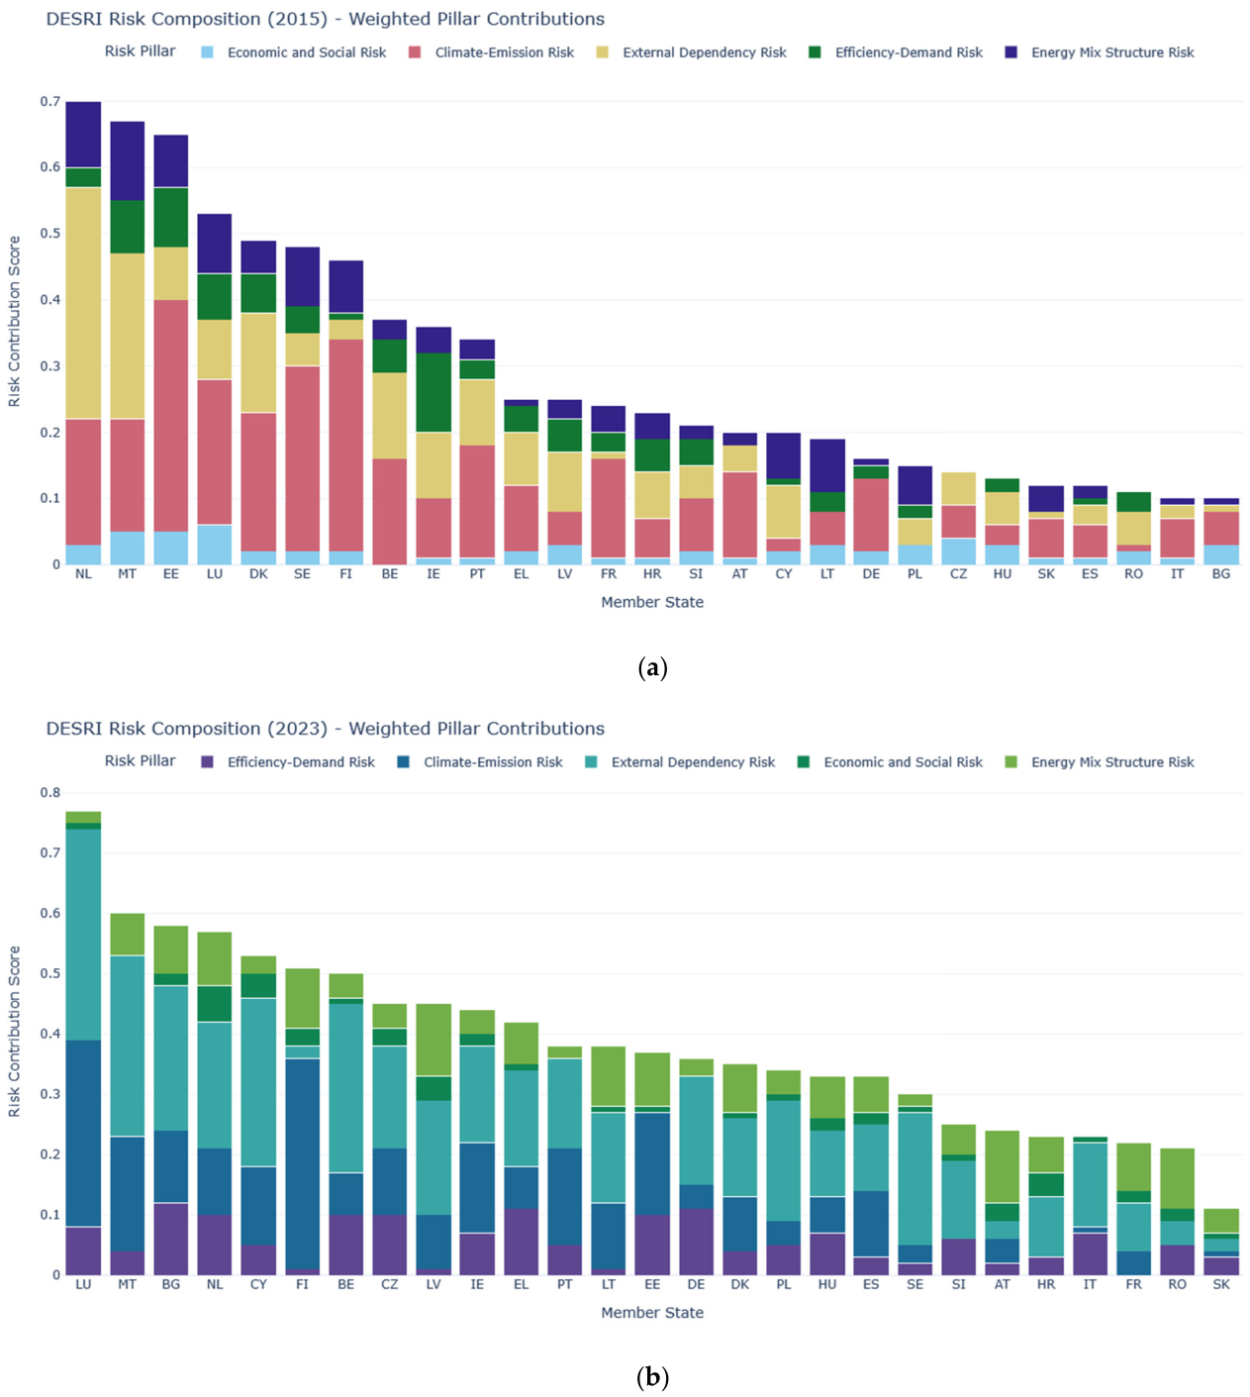
  • RQ(2): Which dimensions contribute most strongly to the composite index across countries and over time?
  • RQ(3): To what extent does the proposed framework complement conventional static assessments of energy security?
To achieve the research objective and answer the research questions, the Dynamic Energy Security Risk Index (DESRI) was developed as a composite measure of transition-related instability in the field of energy security. The index is structured around five analytical pillars: external dependence and security of supply, climate and emissions risk, efficiency and demand-related factors, structural and transformational characteristics of the energy mix, and the economic and social dimension. The empirical analysis covered the EU-27 countries over the period 2013–2023 and was based on 17 indicators obtained from European statistical sources.
The originality of the proposed approach lies in explicitly recognising transition-related instability as a distinct dimension of energy security assessment. Unlike conventional approaches, which generally focus on the static values of indicators in a given year, DESRI enables the analysis not only of the state of the energy system but also of the stability of the pathway leading to that state. The novelty of the study comprises four principal dimensions:
Conceptual dimension. This involves shifting the research perspective from assessing the static level of energy security to evaluating the instability of transition trajectories. The analysis therefore considers not only the level of energy security or transition advancement achieved by a country but also whether the process of reaching that state is stable, gradual, and capable of being absorbed by the energy system, economy, and society.
Methodological dimension. This concerns the development of the composite DESRI index, which combines the levels of selected indicators with the dynamics of their changes, including the pace, volatility, and irregularity of their trajectories over time. Unlike conventional composite indices, DESRI does not focus exclusively on indicator values in a given year. Instead, it enables the identification of situations in which similar static energy profiles correspond to different transition pathways, either stable or rapid and irregular.
Empirical dimension. This involves applying a uniform and replicable assessment procedure to all EU-27 countries over the period 2013–2023, using 17 indicators obtained from harmonised European statistical sources. This makes it possible to compare countries in terms of their levels of dynamic transition-related instability, identify periods in which instability accumulates, and determine the dominant areas of transition pressure.
Practical dimension. This consists of providing a tool that complements existing static energy security assessments by incorporating the stability of the transition process. DESRI can support energy transition monitoring by identifying countries and pillars in which changes are rapid, irregular, or potentially difficult to absorb. In this sense, the proposed method does not replace conventional energy security assessments but extends them by adding a dynamic perspective on transition-related instability.
The novelty defined in this way also has practical relevance. Under conditions of accelerated decarbonisation, the growing role of renewable energy sources, geopolitical tensions, and social pressure associated with energy costs, information concerning the current level of energy security alone is insufficient. From a public policy perspective, it is also important to determine whether changes within the energy system are proceeding in a stable manner and can be absorbed by the economy, infrastructure, and society. DESRI addresses this need by enabling the identification not only of the levels of selected indicators but also of the dynamics and irregularity of their changes over time.

2. Literature Review

The assessment of energy security and energy transition is one of the most frequently addressed issues in contemporary research on energy policy and sustainable development. The existing literature indicates that energy security is multidimensional and encompasses at least such areas as continuity of supply, energy availability and affordability, energy efficiency, import dependence, environmental impacts, infrastructure resilience, and the social consequences of the transition [11,12]. With the acceleration of the energy transition, this concept is increasingly analysed not only as the state of the energy system at a given point in time [13,14,15], but also as a process shaped by technological, regulatory, geopolitical, and socioeconomic changes [16]. This section presents the main strands of research on energy security and energy transition assessment and subsequently identifies the research gap that justifies the development of the DESRI framework as a tool for measuring transition-related instability.

2.1. Static Indicator-Based Approaches to Energy Security Assessment

Most existing studies on the measurement and assessment of energy security rely on static or cross-sectional evaluations based on selected indicators. Such analyses primarily focus on determining the state of energy security in a country, region, or group of countries at a given point in time, usually a particular year, or over a selected period. The indicators most commonly used in these studies include the share of renewable energy sources in final energy consumption, greenhouse gas emissions, energy import dependence, diversification of energy sources, energy intensity, energy productivity, and energy prices.
Within this research strand, Sovacool [17] analysed energy security from an international perspective, emphasising its multidimensional character, encompassing energy availability, affordability, efficiency, and environmental impacts. Radovanović et al. [18] developed an indicator-based approach to measuring energy security from a sustainable development perspective by integrating economic, social, and environmental dimensions. Erahman et al. [19] developed an energy security index for Indonesia, while De Rosa et al. [20] examined the diversification, concentration, and renewability of energy supply in European Union countries. In the European context, Brodny and Tutak [21] assessed the sustainable energy security of the Visegrad Group countries, Bąk et al. [22] analysed spatial differences in energy security across EU countries, and Kuzior et al. [23] investigated the energy security of EU Member States in the context of renewable energy development.
Static approaches also underpin composite indices and comparative rankings, such as the World Energy Trilemma Index [24] and the Energy Transition Index [25]. The former compares countries in terms of energy security, energy equity, and environmental sustainability, while the latter assesses countries’ readiness for the energy transition and the performance of their energy systems. Similar approaches employing multicriteria methods have been applied by Gardumi et al. [26], Kamali Saraji and Streimikiene [27], and Brodny and Tutak [28], among others.
Despite their significance, these studies also have certain limitations:
static indicators primarily describe the level of transition at a given point in time, usually a particular year, rather than the course of the transition process itself;
countries with similar indicator values in a given year may follow different transition trajectories, ranging from stable and gradual to rapid and irregular;
despite their considerable comparative value, composite indices generally aggregate indicator levels rather than their variability over time.
Consequently, static approaches have a limited capacity to identify the pace, irregularity, and potential instability of the energy transition.

2.2. Dynamic Approaches to Energy Transition and Energy Security Assessment

In response to the limitations of static approaches, the literature increasingly employs dynamic methods that account for changes in indicators over time, the pace of transition, and the evolution of selected dimensions of energy security. Unlike cross-sectional analyses, these approaches assume that not only the level of a given indicator is important, but also the direction, pace, and variability of its changes over time.
An example of this approach is provided by Gong et al. [29], who examined the dynamic evolution of China’s energy security using functional data analysis. The authors demonstrated that temporal trajectories provide information that cannot be captured through conventional cross-sectional analyses. Zhang and Zhou [30], in turn, proposed a variance-based approach to energy security risk assessment that accounts for the effects of external shocks and system variability. In research concerning the European Union, Ziemba and Zair [31] conducted a temporal analysis of the energy transition in EU countries and identified differences in the pace of change among Member States. Ziemba [32] also proposed a dynamic multicriteria framework for energy security assessment that accounts for changes in evaluation criteria over time. Tutak et al. [33] proposed the Dynamic Energy Transition Assessment (DETA) method, which integrates an assessment of the level of energy transition advancement, the degree of balance among its key pillars, and the dynamics of changes over time. This approach makes it possible to analyse the current state of the transition together with its quality, coherence, pace, and direction.
The dynamic energy transition assessment strand also includes the study by Brodny et al. [34], who proposed the Energy Transition Efficiency Index (ETEI) to assess empirically the efficiency of the energy transition in the EU-27 countries over the period 2013–2023. Unlike conventional static approaches, this method is based on indices reflecting the dynamics of changes in selected indicators.
The contribution of these studies lies in shifting attention from the level of energy security itself to the process through which it changes. Dynamic approaches demonstrate that two countries with similar indicator levels may differ in terms of transition stability. They also indicate that variability and sudden accelerations or slowdowns in the pace of change may affect the resilience of energy systems.
At the same time, a critical assessment of this research strand reveals that the literature on change dynamics remains heterogeneous. Individual studies differ in how they define dynamics: some focus on trends, others on changes between periods, and still others on system responses to external shocks. It should also be emphasised that, despite growing interest in dynamic approaches, their number remains relatively limited, particularly compared with the prevailing static and ranking-based analyses. Existing dynamic studies represent an important direction in the development of energy transition assessment methods. Nevertheless, further research is required, particularly regarding the explicit operationalisation of instability, international comparability, and the integration of transition pace and variability within a composite index applicable to all EU countries.

2.3. Risk-Based Approaches and the Systemic Disruption Perspective

A separate strand of energy security research employs the concept of risk. Within this perspective, risk is generally understood as the energy system’s exposure to external disruptions, such as fuel import dependence, geopolitical instability, energy price volatility, supplier concentration, supply-chain vulnerability, inadequate infrastructure, or regulatory uncertainty.
The conventional understanding of energy security from this perspective was presented by Yergin [35], who associated it primarily with the ability to ensure continuity of energy supply at affordable prices. Gorzeń-Mitka and Wieczorek-Kosmala [36] analysed the energy sector from a risk management perspective, emphasising the importance of investment, regulatory, market, and technological risks. Cincinelli and Pellini [37] examined the effects of geopolitical and climate risks on uncertainty in European electricity markets. Further contributions were provided by Axon and Darton, whose studies addressed both sources of risk in fuel supply chains [38] and risk profiles under low-carbon transition scenarios [39]. In response to the limitations of classical energy security indices, risk-oriented approaches have also emerged in the literature. One example is the Energy & Climate Security Risk Index (ECSRI) [40], which integrates energy and climate security dimensions and assesses the relative vulnerability of energy-climate systems to disruptions and crises. However, ECSRI is mainly based on aggregated indicator levels compared across years, while the dynamics of change are not modelled as a separate risk component. As a result, it captures temporal variation only indirectly and does not explicitly account for the pace, irregularity, or volatility of transition trajectories. Therefore, although ECSRI operationalizes the concept of risk, it has limited capacity to identify transition-related risks arising from abrupt or uncoordinated structural changes.
Risk-based approaches demonstrate that energy security depends not only on macro-statistical indicator levels but also on infrastructure, trade relations, supply chains, technological dependencies, and the system’s vulnerability to disruptions. These approaches are particularly relevant in the context of energy crises, geopolitical tensions, and instability in energy markets.
Their limitation, however, is that they focus primarily on threats originating outside the energy system. They less frequently examine the energy transition itself as a potential source of internal risk. Meanwhile, the rapid growth of renewable energy, the need to adapt electricity grids, the phase-out of conventional generation capacity, rising household energy costs, and regulatory uncertainty may generate temporary technical, economic, and social pressures. Existing approaches capture this problem only partially, as they tend to measure exposure to disruptions rather than the instability of the transition process itself.

2.4. Research Gap and Positioning of the DESRI Framework

Based on the literature review, the following research gaps can be identified:
Regarding indicators, the measurement of the levels of analysed phenomena continues to dominate, while the pace, direction, and variability of their changes over time are considered relatively infrequently.
Regarding the scope of analysis, there is a lack of comparable studies covering all EU-27 countries within a uniform methodological framework, which limits the systematic comparison of transition trajectories across countries.
Regarding methodology, many composite indices focus on aggregating indicator values but do not directly model the instability of transition trajectories, understood as variability in the pace of progress and the occurrence of accelerations, slowdowns, or temporary reversals.
Regarding mathematical models, the two dimensions of process dynamics, namely the pace of change and the variability of that change over time, are rarely combined into a single component measure that can subsequently be aggregated at the pillar and composite-index levels.
Regarding evaluation frameworks, there is a lack of a tool that complements conventional energy security assessments with the dimension of transition-related instability, enabling the identification not only of the current level of energy security but also of the durability, stability, and resilience of the process leading to that state.
The DESRI index developed and presented in this study addresses these research gaps. The proposed DESRI methodology complements conventional approaches by introducing a dynamic assessment perspective. Its analytical value lies in its ability to identify not only countries characterised by high or low levels of selected indicators but also those in which the transition proceeds rapidly, irregularly, or in a potentially destabilising manner. DESRI therefore captures the pace, volatility, and irregularity of change as a distinct dimension of energy security assessment under transition conditions. This clarification is important because the proposed framework does not equate instability with risk in a direct causal sense. Instability is treated as an observable dynamic state that may increase the likelihood of transition-related pressures or vulnerabilities. Risk therefore constitutes an interpretative layer based on measured instability rather than a separate probabilistic risk model.

3. Materials and Methods

3.1. Data

The study employed a set of 17 indicators identified on the basis of a review of the relevant literature, which are widely used in analyses of the energy transition and energy security, particularly in European Union countries. The selection of indicators reflects the key dimensions of EU energy policy, especially objectives related to security of supply, decarbonization, energy efficiency, system stability, and the social acceptability of transformation costs. The underlying data for these indicators were sourced from the Eurostat database [41] and the Energy Statistical Pocket Book [42] for the period 2013–2023. Because the instability component of the index is estimated using a rolling window, the final DESRI values are reported for 2015–2023. The selection of 2013 as the initial year resulted from the availability of comparable data for all EU-27 countries and the need to calculate dynamic measures based on lagged changes and volatility estimated using a rolling window. Although the final DESRI values are reported for 2015–2023, the earlier observations are required to calculate the initial dynamic components of the index. The analysis included only indicators for which sufficient cross-country comparability and temporal continuity could be ensured across all EU-27 countries. Because the instability component is estimated using a three-year rolling window, the final DESRI values cover the period 2015–2023.
The initial pool of variables was identified through a targeted review of the literature on energy security, energy transition, composite indicators, and EU energy policy monitoring (e.g., [33,34,43,44,45,46,47,48,49,50,51,52,53,54]). Indicator selection was then constrained by four criteria:
substantive relevance to the analytical objective of the study,
availability for all EU-27 countries over the study period,
cross-country comparability, and
limited redundancy with other candidate variables.
The selected indicators were not intended to exhaust the concept of energy security in all its dimensions. They were chosen to represent those dimensions of the energy transition that can be observed consistently in harmonised macro-statistical data and that are relevant to comparative analysis in the EU context.
The grouping of indicators into five pillars was conducted ex ante on conceptual grounds, drawing on recurring themes in the literature and on the structure of EU energy and climate policy objectives. These pillars are: structural and transformational characteristics of the energy mix, climate and emissions pressure, efficiency and demand-side performance, economic and social affordability, and external dependency and resilience of supply. Thus, the pillars should be understood as an analytical classification adopted for this study, rather than as universally binding categories of energy security.
They were derived from the intersection of three considerations: the multidimensional character of energy security discussed in the literature, the main domains repeatedly addressed in EU energy policy, and the practical requirement that indicators should be measurable consistently for all EU countries over time.
The first pillar is structural and transformational risk of the energy mix, which reflects the degree and direction of changes in the structure of energy generation and the system’s capacity to integrate new technologies. This pillar includes the following indicators: the share of energy from renewable sources in final energy consumption (RES share), the share of emission-intensive energy sources in the energy mix, the diversification of the energy mix measured by the Herfindahl–Hirschman Index (HHI), and the cumulative installed capacity in wind and solar power. This set of indicators makes it possible to capture both the direction of the transition (decarbonization of the energy mix) and its potential systemic risks resulting from technological concentration or the rapid expansion of intermittent generation sources.
The second pillar is climate and emissions risk, which directly relates to the achievement of EU climate objectives and the environmental pressure generated by the energy system. It comprises total greenhouse gas emissions per capita (Total GHG per capita), the emissions intensity of the economy measured as GHG emissions per unit of energy (GHG intensity of energy), and the indicator of premature deaths attributable to exposure to fine particulate matter PM2.5. This approach enables simultaneous analysis of emission levels, energy-emission efficiency, and the health impacts of the transition, which are increasingly taken into account in EU climate policy.
The third pillar represents efficiency and demand-related risk, referring to the economy’s ability to reduce energy demand and improve the efficiency of energy use. Within this pillar, the following indicators are included: energy intensity of the economy (energy intensity), energy productivity, final energy consumption in households per capita, primary energy consumption per capita, and transformation and distribution losses in the energy system. This set of indicators allows for the identification of risks related to excessive energy demand, low system efficiency, and limited capacity to implement the “energy efficiency first” principle.
The fourth pillar covers economic and social risk, reflecting the acceptability of the costs of the energy transition and its impact on household well-being. This area includes: the share of the population unable to adequately heat their homes due to energy poverty, household electricity prices, and adjusted gross disposable household income per capita. The inclusion of these indicators makes it possible to assess whether the pace and direction of the energy transition generate social risks that may constrain its durability and political stability.
The final pillar is external dependency and energy system resilience risk, which constitutes a key dimension of security of supply in EU energy policy. This pillar is represented by the energy import dependency indicator and the energy self-sufficiency ratio. These indicators allow for the assessment of the vulnerability of energy systems to external disruptions, including geopolitical and commodity shocks, as well as countries’ capacity to maintain continuity of supply under crisis conditions.
For clarity, the analytical structure of the DESRI framework is summarised in Table 1. The table presents the five pillars, their conceptual focus, the number of indicators assigned to each pillar, and examples of indicators used in the empirical analysis.
All indicators used in the study were obtained from the international, publicly available, and open Eurostat database, which ensures cross-country comparability and full replicability of the research results. The time span of the data covers the years 2013–2023. It should be noted, however, that the DESRI index values presented in the study refer to the period 2015–2023, which results from the adoption of a three-year rolling window (k = 3) in the procedure for estimating the volatility component. The application of this approach allows for a stable assessment of the instability of change trajectories while maintaining adequate sensitivity of the index to transformational impulses.
The indicators used in the study are compiled and described in detail in Table 2.

3.2. Methods

3.2.1. Methods for Assigning Weights to Indicators Within the Analysed Pillars

The weights of the indicators used in the study were determined using two data-driven statistical procedures, the entropy method and the Criteria Importance Through Intercriteria Correlation method (CRITIC), and were subsequently aggregated using the Laplace criterion. Such an approach is increasingly applied in the literature [28,33,34,55], as it combines complementary perspectives on assessing indicator importance and helps to reduce the arbitrariness of weight assignment.
The use of two data-driven weighting methods was motivated by the need to limit a one-sided assessment of indicator importance within the individual DESRI pillars. Both methods draw on the informational properties of the data, but they emphasise different aspects of criterion importance. The entropy method assigns greater importance to indicators exhibiting greater differentiation in their values, as higher variability implies a stronger capacity to discriminate among the analysed objects. Its limitation, however, is that it does not account for relationships between indicators. Consequently, an indicator that is highly variable but also strongly correlated with other variables may receive a relatively high weight despite providing limited additional information. The CRITIC method addresses this limitation by considering not only indicator variability but also the degree of informational conflict among indicators, measured through correlations. Under this approach, indicators characterised by high variability but strongly associated with other variables are treated more cautiously, whereas greater weights may be assigned to criteria that provide more distinct diagnostic information. However, the CRITIC method is more sensitive to the correlation structure of the dataset and may reduce the importance of indicators that are substantively relevant but statistically associated with other variables. The combined application of the entropy and CRITIC methods therefore integrates two complementary criteria of informativeness: differentiation in indicator values and non-redundancy relative to the remaining variables. Consequently, the final weighting system is based neither solely on data dispersion, as in the entropy method, nor exclusively on the combination of variability and correlation structure, as in the CRITIC method. Integrating these methods reduces the risk that a single statistical rationale will exert excessive influence on the results and improves the stability of the weighting procedure.
In the first stage, the entropy method was applied, in which indicator weights are determined based on the degree of variation in their values [56,57]. After preliminary normalisation of the data, their relative shares were calculated (Equation (1)):
p i j = x i j i = 1 n x i j
where p i j denotes the relative share of country i in the value of indicator j.
Next, the informational entropy of the indicator was calculated as:
e j = k i = 1 n p i j ln ( p i j )
where
k = 1 ln ( n )
and e j [ 0 ,   1 ] determines the degree of disorder of the information contained in indicator j.
On this basis, the degree of information diversification was calculated as:
d j = 1 e j
followed by the entropy-based weights:
w j ( E n t r o p y ) = d j j = 1 m d j
In the next stage, the CRITIC was applied, which simultaneously accounts for indicator variability and their mutual correlations [58]. For each indicator, the standard deviation was calculated as:
σ j = 1 n 1 i = 1 n ( x i j x j ¯ ) 2
where x j ¯ denotes the mean value of indicator j.
Next, Pearson’s linear correlation coefficients between indicators were determined:
r j k = i = 1 n ( x i j x ¯ j ) ( x i k x ¯ k ) i = 1 n ( x i j x ¯ j ) 2 ( x i k x ¯ k ) 2
Based on these coefficients, the informational measure of each indicator was defined as:
C j = σ j k = 1 m ( 1 r j k )
The CRITIC weights were then calculated as:
w j ( C r i t i c ) = C j j = 1 m C j
In the final step, the weights obtained using the entropy and CRITIC methods were aggregated according to the Laplace criterion, which assumes equal credibility of the approaches employed. The Laplace criterion was adopted as a neutral and transparent aggregation rule under methodological uncertainty, that is, in the absence of sufficiently strong empirical or theoretical grounds for favouring either of the two data-driven weighting methods. This assumption does not imply that the entropy and CRITIC methods are methodologically identical. Rather, both methods are based on the same empirical data matrix and capture complementary aspects of indicator informativeness. Aggregating the two sets of weights using the arithmetic mean therefore reduces the risk of the results being driven by the rationale of only one weighting method. In this study, the Laplace criterion was applied to achieve a balanced compromise between assessing indicator importance based on variability and assessing it after accounting for interdependencies among variables, thereby enhancing the transparency and robustness of the weighting procedure.
The final indicator weights were calculated as the arithmetic mean [33]:
w j F i n a l = w j ( E n t r o p ) + w j ( C r i t c ) 2
The combined Entropy–CRITIC–Laplace procedure produces a data-driven weighting system that reflects both the differentiation and redundancy of information within the dataset. However, this procedure should not be interpreted as fully objective in a philosophical sense, since the selection of variables, normalisation procedure, and aggregation rule remains dependent on researchers’ decisions. In this study, indicator selection determines which dimensions of energy security are represented in DESRI, normalisation affects the comparability of variables expressed in different units, and the Entropy–CRITIC–Laplace scheme assigns greater importance to indicators characterised by higher variability or lower redundancy. Furthermore, the aggregation procedure assumes partial compensability between pillars, meaning that lower instability in one dimension may partially offset higher instability in another. DESRI values and country classifications should therefore be interpreted in light of these methodological assumptions.

3.2.2. Method for Determining Pillar Weights

To determine the relative importance of the five pillars in the composite index, the Analytical Hierarchy Process (AHP) was used as a structured weighting tool [59,60]. The application of AHP at the pillar level follows from the hierarchical structure of the DESRI framework. The weighting procedure was deliberately differentiated between two analytical levels. At the indicator level, weights were derived from the statistical properties of the data because the indicators within each pillar describe related diagnostic aspects of a given dimension of transition-related instability, and their informativeness can be assessed through variability, differentiation, and redundancy. At the pillar level, however, the five dimensions represent broader conceptual areas of energy security and energy transition. Their relative importance cannot be derived solely from the empirical distribution of indicator values, as it also depends on the adopted understanding of energy security, the role of individual pillars in shaping transition-related instability, and the priorities of EU energy and climate policy. In this study, AHP was applied to translate an explicitly adopted analytical perspective, shaped by EU energy and climate policy priorities, into a transparent set of pairwise comparisons. The pairwise comparison matrix was constructed by the authors based on an analysis of strategic documents and a substantive interpretation of EU energy transition priorities. The resulting pillar weights should therefore be regarded as policy-informed analytical assumptions. The consistency ratio was calculated to verify the internal coherence of the adopted judgements; however, its value should not be interpreted as eliminating the normative element of the weighting procedure. It should be emphasised that the adopted hierarchy of pillars should not be interpreted as the only possible or indisputable hierarchy of EU energy policy priorities. It reflects a specific analytical perspective in which security of supply and the achievement of climate and emissions objectives are treated as the two principal dimensions of energy security instability under transition conditions. Consequently, the weights derived using AHP should be regarded as a transparent and justified modelling assumption.
In the first step, a set of risk pillars F k   ( k = 1 , , K ) , was defined, for which relative importance in the construction of the index had to be determined. The objective of the AHP procedure was to estimate the vector of weights (11):
W = [ W 1 ,   W 2 , , W K ]
where the weights satisfy the normalisation condition:
k = 1 K W k = 1
Next, pairwise comparisons of the risk pillars were conducted by constructing a comparison matrix:
A = [ a k l ] ,             k , l = 1 , , K
where the element akl specifies how much more important pillar Fk is compared to pillar Fl, according to Saaty’s nine-point scale. It was assumed that the comparison matrix satisfies the following conditions (14):
a k l = 1 a l k ,           a k k = 1
which ensures reciprocity of judgments and full equivalence of each pillar with itself.
Based on the comparison matrix, pillar weights were derived as the normalised eigenvector corresponding to the maximum eigenvalue of the matrix:
A W = λ m a x W
where λ m a x denotes the largest eigenvalue. In practice, the calculations were performed by normalising the geometric means of the rows of the comparison matrix:
W k = ( l = 1 K a k l ) 1 / K k = 1 K ( l = 1 K a k l ) 1 / K
An important element of the AHP procedure is the verification of the consistency of decision judgments. For this purpose, the Consistency Index (CI) was calculated as:
C I = λ m a x K K 1
and subsequently the Consistency Ratio (CR):
C R = C I R I
where RI denotes the random consistency index dependent on the number of pillars K. The standard acceptability criterion was adopted:
C R     0.1
which indicates sufficient consistency of the comparison matrix.
The calculated pillar weights W k were used in the final aggregation stage to determine the global DESRI index.

3.3. Dynamic Energy Security Risk Index (DESRI) Method

3.3.1. Conceptual Foundations of the Method

The conceptual foundations of the DESRI method are based on the assumption that energy security under transition conditions should be analysed not only as a static state of the energy system but also as a dynamic process shaped by the pace, variability, and irregularity of change. In the context of the energy transition, rapid or uneven changes in key energy, climate, structural, demand-related, and socioeconomic indicators may create adjustment pressures for energy systems, economies, and societies. The proposed method therefore focuses on identifying transition-related instability as a distinct dimension of energy security assessment.
In this study, the term “dynamic” refers to changes in selected indicators over time, encompassing the pace of change, the variability of that change, and the irregularity of indicator trajectories. The concept of “transition-related instability” is used to describe the observed variability in the course of energy transition processes. It is therefore treated as an empirically measurable characteristic of transition trajectories rather than as a direct measure of a specific disruptive event.
On this basis, the proposed DESRI index provides a quantitative assessment of transition-related instability in selected dimensions of energy security. In this context, the term “risk” is used in a narrower, interpretative analytical sense. It refers to a potential vulnerability or pressure that may arise when changes in key areas of the energy transition are rapid, uneven, volatile, or difficult for the energy system, economy, or society to absorb. DESRI should therefore not be understood as a probabilistic risk model estimating the likelihood and consequences of energy system destabilisation. Rather, the index identifies dynamic instability that may signal elevated risk associated with the course of the energy transition.
Unlike conventional energy security indices, DESRI focuses on change trajectories and on the pace, variability, and irregularity with which energy transition-related indicators evolve over time. The method was designed to support both cross-country comparisons and analyses of changes over time, enabling the identification of countries in which the transition process proceeds more rapidly, variably, or unevenly.
The term “risk” is therefore used differently from its meaning in the broader energy security literature, which focuses on supply disruptions, geopolitical exposure, infrastructure failures, or supply-chain interruptions. DESRI does not measure the full spectrum of energy security risks in this systemic sense. Instead, it captures transition-related instability observable in macro-statistical indicators and interprets substantial, rapid, or irregular changes as signals of increased vulnerability during the transition process. This approach is based on the assumption that abrupt shifts in energy, climate, structural, demand-related, and socioeconomic dimensions may create adjustment pressures even when the long-term direction of change remains consistent with energy transition objectives.
This interpretation should be regarded as an analytical simplification adopted for cross-country comparisons. The resulting composite index should therefore be understood primarily as an index of transition-related instability in selected dimensions of energy security rather than as a comprehensive measure of energy security risk in a broad systemic or probabilistic sense.

3.3.2. General Structure of the DESRI Method

The objective of the developed Dynamic Energy Security Risk Index (DESRI) method is the quantitative assessment of dynamic energy security risk. This risk is understood as the risk of destabilisation of the energy system resulting from rapid and/or unstable changes occurring in key areas of the energy transition. Unlike classical energy security indices, DESRI does not describe the static level of security in a given year, but focuses on the analysis of change trajectories and the pace at which risk accumulates over time. The method was designed as an index for both cross-country and dynamic (time-varying) analyses.
The DESRI computation procedure consists of nine consecutive steps, reflecting the hierarchical structure of the method—from the level of individual indicators, through risk pillars, to the global energy security risk index.
The steps of the DESRI method are as follows:
(1)
Step 1. Definition of the data set and hierarchical structure. In the first step, the data set and the analytical structure of the index were defined. Let:
c C denote an EU-27 country;
t { t 0 , , t T } denote the year of analysis;
j { 1 , , m } denote the indicator.
The value of indicator j for country c in year t is denoted as X j ( c , t ) .
Indicators were assigned to thematic risk pillars: F k   ( k = 1 , , K ) , corresponding to the key dimensions considered in the analysis. The set of indicators belonging to pillar F k   is denoted as J k . This hierarchical structure enables coherent aggregation of information, from partial indicators to the synthetic global index.
(2)
Step 2. Determination of risk direction (parameter s j ). In the second step, the direction of the impact of each indicator on energy security risk was defined. For each indicator, the parameter:
s j { + 1 , 1 }
was specified. A value of s j = + 1 indicates that an increase in the given indicator leads to an increase in energy security risk (e.g., higher import dependency or rising energy prices), whereas s j = 1 indicates that an increase in the indicator contributes to risk reduction (e.g., a higher share of RES or increased energy productivity).
The parameter s j replaces the classical division into stimulants and destimulants and constitutes the only element of the method in which the direction of indicator impact is encoded. Consequently, the subsequent stages of the analysis focus primarily on the intensity, variability, and instability of changes rather than on evaluating their direction. This solution represents a deliberate shift in the interpretative emphasis of the DESRI framework. The parameter s j incorporates the desired direction of an indicator’s impact during data preparation, while the subsequent procedure focuses on the magnitude, variability, and irregularity of change. DESRI is intended to identify situations in which the pace of change may generate adjustment pressures for the energy system, economy, or society. An advantage of this approach is its ability to capture both the effects of a rapid deterioration in indicator values and the pressures resulting from their rapid improvement. For example, a rapid increase in the share of renewable energy, a reduction in emissions, or an improvement in energy efficiency may support long-term transition objectives while simultaneously requiring substantial infrastructural, regulatory, investment, and social adjustments. A limitation of this approach is that the composite DESRI value does not directly distinguish between rapid improvement and rapid deterioration. High index values should therefore be interpreted together with the pillar structure and changes in individual indicators rather than as an automatic indication of transition regression.
(3)
Step 3. Determination of the rate of change (trend component). In the third step, the annual rate of change in each indicator was calculated using the logarithmic growth rate:
g j ( c , t ) = ln ( X j ( c , t ) X j ( c , t 1 ) )
This rate was then adjusted for the risk direction by defining the so-called risk trend:
r j ( T ) ( c , t ) = s j × g j ( c , t )
A positive value of r j ( T ) indicates that the change in the indicator in a given year contributes to an increase in energy security risk, while a negative value indicates a risk-reducing change. To capture the strength of the impulse regardless of its sign, the following intensity measure was introduced:
u j ( c , t ) = | r j ( T ) ( c , t ) |
This approach reflects the assumption that abrupt changes, including those that are formally beneficial from the perspective of long-term transition goals, may generate transition-related instability and adjustment pressure. The use of the absolute value in the trend impulse measure follows from the assumption that DESRI measures the intensity and irregularity of change rather than normatively classifying it as beneficial or adverse. A rapid improvement in indicators, such as an increase in the share of renewable energy, a reduction in emissions, or an improvement in energy efficiency, may be consistent with transition objectives while simultaneously generating temporary adjustment pressures. This applies particularly to challenges related to the grid integration of renewable energy, infrastructure adaptation costs, the need to expand energy storage capacity, labour market changes, investment pressures, and constraints on public policy implementation. Consequently, DESRI treats rapid changes, irrespective of their direction, as a potential source of transition-related instability when their pace exceeds the system’s capacity to absorb them in a stable manner.
(4)
Step 4. Determination of change instability (volatility component). The fourth step aims to identify the instability of indicator change trajectories. For this purpose, a rolling time window of length k years was applied, within which the standard deviation of the risk trend was calculated:
v j ( c , t ) = 1 k 1 τ = t k + 1 t ( r j ( T ) ( c , τ ) r j ( T ) ¯ ( c , t ) ) 2
where the mean value of the risk trend within the window is defined as:
r j ( T ) ¯ ( c , t ) = 1 k τ = t k + 1 t r j ( T ) ( c , τ )
High values of v j indicate an irregular change trajectory, while low values correspond to a stable and predictable transformation process.
A three-year rolling window (k = 3) was adopted to balance the stability of volatility estimation with DESRI’s sensitivity to short-term transition impulses. A two-year window responds more strongly to individual annual changes, whereas three observations make it possible to distinguish more effectively between temporary fluctuations and irregularities persisting over time (Appendix A). At the same time, the three-year window remains sufficiently short to capture dynamic changes occurring during the analysed period.
(5)
Step 5. Normalisation of dynamic components (min–max). Because the measures u j and v j differ in scale and distribution, min–max normalisation was applied in the next step, performed cross-sectionally across countries, separately for each indicator and year.
First, the trend impulse was normalised:
u j n o r m ( c , t ) = u j ( c , t ) m i n c u j ( c , t ) m a x c u j ( c , t ) m i n c u j ( c , t )
and then the volatility component:
v j n o r m ( c , t ) = v j ( c , t ) m i n c v j ( c , t ) m a x c v ( c , t ) m i n c v j ( c , t )
Both measures take values in the interval [0, 1]. The normalisation does not distinguish between stimulants and destimulants, since the direction of impact was already incorporated through the parameter s j .
(6)
Step 6. Construction of partial indicator risk. In the next step, the normalised trend impulse and volatility were combined into a single measure of partial indicator risk:
R j ( c , t ) = α u j n o r m ( c , t ) + ( 1 α ) v j n o r m ( c , t )
where α [ 0 ,   1 ] denotes the weight of the trend component. In the baseline analysis, α = 0.6 , was adopted, reflecting the greater importance of the pace of change while still accounting for instability. The value α = 0.6 moderately favours the trend component over the instability component without making it dominant in the index. This choice also reflects the conceptual assumption underlying DESRI that the pace and direction of changes in selected indicators constitute a primary signal of transition-related pressure. At the same time, the instability component retains substantial importance, with a weight of 0.4. The adopted 60:40 ratio represents a compromise between capturing the systematic pace of change and accounting for irregularities in transition trajectories. The sensitivity analysis examining a change in α from 0.6 to 0.5 is presented in Appendix B.
(7)
Step 7. Aggregation of indicators to the pillar level. The partial risks of indicators were then aggregated to the pillar level. First, a weighted sum was calculated:
S F k ( c , t ) = j J k w j | k R j ( c , t )
where the weights satisfy the condition:
j J k w j | k = 1
Next, to ensure full comparability of pillars, they were normalised:
D E S R I F k ( c , t ) = S F k ( c , t ) m i n c S F k ( c , t ) m a x c S F k ( c , t ) m i n c S F k ( c , t )
As a result, each pillar takes values in the interval [0, 1].
(8)
Step 8. Aggregation of pillars into the global DESRI index. In the final aggregation step, the risk pillars were combined into the global index:
D E S R I ( c , t ) = k = 1 K W k D E S R I F k ( c , t )
where W k denotes the weight of pillar F k (e.g., determined using the AHP method in line with EU policy priorities), satisfying the condition:
k = 1 K W k = 1
(9)
Step 9. Interpretation of results. DESRI values lie in the interval [0, 1]. Low values (DESRI ≈ 0) indicate a stable energy transition trajectory and low dynamic risk, while high values (DESRI ≈ 1) signal high risk dynamics and potential vulnerability of the energy system to destabilisation. DESRI results should be interpreted in relative terms, i.e., with reference to other EU countries in a given year.

4. Results

4.1. Weights of Partial Indicators and Pillars

In the DESRI method, it is assumed that both the partial indicators included within individual risk pillars and the pillars themselves do not have equal importance in shaping dynamic energy security risk. This results from the fact that different areas of the energy transition affect the stability of the energy system and its vulnerability to disruptions to varying degrees in the short and medium term.
The weights of the component indicators were determined in accordance with the methodology described in Section 3, using data-driven analytical methods based on information entropy and CRITIC. They were subsequently aggregated using the Laplace criterion. The indicator weights within each pillar sum to 1. Because the weights were derived from the statistical structure of the dataset, they should be interpreted as measures of the indicators’ relative diagnostic contribution within a given pillar rather than as a direct normative assessment of their policy importance. Higher weights indicate that an indicator provided more information for differentiating among countries and/or contained less redundant information relative to the other indicators within the same pillar. The final weights of the component indicators assigned to the individual DESRI risk pillars are presented in Table 3.
The distribution of weights indicates that, within each pillar, higher weights were assigned to indicators that more strongly differentiated the countries in the analysed dataset. In the structural and transformational pillar, relatively high weights were assigned to the share of renewable energy and installed wind and solar capacity, indicating that these variables played an important role in capturing differences in the pace and scale of changes in the energy mix. In the climate and emissions pillar, the highest weight was assigned to premature mortality associated with PM2.5 exposure, followed by greenhouse gas emissions per capita. This reflects the strong diagnostic role of indicators linking energy system transformation with environmental and health pressures. In the economic and social pillar, the highest weight was assigned to energy poverty, suggesting that differences in households’ ability to heat their homes adequately were particularly relevant for identifying socioeconomic vulnerability across countries. In the external dependence pillar, energy import dependence received the highest weight, confirming its substantial diagnostic contribution to differentiating countries according to their exposure to external supply risks.
The weights of the individual risk pillars were subsequently determined using AHP. Unlike the indicator weights, which were derived from the empirical informativeness of the variables, the pillar weights reflect the conceptual and policy-informed hierarchy adopted within the DESRI framework. This hierarchy draws on the priorities of European Union energy policy, particularly the fundamental importance of ensuring security of energy supply and achieving climate and emissions objectives.
The pairwise comparison matrix was constructed based on an interpretative analysis of EU energy and climate policy priorities, with particular attention to three recurring objectives: ensuring security of energy supply, accelerating decarbonisation, and maintaining the socioeconomic feasibility of the transition [61,62,63,64,65,66]. In this context, external dependence and security of supply risk and climate and emissions risk were assigned the highest relative importance because they correspond to two central dimensions of EU energy policy: reducing vulnerability to external energy shocks and achieving binding climate targets. These two pillars were therefore treated as equally important, as reflected by a value of 1 in their pairwise comparison.
The efficiency and demand-related pillar and the structural and transformational pillar were assessed as moderately less important than external dependence and climate and emissions risk. This does not imply their marginalisation but reflects their interpretation as dimensions that support and stabilise the transition. Energy efficiency, demand reduction, diversification of the energy mix, and the expansion of renewable capacity contribute to both security of supply and decarbonisation. Within the adopted hierarchy, however, they primarily serve as mechanisms for achieving these two strategic objectives. The external dependence and climate and emissions pillars were therefore assigned moderate importance over these dimensions, represented by a value of 3 in the AHP matrix.
The economic and social pillar received the lowest relative weight but was not regarded as unimportant. Its lower weight reflects the analytical assumption that energy affordability and the effects of the transition on households are essential to the durability and social acceptability of the transition. However, over the short and medium term, they more often constitute consequences or transmission channels of changes in security of supply, energy prices, demand, and structural transformation. External dependence and climate and emissions risk were therefore assessed as strongly more important than economic and social risk, as reflected by a value of 5 in the pairwise comparison matrix. At the same time, the economic and social pillar remains an integral component of DESRI to capture the dimension of transition-related social vulnerability.
Table 4 presents the pairwise comparison matrix of the risk pillars.
After performing AHP pairwise comparisons, weights reflecting the importance of each energy transition risk pillar were obtained as follows:
External dependency and security of supply risk: 0.346;
Climate and emissions risk: 0.346;
Efficiency and demand-related risk: 0.122;
Structural and transformational risk: 0.122;
Economic and social risk: 0.064.
The resulting weight structure has important implications for interpreting the DESRI results. The relatively high weights assigned to external dependence and security of supply risk and climate and emissions risk mean that the index more strongly reflects instability associated with security of supply, exposure to external energy shocks, and decarbonisation pressures. However, the lower weight assigned to the economic and social pillar does not imply that the social dimension of the transition is considered unimportant. Rather, within the adopted DESRI configuration, this dimension is treated as an important component of vulnerability and the social acceptability of the transition, although it has a lower weight in the composite assessment of dynamic energy security instability.
To verify the logical correctness and reliability of the expert judgments, a consistency analysis of the pairwise comparison matrix was performed in accordance with the AHP procedure. For the number of criteria n = 5, the following diagnostic parameters were obtained:
λmax = 5.0067;
CI = 0.0017;
CR = 0.0015 < 0.10, with RI = 1.12.
The obtained value of the consistency ratio (CR) is significantly below the commonly accepted threshold of CR < 0.10, which indicates very high consistency of the comparison matrix. It confirms the internal coherence of the pairwise comparison matrix and demonstrates that the adopted judgements are formally consistent within the AHP procedure. As previously stated, the pillar weights should be regarded as analytical assumptions informed by EU energy and climate policy priorities.

4.2. Overall Distribution and Variability of DESRI Index Values in EU-27 Countries

4.2.1. Analysis of DESRI Index Values

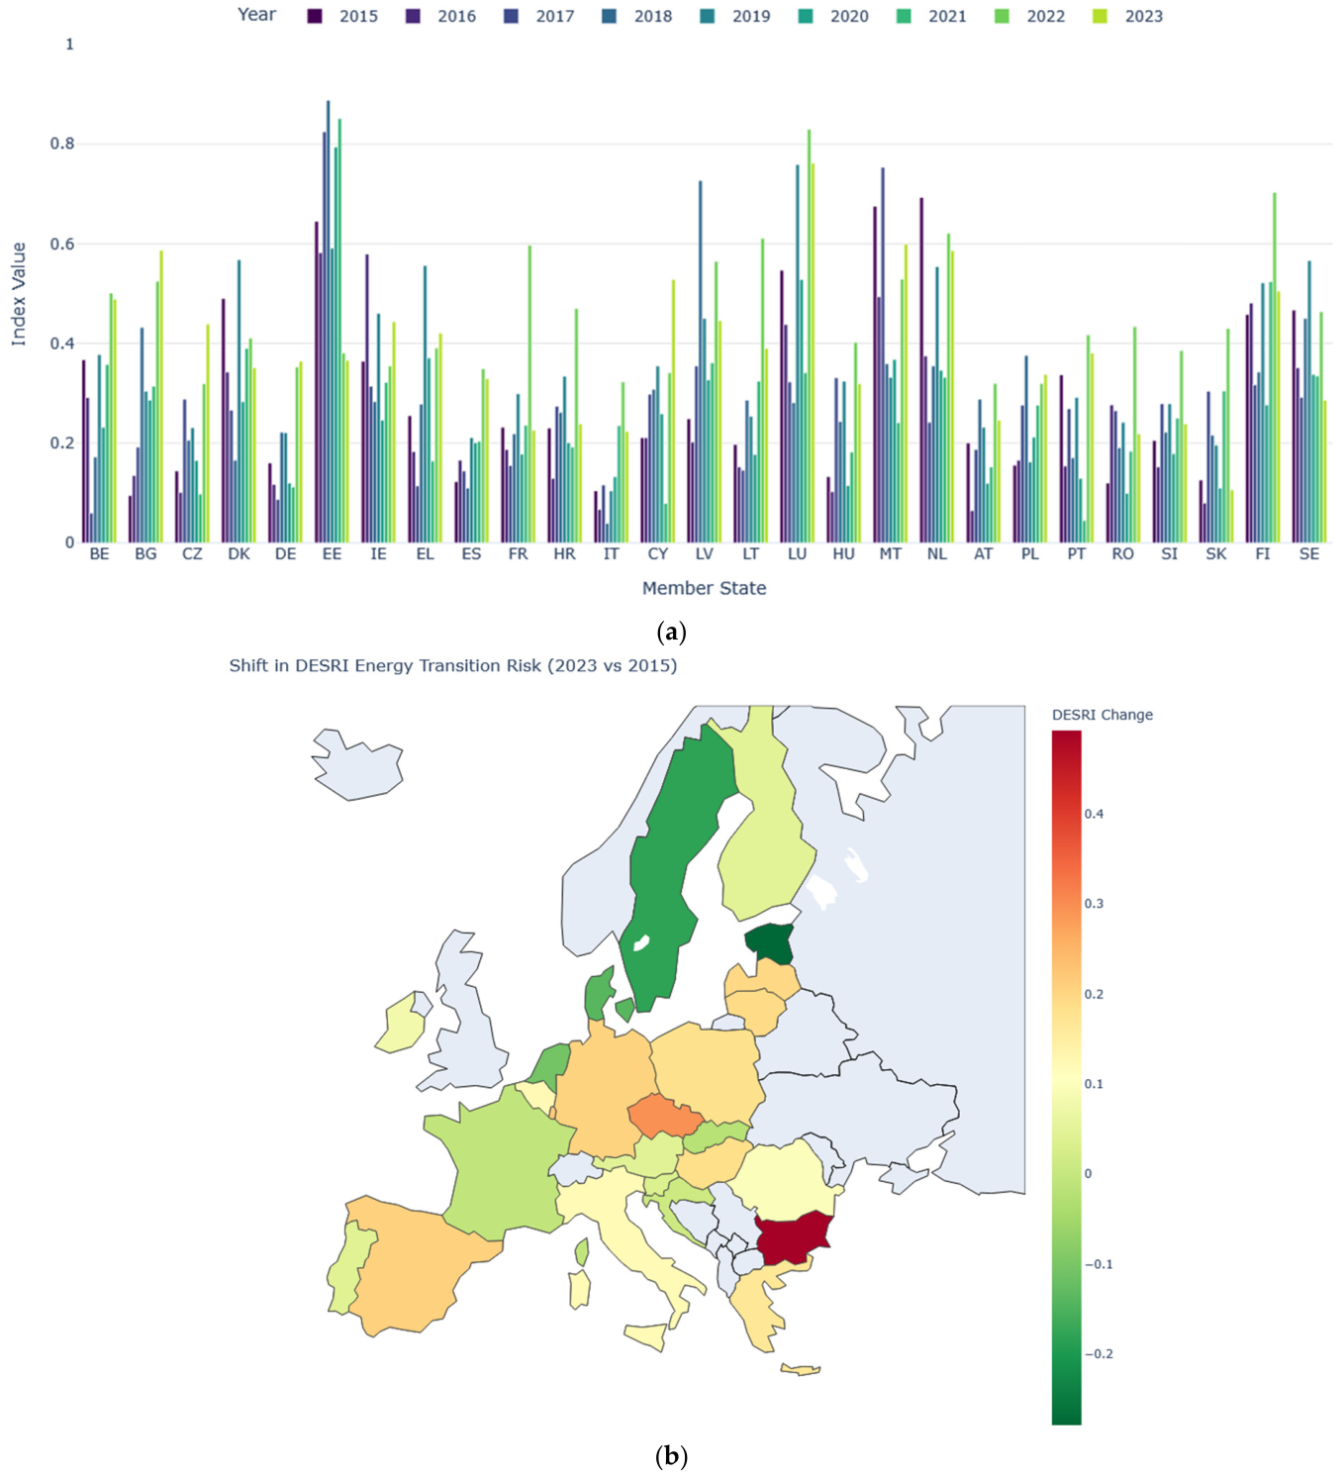
Based on the calculations carried out using the developed Dynamic Energy Security Risk Index method for the EU-27 countries (with a rolling window k = 3), DESRI values were determined for the years 2015–2023. This stage of the research aimed to assess the extent to which the proposed indicator differentiates EU-27 countries in terms of dynamic energy transition risk, as well as to evaluate its ability to capture changes in this risk over time. Figure 1 presents the DESRI index values for EU-27 countries in the analysed period.
The results (Figure 1a) indicate substantial differences in transition-related instability across the EU-27 countries and considerable variation in DESRI values over time. These differences should be interpreted both as dispersion in index values and as a reflection of the diverse structural conditions under which energy transitions take place. Countries with larger, more diversified, and institutionally mature energy systems, such as Germany, Austria, and Italy, generally exhibited relatively lower and more stable DESRI values. This suggests that gradual adjustments, greater system diversification, and a stronger capacity to absorb change may reduce dynamic transition-related instability.
Higher DESRI values occurred more frequently in countries characterised by small energy systems, high exposure to external energy flows, concentrated energy structures, or rapid changes in selected indicators. This was particularly evident in Estonia, Luxembourg, Malta, and the Netherlands. In these cases, high index values primarily indicate the irregularity and intensity of changes across the analysed transition dimensions.
The lowest DESRI values in the entire sample were recorded in Italy in 2018 (0.039), Portugal in 2021 (0.045), Belgium in 2017 (0.060), and Austria in 2016 (0.066). These results indicate that the pace and variability of the analysed indicators in these countries were relatively limited compared with those in other EU countries. However, low DESRI values should not be interpreted as an absence of energy security challenges. Rather, they indicate that the trajectory of change in a given year was more stable and predictable, as DESRI measures dynamic instability rather than the static level of energy security.
The highest index values were recorded in Estonia in 2017–2018 (0.825 and 0.889) and Luxembourg in 2022–2023 (0.831 and 0.762). In Estonia, these results can be interpreted in the context of the specific characteristics of its national energy system, which has historically relied heavily on oil shale, as well as the high sensitivity of emissions, energy intensity, and energy mix indicators to regulatory and transition-related changes. Luxembourg, by contrast, has a small and highly open energy system that depends on external energy flows and is sensitive to changes in import-related and per capita indicators. Under such conditions, even relatively small absolute changes may result in high dynamic instability from a comparative perspective.
The high DESRI values observed for Malta and the Netherlands can also be interpreted in light of the specific structural characteristics of their energy systems. Malta has a small island energy system with limited domestic energy resources and high dependence on imported energy carriers, increasing its sensitivity to external conditions. Despite its high level of development and advanced energy infrastructure, the Netherlands experienced substantial changes in the structure of energy supply and demand, including a declining role for domestically produced natural gas and growing pressure to accelerate decarbonisation. This helps explain why countries with different levels of development and transition advancement may simultaneously be classified as exhibiting elevated dynamic instability.
These findings indicate that high DESRI values may be interpreted in light of different mechanisms shaping transition-related instability. In small and open energy systems, such as Luxembourg and Malta, scale and external exposure play an important role: relatively small absolute changes in energy imports, prices, or consumption may produce substantial changes in relative indicator values. In Estonia, structural dependence on a carbon-intensive energy mix is particularly important, as it increases the system’s sensitivity to regulatory, emissions-related, and technological changes. In the Netherlands, elevated instability may be interpreted as the combined effect of several processes: the declining role of domestically produced natural gas, changes in the energy supply structure, decarbonisation pressures, and the need to adapt infrastructure to the faster development of renewable energy. Similar DESRI values may therefore result from different configurations of national conditions and mechanisms.
An important pattern is the concentration of higher DESRI values in two periods: 2017–2019 and 2021–2022. The first may be associated with the intensification of energy transition processes, particularly changes in the energy mix, renewable energy development, emissions reductions, and demand-side adjustments. During this period, elevated DESRI values were recorded in Estonia, Malta, Luxembourg, and the Netherlands, among others. Estonia reached the highest index value in the entire sample in 2018. The second period should be interpreted in the context of broader disruptions in the European energy market, including the post-COVID-19 recovery in demand, high energy price volatility, and growing geopolitical uncertainty following Russia’s invasion of Ukraine. The simultaneous increase in DESRI values across numerous countries indicates that transition-related instability was shaped not only by national conditions but also by common external pressures affecting EU energy systems.
The findings also demonstrate that a favourable static energy transition profile does not necessarily imply low dynamic instability. Countries with a high share of renewable energy or an advanced decarbonisation profile, such as Sweden, Denmark, and the Netherlands, recorded elevated DESRI values in selected years. This confirms that DESRI does not measure the level of transition advancement but rather the stability of its course. Rapid renewable energy development, changes in the energy mix, the need to adapt grid infrastructure, and demand-side changes may temporarily increase instability even in countries regarded as energy transition leaders.
The opposite pattern can be observed in Germany, Austria, and Italy, which exhibited relatively low and stable DESRI values in selected years. This indicates that annual changes in the analysed indicators were less abrupt from a comparative perspective. In this sense, DESRI captures a different dimension from conventional static energy security indicators, as it measures the stability of transition trajectories rather than the absolute level of energy security or decarbonisation.
Overall, the findings indicate that transition-related instability in the EU is shaped by a combination of national structural conditions and common external pressures. Small and highly open energy systems are more sensitive to fluctuations in import dependence, energy prices, and demand-related indicators. Countries undergoing rapid restructuring of their energy mix may experience elevated instability even when the direction of change is consistent with EU climate policy objectives. Larger and more diversified systems may be better able to absorb transition-related changes, resulting in lower DESRI values during certain periods. The DESRI framework therefore enables the identification not only of the level of dynamic instability but also of the potential structural sources of differing transition trajectories.

4.2.2. Assessment of DESRI Levels

In order to organise the results and facilitate the interpretation of DESRI values, the index values for individual years were divided into four relative classes. The basis for this classification was the quartile distribution of DESRI values across European Union countries in a given year (Table 5). Accordingly, the following classes were distinguished:
Class I—low transition-related instability (DESRI ≤ Q1),
Class II—moderately low transition-related instability (Q1 < DESRI ≤ Q2),
Class III—moderately high transition-related instability (Q2 < DESRI ≤ Q3),
Class IV—high transition-related instability (DESRI > Q3).
Class I includes countries characterised by the lowest relative levels of transition-related instability in a given year.
Class II comprises countries with moderately low DESRI values, indicating a relatively limited intensity and irregularity of change.
Class III identifies countries with moderately high DESRI values, suggesting a stronger accumulation of transition-related instability.
Class IV includes countries with the highest relative DESRI values, indicating the greatest observed intensity and irregularity of change in the analysed period.
The use of quartile classification makes it possible to clearly distinguish groups of countries with similar levels of transition-related dynamic instability in a given year, regardless of the absolute level of the index.
The analysis of the obtained results shows that the assignment of EU-27 countries to particular classes is not permanent, but changes over time. In the analysed period (2015–2023), substantial mobility of countries between classes can be observed, confirming the dynamic character of transition-related instability and showing that DESRI classifications vary across years marked by different structural, regulatory, and external conditions. An interesting example of this variability is Bulgaria, which in 2015 belonged to the group with the lowest DESRI values, but in 2023 moved to the group with the highest DESRI values. A different trajectory can be observed in the case of Estonia, which began the analysed period among the countries with the highest DESRI values and ended it in a lower relative class. This change reflects a relative decline in Estonia’s DESRI position over the analysed period.
Interesting conclusions also emerge from observations of countries characterised by persistently high DESRI values, including Luxembourg, Malta, and the Netherlands. These countries remained in the fourth quartile, corresponding to high dynamic instability, for most of the analysed period, which may be associated with their specific structural conditions, including high exposure to external energy-related factors. At the same time, Scandinavian countries such as Sweden and Denmark moved from the highest dynamic instability group in 2015 to the moderate transition-related instability category in 2023, indicating an improvement in their relative DESRI classification.
Poland’s situation in the context of the European Union appears relatively stable in terms of its DESRI-based classification, although not without challenges related to the evolving sources of transition-related instability. Throughout most of the analysed period, Poland oscillated between the moderate and high transition-related instability groups.
An analysis of the lowest DESRI classes indicates relatively low observed dynamic instability in countries such as Italy, Romania, and Slovakia, which consistently remained in the groups characterised by low or moderately low transition-related instability.
The overall picture of inter-class mobility shows that the analysed countries display different trajectories of adjustment to climate policy requirements, and that their position in the ranking may reflect both longer-term transformation pathways and short-term disturbances in energy markets. However, these trajectories should not be interpreted as evidence of direct causality, but rather as descriptive signals of different adjustment patterns under changing structural, regulatory, and external conditions.

4.2.3. Overall Distribution and Variability of Pillar Index Values in EU-27 Countries

The final value of the Dynamic Energy Security Risk Index (Section 4.2) is the result of aggregating five pillar risk indices that reflect key dimensions of the energy transition and energy security in EU-27 countries. For this reason, the analysis of the distribution and variability of pillar index values constitutes an important stage in the interpretation of results, as it allows for the identification of sources of changes in dynamic risk and for assessing which areas of the transition contribute most to the increase or stabilisation of DESRI values. In this part of the study, a cross-sectional and temporal analysis of pillar index values for the years 2015–2023 is presented, with particular attention paid to their differentiation between countries and variability over time.
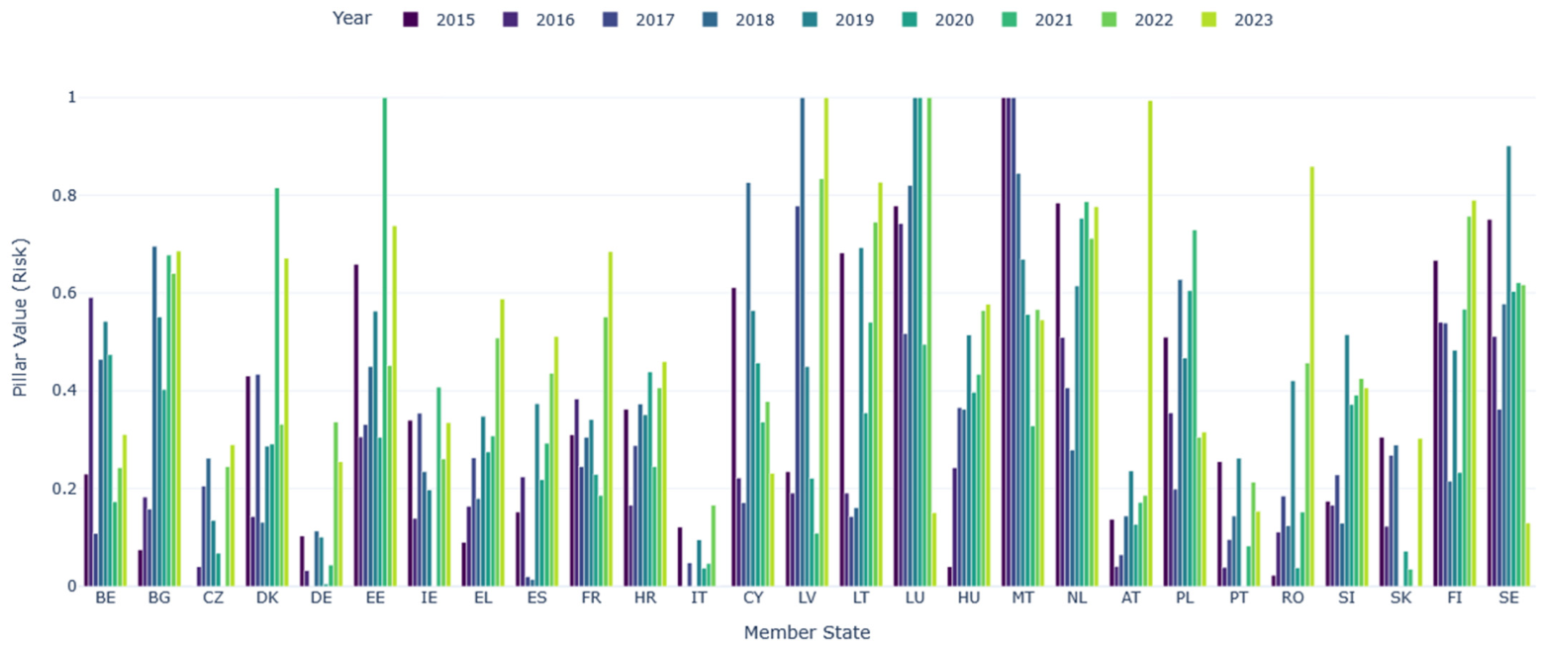
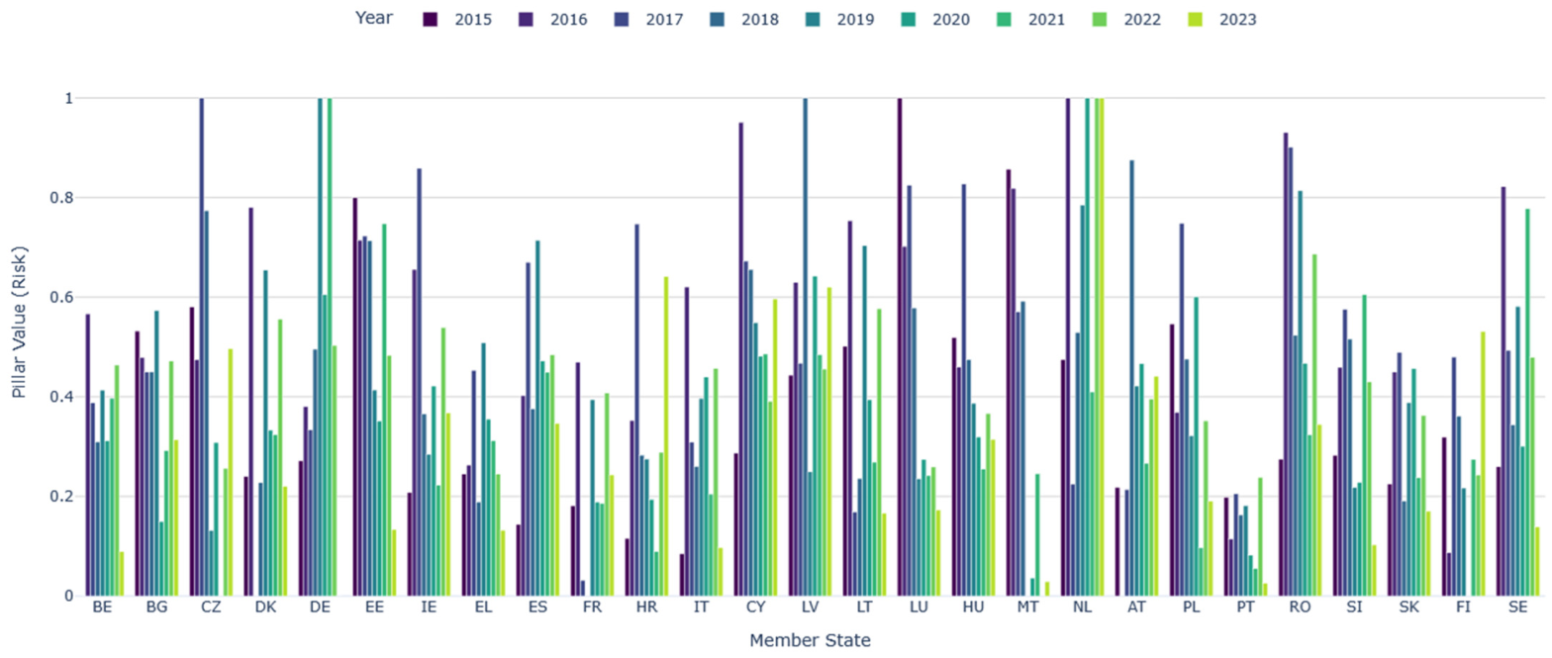
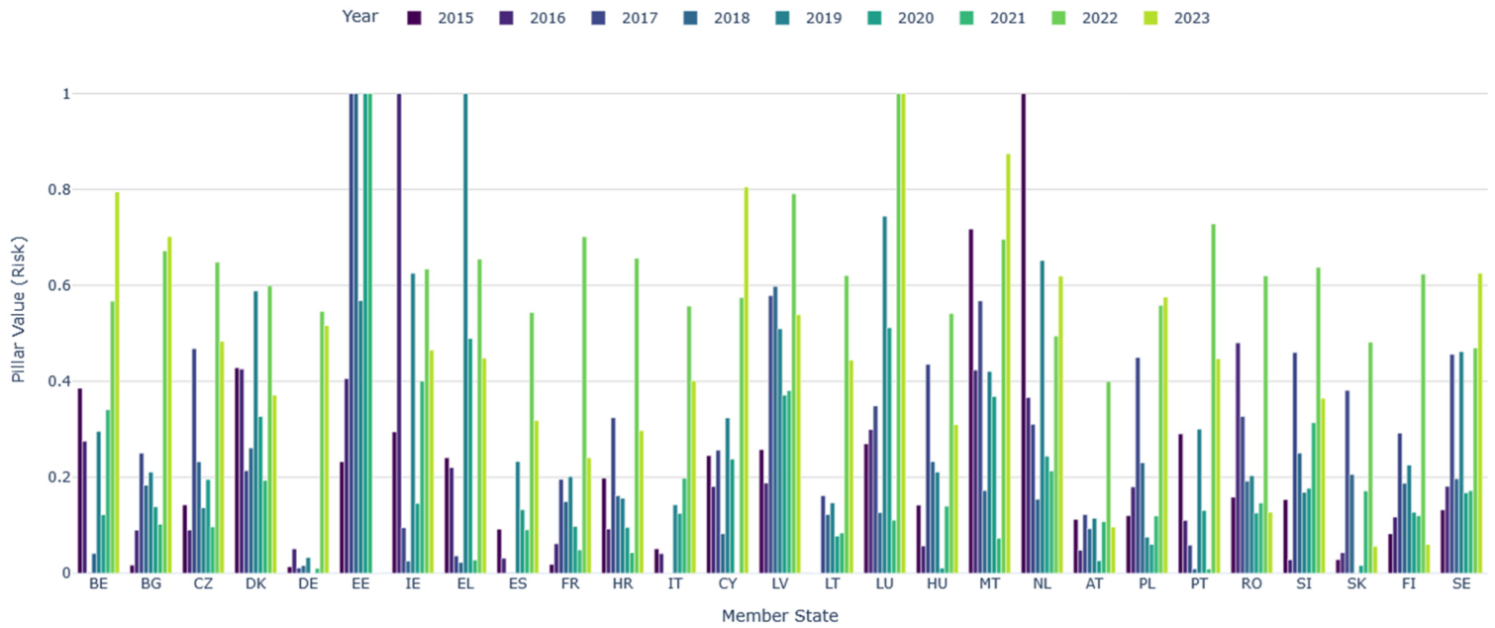
Figure 2 presents the values of the partial DESRI index (normalized to the range [0, 1]) for the pillar Structural and transformational aspects of the energy mix.
The values of the structural and transformational pillar in 2015–2023 indicate very strong differentiation among European Union countries, as well as considerable variability over time. This dimension represents one of the important components contributing to changes in DESRI values, which indicates that the pace and manner of change in the structure of energy generation are closely associated with transition-related instability during the transformation process.
At the cross-sectional level, clear differences can be observed between countries with relatively stable structural changes and those in which the transformation of the energy mix was more abrupt and irregular. Countries characterised by low or moderate pillar values in most of the analysed years include Germany, Austria, Italy, and Portugal, where the observed values suggest a more gradual and relatively stable course of structural change. For example, in Germany the pillar values in 2015–2020 remained at a very low level, while in Austria they mostly did not exceed approximately 0.25 until 2022.
By contrast, the highest values of the structural and transformational pillar were observed in countries where the restructuring of the energy mix was characterised by high intensity or substantial irregularity. Particularly high values were recorded in Luxembourg (equal to 1 in 2019, 2021, and 2022), Estonia (high values in 2015, 2021, and 2023), Malta (values close to 1 in 2015–2017), as well as Latvia and Lithuania, where in selected years the index also reached very high levels. These results indicate pronounced changes in the structural dimension, which in some years were accompanied by higher variability of the adjustment path.
The temporal analysis also reveals periods of accumulation of higher values in this pillar, especially in 2017–2019 and again in 2021–2022. In the first of these periods, increases were visible simultaneously in many countries, including Luxembourg, Malta, Latvia, the Netherlands, and Bulgaria, which indicates that higher values in this pillar were observed across several countries during the same period. The second wave, observed in 2021–2022, affected, among others, Luxembourg, Finland, the Netherlands, Lithuania, and Sweden, showing that elevated values in this pillar occurred simultaneously in countries with different energy system structures and transition pathways.
It is also worth emphasising that high values of this pillar were not always persistent. In some countries, periods of sharp increases were followed by phases of relative decline, showing that elevated pillar values did not persist throughout the entire analysed period. Estonia provides one example, as after very high values in 2015 and 2021 the index declined in subsequent years. A similar pattern can be seen in Malta, where after very high values in the initial phase of the analysis a more stable trajectory emerged.
The obtained results indicate that the structural and transformational dimension of the energy mix constitutes one of the main components of transition-related instability captured by DESRI in the EU. The mechanism through which this pillar operates can be interpreted as a mismatch between the pace of change in the structure of generation capacity and the ability of energy infrastructure to absorb these changes. This applies particularly when the development of renewable energy sources, the phase-out of conventional generation capacity, and the expansion of grids and balancing systems do not proceed in a fully coordinated manner. Under such conditions, the transition may generate temporary technical and organisational instability, even when the overall direction of change remains consistent with climate policy objectives.
The second pillar subjected to detailed analysis was Climate and emissions aspects, referring to the dynamics of changes in greenhouse gas emissions and the emissions intensity of energy systems. The values of the partial index (normalised to the range [0, 1]) for this pillar in 2015–2023 are presented in Figure 3.
Among the countries with the lowest values of the climate and emissions pillar in the analysed period were Romania, Italy, Austria, and Germany. For example, in Romania the pillar values in 2017–2020 remained at a very low level (2017 = 0.108, 2018 = 0.075, 2019 = 0.075, and 2020 = 0), which indicates relatively low observed variability in emissions-related change. Similarly, in Italy in 2018–2019 the climate and emissions pillar reached values close to zero (0.041 and 0, respectively), and in Austria in 2016 it amounted to only 0.090.
By contrast, the highest values were observed in countries characterised by strong dynamics of structural change or high initial emissions intensity. Estonia stood out in particular, where in 2017 and 2020 the pillar reached the maximum value of 1, and in 2018 amounted to 0.866. Very high levels were also recorded in Finland (1 in 2016, 2019, 2022, and 2023), Sweden (0.799 in 2015 and 0.599 in 2019), and Luxembourg, where in 2023 the index reached 0.891. Elevated values were also noted in Malta, especially in 2017 (0.798) and 2023 (0.539).
The temporal analysis reveals periods of accumulation of higher values in the climate and emissions pillar, particularly visible in 2017–2019 and again in 2021–2022. During these periods, many countries simultaneously experienced an increase in pillar values, including Estonia, Finland, Sweden, Luxembourg, the Netherlands, and France. This pattern may be associated with overlapping regulatory, technological and market pressures related to climate policy implementation and decarbonization processes.
An important conclusion from this part of the analysis is that countries perceived as leaders in climate policy did not always exhibit low values of this pillar in dynamic terms. The examples of Finland and Sweden indicate that even countries with favourable static climate profiles may display higher dynamic variability in emissions-related trajectories.
The mechanism through which this pillar operates can be interpreted as adjustment pressure resulting from rapid emissions reductions or abrupt changes in the emissions intensity of the energy system. Such changes may require substantial technological, regulatory, and investment adjustments. High values for this pillar therefore do not necessarily indicate only high emissions levels. They also capture irregularities in the decarbonisation pathway and changes associated with the pace of emissions reduction.
The next analysed pillar was Efficiency and demand-related aspects, reflecting the dynamics of changes in energy demand and the efficiency of its use in the economy and the household sector. The values of the partial index for this pillar for 2015–2023 in the analysed countries are presented in Figure 4.
Among the countries characterised by the lowest values of this pillar in the analysed period were Italy, Austria, Slovakia, and Finland. In the case of Italy, in 2016 the normalised value of the index amounted to 0, which represented the lowest level among all analysed countries in that year, while in 2018 it reached only 0.067, indicating relatively low variability in energy consumption indicators. Very low values were also recorded in Austria in 2015 (0) and in Finland in 2018 (0), which indicates limited dynamics of demand-related change. In turn, Slovakia was characterised by an almost zero level in 2015, when the index amounted to 0.006.
On the opposite side were countries characterised by very high and volatile values of the efficiency and demand-related pillar. Particularly notable were Ireland, Luxembourg, Malta, Estonia, and the Czech Republic. In Ireland, the pillar values reached the maximum of the scale in 2015 and 2018 (1), and in 2020 they remained very high (0.855). In Luxembourg, this dimension was extremely high in 2019–2022, reaching a value of 1 in 2020 and 2022. Malta was also characterised by very high values, including 1 in 2017 and 0.466 in 2022.
The temporal analysis reveals periods of accumulation of higher values in this pillar, particularly in 2018–2020 and 2021–2022. In the first of these periods, a sharp increase was observed in countries such as the Czech Republic, Estonia, Ireland, Luxembourg, and Malta, which may be associated with strong fluctuations in energy demand and differences in the pace of efficiency-related adjustment. In 2021–2022, elevated values appeared simultaneously in many countries, including Belgium, France, Luxembourg, the Netherlands, and Lithuania, which may reflect broader systemic conditions, including the rebound in energy demand after the COVID-19 pandemic and the energy crisis.
An important finding is that this pillar does not exhibit a clear downward trend in many countries despite long-term objectives related to improving energy efficiency. The high and variable values recorded in countries such as Luxembourg, Ireland, and the Netherlands indicate that demand-related indicators contributed substantially to transition-related instability in selected years, including in relatively advanced economies. The mechanism linking this pillar to instability can be interpreted as adjustment pressure associated with fluctuations in energy demand and uneven progress in improving energy efficiency. Abrupt changes in household energy consumption, primary energy consumption, energy intensity, or energy productivity may indicate a greater need to adapt energy supply, infrastructure, and energy efficiency policies to changing demand conditions. This is particularly relevant following periods of economic disruption, when a recovery in demand may temporarily weaken the stabilising effects of long-term improvements in energy efficiency.
The next analysed pillar was Economic and social aspects, covering factors related to the social acceptability of transition costs, access to energy for households, and the socio-economic sensitivity of countries to changes in prices and incomes. The normalised values of the partial index for this pillar in individual European Union countries are presented in Figure 5.
The obtained results indicate very strong differentiation in the values of the economic and social pillar among EU-27 countries, as well as considerable variability over time. In the analysed period, the index assumed both very low values, indicating relatively low observed variability in the socio-economic dimension of the energy transition, and high values, indicating higher observed variability in indicators related to costs and household conditions.
Among the countries with the lowest values of this pillar in selected years were Austria, Italy, Germany, and Malta. For example, in Austria in 2016 the normalised value of the index was 0, which represented the lowest level in the entire sample that year. Low values were also observed in Italy in 2015 (0.085) and in Germany in 2023 (0), indicating relatively stable socio-economic conditions in relation to the transition process.
On the other hand, the highest values of the economic and social pillar were recorded in countries such as Luxembourg, the Netherlands, Estonia, the Czech Republic, and Bulgaria. Particularly high values occurred in Luxembourg in 2015 (1.000) and 2017 (0.825), as well as in the Netherlands in 2017 and 2021–2023, where the index reached 1.000. These results indicate that changes in indicators related to energy prices and household-level transition costs were concentrated in these country-year observations. High values were also observed in the Czech Republic in 2017 (1.000) and in Estonia in 2015–2017 (from 0.723 to 0.800).
The temporal analysis shows that this pillar is characterised by strong fluctuations, which may be associated with external conditions such as price crises, energy market disruptions, or changes in fiscal and social protection policies. A particularly pronounced increase in index values across many countries simultaneously was observed in 2021–2022, which coincided with the sharp rise in energy prices in Europe, increased pressure on household energy affordability, and broader inflationary conditions. The mechanism linking this pillar to transition-related instability can be interpreted as socioeconomic pressure resulting from changes in energy affordability, household vulnerability, and the distributional effects of rising energy prices. When energy prices increase rapidly or households experience difficulties maintaining adequate access to energy services, the socioeconomic conditions of the transition may become less stable. In this sense, high values for the economic and social pillar do not necessarily indicate only high levels of energy poverty or elevated energy prices. They may also reflect changes in households’ exposure to transition costs and the potential need for compensatory, fiscal, or social measures to maintain public acceptance of the energy transition.
The final pillar subjected to partial analysis was External dependency and system resilience, referring to the degree of countries’ dependence on energy imports and their capacity to balance energy demand within the system. The normalised values of the partial index for this pillar in individual EU-27 countries are presented in Figure 6.
The obtained results indicate very strong differentiation in the values of this pillar among EU-27 countries, as well as clear variability over time. In the analysed period, index values ranged from very low levels to very high ones, indicating substantial differences in the observed scale and variability of exposure to external conditions.
Among the countries with the lowest values of this pillar in selected years were Italy, Lithuania, France, Germany, and Finland. For example, in Italy in 2017–2018 the normalised index value was 0, which represented the lowest level in the entire sample in those years. Low values were also observed in Lithuania in 2015 (0), in Germany in 2017 (0.011), and in Finland in 2015 (0.082), indicating relatively limited short-term variability in this dimension.
By contrast, the highest values of this pillar were recorded in countries such as Luxembourg, the Netherlands, Malta, Estonia, and Bulgaria. Particularly high values occurred in Luxembourg in 2022–2023 (1), in the Netherlands in 2015 (1.000) and again in 2023 (0.619), as well as in Malta in 2015 (0.718) and 2018 (0.740). High values were also observed in Estonia in 2017–2021, where the index remained at 1, indicating persistently high values of this pillar throughout the analysed period.
The temporal analysis shows that the external dependency and system resilience pillar displayed pronounced variability in periods marked by geopolitical and market disturbances, and its simultaneous increase in many countries was especially visible in 2021–2022. During this period, a significant rise in values was recorded in Luxembourg, Finland, the Netherlands, Bulgaria, France, and Lithuania. This pattern occurred in a broader context of constrained energy resource supply, disruptions in global trade, and the growing importance of supply security in EU energy policy. The mechanism linking this pillar to transition-related instability can be interpreted as the transmission of external supply, market, and geopolitical shocks to national energy systems. Countries with greater exposure to imported energy carriers may be more sensitive to changes in fuel availability, international prices, trade disruptions, and geopolitical uncertainty. At the same time, limited energy self-sufficiency may reduce a system’s ability to absorb external disruptions without noticeable changes in energy security indicators. High values for this pillar therefore do not necessarily indicate only a high static level of import dependence. They may also reflect variability in external exposure and changes in the ability of national energy systems to maintain supply stability under disrupted market conditions.
The analysis of the five pillars provides a deeper understanding of the sources and mechanisms shaping DESRI values in EU-27 countries. The results indicate that transition-related instability is multidimensional and that its level and variability are the outcome of interactions among various, often partly independent, structural, technological, climatic, demand-related, economic, social, and geopolitical processes.


4.3. Analysis of the Impact of Partial Pillars on the DESRI Value

In order to deepen the interpretation of the obtained results and identify the main sources of variation in DESRI values, an analysis was conducted of the influence of individual partial pillars on the global DESRI index. This analysis makes it possible to determine which dimensions contributed most strongly to DESRI values in individual countries and how the internal structure of the index changed over time.
For this purpose, two reference points were selected: 2015, representing the initial stage of the analysed period, and 2023, reflecting the situation after a series of strong energy and geopolitical shocks. For these two years, the internal structure of DESRI was presented as the relative contribution of individual pillars to the overall index value (Figure 7). Such an approach allows for a comparison not only of the level of the index, but also of its internal composition, thereby highlighting changes in the relative importance of particular dimensions.
The structural analysis of DESRI also makes it possible to identify countries in which a high global index value resulted mainly from the strong contribution of a single pillar, as well as those in which the index reflected a more multidimensional structure arising from the simultaneous contribution of several pillars. This is relevant from the perspective of energy policy interpretation, because different configurations of pillar contributions may be associated with different areas requiring analytical attention.
The analysis of the DESRI structure for 2015 and 2023 allows for a clear identification of changes in the internal composition of the index in EU-27 countries. The obtained results show the relative contributions of individual pillars to the final DESRI value and reveal significant shifts in this composition over the analysed period.
In 2015, in the majority of countries, the climate and emissions pillar accounted for the largest share of DESRI. This was the case, among others, in Estonia (0.346), Finland (0.321), Sweden (0.276), Denmark (0.211), and Luxembourg (0.223). The relatively high share of this pillar indicates that, at the beginning of the analysed period, emissions-related indicators contributed substantially to DESRI values. In many countries, the climate and emissions component accounted for a substantial part of the total index value.
Another important component of DESRI in 2015 was the external dependency and system resilience pillar, particularly visible in countries such as the Netherlands (0.346), Malta (0.248), Denmark (0.148), and Sweden (0.046). In these cases, the contribution of this pillar indicates that DESRI values were influenced to an important extent by variation in dimensions related to import dependence and the capacity of systems to cope with external pressures. At the same time, the structural and transformational pillar and the efficiency and demand-related pillar had relatively smaller shares in the DESRI structure in 2015, which indicates that, these dimensions contributed less strongly to the overall DESRI structure.
The DESRI structure in 2023 differs markedly from that observed in 2015. In many countries, a strong increase in the share of the external dependency and system resilience pillar can be observed, and in several cases it became the dominant component of DESRI. This applies in particular to Belgium (0.275), the Netherlands (0.214), Malta (0.303), Luxembourg (0.346), and Sweden (0.217). In these countries, the higher contribution of this pillar indicates that, in 2023, DESRI values were more strongly influenced by indicators associated with external dependency and system resilience. This coincided with the energy crisis, supply constraints and intensified geopolitical uncertainty.
At the same time, in 2023 an increase in the importance of the structural and transformational pillar became evident, especially in countries implementing intensive changes in energy generation structures. Examples include Lithuania (0.101), Latvia (0.122), Austria (0.121), and the Netherlands (0.095). This indicates that, in selected countries, structural and infrastructural adjustment indicators played a greater role in shaping DESRI values in 2023.
Compared with 2015, the relative share of the climate and emissions pillar in 2023 decreased in many countries, although in some cases it remained substantial (e.g., Finland—0.346; Luxembourg—0.308). This pattern may be consistent with a partial stabilisation of emissions-related trajectories and with the gradual adaptation of countries to the regulatory framework of EU climate policy.
Overall, the structural analysis of DESRI shows that in 2015–2023 there was a noticeable shift in the composition of the index: from a structure more strongly influenced by the climate and emissions pillar in the initial period toward a greater role of the external dependency and system resilience pillar and, in some cases, the structural and transformational pillar in 2023. These results indicate that transition-related instability captured by DESRI not only changes in magnitude, but also evolves in its internal composition, which is relevant for the interpretation of energy transition pathways across the European Union.
The change in the structure of DESRI between 2015 and 2023 also indicates an evolution in the mechanisms shaping transition-related instability. During the initial period, climate and emissions components played a more prominent role, which may be interpreted as reflecting regulatory pressures and decarbonisation-related adjustments. In 2023, however, the external dependence and system resilience pillars gained importance, as did the structural and transformational pillar in some countries. This indicates a shift in the sources of instability from a predominantly regulatory and emissions-related dimension towards factors associated with security of supply, exposure to external shocks, and the capacity of infrastructure to absorb an accelerated transition.

5. Discussion

The results obtained in this study should be interpreted in relation to three major strands of prior research on energy security. First, similarly to conventional composite indices, the proposed framework enables comparative cross-country assessment. However, unlike standard static indices, it emphasises temporal instability and the irregularity of change rather than only the absolute level of performance. Second, the study is closer in spirit to recent dynamic approaches, such as those proposed by Gong et al. [29] and Zhang and Zhou [30], which likewise recognise that temporal variation and external disturbances are relevant to energy security assessment. At the same time, the present framework differs from these contributions by relying on a transparent macro-statistical aggregation procedure applied to the EU-27. Third, in contrast to supply-chain-oriented risk studies, such as Axon and Darton [38,39] the proposed index does not estimate actual disruption mechanisms. Instead, it provides a broader, macro-level picture of transition-related vulnerability observable in statistical trajectories. In this sense, DESRI is best understood as a complementary analytical tool positioned between static benchmarking and more detailed risk diagnostics.
Against this background, the conducted research aligns with the growing body of literature that highlights the dynamic and multidimensional character of energy security under conditions of energy transition. Unlike classical static measures focused on the level of resources, renewable energy deployment, import diversification, or emissions intensity, the DESRI framework makes it possible to capture temporal instability and episodes of transitional tension that may remain less visible in approaches based solely on one-time rankings or average indicator values.
The obtained results are consistent with studies emphasising that energy security should be analysed as a process shaped by regulatory, technological, economic, and geopolitical change rather than exclusively as a condition described by the current level of selected indicators. From this perspective, the variability of DESRI values across countries and over time supports the view that static benchmarking alone may not fully capture the instability accompanying deep transformation processes.
Particularly significant is the fact that countries often considered in the literature as leaders of the energy transition (e.g., Sweden, Denmark) [20,67,68,69,70] were characterised by elevated DESRI values in selected years. This result is consistent with the observations of Markard [71] and Grubler [72], who point out that a rapid pace of technological transformation may generate temporary systemic tensions, especially in the areas of grid stability, system flexibility, and social acceptance. This finding is especially important from an interpretative perspective because it demonstrates that a high DESRI value does not necessarily indicate a reversal of the energy transition. It may also reflect a situation in which positive changes, such as the rapid development of renewable energy, swift emissions reductions, or improvements in energy efficiency, occur at a pace requiring substantial infrastructural, regulatory, investment, and social adjustments. In this sense, DESRI does not classify changes themselves as beneficial or adverse. Instead, it identifies periods in which their intensity may increase pressure on the stability of the transition process. From a public policy perspective, this means that countries with ambitious transition objectives may require more precise management of the pace and sequencing of the transition rather than its deceleration. Elevated DESRI values in countries with advanced transitions should be interpreted as signalling a need to coordinate infrastructure investments, strengthen energy system flexibility, develop balancing capacity, and mitigate social and distributional costs. An effective energy transition may therefore include periods of elevated instability that should not automatically be regarded as failures but rather as temporary pressures requiring active management. From this perspective, DESRI can support the identification of countries and periods in which the pace of change requires particular policy and infrastructure attention.
In this respect, the findings are also partly convergent with results obtained using the Energy & Climate Risk (ECR) index [40], which identifies elevated levels of vulnerability in countries characterised by ambitious climate policies and high transformation dynamics. In the case of ECR, higher values in countries such as the Netherlands or Denmark are associated primarily with regulatory pressure, sensitivity to energy price volatility, and the costs of integrating renewable energy sources, rather than with insufficient progress toward climate objectives. The partial convergence of DESRI and ECR suggests that both frameworks capture tensions accompanying periods of intensive transformation, although they do so through different conceptual and methodological lenses.
At the same time, the analytical value of DESRI lies in its attempt to distinguish between the level of advancement of the transition and the stability of the change process itself. This allows the analysis to place greater emphasis on periods of temporary destabilisation, which are often treated only indirectly in conventional energy security assessments and broader energy-climate indices.
The periods of accumulated transition-related instability identified in the study, namely 2017–2019 and 2021–2022, can be interpreted in light of the interaction of several groups of social, market, and geopolitical factors. The first period may be associated primarily with the intensification of EU climate and energy policy, including the adoption and implementation of the Clean Energy for All Europeans package [63]. This process simultaneously increased regulatory and investment pressures across numerous Member States, particularly regarding renewable energy development, improvements in energy efficiency, emissions reductions, and adjustments to national energy mix structures. The increase in DESRI values during this period may therefore reflect an acceleration of adjustment processes that occurred unevenly in some countries or exceeded the short-term adaptive capacity of their energy systems.
The second period, covering 2021–2022, was different in nature. The increase in DESRI values during this period should be interpreted in the context of overlapping pressures associated with the post-COVID-19 recovery in energy demand, substantial energy price volatility, tensions in European gas and electricity markets, and growing geopolitical uncertainty following Russia’s invasion of Ukraine [73]. The simultaneous increase in DESRI values across countries with different energy mixes and levels of economic development indicates that transition-related instability during this period was shaped not only by national structural conditions but also by common external pressures transmitted through integrated European energy markets [74].
These findings should not, however, be interpreted as direct evidence of causal relationships between specific policy developments, price shocks, or geopolitical events and changes in DESRI values. Instead, they indicate a temporal correspondence between rising transition-related instability and periods of intensified regulatory, market, and geopolitical pressure. In this sense, DESRI can be treated as a diagnostic tool for identifying periods in which different channels of pressure, including policy, price, infrastructure, and geopolitical factors, overlap and increase the irregularity of energy transition pathways.
The analysis of the partial pillars of the DESRI index allows for a deeper interpretation of the sources of risk, consistent with multidimensional approaches proposed, among others scholars (e.g., [1,21,22,27,28,45,46,47,48,74,75,76]).
The structural and transformational risk of the energy mix proved to be one of the main destabilising factors, which is consistent with the literature emphasising that rapid changes in the energy mix increase flexibility requirements, create integration challenges, and may generate systemic tensions during the transition process [77,78,79]. Particularly high values of this pillar in small, highly open economies (Luxembourg, Malta, Estonia) are consistent with research findings indicating the limited capacity of such systems to absorb abrupt structural changes. Climate and emissions risk aligns with observations suggesting that in the early phase of the transition the main source of uncertainty lies in emission reduction trajectories and their alignment with policy targets [80,81]. Efficiency and demand-related risks as well as economic and social risks reveal the importance of demand-side and social factors, which are often marginalised in classical energy security indices. These findings are consistent with literature on energy poverty and social acceptance of the energy transition [82,83,84,85]. In turn, external dependency and system resilience risk, which in 2023 became the dominant pillar of DESRI, clearly confirms a shift in both academic and political debate [86,87] toward security of supply, resilience, and energy sovereignty.
Against the background of existing research, the contribution of DESRI should be understood in a specific and delimited way. First, it helps identify episodes of transition-related instability that may remain less visible in static approaches. Second, it enables analysis not only of the aggregate level of synthetic risk, but also of its internal structure across pillars. Third, it indicates that a high level of advancement in the energy transition does not necessarily coincide with lower short-term instability during the transformation process.
Taken together, these findings are consistent with studies suggesting that effective energy policy should be not only climate-ambitious, but also adaptive, sequenced, and resilient to shocks [88,89]. From this perspective, the DESRI model may be treated as a useful complementary analytical instrument that supports comparative research on the stability of transition pathways and may also offer support for policy interpretation at the macro level.

6. Conclusions

This study addressed the timely and important issue of assessing transition-related instability in the context of energy security in EU-27 countries. It proposed and empirically tested the DESRI framework as a composite measure designed to capture the pace and irregularity of changes occurring in selected dimensions associated with the energy transition. Unlike conventional static energy security indices, which primarily describe the condition of a system in a given year, the proposed approach places greater emphasis on temporal instability and the accumulation of transitional tensions over time. In this sense, the DESRI framework should be understood as complementing rather than replacing established energy security assessment tools.
The obtained results show that transition-related instability is highly differentiated both spatially and temporally. EU-27 countries implement the transition in different ways. Although in a given year they may achieve similar levels of energy security, they may simultaneously generate entirely different levels of instability in the transition process over the longer term. This means that when assessing the safety of the transition process, the rhythm, regularity, and stability of changes are as important as their direction.
The temporal analysis of DESRI values made it possible to identify periods of risk accumulation across the entire European Union, particularly in 2017–2019 and 2021–2022. The simultaneous increase in DESRI values in many countries indicates the presence of systemic factors. These include, among others, the intensification of EU climate policy, the acceleration of decarbonization processes, the integration of energy markets, and vulnerability to external shocks, including resource and geopolitical crises.
In turn, the pillar-based analysis showed that the structure of transition-related instability evolves significantly over time. In the initial stages, climate and emissions risk played a dominant role, whereas as the transition progressed, external dependency risk, system resilience risk, and structural and transformational risk of the energy mix gained increasing importance. These findings suggest that as successive stages of decarbonization are achieved, the focus of instability shifts from the realisation of environmental goals toward the system’s capacity to absorb rapid technological, infrastructural, and market changes.
The classification of countries based on quartile risk classes confirmed the dynamic nature of the phenomenon under study. Membership in particular risk classes is not permanent, and many countries demonstrate the ability to move between categories, which reflects the adaptability of their energy systems. At the same time, a group of countries characterised by structurally elevated DESRI values was identified, stemming from persistent systemic constraints such as high import dependence, small system scale, or limited diversification opportunities.
The empirical application also indicates that countries with apparently favourable static characteristics may still differ substantially in the stability of their transition trajectories. This suggests that instability-sensitive assessment may provide a useful additional analytical lens in comparative energy security research, particularly under conditions of accelerated policy, technological, and geopolitical change.
From the perspective of energy policy, the results indicate that effective energy transition should be assessed not only in terms of achieving climate targets but also in terms of the stability and security of the change process itself.
The obtained results have important implications for the design and implementation of energy policy at both national and EU levels:
The energy transition should be assessed not only in terms of progress towards climate objectives but also with regard to the stability of the transition pathway itself. DESRI results show that countries exhibiting high index values in selected years, such as Estonia, Luxembourg, Malta, the Netherlands, and Finland, experienced more rapid or irregular changes in key transition-related indicators. Even measures consistent with long-term decarbonisation objectives may therefore generate short- and medium-term instability if implemented too rapidly, unevenly, or without adequate infrastructural and institutional adjustments.
Monitoring systems at the EU and Member State levels should incorporate dynamic indicators of transition variability rather than relying exclusively on static measures of energy security or decarbonisation. The observed accumulation of higher DESRI values in 2017–2019 and 2021–2022 indicates that transition-related instability may increase simultaneously across several countries. In this context, the DESRI framework may support an early-warning approach by identifying countries and policy areas in which instability begins to accumulate before developing into broader energy security pressures.
Public policy instruments should be differentiated according to the dominant source of instability identified at the DESRI pillar level. In countries with elevated structural and transformational risk, priorities should include electricity grid modernisation, energy storage development, increased system balancing capacity, demand-side flexibility, and better coordination between renewable energy expansion and the phase-out of conventional generation capacity. These instruments are particularly important where changes in the energy mix occur faster than infrastructure can adapt.
In countries where external dependence and system resilience strongly affect DESRI values, energy policy should focus on reducing exposure to supply shocks. Relevant measures include diversifying energy suppliers and import routes, expanding cross-border interconnections, increasing strategic storage capacity, coordinating emergency reserves regionally, and introducing temporary demand-reduction measures during periods of market stress. The results for 2021–2023 indicate that external dependence remains an important component of transition-related instability and should be integrated into transition planning rather than treated as a separate energy security issue.
In countries where economic and social risk represents a significant DESRI component, the energy transition should be supported by targeted protective instruments and measures improving energy affordability. These should include assistance for households at risk of energy poverty, programmes for renovating and improving the thermal efficiency of energy-inefficient buildings, targeted compensation mechanisms, and instruments mitigating the regressive effects of rising energy prices. In such cases, the principal policy challenge is not only to maintain the pace of decarbonisation but also to prevent the social costs of the transition from undermining its acceptance and long-term stability.
The DESRI framework may also support the coordination of EU energy policy by distinguishing between countries with stable transition trajectories and those experiencing temporary or persistent dynamic instability. This distinction is important because countries with similar static levels of renewable energy use, emissions, or import dependence may differ substantially in the stability of their transition processes. Policy support should therefore be tailored not only to the level of energy transition advancement but also to the variability and irregularity of the change process.
From an operational perspective, DESRI can be treated as a complementary diagnostic tool within existing EU energy policy monitoring mechanisms. The index should not replace existing indicators of decarbonisation, security of supply, or energy efficiency. Instead, it can complement them by providing information on the stability of the transition pathway. Pillar-level DESRI analysis may be particularly useful because it identifies whether elevated instability is driven primarily by structural factors, external dependence, emissions pressures, demand and efficiency factors, or the economic and social component. This approach is consistent with the logic of differentiated transition pathways, as countries at similar levels of transition advancement may require different public policy instruments. In practice, DESRI could serve as an early-warning indicator. Situations requiring particular policy attention may include a country remaining in the highest DESRI category for two or more consecutive years, moving rapidly into a higher instability category, or experiencing the increasing dominance of one pillar within the index structure. These thresholds should not be treated as rigid normative values but rather as signals triggering an in-depth country analysis, additional monitoring, or a review of energy policy instruments. In this sense, DESRI may support a shift from general monitoring of transition progress towards a more targeted identification of countries, periods, and areas requiring intervention or improved policy coordination.
At the same time, the study has important limitations. The set of indicators and the pillar structure were defined for the European Union context and reflect both the analytical scope of the study and the availability of harmonised macro-statistical data. Although this ensures the comparability of results across countries, it may also lead to the omission of certain technological, institutional, regulatory, or infrastructural dimensions. Moreover, the weighting procedure combines data-driven elements with elements informed by public policy priorities, which means that the resulting index is not free from normative assumptions. The DESRI framework also does not capture disruption mechanisms at the level of fuel supply chains, infrastructure failures, or scenario-based future risks. For these reasons, DESRI should be interpreted as a complementary macro-level analytical tool rather than as a complete measure of energy security risk.
Future research may develop the proposed DESRI framework in several directions. The first involves testing alternative indicator sets and weighting schemes. This would make it possible to assess the robustness of DESRI values and country classifications to key methodological assumptions, including indicator selection and pillar weights. Future studies could also provide more detailed interpretations of national trajectories by linking changes in DESRI and its pillars to specific policy decisions, market developments, infrastructure constraints, or geopolitical shocks. This would shift the application of the index from descriptive monitoring towards a more explanatory and policy-relevant approach. Another direction would involve adapting the DESRI framework to groups of countries beyond the EU-27. Such applications would, however, require the context-specific adjustment of the indicator set, pillar structure, and weighting assumptions to local institutional, economic, and geopolitical conditions. In this sense, the methodological value of DESRI lies in providing a flexible procedure for the comparative assessment of transition-related instability under clearly specified assumptions. From this perspective, the DESRI framework may serve as a useful analytical tool for research on the stability of energy transition pathways and, with appropriate interpretative caution, support the macro-level interpretation of findings for energy and climate policy purposes.

Author Contributions

Conceptualization, M.T. and J.B.; methodology, J.B. and M.T.; software, M.T. and J.B.; formal analysis, J.B. and M.T.; investigation, J.B. and M.T.; resources, M.T., J.B. and W.W.G.; data curation, M.T. and J.B.; writing—original draft preparation, M.T., J.B. and W.W.G.; writing—review and editing, J.B. and M.T.; visualisation, M.T.; supervision, M.T. and J.B.; project administration, M.T. and J.B.; funding acquisition, M.T. All authors have read and agreed to the published version of the manuscript.

Funding

This publication was funded by the statutory research performed at Silesian University of Technology, Department of Production Engineering (project no. 13/030/BK_26), Faculty of Management and Organization, and the Department of Safety Engineering (project no. 06/030/BK_26), Faculty of Mining, Safety Engineering and Industrial Automation.

Institutional Review Board Statement

Not applicable.

Informed Consent Statement

Not applicable.

Data Availability Statement

The data presented in this study are available on request from the corresponding authors.

Conflicts of Interest

The authors declare no conflicts of interest.

Appendix A. Sensitivity Analysis of DESRI to the Rolling-Window Length

One of the parameters adopted in the construction of DESRI is the length of the rolling window used to determine indicator volatility. The baseline variant presented in the main body of the article employs a three-year rolling window (k = 3). To assess whether this parameter affects the index results and country rankings, a sensitivity analysis was conducted using an alternative two-year window (k = 2).
The selection of k = 3 was motivated by the need to balance the stability of volatility estimation with the index’s sensitivity to short-term transition impulses. A two-year window bases the volatility assessment on a very short sequence of observations, making the results highly responsive to individual annual changes. This may lead to the excessive prominence of temporary fluctuations, measurement errors, or one-off events. Using three observations makes it easier to distinguish an isolated fluctuation from an irregularity persisting over time.
At the same time, a three-year window remains sufficiently short to preserve DESRI’s ability to identify dynamic changes associated with the energy transition. Given the relatively short study period of 2013–2023, applying a longer window would reduce the number of available annual results and could excessively smooth the index’s response to significant transition impulses. The selection of k = 3 is therefore regarded as a compromise between three requirements:
limiting the influence of individual annual changes;
maintaining sensitivity to short-term instability;
retaining an adequate number
of DESRI observations over the analysed period.
The sensitivity analysis was conducted by recalculating DESRI values for all EU-27 countries using a two-year rolling window (k = 2). All other elements of the procedure, including the indicator set, normalisation, weighting system, and aggregation method, remained unchanged. Consequently, the observed differences can be attributed exclusively to the change in rolling-window length.
Country rankings were compared in particular because DESRI values obtained using different window lengths may differ in scale due to differences in the information used to estimate volatility. Ranking consistency was assessed using Spearman’s rank correlation coefficient:
ρ s = 1 6 i = 1 n d i 2 n ( n 2 1 )
where d i denotes the difference between a country’s ranking positions for k = 2 and k = 3, while n = 27 denotes the number of countries analysed.
The mean absolute rank difference was also calculated:
M A R D t = 1 n i = 1 n | R i , t ( 2 ) R i , t ( 3 ) |
where R i , t ( 2 ) and R i , t ( 3 ) denote the ranking position of country i in year t for the two-year and three-year windows, respectively.
Spearman’s rank correlation coefficients are presented in Table A1.
Table A1. Consistency of DESRI rankings for rolling windows k = 2 and k = 3.
YearSpearman’s Rank CorrelationMean Absolute Change in Ranking Position
20150.8583.19
20160.8802.59
20170.8093.26
20180.8203.56
20190.9182.59
20200.9172.30
20210.8343.19
20220.8473.26
20230.9432.22
Mean0.8702.91
The rank correlation coefficients were high in all analysed years, ranging from 0.809 to 0.943. The greatest ranking consistency was observed in 2023, while the relatively lowest consistency occurred in 2017. The mean Spearman coefficient for the entire period was 0.870, indicating a high degree of agreement between the country rankings obtained under the two variants.
The mean absolute rank difference was 2.91 positions. Moreover, 67.9% of the compared positions changed by no more than three places, while 83.5% changed by no more than five places. This indicates that applying the shorter window affects index values and the positions of certain countries but does not fundamentally alter the overall structure of the results.
Detailed DESRI values and country rankings for k = 2 are presented in Table A2, while the baseline results for k = 3 are reported in Table A3.
Table A2. DESRI values for the rolling window k = 2.
DESRI ValueRanking Position
201520162017201820192020202120222023201520162017201820192020202120222023
BE0.43930.39650.07000.28330.31570.30100.54820.42750.579975261612102135
BG0.15960.18480.24280.45940.23690.28040.45580.57710.743722161832114452
CZ0.16520.12900.28340.23060.15650.23490.19100.33760.568421231321241822186
DK0.34210.17660.27720.19090.49750.40500.42450.31670.346691714244652020
DE0.04670.05380.05580.18960.23500.19510.17400.29750.4195272627252223262117
EE0.62250.74850.81160.90190.45970.76170.89020.47260.47983111611912
IE0.28670.69210.19910.26010.46150.28380.49940.23240.5046122221851332511
EL0.20070.22710.08300.32230.42630.49650.17400.29390.4408181225984252316
ES0.11230.22270.13100.13580.20940.31750.29730.28400.444825142326239182415
FR0.28400.22300.23510.33800.34740.27830.29950.67730.39991313208111516218
HR0.23580.15670.31570.32190.28990.21230.27220.49220.276715201010162120726
IT0.20660.11880.11170.06850.10240.23090.41150.29590.276517252427261962227
CY0.15820.13870.26300.27970.29680.35220.14170.21570.53172321151715827268
LV0.32680.26530.38650.67620.37700.29450.36240.63150.512610832911949
LT0.29960.24580.24760.31760.30040.22560.37000.64000.47181110171113207313
LU0.47930.30350.28880.35800.87500.72200.29780.72480.806167126121711
HU0.23280.12390.33430.24960.25320.13190.23930.35480.367716248191927211619
MT0.84240.56960.65090.30680.35220.50810.33740.50190.6447132141031364
NL0.63120.23810.31830.42770.59390.45700.33960.46840.6814211942512103
AT0.19890.05280.20100.30760.25690.17120.18360.19280.3338202721131824232722
PL0.12670.17500.31560.35660.09910.21060.34150.35450.450224181172722111714
PT0.41160.20260.24130.20020.29720.26960.18200.40040.512581519231416241410
RO0.09600.26150.33660.24370.25020.16560.28270.44450.32882697202026191123
SI0.24570.16550.25840.21990.28310.26160.31800.33210.2899141916221717141924
SK0.19950.13670.36250.29780.11940.16890.35150.43500.277219225152525101225
FI0.53640.39670.37630.31470.53250.28690.36850.48000.534454412312887
SE0.57160.38260.33710.42370.44300.38200.31570.38280.3346466577151521
Table A3. DESRI values for the rolling window k = 3.
DESRI ValueRanking Position
201520162017201820192020202120222023201520162017201820192020202120222023
BE0.36730.29140.06020.17220.37870.23220.35860.50170.48948927231013597
BG0.09540.13530.19270.43250.30450.28660.31470.52520.587827201941581183
CZ0.14420.10170.28840.20680.23170.16560.09870.31960.4393212411212220252710
DK0.49010.34340.26700.16660.56880.28310.39080.41140.35125816253931516
DE0.16050.11730.08700.22200.22200.12020.11250.35400.3643192226182323242115
EE0.64560.58280.82530.88870.59160.79410.85190.38110.367031112111914
IE0.36450.57950.31450.28330.46090.24680.32270.35530.44469271281210209
EL0.25530.18370.11480.27830.55610.37160.16410.39170.42111114251453221711
ES0.12310.16610.14460.11030.21190.20160.20470.34920.3298241623262415182218
FR0.23260.18720.15520.21950.29920.17850.23640.59750.226813132119161816524
HR0.23030.12950.27420.26210.33460.20150.19230.47080.2399142114151216191023
IT0.10430.06770.11640.03910.10430.13340.23530.32380.2244262624272721172425
CY0.21130.21120.29860.30880.35550.25970.07910.34160.5285151199111126235
LV0.24940.20250.35530.72750.45000.32790.36190.56570.446512123297468
LT0.19780.15210.14660.28620.25460.17760.32440.61200.39021819221119199412
LU0.54800.43840.32370.28150.75920.52820.34190.83070.76234551312611
HU0.13300.10330.33190.24340.32420.11510.18290.40200.319222234161425211619
MT0.67510.49440.75310.35970.33210.36800.24170.53000.599423261341572
NL0.69380.37540.24240.35560.55480.34670.33270.62120.58681618765834
AT0.20060.06590.18710.28850.23240.11980.15280.32070.2469172720102124232621
PL0.15640.16630.27610.37600.16230.21230.27630.32090.338620151352614132517
PT0.33790.15470.26940.17200.29210.12970.04510.41760.3816101715241722271413
RO0.12070.27730.26540.19180.24230.09910.18480.43500.2199251017222027201226
SI0.20530.15220.27960.22210.27930.17960.25080.38700.2399161812171817141822
SK0.12630.08020.30440.21620.19650.11040.30520.43080.106923258202526121327
FI0.45810.48110.31790.34330.52250.27750.52470.70360.50577468710226
SE0.46760.35120.29220.45020.56680.33810.33570.46410.2862671034671120
The analysis confirmed that the principal DESRI results are robust to changing the rolling-window length from three to two years. The k = 2 variant is more sensitive to individual annual changes, resulting in local shifts in country rankings. However, it does not fundamentally alter the overall ranking structure, as demonstrated by the high rank correlation coefficients. The sensitivity analysis supports the use of k = 3 as the baseline variant. The three-year window limits the influence of temporary fluctuations while preserving the index’s ability to identify short-term and irregular changes in transition trajectories. Nevertheless, the window length remains a methodological assumption. Future research may therefore consider longer windows and examine their effects on DESRI values, country rankings, and the identification of periods of elevated instability.

Appendix B. Sensitivity Analysis of DESRI to the Value of the Parameter α

The parameter α determines the relative importance of the current-change dynamics component and the historical volatility component in the construction of DESRI. In the baseline variant, α = 0.6 was adopted, whereas the sensitivity analysis used an equal-weight variant, α = 0.5 . The aim of the analysis was to determine whether a moderate change in the proportion between the two components affects DESRI values and the ranking positions of the EU-27 countries.
The value α = 0.6 indicates a moderate increase in the importance of current-change dynamics relative to volatility observed within the rolling window. This assumption follows from the dynamic nature of DESRI, whose purpose is to identify current transition-related impulses while also accounting for the irregularity of earlier change trajectories.
To verify whether this choice determines the results, an analysis was conducted for α = 0.5 , which assigns equal importance to both components. DESRI values were recalculated for all EU-27 countries and for the years 2015–2023 using α = 0.5 . The remaining elements of the procedure, including the set of indicators, normalisation, weighting scheme, rolling-window length, and aggregation method, remained unchanged. As a result, differences between the variants can be attributed to the change in the value of α .
Ranking consistency was assessed, as in the sensitivity analysis concerning the rolling-window length, using Spearman’s rank correlation coefficient (Table A4). The mean absolute change in country ranking position was also calculated.
Table A4. Consistency of DESRI rankings for α = 0.5 and α = 0.6 .
YearSpearman’s Rank CorrelationMean Absolute Change in Ranking Position
20150.9900.67
20160.9910.81
20170.9920.59
20180.9900.74
20190.9661.56
20200.9771.19
20210.9840.89
20220.9821.04
20230.9930.59
Mean0.9850.90
The rank correlation coefficients for individual years ranged from 0.966 to 0.993. The mean value of Spearman’s coefficient was 0.985, indicating very high consistency between the rankings obtained under both variants. The mean absolute change in ranking position was only 0.90 places. In 79.4% of cases, changing the value of α shifted a country by no more than one position; in 93.8% of cases, by no more than two positions; and in 96.7% of cases, by no more than three positions. The maximum observed change was five positions. The largest differences occurred in 2019, although even in that year the rank correlation reached 0.966. This means that changing the parameter affects the level of DESRI values and some country positions, but does not alter the overall structure of the results.
Detailed DESRI values and rankings for α = 0.5 are presented in Table A5, while the results of the baseline variant for α = 0.6 are reported in Figure 1a (Section 4.2).
Table A5. DESRI values and ranking positions for α   =   0.5 and k = 3.
DESRI ValueRanking Position
201520162017201820192020202120222023201520162017201820192020202120222023
BE0.36040.27480.06520.15190.41890.23720.32390.47820.477591027241013997
BG0.09850.13980.17900.40990.35400.30800.28290.47840.547726222041481284
CZ0.14920.11040.27980.19510.28850.16690.09210.30210.4111222410211820252611
DK0.51650.40280.25320.16340.56790.26490.38240.40820.354957162351051314
DE0.18640.14360.08460.22020.21290.10700.11100.33640.3541192126172527242216
EE0.63910.57090.82550.87430.60280.80360.81680.33060.354432113112315
IE0.38020.57900.32560.27620.44390.24950.29110.36190.43378151191110199
EL0.26540.19120.11030.24520.58340.35150.17420.38710.42181114241444221610
ES0.13700.16660.12570.10090.22170.19060.18650.33670.3061231723262317212119
FR0.23150.20330.15150.19660.28980.19010.26180.55300.203114132119171814525
HR0.24400.14930.25770.23590.36090.22340.19680.43950.2409132014151215181121
IT0.08450.06580.10410.04060.11440.13240.20150.30320.2156272725272721172524
CY0.22740.23640.29480.29970.38880.24390.07000.34090.5261151189111226205
LV0.25150.21610.33450.72480.50950.36260.39910.53590.446912124273468
LT0.19520.16120.14320.29060.25580.19380.35000.57000.39181718221021168412
LU0.58840.50260.34400.27340.70760.48250.40240.82830.77494331212311
HU0.12520.11650.31590.23510.35590.12880.18680.38480.312224237161322201718
MT0.64470.49840.77800.37440.34550.34960.24410.50040.596024251551672
NL0.70160.43300.23400.33320.49440.33820.36320.60620.56701618886633
AT0.18860.08040.18000.25480.20920.12660.14580.31050.2180182619132623232423
PL0.18500.18690.26010.37080.21930.23010.27170.29140.315520151362414132717
PT0.31400.15810.25470.14780.29470.11750.03690.40940.3626101915251624271213
RO0.15770.28630.24860.19530.24450.11390.18700.40590.198621917202226191426
SI0.19980.16810.27030.21320.28050.17750.25380.38250.2279161612181919151822
SK0.11700.08810.29070.19460.25700.11650.29020.39000.079825259222025111527
FI0.41350.49030.31940.33700.52120.27420.52220.68870.4958756769226
SE0.42130.34490.27690.44240.60580.33190.35600.45410.2859681132771020
The sensitivity analysis confirmed the high robustness of DESRI results to changing the parameter α from 0.6 to 0.5. Very high rank correlations and small average shifts in ranking positions indicate that adopting a moderate advantage of the current-change dynamics component does not determine the country classifications.
The results support the use of α = 0.6 in the baseline variant. This parameter preserves greater sensitivity of the index to current transition-related impulses while still accounting for the irregularity of earlier changes. However, it should not be interpreted as the only possible value. It is a modelling assumption whose influence was verified by comparison with a variant assigning equal weight to both components.

References

  1. Brodny, J.; Tutak, M.; Grebski, W.W. Multi-Barrier Framework for Assessing Energy Security in European Union Member States (MBEES Approach). Energies 2025, 18, 4905. [Google Scholar] [CrossRef]
  2. Strojny, J.; Krakowiak-Bal, A.; Knaga, J.; Kacorzyk, P. Energy Security: A Conceptual Overview. Energies 2023, 16, 5042. [Google Scholar] [CrossRef]
  3. Siksnelyte-Butkiene, I.; Streimikiene, D.; Karpavicius, T.; Balezentis, T. Societal challenges to ensure energy security: A systematic critical review of the concept, indicators, and low-carbon transition policies. Energy Res. Soc. Sci. 2025, 127, 104219. [Google Scholar] [CrossRef]
  4. Moghani, A.M.; Loni, R. Review on energy governance and demand security in oil-rich countries. Energy Strategy Rev. 2025, 57, 101625. [Google Scholar] [CrossRef]
  5. Yang, X.; Zhou, H.; Gao, J. Enhancing renewable energy productivity and energy efficiency of energy projects: How does cost of capital influence? Energy Strategy Rev. 2025, 57, 101608. [Google Scholar] [CrossRef]
  6. Batóg, J.; Pluskota, P. Renewable Energy and Energy Efficiency: European Regional Policy and the Role of Financial Instruments. Energies 2023, 16, 8029. [Google Scholar] [CrossRef]
  7. Mauro, M.R. Energy Security, Energy Transition, and Foreign Investments: An Evolving Complex Relationship. Laws 2024, 13, 48. [Google Scholar] [CrossRef]
  8. Hu, G.; Yang, J.; Li, J. The Dynamic Evolution of Global Energy Security and Geopolitical Games: 1995–2019. Int. J. Environ. Res. Public Health 2022, 19, 14584. [Google Scholar] [CrossRef] [PubMed]
  9. Osuma, G.; Yusuf, N. Towards an optimal renewable energy mix for the European Union: Enhancing energy security and sustainability. J. Knowl. Econ. 2025, 16, 17085–17121. [Google Scholar] [CrossRef]
  10. Lal, A.; Tavoni, M.; Preuss, N.; You, F. Aligning EU energy security and climate mitigation through targeted transition strategies. Nat. Commun. 2026, 17, 875. [Google Scholar] [CrossRef] [PubMed]
  11. Bąk, I.; Sulikowski, P.; Wawrzyniak, K.; Szczecińska, B.; Oesterreich, M. Data-Driven Assessment of Energy Security Dynamics in European Union Countries. Energy Policy 2026, 217, 115449. [Google Scholar] [CrossRef]
  12. Muresan-Grecu, F.; Fita, N.D.; Babut, G.B.; Ilieva Obretenova, M.; Pasculescu, D.; Lazar, T.; Uțu, I.; Rada, C.; Schiopu, A.M.; Nicola, A.; et al. Analysis and Assessment of Energy Security in the Context of Ensuring Economic Sustainability and Crisis Prevention. Sustainability 2026, 18, 3183. [Google Scholar] [CrossRef]
  13. Ivashko, O.; Simakhova, A.; Soliakov, V.; Choroszczak, J. Clustering EU Member States by Energy Security Level Using Kohonen Maps. Energies 2025, 18, 4750. [Google Scholar] [CrossRef]
  14. Wang, Q.; Wang, X.; Li, R. Geopolitical Risks and Energy Transition: The Impact of Environmental Regulation and Green Innovation. Humanit. Soc. Sci. Commun. 2024, 11, 1272. [Google Scholar] [CrossRef]
  15. Gasser, P. A Review on Energy Security Indices to Compare Country Performances. Energy Policy 2020, 139, 111339. [Google Scholar] [CrossRef]
  16. Zhou, P.; Wan, G.-X.; Wen, W.; Zhu, Q. Energy Transition Risk Assessment: Concepts, Indicators, and Methodological Issues. Engineering 2025, in press. [Google Scholar] [CrossRef]
  17. Sovacool, B.K. An international assessment of energy security performance. Ecol. Econ. 2013, 88, 148–158. [Google Scholar] [CrossRef]
  18. Radovanović, M.; Filipović, S.; Pavlović, D. Energy security measurement—A sustainable approach. Renew. Sustain. Energy Rev. 2017, 68, 1020–1032. [Google Scholar] [CrossRef]
  19. Erahman, Q.F.; Purwanto, W.W.; Sudibandriyo, M.; Hidayatno, A. An assessment of Indonesia’s energy security index and comparison with seventy countries. Energy 2016, 111, 364–376. [Google Scholar] [CrossRef]
  20. De Rosa, M.; Gainsford, K.; Pallonetto, F.; Finn, D.P. Diversification, concentration and renewability of the energy supply in the European Union. Energy 2022, 253, 124097. [Google Scholar] [CrossRef]
  21. Brodny, J.; Tutak, M. The comparative assessment of sustainable energy security in the Visegrad countries: A 10-year perspective. J. Clean. Prod. 2021, 317, 128427. [Google Scholar] [CrossRef]
  22. Bąk, I.; Wawrzyniak, K.; Szczecińska, B.; Barej-Kaczmarek, E.; Oesterreich, M. Spatial Differentiation of EU Countries in Terms of Energy Security. Energies 2025, 18, 4310. [Google Scholar] [CrossRef]
  23. Kuzior, A.; Kovalenko, Y.; Tiutiunyk, I.; Hrytsenko, L. Assessment of the Energy Security of EU Countries in Light of the Expansion of Renewable Energy Sources. Energies 2025, 18, 2126. [Google Scholar] [CrossRef]
  24. World Energy Council. World Energy Trilemma Index 2023; World Energy Council: London, UK, 2023; Available online: https://www.worldenergy.org/transition-toolkit/world-energy-trilemma-framework (accessed on 5 February 2026).
  25. World Economic Forum. Fostering Effective Energy Transition 2023: Energy Transition Index Benchmarking Report; World Economic Forum: Geneva, Switzerland, 2023; Available online: https://www.weforum.org/reports/fostering-effective-energy-transition-2023 (accessed on 5 February 2026).
  26. Gardumi, F.; Keppo, I.; Howells, M.; Pye, S.; Avgerinopoulos, G.; Lekavičius, V.; Galinis, A.; Martišauskas, L.; Fahl, U.; Korkmaz, P.; et al. Carrying out a multi-model integrated assessment of European energy transition pathways: Challenges and benefits. Energy 2022, 258, 124329. [Google Scholar] [CrossRef]
  27. Kamali Saraji, M.; Streimikiene, D. A novel multicriteria assessment framework for evaluating the performance of the EU in dealing with challenges of the low-carbon energy transition: An integrated Fermatean fuzzy approach. Sustain. Environ. Res. 2024, 34, 6. [Google Scholar] [CrossRef]
  28. Brodny, J.; Tutak, M. Assessing the Energy and Climate Sustainability of European Union Member States: An MCDM-Based Approach. Smart Cities 2023, 6, 339–367. [Google Scholar] [CrossRef]
  29. Gong, X.; Wang, Y.; Lin, B. Assessing dynamic China’s energy security: Based on functional data analysis. Energy 2021, 217, 119324. [Google Scholar] [CrossRef]
  30. Zhang, L.P.; Zhou, P. Reassessing energy security risk incorporating external shock: A variance-based composite indicator approach. Appl. Energy 2024, 358, 122665. [Google Scholar] [CrossRef]
  31. Ziemba, P.; Zair, A. Temporal Analysis of Energy Transformation in EU Countries. Energies 2023, 16, 7703. [Google Scholar] [CrossRef]
  32. Ziemba, P. Energy security assessment based on a new dynamic multi-criteria decision-making framework. Energies 2022, 15, 9356. [Google Scholar] [CrossRef]
  33. Tutak, M.; Brodny, J.; Grebski, W.W. Dynamic and Balanced Monitoring of the Path to Carbon Neutrality Among European Union Countries: The DETA Framework for Energy Transition Assessment. Energies 2026, 19, 358. [Google Scholar] [CrossRef]
  34. Brodny, J.; Tutak, M.; Grebski, W.W. Empirical Evaluation of the Energy Transition Efficiency in the EU-27 Countries over a Decade—A Non-Obvious Perspective. Energies 2025, 18, 3367. [Google Scholar] [CrossRef]
  35. Yergin, D. Ensuring Energy Security. Foreign Aff. 2006, 85, 69–82. [Google Scholar] [CrossRef]
  36. Gorzeń-Mitka, I.; Wieczorek-Kosmala, M. Mapping the Energy Sector from a Risk Management Research Perspective: A Bibliometric and Scientific Approach. Energies 2023, 16, 2024. [Google Scholar] [CrossRef]
  37. Cincinelli, P.; Pellini, E. The role of geopolitical and climate risk in driving uncertainty in European electricity markets. Energy Econ. 2025, 144, 108276. [Google Scholar] [CrossRef]
  38. Axon, C.J.; Darton, R.C. The causes of risk in fuel supply chains and their role in energy security. J. Clean. Prod. 2021, 324, 129254. [Google Scholar] [CrossRef]
  39. Axon, C.J.; Darton, R.C. Risk profiles of scenarios for the low-carbon transition. Energy 2023, 275, 127393. [Google Scholar] [CrossRef]
  40. Energy & Climate Security Risk Index. Available online: https://ces.csd.eu/ (accessed on 5 February 2026).
  41. Eurostat. Eurostat Database; European Commission: Luxembourg, 2025; Available online: https://ec.europa.eu/eurostat (accessed on 5 February 2026).
  42. European Commission. EU Energy Statistical Pocketbook and Country Datasheets. Available online: https://energy.ec.europa.eu/data-and-analysis/eu-energy-statistical-pocketbook-and-country-datasheets_en (accessed on 5 February 2026).
  43. Cherp, A.; Jewell, J. The concept of energy security: Beyond the four As. Energy Policy 2014, 75, 415–421. [Google Scholar] [CrossRef]
  44. Sovacool, B.K.; Burke, M.; Baker, L.; Kotikalapudi, C.K.; Wlokas, H. New frontiers and conceptual frameworks for energy justice. Energy Policy 2017, 105, 677–691. [Google Scholar] [CrossRef]
  45. Polyanska, A.; Sala, D.; Psyuk, V.; Pazynich, Y. A Multicriteria Approach to the Study of the Energy Transition Results for EU Countries. Energies 2025, 18, 5406. [Google Scholar] [CrossRef]
  46. Ziemba, P.; Zair, A.; Wolak, A. Progress in the Energy Transition Process in EU Countries—A Sustainable Multi-Criteria Assessment. Energies 2026, 19, 1045. [Google Scholar] [CrossRef]
  47. Luty, L.; Zioło, M.; Knapik, W.; Bąk, I.; Kukuła, K. Energy Security in Light of Sustainable Development Goals. Energies 2023, 16, 1390. [Google Scholar] [CrossRef]
  48. Kamali Saraji, M.; Streimikiene, D.; Ciegis, R. A novel Pythagorean fuzzy-SWARA-TOPSIS framework for evaluating the EU progress towards sustainable energy development. Environ. Monit. Assess. 2022, 194, 42. [Google Scholar] [CrossRef] [PubMed]
  49. Siksnelyte-Butkiene, I.; Karpavicius, T.; Streimikiene, D.; Balezentis, T. The achievements of climate change and energy policy in the European Union. Energies 2022, 15, 5128. [Google Scholar] [CrossRef]
  50. Almonte, G.J.C.; Soriano, P.I.R.; Promentilla, M.A.B. Energy security, equity, and sustainability: A multi-criteria decision analysis framework for nuclear power evaluation in emerging economies. Energy 2026, 353, 140971. [Google Scholar] [CrossRef]
  51. Martchamadol, J.; Kumar, S. An aggregated energy security performance indicator. Appl. Energy 2013, 103, 653–670. [Google Scholar] [CrossRef]
  52. Löschel, A.; Moslener, U.; Rübbelke, D.T.G. Indicators of energy security in industrialised countries. Energy Policy 2010, 38, 1665–1671. [Google Scholar] [CrossRef]
  53. Glynn, J.; Chiodi, A.; Gallachóir, B.Ó. Energy security assessment methods: Quantifying the security co-benefits of decarbonising the Irish Energy System. Energy Strategy Rev. 2017, 15, 72–88. [Google Scholar] [CrossRef]
  54. Sotnyk, I.; Kurbatova, T.; Kubatko, O.; Prokopenko, O.; Prause, G.; Kovalenko, Y.; Trypolska, G.; Pysmenna, U. Energy Security Assessment of Emerging Economies under Global and Local Challenges. Energies 2021, 14, 5860. [Google Scholar] [CrossRef]
  55. Brodny, J.; Tutak, M. Decade of Progress: A Multidimensional Measurement and Assessment of Energy Sustainability in EU-27 Nations. Appl. Energy 2025, 382, 125222. [Google Scholar] [CrossRef]
  56. Zhu, Y.; Tian, D.; Yan, F. Effectiveness of entropy weight method in decision-making. Math. Probl. Eng. 2020, 2020, 3564835. [Google Scholar] [CrossRef]
  57. Song, M.; Zhu, Q.; Peng, J.; Santibanez Gonzalez, E. Improving the evaluation of cross efficiencies: A method based on Shannon entropy weight. Comput. Ind. Eng. 2017, 112, 99–106. [Google Scholar] [CrossRef]
  58. Diakoulaki, D.; Mavrotas, G.; Papayannakis, L. Determining objective weights in multiple criteria problems: The CRITIC method. Comput. Oper. Res. 1995, 22, 763–770. [Google Scholar] [CrossRef]
  59. Saaty, T.L. How to make a decision: The analytic hierarchy process. Eur. J. Oper. Res. 1990, 48, 9–26. [Google Scholar] [CrossRef]
  60. Moslem, S.; Saraji, M.K.; Mardani, A.; Alkharabsheh, A.; Duleba, S.; Esztergár-Kiss, D. A systematic review of Analytic Hierarchy Process applications to solve transportation problems: From 2003 to 2022. IEEE Access 2023, 11, 11973–11990. [Google Scholar] [CrossRef]
  61. European Commission. The European Green Deal; Publications Office of the European Union: Luxembourg, 2019; Available online: https://eur-lex.europa.eu/legal-content/EN/TXT/?uri=CELEX:52019DC0640 (accessed on 5 February 2026).
  62. European Commission. Fit for 55 Package: Delivering the EU’s 2030 Climate Target on the Way to Climate Neutrality; Publications Office of the European Union: Luxembourg, 2021; Available online: https://op.europa.eu/en/publication-detail/-/publication/649643b0-9008-11ec-b4e4-01aa75ed71a1/language-en (accessed on 5 February 2026).
  63. European Commission. Clean Energy for All Europeans: Unlocking Europe’s Growth Potential; Publications Office of the European Union: Luxembourg, 2016. [Google Scholar]
  64. European Commission. A Framework Strategy for a Resilient Energy Union with a Forward-Looking Climate Change Policy; COM(2015) 80 Final; European Commission: Brussels, Belgium, 2015. [Google Scholar]
  65. European Commission. REPowerEU Plan; COM(2022) 230 Final; European Commission: Brussels, Belgium, 2022. [Google Scholar]
  66. European Parliament; Council of the European Union. Regulation (EU) 2018/1999 on the Governance of the Energy Union and Climate Action. Off. J. Eur. Union 2018, L 328, 1–77. [Google Scholar]
  67. Jaroń, A.; Borucka, A. Analysis of Energy System Transformations in the European Union. Energies 2024, 17, 6181. [Google Scholar] [CrossRef]
  68. Kryk, B.; Guzowska, M.K. Implementation of climate/energy targets of the Europe 2020 Strategy by the EU Member States. Energies 2021, 14, 2711. [Google Scholar] [CrossRef]
  69. Panait, M.; Iacob, Ș.; Voica, C.; Iacovoiu, V.; Iov, D.; Mincă, C.; Teodorescu, C. Navigating through the storm—The challenges of the energy transition in the European Union. Energies 2024, 17, 2874. [Google Scholar] [CrossRef]
  70. McCauley, D.; Pettigrew, K.A.; Todd, I.; Milchram, C. Leaders and laggards in the pursuit of an EU just transition. Ecol. Econ. 2023, 205, 107699. [Google Scholar] [CrossRef]
  71. Markard, J. The next phase of the energy transition and its implications for research and policy. Nat. Energy 2018, 3, 628–633. [Google Scholar] [CrossRef]
  72. Grubler, A.; Wilson, C.; Nemet, G. Apples, oranges, and consistent comparisons of the temporal dynamics of energy transitions. Energy Res. Soc. Sci. 2016, 22, 18–25. [Google Scholar] [CrossRef]
  73. Goldthau, A.C.; Richert, J.; Stetter, S. Leviathan awakens: Gas finds, energy governance, and the emergence of the Eastern Mediterranean as a geopolitical region. Rev. Policy Res. 2024, 41, 310–328. [Google Scholar] [CrossRef]
  74. Sovacool, B.K.; Mukherjee, I. Conceptualizing and measuring energy security: A synthesized approach. Energy 2011, 36, 5343–5355. [Google Scholar] [CrossRef]
  75. Ainou, F.Z.; Ali, M.; Sadiq, M. Green energy security assessment in Morocco: Green finance as a step toward sustainable energy transition. Environ. Sci. Pollut. Res. 2023, 30, 61411–61429. [Google Scholar] [CrossRef]
  76. Ang, B.W.; Choong, W.L.; Ng, T.S. Energy security: Definitions, dimensions and indexes. Renew. Sustain. Energy Rev. 2015, 42, 1077–1093. [Google Scholar] [CrossRef]
  77. Lund, P.D.; Lindgren, J.; Mikkola, J.; Salpakari, J. Review of energy system flexibility measures to enable high levels of variable renewable electricity. Renew. Sustain. Energy Rev. 2015, 45, 785–807. [Google Scholar] [CrossRef]
  78. Saleh, A.M.; István, V.; Khan, M.A.; Waseem, M.; Ahmed, A.N.A. Power system stability in the era of energy transition: Importance, opportunities, challenges, and future directions. Energy Convers. Manag. X 2024, 24, 100820. [Google Scholar] [CrossRef]
  79. Monie, S.W.; Gustafsson, M.; Önnered, S.; Guruvita, K. Renewable and integrated energy system resilience—A review and generic resilience index. Renew. Sustain. Energy Rev. 2025, 215, 115554. [Google Scholar] [CrossRef]
  80. Aghion, P.; Dechezleprêtre, A.; Hémous, D.; Martin, R.; Van Reenen, J. Carbon taxes, path dependency, and directed technical change: Evidence from the auto industry. J. Political Econ. 2016, 124, 1–51. [Google Scholar] [CrossRef]
  81. Fouquet, R. Path dependence in energy systems and economic development. Nat. Energy 2016, 1, 16098. [Google Scholar] [CrossRef]
  82. Rogelj, J.; Popp, A.; Calvin, K.V.; Luderer, G.; Emmerling, J.; Gernaat, D.; Fujimori, S.; Strefler, J.; Hasegawa, T.; Marangoni, G.; et al. Scenarios towards limiting global mean temperature increase below 1.5 °C. Nat. Clim. Change 2018, 8, 325–332. [Google Scholar] [CrossRef]
  83. Grubb, M.; Hourcade, J.-C.; Neuhoff, K. Planetary Economics: Energy, Climate Change and the Three Domains of Sustainable Development; Routledge: London, UK, 2014. [Google Scholar]
  84. Doukas, H.; Trachanas, G.P. Social acceptance, sources of inequality, and autonomy issues toward sustainable energy transition. Energy Sources Part B Econ. Plan. Policy 2022, 17, 2121383. [Google Scholar] [CrossRef]
  85. Śmiech, S.; Karpinska, L.; Bouzarovski, S. Impact of energy transitions on energy poverty in the European Union. Renew. Sustain. Energy Rev. 2025, 211, 115311. [Google Scholar] [CrossRef]
  86. Guivarch, C.; Monjon, S. Identifying the main uncertainty drivers of energy security in a low-carbon world: The case of Europe. Energy Econ. 2017, 64, 530–541. [Google Scholar] [CrossRef]
  87. LaBelle, M.C. Breaking the era of energy interdependence in Europe: A multidimensional reframing of energy security, sovereignty, and solidarity. Energy Strategy Rev. 2024, 52, 101314. [Google Scholar] [CrossRef]
  88. Handoyo, S. Sustainability in the energy sector: A systematic literature review of energy transitions, technologies, and policy instruments. Energy Rep. 2026, 15, 108937. [Google Scholar] [CrossRef]
  89. Schmitz, R.; Flachsbarth, F.; Plaga, L.S.; Braun, M.; Härtel, P. Energy security and resilience: Revisiting concepts and advancing planning perspectives for transforming integrated energy systems. Energy Policy 2025, 207, 114796. [Google Scholar] [CrossRef]
Figure 1. DESRI index values in EU-27 countries ((a) index values for 2015–2023; (b) difference in DESRI values between 2015 and 2023).
Sustainability 18 06749 g001
Figure 2. Values of the partial DESRI index for the pillar Structural and transformational aspects of the energy mix.
Sustainability 18 06749 g002
Figure 3. Values of the partial DESRI index for the pillar Climate and emissions aspects.
Sustainability 18 06749 g003
Figure 4. Values of the partial DESRI index for the pillar Efficiency and demand-related aspects.
Sustainability 18 06749 g004
Figure 5. Values of the partial DESRI index for the pillar Economic and social aspects.
Sustainability 18 06749 g005
Figure 6. Values of the partial DESRI index for the pillar External dependency and system resilience.
Sustainability 18 06749 g006
Figure 7. Breakdown of the contributions of partial pillar indices to the value of the global DESRI index ((a) 2015, (b) 2023).
Sustainability 18 06749 g007
Table 1. Summary of the DESRI pillar structure, indicator groups, and examples.
DESRI PillarConceptual FocusNumber of
Indicators
Examples of Indicators
Structural and transformational characteristics of the energy mixChanges in the structure of the energy mix and the system’s capacity to integrate new technologies4RES share, share of emission-intensive energy sources, HHI index, share of wind and solar PV capacity
Climate and emissions pressureEnvironmental and emissions-related pressure generated by the energy system3GHG emissions per capita, GHG intensity of energy, premature mortality related to PM2.5 exposure
Efficiency and demand-side performanceEnergy demand, energy efficiency and losses in the energy system5Energy intensity, energy productivity, household final energy consumption per capita, primary energy consumption per capita, transformation and distribution losses
Economic and social affordabilitySocial acceptability of transition costs and household vulnerability3Energy poverty, household electricity prices, disposable household income per capita
External dependency and energy system resilienceExposure to external energy-related shocks and domestic capacity to ensure supply continuity2Energy import dependency, energy self-sufficiency ratio
Table 2. Characteristics of the indicators.
IndicatorUnitDESRI PillarDirection (sj)Relevance in the Context of Research and EU Policy
Share of renewable energy sources in total final energy consumption%Structural and transformational risk of the energy mix−1Indicator of the share of renewable energy sources in final energy consumption. An increase in the RES share reduces emissions risk and dependence on fossil fuels; however, high growth dynamics may generate system integration risks.
Proportion of high-emission energy carriers in the overall energy mix%Structural and transformational risk of the energy mix+1Reflects the degree of dependence of the energy system on fossil fuels. A high share of emission-intensive sources increases transformational risk and regulatory pressure resulting from EU climate policy.
Degree of energy source diversification (HHI index)Structural and transformational risk of the energy mix+1Concentration index of the energy mix. High values indicate low diversification of energy sources and increased system vulnerability to technological or market disruptions.
Share of installed wind and solar photovoltaic capacity in total installed electricity capacity%Structural and transformational risk of the energy mix−1Cumulative installed capacity of RES (wind and photovoltaics). Capacity growth supports decarbonization, but rapid expansion may generate instability risks in the power system.
Greenhouse gas emissions per capitat CO2 eq.Climate and emissions risk+1Total greenhouse gas emissions per capita. High values indicate increased climate pressure and a higher risk of failing to meet the Fit for 55 targets.
Emissions attributable to the energy sectorkg CO2 eq./toeClimate and emissions risk+1Emissions intensity of the economy. The indicator reflects the effectiveness of energy system decarbonization regardless of the scale of energy consumption.
Premature mortality associated with PM2.5 exposureliczba/100 tys.Climate and emissions risk+1Indicator of health impacts of air pollution. Captures the social and health costs of emission-intensive energy systems.
Energy intensity of the economyKGOE/1000 EUREfficiency and demand-related risk+1Energy intensity of the economy. High values indicate low energy efficiency and increased vulnerability to rising energy prices.
Energy efficiency of the economy (energy productivity)EUR/KGOEEfficiency and demand-related risk−1Energy productivity of the economy. An increase in this indicator reflects the ability to achieve economic growth with lower energy consumption.
Per capita final energy consumption in householdsKGOEEfficiency and demand-related risk+1Energy consumption in households. High and rapidly increasing values may indicate limited effectiveness of energy efficiency policies.
Per capita primary energy consumptionTOEEfficiency and demand-related risk+1Total demand for primary energy. High values increase systemic risk and pressure on energy infrastructure.
Energy losses in transformation and distribution processes%Efficiency and demand-related risk+1Energy losses in generation and transmission processes. High values indicate low efficiency of the energy system.
Share of the population unable to adequately heat their homes due to economic constraints%Economic and social risk+1Indicator of energy poverty. High values signal limited social acceptability of energy transition costs.
Electricity prices for household consumers, including all applicable taxesEUR/kWhEconomic and social risk+1Electricity prices for households. Rapid price increases may lead to social and political tensions.
Per capita disposable income of householdsEUREconomic and social risk−1Disposable household income. Higher values increase the capacity to absorb the costs of the energy transition.
Level of dependence on energy imports%External dependency and system resilience risk+1Degree of dependence on energy imports. A key indicator of security of supply and vulnerability to geopolitical shocks.
Energy self-sufficiency indicator%External dependency and system resilience risk−1Indicator of energy self-sufficiency. Higher values indicate greater system resilience to external disruptions.
Table 3. Values of partial indicator weights.
DESRI PillarIndicatorWeight Value
Structural and transformational risk of the energy mixShare of renewable energy sources in total final energy consumption0.309
Proportion of high-emission energy carriers in the overall energy mix0.168
Degree of energy source diversification (HHI index)0.224
Share of installed wind and solar photovoltaic capacity in total installed electricity capacity0.299
Climate and emissionsGreenhouse gas emissions per capita0.367
Emissions attributable to the energy sector0.240
Premature mortality associated with PM2.5 exposure0.392
Efficiency and demand-related Energy intensity of the economy0.110
Energy efficiency of the economy (energy productivity)0.279
Per capita final energy consumption in households0.195
Per capita primary energy consumption0.173
Energy losses in transformation and distribution processes0.243
Economic and social Share of the population unable to adequately heat their homes due to economic constraints0.463
Electricity prices for household consumers, including all applicable taxes0.321
Per capita disposable income of households0.216
External dependency and system resilienceLevel of dependence on energy imports0.552
Energy self-sufficiency indicator0.448
Table 4. Pairwise comparison matrix of risk pillars.
Risk PillarExternal Dependency and Security of Supply RiskClimate and Emissions RiskEfficiency and Demand-Related RiskStructural and Transformational RiskEconomic and Social Risk
External dependency and security of supply risk11335
Climate and emissions risk11335
Efficiency and demand-related risk1/31/3112
Structural and transformational risk1/31/3112
Economic and social risk1/51/51/21/21
Table 5. DESRI-based classes of transition-related instability in EU-27 countries in 2015–2023.
Risk Level201520162017201820192020202120222023
High dynamic riskNL, MT, EE, LU, DK, SE, FIEE, IE, MT, FI, LU, LV, NLEE, LV, HU, FI, IE, SE, MT, NLEE, LV, SE, MT, NL, LU, FIEE, DK, LU, SE, NL, FI, ELEE, LU, MT, DK, NL, FI, CYEE, LU, FI, NL, SE, MT, FRLU, FI, NL, FR, CY, BG, LVLU, MT, BG, NL, FI, CY, BE
Moderately high riskBE, IE, PT, EL, LVBE, DK, SE, EL, CY, FR, ROBE, CY, SK, CZ, SI, HR, PLIE, HR, EL, BG, CZ, PL, SKBE, BG, IE, LV, MT, HR, HUSE, IE, BE, BG, LV, HR, PLIE, DK, LT, PL, HR, SI, BEIE, EE, SE, DK, PT, SK, BEIE, LV, CZ, EL, LT, PT, EE
Moderately low riskFR, HR, CY, SI, AT, PL, LTBG, SI, LT, HR, ES, PL, ITFR, AT, BG, DE, EL, ES, LTAT, BE, RO, FR, DE, SI, HUCY, FR, AT, DE, LT, PL, SICY, CZ, ES, LT, IT, FR, DEHU, BG, RO, EL, ES, CY, ATRO, HR, PL, AT, DE, ES, ELDE, DK, PL, ES, HU, SE, AT
Low dynamic riskDE, CZ, HU, SK, ES, RO, IT, BGHU, CZ, SK, AT, DE, EL, ITRO, IT, ES, DK, PT, IE, FIES, PT, DK, IT, SK, CZ, FISK, RO, IT, ES, CZ, PTRO, SK, HU, AT, DE, SICZ, IT, DE, DE, PT, SKCZ, AT, HU, SI, IT, LTSK, RO, IT, FR, SI, HR
Notes: AT—Austria, BE—Belgium, BG—Bulgaria, HR—Croatia, CY—Cyprus, CZ—Czech Republic, DK—Denmark, EE—Estonia, FI—Finland, FR—France, DE—Germany, EL—Greece, HU—Hungary, IE—Ireland, IT—Italy, LV—Latvia, LT—Lithuania, LU—Luxembourg, MT—Malta, NL—The Netherlands, PL—Poland, PT—Portugal, RO—Romania, SK—Slovakia, SI—Slovenia, ES—Spain, SE—Sweden.
Disclaimer/Publisher’s Note: The statements, opinions and data contained in all publications are solely those of the individual author(s) and contributor(s) and not of MDPI and/or the editor(s). MDPI and/or the editor(s) disclaim responsibility for any injury to people or property resulting from any ideas, methods, instructions or products referred to in the content.