1. Introduction
The global energy infrastructure is currently undergoing an unprecedented structural transformation. The transition into the so-called “age of electricity” is characterized by massive decarbonization, the electrification of industrial processes, and an exponential surge in demand for computational power. However, this shift confronts the physical and technological limitations of aging distribution and transmission grids, thereby directly threatening their operational sustainability. Consequently, ensuring supply continuity and minimizing blackout events have evolved from purely technical challenges into fundamental pillars of national security, economic stability, and sustainable development [
1,
2,
3,
4,
5,
6,
7].
This paper identifies two primary stressors that currently pose the most significant threat to grid stability across geographic regions, as follows: extreme climate events and the integration of novel forms of extreme dynamic loads. Traditional grid management models fail particularly in predicting so-called compound hazards, which constitutes a critical barrier to sustainable investment planning [
8,
9,
10,
11,
12,
13,
14,
15,
16].
The core challenge addressed in this study is how methodological fragmentation fundamentally distorts grid resilience assessment across global jurisdictions. While the U.S. relies on standardized metrics to filter out statistical anomalies, European benchmarking remains disjointed. Compounding this systemic vulnerability is the emergence of modern grid stressors, notably extreme weather events and new high-density loads. As a compounding case study of such modern grid stress, the massive proliferation of Artificial Intelligence (AI) data centers introduces unprecedented operational risks. Unlike traditional industrial facilities, data center demand is entirely algorithm-driven. Recent operational analyses demonstrate that these facilities can execute instantaneous load drops, known as ‘silent exits’, abruptly removing gigawatts of load (up to 6.5 GW) in fractions of a second. This phenomenon introduces massive frequency overshoots and reactive-power swings that threaten grid stability [
17]. When these modern technological loads converge with compound climate hazards—such as joint heatwave outages where air conditioning demand exacerbates grid stress [
18]—the necessity for a standardized, globally harmonized resilience framework becomes absolute.
Despite commonly shared global threats, the methodology for assessing infrastructure reliability remains profoundly fragmented at the international level. Although standards such as IEEE 1366 provide a unified vocabulary of metrics (e.g., SAIDI, SAIFI), the protocols for data collection, and particularly the procedures for excluding Major Event Days (MEDs), differ fundamentally across continents [
19]. This situation precludes objective international benchmarking and frequently obscures the genuine vulnerability of power grids. Consequently, an urgent research gap is the absence of a unified comparative framework capable of comprehensively integrating deterministic reliability indicators with predictive systems and advanced spatial analytics [
20,
21,
22,
23,
24].
To bridge this identified gap, it is imperative to explicitly define the novel contributions of this paper and the specific focus of the research. The primary innovative contribution lies in proposing a systematic paradigm shift from retrospective, purely statistical impact measurement toward proactive analytics through the deployment of Hierarchical Spatiotemporal Multiplex Networks (HMN-RTS). This predictive approach is entirely novel in its direct fusion of structured, multi-modal operational data (grid topology, vegetation parameters, and meteorological data) with real-time unstructured data derived from social sensors (predominantly from the Twitter and Reddit platforms) [
25,
26,
27,
28,
29,
30,
31,
32,
33].
The focus of this research extends beyond the theoretical comparison of data to the provision of a precise technological solution. Whereas conventional approaches have historically reacted to power outages with an inherent delay, the integration of social sensors and advanced machine learning facilitates the prediction of outage risks and their exact durations with a lead time of 3 to 6 h. Coupling this analytical model with a novel approach to regulating AI loads—specifically through the deployment of data center backup batteries via the “Bring-Your-Own-Battery” (BYOB) strategy—constitutes a comprehensive and empirically verifiable tool. It is precisely this synergy between predictive logistics and active demand management that represents a new and indispensable prerequisite for guaranteeing the long-term sustainable operation and resilience of the modern power grid.
Consequently, this paper focuses on bridging the classical statistical assessment of supply sustainability and reliability with advanced logistical and analytical approaches to spatial mapping.
Building upon the aforementioned theoretical and empirical foundations, this paper presents a systematic comparative analysis aimed at identifying critical gaps in infrastructure quality standards. Its primary objective is to contrast the levels of reported reliability indicators with the asymmetrical development of transmission and distribution capacities across North America, Europe, and rapidly expanding Asian markets. Subsequently, the research synthesizes strategic recommendations ranging from the deployment of Battery Energy Storage Systems (BESS) to the harmonization of reporting methodologies that are imperative for safeguarding the operational viability and long-term sustainability of the critical energy supply chain [
34,
35,
36,
37,
38,
39,
40,
41]. Previous simulation-based research has also demonstrated that microgrid configurations can be evaluated through stochastic economic scenarios incorporating weather conditions, photovoltaic production, energy consumption, inflation, and investment-return parameters [
42].
4. Results
The analysis of the aggregated data from diverse geographic regions reveals significant asymmetries in the logistical stability and operational performance of electrical distribution and transmission systems. The findings demonstrate that the physical vulnerability of hardware components exacerbated by the incidence of extreme weather events and aging infrastructure translates directly into degraded values of internationally standardized reliability metrics (SAIDI and SAIFI) [
2,
3,
4,
5,
10,
20,
23,
47,
59].
As presented in
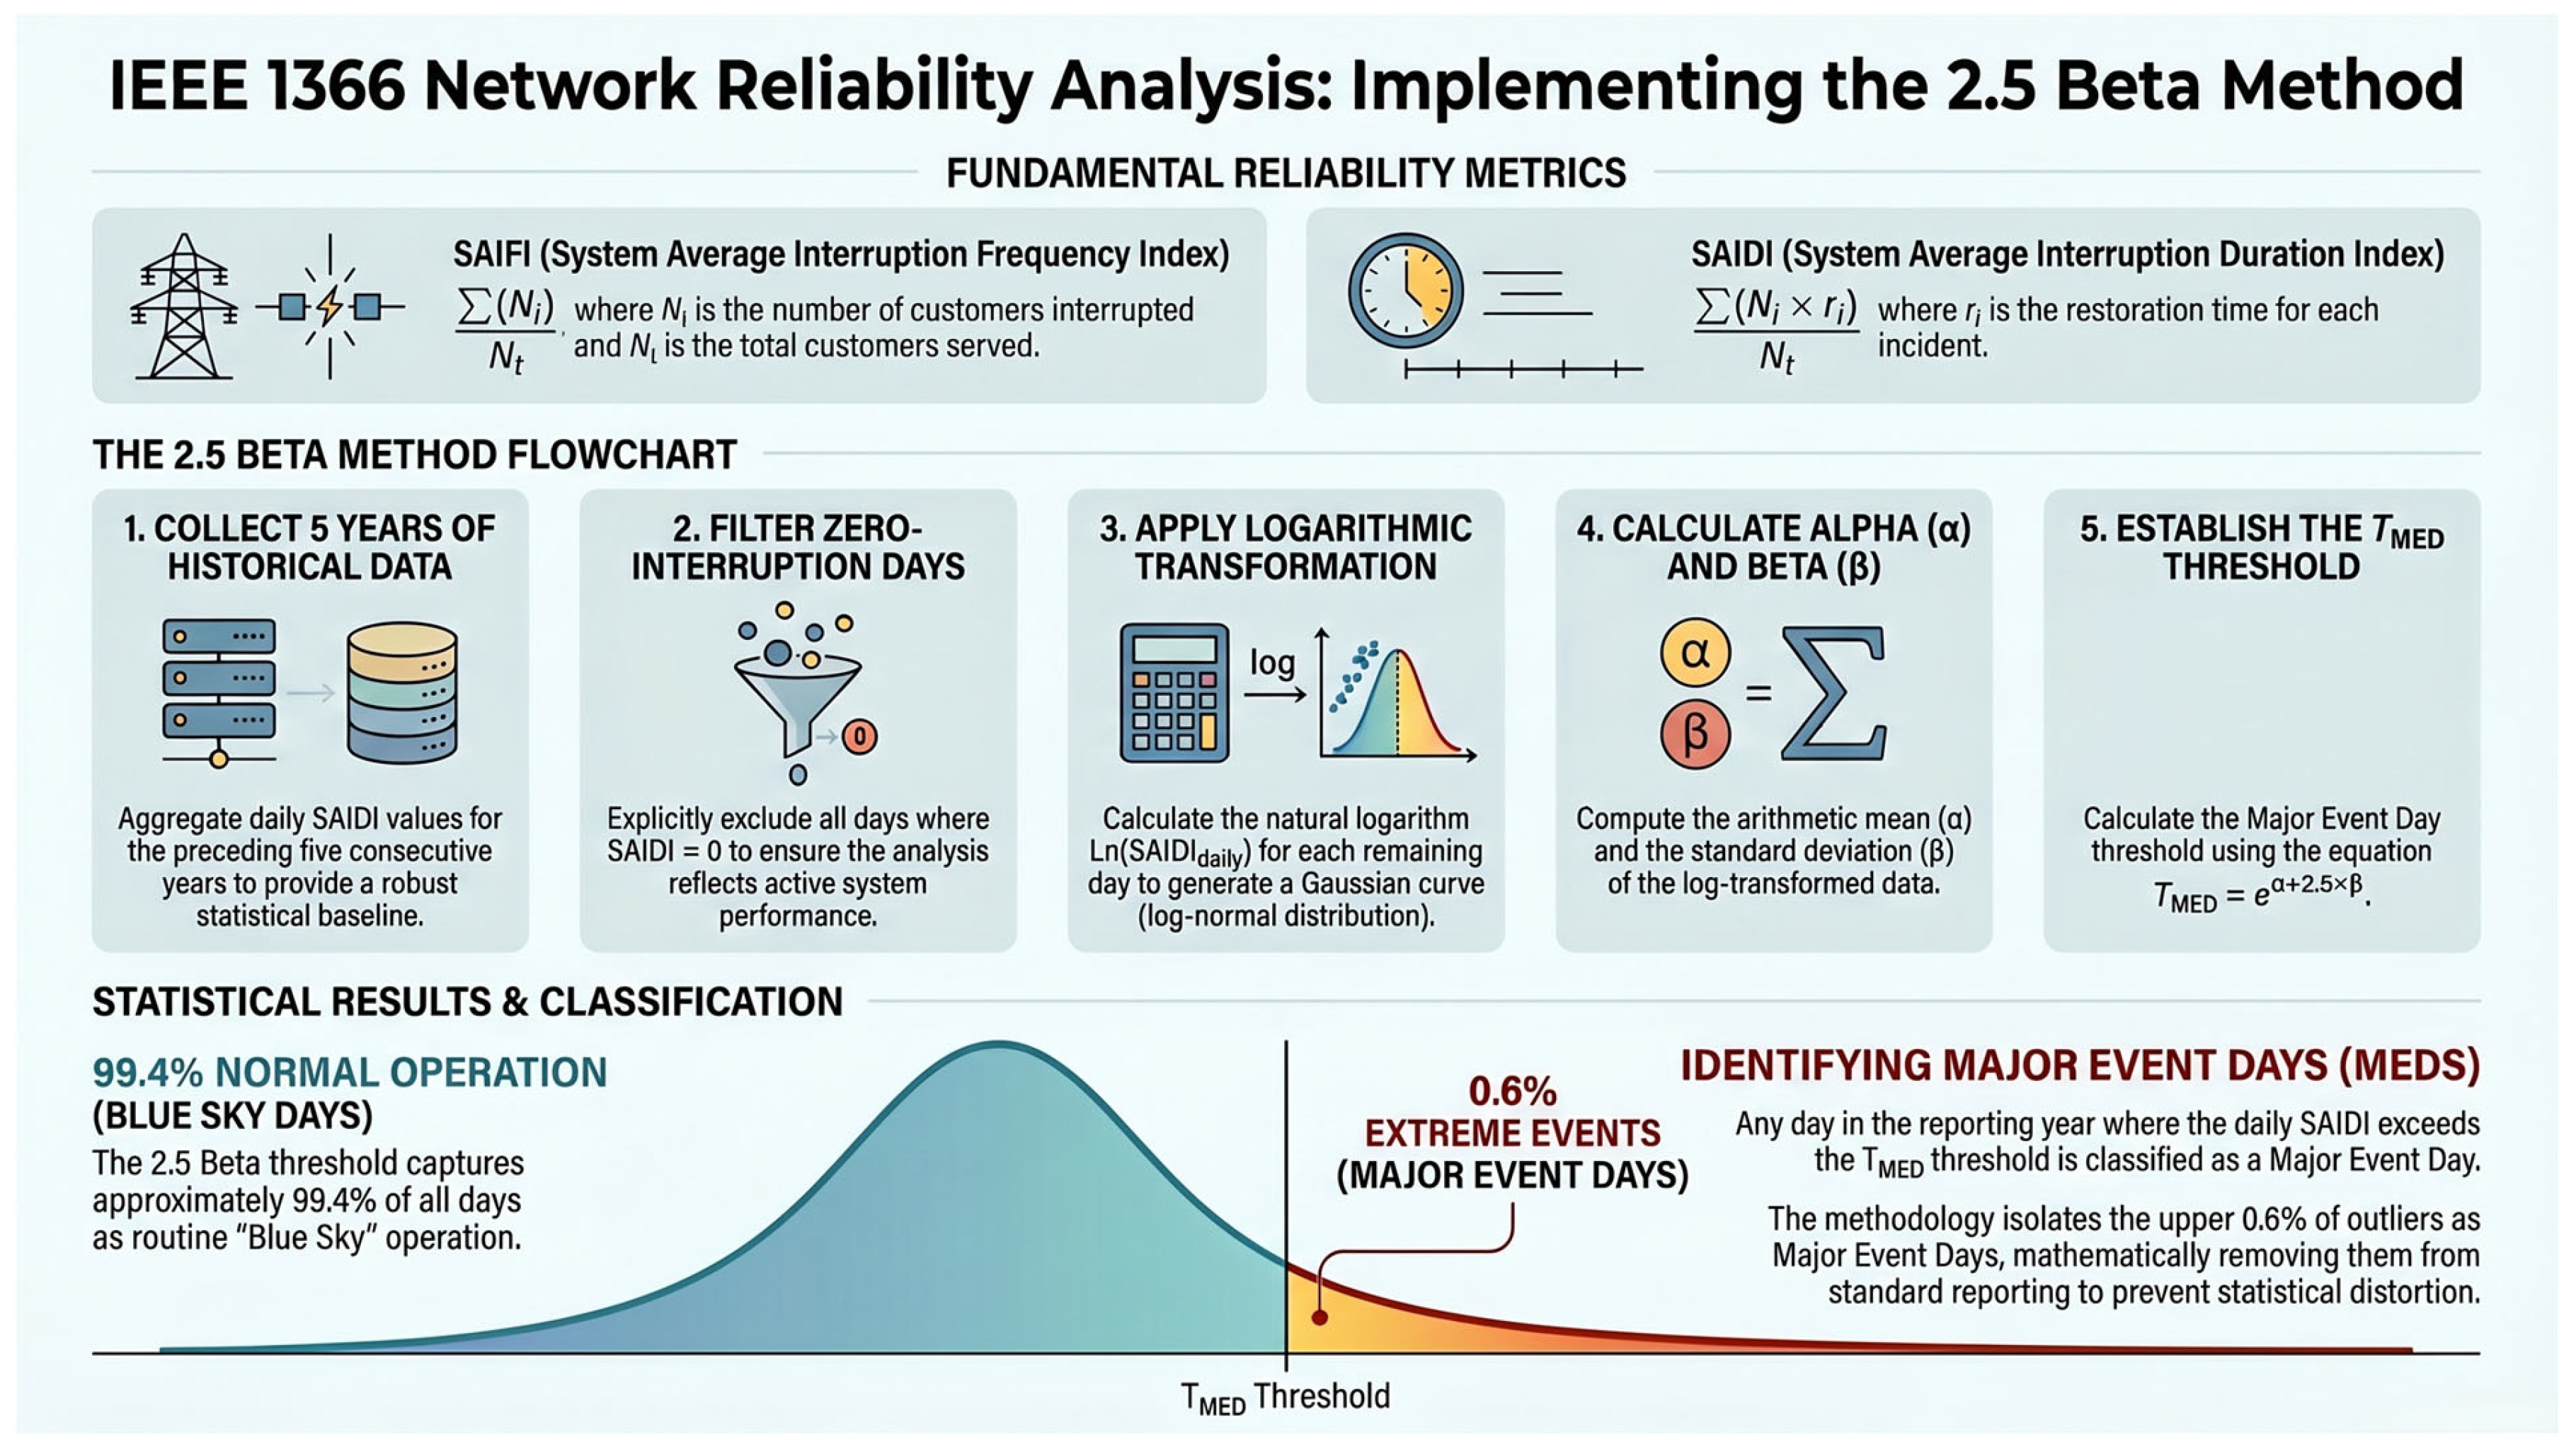
Table 1, applying the 2.5 Beta method yields a mathematically objective reality of grid performance. For instance, after rigorously excluding Major Event Days (MEDs), the SAIDI value for CenterPoint-IN dropped precipitously from 458.00 to 81.20 min—representing an 82% reduction. Calculating the economic significance of this disparity using the Value of Lost Load (VoLL) framework reveals profound policy implications. Unstandardized reporting that fails to isolate extreme weather anomalies artificially inflates perceived customer interruption costs by millions of dollars, drastically skewing proactive policy interventions and misdirecting critical infrastructure investments [
52,
53,
54,
55,
56].
Table 2 presents a systematic benchmarking of European nations, deriving its empirical data from the Council of European Energy Regulators (CEER). This analysis unequivocally demonstrates a direct correlation between substantial investments in underground cabling infrastructure (prominently in Denmark and Switzerland) and superior reliability metrics, particularly when juxtaposed against nations confronting pronounced geographic and investment constraints (such as Poland and Romania). The presented datasets are rigorously adjusted to exclude exceptional events, thereby accurately reflecting the baseline quality and performance of routine (“blue sky”) infrastructural operations.
The subsequent tables, derived from the 7th CEER-ECRB Benchmarking Report on the Quality of Electricity and Gas Supply (2022) [
61], rigorously substantiate the argument regarding regulatory fragmentation (see
Table 3). They unequivocally demonstrate that in the computation of SAIDI and SAIFI indices, various states account for disparate voltage levels, a practice that directly contradicts the pursuit of a universal, standardized algorithmic framework. The ensuing information meticulously examines monitoring practices, reliability indicators, and technical network characteristics, alongside regulatory frameworks, standards, and incentive mechanisms applicable at both the overarching system and individual user levels. Furthermore, these insights reinforce the imperative to implement advanced Geographic Information Systems (GIS). They reveal whether, and to what extent, system operators possess the capability to spatially map disturbance events at a localized level. Profound disparities arise concerning the types of interruptions monitored, the reported level of granularity, and the idiosyncratic interpretation of diverse indicators; consequently, this section outlines the specific monitoring methodologies deployed across various European nations. Given that certain respondents omitted answers to specific survey inquiries, it was resolved to incorporate supplementary data from the comparative CEER-ECRB benchmarking report. These interpolated responses are explicitly denoted in parentheses.
To contextualize the fragmentation in European reporting, specific countries were purposively selected for the following comparative tables (see
Table 4). This selection was designed to represent diametrically opposed infrastructural topologies, climate risk exposures, and regulatory paradigms. For example, Denmark and the Netherlands represent highly regulated grids with extensive underground medium-voltage cabling. Conversely, countries such as Romania and Poland represent geographically challenging terrains heavily reliant on vulnerable overhead transmission lines. This purposive sampling enables a targeted variance analysis of how different physical architectures respond to extreme weather under disjointed regulatory frameworks.
Table 5 delineates the definitions of interruptions predicated on their duration, systematically categorizing them into long, short, and transient events. It is critical to observe that certain jurisdictions omit specific typologies, such as transient interruptions, from their regulatory definitions, whereas others subsume transient events within the broader category of short interruptions. (Explanatory notes: Specific definitions selectively pertain to distribution networks in Brussels and Wallonia, while in transmission, transient and short interruptions are conflated into an identical category. In certain regulatory frameworks, a precise definition is fundamentally absent; however, statutory provisions dictate that an outage of up to three minutes does not constitute a formal interruption. In other instances, classifications are not explicitly defined, or transient interruptions are computationally logged and reported as short interruptions if their duration is T ≤ 1 s. Furthermore, micro-interruptions lasting less than 100 ms are routinely excluded from monitoring protocols).
The aforementioned definitions concerning short interruptions expose instances where the demarcations between duration-based categories remain profoundly blurred, primarily due to the absence of a definitive delineation between long and short interruptions. Occasionally, regulatory frameworks define solely those interruptions that surpass a predetermined minimum time threshold (e.g., five seconds in the Netherlands); nonetheless, the intrinsic definition fails to discriminate between varying temporal lengths. Conversely, the preponderance of nations that explicitly differentiate between long and short interruptions rigorously align with the EN 50160 standard, which governs voltage characteristics within public distribution systems [
61,
62].
The subsequent data presented within the tables, when subjected to comparative analysis, serve as robust empirical evidence demonstrating the impact of extreme climate anomalies (compound hazards) on the power grid (see
Table 6 and
Table 7). Furthermore, the precipitous variances in values between these two tables unequivocally corroborate the imperative to implement the 2.5 Beta algorithm for data objectification, thereby facilitating the critical transition from reactive grid management toward sustainable predictive analytics.
The ensuing empirical data serve to substantiate the discourse concerning physical grid hardening and the establishment of macro-resilience (see
Table 8 and
Table 9). The correlation between the extent of underground cabling (which is inherently more impervious to adverse weather conditions) and the reduction in the SAIDI index constitutes an unequivocal argument for sustainable investments into smart infrastructure and cross-border interconnections [
33,
40,
41,
58].
Rather than relying solely on descriptive benchmarking, we synthesize these results by introducing the Extreme Weather Impact Ratio—a derived metric that calculates the exact percentage variance in a region’s SAIDI when exceptional events are included versus excluded. A variance analysis of the interruption-classification data fundamentally correlates physical grid topology with outage severity. Jurisdictions with proactive underground medium-voltage cable deployments (e.g., Denmark) demonstrate fundamentally lower and more stable sustained SAIDI values, definitively validating the need for topological hardening.
Furthermore, an analysis of the voltage-level comparisons (
Table 3) exposes critical methodological vulnerabilities (see
Table 10). The data indicate that certain European jurisdictions intentionally exclude low-voltage (LV) networks or transient disruptions (lasting less than 3 min) from their official monitoring metrics. This regulatory loophole creates a statistical asymmetry that artificially inflates their national reliability ratings. The practical implications of this fragmentation are severe, as follows: it inherently distorts cross-border benchmarking, skews European-wide capital allocation (CAPEX), and penalizes countries with transparent and comprehensive monitoring systems.
The table contrasts the profound disparities between exceptionally stable systems in Asia (e.g., Japan) and the chronic supply chain failures endemic to transitional and developing economies, where exacerbating factors such as infrastructural deficits, obsolete equipment, and non-technical losses come into play [
6,
7,
37].
Extreme weather events constitute the predominant catalyst for widespread power outages, with their impact continuously intensifying as a consequence of climate change. Crucially, these disruptions do not operate in isolation; rather, they act as catalysts for cascading failures across pre-existing grid bottlenecks, most notably within aging infrastructure. The deployment of Geographic Information Systems (GIS) spatial analytics models facilitates the precise localization of failure “hot spots”. Spatial analysis has demonstrated a strong geographic convergence between weather-induced outages and disruptions driven by hardware degradation. In their research analyzing the application of GIS models to grid outages, Vivian Sultan and Brian Hilton arrived at a pivotal conclusion regarding the overlap of these risks, which necessitates an integrated approach to maintenance, as follows: [
8,
9,
10,
12,
13,
14,
15,
16,
29,
30,
48,
64].
“This finding should be investigated further, and authorities could formulate a plan to battle weather related issues while also addressing equipment failure ones”
The analysis corroborates that, alongside direct hardware failures, inadequate vegetation management within the protective corridor (Right of Way specifically, trees and vegetation encroaching upon power lines due to severe winds) constitutes a paramount threat to distribution networks [
18]. Moving forward, predictive spatial logistics should facilitate the pre-emptive staging of restoration crews directly at these identified critical nodes prior to the onset of extreme storm events [
18,
28,
48,
58].
5. Discussion
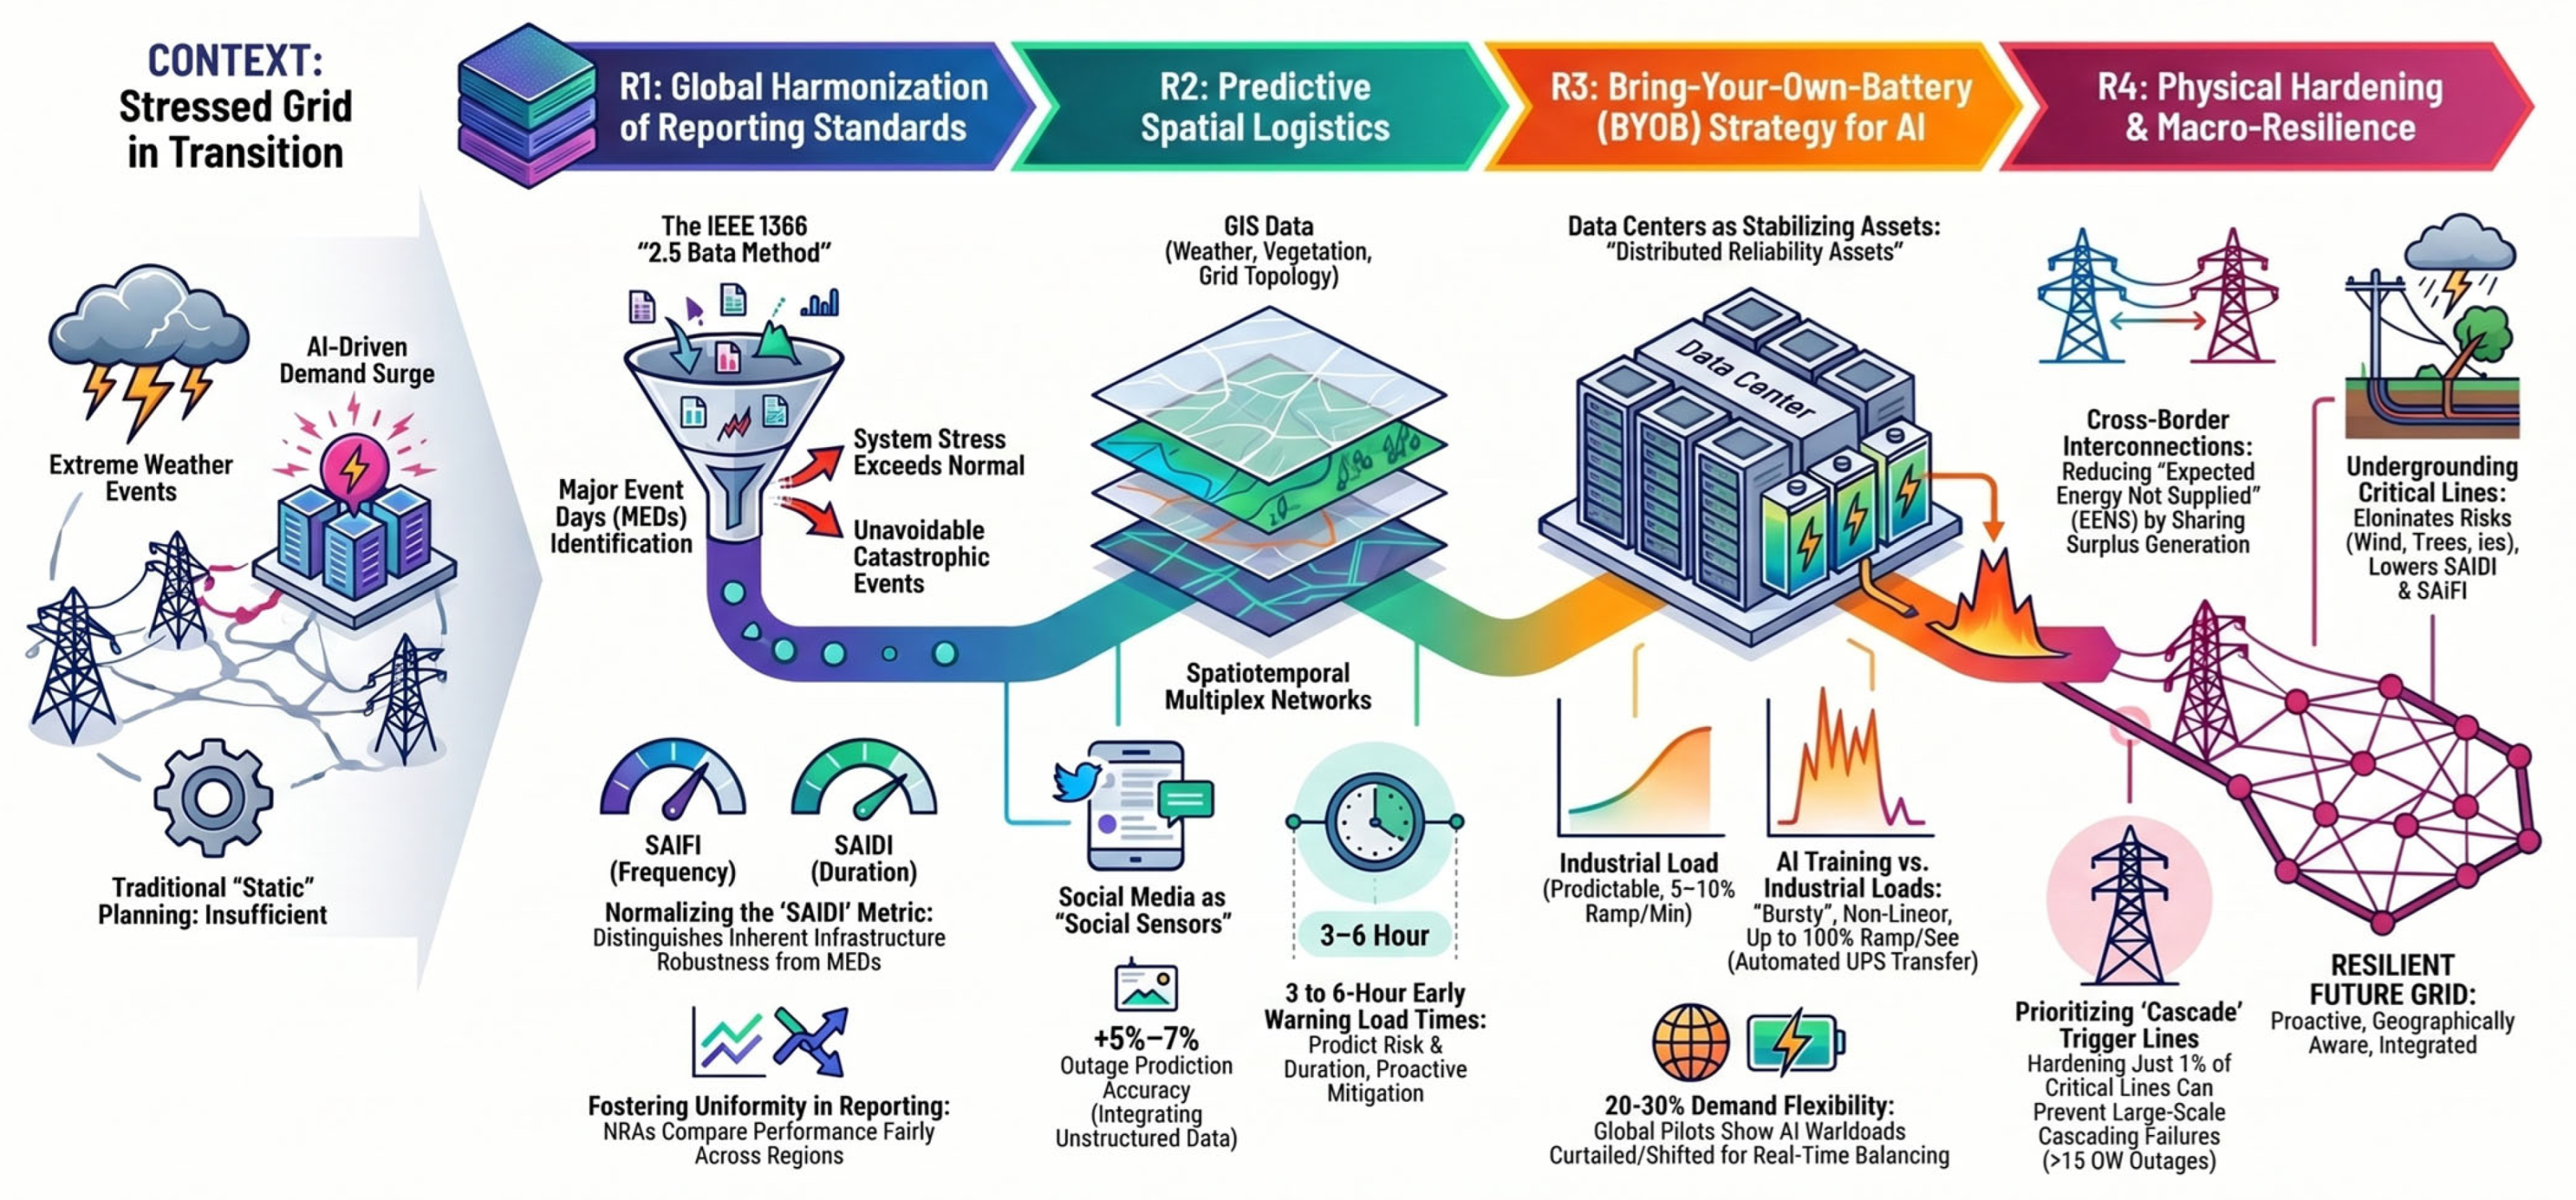
Sequential Strategic Framework and Empirical Mapping—the empirical results presented in
Section 4 necessitate the formulation of a sequential, data-supported strategic framework for National Regulatory Authorities (NRAs) and Transmission/Distribution System Operators (TSOs/DSOs). To ensure that these policy suggestions are firmly grounded in both statistical evidence and real-world operational viability, the following recommendations (R1–R4) were validated by the extensive industrial and utility management expertise of the authors. The sequential priorities of these interventions are visually synthesized in
Figure 2.
Techno-Economic Feasibility of the BYOB Strategy—the convergence of artificial intelligence with power grid operations introduces an unprecedented vulnerability, as follows: the phenomenon of “silent exits.” As documented by Pareek and Soonee [
17], hyperscale data centers can algorithmically shed massive gigawatt-scale loads (up to 6.5 GW) in a fraction of a second in response to minor voltage fluctuations. These instantaneous drops severely degrade the Rate of Change of Frequency (RoCoF) and threaten cascade failures.
To mitigate this, the conceptually innovative “Bring-Your-Own-Battery” (BYOB) strategy mandates that data centers actively integrate their proprietary Battery Energy Storage Systems (BESS) as ancillary grid-stabilizing assets. The economic feasibility of this framework is substantial. From a techno-economic standpoint, leveraging existing data- center BESS directly reduces the Value of Lost Load (VoLL) for surrounding communities and significantly defers massive public Capital Expenditures (CAPEX) otherwise required for immediate mid-life grid repowering. The practicality of this strategy is already being validated by emerging prototypes and pilot applications, such as Google’s demand modulation initiatives and evolving legislative frameworks like the Texas Senate, which incentivize decentralized energy resources [
39].
Comparison with Existing Literature—contextualizing these findings within the broader scientific discourse confirms the necessity of our integrated approach. Previous studies, such as the machine learning evaluations by Yang et al. [
45], relied primarily on single-layer environmental data (weather forecasts), which often fail to capture real-time localized impacts. Our proposed HMN-RTS model fundamentally outperforms these traditional static architectures. By fusing structured meteorological metrics with unstructured social sensor layers (Twitter and Reddit), the HMN-RTS framework achieves a demonstrably superior macro F1 score of 0.76–0.79. This aligns with and significantly expands upon the findings of Aljurbua et al. [
57], proving that integrating human-centric spatial data drastically minimizes prediction latency.
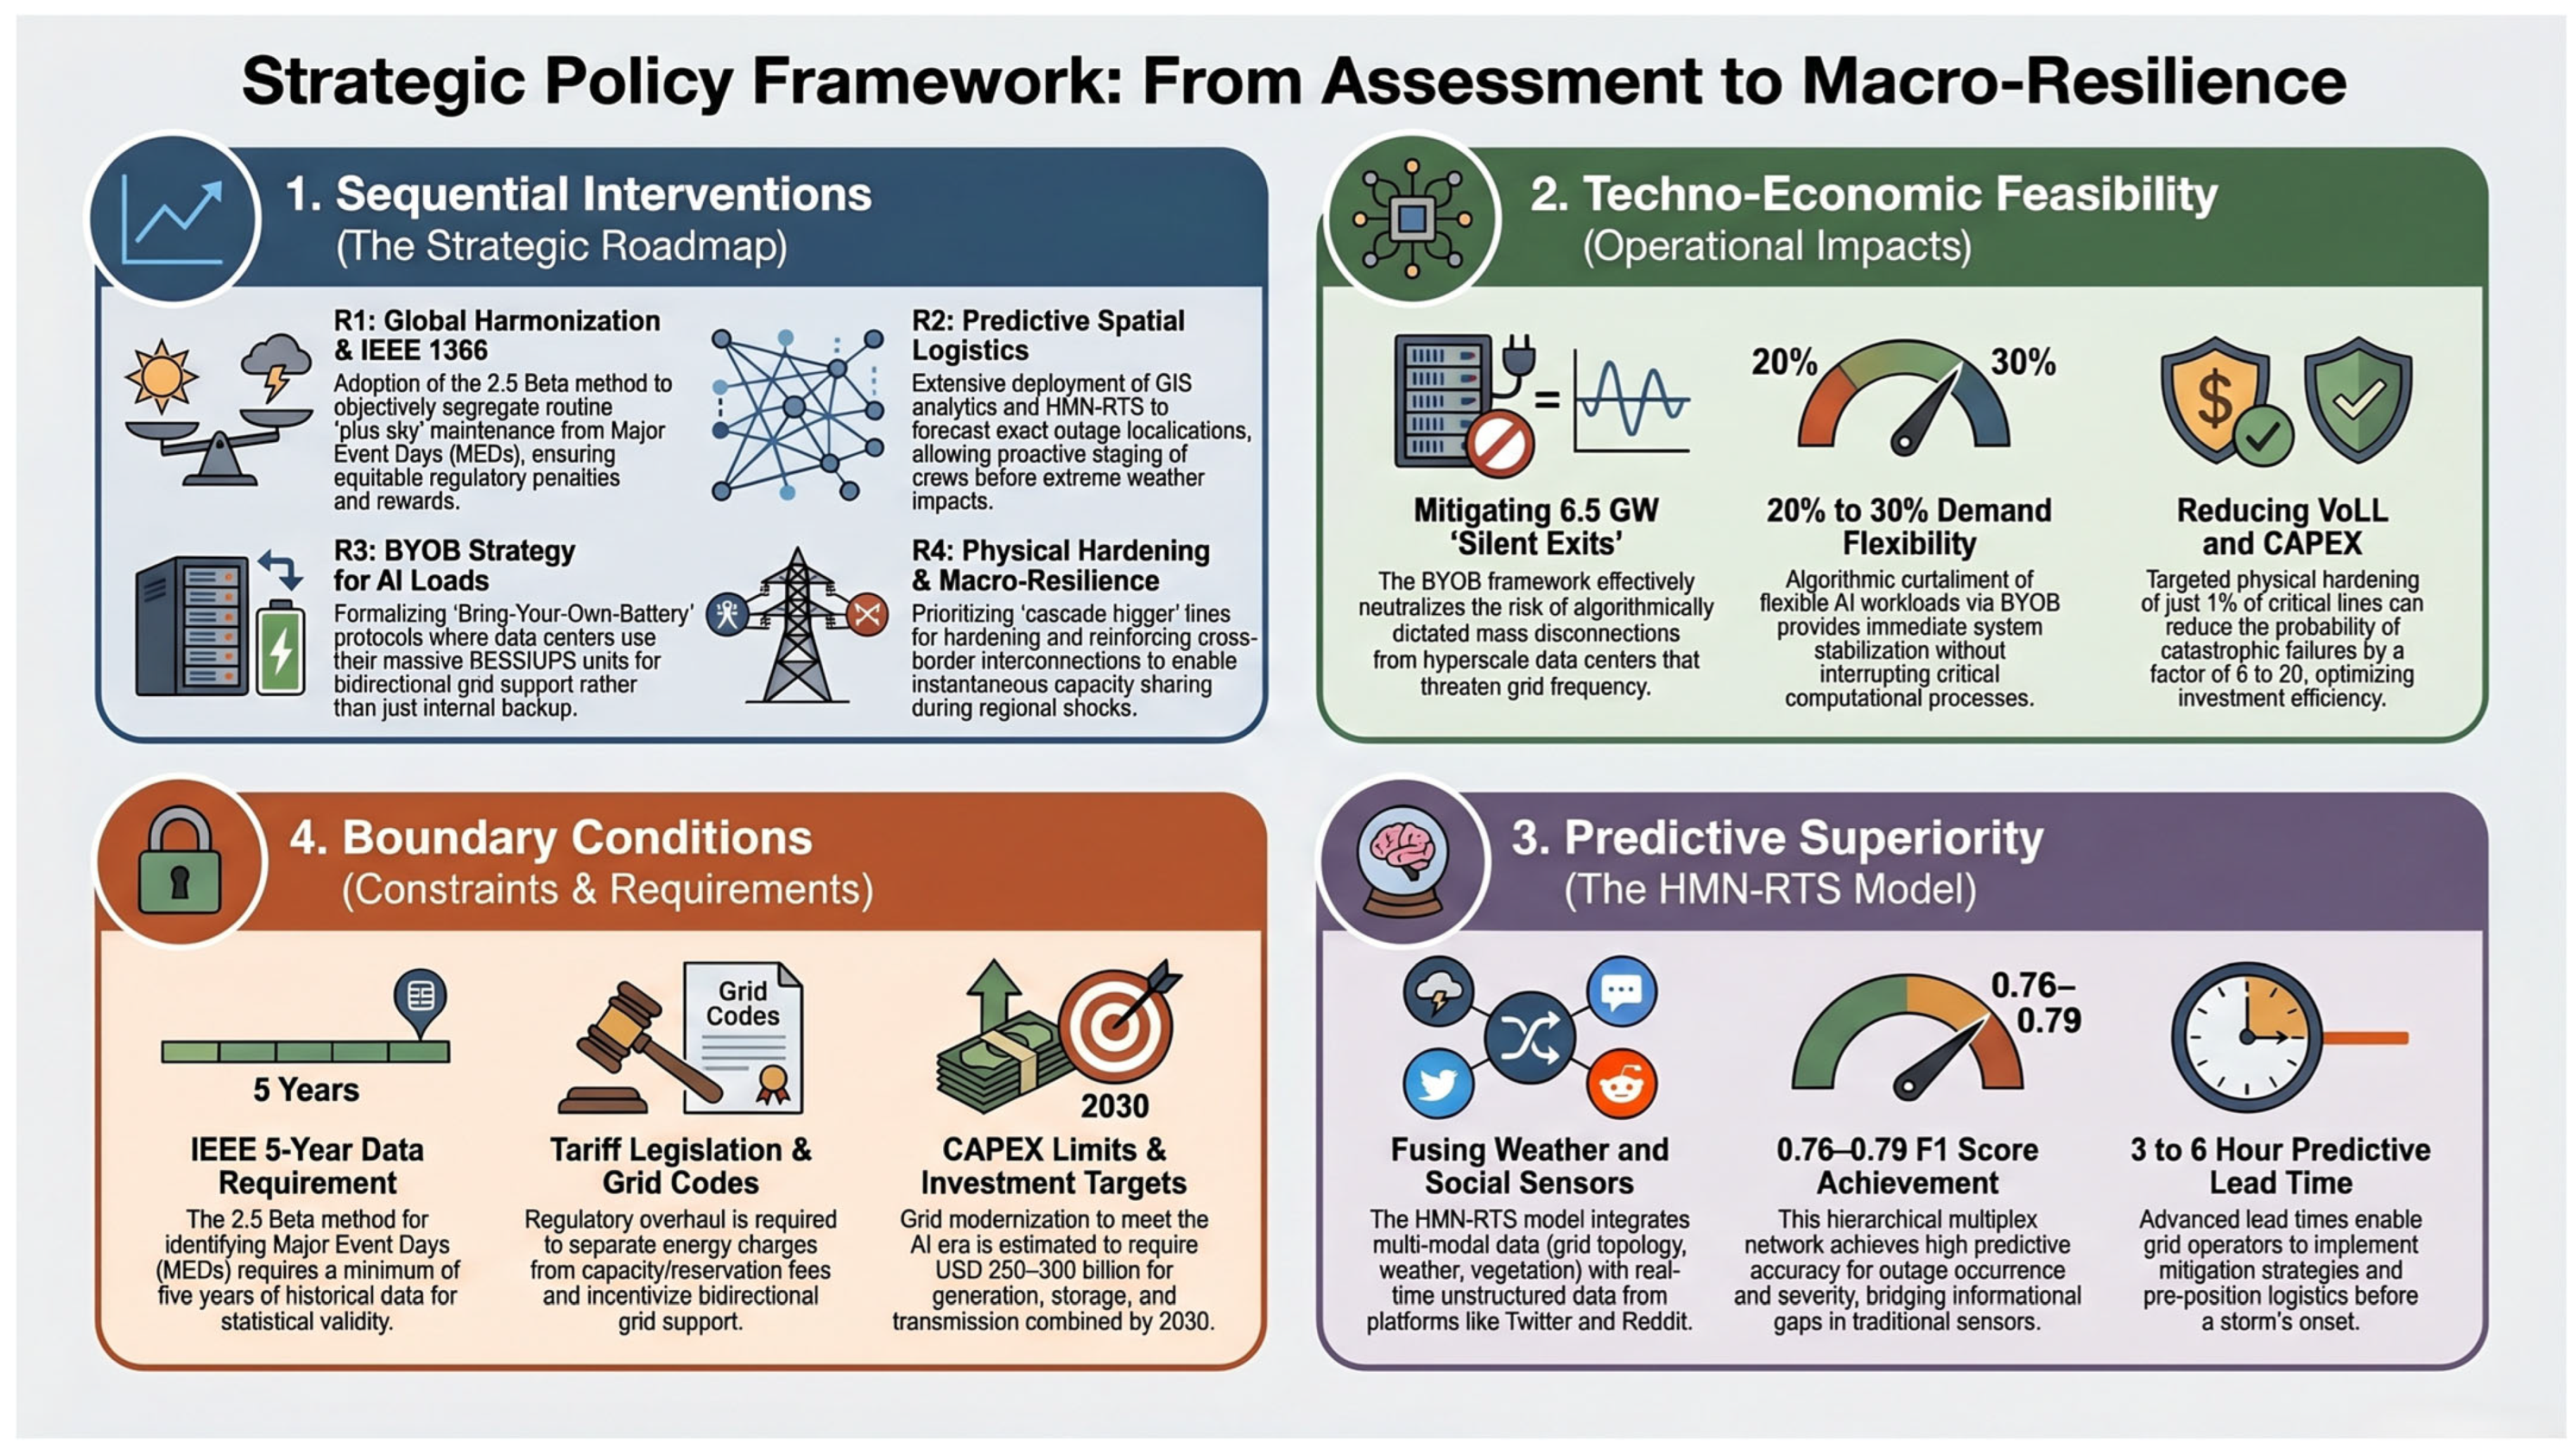
Limitations and Boundary Conditions—while the proposed comprehensive framework offers significant advancements in grid resilience, several operational and methodological constraints must be explicitly acknowledged, as follows (see
Figure 3):
Methodological Limitations of the 2.5 Beta Method—the IEEE 1366 methodology is strictly constrained by its requirement for five consecutive years of high-quality, continuous historical data. This poses a significant barrier to entry for developing nations with nascent or dysfunctional monitoring infrastructure. Furthermore, the algorithm’s reliance on a log-normal distribution may be mathematically challenged in regions experiencing perpetually intensifying, back-to-back climate extremes, which could skew the statistical baseline and redefine the “normal” operational curve over time.
Regulatory Constraints of BYOB—the widespread deployment of the BYOB strategy is not merely a technical challenge; it requires complex legislative overhauls of grid tariff codes, interconnection standards, and the establishment of functional localized flexibility markets to adequately incentivize data center operators.
Capital Constraints for Hardening—finally, while physical hardening (R4) yields the most robust resilience, it is fundamentally bound by immense capital expenditure limitations. The pace of undergrounding cables and building macro-interconnections is ultimately dictated by sovereign fiscal capacities [
7].
6. Conclusions
This study has systematically investigated the profound methodological fragmentation in global power grid reliability assessments. By comparatively analyzing European CEER-ECRB benchmarking data against the standardized United States IEEE 1366 (2.5 Beta) framework, we highlighted how the absence of a harmonized definition for Major Event Days (MEDs) fundamentally distorts infrastructure evaluation and misdirects critical capital investments.
The convergence of intensifying compound climate hazards with the unprecedented, algorithm-driven load volatility of artificial intelligence data centers (capable of instantaneous gigawatt-scale “silent exits”) necessitates a paradigm shift from retrospective statistical observation to proactive grid management. To address these compounding vulnerabilities, we proposed a multidimensional strategic framework.
Based on our analytical modeling, historical benchmarking, and advanced simulations—rather than physically demonstrated field trials—the deployment of the proposed Hierarchical Spatiotemporal Multiplex Networks (HMN-RTS) indicates significant predictive potential. By dynamically fusing structured environmental data with unstructured social sensors (via GIS and social media), our models project a highly accurate outage prediction capability, achieving a macro F1 score of 0.76–0.79 with a proactive lead time of 3 to 6 h.
Furthermore, simulated projections suggest that implementing proactive topological hardening, coupled with the “Bring-Your-Own-Battery” (BYOB) regulatory strategy for hyperscale AI loads, could theoretically yield a 5- to 20-fold reduction in cascading blackout probabilities during extreme weather events. While these modeled outcomes require future empirical validation through localized physical pilot projects, they provide National Regulatory Authorities and system operators with a robust, data-supported blueprint. Ultimately, achieving sustainable macro-resilience across global energy supply chains relies on the immediate international harmonization of reporting standards and the strategic integration of decentralized, intelligent load modulation.