Article

Potential for Cropland Cultivation and Expansion Using Animal Draught Power in an Abrupt-Sunlight-Reduction Scenario with Loss of Industry


by
Luisa L. Monteiro
1,2,*,
Michael Hinge
1,
Simon Blouin
1 and
David Denkenberger
1,2,*
1
Alliance to Feed the Earth in Disasters (ALLFED), Lafayette, CO 80026, USA
2
Department of Mechanical Engineering, University of Canterbury, Private Bag 4800, Christchurch 8140, New Zealand
*
Authors to whom correspondence should be addressed.
Sustainability 2026, 18(13), 6552; https://doi.org/10.3390/su18136552
Submission received: 25 May 2026 / Revised: 15 June 2026 / Accepted: 26 June 2026 / Published: 28 June 2026
(This article belongs to the Special Issue Disaster Risk Reduction and Sustainability)

Abstract

An abrupt-sunlight-reduction scenario combined with a catastrophic collapse of electricity/industry has the potential to disrupt food production and distribution worldwide, creating widespread food insecurity. This paper explores the potential of animal draught power to cultivate current cropland and expand cropland area in each country with winter wheat during an abrupt-sunlight-reduction scenario with global collapse of industry. For a 150 tera-gram soot injection with no fertiliser application, the country-level allocation of draught animals allows for the global cultivation of over 700 million hectares (Mha) of current cropland, and expansion of global cropland area by 120 Mha, mostly focused in tropical regions of the globe. Over the course of seven years, over 8.3 billion tons of wheat are produced globally, 25% of which is fed to working animals, while the remaining surplus is used to meet human calorie demand. Although enough wheat is eventually produced to meet 80% of the human global calorie demand, animal demand and trade collapse only makes it possible to meet 30% of the global calorie demand. This presents outdoor agriculture and cropland expansion as viable and sustainable methods to mitigate starvation and prevent animal extinction in a catastrophe in some select countries.

1. Introduction

Modern agricultural systems have increased in size, complexity, and interconnectedness, largely thanks to global trade. As such, production depends increasingly on external factors, including fertiliser and pesticide production, and provision of equipment, labour, and fuel [1]. However, this dependence has increased the food system’s vulnerability to shocks, and local disruptions can trigger cascading failures and threaten global food supply [2].
Food systems are also vulnerable to global climate catastrophes. A nuclear war, supervolcanic eruption, or impact with an asteroid/comet could result in the release of large volumes of aerosols into the stratosphere, triggering an abrupt-sunlight-reduction scenario (ASRS) and altering global climate by severely reducing global temperatures [3]. An ASRS could last for several years and reduce crop yields around the globe, as many crops would be unable to withstand the harsh conditions. This decrease would worsen with the decrease in precipitation levels, though some regions could experience less water limitation due to low temperatures and high relative humidity [4]. Climate and crop models suggest an ASRS could reduce global calorie production by up to 90% and require a decade for full recovery [5,6].
The impacts of an ASRS extend beyond the agricultural sector: depending on the cause, the electricity system could suffer long-term damage that would quickly and widely propagate, potentially causing a global catastrophic industry loss (GCIL). Possible causes include electromagnetic pulses (EMPs) caused by the detonation of nuclear weapons at high altitude or a supervolcanic eruption that disrupts renewable-energy-dependent systems [7]. Strategies such as decentralising the global industrial infrastructure and Faraday-cage shielding could mitigate the effects of a GCIL, but their implementation is still uncommon, increasing the world’s vulnerability to such an event [8].
The loss of electricity and transport networks would trigger the subsequent collapse of other sectors; affect food storage and distribution, leading to food spoilage and shortage; and impair global supply chains of fuel and agricultural inputs (among others), especially in countries dependent on food imports [2,8,9,10,11]. Regardless of the scale of the GCIL, the induced disruptions in the supply of agricultural inputs would result in lower crop yields [12]. For example, a nuclear exchange between the United States and Russia alone (not considering the impacts of EMP or ASRS) could reduce global industrial output by 25%, with the loss of fertiliser inputs reducing wheat yields by 15%, causing shortages in countries targeted by the exchange [10]. Another study showed that a 50% reduction in the supply of agricultural inputs (fertiliser, pesticide, and equipment) would cause a 21% reduction in wheat production [1]. Combined, an ASRS and GCIL could trigger a food shock large enough to cause widespread famine, malnutrition, and even the collapse of modern civilisation [13].
Several studies have highlighted the absence of solutions to ensure food self-sufficiency post-natural disasters and global catastrophes [2,13,14]. Since the aforementioned effects can also occur outside of catastrophic conditions, developing mitigation strategies to ensure food security in such extreme situations can also improve the resilience and sustainability value of the food supply system to milder disruptions. For example, resilient food solutions are food systems that can be quickly implemented and scaled-up in a catastrophic event to increase food availability, while still being affordable and accessible to the general population. Previously explored resilient food solutions to ASRS include methane single-cell proteins, lignocellulosic sugar [15], and crop-switching [16]. However, these studies do not consider the impacts of a GCIL in the development of their respective resilient food solutions.
Another solution is the expansion of agricultural land to counteract the reduced yields of existing crops. Previous research showed cropland expansion to other land types to cultivate cold-tolerant plants could constitute a plausible food source in an ASRS [17]. Assuming mechanised equipment can be used, cropland expansion can counteract the yield shock caused by the ASRS and fulfil a significant fraction of global calorie requirements. However, the study does not account for the effects of GCIL or for disruptions to global fuel supply, and thus the potential to prevent starvation by expanding cropland area in an ASRS without industrial function is a research gap.
This paper explores the potential to prevent global starvation by cultivating and expanding cropland in a combined ASRS-GCIL scenario using draught animal power. Although there have been documented cases of a fuel crisis triggering a mass re-adoption of animal draught for agricultural activities, research about maintaining existing and expanding farmland using animal power in a scenario of industrial and trade collapse is non-existent. A crop model is used to determine the current cropland and non-cropland area suitable for winter wheat growth following a 150 tera-gram (Tg) soot injection caused by a nuclear exchange, without irrigation and fertiliser input. Assuming mechanised equipment cannot be used, the physical feasibility of cultivating current cropland for seven years and expanding new cropland area for three years using animal draught as a food-providing system following a catastrophe is assessed. Therefore, this paper investigates animal and human availability for labour and the areas being cultivated and expanded to calculate the gross wheat and wheat residues produced, the animal feed requirements for land cultivation and expansion, the net available human edible wheat, and the global human calorie demand met with the produced wheat.

2. Materials and Methods

2.1. Crop Model

The Mink global gridded crop model, based on the Decision-Support System for Agrotechnology Transfer (DSSAT) physiological crop model, is used to assess winter wheat crop yields in both current cropland and non-cropland areas of 158 countries [16,18]. A single winter wheat cultivar, selected for its tolerance of low temperatures and drought, and energy density, is modelled based on the crop growth parameters of winter wheat grown in northern Europe. Winter wheat was picked over other stale crops since it performed the best when planted over all staples’ cropland in the crop model. The model provides details on land coverage, focusing on land classified as current cropland (CC), herbaceous vegetation (H), barren land (B), and shrubland (S). Bodies of water, forest, and ice were excluded when assessing viable areas for cropland expansion.
The model considers a 150 Tg soot injection based on [3], where the climate effects of stratospheric soot injection caused by the detonation of nuclear weapons and subsequent burning of cities were simulated. The ASRS modelled occurs in May, which is considered the start of year 1 of the catastrophe, offset from calendar years. The severe ASRS conditions are simulated for seven years, and the crop yields are calculated optimising the best planting month for each of the years. The model also considers 0% of current nitrogen application levels, as well as no irrigation to simulate collapse of industry. The effect of nutrients from decomposing crop residues is also included in the yield estimates.
To improve prediction accuracy, a multiplicative correction factor of 0.80 is applied to align the model’s baseline wheat yields with observed global production statistics. Additionally, multiplicative factors of 0.65, 0.80, and 0.90 are applied to the first three years of ASRS [19], respectively, to account for farmer inexperience when growing a new crop and from planting on newly cleared areas [20]. These factors make yield estimations slightly pessimistic in regions where wheat is already cultivated, but the effect is considered negligible given the size difference between current wheat cropland and the area modelled.
The results of the Mink gridded crop model are interpolated with the 90 m Digital Elevation Data provided by the NASA Shuttle Radar Topographic Mission (SRTM) to determine the slope of the area of each grid cell [21]. Only areas with a slope under 10% are considered, as most cattle reside in low-slope terrains and could get hurt working in land with too steep a slope [22].
Areas over a grid cell are considered suitable for cultivation if the average predicted yield over seven years of ASRS-GCIL is larger than 1040 kg per ha and 1200 kg per ha for current cropland and non-cropland areas, respectively. These thresholds were calculated based on draught animals’ feed requirements during cultivation days, with the threshold for non-cropland area being 0.16 times larger to account for the extra work required to convert the land and cultivate it for six years.

2.2. Animal Distribution

The collapse of industry would disrupt the production and supply of electric power and fossil fuel, which would subsequently render mechanised equipment unusable. Alternative power sources or above-ground fuel reserves could be considered, but are not guaranteed. Therefore, all mechanised equipment is assumed to be out of use in this model.
As a preliminary response to ASRS, many animals would be culled for human consumption, but a potential GCIL could incentivise keeping animals alive to be used in labour. This model assumes draught animals are used to cultivate and expand land, notably draught cattle (both dairy and non-dairy) and horses. The number of existing cattle and horses and the number of cattle slaughtered are extracted from the FAO statistical database, and the number of dairy cows is calculated based on the milk yield and milk output of each country [23]. The fraction of slaughtered cattle and dairy cows (see Section 3.2) is then subtracted from the total number of cattle in each country to obtain the number of draught cattle that can be used (oxen, heifers, and steers). The model assumes a steady state for the number of animals over the seven years of ASRS, and that the slaughtered cattle numbers include animals too young for draught work. Since oxen and cows can only achieve 64% of the draught power of horses [24], this factor was used to normalise the number of draught cattle into horse equivalents, thus facilitating the distribution of animals for cultivation. Since trade is assumed to have collapsed, each country is restricted to its current existing animals, and cross-border transportation of animals is not considered.
In China, where draught animals are still largely used, it is estimated there is one animal working per 2.23 ha of arable land. Approximately 73% of the total arable area in China is traditionally farmed, and since most of the draught power is provided by oxen, that number is adjusted to 2.5 ha per horse [25]. This is used to calculate the animals needed to cultivate the current cropland area and the future expanded area. One person is allocated per every animal pair allocated, based on each country’s current working population, to oversee the training and guiding of the animals, as well as carrying out some of the necessary cropland expansion tasks. The model prioritises animal allocation for the cultivation of current cropland areas, as current cropland has been planted before and requires less preparation. Hence, cropland area expansion only occurs in countries with an excess of animals following allocation for cultivation of current cropland. The number of animals allocated for expansion decreases monthly, as animals are allocated to cultivate the area expanded in the previous month. Although the animals’ manure could be applied to the land, this is not considered in the model.

2.3. Tasks

The number of hours per hectare of each equipment and technique is adapted from Smil’s calculations for the labour requirements in traditional farming [24], depicted in Table 1. A working day of 8 working hours, 7 days per week, is assumed.
Three different levels of productivity are considered: the minimum, the maximum, and the median. Ploughing and harrowing are dependent on animal power, and both require an animal pair to be executed, and the number of ploughs and harrows in a country is assumed to be the same as the number of draught animal pairs. Other tasks, like hoeing, mowing, and controlled burning, are all performed by humans. The time required to perform a task is calculated by multiplying the area to be expanded/cultivated by the time per unit of area of a task, and this is calculated for the expanded/cultivated area of each country, according to the number of draught animals and people.

2.3.1. Cropland Expansion

In this model, each pair of draught animals pull ploughs and harrows three times to prepare soil for farming, levelling and aerating the soil and producing an even seedbed [24]. Cropland expansion begins with barren land, then proceeds to herbaceous vegetation, and finally shrubland, in increasing order of difficulty according to vegetation cover. Barren land can be ploughed and harrowed immediately, while herbaceous vegetation and shrubland are first cleared of existing vegetation: herbaceous vegetation is cleared by mowing with scythes, and shrubland is first burnt, before burnt remnants and roots are removed with hoes. Since both tasks rely on draught power, ploughing and harrowing happen sequentially, and their time is additive; therefore, the time required to clear barren land is the sum of the ploughing and harrowing times, while the time required to clear herbaceous vegetation and shrubland correspond to the time of the longest task.
It should be noted that cropland expansion times are underestimated because the time required to transport or move equipment between areas after initial relocation is not accounted for. Expansion begins one month after the catastrophe occurs, which is dedicated to assessing the catastrophe, animal training, and initial allocation of equipment, and it stops at the end of the third year. Hence, the expanded land can be cultivated several times in the years when the climate is still highly degraded, aligning with previous resilient food analysis [15].
Cropland expansion rates depend on each country’s number of excess draught animals, land type, and the quantity of area to clear. The land is cleared sequentially, with a rate corresponding to the land type being cleared at a given time. Therefore, the land clearing process as a function of time can be described by a curve split into three sections: barren land, herbaceous vegetation, and shrubland.
Each section can be described by the following equations:
F o r   0 < t t B   :   A   ( t )   = m B × t ,
F o r   t B < t ( t B + t H )   :   A   ( t ) = m H × t + b ,
F o r   ( t B + t H ) < t ( t B + t H + t S )   :   A   ( t ) = m S × t + c ,
where mB, mH, and mS correspond to the land-clearing rates in hectares per day for B, H, and S, respectively, and tB, tH, and tS correspond to the time in days required to clear the full areas of B, H, and S, respectively. The constants b and c in ha correspond to the points where the land type changes, and are the described by the following equations:
b = t B × ( m B m H ) ,
c = [ ( t B + t H ) × ( m H m S ) ] + b
At the end of every month, the number of animals allocated for expansion decreases as they are allocated to cultivate the area cleared in the previous month, until either the full area has been cleared or until the end of the three years of expansion. The clearing rates, times, and constants are recalculated every month to reflect the decrease in draught animal numbers.

2.3.2. Cultivation

Cultivation is modelled to happen once a year, after ploughing, harrowing and drilling in the soil. The number of hours per hectare of each task is adapted from Smil’s calculations for the labour requirements in traditional farming, depicted in Table 1. The current and expanded cropland areas are cultivated and harvested within 270 days, in line with FAO estimates for cattle workload in rural China [26]. In this model, the area expanded in a month is planted in the following month, while the current cropland is cultivated for the first time in the second month of ASRS-GCIL. Wheat is harvested nine months after cultivation and then replanted three months after the harvest, after letting the land lay fallow. This cropping pattern is repeated for the next seven years of the catastrophe. While under baseline conditions, different cultivation patterns would have to be considered for each country, the extreme climate change caused by the catastrophe shortens growing seasons and slows down crop maturation in mid-latitude regions [4], making this a conservative estimate of growing seasons.

2.4. Wheat Production

The winter wheat yields—in kg in dry matter (DM) per ha—simulated by the crop model for a 150 Tg soot injection with no fertiliser and irrigation inputs are calculated for every calendar year, as the soot concentration in the atmosphere changes over time. Each country’s monthly wheat production is calculated by multiplying the area cultivated nine months prior by the average annual wheat yield of that country in the simulated conditions. Annual wheat residue production is also estimated, assuming 960 kg DM of wheat residue (65% of which is stem, 22% chaff, and 12% leaves [27]) is produced for every 1 ton DM of wheat. It is assumed that each country’s wheat and residue production is fed exclusively to its people and draught animals, with no exports or imports between countries. This serves to assess the impact of trade collapse on the food supply chain and the reliability of outdoor agriculture as a resilient food method in every nation modelled. The values used as a basis for the analysis are summarised in Table 2.

2.5. Animal Feed

In baseline conditions, draught animals are fed primarily with grass and non-edible crop residues [32,33], but feed utilisation in an ASRS would need to be adjusted to accommodate the reduced feed availability while still providing the animals with the energy required for draughting.
Annual animal feed requirements were estimated using the following methodology: first, the base metabolic needs of a draught horse, based upon values provided by [24,34], is assumed to be met by 4.6 kg of wheat or 8.8 kg of wheat residues (a blend of stems, chaff, and leaves) per day per animal; next, assuming a work schedule of 270 days per year, the animal wheat requirement for working days increases by a factor of 1.8. The decision tree for optimising feed uses the following logic: first, animals are fed inedible feed to meet maintenance energy demand, and human edible feed is used to meet any shortfall; next, human edible feed is assigned to animals’ rations during working days to supplement their diet—animals consume 392 and 464 kg of wheat per ha cultivated and expanded, respectively. If the area does not produce enough wheat to meet animals’ energy requirements, it is not cultivated or expanded. The energy provided by the wheat and its residues is calculated by multiplying the annual production by its digestible energy for horses, depicted in Table A1 in the Appendix A.

2.6. Assessments

The outcomes modelled by the minimum, median, and maximum levels of productivity are reported for the animal distribution, cropland expanded, cropland cultivated, wheat produced, and global human and animal calorie demand met. The area suited for winter wheat growth and expanded cropland area are calculated for every country, and presented aggregated by continent or globally. Animal distribution, wheat produced, and wheat used to meet animals’ energetic requirements are also calculated for every country, but the global sum is presented in the results. The wheat used to meet global human calorie demand is based on the global amounts of wheat produced and wheat used to meet animals’ feed requirements. Cropland expansion is modelled only for the first three years of the catastrophe, but wheat production and consumption are shown for seven years of the catastrophe.

3. Results

3.1. Cultivable Land Area in a Combined ASRS-GCIL

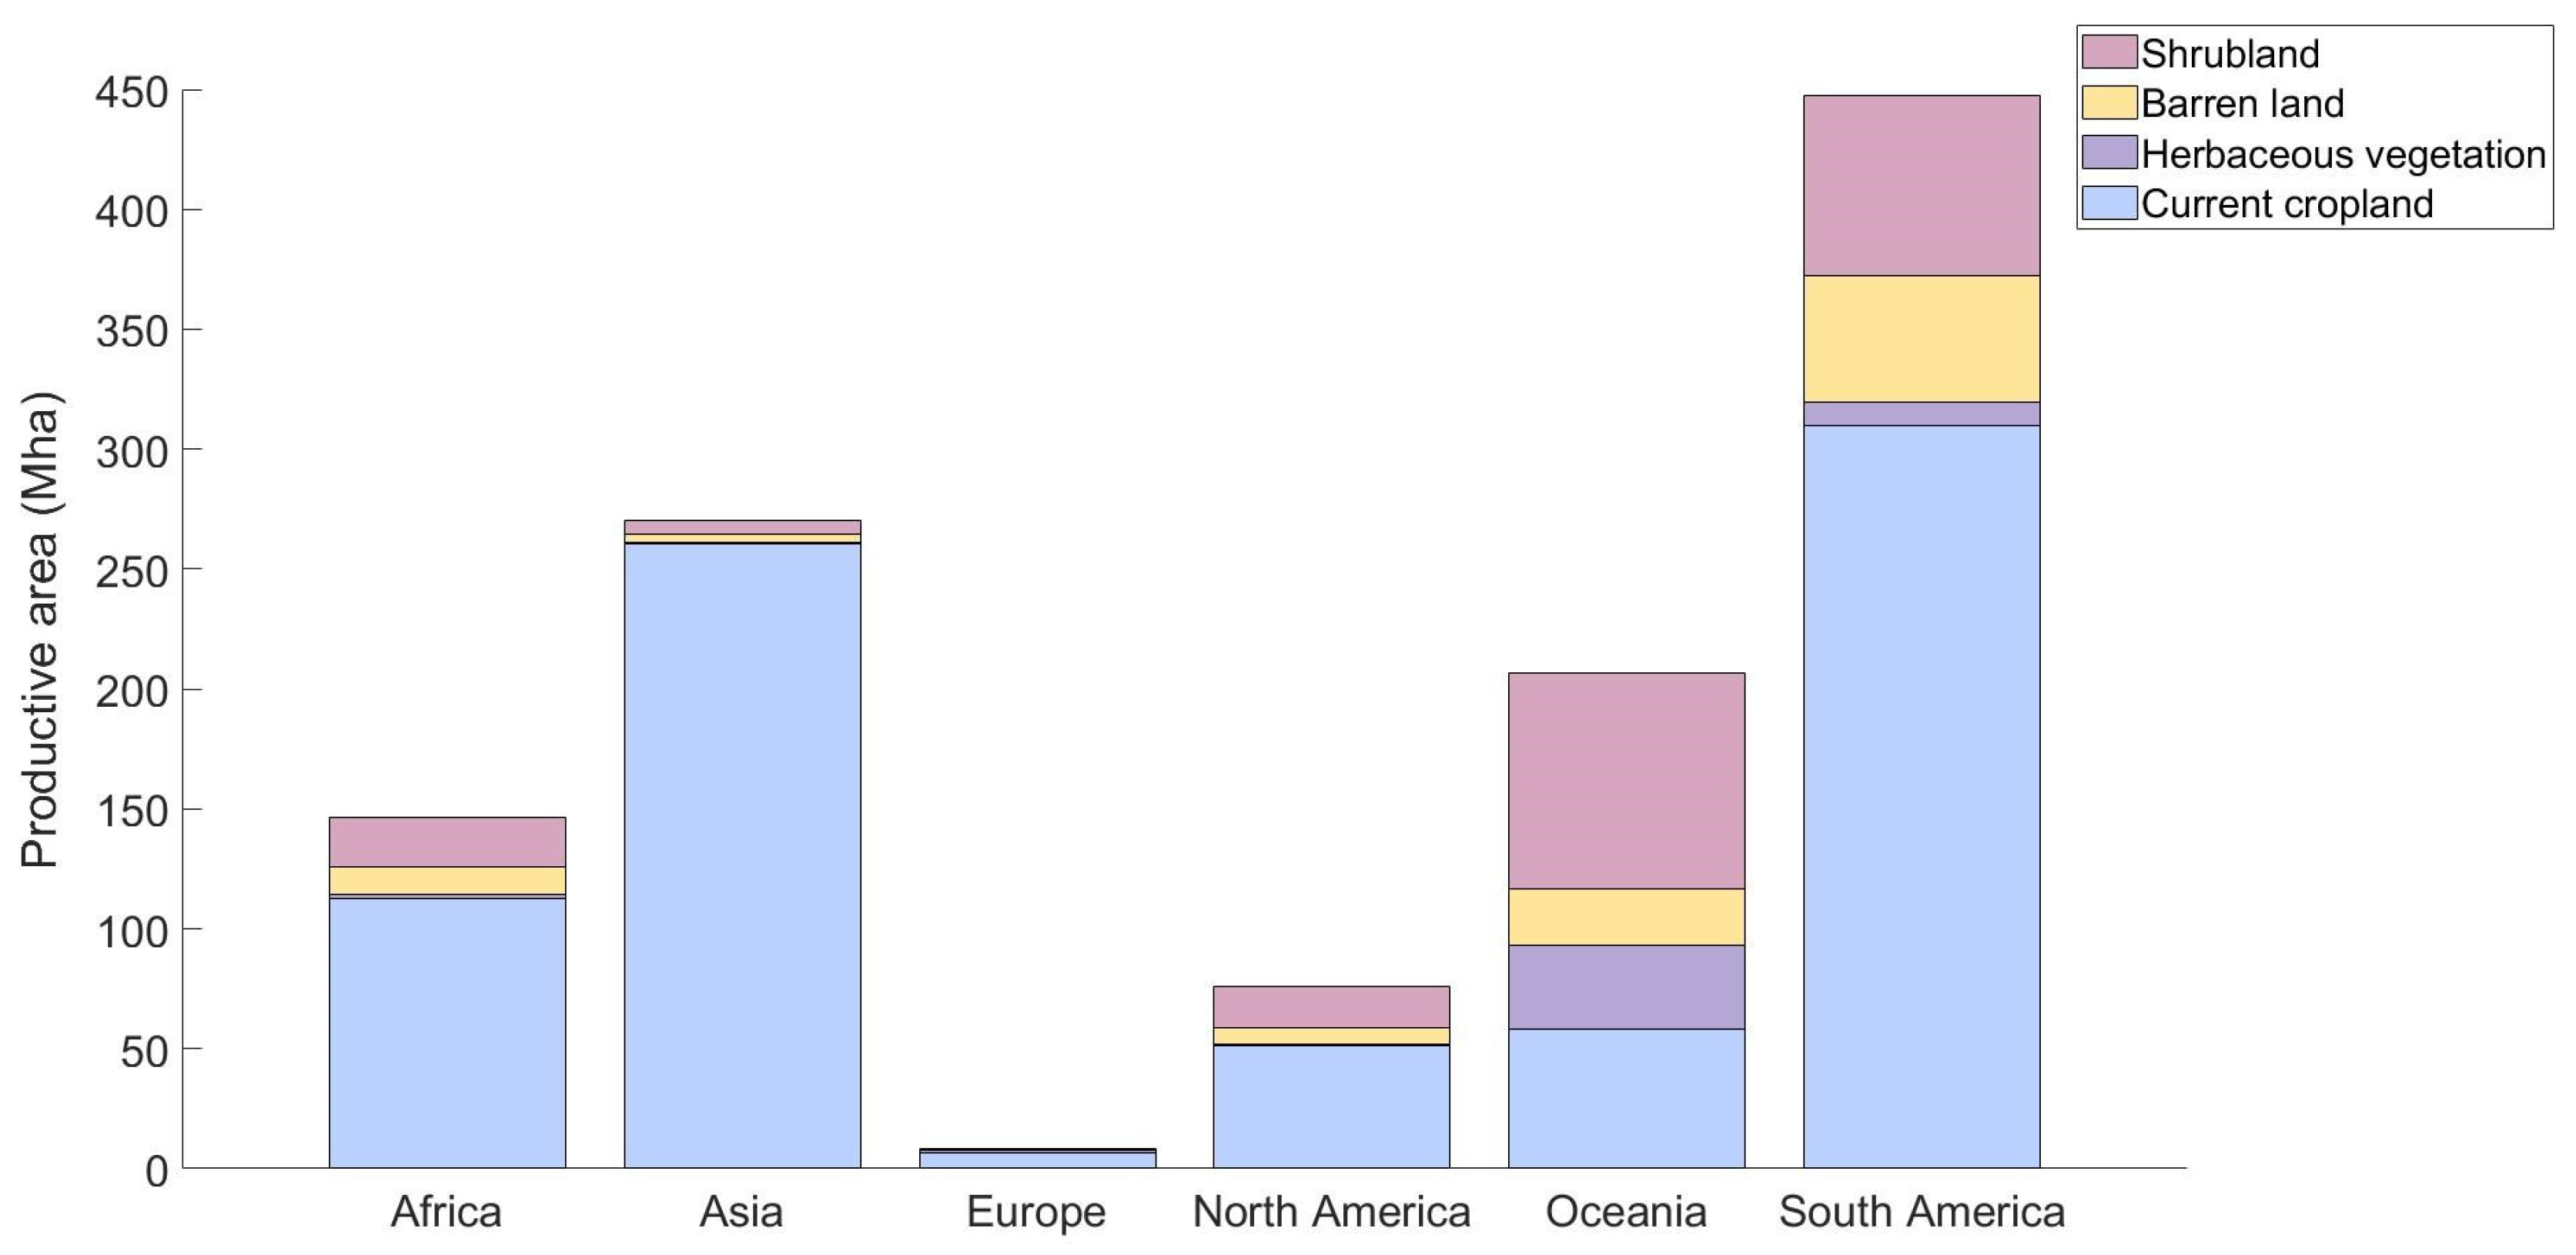
The crop model allowed for the visualisation of potential winter wheat yields in current cropland and non-cropland regions in a combined ASRS-GCIL scenario. Figure 1 shows the total suitable area available per continent, according to land type. Considering only the areas of the selected land types, with average yields above the defined thresholds, and a slope under 10%, the potentially suitable current cropland and non-cropland areas spread over 798 and 356 million hectares (Mha), respectively.
Of the 158 countries simulated, there are 74 with a cumulative total of 798 Mha of current cropland area suitable for winter wheat cultivation in a combined ASRS-GCIL. It is the predominant land type in all but five countries and makes up nearly 70% of the global suitable area. The suitable non-cropland global area adds up to 356 Mha, with shrubland making up 59% of that area, followed by herbaceous vegetation and barren land at 27 and 14%, respectively. There are 63 countries with suitable non-cropland areas worth expanding to, with most of the area being in countries in Oceania and South America.

3.2. Animal Demand and Distribution

According to the FAO statistical database, the total global number of horses and of cattle slaughtered annually is 55 million and 307 million, respectively [23]. Using the milk production statistics and subtracting the number of slaughtered cattle, the model estimates there are approximately 252 million dairy cows and 1.2 billion other cattle, which correspond to 797 million animals in horse-equivalents. In total, there are 852 million animals in horse-equivalents in the world to train and use as draught animals.
Since cross-border transportation of animals is not considered, each country is restricted to its current animal stock, and its animal demand is determined by its suitable cultivable area during the ASRS-GCIL. Table 3 compares the animal demand per continent and land type to the final animal allocation. The global summed current cropland and non-cropland areas require a total of 455 million animals in horse-equivalents, but countries with smaller animal numbers or larger areas to cultivate could fail to meet their animal demand. Because of this, only 88% and 55% of the global animal demand for cultivation of current cropland and non-cropland areas are met, respectively. In total, only 47 countries meet their total animal demand for both current cropland and non-cropland areas (see Table S1 in Supplementary Material for a country-level breakdown).

3.3. Cropland Expansion and Cultivable Current Cropland

Limitations in animal allocation promote reductions in the cultivation and expansion capacities of each country. All 73 countries with suitable current cropland area have animals for cultivation, with 51 fully meeting their animal demand, and approximately 709 Mha of current cropland is cultivated globally every year (88% of the total suitable global current cropland area).
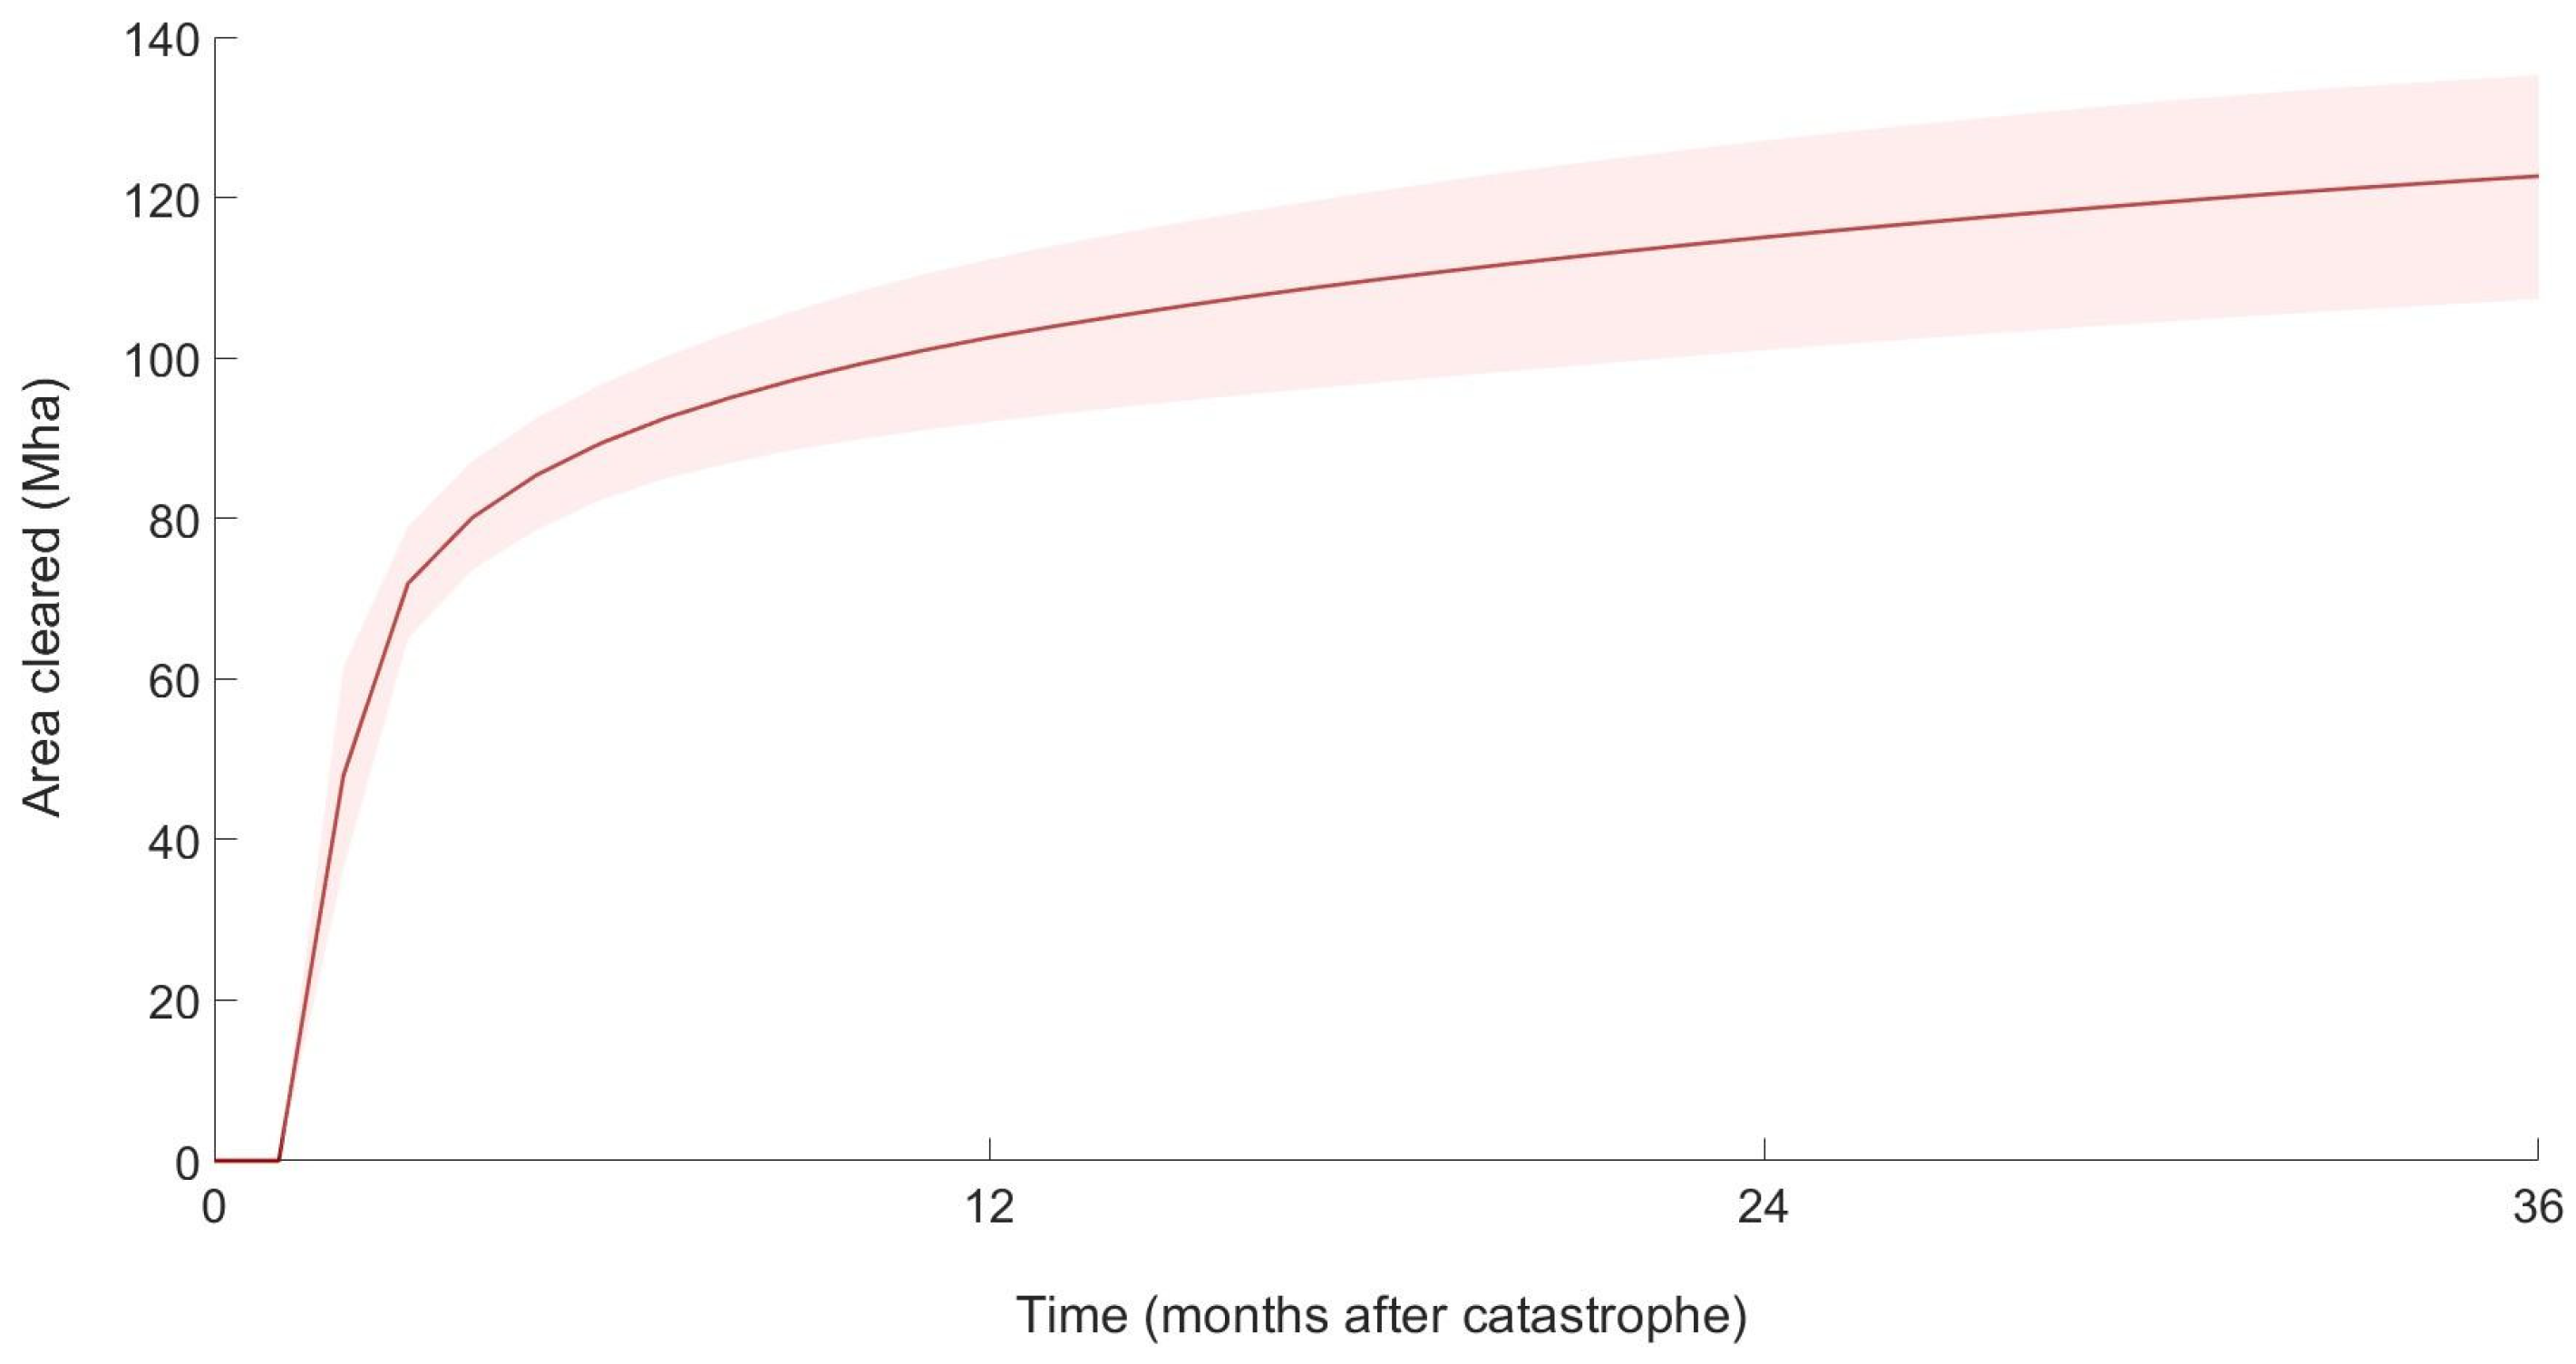
Figure 2 shows the global land-clearing process in the three years following the beginning of the catastrophe. With only 77 million animals in horse-equivalents available to work in non-cropland area, only 43 of the 63 countries with suitable non-cropland area can expand their cropland area. Therefore, those countries clear a cumulative median total of 123 Mha (min-max 107–135 Mha). Table 4 compares the total suitable area available to the area effectively used for cultivation.

3.4. Wheat Production

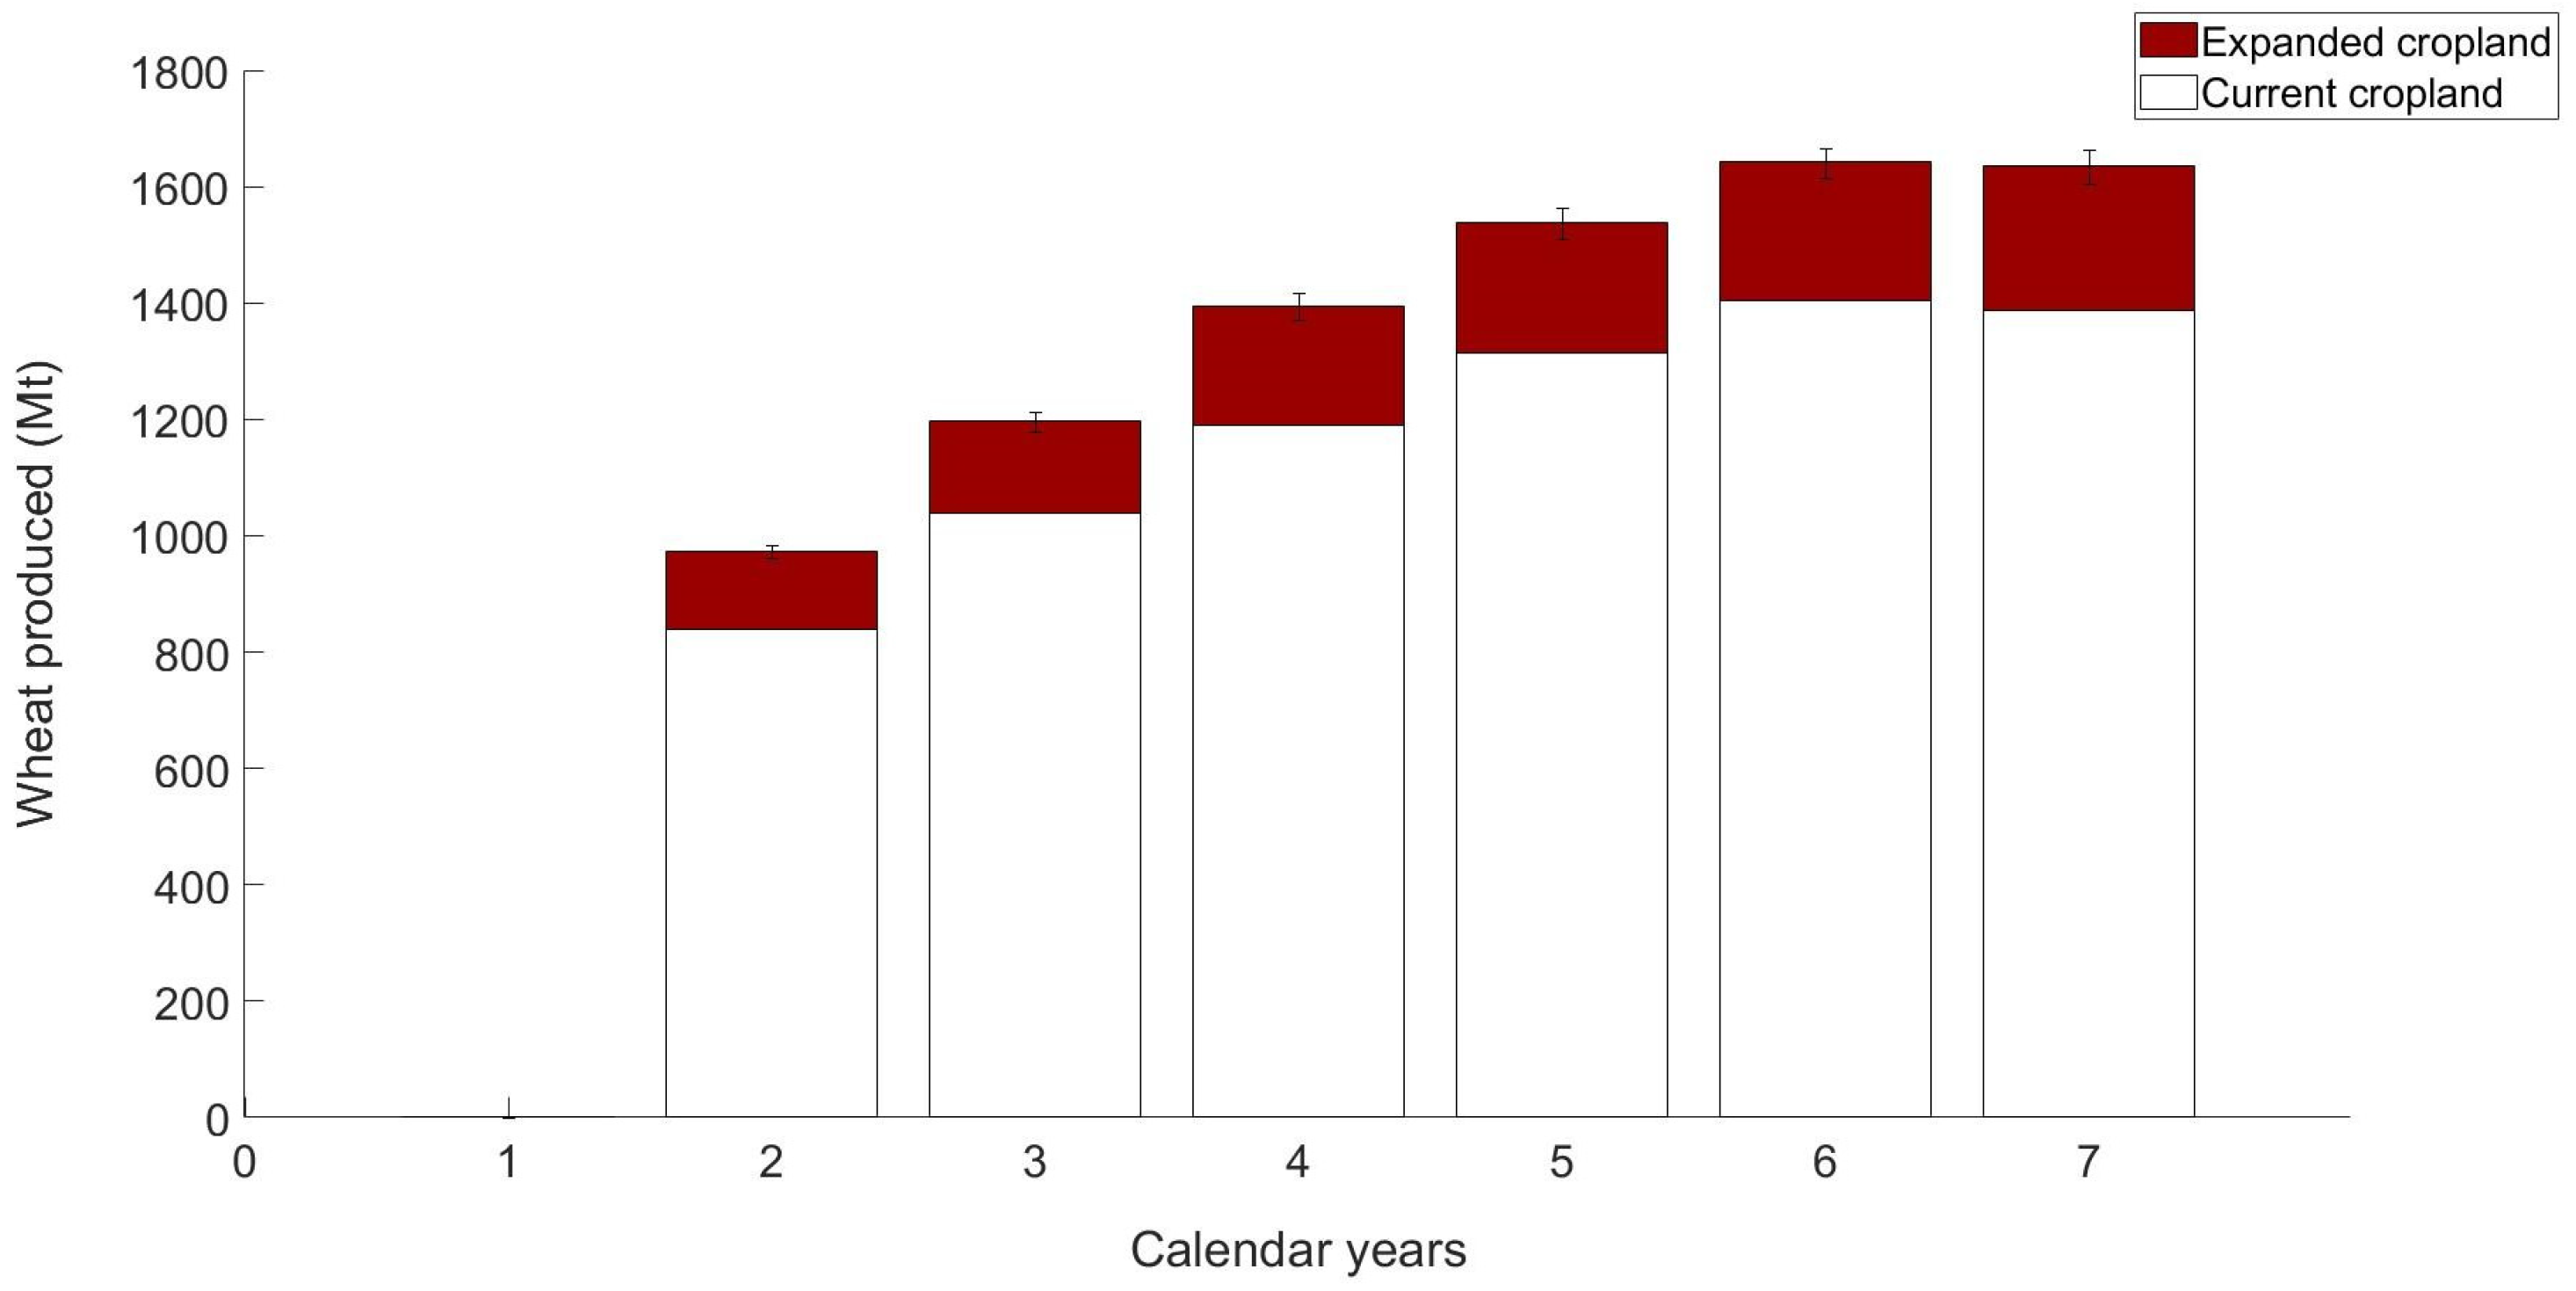
Figure 3 depicts the cumulative annual gross wheat production from expanded and current cropland areas. The 11% and 45% shortfalls in draught animal demand for current cropland and non-cropland areas, respectively, influence winter wheat production in the catastrophe. The wheat produced by the former in the second and third years constitutes just 14% of the annual gross wheat production, since the expanded area in those years is the smallest. Once cropland expansion concludes in the middle of the fourth calendar year (three years after the catastrophe begins), the global expanded area is responsible for the production of over 200 million tons (Mt) of winter wheat per year, boosting food availability during the catastrophe.
Current cropland is responsible for over 80% of the annual gross wheat production, contributing over 1 billion tons of wheat per year starting from the third calendar year. Although the area of current cropland cultivated does not change annually, the gross wheat production increases annually as the soot slowly dissipates from the stratosphere and the climate improves. Even though cropland expansion does not greatly contribute to gross wheat production, it still increases annual wheat production globally by a factor of 1.2.
If the inexperience factors are excluded, the global median suitable current cropland and non-cropland areas cultivated increase by 10%, and the gross wheat production would increase 30% and 16% in the second and third years, respectively, without altering the overall trend.

3.5. Meeting Calorie Demand of Animals and Humans

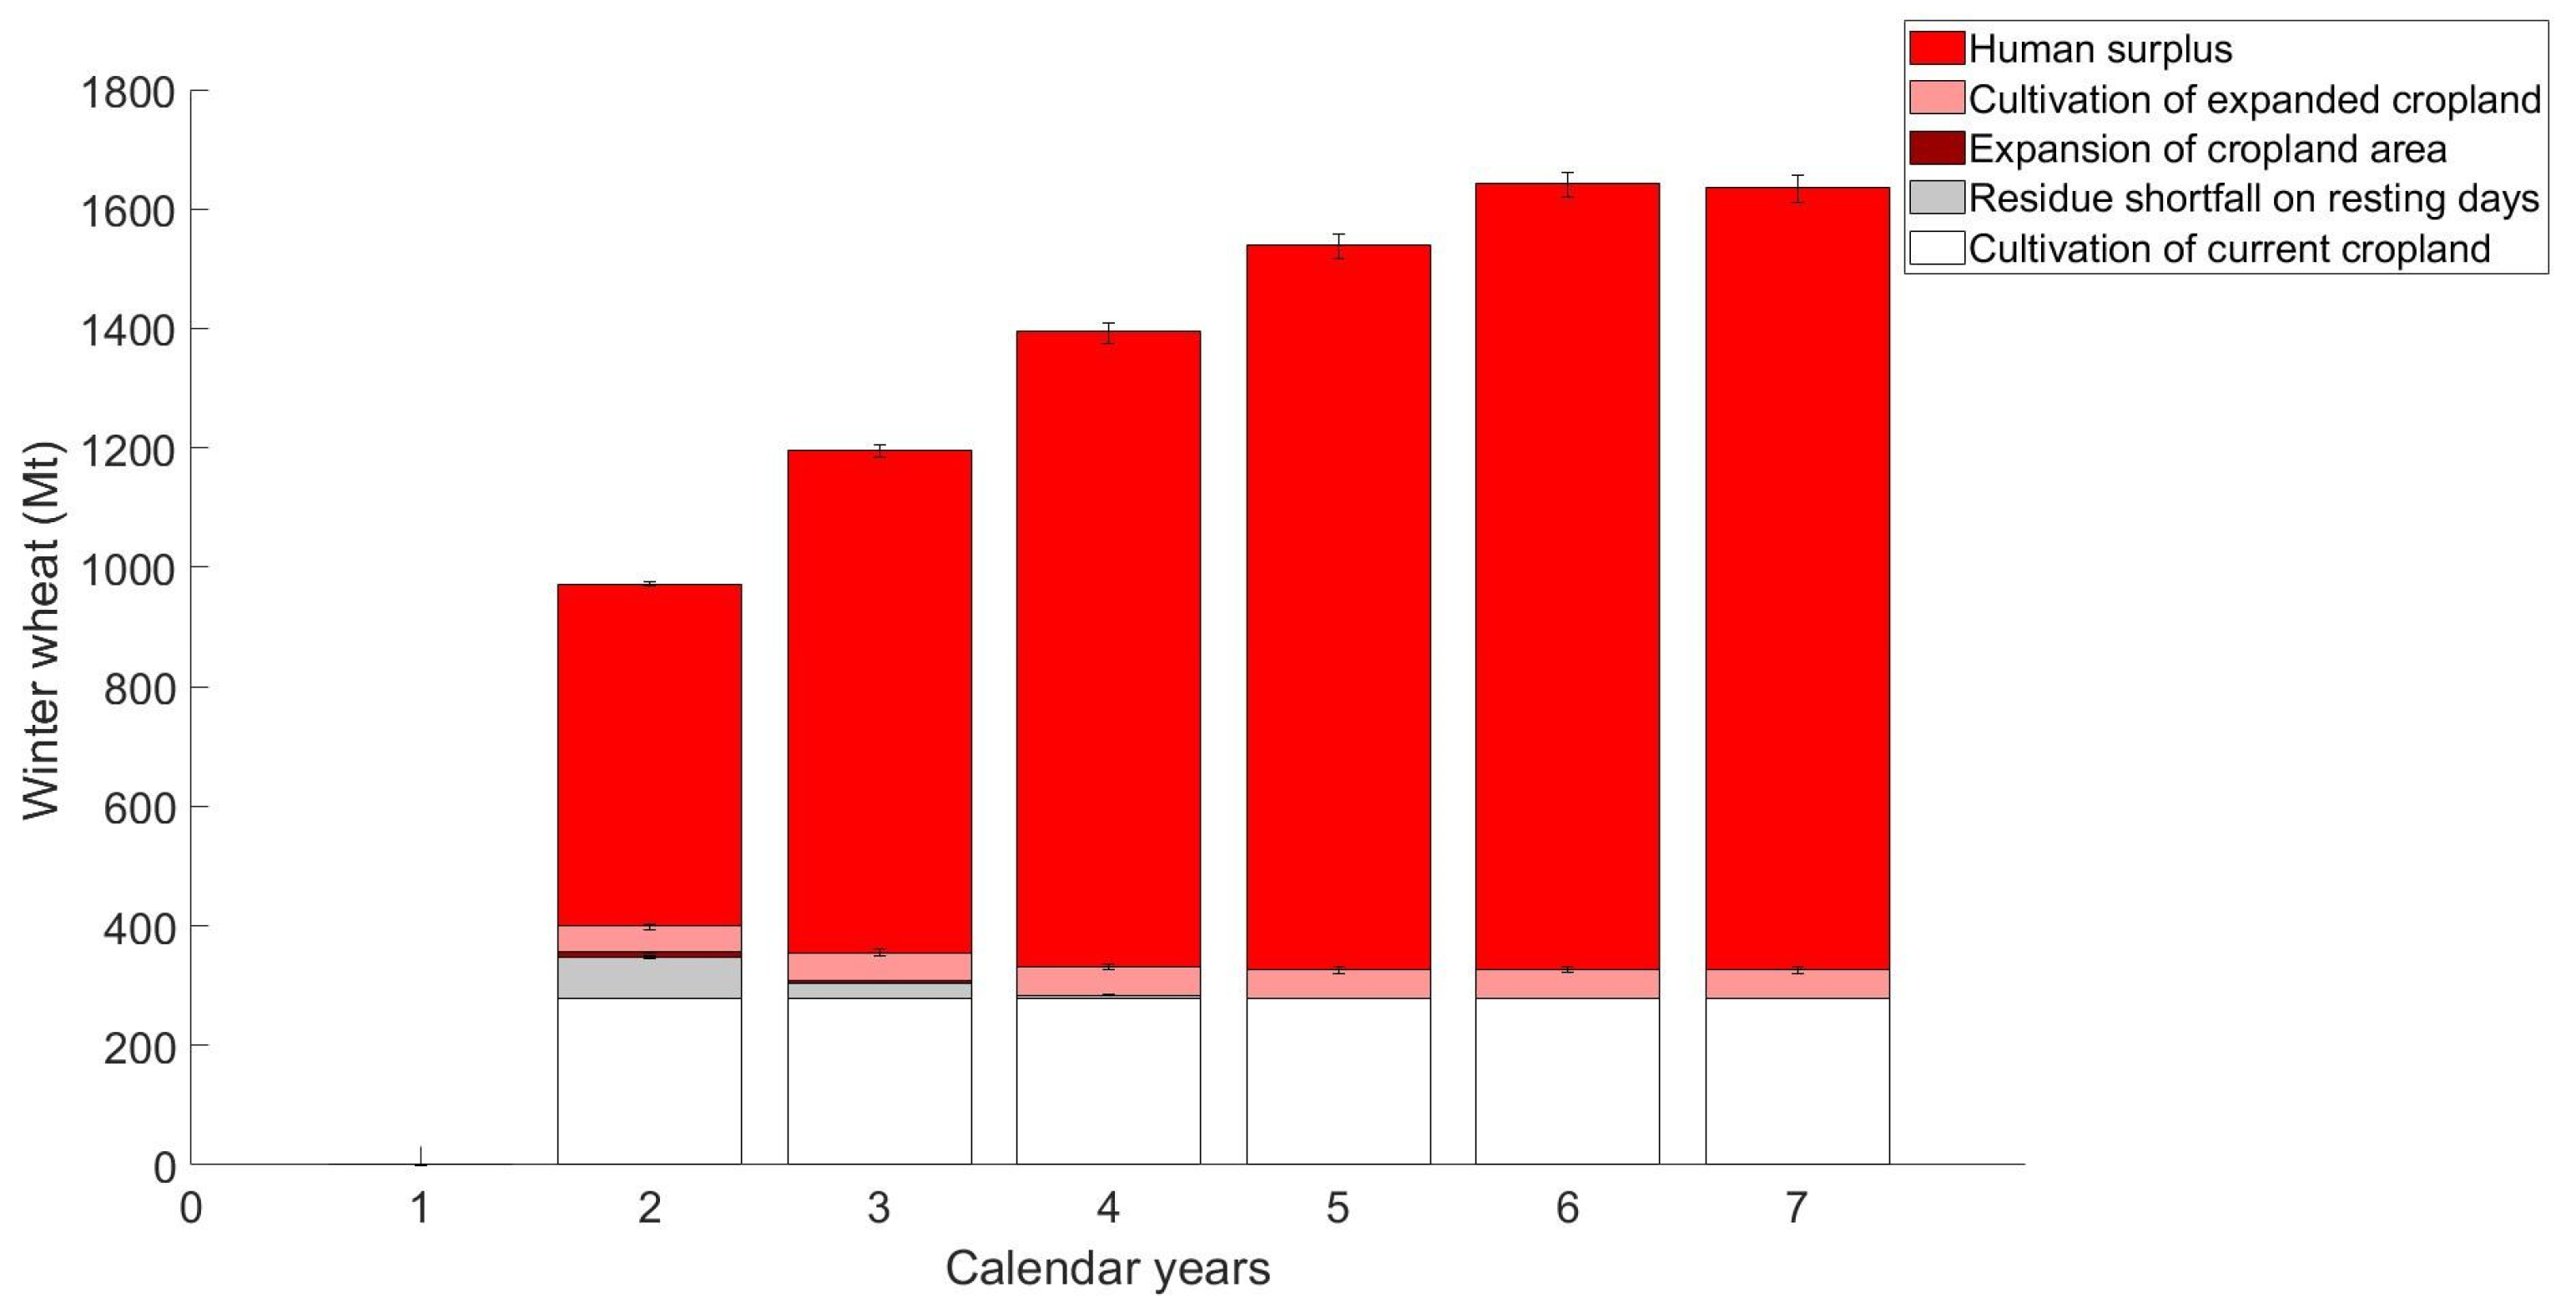
Figure 4 shows the global wheat animal demand and the surplus wheat used to meet human calorie requirements. The animal wheat demand is calculated in every country according to the annual work requirements of the draught animals working in a year; this includes the cultivation requirements, expansion requirements, and the wheat used to meet the crop residues’ shortfall (the residues are used to meet the animals’ maintenance needs throughout the year).
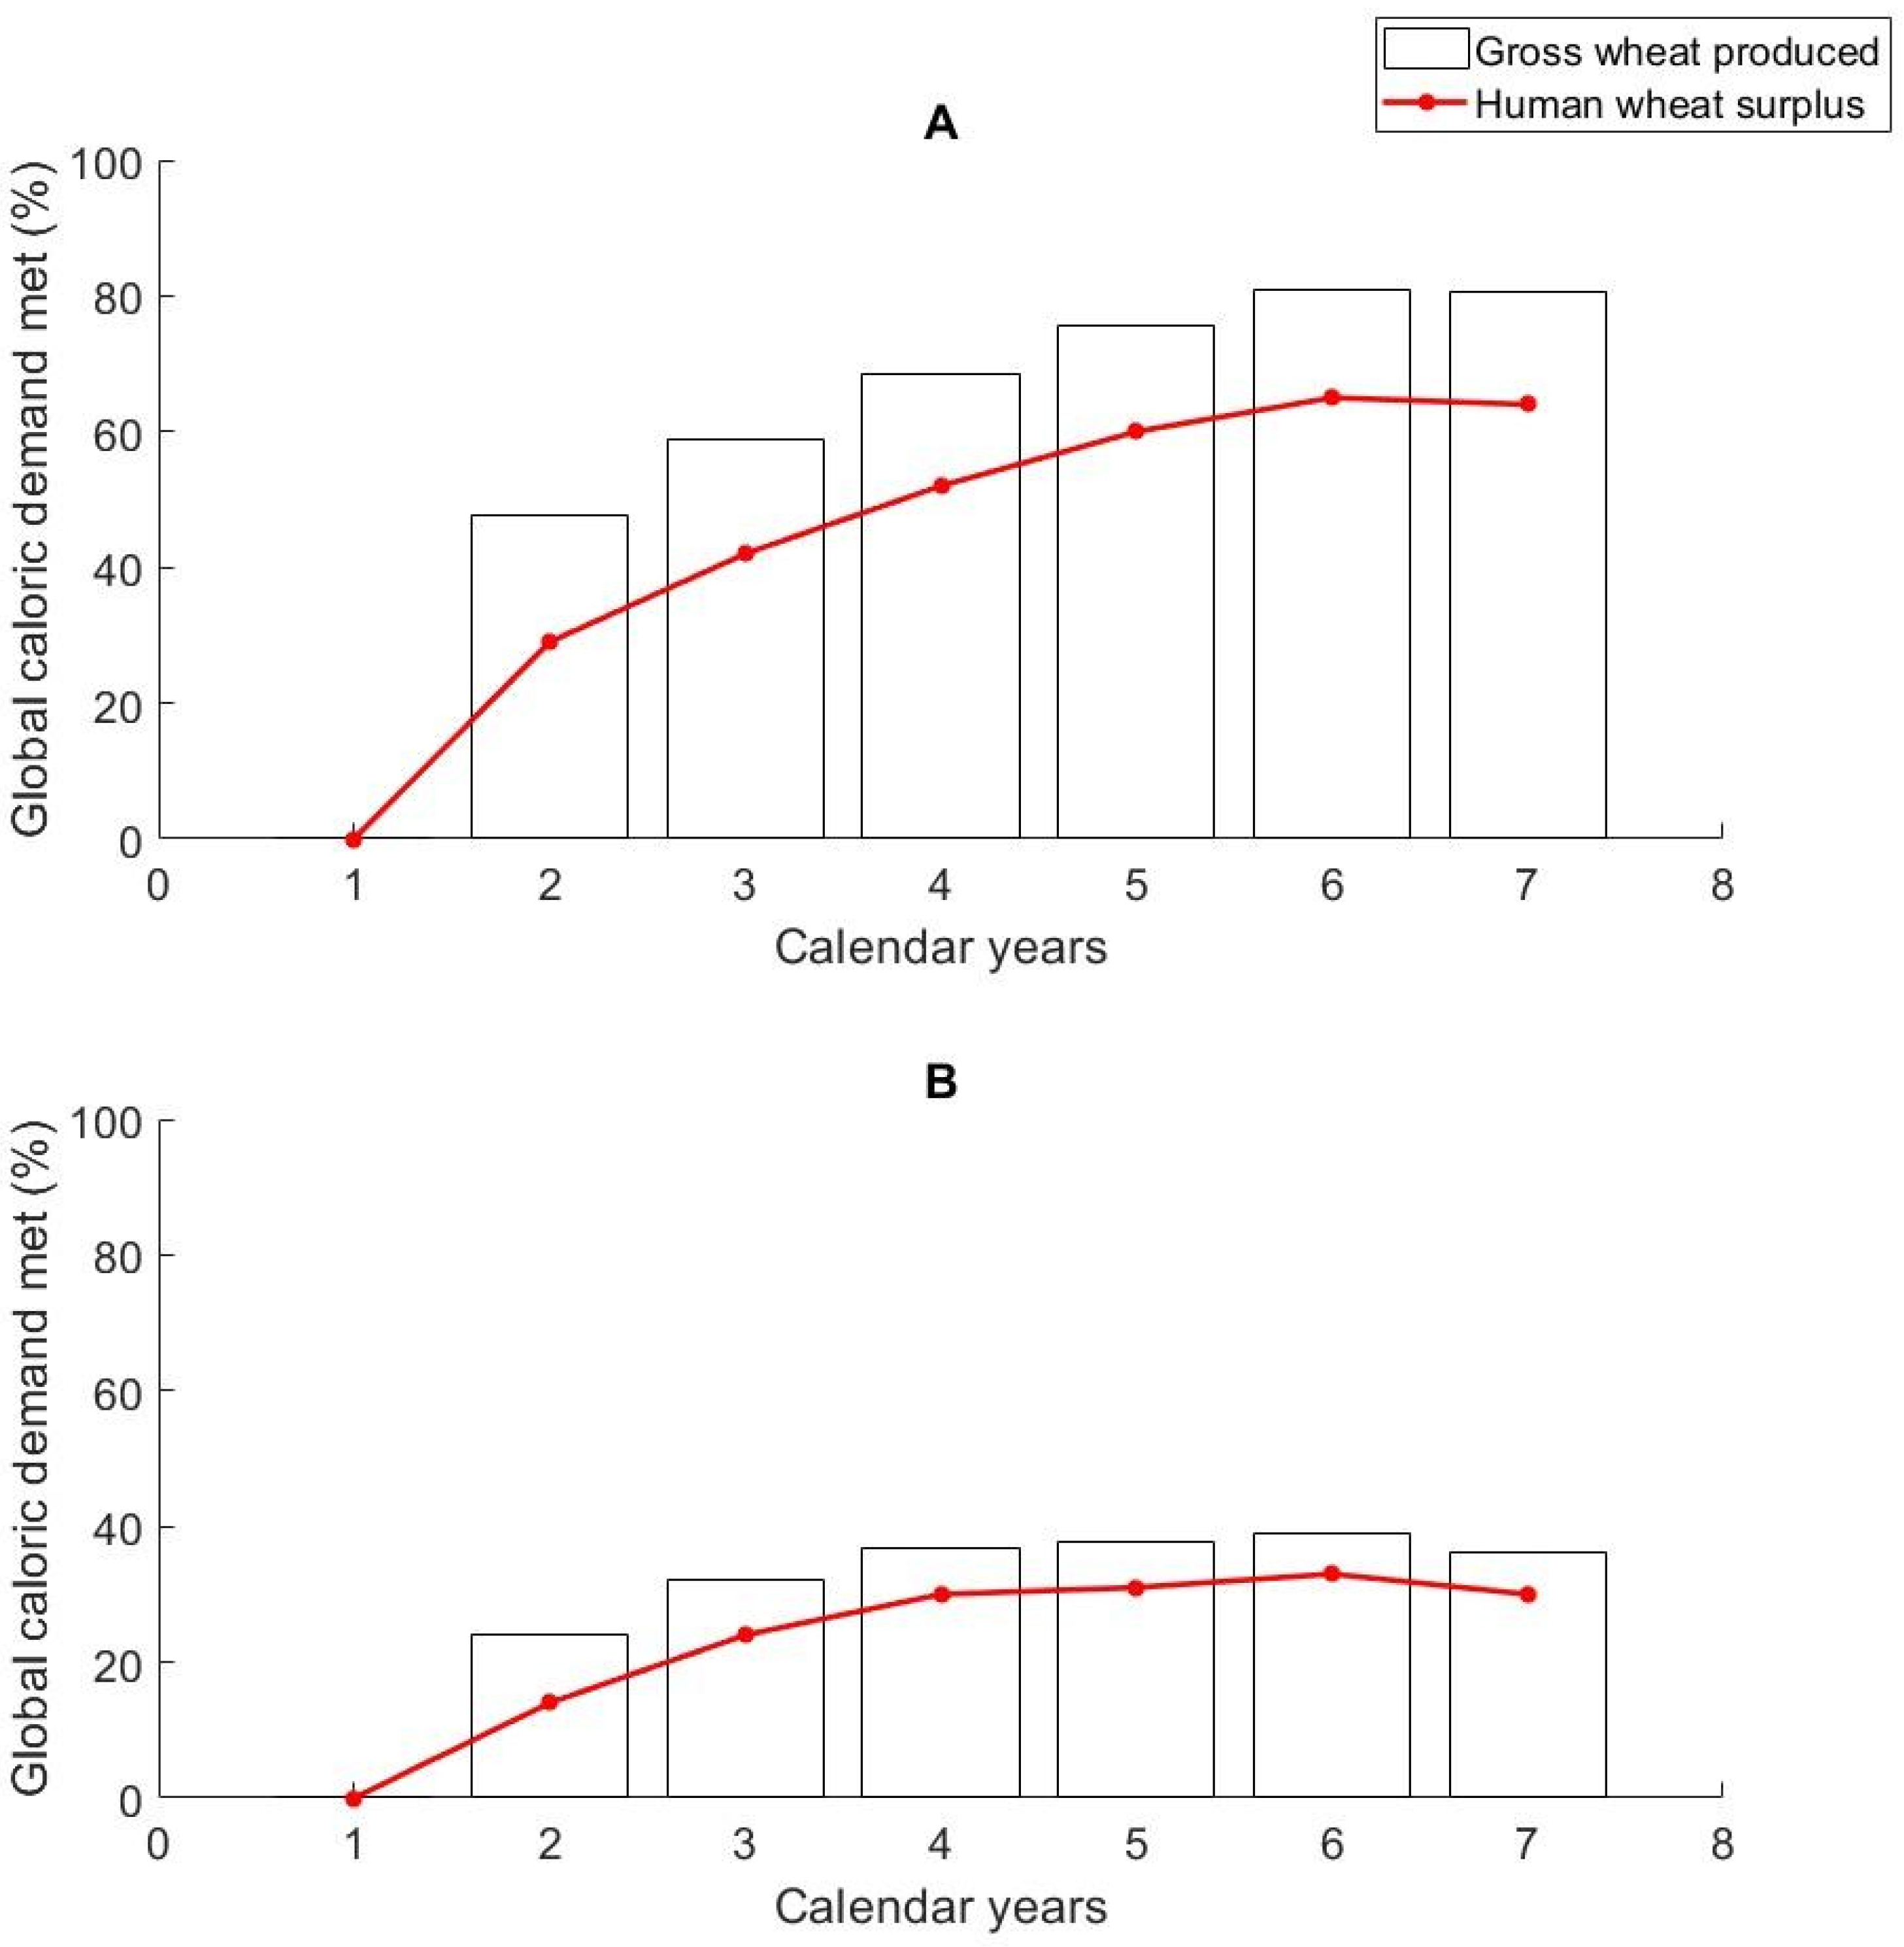
Figure 5 depicts the cumulative human calorie demand met by the human surplus wheat compared to the gross wheat production. Although the global gross wheat production is enough to cover the global animal wheat demand, the same does not apply to every country. In fact, most countries only start producing enough wheat to fully cover their animal requirements from the third year onwards, and the human and animal shortfall feed requirements would need to be met by either previously stored food or other resilient foods. The animal wheat needs are the largest in the first years of the catastrophe, when expansion is still happening and residue production is still limited. After expansion stops and once the wheat production ramps up, the animal wheat needs decrease, and the human surplus fraction increases. Two scenarios are considered, one where international trade is assumed to continue, and another where it is not, to assess the limitations of trade collapse. In the latter scenario, if the wheat available exceeds the country’s annual needs, the extra wheat is not included in the human demand met.
Figure 5A shows that even in a scenario of extreme climate conditions and industrial collapse, the gross wheat production is enough to meet over half of the global human calorie demand every year, with animal wheat demands causing less than a 20-percentage points reduction in demand met. However, when trade collapse is assumed and countries are restricted to their own production, gross wheat production cannot even meet half of the global human calorie demand (Figure 5B). This failure to meet requirements is further aggravated after feeding the animals, which causes a drop in food availability in the second and third years that is only improved once cropland expansion stops and wheat production increases. Still, the human surplus wheat in the fourth year meets little more than 30% of the global human calorie demand, with little improvement in the following years. In terms of calorie requirements fulfilled, this system’s gross wheat production is comparable to that of lignocellulosic sugar, synthetic fat and single-cell proteins produced in ASRS conditions [15], but weaker than other previously explored resilient foods when trade collapse is considered.

4. Discussion

4.1. Impact of a Combined ASRS-GCIL on Cultivable Land

The severity of an ASRS is proportional to the drop in food production, and a 150 Tg soot injection has the potential to cause a 90% reduction in food production [3,6], which can be further aggravated by an industrial collapse that would halt agricultural operations (e.g., fertiliser application and irrigation) and food trade [12]. Therefore, the 150 Tg soot injection was chosen to investigate the food system’s capacity to meet human calorie demand in the most extreme catastrophe the model could simulate. However, if the soot injection was smaller, results would have to be recalculated.
Previous research into agricultural resilience in catastrophes has shown that the Northern Hemisphere extratropical countries are the most affected by the temperature drop [6,16]; hence, Europe and North America have the least suitable area for the cultivation of winter wheat in a combined ASRS-GCIL scenario (less than 8% of the total suitable area). Conversely, South America, Asia, and Oceania have the most suitable area, with Brazil alone having 23% of the world’s suitable current cropland area, while Australia has 42% of the world’s suitable non-cropland area. The suitable current cropland area in India, Indonesia, and Thailand cumulatively accounts for 25% of the global area, highlighting that countries located in or close to the Southern Hemisphere have more area suitable for cultivation during this catastrophe, due to the less severe temperature reductions compared to the Northern Hemisphere. This is also evidenced by the fact that the countries in North America, Africa, and Europe with the most suitable area are located closer to the Equator (see Table S1 in the Supplementary Material).
Besides larger suitable areas, countries in tropical regions also show higher annual crop yields for both current cropland and non-cropland areas. Even countries with small suitable areas show annual yields larger than 1 ton per ha per year, but it should be noted that these crop yields are significantly lower compared to the ones achieved in baseline climate. However, since the catastrophe would trigger an extreme reduction in food production, expansion to non-cropland areas could be a solution to make up for the drop in cultivable area and yields, improving the overall agroecological resilience and countries’ self-sustaining ability in the face of catastrophes leading to international trade collapse.

4.2. Deployment of Draught Animal Power

Despite widespread mechanisation, some countries still default to draught animals as their primary power source in agriculture, either because of terrain constraints, low funds, lack of skill, poor access to maintenance services and/or oil prices [35,36]. Although the number of draught animals per area has decreased over time, animals today could be trained or led by farmers to be used in draught [12,25].
One potentially relevant example for the deployment of animal power is the experience of Cuba in the early 1990s, in which they did manage to expand their use of animal power significantly, and under the kind of conditions this paper considers. On the eve of the Soviet collapse, Cuba had the most mechanised agricultural sector in Latin America, with roughly 90,000 tractors, while the national oxen herd had dwindled to around 160,000 animals confined mainly to the small private smallholder sector [37]. When Soviet oil, spare parts, and credit disappeared after 1990, fuel imports fell by roughly three-quarters within three years. The majority of this tractor fleet was idled or operated only intermittently as a result, and the state was forced to adopt large-scale animal power for farming activities [38]. The oxen herd more than doubled to nearly 400,000 by 2000, with over 280,000 animals pressed into work in the first year of the transition alone [39]; male cattle were diverted from beef production into draft service, training programmes for ploughmen were revived, and implement manufacture restarted.
By the early 2000s, animal traction was supplying an estimated 38% of total farm energy [37,40], and the experience of Cuba does suggest that a large-scale expansion of animal power at short notice is possible, even in systems with a high level of mechanisation. However, the sector also experienced serious disruptions, with output declining by around 40% over the decade [41], driven by a decline in inputs and a contraction of the farmed area.
By utilising a variety of animals instead of focusing on specific draught animal species, the model promotes the cultivation and expansion of larger areas. Horses are heavier and have a more powerful draught than cattle but perform worse on heavy soils and have higher feed requirements [24,34,36]. In baseline conditions, using dairy cattle for both milk production and draught would double the animals’ feed requirements [35,42], but since a catastrophe incites the prioritisation of human needs over animals’, dairy cattle are exclusively used for draught alongside non-dairy cattle in this model. Although a steady-state of animal numbers is assumed, this would most likely not be the case in a combined ASRS-GCIL; the catastrophe also interferes with animal feed supply and limits their opportunities for continuous healthcare, causing a decline in animal populations that would be further aggravated by the redirection of existing food sources to humans. The results obtained by the model would need to be reevaluated if this decline was accounted for, and so this study only provides an optimistic upper-limit estimate. While it could be argued that a mixture of mechanised and draught power could be used, this study aims to assess the impact of draught power alone to simulate an extreme scenario in which mechanised power is either not restored or reserved for other operations.
As stated in Section 3.2, only 357 million animals in horse-equivalents globally are used for cultivation and expansion. Countries in North America have limited suitable areas, so they all have enough animals to meet their cultivation and expansion requirements. South America and Asia have the largest animal demands because they have the largest suitable areas for the cultivation of winter wheat, and their countries cumulatively meet 98 and 86% of their continents’ respective animal demand. France, Greece, Italy, and Portugal are the only European countries with area suitable for winter wheat cultivation in the catastrophe, and all, except for Greece, have animals to meet their lands’ animal demand. Africa and Oceania meet 80 and 15% of their respective animal demands; in the case of Oceania, Papua New Guinea and Australia’s animal demands exceed their animal stocks by factors of 7 and 37, respectively, with the same applying to nine African countries.
Except for Oceanic countries, all countries with suitable area have an added total of animals larger than their respective continents’ demands, but geographical constraints and trade collapse could prevent countries from fulfilling their respective animal demands. If animal trade was included, all non-Oceanic countries would be able to meet their requirements and cultivate their full suitable current cropland areas. However, the animal allocation displayed in Table 3 leaves 334 million animals in horse-equivalents in countries with suitable area, which could either be slaughtered for human consumption (thus increasing food availability) or used for other tasks, like the transportation of people and goods, but this is not demonstrated in this study. While it could be argued these extra animals could be put to work to expand larger areas, the number of animals should be proportional to the area they can cultivate, and the overallocation of animals to cropland expansion would incur higher feed requirements per hectare cleared, an undesirable outcome in a scenario where human survival is prioritised.
The global industrial collapse caused by the combined ASRS-GCIL would halt fuel production and trade, limiting nations to their above-ground fuel reserves, which would quickly deteriorate if not handled adequately. This could prove especially troublesome in import-dependent countries, where fuel usage would be controlled and restricted to the most crucial and urgent operations. Other sources of energy could be implemented, like natural gas, coal, or wood gas, to temporarily generate power, but the first two’s extraction would be affected by the industrial collapse, and the latter could take some time to be ramped up depending on each country’s capacity [43]. While power is not restored, draught animals could be trained in a month or two [12] and used to alleviate pressure to use mechanised equipment across all fields, including agriculture, preventing their culling for human consumption, and thus constituting a sustainable adaptation to agriculture during catastrophe.

4.3. Cultivable Current Cropland and Expanded Cropland Areas

The quantity of food produced is proportional to the area cultivated, so in a catastrophic scenario in which crop yields are lower, maximising area cultivated becomes crucial. Therefore, 280 million animals in horse-equivalents are allocated globally and 709 Mha of current cropland are cultivated every year. Of the animals allocated, 87% are in countries capable of meeting their full animal demand. Brazil and Argentina cultivate the first and third largest current cropland areas with 189 and 53 Mha, respectively, approximately 80% of current cropland cultivated in the continent. India and Indonesia are responsible for an added total of 170 Mha, making the Asian continent the one with the second largest cultivated current cropland area (see Table 4). All countries in North America meet their animal demand, with Mexico accounting for 44% of the current cropland cultivated in the continent and being the country with the sixth largest cultivated area. Although Oceania cumulatively cultivates the second smallest current cropland area, enough area is cultivated in to make it the continent with the fourth largest cultivated area at 28 Mha.
Of the 43 countries with animals allocated for cropland expansion, only 4 cannot meet their non-cropland animal demand. In the three years used for expansion, draught animals convert 123 Mha of non-cropland area, only 35% of the global non-cropland area suitable for cultivation in ASRS-GCIL. Depending on the hours per hectare spent by the animals (see Table 1), the area expanded can be 10% higher or lower. This highlights the debilitating effect of industry collapse on cropland expansion when compared to a previous study focusing solely on the effects of ASRS, in which the global area cleared with mechanised equipment varies between 698 and 1080 Mha, depending on whether global trade collapses or not [17]. The largest expansion occurs between the first and second months of the catastrophe, when the animal expansion fleet is at its most numerous and global cropland area is expanded by 41 Mha (min-max 36–47 Mha). The first 12 months see the greatest increase in cropland converted with 102 Mha (min–max 92–112 Mha), with all barren land and most of the herbaceous vegetation land already cleared. After three years of expansion, there are 13, 73, and 36 Mha (min–max 20–48 Mha) of respectively barren land, herbaceous vegetation land, and shrubland converted into cropland, which cumulatively represent 34% (min–max 30–37%) of the suitable non-cropland area in a combined ASRS-GCIL.
South America expands its continental area the most, with Brazil, Argentina, and Colombia having the largest expanded cropland areas at 22, 18, and 9.3 Mha, respectively. Africa is the continent with the second largest expanded area, with South Africa and Madagascar increasing their cropland availability by factors of 2.2 and 2, respectively, the largest in the world. Mexico and the United States have by far the largest expanded areas in North America, accounting respectively for 61 and 36% of the continent’s expanded area. The area expanded in Europe accounts for little more than 1% of the global expanded area, but it increases the available cropland area in the continent by 20%. The same does not apply to Oceania, in which the expanded cropland increases available cropland area by 2%. While the expanded cropland is not the largest, its existence improves a country’s capacity to produce food and prevent its population from starving amidst a catastrophe.

4.4. Production of Winter Wheat in a Combined ASRS-GCIL

Once the triggering event of the catastrophe happens, the winter wheat cultivation plan is put in motion as soon as possible. As newly converted cropland cannot immediately produce great amounts of food, the current cropland area simulated is not currently exclusively dedicated to winter wheat, and farmers would have very restricted access to learning tools to improve their knowledge about the crop, the inexperience factors are used as yield penalties in the first three calendar years of the catastrophe.
From the third calendar year onwards, the cultivated global current cropland area produces over 1 billion tons of winter wheat annually, with global production peaking in the sixth year (Figure 3). Since wheat production is proportional to area cultivated, South America, Asia and Africa are the predominant wheat producers, with average annual wheat outputs of 572, 351, and 119 Mt, respectively (see Table S2 in Supplementary Material). Brazil, India, and Argentina are the top wheat producers for every year the current cropland is cultivated, with Australia becoming the fourth largest wheat producer by the third calendar year. The global annual wheat yield in current cropland averaged over the seven years of the catastrophe is 1.4 t per ha, a 40% drop compared to wheat yields in baseline climate.
Although the current cropland area cultivated is nearly as large as the area used for primary cereal production in baseline climate [23], the 40% drop in annual wheat production compared to primary cereals demonstrates the detrimental effect of extreme climate and global industrial collapse on agriculture, especially when considering that trade is likely to not be restored and each country relies solely on its resources. On a smaller scale, the expanded cropland area produces over 200 Mt of winter wheat per year from the fourth calendar year onwards, peaking at the seventh year. Production from the expanded area stabilises around the fourth-year mark since most of the possible area has been expanded. The expanded area in countries in South America, Africa, and North America accounts for over 90% of the area’s annual production (see Table S3 in the Supplementary Material). Brazil and Argentina continue to be the top producers, but Peru, South Africa, and Madagascar experience the largest increments in annual production (all by a factor of 2) thanks to expanded cropland. Although the expanded area is significantly smaller than the cultivated current cropland area, its existence causes an increase in annual wheat production, consequently increasing the calorie needs met.

4.5. Meeting Animal Calorie Demand

There is currently 1.3 billion ha of land used for global cattle and buffalo feed, with only 70.7 Mha dedicated to growing cereal grains for these animals [33]. Assuming a yield of 3.63 t of wheat per ha in baseline conditions [44], these animals consume nearly 260 Mt of grain every year. Grass and crop residues are also used to supplement animals’ diets, but shocks to the animal feed supply chain would make it impossible to properly meet animal energy requirements. In addition, the use of draught animals in the combined ASRS-GCIL catastrophe increases animal energy requirements, making their grain and residue intake larger compared to baseline levels.
Animal feed demand in the first calendar year is assumed to be met with stocks from before the catastrophe, and the total animal wheat demand of each year is compared to the annual gross wheat production. Animals allocated to cultivation of current cropland consume nearly 280 Mt of wheat globally for every year the land is cultivated, making this the most demanding task due to the large area and number of draught animals working. In the second calendar year, 28% of the global gross wheat produced is used, but this steadily decreases to 17% by the seventh year as annual wheat production increases. Apart from 10 countries with net negative wheat production in the second calendar year, all countries demonstrate net positive wheat production from current cropland area in all years of the catastrophe.
Animals allocated to expand cropland consume a total of 57 Mt over three years, with demand being the highest in the first calendar year when the largest area is expanded (not represented in Figure 4 since the first-calendar-year requirements are met by pre-stored feed). The cultivation of the expanded area sets global annual demand to nearly 50 Mt over seven years, making it the second most demanding task. Only Nigeria, Pakistan, Vietnam, and the United States of America have one net negative year for wheat produced from the expanded area, presenting cropland expansion as a viable food source to increase food production and availability across the world in a catastrophic scenario.
Every ton of wheat produced produces 960 kg of wheat residues (stem, chaff, and leaves), which are used to meet animals’ maintenance energy requirements. In the second calendar year, the current and expanded global croplands produce nearly 970 Mt of wheat residues, but only 43% of the working animals have their maintenance energy needs met, and 70 Mt of the wheat (7% of the gross wheat produced) is used to meet the residue shortfall. As more area becomes available and wheat yields gradually increase, residue production increases enough to fulfil the maintenance energy needs of 71% and 99% of the working animals by the third and fifth calendar years, respectively. From the fifth calendar year onwards, the wheat used to meet the global residue shortfall does not exceed 200 million kg, making it less than 1% of the gross annual wheat production. The model assumes all wheat residues produced are fed to the animals, but if that was not the case, more wheat would need to be used to meet residue shortfall.
In total, the animals working during the second calendar year require 399 Mt of wheat, but since countries are restricted to their own wheat production, there are 22 countries in which the animal wheat requirements exceed the gross wheat production. In this case, either previously stored feed [12] or alternative feed sources, such as residues from growing mushrooms [45], tree leaves/twigs, or processed wood and paper pulp [46,47], need to be used to feed the animals, thus directing the winter wheat for human consumption. By the fourth calendar year, wheat production increases over time and the number of animals working stabilises, all wheat-producing countries produce enough wheat to fully meet their working animals’ demands, with the last two years requiring less than 20% of the gross global annual wheat production.

4.6. Meeting Human Calorie Demand

In total, global animal wheat demand over the course of seven years adds up to 2.4 billion tons (nearly 30% of the gross global wheat production), and the surplus wheat is used to meet human calorie demand (see Table S4 in Supplementary Material for human surplus wheat remaining after feeding the animals in each country). In this section, the capacity of both the gross production and human surplus wheat to meet human calorie requirements is assessed.
In Figure 5A, the calories produced by the global gross wheat production and the human surplus for each year are compared to the global human calorie requirements (assuming worldwide distribution of the gross food produced). Current and expanded cropland’s summed gross wheat production fulfils half of the global population’s calorie demand in the second year, and this steadily increases until 81% of global calorie demand is met in the seventh calendar year. However, there is a 16 percentage points drop in human calorie demand met when only the human surplus is considered, making this method’s capacity to meet global human calorie demand similar to hydrogen-based single-cell protein and synthetic fats produced from paraffin wax [15]. Due to the industrial collapse, less wheat is produced than in the ASRS-only scenario, limiting the fulfilment of the global calorie demand.
Since this model considers a total collapse of trade, regardless of the gross wheat production, each country’s focus is meeting its population’s calorie demand. Between the second and seventh calendar years, the global gross wheat production goes from meeting 24 to 36% of the global human calorie demand (as seen in Figure 5B), but only 6 to 12% of the population are in countries whose demand is fully met, mostly those closer to the Equator. When only the human wheat surplus is considered, global calorie demand met drops by 10 to 6 percentage points between the second and seventh calendar yields, with only 5 to 10% of the population in countries whose needs are fully met (see Table S5 in Supplementary Material for calorie demand met by country with surplus wheat for human consumption).
Previous research investigated the possibility of cultivating 3 billion ha of tropical land area in a combined ASRS-GCIL scenario. There was concern that the high UV levels would allow only certain varieties of wheat to be grown and that the global food requirement would not be met, at least in the first years of the catastrophe. As wheat variety multiplies and the climate recuperates, it becomes possible to feed the entire global population with the grain produced from that area by year 4 [48]. In the present study, more than 800 Mha of land is cultivated every year, but due to the reduced wheat yields caused by the combined effect of the extreme climate and industrial collapse, and the utilisation of draught animals over mechanised equipment, only a fraction of the global population would have its needs met without trade. If mechanised equipment were to be used, the land cultivated would be larger and wheat production would increase, and this could possibly be akin to the no-trade-scenario simulated in an ASRS-scenario [17]. However, as it stands now, the cultivation of current and expanded cropland for wheat production in a combined ASRS-GCIL performs worse than other resilient food systems, being the most helpful in a few select countries to meet their human calorie requirements.
In countries without area to cultivate in the catastrophe or where the human calorie needs are only partially met, other resilient foods would need to be developed in tandem to help meet the shortfall in calorie demand. It should be noted that most of the studies on resilient food systems assume global trade does not collapse, which plays a crucial role in alleviating regional imbalances and successfully mitigating starvation in a catastrophe. However, in an ASRS-GCIL, recovery of international trade would be difficult both technically and politically, so each country’s government should consider the implementation of this study’s reliant food system carefully.

5. Limitations and Future Work

5.1. Limitations of Crop Modelling

Our crop modelling has several limitations. In case of a catastrophe, farmers are likely to plant a mix of cold-tolerant cultivar and species to maximise land use and calorie output. Therefore, the single winter wheat cultivar simulated in this study as a proxy for cold-tolerant crops likely underestimates the calories delivered, but provides a realistic portfolio. Future work should focus on planting different crops to maximise calorie output and increase nutritional diversity for different levels of soot injection.
Methodologically, the Mink/DSSAT framework with the same set-up as in [16] is used, which carries the same caveats, such as the fact that DSSAT is applied outside its normal calibration range (cool temperatures, low light levels) and assumes farmers can plant during the optimal month each year. Pests and disease, ozone/UV-B effects, or organic nitrogen fertiliser application are not included in the simulation. Finally, the 80% global scaling used to match modelled wheat to current production (under present nitrogen inputs and planted area) is a coarse approach that likely conceals regional biases. The exclusion of the inexperience factors increases gross wheat production globally by 10% over seven years, but a further sensitivity analysis of this parameter constitutes future work.
Although there is no fertiliser application, the crop model simulations show there would still be a large area worth cultivating in an ASRS-GCIL. Wheat output could potentially be improved by using animal and human manures to fertilise crops. The human manure would need to be pasteurised, which could plausibly be done in large piles. The catastrophe would heavily impact the food supply system and animals’ diets, and therefore the composition of their manure and its impact on crop yields is unknown and would require further research.

5.2. Cropland Expansion Rates

There is some uncertainty regarding the cropland expansion aspect of this study; expansion tasks could require animals to work every day or at any given period throughout the year. This is an optimistic assumption, as there would be months where the harsh climate conditions would make working outdoors difficult, decreasing cropland expansion rates. Alternative land-clearing sequences were also not considered, and therefore the impact of land-clearing sequence on cropland expansion rates is recommended for future work, as well as drafting rewilding plans for the expanded area.
On a different note, expansion rates would improve if the animals allocated for the cultivation of current cropland participated in cropland expansion in the days when they are not required for cultivation. Although this would increase the expanded area, it would also increase the animals’ feed requirements, and as the first three years of ASRS are the most critical for crop production, it may be better to save as much of the wheat produced for human consumption, thus only feeding the animals for the minimum time required. Alternatively, animal labour requirements could be lessened if the land is cleared through controlled burning, but since not every non-cropland area would be in an appropriate region, its use is limited to clear shrubland areas due to the presence of vegetation.

5.3. Animal Data

5.3.1. Human Labour

The humans assigned to work with the animals are based on each country’s current working population, and any casualties caused by the catastrophe or by the changes in the food supply system are not considered in the model. This means that, depending on the triggering event of the catastrophe and the death rates, the cultivated and expanded areas can be smaller, thus decreasing wheat output. However, this also means fewer people would need to be fed.
Any changes in work capacity caused by changes in diet triggered by the catastrophe are also not considered, thus meaning that, depending on the populations’ health, an 8 h working-day could be either impossible or have a lower work output. Thus, future work should consider a dynamic population model and how it could match labour demand.

5.3.2. Animal Numbers

The number of animals is considered constant throughout the seven years of ASRS-GCIL, assuming births occur at a rate that allows for the replacement for animal deaths. Factors that may cause mass animal death, such as diseases, lack of veterinarian care, scarcity of feed to maintain the animals alive and the culling of animals for human consumption, are not considered, but all are likely to happen during a catastrophe. This, along with the lack of consideration for the climate’s impact on animals’ health and actual working hours, makes this scenario an optimistic assumption. Future work could investigate the impact of partial culling and reduced animal health on the model.
The number of dairy cows could have been underestimated since it was calculated based on annual milk production, and does not consider cows in small farms or owned by families. Similarly, there is uncertainty regarding the number of draught cattle that can be used, as it is assumed all male cattle would have the power of oxen and there are no differences between sex or age, which could factor into the work rates and energy and feed requirements.

5.3.3. Equipment and Animal Distribution

This study assumes there would be enough animal-drawn cultivation equipment to equip all the animals. Currently, animal-drawn equipment is more often found in developing countries. The mechanised equipment would need to be retrofitted into animal-drawn equivalents, but the feasibility of achieving this in a GCIL is unknown. Animal-drawn equipment could be fabricated from scratch from wood and metal scraps, but the capacity to do this would vary across the globe and depend on resource availability and skill, making this estimate an optimistic one. The time of production of animal-drawn equipment in these conditions is also unknown, but it would likely mean wheat production would be lower in the first years of the catastrophe.
Animals could be trained within a few months to do draught work [12], or people could guide the animals in draughting if farmers have limited training knowledge. Younger animals are easier to train, but even this could prove arduous if there are equipment restrictions. Future work should also include developing training plans for animals that are easily accessible in a catastrophe.
This study also does not consider the intricacies of mobilising animals, humans, and food during the catastrophe, which is why no cross-border animal trade is considered. Getting animals and humans to the places where they are needed could prove difficult if the places are remote. The best possibility would be recuperating international trade so countries would not be limited to their own wheat production, but the possibility of achieving this in a GCIL scenario with heavy geopolitical tensions at work is uncertain. Therefore, future work should focus on improving animal allocation within a country to maximise the cultivated area.

5.3.4. Animal Calorie Requirements

While the results show there would be enough feed produced globally to feed all the animals, some countries in the beginning of the catastrophe would not have enough wheat to meet animal energy requirements. Neighbouring countries could potentially supplement stocks of countries with smaller annual wheat outputs, but depending on the geographical distribution of the animals and the land cultivated, this could be an arduous task. Alternative feeds could be used to supplement animals’ rations and free as much of the produced wheat as possible for human consumption. Future work would investigate the impact of partially using some of the suitable cropland as pasture and of using other resilient foods’ residues to increase animal feed availability.

6. Conclusions

Expansion and the cultivation of cropland using animal draught works better as a sustainable food-providing system in a combined ASRS-GCIL scenario in countries located in tropical regions. Each country uses their own draught animal stocks to globally cultivate over 700 Mha of current cropland and expand cropland area by 123 Mha, and these areas are cultivated with winter wheat for seven calendar years after the catastrophe. Wheat production ramps up as the climate conditions improve and more area becomes available, exceeding the 1 billion tons per year by the third calendar year. Part of the wheat produced is fed to animals, with animal demand becoming smaller from the fourth year onwards as cropland expansion stops. Gross wheat production by the sixth year is enough to meet 80% of the global calorie demand, but since animals need to be fed and the trade of food among countries is not considered, the human surplus wheat can only feed 30% of the global population. Overall, this resilient food system is more suitable for countries in which net wheat produced is always positive (even in the most severe years of the catastrophe) and large enough to feed a significant portion of the population, therefore ensuring those countries’ food security. Future work would include uncertainty and sensitivity analyses for different input parameters (yield thresholds, equipment numbers, animal allocation within a country) and model parameters (manure input, dynamic modelling of animal and human populations, different land-clearing sequences, inexperience factors), the development of post-disaster recovery plans, and overcoming the additional stated limitations.

Supplementary Materials

The following supporting information can be downloaded at: https://www.mdpi.com/article/10.3390/su18136552/s1, Table S1: Number of animals used (in horse equivalents) and average area cultivated (in hectares) by country; Table S2: Gross wheat produced annually from current cropland in each country; Table S3: Gross wheat produced annually from expanded cropland in each country; Table S4: Human surplus wheat remaining after feeding the animals in each country; Table S5: Annual calorie demand met in each country by the human surplus wheat.

Author Contributions

Conceptualization, L.L.M. and D.D.; methodology, L.L.M., S.B. and D.D.; software, S.B.; formal analysis, L.L.M. and M.H.; investigation, L.L.M., M.H., S.B. and D.D.; resources, D.D.; data curation, S.B.; writing—original draft preparation, L.L.M., S.B. and D.D.; visualisation, L.L.M.; supervision, M.H. and D.D.; project administration, L.L.M. and D.D.; funding acquisition, L.L.M. and D.D. All authors have read and agreed to the published version of the manuscript.

Funding

This research was funded in part by the Alliance to Feed the Earth in Disasters (ALLFED). Luísa L. Monteiro was funded as a PhD student by the Department of Mechanical Engineering at the University of Canterbury.

Institutional Review Board Statement

Not applicable.

Informed Consent Statement

Not applicable.

Data Availability Statement

The original contributions presented in this study are included in the article/Supplementary Materials. Further inquiries can be directed to the corresponding authors.

Acknowledgments

The crop model is a product of IFPRI/CGIAR and ALLFED collaboration (https://github.com/allfed/mink—accessed on 30 April 2025). The authors would like to thank Ricky Robertson at IFPRI, Benjamin Poulter at NASA, Nicholas Lam, and Baxter Kamana-Williams.

Conflicts of Interest

The authors declare no conflicts of interest.

Abbreviations

The following abbreviations are used in this manuscript:
ALLFEDAlliance to Feed the Earth in Disasters
ASRSAbrupt-sunlight-reduction scenario
BBarren land
CCCurrent cropland
DEMDigital Elevation Model
DSSATDecision-Support System for Agrotechnology Transfer
EMPElectromagnetic pulse
FAOFood and Agriculture Organization
GCILGlobal catastrophic industry loss
HHerbaceous vegetation
haHectares
MhaMillion hectares
MtMillion tons
NASANational Aeronautics and Space Administration
SShrubland
SRTMShuttle Radar Topographic Mission
TgTeragrams
UVUltraviolet

Appendix A

Table A1. Energetic values of wheat and its residues for horses.
FeedGross Energy (kcal/kg)Digestible Energy (kcal/kg)References
Chaff 2476[49]
Leaves44602529[50]
Wheat43503715
Wheat straw44101341

References

  1. Ahvo, A.; Heino, M.; Sandström, V.; Chrisendo, D.; Jalava, M.; Kummu, M. Agricultural input shocks affect crop yields more in the high-yielding areas of the world. Nat. Food 2023, 4, 1037–1046. [Google Scholar] [CrossRef] [PubMed]
  2. Davis, K.F.; Downs, S.; Gephart, J.A. Towards food supply chain resilience to environmental shocks. Nat. Food 2021, 2, 54–65. [Google Scholar] [PubMed]
  3. Coupe, J.; Bardeen, C.G.; Robock, A.; Toon, O.B. Nuclear Winter Responses to Nuclear War Between the United States and Russia in the Whole Atmosphere Community Climate Model Version 4 and the Goddard Institute for Space Studies ModelE. J. Geophys. Res. Atmos. 2019, 124, 8522–8543. [Google Scholar] [CrossRef]
  4. Robock, A. Nuclear winter. Wiley Interdiscip. Rev. Clim. Change 2010, 1, 418–427. [Google Scholar] [CrossRef]
  5. Jägermeyr, J.; Robock, A.; Elliott, J.; Müller, C.; Xia, L.; Khabarov, N.; Folberth, C.; Schmid, E.; Liu, W.; Zabel, F.; et al. A regional nuclear conflict would compromise global food security. Proc. Natl. Acad. Sci. USA 2020, 117, 7071–7081. [Google Scholar] [CrossRef] [PubMed]
  6. Xia, L.; Robock, A.; Scherrer, K.; Harrison, C.S.; Bodirsky, B.L.; Weindl, I.; Jägermeyr, J.; Bardeen, C.G.; Toon, O.B.; Heneghan, R. Global food insecurity and famine from reduced crop, marine fishery and livestock production due to climate disruption from nuclear war soot injection. Nat. Food 2022, 3, 586–596. [Google Scholar] [CrossRef] [PubMed]
  7. Oak Ridge National Laboratory. Electromagnetic Pulse: Effects on the U.S. Power Grid; Oak Ridge National Laboratory: Oak Ridge, TN, USA, 2010; p. 6. [Google Scholar]
  8. Foster, J.S., Jr.; Gjelde, E.; Graham, W.R.; Hermann, R.J.; Kluepfel, H.M.; Lawson, R.L.; Soper, G.K.; Wood, L.L., Jr.; Woodard, J.B. Report of the Commission to Assess the Threat to the United States from Electromagnetic Pulse (EMP) Attack: Critical National Infrastructures; Commission to Assess the Threat to the United States from Electromagnetic Pulse (EMP) Attack: McLean, VA, USA, 2008.
  9. Bernstein, A.; Bienstock, D.; Hay, D.; Uzunoglu, M.; Zussman, G. Sensitivity analysis of the power grid vulnerability to large-scale cascading failures. ACM SIGMETRICS Perform. Eval. Rev. 2012, 40, 33–37. [Google Scholar] [CrossRef]
  10. Blouin, S.; Jehn, F.U.; Denkenberger, D. Global Industrial Disruption Following Nuclear War. arXiv 2024. [Google Scholar] [CrossRef]
  11. Kinney, R.; Crucitti, P.; Albert, R.; Latora, V. Modeling cascading failures in the North American power grid. Eur. Phys. J. B-Condens. Matter Complex Syst. 2005, 46, 101–107. [Google Scholar] [CrossRef]
  12. Moersdorf, J.; Rivers, M.; Denkenberger, D.; Breuer, L.; Jehn, F.U. The Fragile State of Industrial Agriculture: Estimating Crop Yield Reductions in a Global Catastrophic Infrastructure Loss Scenario. Glob. Chall. 2024, 8, 2300206. [Google Scholar] [PubMed]
  13. Wescombe, N.J.; Martínez, J.G.; Jehn, F.U.; Wunderling, N.; Tzachor, A.; Sandström, V.; Cassidy, M.; Ainsworth, R.; Denkenberger, D. It’s time to consider global catastrophic food failures. Glob. Food Secur. 2025, 46, 100880. [Google Scholar] [CrossRef]
  14. De Haen, H.; Hemrich, G. The economics of natural disasters: Implications and challenges for food security. Agric. Econ. 2007, 37, 31–45. [Google Scholar] [CrossRef]
  15. Martinez, J.B.G.; Behr, J.; Denkenberger, D.C. Food without agriculture: Food from CO2, biomass and hydrocarbons to secure humanity’s food supply against global catastrophe. Trends Food Sci. Technol. 2024, 150, 104609. [Google Scholar]
  16. Blouin, S.; Rivers, M.; Hinge, M.; Antonietta, M.; Jimenez, I.; Jehn, F.U.; Denkenberger, D.C. Strategic Crop Relocation Could Substantially Mitigate Nuclear Winter Yield Losses. arXiv 2025. [Google Scholar] [CrossRef]
  17. Monteiro, L.L.; Hinge, M.; Blouin, S.; Rivers, M.; van der Walt, J.D.; Denkenberger, D. Expansion of Cropland Area during an Abrupt Sunlight Reduction Scenario. arXiv 2026. [Google Scholar] [CrossRef]
  18. Robertson, R.D. Mink: Details of a Global Gridded Crop Modeling System; International Food Policy Research Institute (IFPRI): Washington, DC, USA, 2017. [Google Scholar]
  19. Plastina, A.; Edwards, W. Proven Yields and Insurance Units for Crop Insurance. Available online: https://www.extension.iastate.edu/agdm/crops/html/a1-55.html (accessed on 30 September 2025).
  20. Müller, C.; Elliott, J.; Kelly, D.; Arneth, A.; Balkovic, J.; Ciais, P.; Deryng, D.; Folberth, C.; Hoek, S.; Izaurralde, R.C.; et al. The Global Gridded Crop Model Intercomparison phase 1 simulation dataset. Sci. Data 2019, 6, 50. [Google Scholar] [CrossRef] [PubMed]
  21. SRTM 90m DEM Digital Elevation Database. Available online: https://srtm.csi.cgiar.org/ (accessed on 5 April 2025).
  22. Donovan, M. Temporal and Spatial Trends in Livestock on Slopes Across New Zealand; No. 2023/03; Ministry for Primary Industries (Manatū Ahu Matua): Wellington, New Zealand, 2022.
  23. FAO. FAOSTAT: Crops and Livestock Products. Available online: https://www.fao.org/faostat/en/#data/QCL (accessed on 1 December 2025).
  24. Smil, V. Energy and Civilization: A History; MIT Press: Cambridge, MA, USA, 2018. [Google Scholar]
  25. Zhou, X.; Ma, W.; Li, G. Draft Animals, Farm Machines and Sustainable Agricultural Production: Insight from China. Sustainability 2018, 10, 3015. [Google Scholar] [CrossRef]
  26. Mengjie, W.; Yi, D. The Importance of Work Animals in Rural China. Available online: https://www.fao.org/4/W0613T/w0613T0p.htm (accessed on 3 January 2026).
  27. The Main Components of Yield in Wheat. Available online: https://ahdb.org.uk/knowledge-library/the-main-components-of-yield-in-wheat (accessed on 1 May 2025).
  28. United Nations. World Urbanization Prospects 2025: Summary of Results; No. UN DESA/POP/2025/TR/NO. 12; United Nations, Department of Economic and Social Affairs, Population Division: New York, NY, USA, 2025.
  29. FAO. FAO Food Balance Sheets: A Handbook; Food and Agriculture Organization of the United Nations: Rome, Italy, 2001. [Google Scholar]
  30. WHO. Food and Nutrition Needs in Emergencies; World Health Organization: Geneva, Switzerland, 2004. [Google Scholar]
  31. Godfray, H.C.J.; Beddington, J.R.; Crute, I.R.; Haddad, L.; Lawrence, D.; Muir, J.F.; Pretty, J.; Robinson, S.; Thomas, S.M.; Toulmin, C. Food security: The challenge of feeding 9 billion people. Science 2010, 327, 812–818. [Google Scholar] [CrossRef] [PubMed]
  32. Dijkman, J.T.; Lawrence, P.R. The energy expenditure of cattle and buffaloes walking and working in different soil conditions. J. Agric. Sci. 1997, 128, 95–103. [Google Scholar] [CrossRef]
  33. Mottet, A.; de Haan, C.; Falcucci, A.; Tempio, G.; Opio, C.; Gerber, P. Livestock: On our plates or eating at our table? A new analysis of the feed/food debate. Glob. Food Secur. 2017, 14, 1–8. [Google Scholar] [CrossRef]
  34. Pearson, R.A. Resource requirements for draught animal power. BSAP Occas. Publ. 1993, 16, 57–67. [Google Scholar] [CrossRef][Green Version]
  35. Copland, J.W. (Ed.) Draught Animal Power for Production: Proceedings; Australian Centre for International Agricultural Research: Canberra, Australia, 1987.
  36. Mota-Rojas, D.; Braghieri, A.; Álvarez-Macías, A.; Serrapica, F.; Ramírez-Bribiesca, E.; Cruz-Monterrosa, R.; Masucci, F.; Mora-Medina, P.; Napolitano, F. The use of draught animals in rural labour. Animals 2021, 11, 2683. [Google Scholar] [CrossRef] [PubMed]
  37. Ríos, A.; Cárdenas, J. Animal Traction in Cuba: An Historical Perspective; Instituto de Investigaciones de Mecanización Agropecuaria (IIMA): La Habana, Cuba, 1994. [Google Scholar]
  38. Starkey, P.; Sims, B. Animal traction in Cuba: An overview of survey results, issues and opportunities. In La Tracción Animal en Cuba: Situation, Needs and Potential; Instituto de Investigaciones de Mecanización Agropecuaria (IIMA): La Habana, Cuba, 2003. [Google Scholar]
  39. Funes, F. (Ed.) Sustainable Agriculture and Resistance: Transforming Food Production in Cuba; Food First Books: Oakland, CA, USA, 2002. [Google Scholar]
  40. Ríos, A. Improving Animal Traction Technology in Cuba. In Improving Animal Traction Technology: Meeting the Challenges of the Future; Technical Centre for Agricultural and Rural Cooperation (CTA): Wageningen, The Netherlands, 1995. [Google Scholar]
  41. Alvarez, J. Cuba’s Agricultural Sector; University Press of Florida: Gainesville, FL, USA, 2004. [Google Scholar]
  42. Matthewman, R.W. Role and potential of draught cows in tropical farming systems: A review. Trop. Anim. Health Prod. 1987, 19, 215–222. [Google Scholar] [CrossRef] [PubMed]
  43. Nelson, D.; Turchin, A.; Denkenberger, D. Wood Gasification: A Promising Strategy to Extend Fuel Reserves after Global Catastrophic Electricity Loss. Biomass 2024, 4, 610–624. [Google Scholar] [CrossRef]
  44. Global Wheat Production from 2000/01 to 2025/26. Available online: https://www.statista.com/statistics/267268/production-of-wheat-worldwide-since-1990/ (accessed on 6 May 2026).
  45. Spinosa, R.; Stamets, P.; Running, M. Fungi and sustainability. Fungi 2008, 1, 38–40. [Google Scholar]
  46. Omar, J.A. Utilization of corrugated cardboard in fattening rations of Awassi lambs. Small Rumin. Res. 2001, 42, 167–170. [Google Scholar] [CrossRef]
  47. Peavy, A.; Harris, B.; Van Horn, H.; Wilcox, C. Complete Rations for Dairy Cattle. IX. Effects of Percent Ground Corrugated Boxes and Citrus Molasses Solubles-Soybean Millfeed Product on Milk Production and Ration Digestibility. J. Dairy Sci. 1980, 63, 405–411. [Google Scholar] [CrossRef]
  48. Denkenberger, D.C.; Cole, D.D.; Abdelkhaliq, M.; Griswold, M.; Hundley, A.B.; Pearce, J.M. Feeding everyone if the sun is obscured and industry is disabled. Int. J. Disaster Risk Reduct. 2017, 21, 284–290. [Google Scholar] [CrossRef]
  49. Golden Horse Feeds Lucerne Chaff 20kg. Available online: https://store.nzfarmsource.co.nz/catalog/golden-horse-feeds-lucerne-chaff-20kg/246350?srsltid=AfmBOor0EbLi6-CXNZ3XkHYZVKns_S7o0u93ACK79R9WRRfiIZkyi6TU (accessed on 7 June 2025).
  50. Heuzé, V.; Tran, G.; Bastianelli, D.; Archimede, H.; Sauvant, D. Feedipedia: An Open Access International Encyclopedia on Feed Resources for Farm Animals. In Book of Abstracts of the 64th Annual Meeting of the European Association for Animal Production, Nantes, France, 26–30 August 2013, 1st ed.; Wageningen Academic Publishers: Wageningen, The Netherlands, 2013; p. 269. [Google Scholar]
Figure 1. Current cropland and non-cropland areas suitable for cultivation of winter wheat in a combined abrupt-sunlight-reduction and global-catastrophic-industry-loss scenarios, according to land cover type and continent.
Sustainability 18 06552 g001
Figure 2. Average area cleared as a function of time. The shaded areas correspond to variability caused by task productivity.
Sustainability 18 06552 g002
Figure 3. Annual average wheat production from current cropland and expanded cropland in million tons (Mt). The error bars correspond to variability caused by task productivity.
Sustainability 18 06552 g003
Figure 4. Global quantity of wheat required by working animals in a combined abrupt-sunlight-reduction and global-catastrophic-industry-loss scenario, discriminated by type of work done and land type. The error bars correspond to variability caused by task productivity. It should be noted that this figure only applies to average global demand, and is not presented on a country-level basis.
Sustainability 18 06552 g004
Figure 5. Human calorie demand met by the total and remaining quantities of wheat produced annually with international trade (A) and without international trade (B).
Sustainability 18 06552 g005
Table 1. Labour requirements of techniques employed in cropland cultivation and expansion [24].
TaskUsed inPeople/AnimalsHours per Hectare
MinimumMedianMaximum
Controlled burningExpansion 0.120.300.60
MowingExpansion1/-334250
HoeingExpansion1/-100110120
PloughingCultivation1/2405060
Expansion1/2120150180
HarrowingCultivation1/261320
Expansion1/2183960
Seed drillingCultivation1/2678
Table 2. Basis of calculation for the resource availability analysis.
VariableValueUnitReference
World population 17.9billion people[28]
Calorie content of dry carbohydrate3340kcal per kg DM[29]
Expected food waste 212% of calories produced
Average daily calorie requirement2100kcal/person/day[30]
1 The world population number used corresponds to the sum of the populations of the countries modelled in the Mink crop model. 2 Some amount of food waste throughout the system is unavoidable, regardless of food crisis severity. However, a reasonably low value of food waste, 12%, was considered in the proposed scenario. This value was chosen because food waste is expected to be lower than the current value of 35% for post-harvest losses [31] due to increased food scarcity [15].
Table 3. Animal demand for cultivation of land and actual number of animals allocated for cultivation (in millions of horse-equivalents).
ContinentAnimals Required to CultivateAnimals Allocated to
Current CroplandNon-CroplandCurrent CroplandNon-Cropland
Africa44133511
Asia1033.9892.6
Europe2.60.62.50.5
North America20102010
Oceania2359120.2
South America1225412252
Total31514028077
Table 4. Current cropland and non-cropland areas suitable for cultivation in a combined abrupt-sunlight-reduction and global-catastrophic-industry-loss scenarios and areas effectively cultivated.
ContinentTotal Suitable AreaTotal Area Cultivated
Current CroplandNon-CroplandCurrent CroplandNon-Cropland
Africa112348826
Asia260102256.2
Europe6.71.56.31.3
North America51255113
Oceania58149310.5
South America31013730976
Total798356709123
Disclaimer/Publisher’s Note: The statements, opinions and data contained in all publications are solely those of the individual author(s) and contributor(s) and not of MDPI and/or the editor(s). MDPI and/or the editor(s) disclaim responsibility for any injury to people or property resulting from any ideas, methods, instructions or products referred to in the content.