1. Introduction
Greenhouse gases create a natural greenhouse effect by trapping heat near the Earth’s surface [
1]. Human activities, primarily the combustion of fossil fuels, have significantly increased their atmospheric concentrations [
2]. Carbon dioxide among greenhouse gases remains central to the discussion on climate change [
3]. Its anthropogenic emissions are orders of magnitude higher than those of other greenhouse gases, and its atmospheric lifetime extends over millennia [
4]. Oceans and terrestrial ecosystems absorb approximately half of these emissions, while the remainder accumulates in the atmosphere, thereby intensifying the greenhouse effect [
5].
Current CO
2-utilization technologies aim to transform carbon dioxide from a waste product into a valuable resource [
6]. Among chemical CO
2-utilization methods, several approaches have been developed. Thermal catalytic hydrogenation is one of the most extensively studied techniques, enabling the production of methanol, methane, and liquid hydrocarbons from CO
2 using various catalysts [
7]. Dry reforming of methane converts CH
4 and CO
2 into synthesis gas, which can be used as an energy source [
8]. Electrochemical reduction allows for CO
2 capture and its conversion into valuable chemicals and fuels [
9]. Mineral carbonation is aimed at binding CO
2 with calcium and magnesium oxides derived from natural minerals or industrial waste, resulting in the formation of stable carbonates suitable for use in the construction industry [
10].
In addition to chemical approaches, biological methods for carbon dioxide utilization have been developed, based on the ability of living systems to assimilate CO
2 while producing valuable products. Microalgae exhibit high rates of CO
2 assimilation while simultaneously accumulating biomass for animal feed and biofuel production [
11,
12]. Enzymatic methods employing carbonic anhydrase enable the conversion of CO
2 into biohydrogen and volatile fatty acids [
13,
14].
Photosynthetic microorganisms are considered as a promising tool for reducing atmospheric CO
2 concentrations due to their efficient carbon fixation capacity and ability to convert CO
2 into organic biomass [
15]. A key advantage of these organisms is their high productivity, which exceeds that of terrestrial plants by a factor of five [
16]. Photosynthetic microorganisms accumulate proteins, lipids, carbohydrates, and pigments, making them suitable for the production of feed additives for livestock and aquaculture, as well as biofertilizers and biofuels [
17]. Furthermore, these microorganisms can be cultivated on non-arable land, in seawater, or wastewater, thus avoiding competition with agricultural crops for arable land and freshwater resources [
18]. However, the application of photosynthetic microorganisms is associated with several significant limitations. High CO
2 concentrations (above 5%), typical for flue gases, can inhibit microbial growth [
19]. The high cost of cultivation remains a serious challenge and represents a major obstacle to industrial implementation [
20]. A life-cycle assessment of indirect CO
2 emissions during microalgae cultivation at an industrial facility indicates that the process carbon footprint is substantial [
21].
Arthrospira platensis (according to recent taxonomy,
Limnospira platensis, commercially referred to as spirulina) is a cyanobacterium that, owing to its unique biochemical composition, represents a valuable product for functional nutrition [
22]. Its cells contain high amounts of proteins, including all essential amino acids, as well as a rich complex of vitamins, minerals, essential fatty acids, chlorophyll, and phycocyanin [
23]. This unique composition accounts for the considerable industrial interest in
A. platensis, with global production of
Arthrospira sp. estimated at approximately 12.000 tons of dry biomass per year [
24]. According to a market analysis, more than 45% of global spirulina consumption is attributed to dietary supplements, approximately 25% to functional foods, nearly 20% to animal feed and aquaculture, and about 10% to cosmetics and pharmaceuticals [
25].
Beyond these commercial applications,
Arthrospira platensis possesses a high CO
2-fixation capacity, making it a promising biological platform for carbon capture and utilization. Unlike chemical methods, which remain economically challenging, the co-utilization strategy—integrating CO
2 assimilation with biomass production for feed, food, or fertilizer—can offset capture costs through product sales. In [
26] it was shown, that Spirulina biomass produced from CO
2 can become cost-competitive under optimized conditions. A techno-economic analysis using the marginal abatement cost (MAC) approach further confirmed that a polygeneration system co-producing biomethane, Spirulina powder for food, and biofertilizer achieves a negative MAC, with a net present value exceeding €11.5 million and an internal rate of return above 40% at a 3 MW scale [
27]. These data demonstrate that coupling CO
2 biofixation with the production of high-value Spirulina biomass provides an economically viable pathway for industrial implementation.
Industrial cultivation of
Arthrospira platensis is carried out in two fundamentally different types of systems—open and closed—with the choice between them determined by the intended product application, economic considerations, and regional climatic conditions [
28]. The advantages of open systems are primarily economic. Open ponds are preferred for large-scale commercial cultivation due to their low capital costs and ease of operation [
29]. Disadvantages of open systems include the risk of contamination by alien microorganisms, significant fluctuations in temperature and pH, as well as unintended dilution due to precipitation, all of which negatively affect culture quality and productivity. Moreover, open systems are characterized by low light-utilization efficiency, water loss through evaporation, and dependence on weather conditions [
30,
31].
Closed photobioreactors have been developed to overcome the limitations of open systems. The advantages of closed systems include the ability to precisely control temperature, pH, CO
2 concentration, and illumination intensity; significantly higher biomass productivity; minimal risk of contamination; and reduced land requirements owing to the possibility of vertical arrangement [
32,
33]. The main disadvantage of closed photobioreactors remains their high construction and operational costs. Other limitations include the risk of culture overheating, biofouling of internal surfaces, decreased light transmittance of materials over time, and the need to remove oxygen accumulated during photosynthesis [
34,
35].
Recent studies have focused primarily on determining optimal gas environment parameters, adapting strains to high carbon dioxide concentrations, and developing technological solutions to enhance CO
2 utilization efficiency. Experimental findings concerning the response of spirulina to elevated CO
2 concentrations in gas mixtures are rather heterogeneous. For instance, a study on three spirulina strains cultivated in cylindrical photobioreactors established that the highest productivity and CO
2 fixation rates were achieved at a CO
2 concentration of 10% [
36]. According to another study,
Arthrospira platensis exhibits good growth performance at CO
2 concentrations of 1% and 5%, whereas at 9% CO
2, massive cell death occurs [
37].
Mutagenesis and selection techniques have been employed to improve CO
2 biofixation. In [
38], gamma irradiation was used to obtain a strain adapted to a CO
2 concentration of 15%, resulting in a 500% increase in biomass yield. Another investigation produced several mutants for which the optimal CO
2 concentration is 12%, and these strains demonstrate high CO
2-fixation rates [
39]. It is important to note that the effectiveness of utilizing elevated CO
2 concentrations depends on other factors. For example, a study [
40] demonstrated that high CO
2 concentrations are effective only when combined with high illumination intensity. Spirulina growth at high CO
2 concentrations is also dependent on the bubbling rate: at moderate CO
2 concentrations (3%), a high flow rate (375 mL/min per liter of suspension) stimulates growth, whereas at 6% CO
2, such an intense gas supply induces medium acidification and growth inhibition [
41].
In our previous studies on cyanobacterium cultivation using a sealed gas chamber, we investigated the growth, adaptation to elevated CO
2 concentrations, biochemical biomass analysis of
Arthrospira platensis, as well as the influence of illumination intensity [
42,
43,
44]. Effectiveness of CO
2 capture from flue gas simulations was also studied. However, in those studies, the gas composition within the enclosed space was not continuously monitored, PBR volumes were larger (90–100 L), and the strains used were adapted by short-term step-wise CO
2 increase. The present work differs from our prior studies in the following key aspects:
Continuous monitoring of both CO2 and O2 in the sealed gas chamber, enabling three independent estimates of CO2 capture and O2 generation.
Use of 30 × 10 L column PBRs (300 L total) providing a higher surface-to-volume ratio and more uniform illumination.
A strain subjected to long-term (6-month) continuous adaptation at 3.0 vol.% CO2.
Simultaneous analysis of carbonate–bicarbonate chemistry alongside gas-phase dynamics. This combination of factors has not been previously reported for this organism.
The objectives of this research are:
To study the dynamics of CO2 and O2 concentrations within a sealed gas chamber during microalgae cultivation in cylindrical column-type photobioreactors.
To determine the relationship between biomass growth rate and atmospheric composition.
To investigate changes in chemical parameters of the culture medium (pH, temperature, carbonate, bicarbonate, phosphate, and nitrate concentrations).
To perform microscopic analysis of the Arthrospira platensis culture.
To elucidate the relationships between cultivation parameters, photobioreactor biomass productivity, CO2 utilization efficiency, and O2 generation efficiency.
2. Materials and Methods
2.1. Description of the Experimental Setup
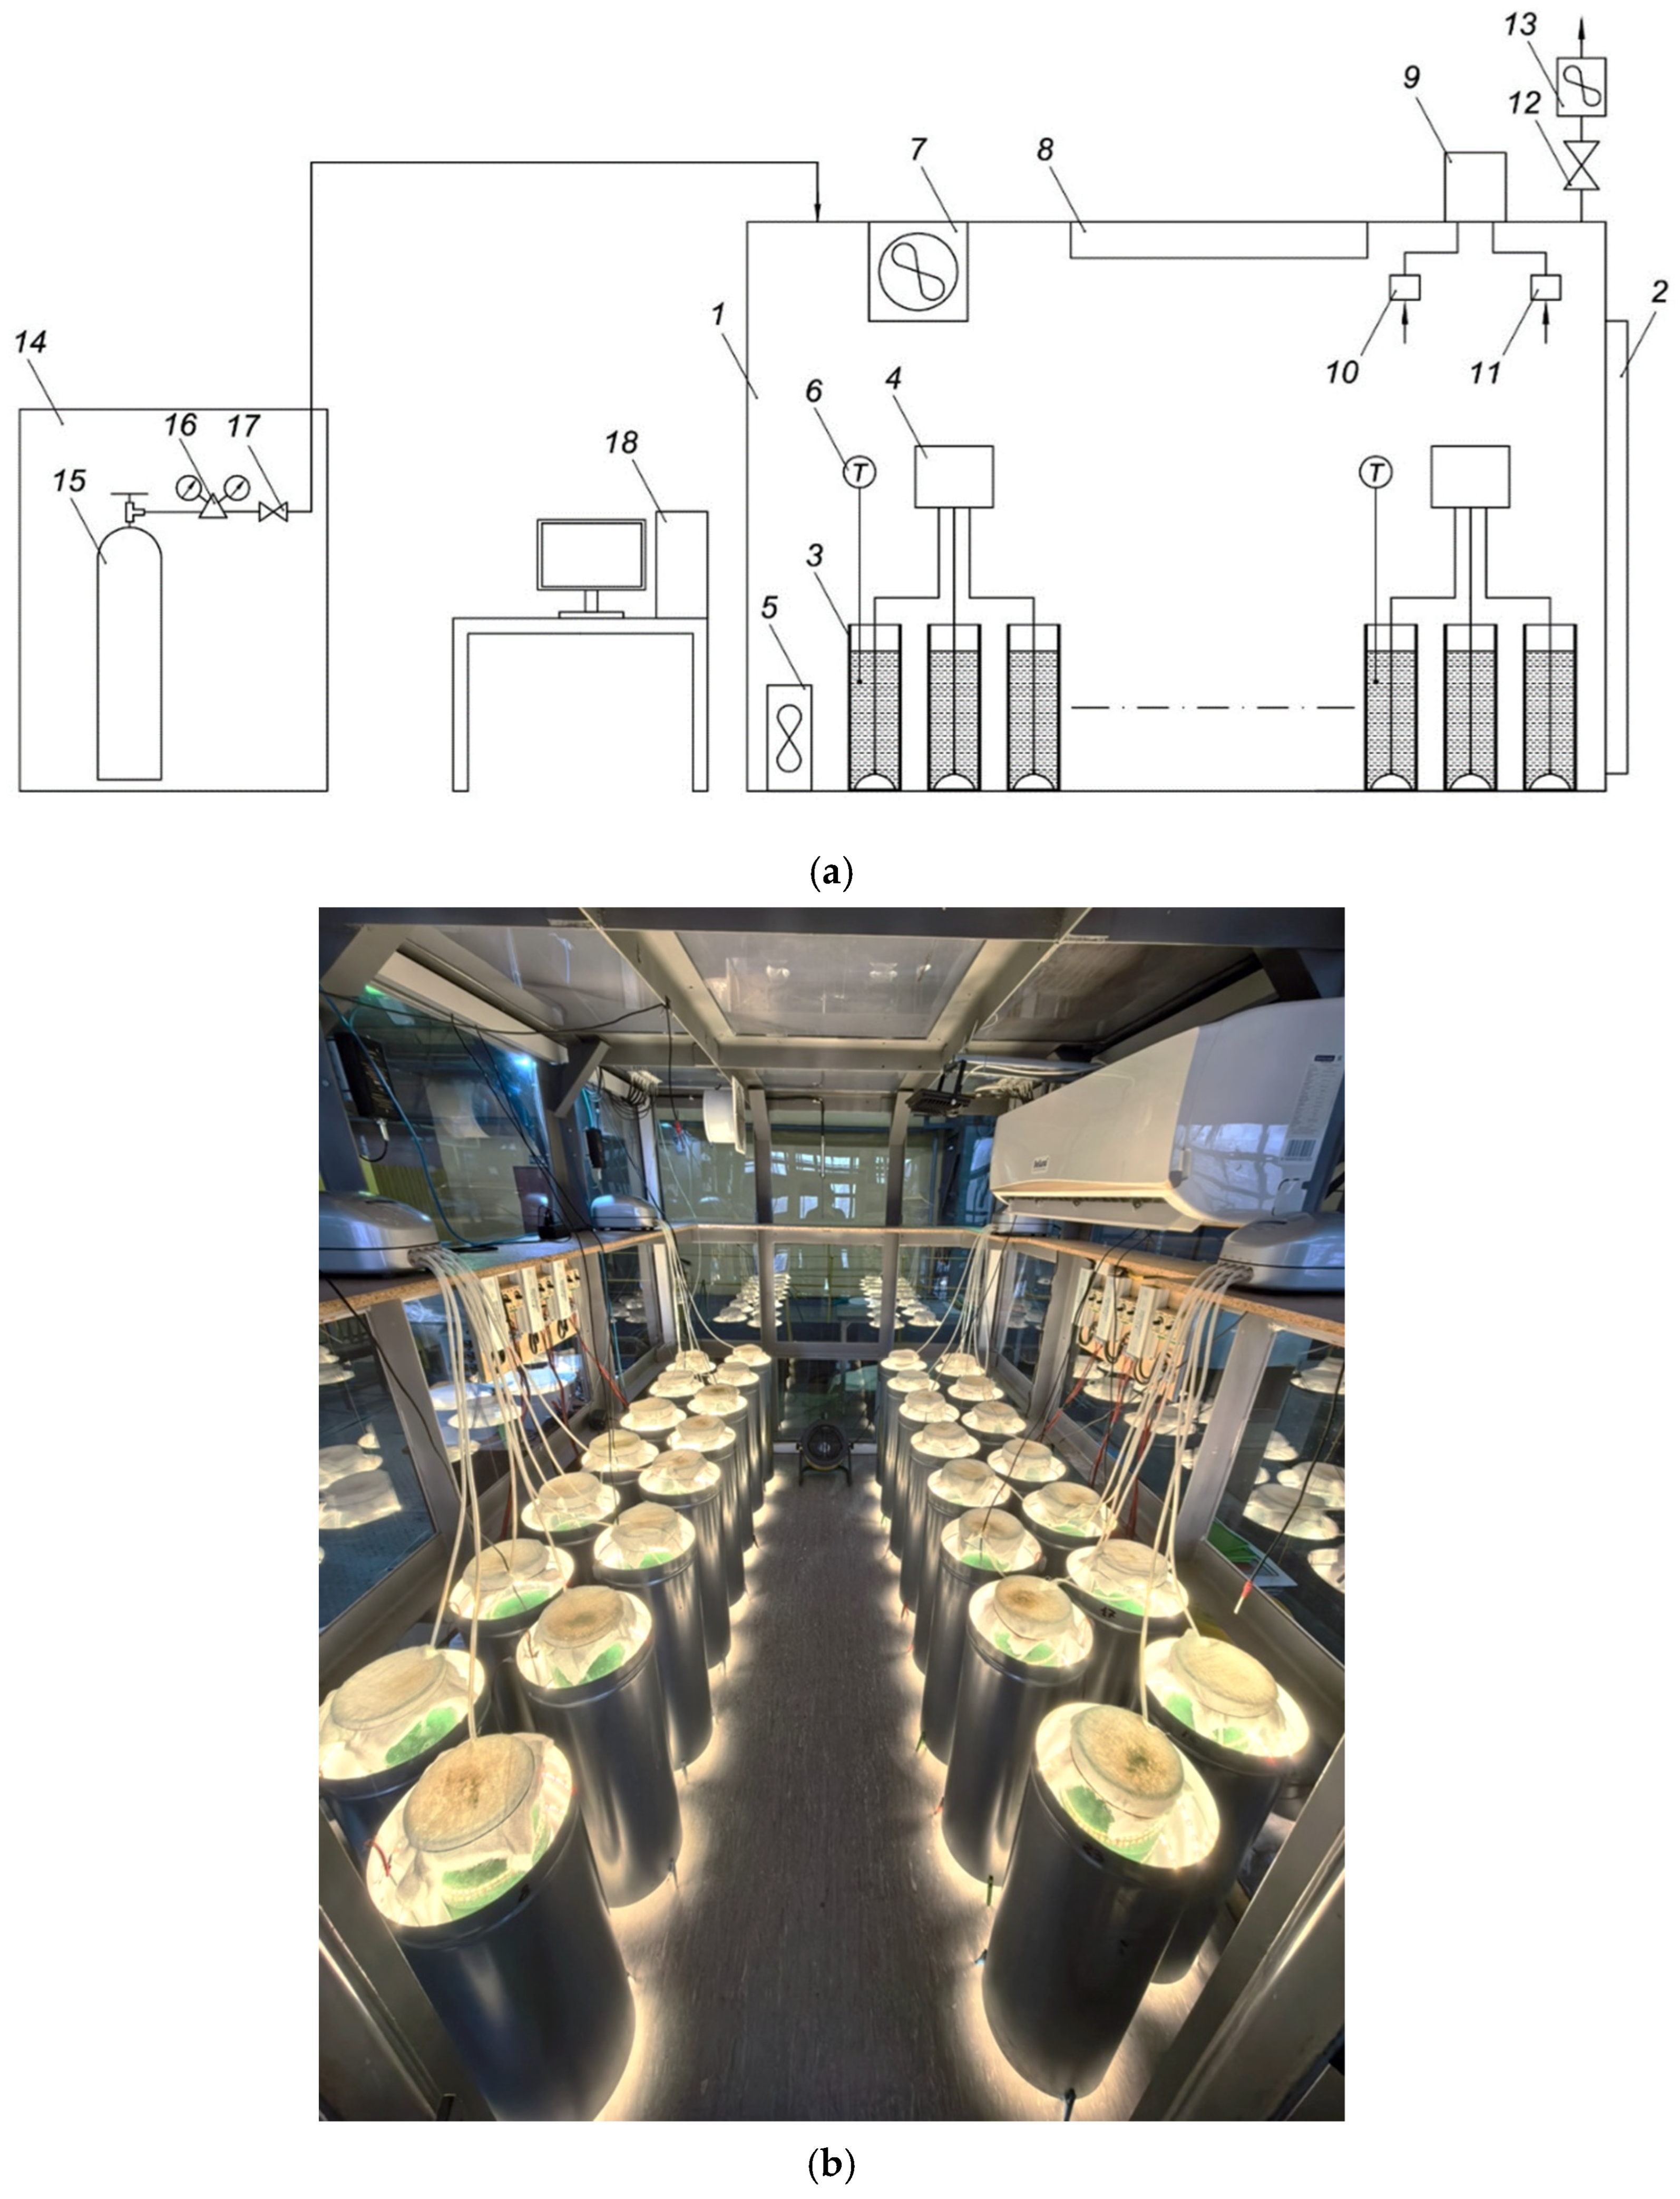
Thirty identical cylindrical glass photobioreactors (PBRs) with a volume of 10 L each (height 80 cm), covered with gauze lids, were used. Cultivation conditions were identical for all PBRs. The gas–air mixture was continuously supplied to the culture liquid through aerators located at the bottom of each PBR (flow rate 1 L/min). Illumination was continuous, provided by LED strips with a light intensity of 225 ± 20 μmol/m2·s. The reported light intensity corresponds to photosynthetic photon flux density (PPFD) measured at the reactor surface. Because biomass concentration increased during cultivation, some degree of light attenuation and self-shading inside the culture was expected, particularly during the later stages of growth. The temperature in the PBRs was maintained at 27 ± 1 °C.
The photobioreactors were placed inside a sealed gas chamber (
Figure 1) with a volume of 12 m
3, connected to gas cylinders to maintain fixed CO
2 levels (1.5, 3.0, and 6.0 vol.% for the three experiments). The gas chamber was equipped with monitoring equipment for temperature, humidity, pressure, as well as gas analyzers for measuring O
2, CO, CO
2, NH
3, CH
4, SO
2, NO
2, and H
2S concentrations.
2.2. Experimental Cultivation Procedure
Three experiments were conducted, each lasting 12 days. An inoculum of Arthrospira platensis previously adapted to high carbon dioxide concentrations was used. Three CO2 levels were selected: 1.5 vol.%, 3.0 vol.%, and 6.0 vol.%. Biomass and nutrient medium composition were analyzed for 8 PBRs. For each measured parameter, samples were taken independently from each of the 8 reactors; the values presented are arithmetic means across all 8 PBRs (M ± SEM). Sampling was performed on days 0, 2, 4, 6, 8, 10, and 12 of the experiments. Optical density and pH were measured every two days. Nitrate, phosphate, carbonate, and bicarbonate measurements were conducted every four days. Microscopic analysis of the culture and pigment content determination were performed on days 0 and 12.
On day 12 of each experiment, biomass was separated by gravity filtration through stainless steel mesh filters with a pore size of 100 μm. The filtered biomass was washed with distilled water, then frozen in a lyophilization chamber at −20 °C for 4 h, and finally dried at 35 °C to constant weight.
2.3. Strain Description
The original Arthrospira platensis strain was obtained from the microalgae culture collection of the Faculty of Geography, Lomonosov Moscow State University. A strain adapted to elevated CO2 concentrations was used. This adapted line was obtained by long-term (6 months) continuous cultivation at an atmospheric CO2 concentration of 3.0 vol.%. Modified Zarrouk medium was used (NaHCO3 12 g/L instead of 16.8 g/L, KNO3 3.0 g/L, K2HPO4·3H2O 0.66 g/L, K2SO4 1.0 g/L, MgSO4·7H2O 0.2 g/L, NaCl 1.0 g/L, CaCl2 0.04 g/L, FeSO4·7H2O 0.018 g/L, EDTA 0.08 g/L, trace elements for Zarrouk medium 1 mL/L), prepared with distilled water. All chemicals were purchased in Rushim, Russia.
2.4. Analytical Methods
2.4.1. Gas Concentrations
The gas composition inside the chamber (O2, CO2, CO, NH3, CH4, SO2, NO2, H2S) was continuously monitored using a multi-channel gas analyzer. CO2 fixation by the culture was determined by the rate of its concentration decrease in the sealed chamber volume. Measurements were recorded at intervals of 5–6 s. Measurement ranges: O2 (0–30) vol.%, CO2 (0–10) vol.%, CO (0–500) mg/m3, NH3 (0–70) mg/m3, CH4 (0–5) vol.%, SO2 (0–50) mg/m3, NO2 (0–35) mg/m3, H2S (0–140) mg/m3. Permissible basic measurement errors: O2 ± 0.4%, CO2 ± 0.1%, CO ± 4 mg/m3, NH3 ± 4 mg/m3, CH4 ± 0.2%, SO2 ± 2.5 mg/m3, NO2 ± 0.5 mg/m3, H2S ± 2 mg/m3.
2.4.2. Optical Density (OD)
Culture growth was monitored by measuring the optical density of the suspension. Measurements were performed using a spectrophotometer (Expert-003, Russia) at a wavelength of 655 nm in cuvettes with a 5 mm optical path length. Sampling was carried out on days 0, 2, 4, 6, 8, 10, and 12.
2.4.3. pH
The pH of the nutrient medium was measured using a pH meter (Expert-pH, Moscow, Russia) on days 0, 2, 4, 6, 8, 10, and 12. Measurements were performed with automatic temperature correction. The instrument was calibrated every 7 days using buffer solutions at pH 9.18, 6.86, and 4.01. Measurement error: ±0.01 pH units.
2.4.4. Phosphates and Nitrates
Phosphate concentration was determined by the molybdate method using a spectrophotometer Expert-003 (Ionomer, Moscow, Russia) at a wavelength of 700 nm. Measurements were performed on days 0, 4, 8, and 12. The method is based on the reaction of orthophosphates with ammonium molybdate in an acidic medium to form phosphomolybdic heteropoly acid. Subsequent reduction of this acid produces a blue-colored compound whose color intensity is directly proportional to the orthophosphate content in the sample.
Nitrate concentration was determined using a spectrophotometer (Expert-003, Russia) at a wavelength of 525 nm. Measurements were performed on days 0, 4, 8, and 12. The method is based on the reduction of nitrates to nitrites by metallic magnesium. The resulting nitrites then react with Griess reagent to form a dye. The color intensity is proportional to the initial nitrate concentration.
2.4.5. Carbonates and Bicarbonates
Carbonates (CO32−) and bicarbonates (HCO3−) were determined by direct titration on days 0, 4, 8, and 12. The method is based on the sequential titration of alkaline components with hydrochloric acid. Upon acid addition, carbonate ions are first neutralized to bicarbonates, corresponding to the first equivalence point detected by phenolphthalein color change. Subsequently, bicarbonates are neutralized to carbonic acid, corresponding to the second equivalence point detected by methyl orange color change.
2.4.6. Microscopic Analysis
Microscopic analysis was performed using a light microscope Levenhuk MED Series (Levenhuk, Tampa, FL, USA) at magnifications of ×100 and ×400. Sampling was performed on days 0 and 12. Cell viability was assessed by differential staining with methylene blue, based on the differential permeability of live and dead cell membranes [
45]. Live and dead trichomes were counted using a Gorjaev’s count chamber, with trichomes counted in 10 large squares, then recalculated per 1 mL of suspension considering the chamber volume.
2.4.7. Biomass Yield Definition
Biomass yield was calculated as the final dry weight (g/L) after filtration and drying.
2.5. Data Processing and Calculations
Table 1 represents all main units used for calculations.
The final dry mass of spirulina per PBR was calculated using the following formulas:
where 0.892 is the empirical conversion factor (g/L per OD unit), V
PBR is the average PBR volume (L).
where M
total is the total dry mass at the end of the experiment (g), N is the number of PBRs in the experiment.
where ΣΔC
CO2 is the total CO
2 concentration decrease during the experiment (vol.%), V
GC = 11.5 m
3 is the gas chamber volume excluding PBRs and equipment inside the gas chamber.
The coefficient 1.7 is derived from the ratio of C atoms in biomass (40–50% of mass [
46]) and CO
2 (27.29% of mass). The coefficient 1.85 converts CO
2 volume to mass [kg/m
3].
where ΣΔC
O2 is the total O
2 concentration increase during the experiment (vol.%), V
GC = 11.5 m
3 is the gas chamber volume, and 1.18 is the photosynthetic coefficient showing the ratio of O
2 volume evolved to CO
2 volume absorbed for spirulina [
47].
2.6. Calculation of Specific Growth Rate and Average Daily Biomass Productivity
The specific growth rate (μ, day−1) and average daily biomass productivity (P, mg/(L·day)) were calculated to quantitatively evaluate the growth dynamics of A. platensis under different gas supply regimes.
The specific growth rate was determined by the formula:
where X
1 and X
2 denote biomass concentration (mg/L) at the beginning and end of the time interval, respectively, while t
2 − t
1 denotes interval duration (days).
The average daily biomass productivity was calculated by the formula:
where X
12 denotes biomass concentration on day 12 of the experiment (mg/L), and X
0 denotes initial biomass concentration (mg/L).
Calculations were performed for the following time intervals: 0–2, 2–4, 4–6, 6–8, 8–10, and 10–12 days. The average specific growth rate was calculated as the arithmetic mean of μ values over all intervals.
2.7. Evaluation of CO2 Capture and O2 Generation
The CO2 capture efficiency by spirulina during photosynthesis (φ [mg/(L·day)]) was calculated using three methods, accounting for CO2 and O2 losses to the environment (from our previous experiments the losses are linear 0.05 vol.%/day, 0.60 vol.% during 12 days). ΣΔCCO2 is the total CO2 concentration decrease during the experiment (vol.%), ΣΔCO2 is the total O2 concentration increase during the experiment (vol.%), and VGC = 11.5 m3 is the gas chamber volume excluding PBRs and equipment inside the gas chamber.
Direct measurement method:
where 300 L is the total culture volume (30 PBRs × 10 L). The coefficient 1.85 converts CO
2 volume to mass [kg/m
3].
Calculation method from O
2 concentration dynamics, considering the photosynthetic coefficient of 1.18 converting CO
2 volume to O
2 volume [
48]:
Calculation method from biomass accumulation dynamics, considering the coefficient 1.7. The coefficient 1.7 is derived from the ratio of C atoms in biomass (40–50% of mass [
46]) and CO
2 (27.29% of mass). Converting dry spirulina mass to absorbed CO
2 mass:
The O2 generation efficiency by spirulina during photosynthesis (η [mg/(L·day)]) was calculated using three methods, accounting for CO2 losses to the environment (0.05 vol.%/day).
Direct measurement method:
The coefficient 1.31 converts O2 volume to mass [kg/m3].
Calculation method from CO
2 concentration dynamics, considering the photosynthetic coefficient of 1.18 [
48]:
Calculation method from biomass concentration dynamics, considering the coefficient 1.7 converting spirulina mass to absorbed CO
2 mass, the photosynthetic coefficient 1.18, and the O
2 to CO
2 molar mass ratio 32/44:
2.8. Statistical Data Processing
Statistical analysis of experimental data was performed using the R software environment (version 4.5.3) and packages readxl, dplyr, tidyr, car, emmeans, multcomp, ggplot2, and rstatix. All data are presented as arithmetic mean ± standard error of the mean (M ± SEM). The significance level was set at 0.05.
For each CO2 concentration (1.5%, 3.0%, 6.0%), one independent experiment was conducted. Thus, the three CO2 conditions represent independent experiments performed sequentially, not simultaneous triplicate runs of the same condition. For parameters measured individually in each photobioreactor (biomass concentration, pH, nitrate and phosphate concentrations, carbonate/bicarbonate content, and trichome viability), the true experimental unit is the individual PBR, and statistical comparisons across CO2 levels are based on 8 independent PBRs per condition (n = 8 for each group). For gas-phase variables (CO2 and O2 concentrations within the sealed chamber), the true experimental unit is the chamber itself (n = 1 per CO2 condition). Consequently, gas dynamics across CO2 levels are presented as descriptive trends without inferential statistics. The dependence among reactors sharing the same gas atmosphere was not statistically modeled because no gas-phase contrast was tested; for all other variables, reactors were treated as independent units because they were individually sampled and their culture media evolved independently despite sharing the same gas headspace.
Normality of quantitative trait distribution in each experimental group was assessed using the Shapiro–Wilk test. Equality of variances between compared groups was tested using Levene’s test. When the assumption of variance equality was violated (p < 0.05 by Levene’s test), robust Welch’s ANOVA was applied for one-way analysis, and when normality was violated, the non-parametric Kruskal–Wallis test was used.
Two-way analysis of variance was performed separately for each parameter (optical density, average daily biomass growth, specific growth rate, pH). The model included the main effects of both factors (time and CO2 concentration) and their interaction effect. ANOVA results are presented with F-values, degrees of freedom, and significance levels (p).
To identify differences between CO2 concentrations within each time point, one-way analysis of variance was performed separately for each day and for each measured parameter. The choice of analysis method was made adaptively depending on the fulfillment of assumptions: when normality and homogeneity of variances were satisfied, classical ANOVA was used; when variance homogeneity was violated, Welch’s criterion was used; when normality was violated, the Kruskal–Wallis test was used. When statistically significant effects were detected by one-way ANOVA, multiple pairwise comparisons were performed using Tukey’s criterion (when classical ANOVA was used) or pairwise Wilcoxon tests with Bonferroni correction (when non-parametric methods were used). To assess differences between CO2 concentrations within each day based on the two-way model results, post hoc analysis with Tukey’s correction for multiple comparisons was used.
3. Results
3.1. Dynamics of Carbon Dioxide Concentration in the Chamber Atmosphere
Monitoring of CO
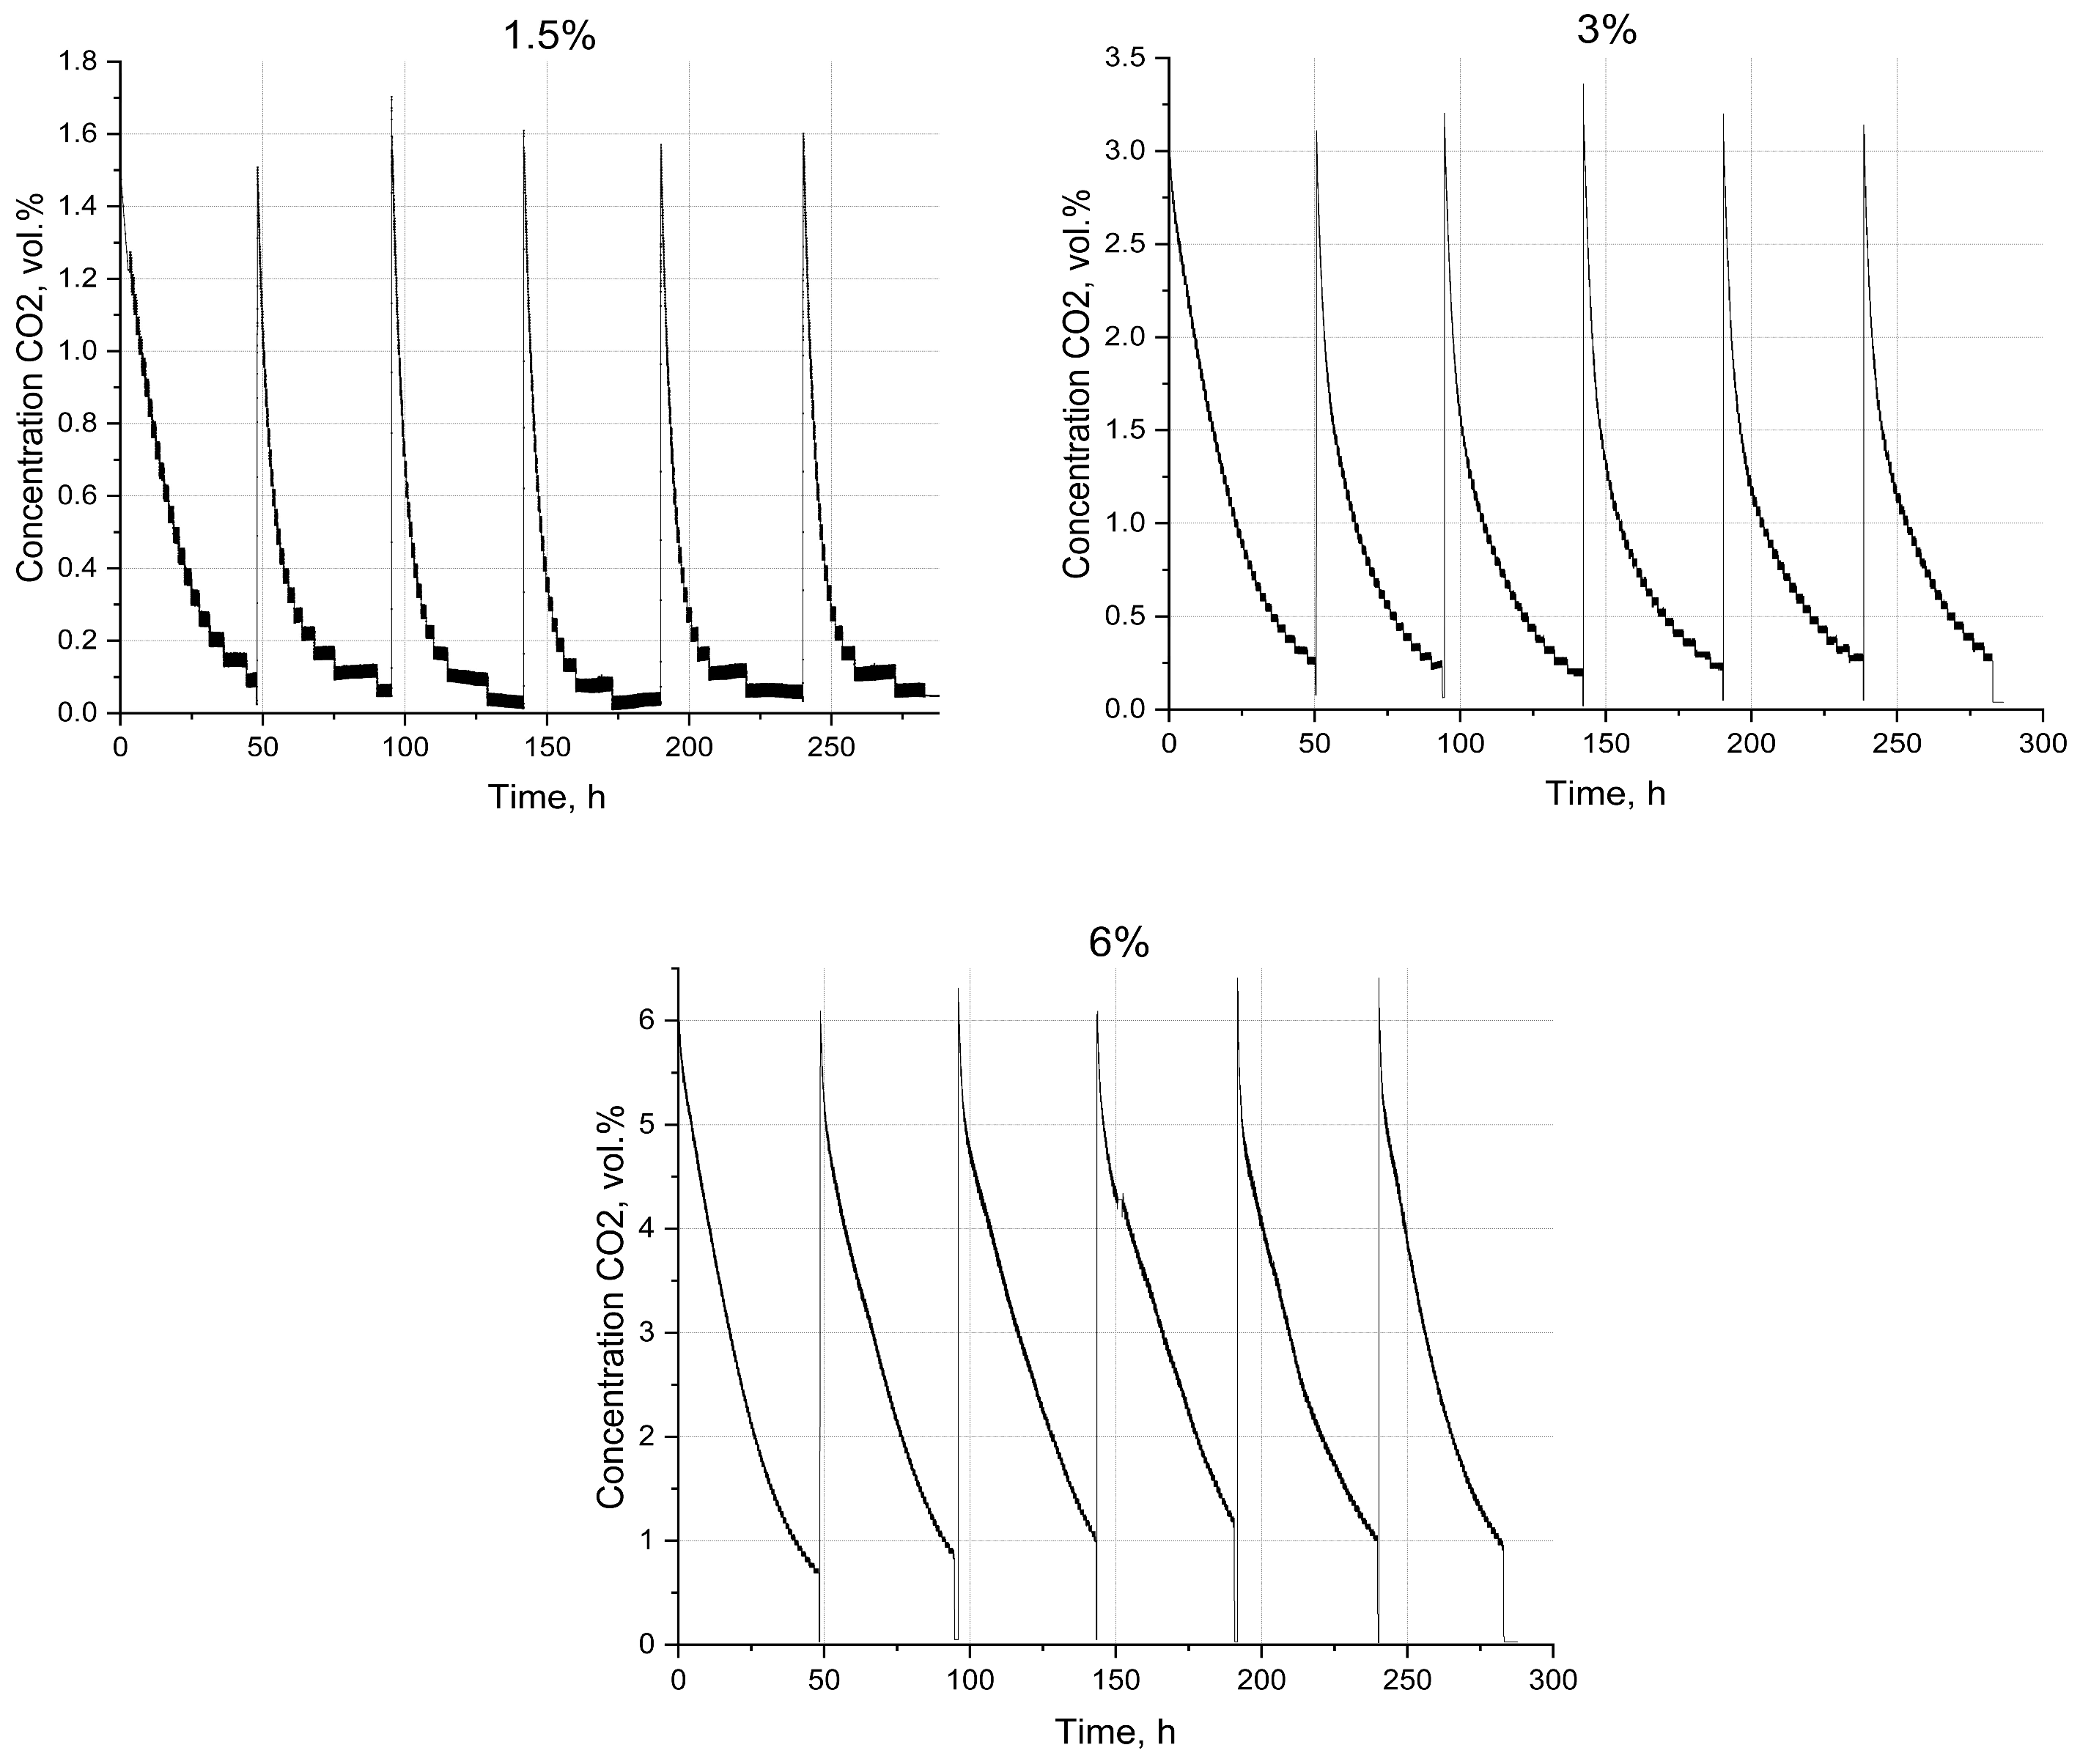
2 concentration in the cultivation chamber atmosphere in experiments with different carbon dioxide levels (1.5, 3.0, and 6.0 vol.%) revealed pulse dynamics (
Figure 2).
Sharp drops in CO2 level to near zero every two days in all experiments were caused by the chamber opening for sampling: air exchange with the external atmosphere (~0.04 vol.% CO2) led to rapid dilution and displacement of gas. The decrease in CO2 level after each sharp replenishment (associated with filling the chamber to the target concentration for the specific experiment) is related to CO2 biofixation by A. platensis cells while the chamber was sealed (between openings for sampling).
In the 1.5% CO
2 group, the decrease was relatively slow and smooth, with prolonged maintenance of concentration at 0.2 vol.% before the next chamber filling to the target CO
2 level. This indicates limited CO
2 assimilation capacity, consistent with high pH values (>9.8) (
Section 3.5) and lower biomass productivity (Section Specific Growth Rate and Average Daily Biomass Productivity).
At 3.0% CO
2 concentration, an increased drop was observed, often reaching minimum values (~0.25 vol.%) in less time. This indicates a noticeably increased rate of dissolved inorganic carbon consumption by cells, correlating with an effective buffering effect and bicarbonate accumulation (
Section 3.7) compared to 1.5% CO
2.
In the 6.0% CO2 regime, the decrease kinetics were nearly linear, with high rate and no deceleration at the end of the time interval. This dynamic reflects sustained high rates of photosynthetic carbon fixation without rapid reserve depletion.
Assessment of absolute CO
2 consumption by microalgae (
Section 3.9), performed based on photosynthesis stoichiometry (approximately 1.7 g CO
2 per 1 g dry biomass), showed that the largest amount of carbon dioxide was assimilated in the 6.0% CO
2 regime.
3.2. Dynamics of Oxygen Concentration in the Chamber Atmosphere
Monitoring of O
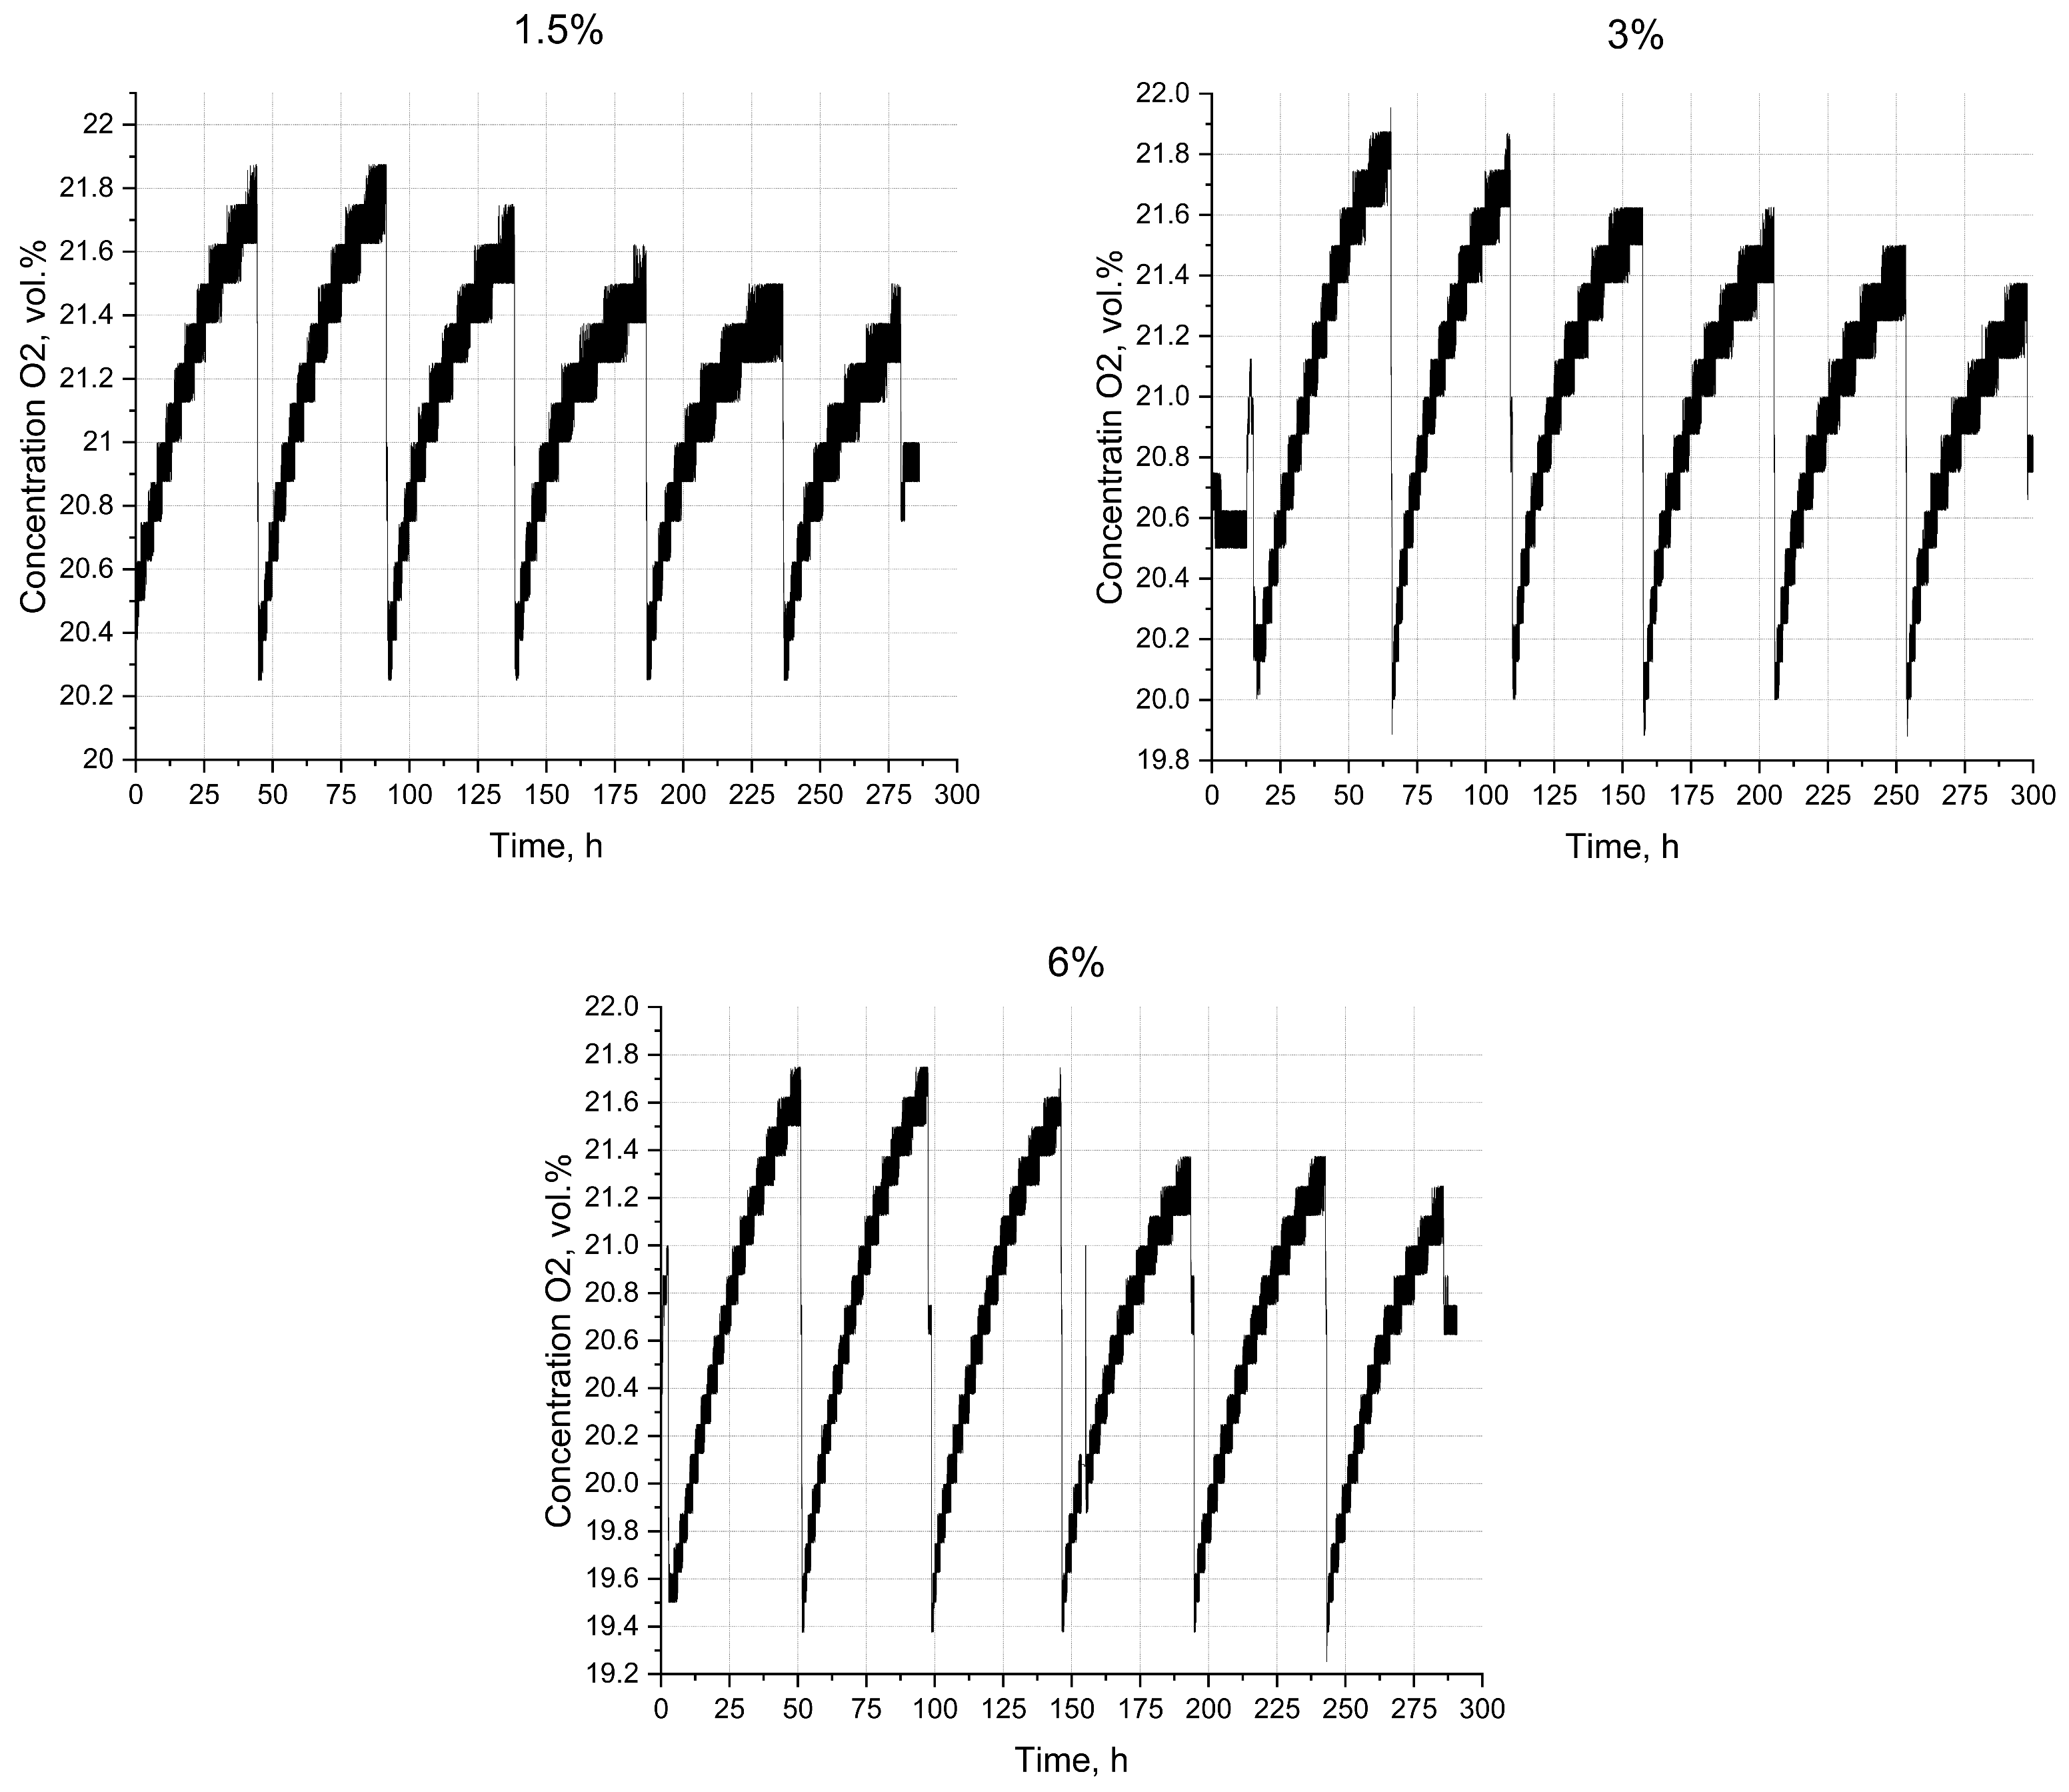
2 concentration in the gas chamber atmosphere in experiments with different carbon dioxide levels (1.5, 3.0, and 6.0 vol.%) revealed characteristic O
2 accumulation dynamics (
Figure 3).
An identical curve profile was observed in all experimental groups: gradual increase in O2 concentration during intervals between sampling, followed by sharp vertical drops to 18.5–20.4 vol.%. It is important to note that the observed sharp decreases in oxygen concentration after each accumulation period were exclusively due to the sampling procedure: opening the sealed chamber for culture liquid sampling. Air exchange with the external atmosphere (ranging from 19.6 to 19.4% due to slow chamber ventilation) led to intensive dilution of the oxygen-enriched gas phase inside the chamber. Thus, the sharp drops in O2 concentration in the graphs are related to the sampling methodology and do not reflect the actual process kinetics in the sealed state.
During intervals between samplings, O2 concentration steadily accumulated due to photosynthetic oxygen release by A. platensis cells. The most intense O2 increase was observed during the first 4–6 days of the experiment in all three experiments. Subsequently, O2 accumulation amplitude decreased in all groups, but in the 3.0% and 6.0% CO2 variants, it remained significantly higher than at 1.5% CO2. The maximum peak oxygen concentrations (21.4–21.9 vol.%) were observed in the 3.0% CO2 group, while at 6.0% CO2 peaks reached 21.5–21.7 vol.%, and at 1.5% they reached CO2—21.8–21.9 vol.%.
The observed O
2 dynamics directly correlate with higher biomass productivity, pH stability, and accelerated nutrient utilization under elevated carbon nutrition conditions. These results agree with other studies showing that under optimal CO
2 supply, photosynthetic activity of
Arthrospira platensis leads to significant accumulation of dissolved and gaseous oxygen in closed systems [
49].
3.3. Spirulina Viability (Microscopy)
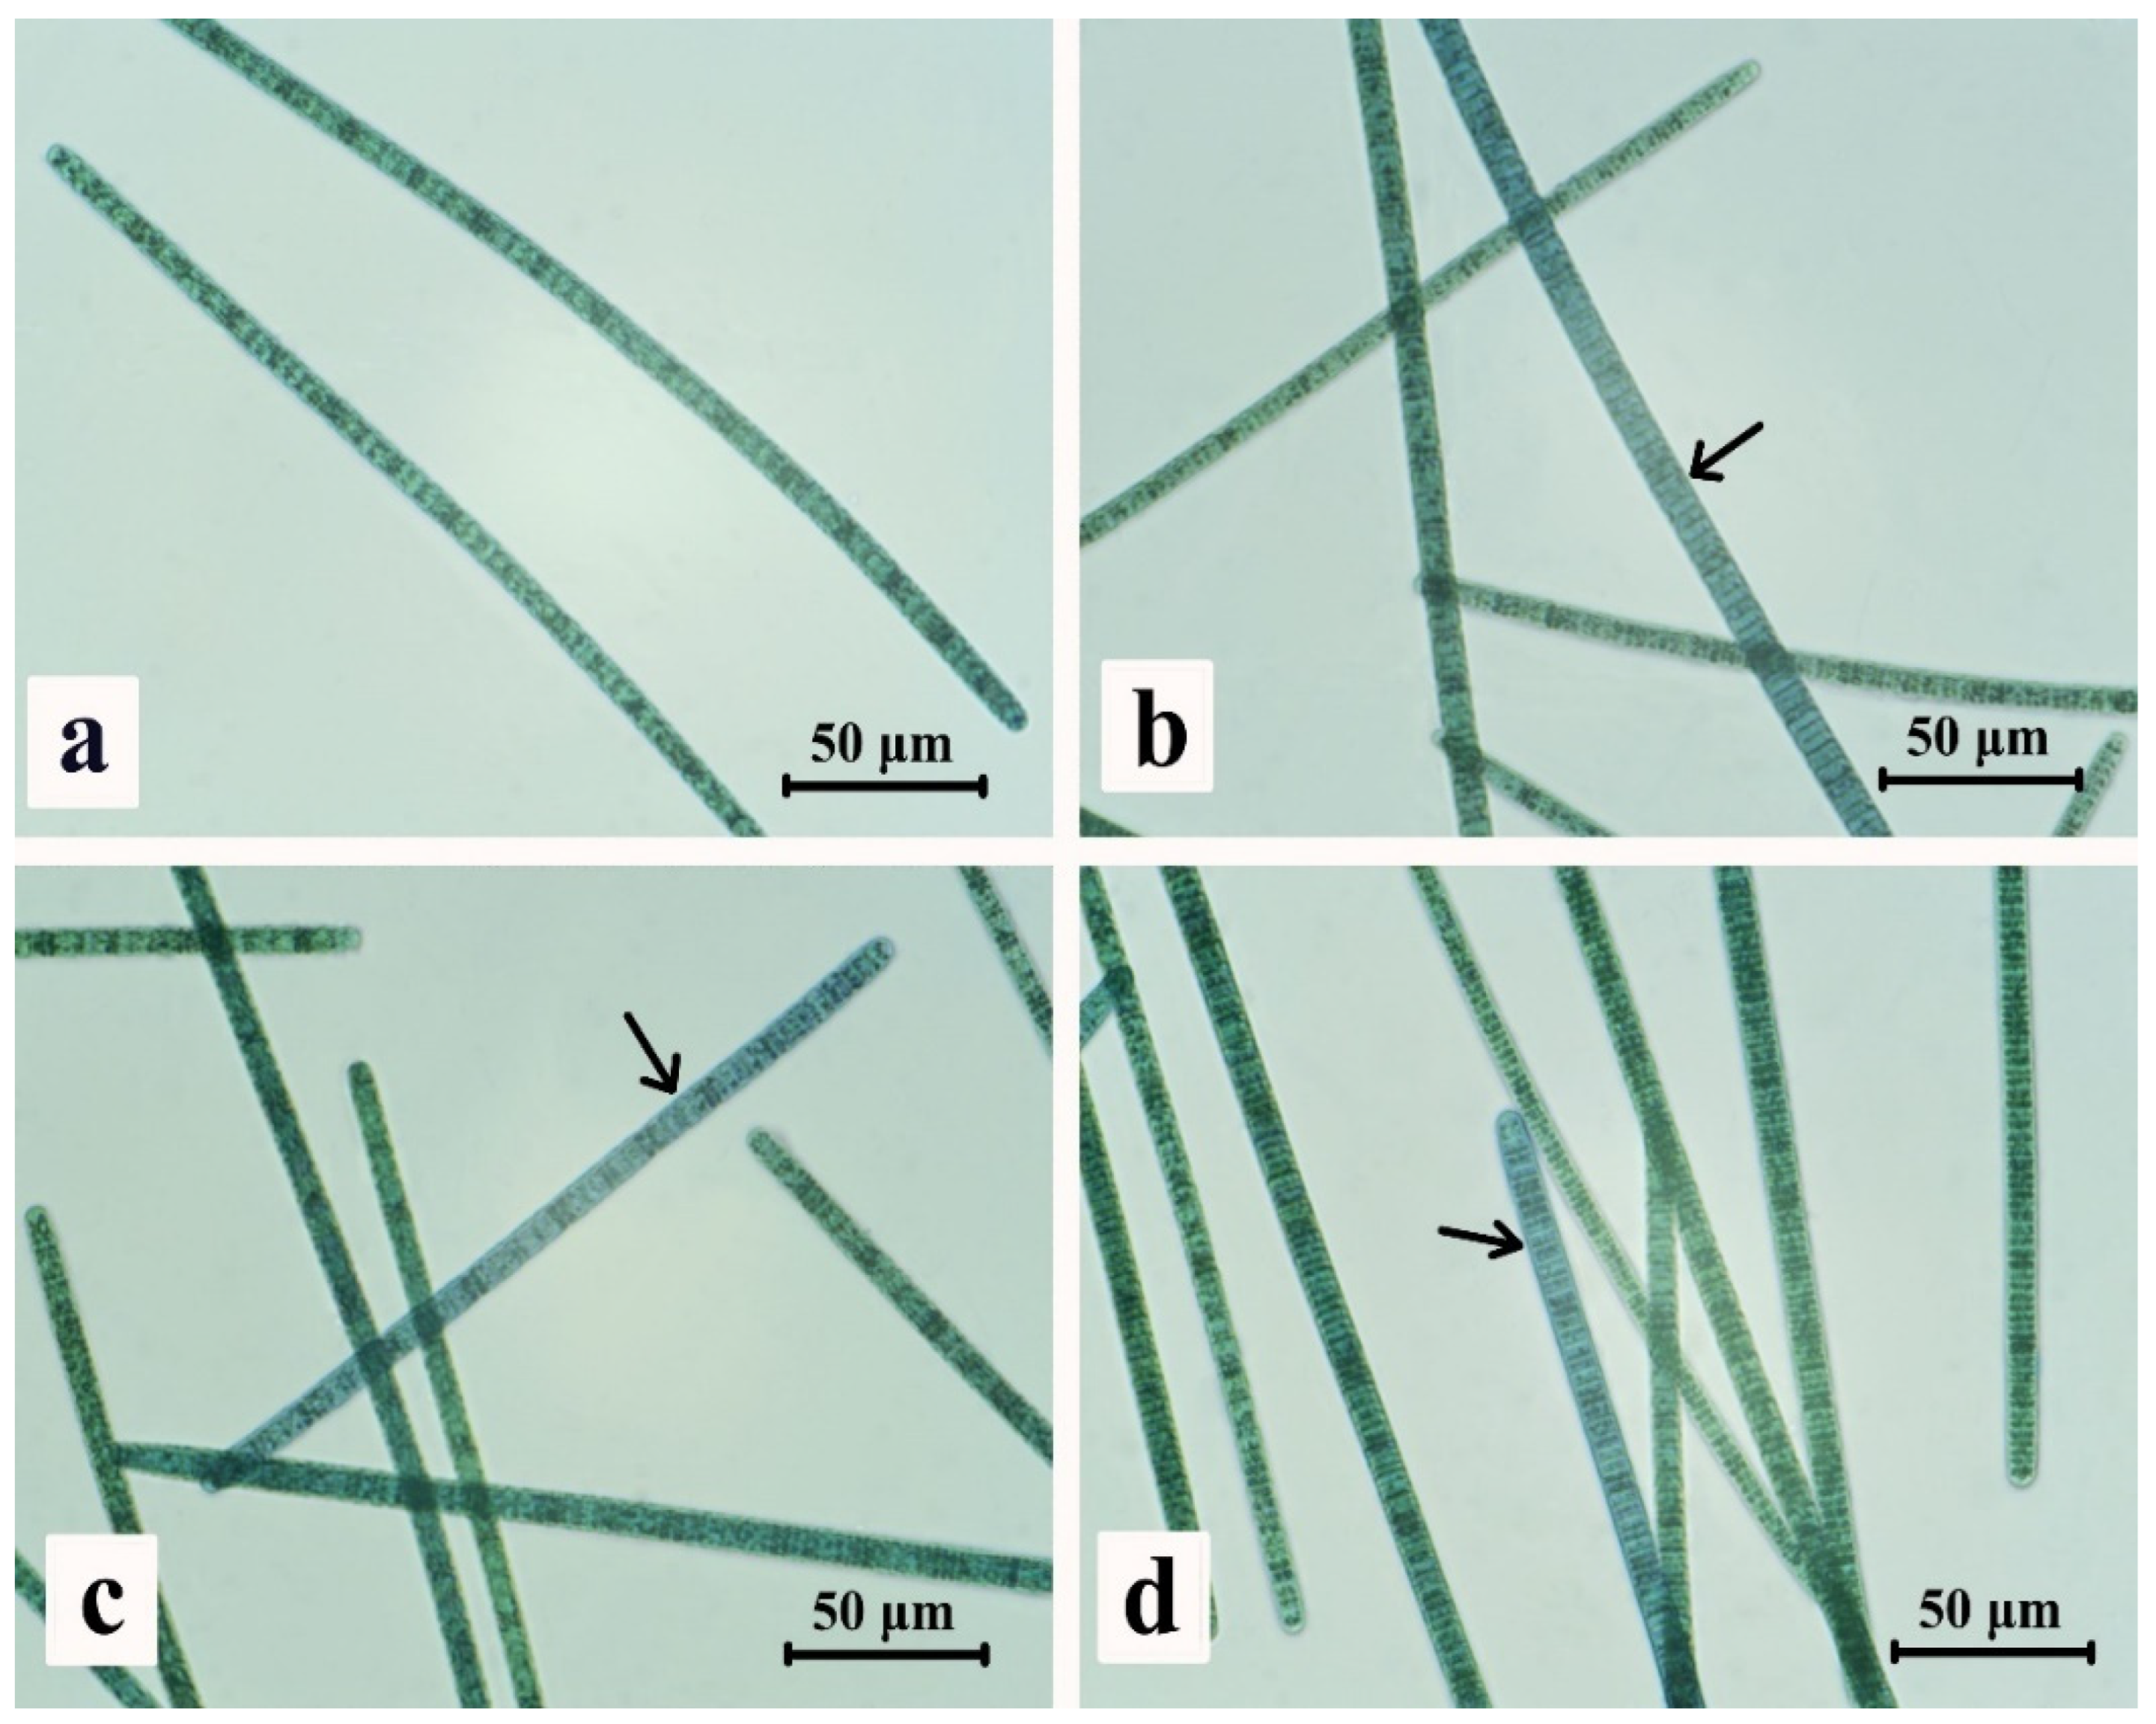
Microscopic analysis of
A. platensis culture was performed at the beginning (day 0) and the end (day 12) of the experiment at three CO
2 levels: 1.5 vol.%, 3.0 vol.%, and 6.0 vol.%. Representative microphotographs are presented in
Figure 4.
In the inoculum (day 0), the proportion of live trichomes was 93.8 ± 5.8% for the 1.5% CO2 group, 93.3 ± 6.4% for the 3% CO2 group, and 82.3 ± 10.1% for the 6% CO2 group, indicating high initial viability in all experimental variants with minor differences within error. The somewhat lower viability in the 6% CO2 group may be due to elevated dissolved CO2 concentration at the start of the experiment, which could have caused short-term stress due to medium acidification; however, this value is within experimental error and does not indicate significant differences from other groups.
By day 12 of cultivation, culture viability remained high in all groups. In the 1.5% CO2 group, live cell proportion was 87.5 ± 0.6%, 90.2 ± 1.4% in the 3.0% CO2 group, and 88.9 ± 2.0% in the 6.0% CO2 group. The slight decrease in live trichome proportion compared to the inoculum is characteristic of closed cultivation systems and does not indicate growth inhibition. Isolated dead trichomes observed in microphotographs (indicated by arrows) were present in all groups in comparable amounts. In all groups, trichomes retained structural integrity, and no pigment apparatus degradation was observed. This allows the conclusion that elevated CO2 concentrations have no toxic effect on A. platensis cells in the studied range.
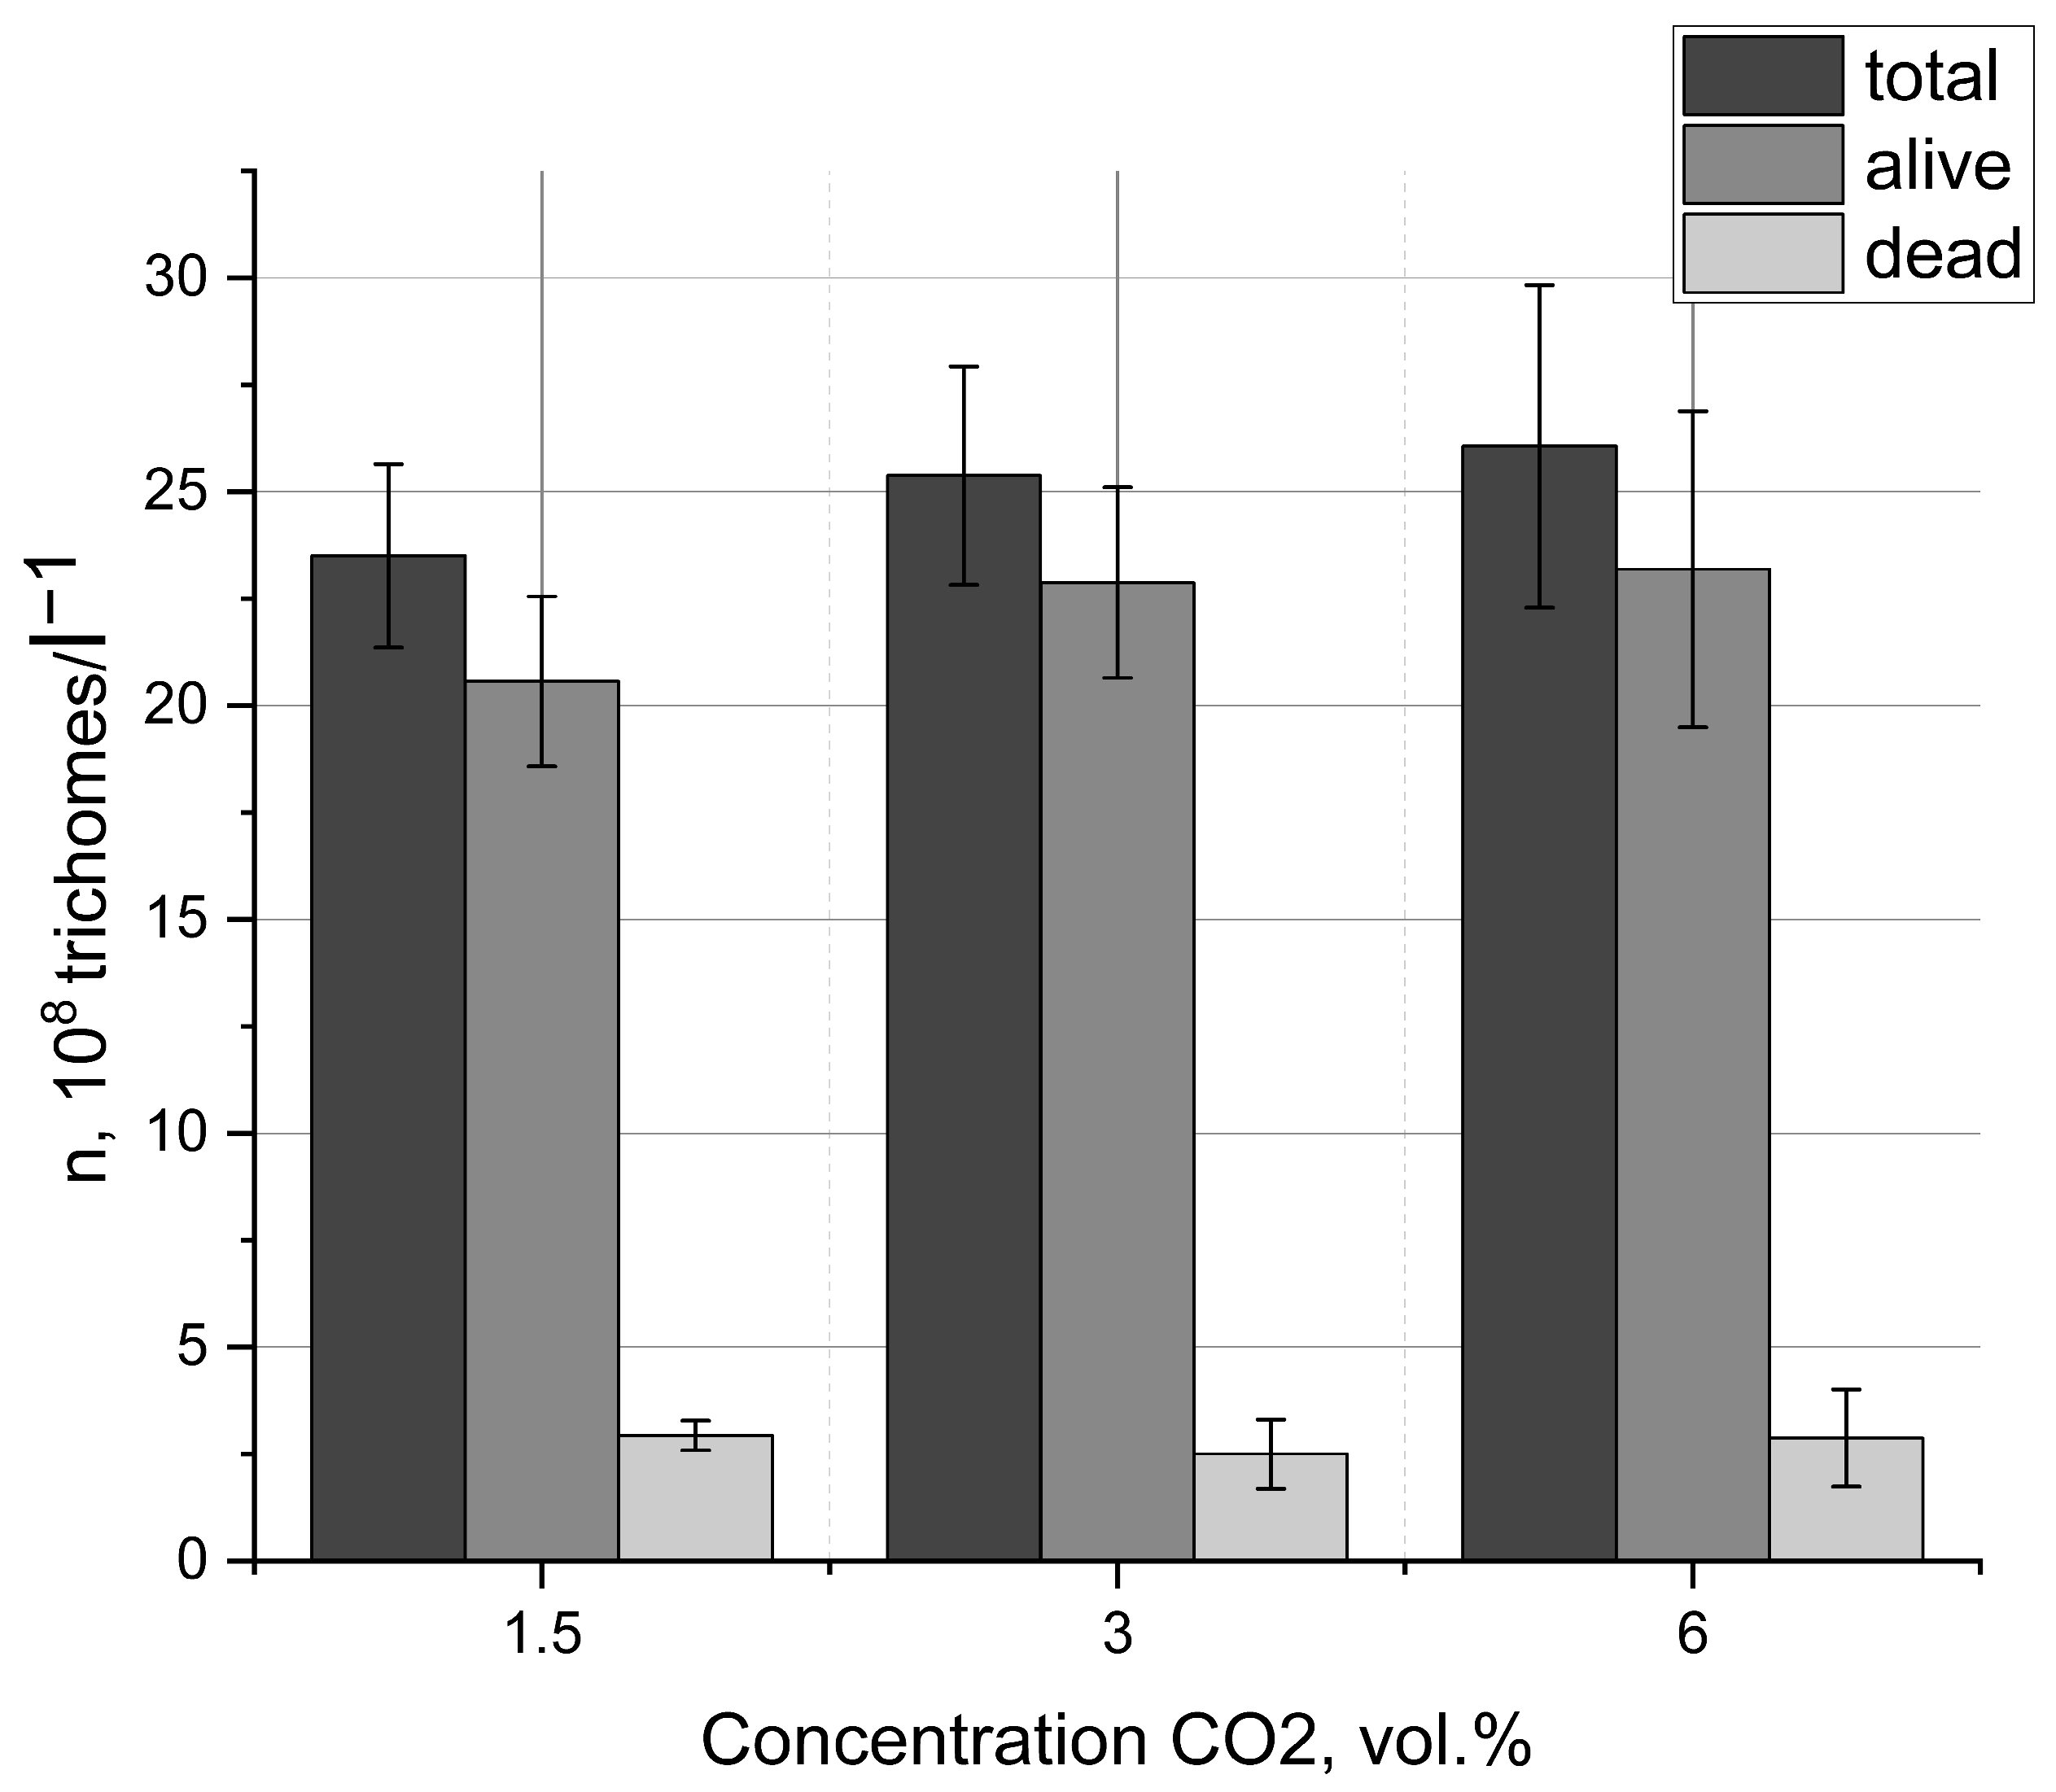
Quantitative results of microscopic analysis of culture viability at day 12 are presented in
Figure 5.
As seen from the data, total trichome concentration at the end of the experiment was high in all variants and ranged from 23 to 26 × 108 L−1. The highest trichome density was observed at 3.0% and 6.0% CO2. The proportion of live trichomes remained high in all groups, exceeding 85%. The maximum number of live cells was observed in the 3.0% CO2 group.
The microscopy results confirm high culture viability throughout the entire 12-day cultivation cycle at all studied CO2 concentrations.
3.4. Biomass Growth and Accumulation
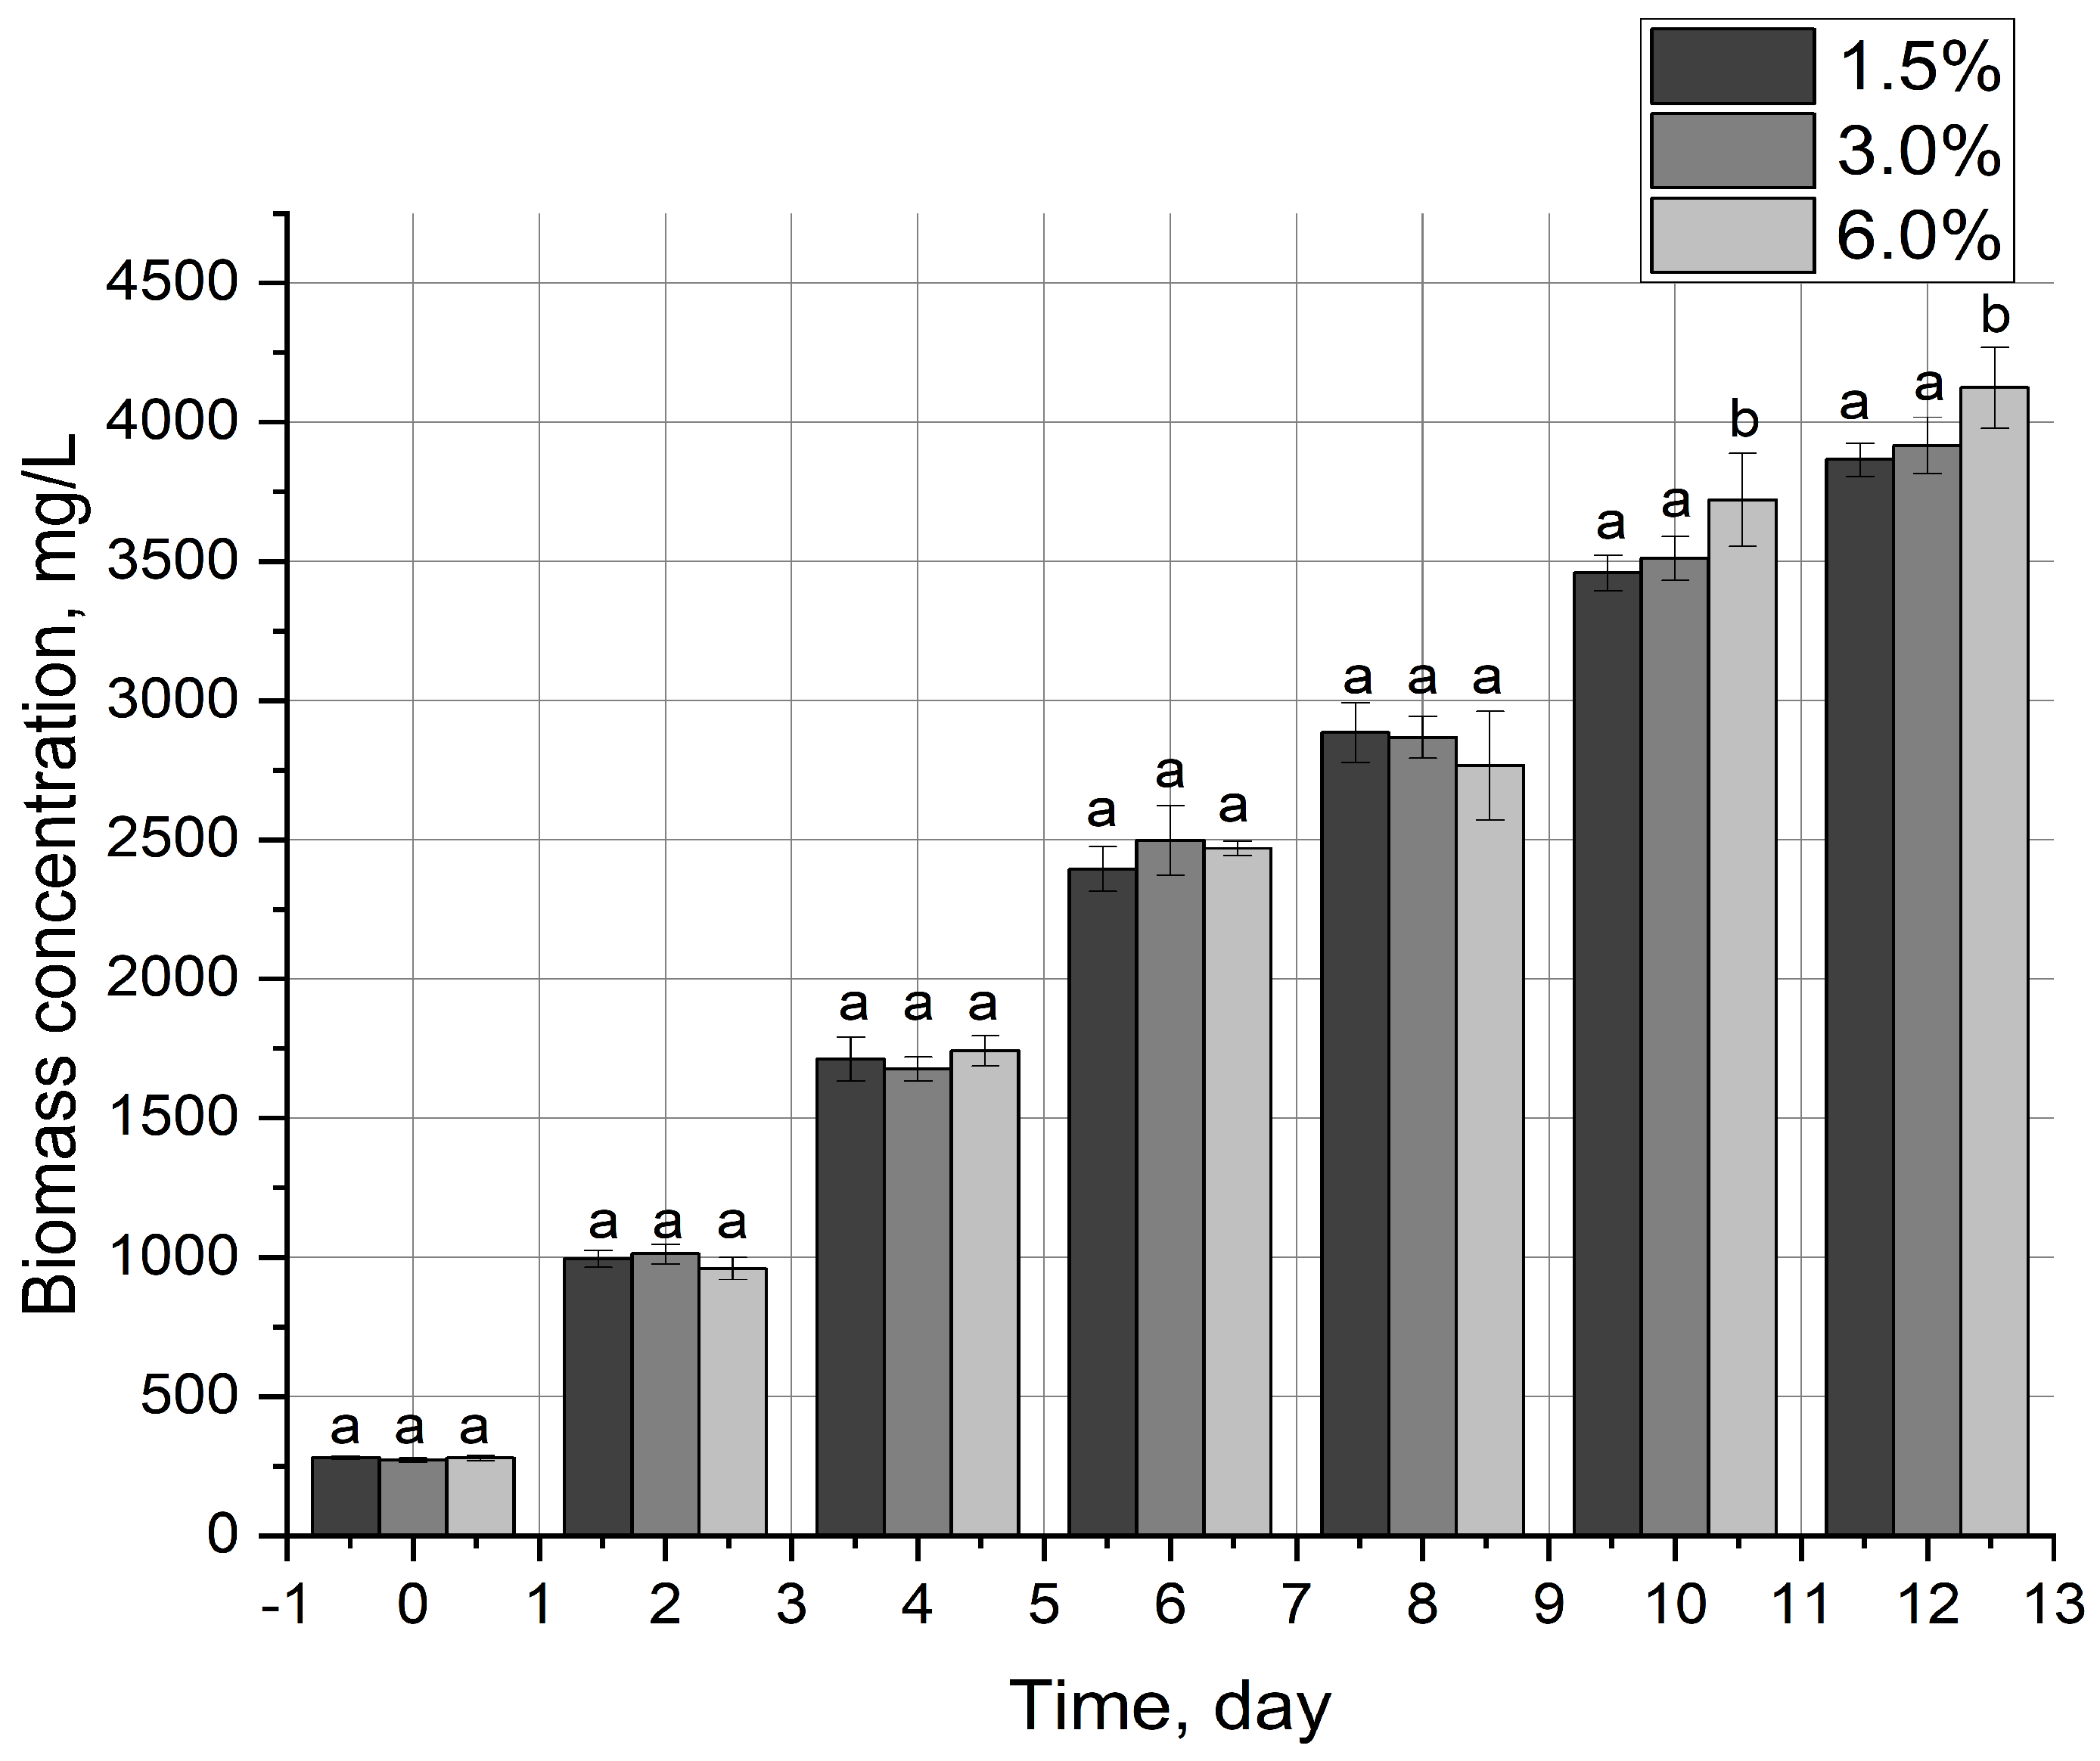
The dynamics of biomass accumulation of
A. platensis at different carbon dioxide concentrations (1.5%, 3.0% and 6.0%) during a 12-day cultivation cycle are shown in
Figure 6.
In all experimental groups, stable growth without a pronounced lag phase was observed, indicating successful adaptation of the cells to the applied experimental conditions. During the first four days, the biomass concentration in the photobioreactors was almost identical for all CO2 concentrations.
Differences in biomass concentration became more noticeable after day 6. The most intensive biomass accumulation in the second half of the cycle was recorded in the experiment with 6.0% CO2. By the end of the experiment (day 12), the average biomass concentration under this regime reached its maximum—4123.49 mg/L, which is 6.7% higher than in the 1.5% CO2 group and 5.3% higher than in the 3% CO2 group.
At 3.0% CO2, the final biomass concentration in the culture medium was 3917.44 mg/L, which slightly exceeded the value for the 1.5% group but was lower than that of the 6.0% regime. Thus, increasing the carbon dioxide content in the supplied gas–air mixture leads to an increase in A. platensis productivity under intensive cultivation conditions. The error margin for A. platensis concentration values is ±5–25% (based on replicate variability).
Elevated CO
2 concentration (6%) significantly increased the optical density of the culture only at the late stages of cultivation: on day 10 (ANOVA, Tukey: +294 mg/L,
p = 0.028), and a trend persisted on day 12 (Welch’s test,
p = 0.056). A more detailed description of the statistical analysis is provided in
Appendix A.1.
The obtained data correlate with the results of microscopic examinations, confirming high cell viability across the entire range of studied CO2 concentrations.
Specific Growth Rate and Average Daily Biomass Productivity
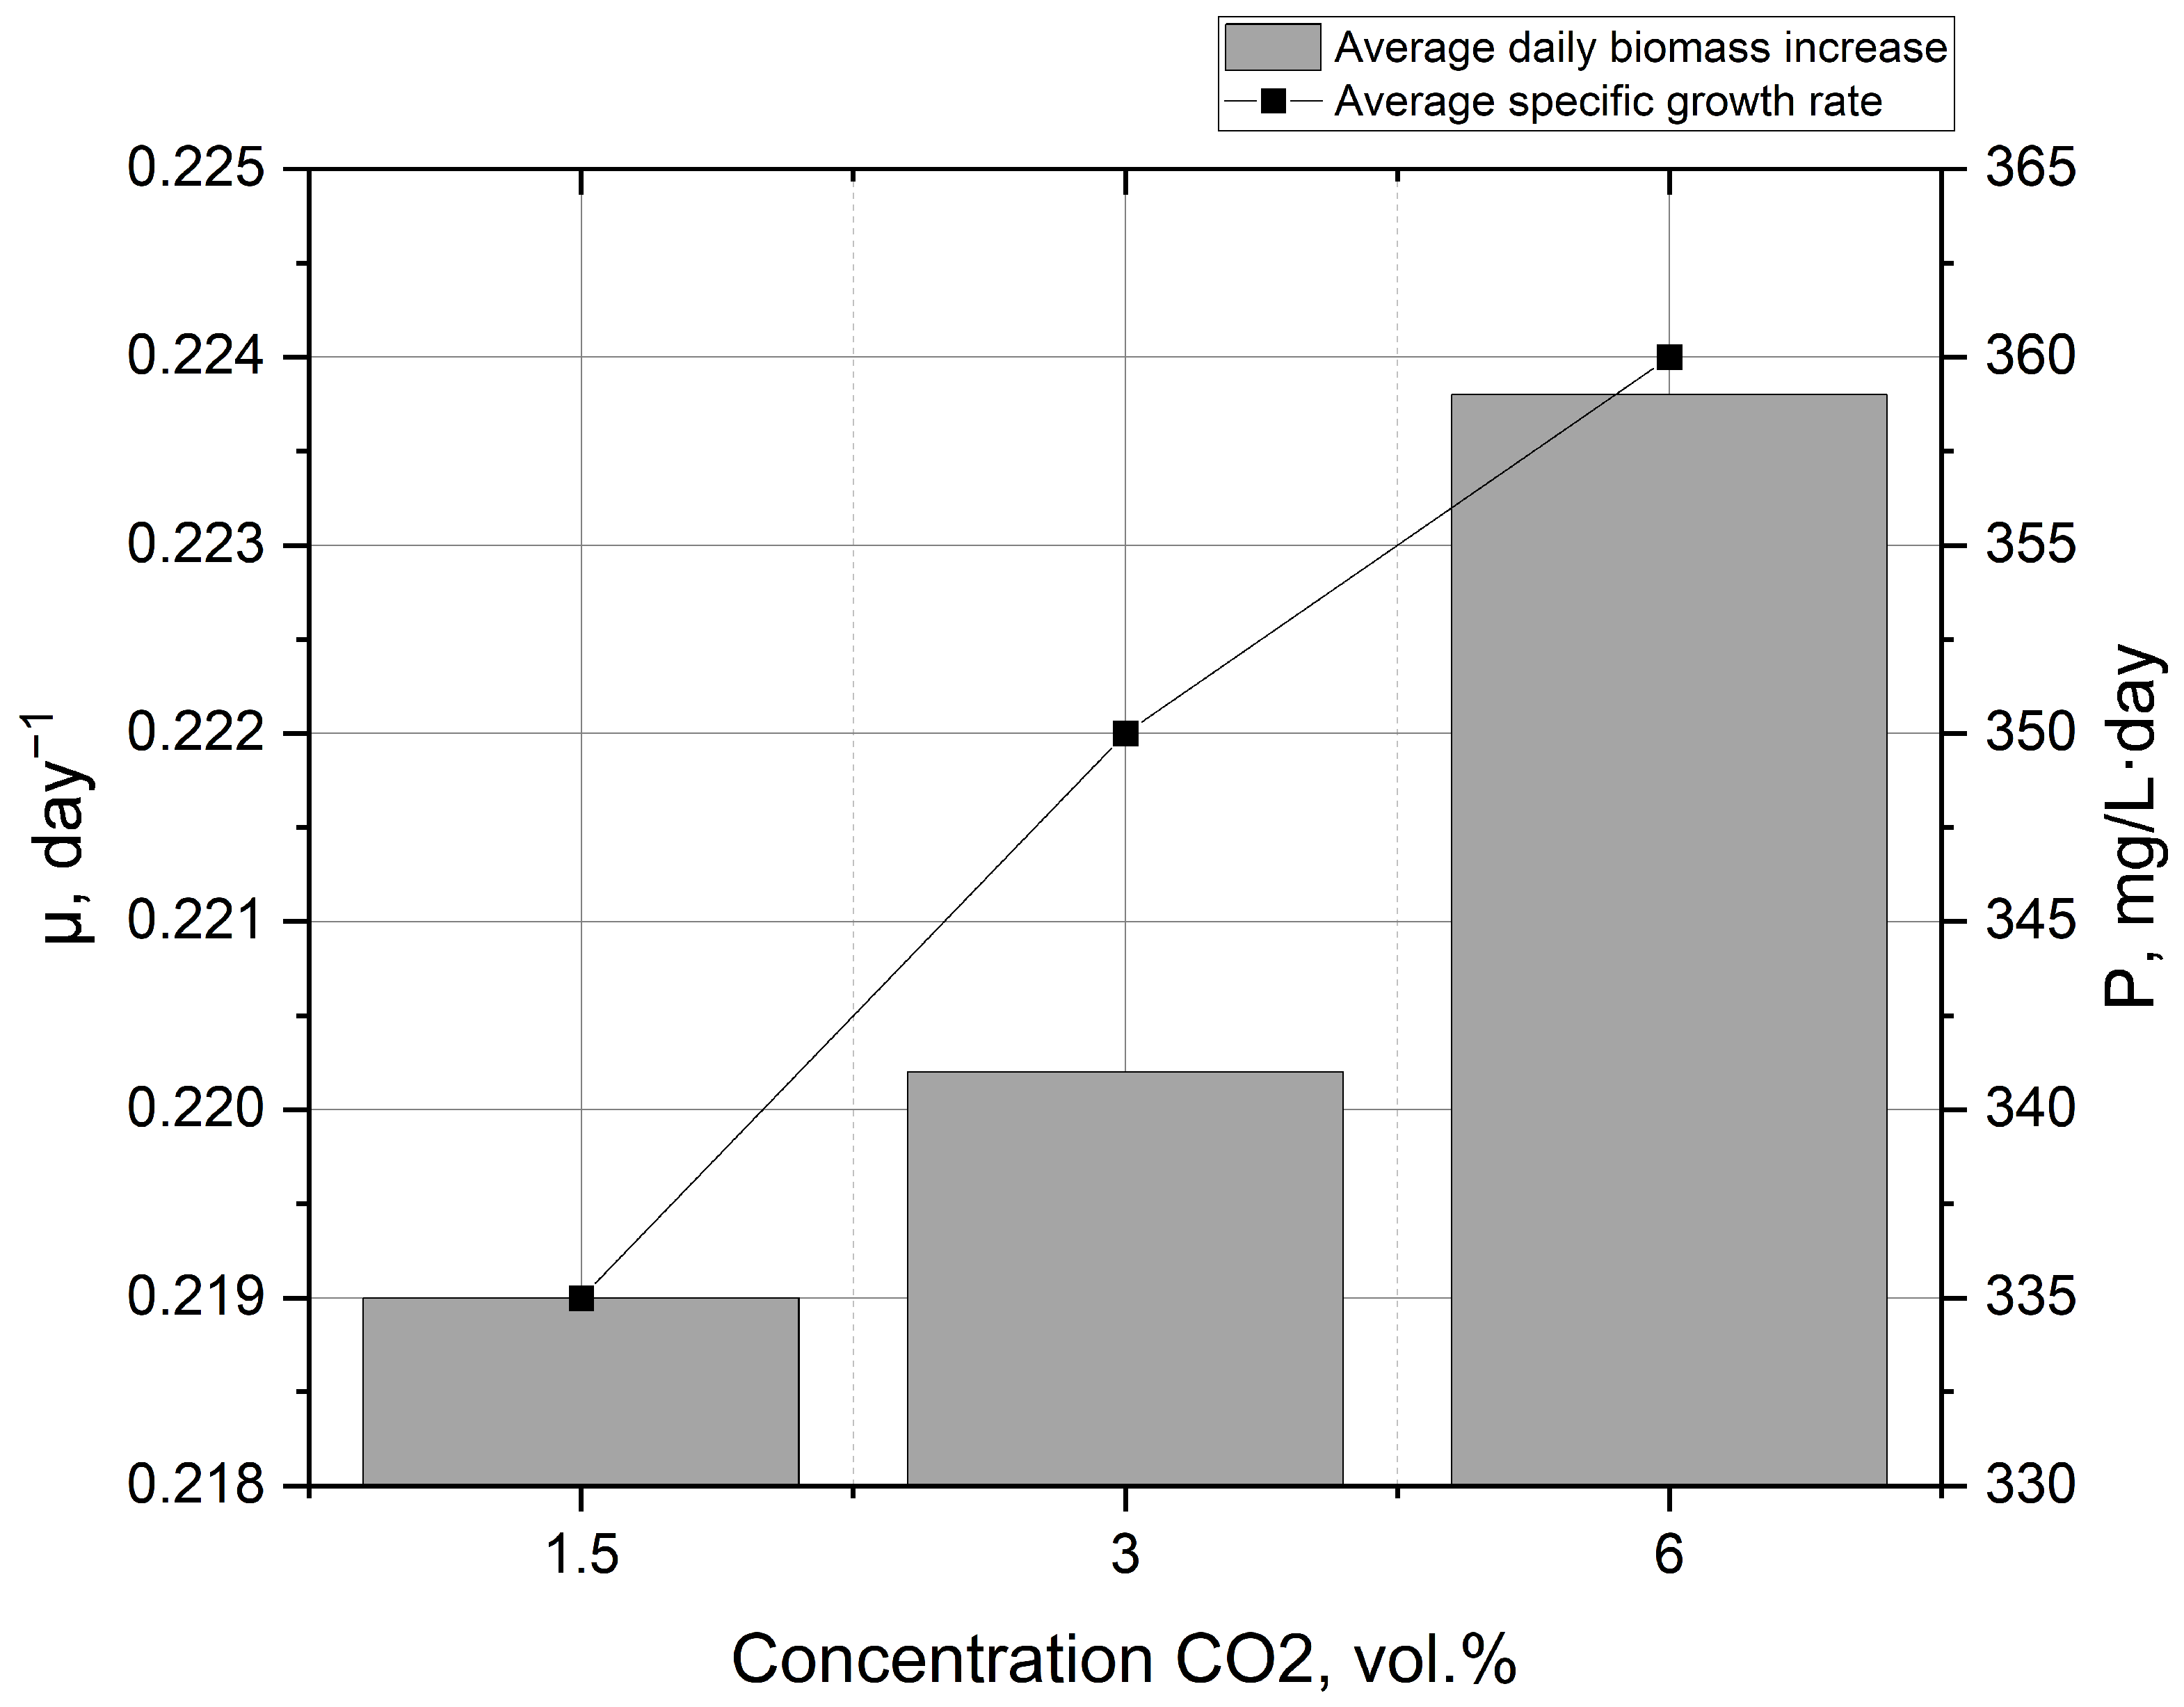
The specific growth rate (μ, day−1) and average daily biomass productivity (P, mg/L·day) were calculated using Equations (5) and (6), respectively, and used to quantitatively characterize the growth dynamics of the culture under different CO2 regimes.
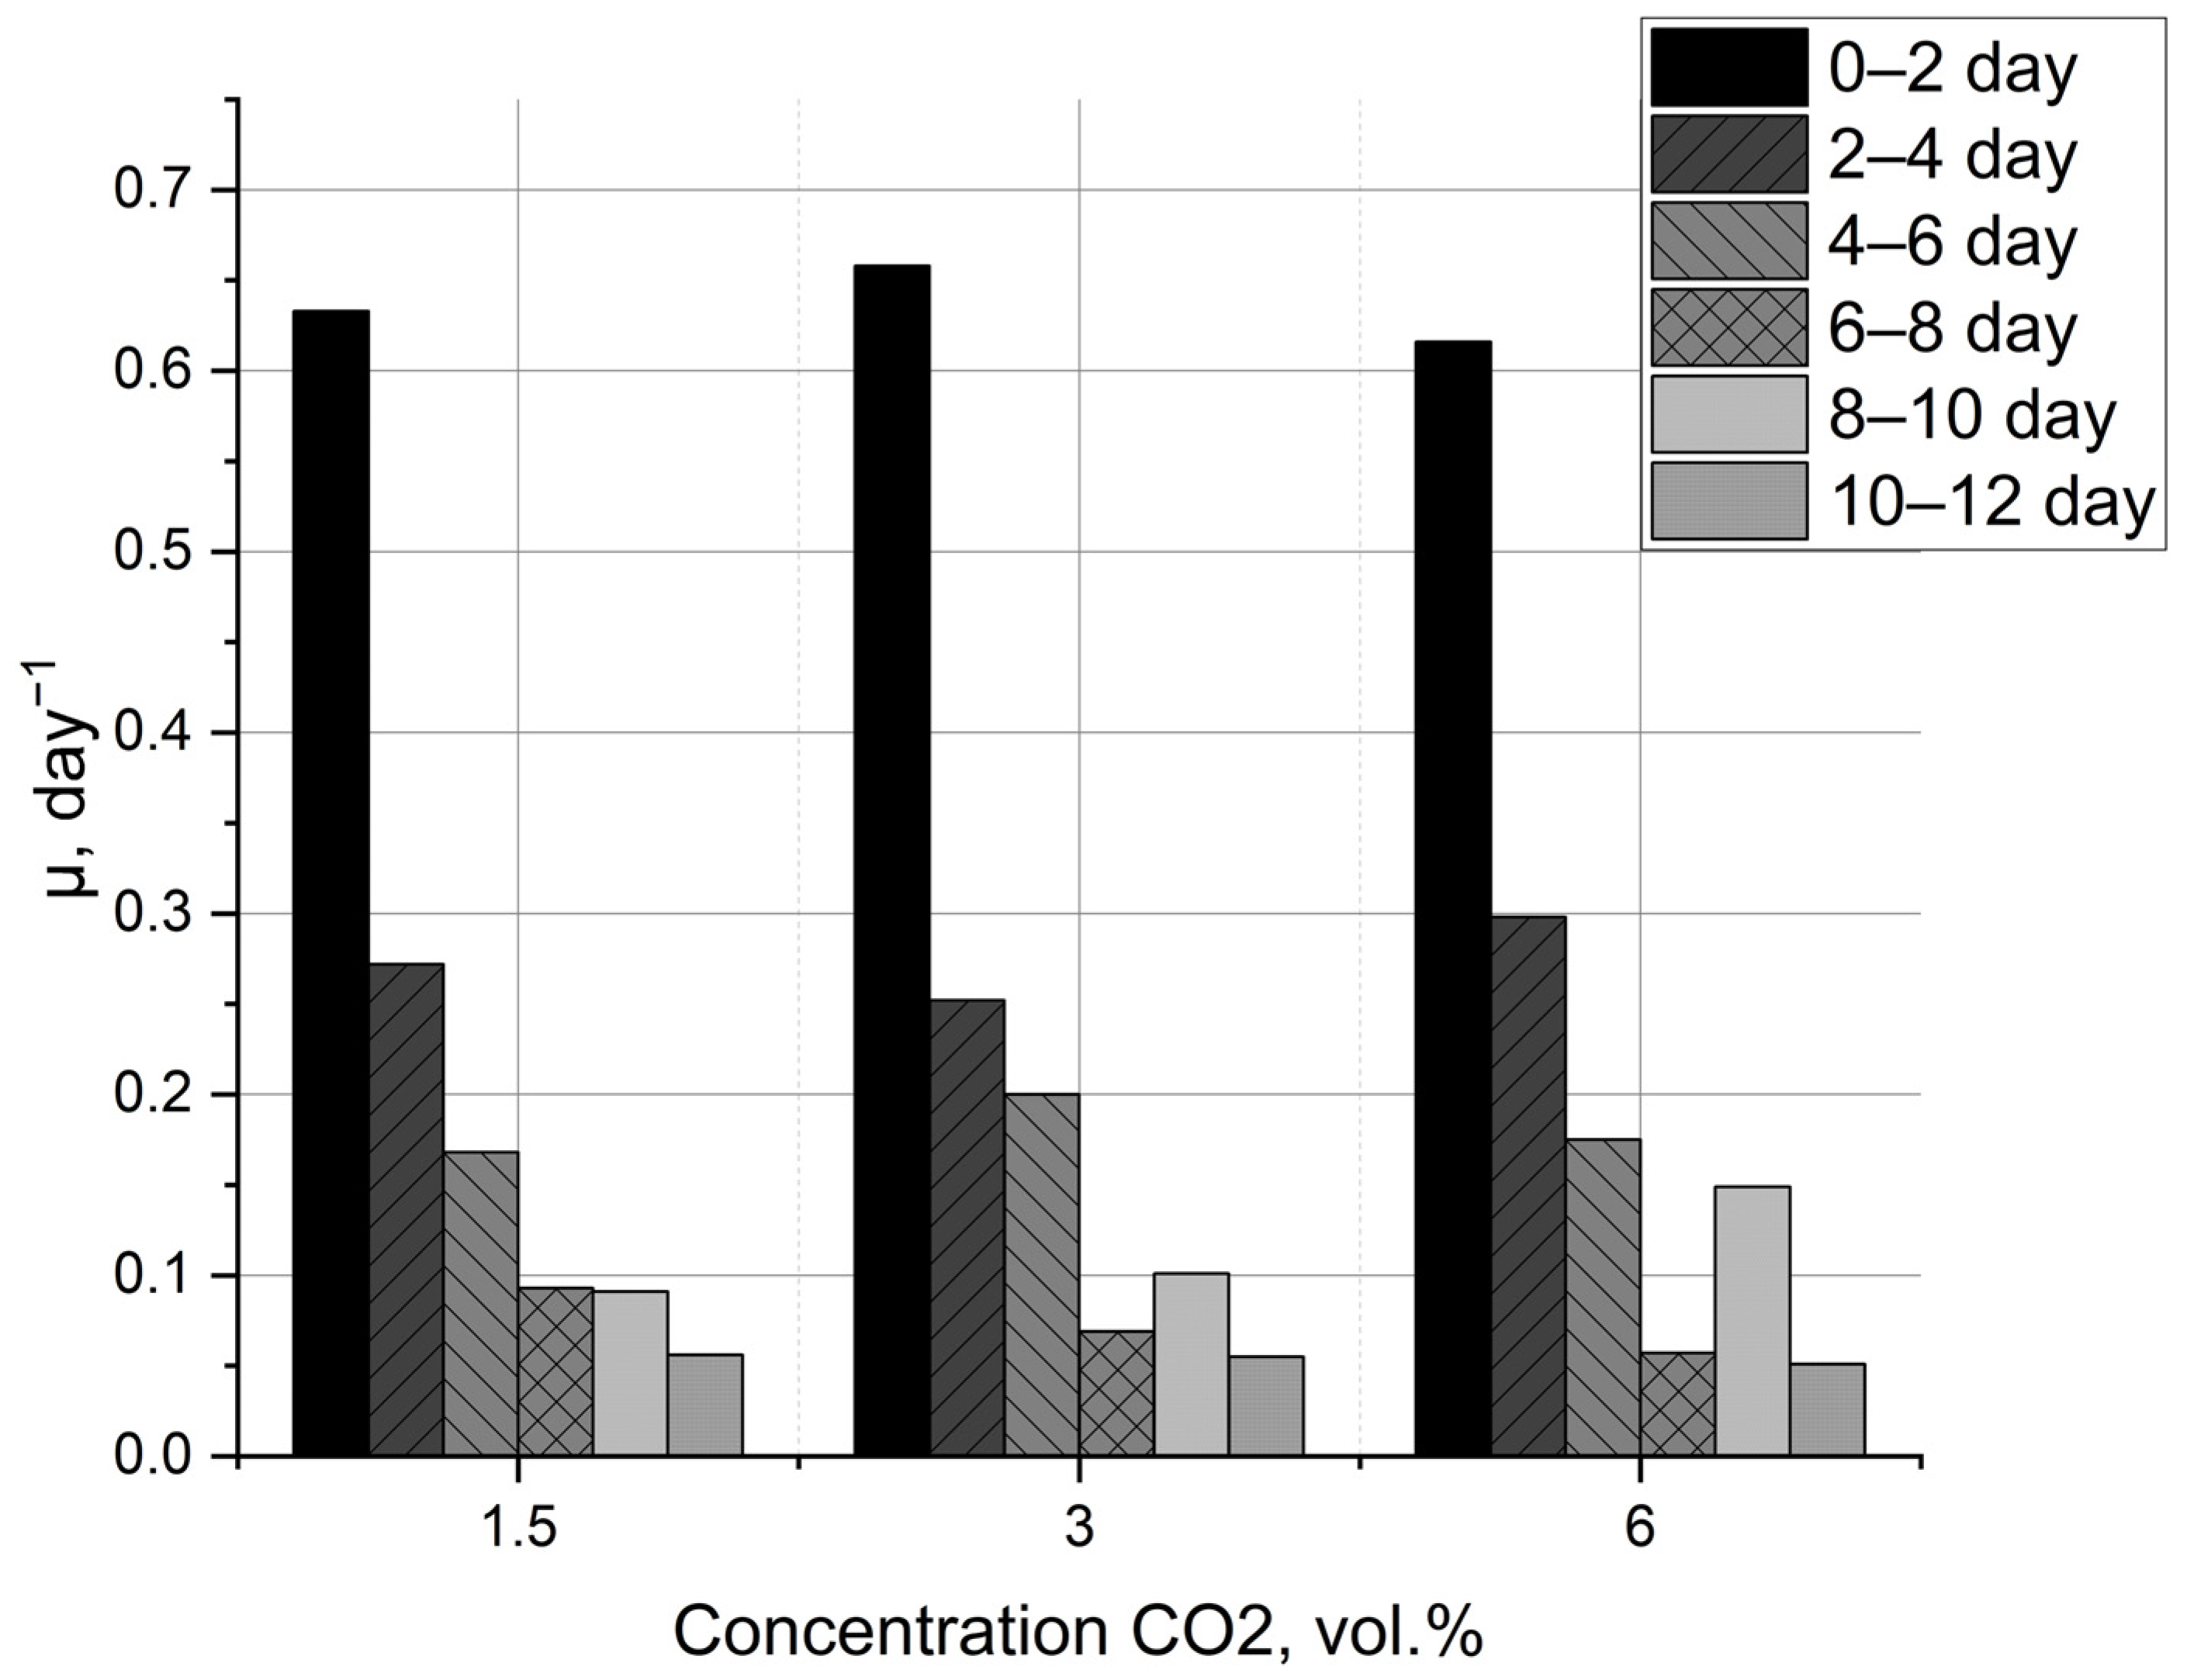
In all three experiments, the maximum specific growth rate was observed during the first two days of cultivation. In subsequent intervals, the rate gradually decreased, which is typical for a closed system under progressive resource limitation.
The most sustained preservation of relatively high μ values in the mid and late phases of the cycle was recorded at 6.0% CO
2 (
Figure 7). Under this regime, the decrease in growth rate was slower than at 1.5% and 3.0%, indicating better compensation for medium alkalinization (see
Section 3.5: at 6.0% CO
2, pH values were maintained in the range 8.75–9.30 throughout the cycle, whereas in the 1.5% CO
2 group, pH exceeded 9.8) and maintenance of high metabolic activity throughout the experiment. The average specific growth rate over the 12 days was highest precisely in the 6.0% CO
2 variant.
A similar picture is observed for average daily biomass productivity (
Figure 8): the maximum value was achieved at 6.0% CO
2, and the productivity in this regime markedly exceeded that of the 3.0% and especially the 1.5% CO
2 groups.
These results indicate that cultivation at 6.0% CO2 promotes both higher biomass accumulation and a longer period of active growth compared with the lower CO2 treatments.
Two-way ANOVA revealed a significant effect of cultivation period (
p < 0.001) and the CO
2 × Period interaction (
p < 0.001) on the average daily biomass increase, but no significant main effect of CO
2 concentration (
p = 0.256). The effect of CO
2 was observed only in specific periods: on days 2–4 (6% > 3%,
p = 0.018) and most pronounced on days 8–10 (6% > 1.5% and 3%,
p < 0.001). A more detailed description of the statistical analysis is provided in
Appendix A.2.
3.5. pH Dynamics of the Culture Medium
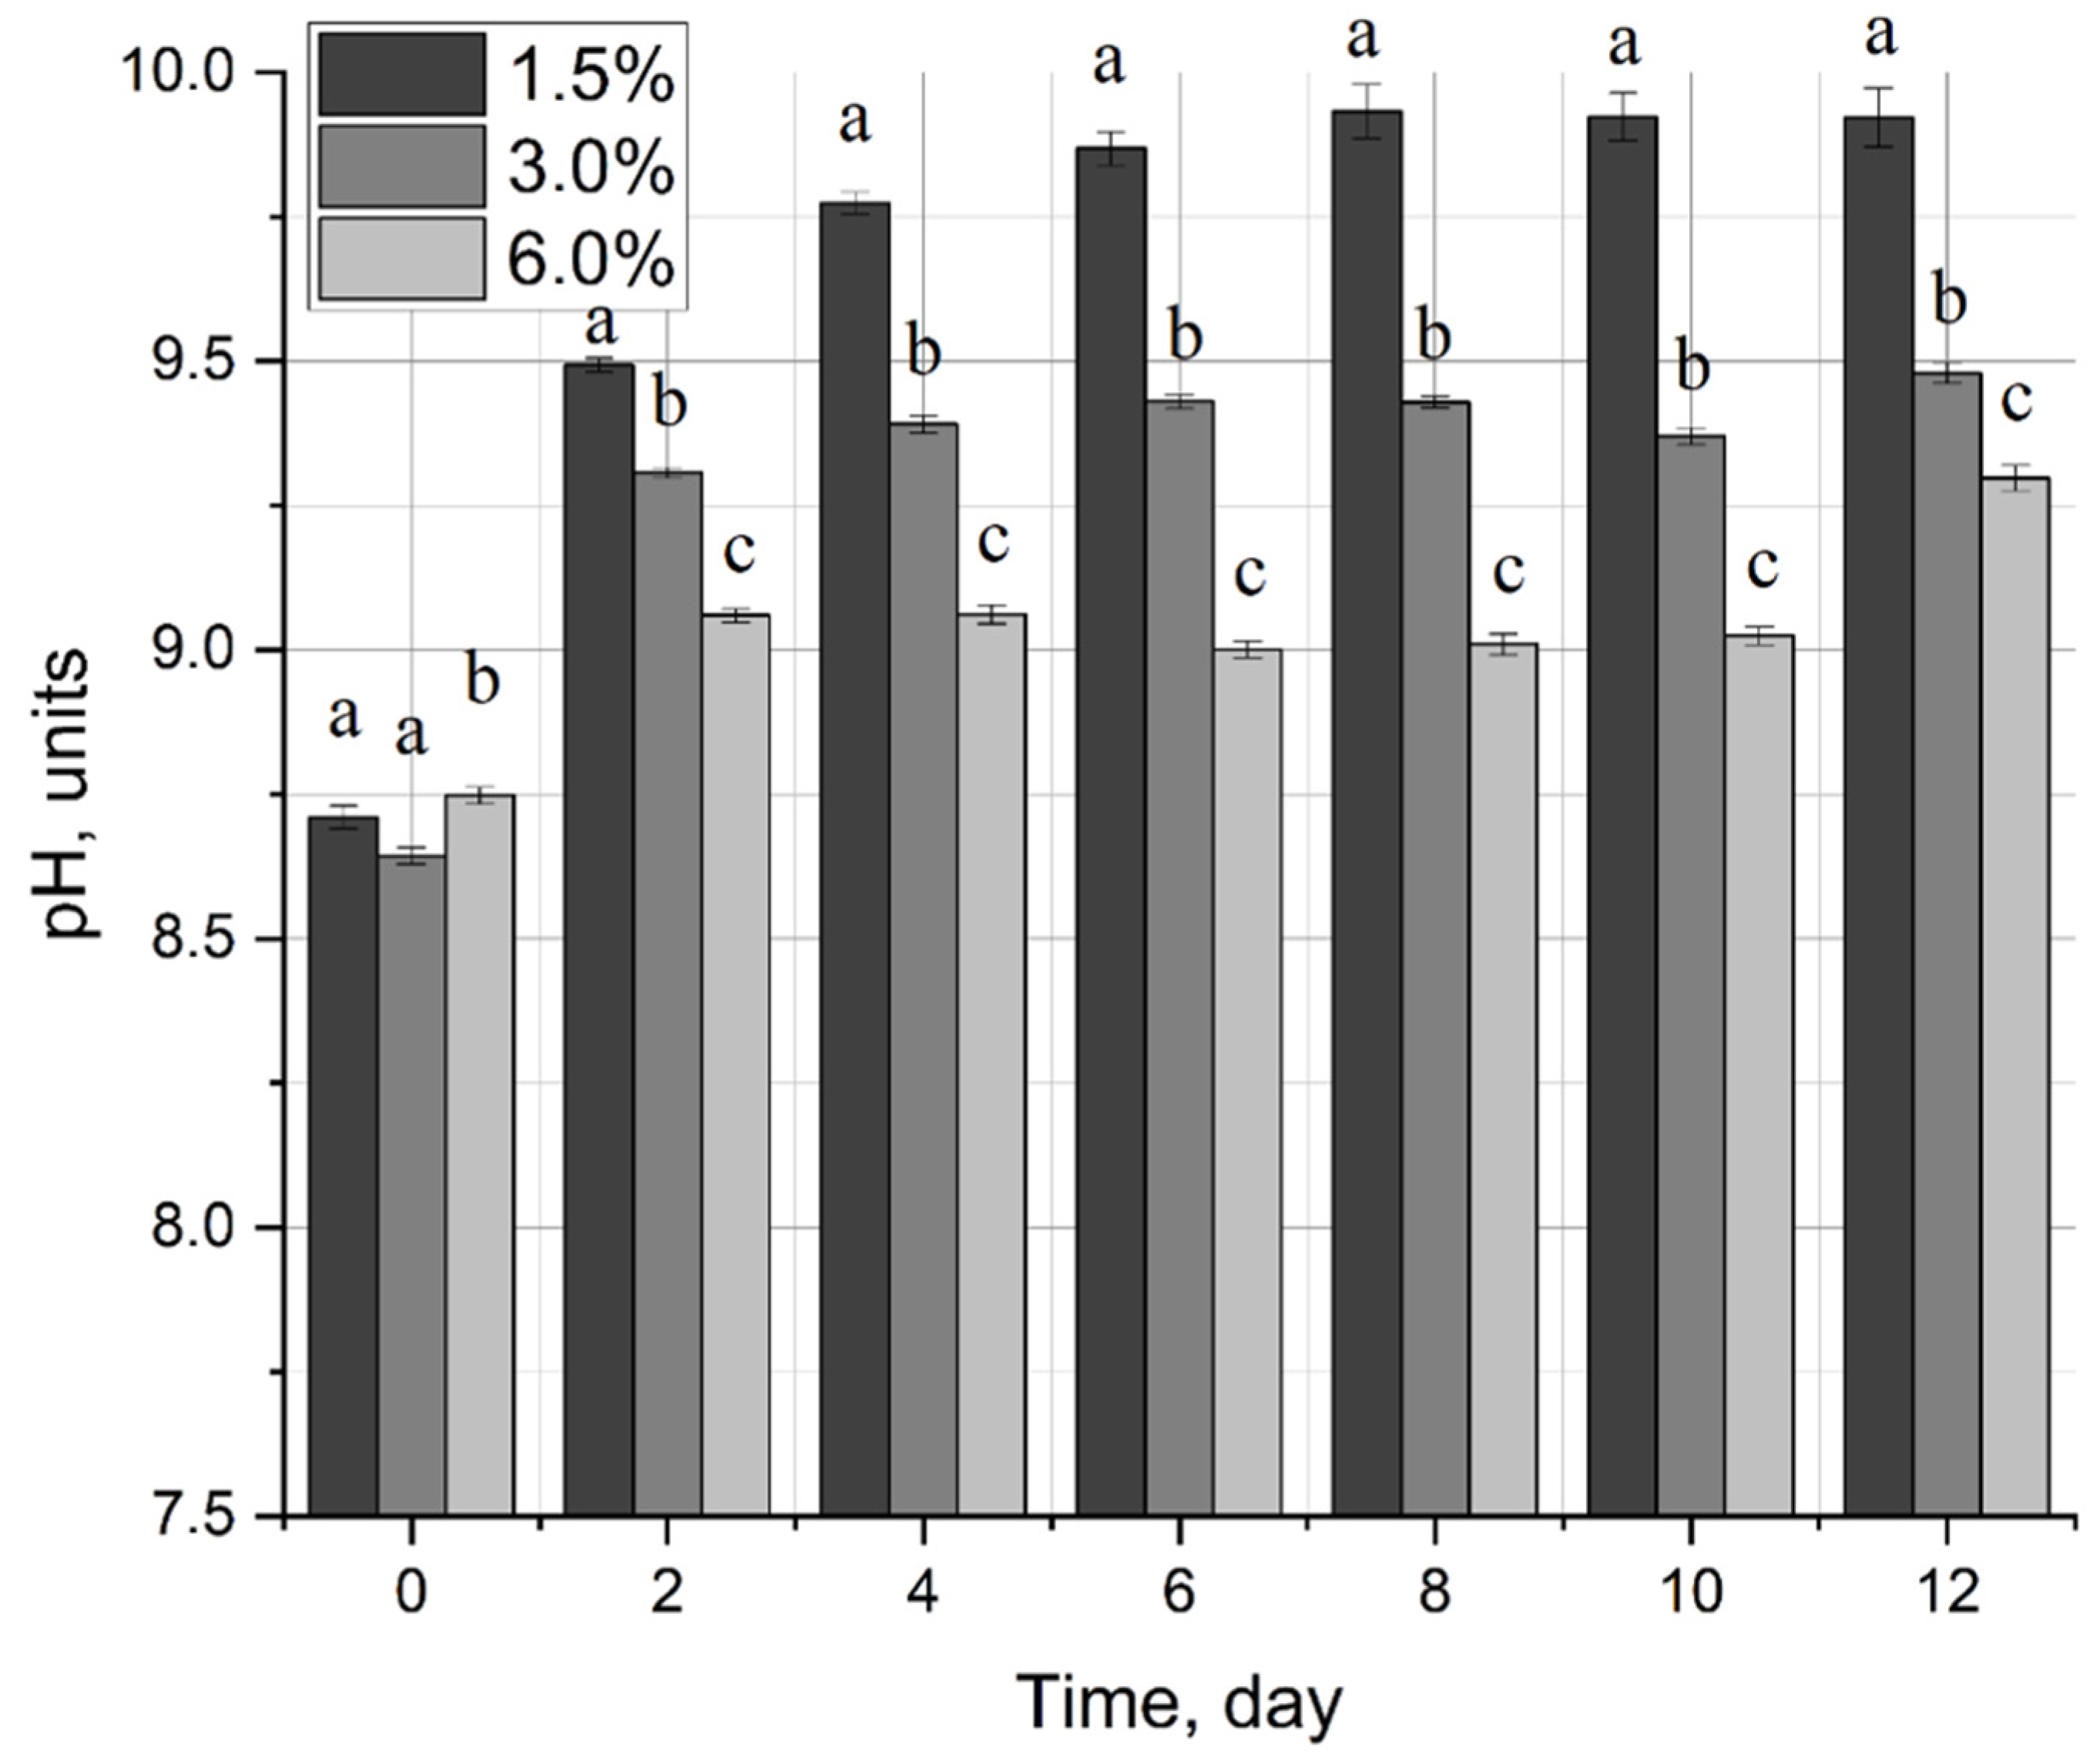
The change in pH of the culture medium during experiments with different CO
2 concentrations is shown in
Figure 9. Monitoring the pH during the growth of
A. platensis revealed a strong dependence between the concentration of carbon dioxide in the supplied gas–air mixture and the degree of medium alkalinization. In the initial period of cultivation, all experimental groups showed an intensive increase in pH, due to the active uptake of dissolved carbon dioxide by the microalgal cells during photosynthesis. The release of hydroxyl ions upon consumption of bicarbonate anions shifts the equilibrium towards the alkaline region, but the rate of this process differed significantly depending on the CO
2 concentration.
Typically, during spirulina cultivation, the pH of the medium tends to increase, shifting from initial values of 9.0–9.5 to values above 10.5–11.0 [
50]. This is associated with the active uptake of bicarbonate ions for photosynthesis, leaving the medium more alkaline. In our work, at 1.5% CO
2, the pH rose rapidly and, by the middle of the experiment. already exceeded 9.8, stabilizing in the final phase around 9.92. At 3.0% and 6.0% CO
2, the pH did not exceed 9.5 throughout the 12 days of cultivation, with the most stable and lower values (in the range 9.0–9.3) observed at 6.0% CO
2.
Two-way ANOVA revealed a highly significant effect of CO
2 concentration, cultivation time, and their interaction on pH (
p < 0.001 for all effects). One-way analysis by day showed that CO
2 significantly influenced pH on all days of the experiment (
p < 0.001). The largest difference in pH between 1.5% and 6% CO
2 was observed on day 8 (+0.923,
p < 0.001). Elevated CO
2 concentration (6%) suppressed medium alkalinization. A more detailed description of the statistical analysis is provided in
Appendix A.3.
Elevated CO2 concentrations effectively suppressed medium alkalinization. The most stable pH values were observed at 6.0% CO2, where pH remained between 9.0 and 9.3 throughout cultivation. This pH range is generally considered favorable for Arthrospira platensis growth and was associated with higher biomass productivity and prolonged metabolic activity.
3.6. Dynamics of Phosphate and Nitrate Consumption
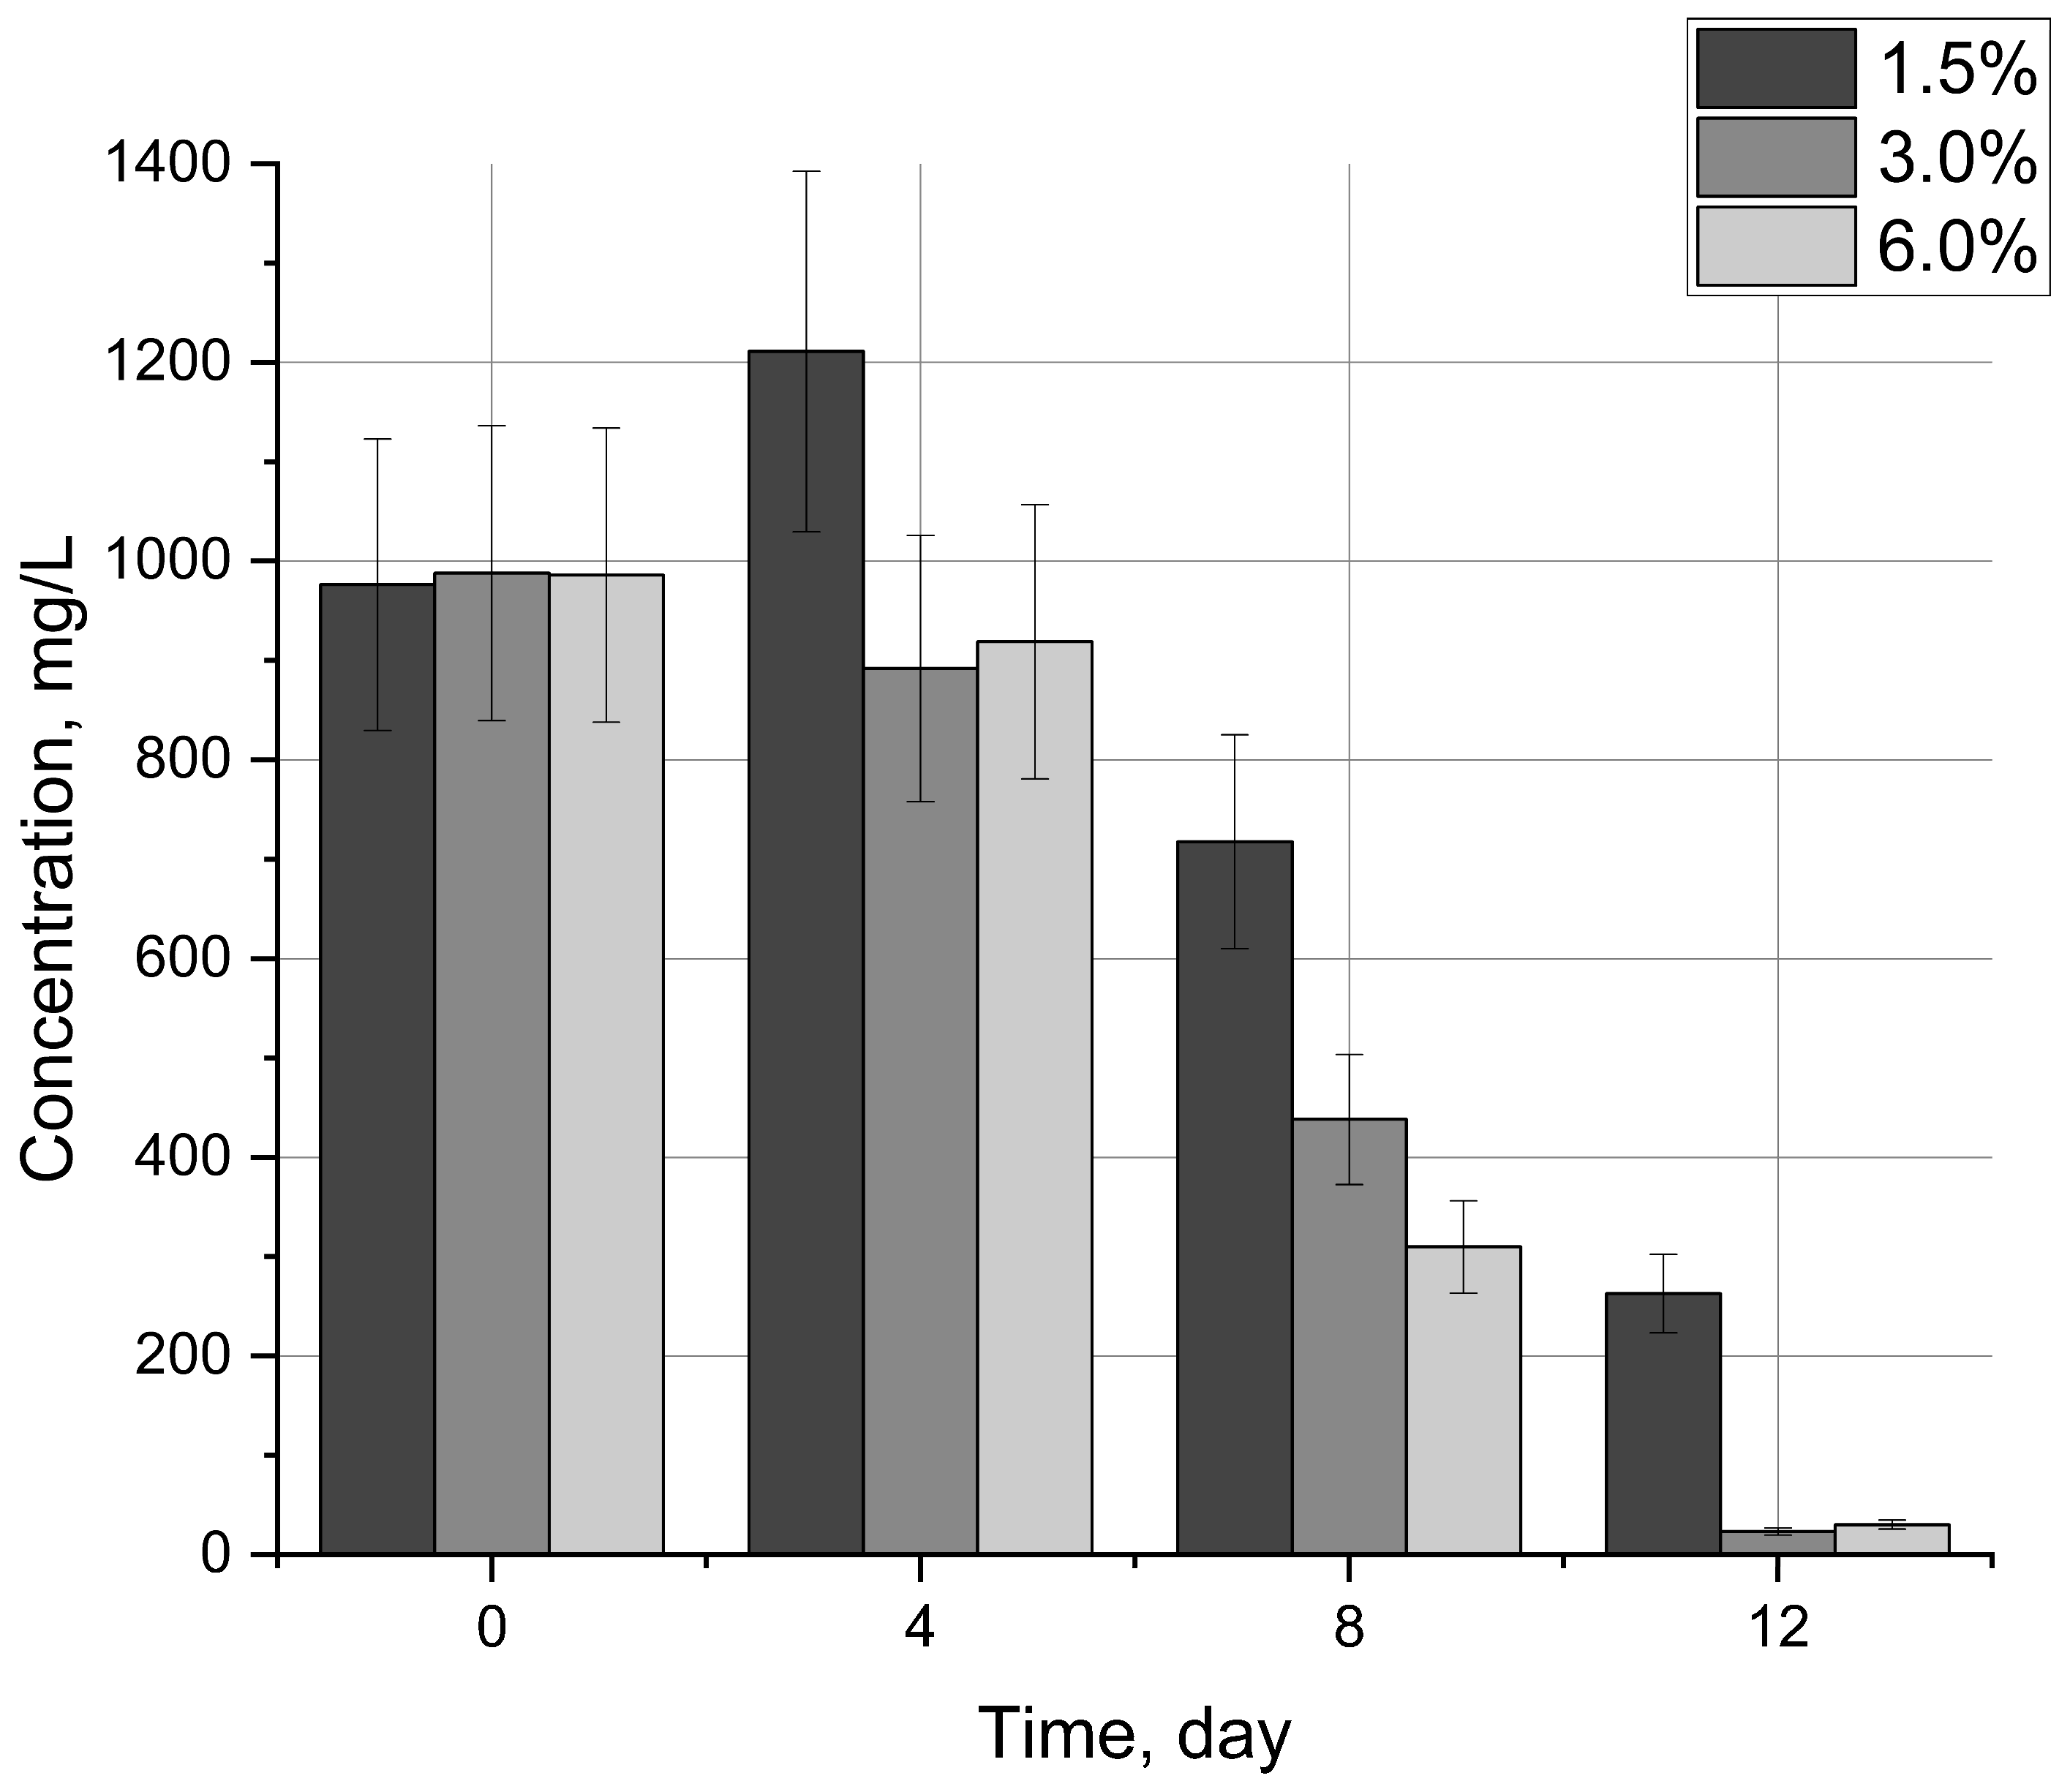
The efficiency of nitrogen (
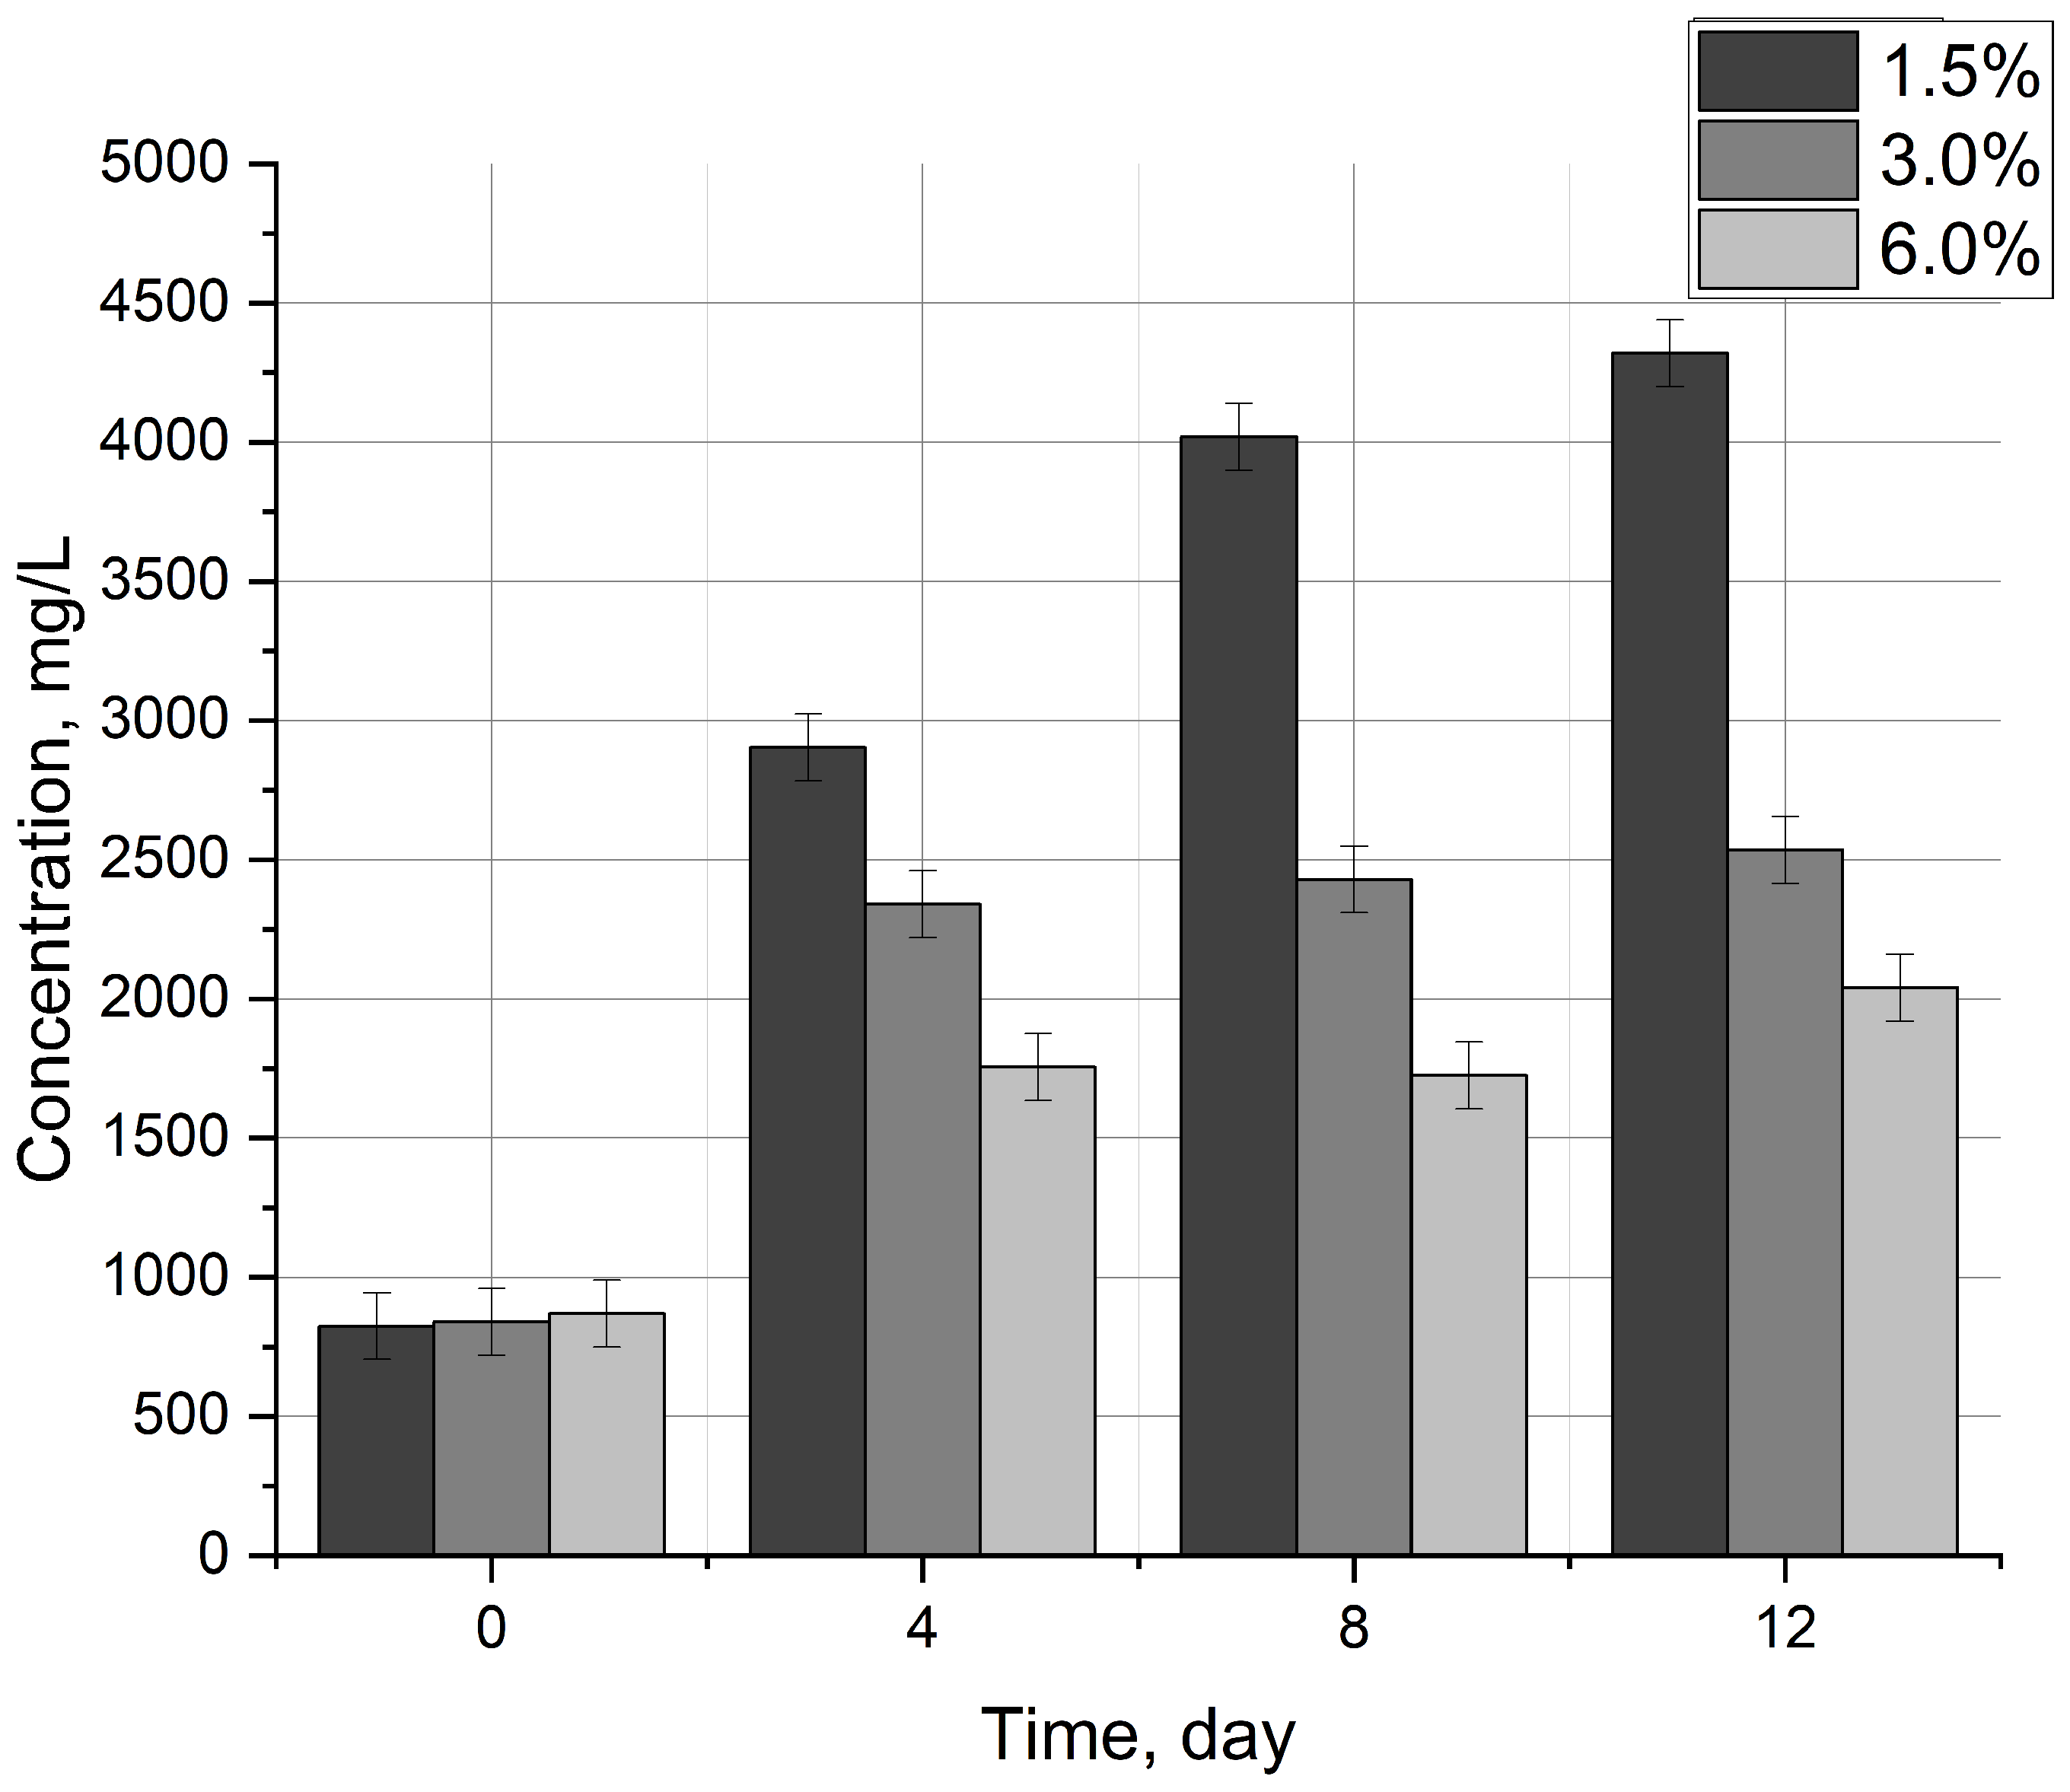
Figure 10) and phosphorus (
Figure 11) assimilation was directly dependent on the intensity of biomass accumulation and the regime of carbon dioxide enrichment of the culture. Analysis of nitrate ion changes in the medium showed that in all experiments, the microalgae actively used the nitrogen substrate, but the rate of its utilization varied. In the groups with elevated CO
2 content (3.0% and 6.0%), almost complete nitrate depletion was observed by the end of the cycle, which correlates with the higher growth rates of the culture under these conditions. In the 1.5% CO
2 experiment, the nitrogen concentration in the medium decreased less intensively, remaining at a substantially higher level by day 12 compared to the other regimes. This may be attributed to carbon limitation (at low CO
2 content) slows down metabolic activity and reduces the population’s demand for other nutrients.
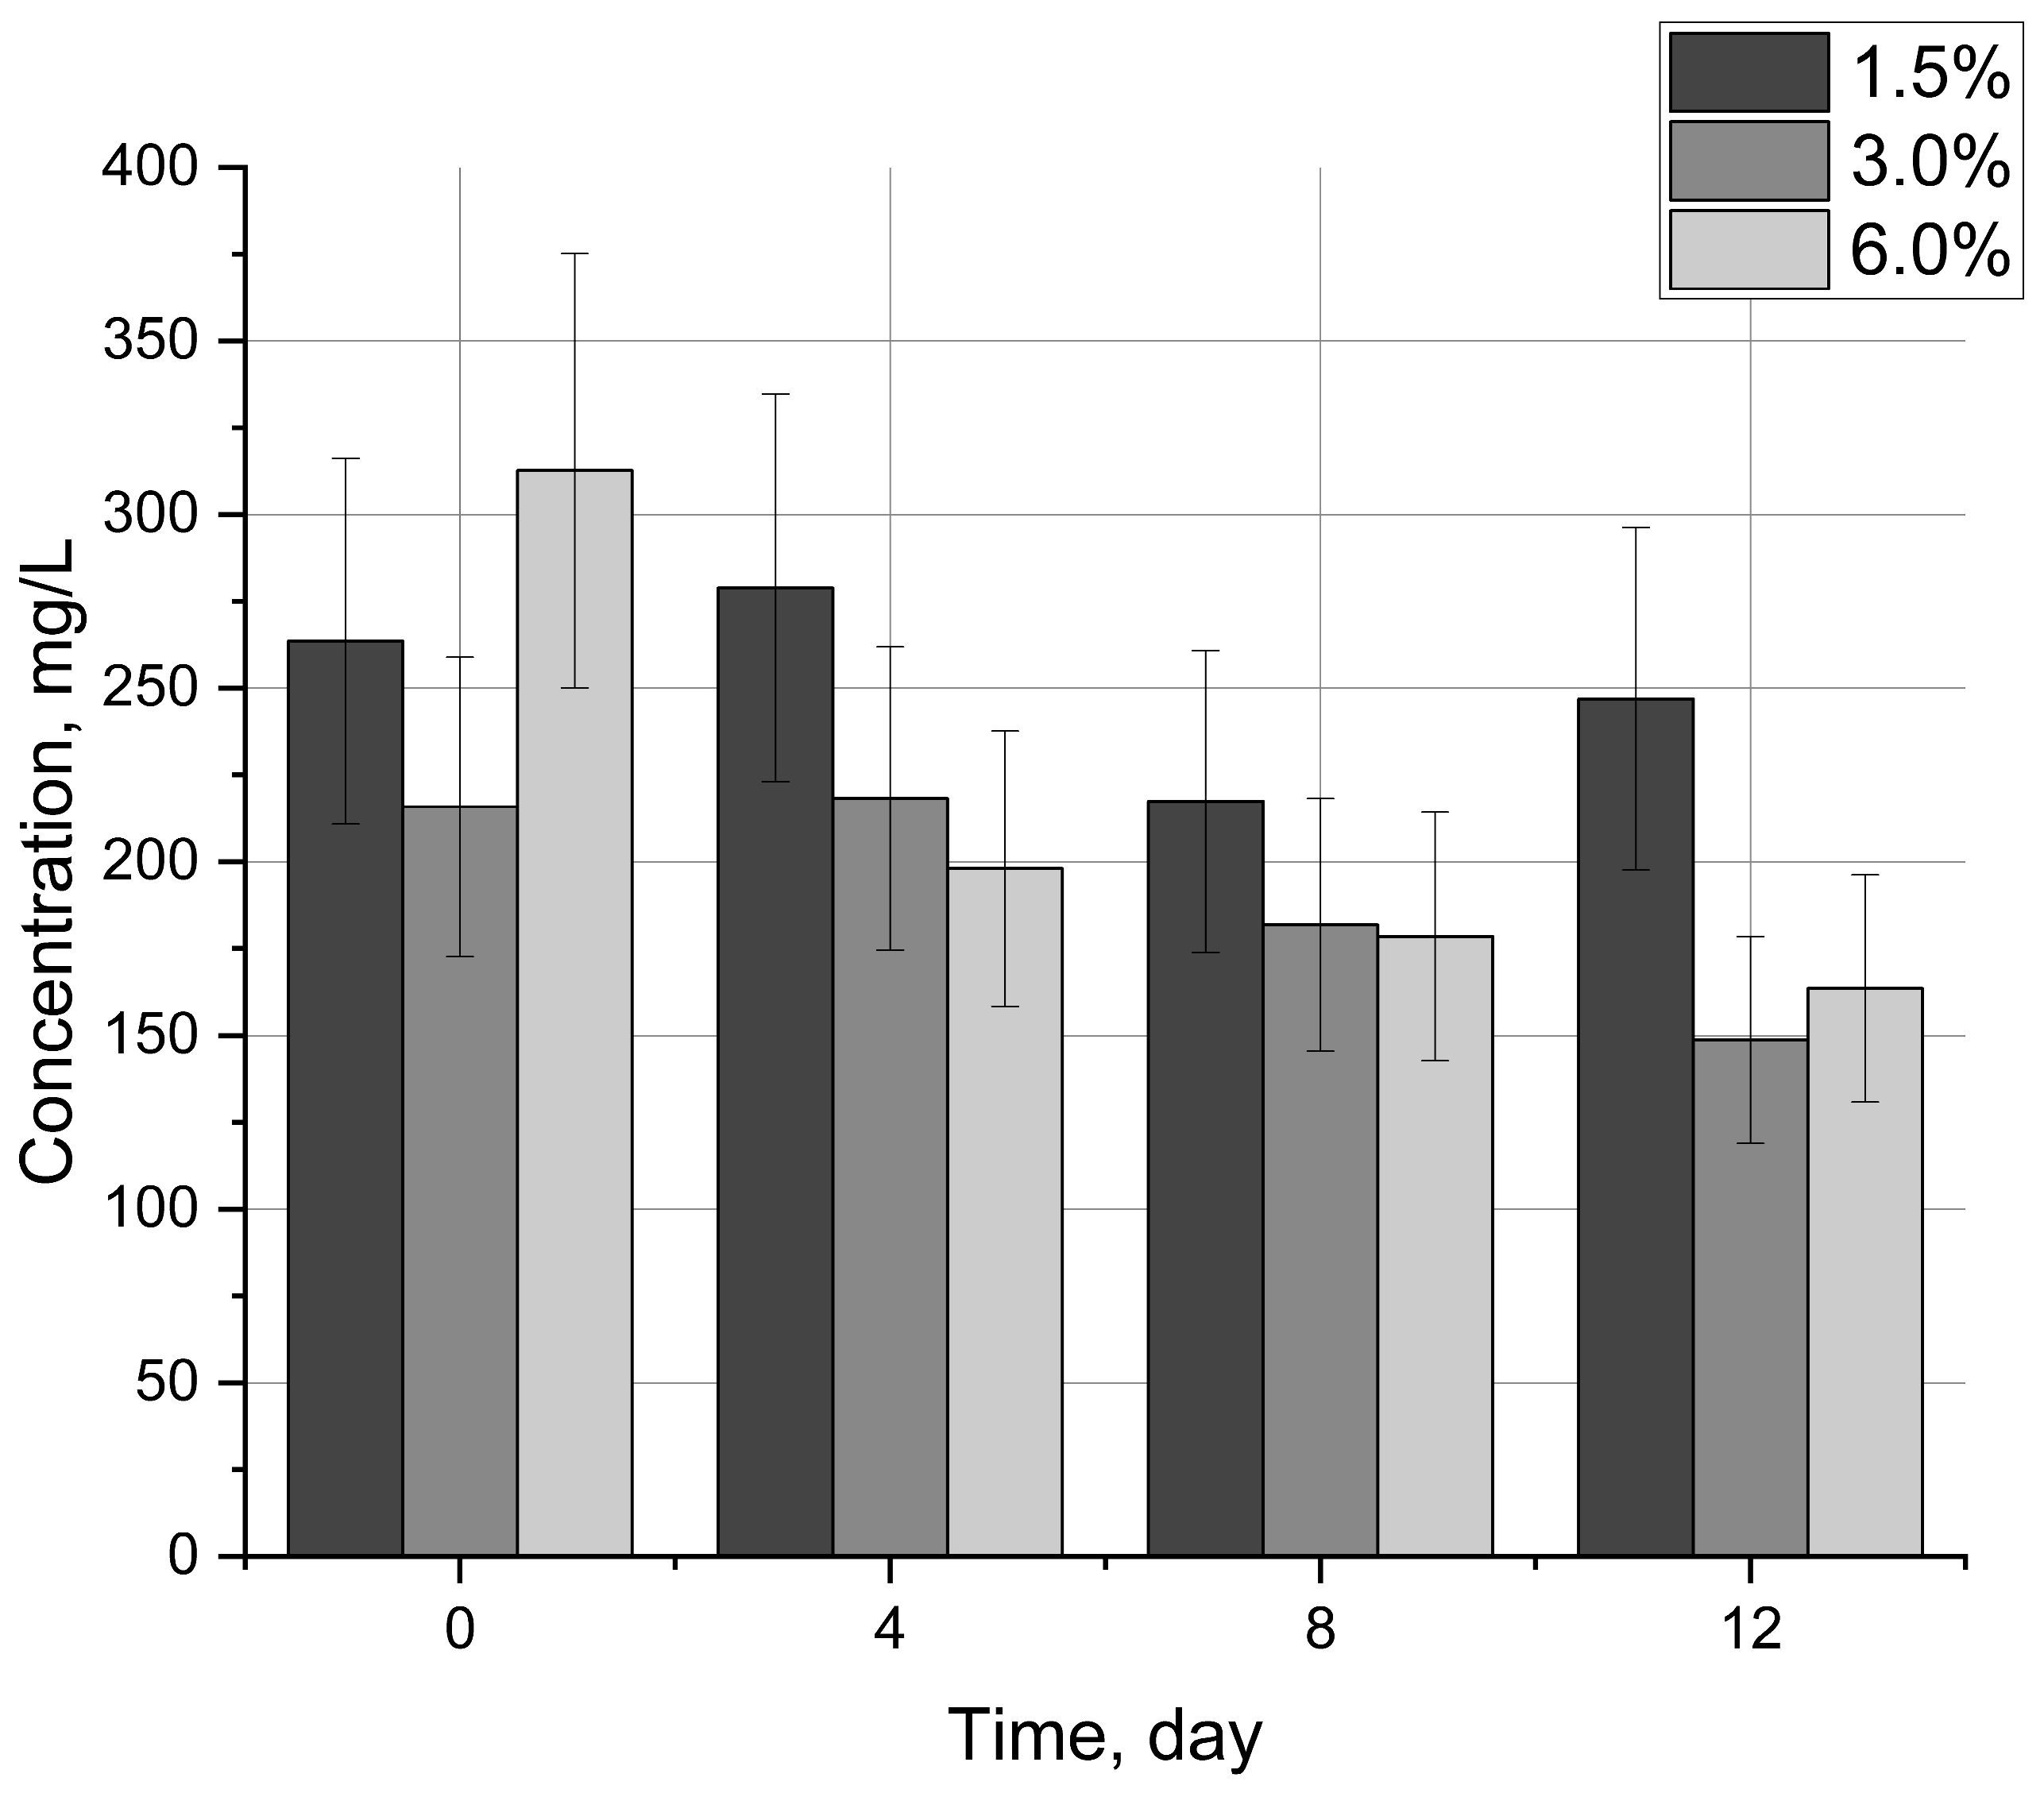
The dynamics of phosphate content in the culture medium also correlated with the overall productivity of the system. The deepest decrease in phosphorus concentration was recorded in the 6.0% CO2 experiment, where active biomass growth required intensive incorporation of the element into nucleic acids and ATP. Notably, at the maximum carbon dioxide saturation, the phosphate consumption curve showed a steeper slope during periods of pH stabilization, indicating optimization of ion uptake biochemical processes under a balanced carbonate buffer.
Differences in initial phosphate concentrations between groups (1.5% CO2—263.6 mg/L; 3.0% CO2—215.8 mg/L; 6.0% CO2—312.7 mg/L) were due to unavoidable variability in medium preparation and distribution among the photobioreactors. These differences were taken into account when analyzing the phosphate consumption dynamics: the relative decrease in concentration relative to the initial value of each group was assessed.
The 6.0% CO2 treatment showed the highest nitrate and phosphate consumption, consistent with its superior biomass productivity.
However, the comparison with
Figure 7 shows that nutrient depletion did not substantially affect the dynamics of biomass accumulation. The relative error for the test kit is 20% for phosphates and 15% for nitrates.
3.7. Dynamics of Bicarbonate and Carbonate Changes
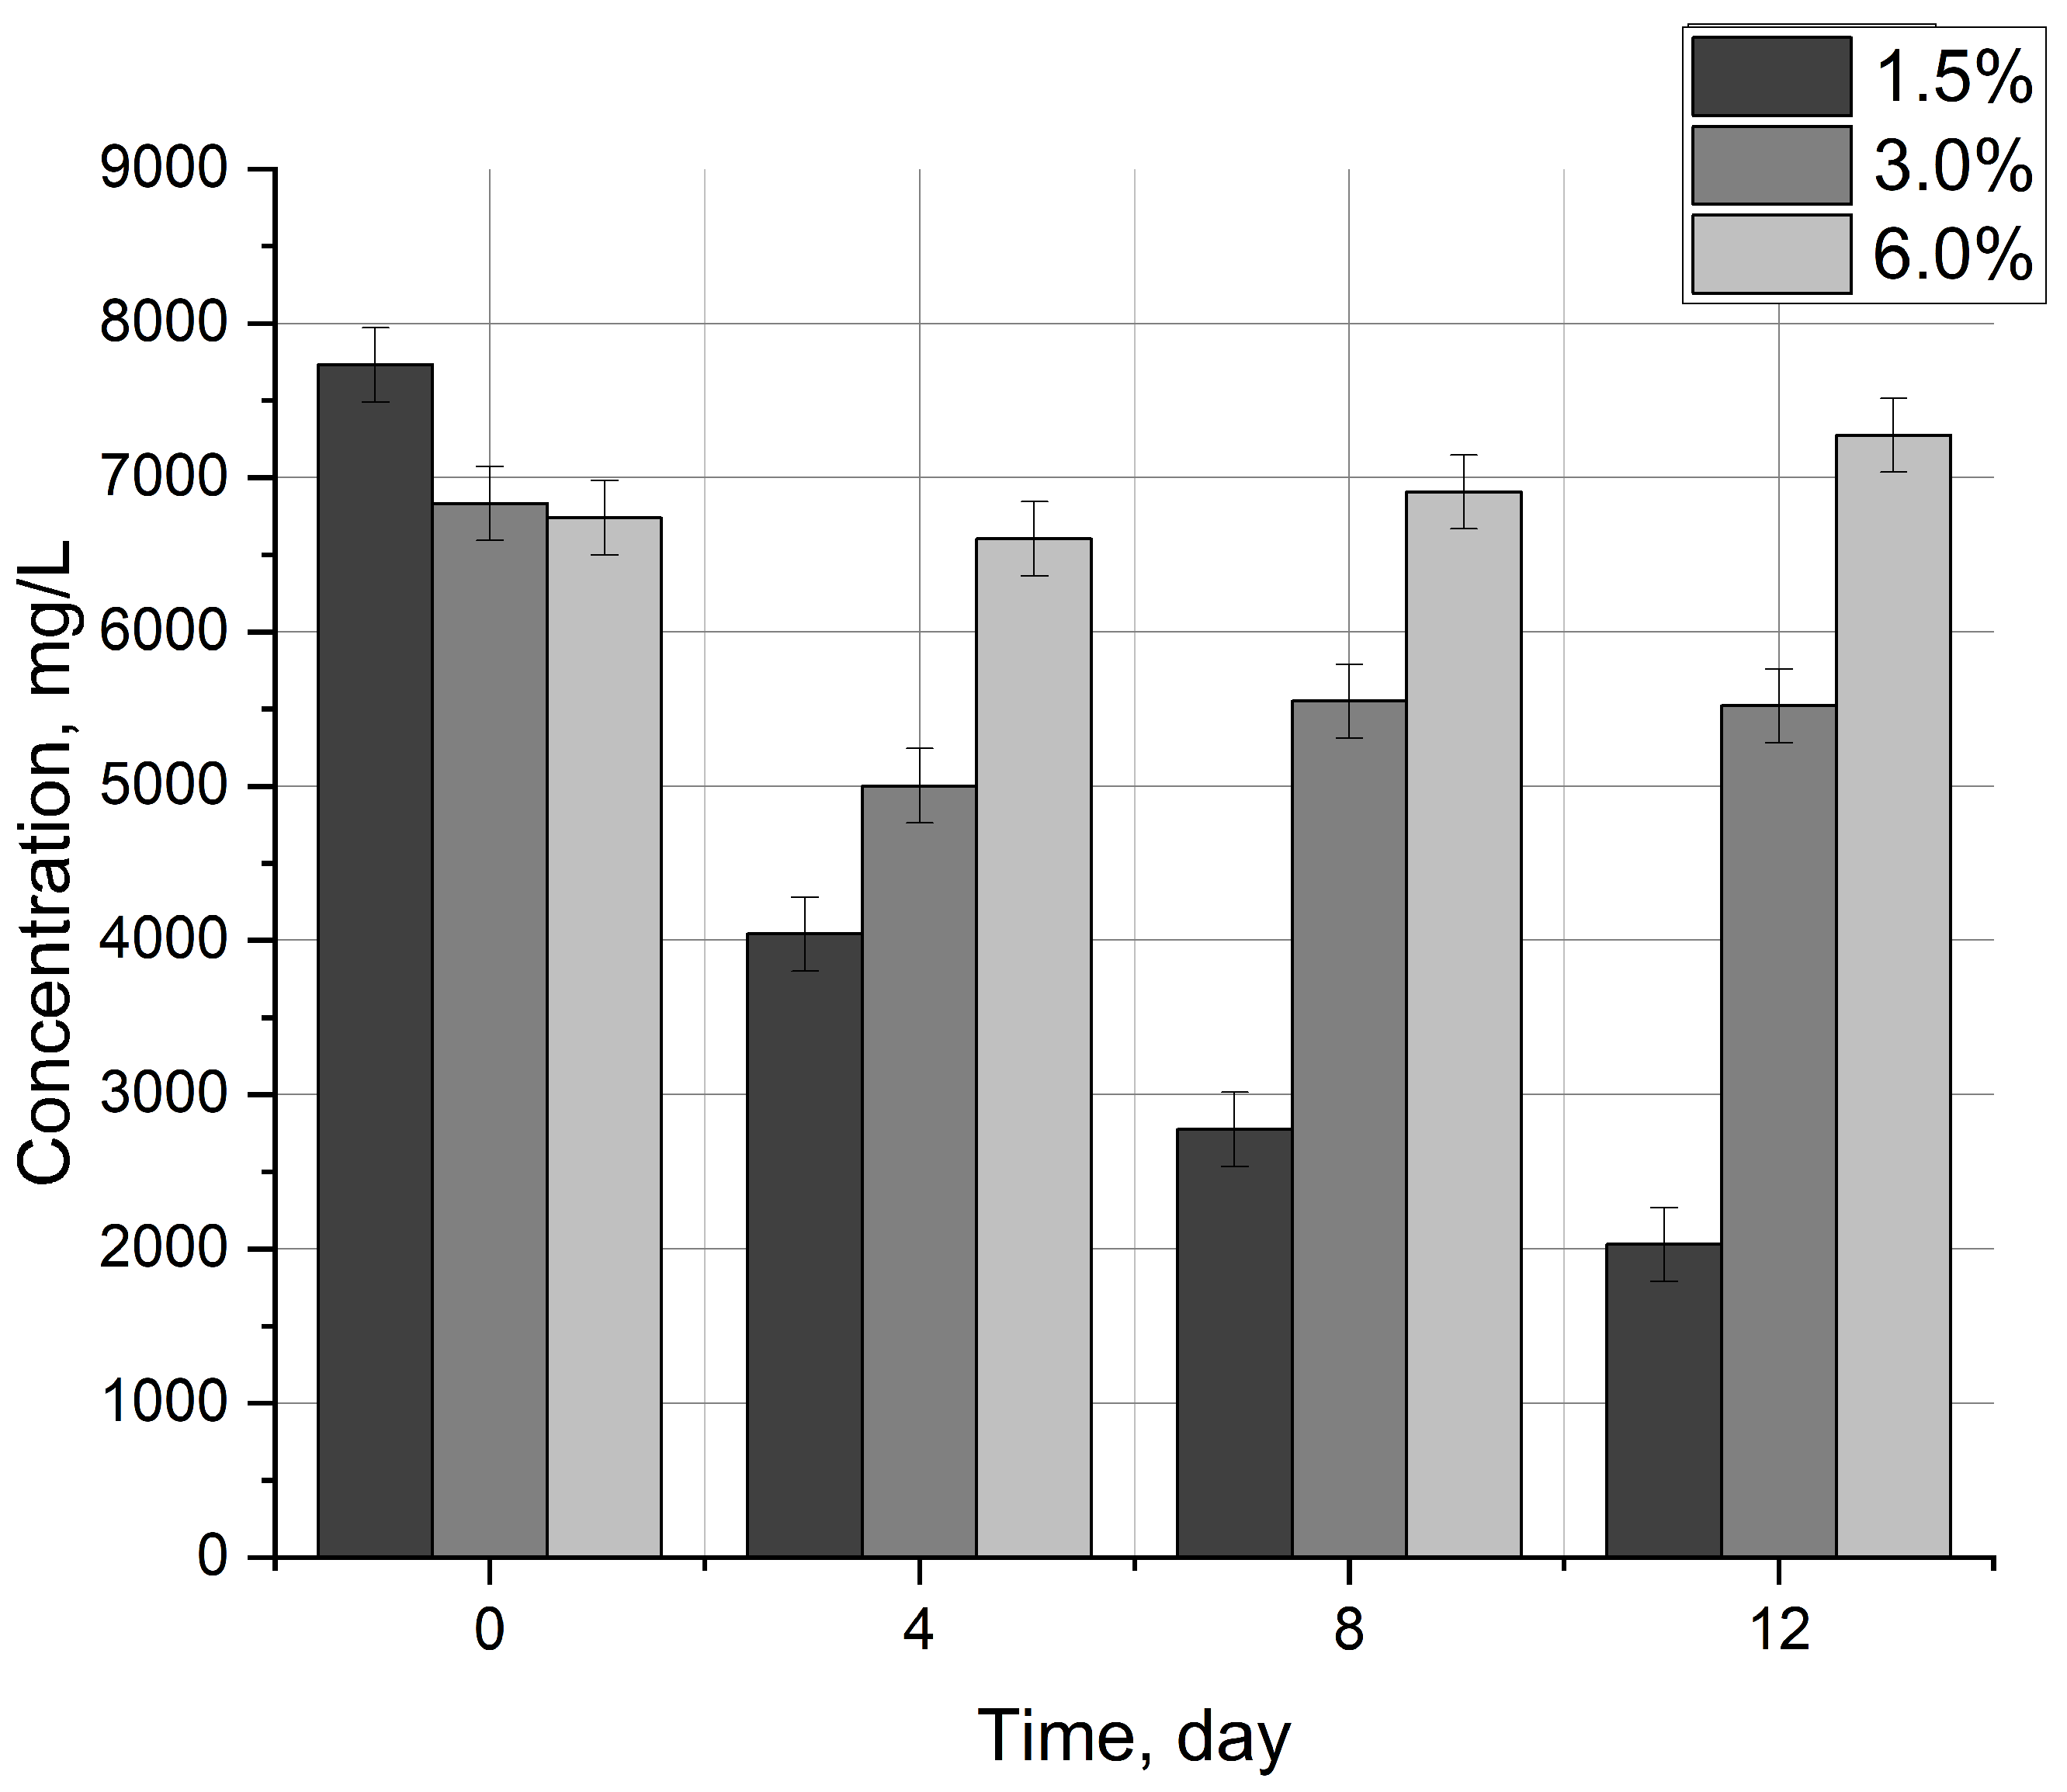
The transformation of inorganic carbon in the culture medium was closely correlated with bubbling intensity and pH level. Throughout the cultivation cycle, substantial differences in the concentration ratios of bicarbonate (HCO
3−) (
Figure 12) and carbonate ions (CO
32−) (
Figure 13) were observed between the experimental groups.
In the experiments with 1.5% and 3.0% CO2, a decrease in bicarbonate content was noted as biomass grew. In the 1.5% CO2 experiment, the decrease in bicarbonate content was more pronounced. By the end of the experiment in the 1.5% CO2 group, the HCO3− concentration reached its minimum (about 2 g/L), which, against the background of high pH values (above 9.8), indicates almost complete removal of available carbon substrate and a shift in equilibrium towards carbonate accumulation. The stable increase in CO32− concentration under these conditions confirms a deficit in dissolved carbon dioxide, unable to compensate for the changes caused by photosynthetic activity.
A fundamentally different dynamics was recorded in the 6.0% CO2 regime. Unlike the previous variants, the bicarbonate concentration in this group not only did not decrease but showed a tendency to increase, stabilizing at a level several times higher than in the 1.5% CO2 experiment. The accumulation of bicarbonate ions enhanced the buffering capacity of the medium and contributed to the temporary stabilization of pH observed during the middle stage of cultivation. The high partial pressure of CO2 in the supplied mixture promoted intensive gas dissolution and its conversion to HCO3−, creating a significant reserve of inorganic carbon.
The carbonate ion content in the 6.0% CO2 experiment remained at a consistently low level throughout the experiment. This indicates that under excessive saturation of the system with carbon dioxide, the carbonate equilibrium is constantly shifted towards bicarbonates—the most preferred form of carbon for assimilation by A. platensis. Thus, a concentration of 6.0% CO2 not only ensures maximum substrate availability but also forms a powerful buffer system, preventing critical shifts in the chemical composition of the medium even at high culture density. The measurement error for carbonates and bicarbonates is estimated based on the titration process error at ±120 mg/L and ±240 mg/L, respectively.
The carbonate system dynamics observed in this work are consistent with patterns described in the literature. During
A. platensis cultivation, the concentration of carbonate ions in the medium usually increases, while the concentration of bicarbonate ions—the main source of inorganic carbon for photosynthesis—decreases [
47,
48]. This is due to active consumption of HCO
3− by cyanobacterial cells and the accompanying rise in pH, which shifts the carbonate equilibrium towards CO
32− [
51]. Specifically, [
52] showed that when cultivating
A. platensis in photobioreactors without additional CO
2 supply, the bicarbonate concentration drops almost to zero by the end of the cycle against a pH increase above 10.5. Similar results were obtained in [
53], where under periodic CO
2 supply (5–10%), it was possible to maintain HCO
3− concentration at 0.03–0.09 mol/L and pH in the range 9.5–10.0, which corresponds to optimal conditions for spirulina growth. In the present work, a concentration of 6.0% CO
2 provided a stable reserve of bicarbonates throughout the 12-day cycle, whereas at 1.5% CO
2, progressive depletion was observed—dynamics typical of carbon-limited systems [
51]. A key difference of this study from a number of published works is that at 6.0% CO
2, the HCO
3− concentration not only did not decrease but showed a tendency to accumulate.
3.8. Biomass Yield
The final dry biomass mass per photobioreactor and the dry biomass concentration in the photobioreactor contents are presented in
Table 2.
The dry biomass concentration obtained by direct weighing after filtration and drying was used to verify the empirical conversion factor of OD to spirulina concentration. Based on the data from three experiments, the final conversion factor was 0.892 ± 0.014 g/L per OD unit, and it was used in Formula (1) to calculate the final dry mass of spirulina per PBR.
3.9. CO2 Capture and O2 Generation
CO
2 capture and O
2 generation were evaluated using three independent approaches: direct monitoring of gas composition changes within the chamber atmosphere, stoichiometric estimation based on O
2 and CO
2 dynamics, and calculation from final biomass accumulation. The results are presented in
Table 3 and
Table 4. Among these approaches, biomass-based calculations were considered the most reliable indicators of biological CO
2 fixation and O
2 production because they are directly linked to the amount of carbon incorporated into cellular material and are not affected by gas leakage from the chamber. Therefore, the values of
φbiomasscalc and
ηbiomasscalc were used as the primary indicators of process performance.
Table 3 shows that biomass-based CO
2 capture efficiency increased from 432 mg/(L·day) at 1.5% CO
2 to 480 mg/(L·day) at 6.0% CO
2, indicating enhanced carbon fixation under elevated CO
2 supply. A similar trend was observed for biomass-derived O
2 generation, which increased from 371 to 412 mg/(L·day) (
Table 4).
Direct gas-phase measurements yielded substantially higher values than both biomass-based and stoichiometric estimates, particularly at 3% and 6% CO
2. This discrepancy can be attributed to two factors. First, complete chamber hermeticity could not be achieved throughout the cultivation period, resulting in partial gas exchange with the surrounding atmosphere. Second, a significant fraction of the supplied CO
2 remained dissolved in the 300 L culture medium as dissolved inorganic carbon, primarily in the form of bicarbonate and carbonate ions. As demonstrated in
Section 3.7, accumulation of these carbon species became increasingly important at elevated CO
2 concentrations and contributed to the divergence between gas-phase and biomass-based estimates.
The agreement between biomass-derived and stoichiometric calculations was substantially better than that observed for direct measurements, supporting the validity of the biomass-based approach for assessing biological carbon sequestration. The observed differences between methods therefore reflect limitations of gas-phase measurements rather than inconsistencies in biological productivity.
The biomass-based CO
2 capture efficiencies obtained in this study (432–480 mg/(L·day)) exceeded values previously reported for comparable
Arthrospira platensis cultivation systems (219–235 mg/(L·day)) [
54]. This improvement is likely associated with the combination of continuous illumination, stable pH control, sufficient inorganic carbon availability, and long-term adaptation of the culture to elevated CO
2 concentrations.
4. Discussion
The biomass productivity values obtained in this work for
Arthrospira platensis substantially exceed the results of most published studies conducted at elevated CO
2 concentrations.
Table 5 presents a comparison of average daily biomass productivity with data from some studies most similar in cultivation conditions.
As can be seen from the table, the biomass growth rate in this work is 3–4 times higher than the values of the closest analogs from the authors’ early work [
37], with a similar setup (sealed chamber, 90 L PBR, Zarrouk medium). This gap is explained by a combination of several factors discussed below.
Illumination was likely one of the key factors contributing to the high biomass productivity observed in this study. Continuous illumination at a PPFD of 225 μmol m
−2 s
−1 provided favorable conditions for photosynthesis throughout cultivation. Similar observations have been reported by other authors, where extending the photoperiod substantially increased biomass productivity under elevated CO
2 conditions [
43]. These findings highlight the importance of sufficient irradiance for realizing the benefits of increased CO
2 availability.
Although the incident PPFD remained constant throughout the experiments, light penetration inside the culture likely decreased as biomass accumulated. Such self-shading effects are characteristic of dense Arthrospira cultures and may partially explain the gradual reduction of specific growth rates observed during the final cultivation period.
Photobioreactor geometry may also have contributed to the enhanced productivity. Compared with the 90–100 L systems used in previous studies [
45,
54], the 10 L bubble-column reactors employed here provided a higher surface-to-volume ratio and improved light penetration. Reduced self-shading likely increased the average light availability within the culture and supported more uniform biomass growth.
Long-term adaptation of the culture to elevated CO2 concentrations may have further enhanced performance. Unlike previous studies, in which adaptation occurred gradually during sequential experiments, the strain used here had been maintained at 3% CO2 for six months prior to cultivation. Such prolonged adaptation may improve physiological stability and photosynthetic efficiency under CO2-enriched conditions.
Although the effect of CO2 concentration on biomass productivity was moderate, cultures supplied with 6.0% CO2 consistently outperformed those grown at lower concentrations. The advantage of elevated CO2 became most apparent during the later stages of cultivation, when biomass density increased and the demand for inorganic carbon became greater. Under these conditions, higher CO2 availability helped maintain pH stability and bicarbonate reserves, thereby supporting continued growth. At 1.5% CO2, HCO3− concentration progressively declined, and CO32− increased, indicating carbon limitation and a shift toward less bioavailable carbon forms (Spirulina preferentially uses HCO3−). The combination of improved biomass yield and stabilized pH at 6% CO2 may also reduce the need for pH control chemicals (e.g., acids), offering additional economic and environmental benefits.
The discrepancy between gas-phase CO2 depletion and biomass-derived carbon fixation highlights the importance of dissolved inorganic carbon accumulation in alkaline Spirulina cultures. In addition, periodic chamber opening for sampling and unavoidable leakage may have contributed to carbon losses that could not be fully quantified. Therefore, biomass-derived estimates were considered the most robust indicator of biological carbon sequestration in the present study.
The observed productivity was likely supported by the combined effects of continuous illumination, favorable reactor geometry, adequate medium buffering capacity, and prior adaptation of the strain to elevated CO2 concentrations.
Yet high productivity alone does not guarantee practical viability. To address the question of practical applicability, carbon capture technology should be considered not in isolation but within the framework of a co-utilization concept, where emission reduction costs are offset by the production of valuable biomass.
Several limitations of the experimental design must be acknowledged. First, all 30 PBRs within each experiment shared the same sealed gas atmosphere; consequently, they represent technical rather than fully independent biological replicates. For gas-phase variables (CO2 and O2), the true experimental unit is the chamber (n = 1 per CO2 level), and no inferential statistics were applied to these data; they are reported descriptively. The reported variability (M ± SEM across 8 sampled PBRs) captures culture heterogeneity within a shared gas environment but cannot substitute for replication in independent sealed chambers. Future studies would benefit from the use of multiple independent chambers per CO2 condition. Second, the three CO2 conditions were investigated in sequential experiments rather than simultaneously, introducing a potential time effect that cannot be fully excluded. For biomass, pH, nutrients, carbonates, and microscopy, the individual PBR served as the true experimental unit (n = 8 per condition), and analyses (ANOVA, Welch’s test, Kruskal–Wallis) were conducted accordingly. The dependence among reactors sharing the same gas environment was not statistically treated because no gas-phase statistical contrasts were performed; for all other variables, reactors were treated as independent, which is justified because each PBR had its own culture medium, with sampling and measurements performed separately on each reactor. Nevertheless, we acknowledge that some degree of shared environmental influence cannot be completely ruled out.
Beyond the experimental performance metrics, several operational considerations should be addressed when scaling up the proposed multiple column-type photobioreactor system. Lighting energy demand represents a major operational cost; continuous illumination at 225 μmol/m
2·s, while effective for productivity enhancement, would benefit from optimization of photoperiods or dimming strategies during low-density growth phases to reduce electricity consumption without compromising carbon capture efficiency. Gas mixing and distribution across multiple reactors require careful design to maintain uniform CO
2 supply (1 L/min per reactor in this study) while avoiding channeling or preferential flow paths. Oxygen accumulation in closed photobioreactors was monitored in our study, with peak O
2 concentrations reaching 21.9 vol.%—only 1 percentage point above ambient air (20.9 vol.%). At this level, no inhibitory effect on photosynthesis is expected, as significant O
2 toxicity typically occurs at much higher concentrations (e.g., >30–40 vol.%) or under supersaturated dissolved O
2 conditions. Nevertheless, at industrial scale with higher cell densities and larger reactor volumes, routine degassing or gas recirculation may still be prudent to avoid long-term O
2 build-up. Harvesting requirements for
Arthrospira platensis are relatively favorable due to its filamentous morphology and natural flotation, yet the energy input for gravity filtration (100 μm mesh), washing, and lyophilization or low-temperature drying (35 °C) must be accounted for in techno-economic assessments. Finally, biomass quality for co-utilization as feed, food, or fertilizer remained high under elevated CO
2 conditions, with viability exceeding 85% and no pigment apparatus degradation observed at 6.0% CO
2, confirming that CO
2 enrichment does not compromise product value. These operational factors should be systematically addressed in future pilot-scale studies to validate the economic viability suggested by marginal abatement cost analyses [
27].
The carbonate–bicarbonate equilibrium plays a central role in both inorganic carbon supply and pH regulation in
Arthrospira platensis cultures. A. platensis preferentially assimilates bicarbonate (HCO
3−) rather than free CO
2, using an active transport system and intracellular carbonic anhydrase to convert HCO
3− into CO
2 near Rubisco. Consequently, the availability of HCO
3− directly determines photosynthetic rate. In aqueous solution, the CO
2-HCO
3-CO
32− system is governed by the following equilibria:
At the pH range typical for A. platensis (8.5–10.5), the dominant species is HCO3−, but its concentration is highly sensitive to pH shifts. Active HCO3− uptake drives the equilibrium toward CO32− formation, releasing H+. However, because the medium is strongly buffered at high pH, the released H+ does not acidify the solution; instead, the increase in CO32− concentration raises pH further. This creates a positive feedback loop: HCO3− consumption → pH increase → shift in equilibrium toward CO32− → further reduction in HCO3− availability, eventually leading to carbon limitation and growth arrest.
At elevated CO
2 concentrations (6% in this study), the high partial pressure of CO
2 in the gas phase drives additional CO
2 dissolution. Dissolved CO
2 rapidly hydrates to H
2CO
3, which dissociates to H
+ and HCO
3−, replenishing the HCO
3− pool. This process counteracts the pH rise in two ways: (1) direct supply of H
+ from H
2CO
3 dissociation partially neutralizes the alkalinity generated by HCO
3− uptake; (2) the maintained HCO
3− concentration prevents the equilibrium from shifting excessively toward CO
32−. As a result, the culture remains in a high-HCO
3−, moderate-pH regime, which sustains photosynthetic activity and prolongs active growth. This buffering mechanism explains why bicarbonate concentration at 6% CO
2 remained stable (or even increased) throughout the 12-day experiment (
Figure 12), whereas at 1.5% CO
2, it progressively declined.
The interplay between CO2 supply, carbonate speciation, and pH is therefore not merely a passive chemical background but an active participant in regulating carbon availability. Understanding this relationship is crucial for optimizing CO2 biofixation processes, as it highlights the need to maintain not only a high total inorganic carbon concentration but also the appropriate balance between CO2 and HCO3− to support efficient photosynthesis.
The efficiency of CO2 supply to Arthrospira platensis depends not only on the gas-phase concentration but also on the gas–liquid mass transfer rate, characterized by the volumetric coefficient kLa. In bubble-column photobioreactors, kLa is influenced by the gas flow rate, bubble size, liquid properties, and cell density. Although we did not measure kLa directly, the observed increase in biomass productivity at 6% CO2 cannot be explained by a higher physical mass transfer coefficient alone, because the gas flow rate was identical in all experiments. Instead, the high pH of the medium (>9) chemically enhances CO2 absorption through the rapid reaction CO2 + OH− → HCO3−. This enhancement is more effective when the CO2 partial pressure is higher, because it replenishes the HCO3− pool and maintains a steep concentration gradient. Consequently, the effective kLa at 6% CO2 is greater than that at 1.5% CO2, even though the physical gas–liquid contact is the same. This mass-transfer perspective helps to rationalize why carbon limitation was alleviated only at the highest CO2 concentration and why the benefit appeared mainly during the late growth phase, when cellular demand was maximal.
5. Conclusions
This study evaluated the influence of different CO2 concentrations (1.5%, 3.0%, and 6.0% v/v) on the growth performance, nutrient utilization, inorganic carbon dynamics, CO2 biofixation, and oxygen generation of Arthrospira platensis cultivated in bubble-column photobioreactors.
The results demonstrated that increasing the CO2 concentration to 6.0% created the most favorable cultivation conditions, resulting in the highest biomass productivity and the most stable pH regime. Enhanced CO2 availability improved the maintenance of dissolved inorganic carbon, prevented excessive medium alkalinization, and supported sustained metabolic activity throughout the cultivation period.
Analysis of the carbonate system revealed that elevated CO2 concentrations promoted bicarbonate accumulation and improved buffering capacity, thereby maintaining carbon availability for photosynthesis. The observed patterns of nutrient consumption were consistent with biomass production and confirmed more intensive metabolic activity under the 6.0% CO2 treatment.
The study also showed that biomass-based estimates provide the most reliable assessment of biological CO2 sequestration and oxygen generation in experimental systems where gas leakage and dissolved inorganic carbon accumulation may affect direct gas-phase measurements.
Overall, the findings indicate that cultivation of A. platensis under moderate CO2 enrichment represents a promising approach for simultaneous carbon capture, oxygen production, and generation of valuable biomass. These results may contribute to the development of integrated biotechnological systems for sustainable utilization of industrial CO2 emissions.
Future studies should focus on improving carbon mass balance assessment, quantifying light attenuation effects in dense cultures, and evaluating the long-term performance of the process under pilot-scale conditions. They should also include a detailed energy balance, a life-cycle assessment, and a full economic analysis based on pilot-scale data. The present work provides the biological and process foundation necessary for such evaluations.




 ,
,