1. Introduction
The construction industry continues to face persistent challenges arising from project complexity, systemic uncertainty, and fragmented delivery processes. Empirical studies consistently report that cost overruns and schedule delays remain widespread across infrastructure and building projects worldwide, driven primarily by design changes, coordination deficiencies, and underestimation of project complexity [
1,
2,
3]. These persistent inefficiencies highlight the critical importance of improving the reliability of early-stage decision-making, where geometric configurations, regulatory constraints, and economic performance are determined and subsequently exert long-term influence on construction cost, schedule, and quality outcomes [
4,
5].
In dense urban contexts, early-stage residential building design is particularly demanding due to the need to comply with multiple planning and building-control regulations, including floor-area ratio (FAR), open-space ratio (OSR), building height, setback, parking, and unit-mix requirements. These regulatory provisions interact nonlinearly with unit layouts, structural grids, circulation systems, and rentable area, creating a highly constrained and interdependent design environment. Despite this inherent complexity, residential projects commonly rely on fragmented CAD–spreadsheet workflows and manual regulatory checks, which significantly increase design rework and the risk of late-stage revisions [
6].
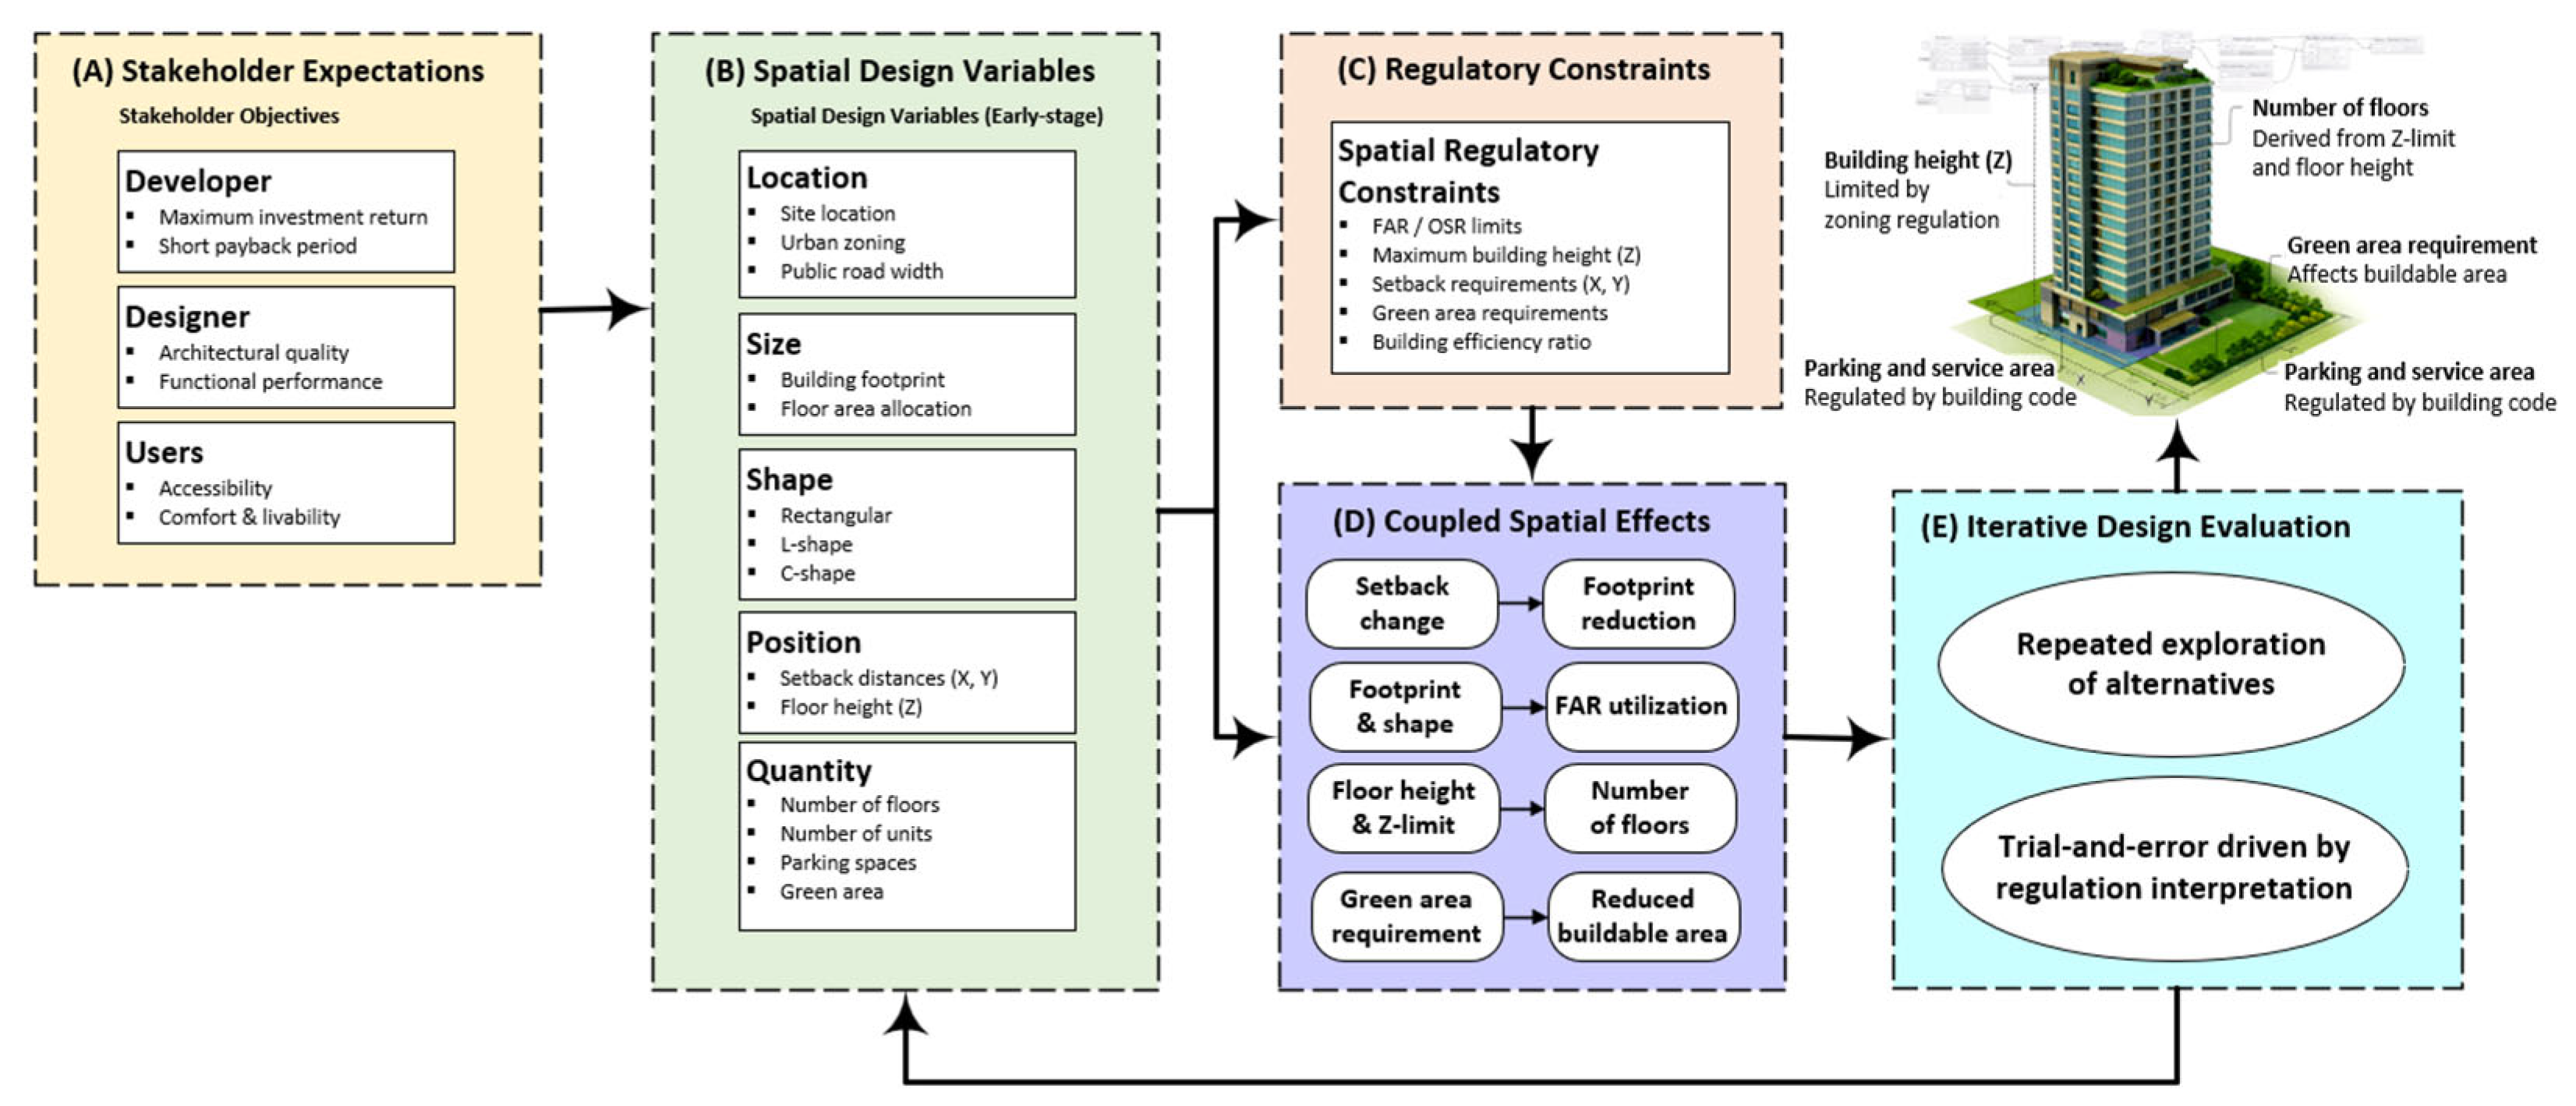
Early-stage residential design is further complicated by the fact that critical geometric, regulatory, and economic decisions must be made when information remains incomplete and uncertainty is high. As illustrated in
Figure 1, stakeholder expectations related to investment return, payback period, accessibility, and residential comfort must be translated into spatial design variables, such as building location, footprint size, geometric shape, spatial positioning, and quantity-related attributes. These variables are tightly constrained by multiple layers of planning and building-control regulations—including FAR, OSR, setback, height, parking, and green-area requirements—whose spatial implications are predominantly defined in textual form and therefore difficult to interpret consistently. Changes in a single spatial parameter frequently propagate across the design space, generating coupled spatial effects that influence buildable area, FAR utilization, number of floors, and overall project feasibility. Consequently, early-stage residential design is often conducted through iterative trial-and-error processes that rely heavily on professional experience, limit transparency in decision-making, and increase the likelihood of suboptimal or late-stage design changes. From a construction management perspective, this lack of structured, regulation-aware decision support constrains systematic evaluation of trade-offs among regulatory compliance, spatial efficiency, and economic performance at the stage where decisions have the greatest downstream impact.
Digital transformation has partially addressed these challenges through the adoption of Building Information Modeling (BIM) and parametric design tools, which support structured data representation, consistent geometric reasoning, and rapid generation of early design alternatives [
7].
Visual programming environments such as Dynamo and Grasshopper allow designers to encode spatial logic, unit configurations, and façade parameters into reusable scripts, thereby enhancing design-space exploration and early-stage analyses [
8,
9]. However, most parametric workflows still depend on manual interpretation of building-control regulations, and regulatory constraints are often applied late in the design process or external to the BIM environment [
10]. Even parametric frameworks developed specifically for condominium design typically treat regulatory reasoning as an external validation step rather than an embedded component of computational logic [
6].
Parallel advances in automated code compliance checking (ACC) have produced rule-based, ontology-driven, and knowledge-graph-based approaches capable of translating textual regulations into machine-readable formats [
11]. ACC research has demonstrated increasingly sophisticated workflows for zoning, structural, and fire-safety regulations [
12,
13,
14], and recent studies explore AI-assisted regulation interpretation using large language models [
15,
16,
17]. Nevertheless, ACC systems predominantly operate as post hoc verification layers applied to completed BIM models rather than as mechanisms that actively guide generative or exploratory design processes [
18,
19]. As a result, ACC research has not yet fully addressed the need for regulation-aware design generation during early-stage exploration.
A complementary research stream has investigated multi-objective optimization (MOO) methods for building-performance and construction-engineering applications. NSGA-II and related evolutionary algorithms have been widely applied to optimize energy consumption, CO
2 emissions, daylighting, thermal comfort, and life-cycle cost [
20,
21,
22]. In construction engineering, NSGA-II has also been used to address trade-offs involving prefabricated components, green construction strategies, and project-level performance [
10,
23,
24]. Despite these advances, regulatory constraints are frequently simplified as boundary conditions or omitted altogether, producing Pareto-optimal solutions that are analytically appealing but not permit-ready under real-world regulatory frameworks [
23,
25,
26]. Moreover, only limited studies integrate NSGA-II with parametric BIM in a manner that enforces regulatory compliance “by construction” through explicit algebraic formulations of local planning and building-control rules [
27,
28].
Recent progress in BIM–AI integration further demonstrates the potential for intelligent design-support systems. Machine learning and computer vision applications within BIM environments have been studied extensively [
28], while generative AI has been explored for parametric design, script synthesis, and massing generation [
29,
30,
31].
Research on AI-enhanced early-stage communication and reasoning highlights emerging opportunities for improved decision support [
29,
32]. Nevertheless, integration of AI-driven regulation interpretation, parametric BIM, and multi-objective optimization into a unified, regulation-aware decision-making workflow remains limited. Synthesizing insights across these domains reveals a critical research gap in early-stage residential building design. Existing BIM and parametric workflows rarely formalize building-control regulations as explicit, auditable algebraic systems capable of capturing spatial interdependencies during design exploration [
11,
19]. At the same time, NSGA-II-based optimization frameworks frequently oversimplify or ignore regulatory constraints, limiting their applicability for realistic, permit-ready decision-making [
23,
24,
25]. This disconnect constrains the practical usefulness of optimization results for construction managers and developers, who require transparent trade-off information linking geometry, regulatory compliance, and economic performance at the preliminary design stage [
6,
27].
As summarized in
Table 1, existing studies predominantly address BIM-enabled parametric design, automated compliance verification, generative design exploration, or multi-objective optimization as separate research streams. Although previous studies have demonstrated significant advances within their respective domains, few have integrated these capabilities within a unified framework capable of embedding regulatory requirements directly into the design-generation process. In particular, automated code compliance approaches mainly focus on post hoc verification, whereas optimization-based studies often simplify or omit regulatory constraints during design exploration. Consequently, a critical gap remains in developing regulation-aware generative optimization frameworks that simultaneously support BIM integration, automated compliance reasoning, and multi-objective decision-making during early-stage residential design.
Table 1 clearly demonstrates that previous studies have primarily focused on isolated aspects of BIM implementation, automated compliance checking, generative design, or optimization independently. In contrast, the proposed framework integrates these capabilities within a regulation-aware computational environment by explicitly embedding planning and building-control regulations into the generative optimization process. This integration facilitates compliance-by-construction during design generation while reducing reliance on post hoc compliance verification.
Among available multi-objective evolutionary algorithms, NSGA-II was selected because of its established robustness, widespread adoption in building-performance optimization, and proven capability for generating diverse Pareto-optimal solutions under constrained design environments. The objective of this study is therefore not to benchmark optimization algorithms but rather to demonstrate how regulation-aware constraints can be embedded within a BIM-enabled generative design workflow.
To address this gap, this study introduces REGEN (Regulation-Aware Generative Design), a unified computational framework that formalizes planning and building-control regulations as explicit algebraic equations, embeds them within a parametric BIM environment, and couples them with NSGA-II-based multi-objective optimization.
The framework systematically searches for regulation-compliant Pareto-optimal solutions across five development-relevant objectives: maximizing project profit, maximizing green-area provision, maximizing overall building efficiency, minimizing geometric inefficiency through the shape factor, and minimizing building footprint area to promote compact and environmentally responsible development. By integrating regulation-aware generative modeling with evolutionary optimization, the present framework transforms early-stage residential design from an experience-driven, trial-and-error process into a transparent, data-driven decision-support system for construction and development decision-making.
2. Overview of the REGEN Framework
The REGEN framework formulates early-stage residential building design as a regulation-aware multi-objective optimization problem. The methodology integrates planning and building-control regulations, geometric configuration, and economic evaluation into a unified algebraic system coupled with NSGA-II optimization.
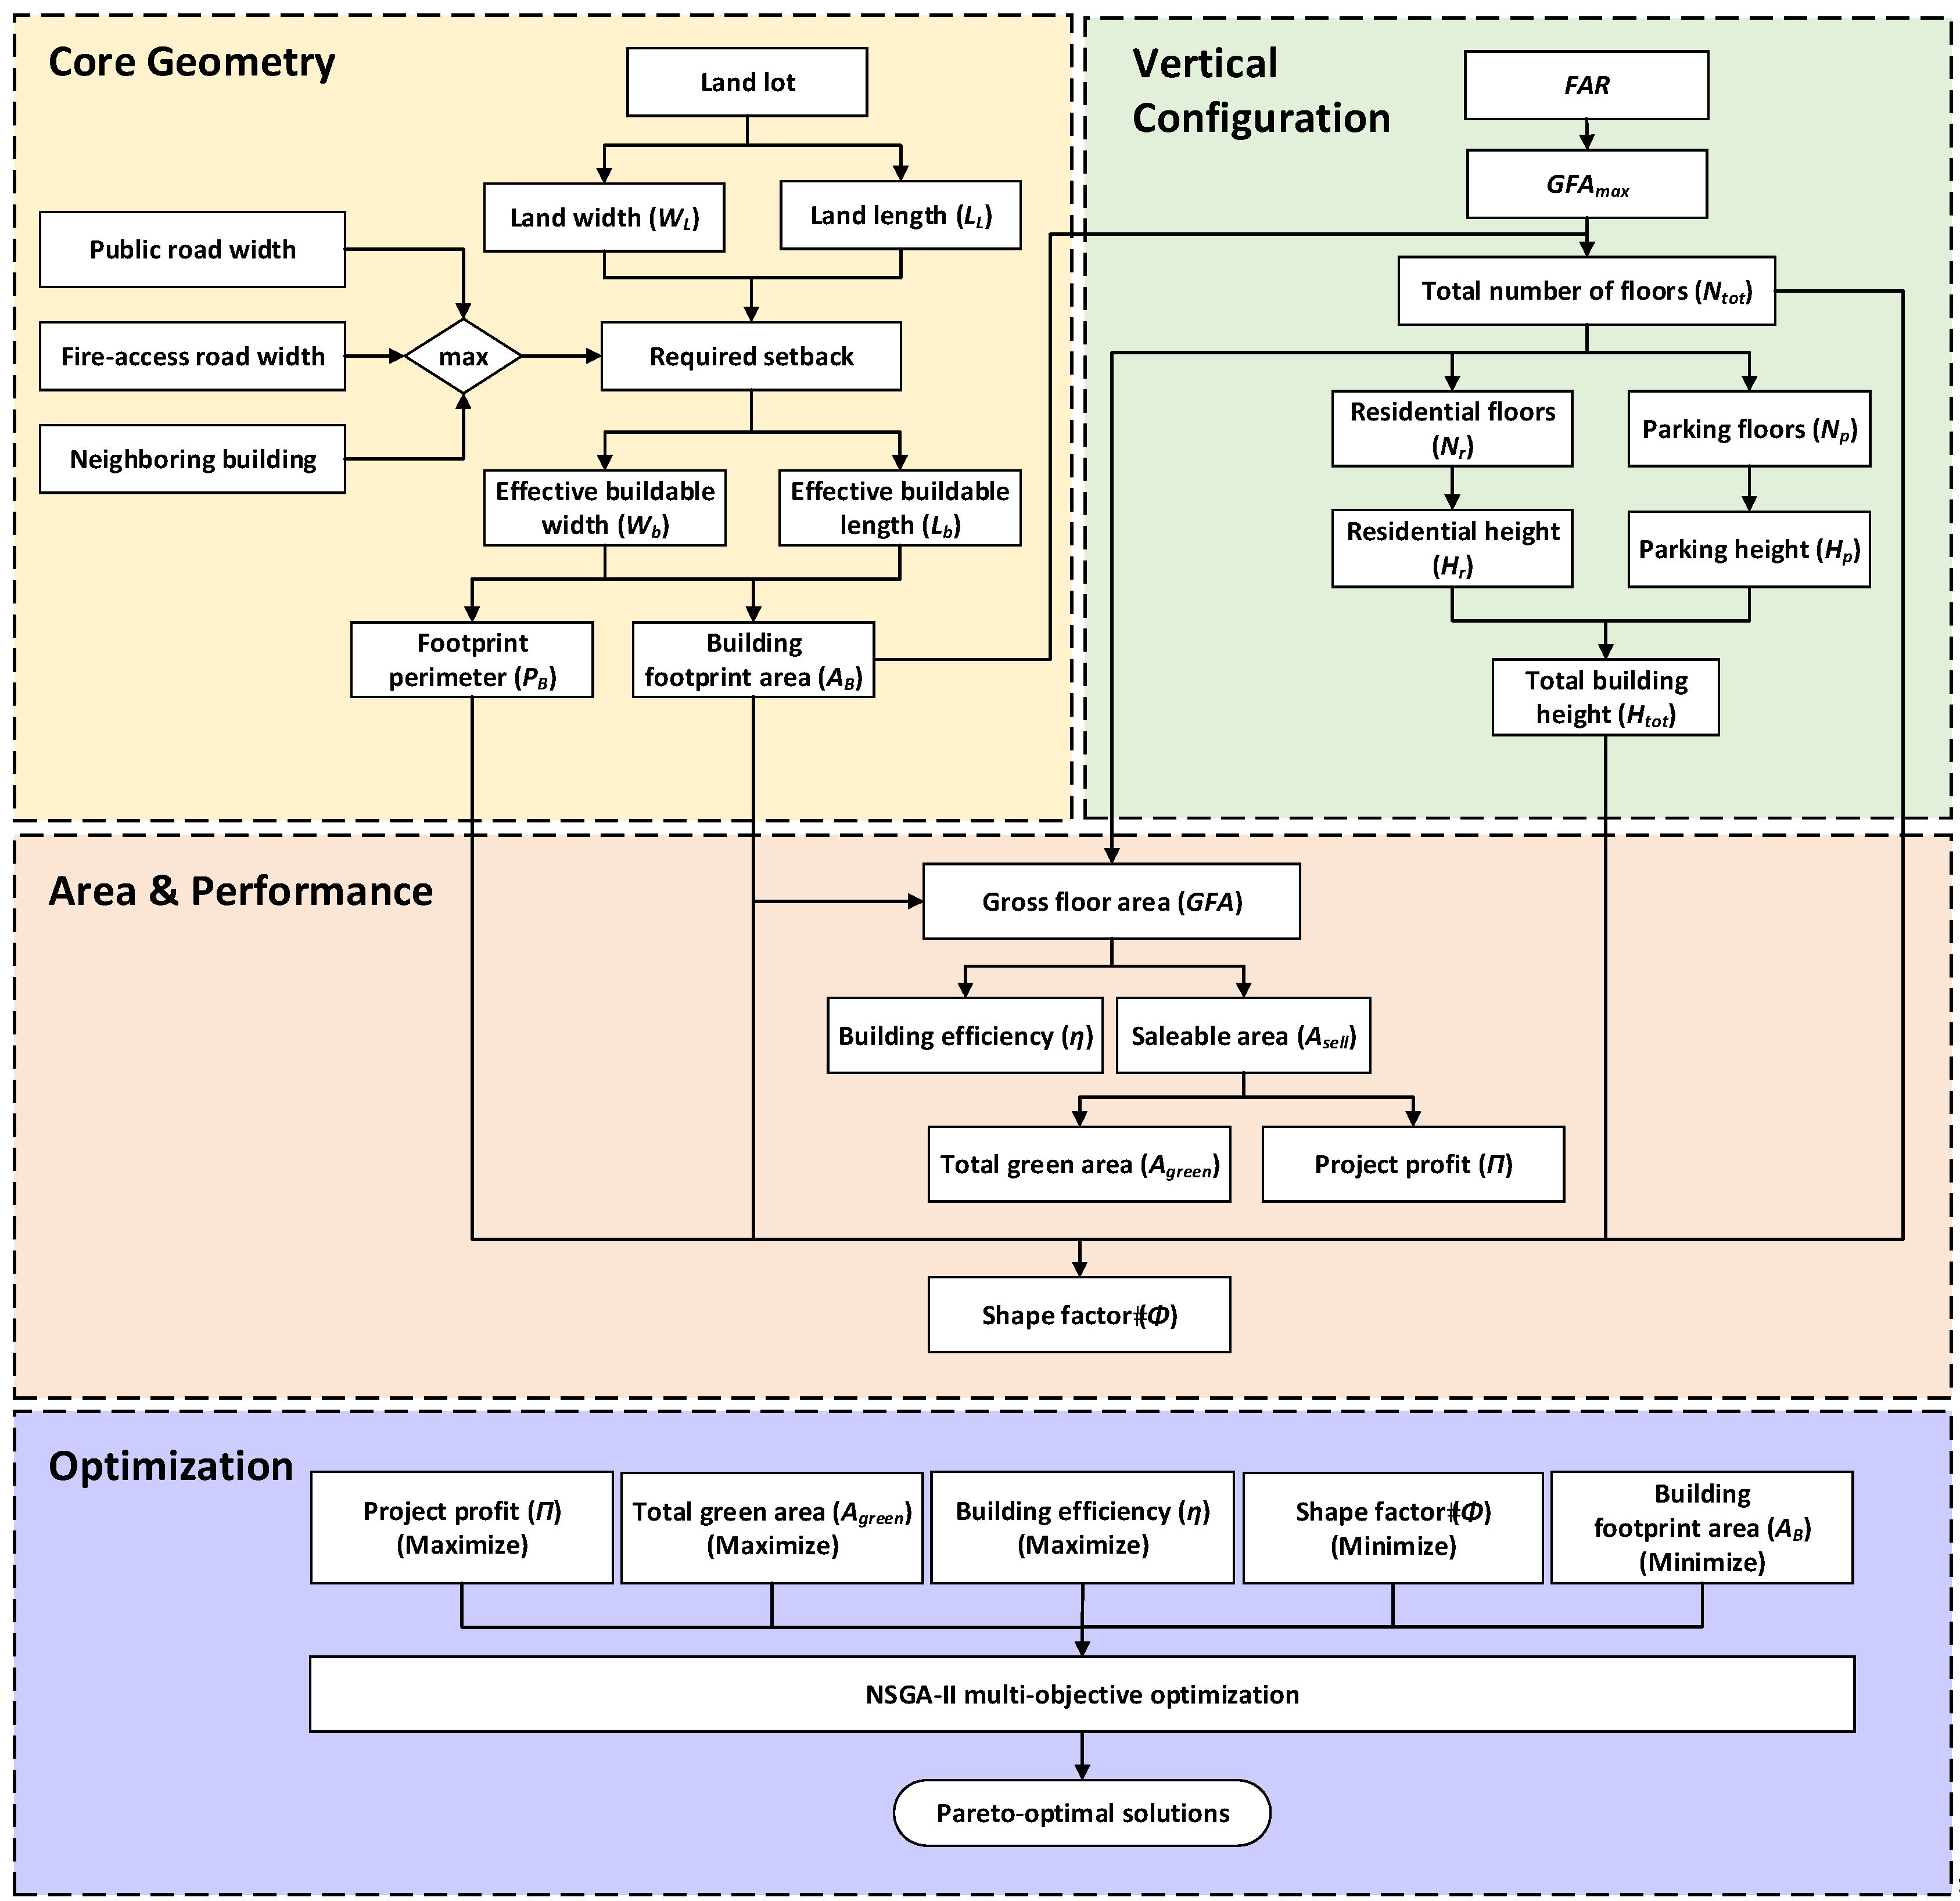
The complete formulation consists of Equations (1)–(50). All variables, parameters, decision variables, intermediate variables, and performance indicators are defined consistently in
Table 2, while the calculation logic and interdependency structure are illustrated in
Figure 2.
The framework is designed to ensure that all generated design alternatives are regulation-compliant by construction. Rather than applying regulatory checks as a post hoc step, the developed approach embeds regulatory reasoning directly into the generative and optimization process, enabling systematic exploration of regulation-compliant design alternatives at the preliminary design stage. In the present implementation, regulatory compliance refers specifically to the encoded feasibility-related planning regulations considered in this study, including FAR, OSR, building-height limitations, setback requirements, parking provisions, and green-area requirements. The framework does not currently address all regulatory provisions required during formal permitting processes, such as structural safety codes, fire-protection regulations, accessibility standards, environmental approvals, or administrative review procedures.
Figure 2 illustrates the calculation flow of the proposed framework, which integrates regulation-aware geometric generation, performance evaluation, and NSGA-II-based multi-objective optimization into a unified workflow. The process begins with core geometric determination of the buildable footprint based on site dimensions and regulatory setbacks, yielding the building footprint area and perimeter. Vertical configuration is subsequently established by coupling horizontal buildable geometry with regulatory capacity to determine the total number of floors and building height.
Based on these geometric and vertical configurations, gross floor area is decomposed into saleable area and non-saleable components, enabling evaluation of building efficiency, green-area provision, and project profit, while geometric compactness is quantified through the shape factor. These performance indicators, together with the building footprint area, are simultaneously optimized using NSGA-II to generate Pareto-optimal, regulation-compliant design alternatives, supporting transparent and decision-oriented trade-off analysis at the early stage of residential building development.
Although the numerical case study presented in this paper is based on the planning regulations of Bangkok, Thailand, the present framework is not intrinsically restricted to a specific jurisdiction. The framework separates regulation representation from the optimization engine by expressing planning and building-control requirements as parameterized algebraic constraints. Consequently, local regulatory parameters such as FAR limits, open-space requirements, building setbacks, height restrictions, parking standards, and environmental provisions can be replaced without modifying the underlying NSGA-II optimization procedure. This modular architecture provides the foundation for future extension toward multi-jurisdictional applications.
2.1. Decision Variables and Design Control
Equations (1)–(7) define the decision variables representing controllable early-stage design choices. These include setback distances along parcel boundaries, the proportion of parking floors, residential and parking floor-to-floor heights, building shape configuration, and pricing margin. Together, these variables form the decision vector that initiates the calculation flow shown in
Figure 2. By explicitly defining these variables, the framework allows the optimization to explore alternative massing, vertical configuration, and pricing strategies while maintaining regulatory feasibility.
2.2. Regulatory Capacity and Site Constraints
Equations (8)–(10) formalize planning regulations governing development intensity and site openness. Maximum allowable gross floor area is determined using the prescribed floor-area ratio (FAR), while minimum open-space requirements constrain horizontal site coverage. These equations define the regulatory capacity of the site and establish a feasibility-based development envelope that satisfies the encoded planning regulations considered in this study. As illustrated in
Figure 2, regulatory capacity is evaluated early in the workflow, preventing infeasible design alternatives from proceeding to detailed geometric and economic calculations.
The present study focuses on regulations that directly influence development feasibility and geometric configuration during early-stage residential design. Specifically, the encoded regulations include FAR requirements, open-space provisions, building-height limitations, setback requirements, parking provisions, and green-area requirements. Other regulatory aspects that require detailed design information or specialist review remain outside the scope of the current framework.
2.3. Buildable Footprint Geometry
Equations (11)–(16) translate regulatory setback requirements into effective buildable geometry. The governing setback distances along the width and length directions are determined by considering public-road-width requirements, fire-access regulations, and neighboring-building conditions. The effective buildable width
and effective buildable length
are subsequently obtained by subtracting the governing setback distances from the land width
and land length
, respectively. The resulting building footprint area
and footprint perimeter
provide the geometric basis for subsequent calculations of gross floor area, spatial efficiency, green-area provision, and shape factor. These intermediate variables establish the direct linkage between planning regulations and building morphology during the optimization process.
2.4. Vertical Configuration and Height Compliance
Equations (17)–(23) govern vertical configuration and ensure compliance with building-height regulations. The total number of floors
is determined from the maximum allowable building height
and the selected residential floor-to-floor height
. The number of parking floors
is calculated using the parking-floor proportion decision variable
, whereas the number of residential floors
is obtained from the remaining floors allocated for residential use. Residential height
, parking height
, and total building height
are subsequently computed and constrained not to exceed the maximum allowable building height
. This formulation allows the optimization process to systematically explore trade-offs among parking provision, residential capacity, and development intensity while maintaining regulatory compliance.
2.5. Area Decomposition and Spatial Performance
Equations (24)–(27) decompose gross floor area into functional area components, including parking area
, amenity and service area
, common non-saleable area
, residential saleable area
, rental or lease area
, and total saleable area
. Total built area
is subsequently used to calculate building efficiency
as the ratio of total saleable area to total built area. This indicator provides a direct measure of spatial utilization efficiency and links geometric configuration to economic and functional performance.
2.6. Green-Area Computation and Compliance Evaluation
Equations (28)–(32) quantify total green-area provision by aggregating unit-based green-area
, balcony-based green area A
green,2, and open-space green-area contribution
. The total green area
is subsequently evaluated against the minimum required green area
. By treating
as both a regulatory constraint and an optimization objective, the proposed framework enables exploration of environmentally favorable design alternatives that exceed minimum regulatory requirements while maintaining feasibility within planning regulations.
2.7. Parking Demand Approximation Under Regulatory Constraints
Equation (33) estimates parking demand using a proxy-based formulation linked to the number of residential units
and parking provision requirements. This approximation enables early-stage assessment of parking implications without requiring detailed parking-layout design.
2.8. Economic Evaluation
Equations (34)–(37) evaluate project economics by linking geometric outcomes to financial performance. Total project cost
is calculated from land acquisition cost
and construction cost
. The selling-price markup coefficient (
) is defined as a dimensionless parameter representing the percentage increase above the baseline market selling price. In this study,
is treated as a proportional markup rather than an additive monetary value per square meter or a normalized coefficient without direct economic interpretation. For example, a value of
= 0.10 corresponds to a 10% increase over the baseline selling price. This formulation ensures dimensional consistency in the profit objective and enables alternative pricing strategies to be explored during optimization. Total revenue
and project profit
are subsequently determined for each feasible design alternative.
It should be noted that the economic evaluation model adopted in this study is intended to support early-stage design feasibility assessment rather than detailed real-estate investment appraisal. Accordingly, project profit is calculated using deterministic assumptions regarding land acquisition cost, construction cost, design cost, and selling price. Financing costs, sales-cycle dynamics, market-price fluctuations, operational revenues, operational expenses, taxation effects, and time-value-of-money considerations are not explicitly incorporated into the present formulation. This simplification allows the influence of geometric configuration and regulatory constraints on project performance to be isolated and evaluated consistently within the optimization framework.
The deterministic economic assumptions adopted in this study were intentionally selected to facilitate comparative evaluation of design alternatives during the early-stage feasibility phase. Consequently, land acquisition cost, construction cost, design fee, and selling price were treated as fixed inputs to isolate the influence of geometric configuration and regulatory constraints on optimization outcomes. Future studies should investigate the sensitivity of the resulting Pareto-optimal solutions to variations in these economic parameters through scenario-based analysis, Monte Carlo simulation, interval optimization, or other uncertainty-aware approaches. Such analyses would provide deeper insight into the robustness of design recommendations under changing market conditions and financial assumptions.
2.9. Shape Factor
Equation (38) defines the shape factor
as a normalized ratio between the effective building surface and the generated building area. The product of footprint perimeter
and total building height
represents the effective façade-related surface, while the product of building footprint area
and total number of floors
represents the generated building area. Lower values of Φ indicate more compact building configurations with reduced façade complexity and improved constructability.
2.10. Objective Functions
Equations (39)–(43) define five objective functions
optimized using NSGA-II. Specifically, the framework maximizes project profit (
), total green area (
), and building efficiency
) while minimizing shape factor
) and building footprint area (
). Accordingly, the objective functions are defined as (
): project profit; (
): total green area; (
): building efficiency; (
): shape factor; and (
): building footprint area. Collectively, these objectives enable systematic exploration of trade-offs among economic feasibility, environmental performance, spatial efficiency, geometric compactness, and land utilization.
2.11. Constraints
Equations (44)–(50) enforce regulatory and feasibility constraints throughout the optimization process. These constraints include compliance with maximum allowable gross floor area
determined by
requirements, building-height limitations ensuring
, minimum open-space ratio requirements, minimum green-area requirements ensuring
, geometric feasibility conditions requiring
and
, integrality requirements for floor-related variables
,
, and
, and decision-variable bound constraints. All candidate solutions must satisfy these constraints before entering Pareto ranking and evolutionary selection.
3. REGEN–NSGA-II Evolutionary Optimization Framework
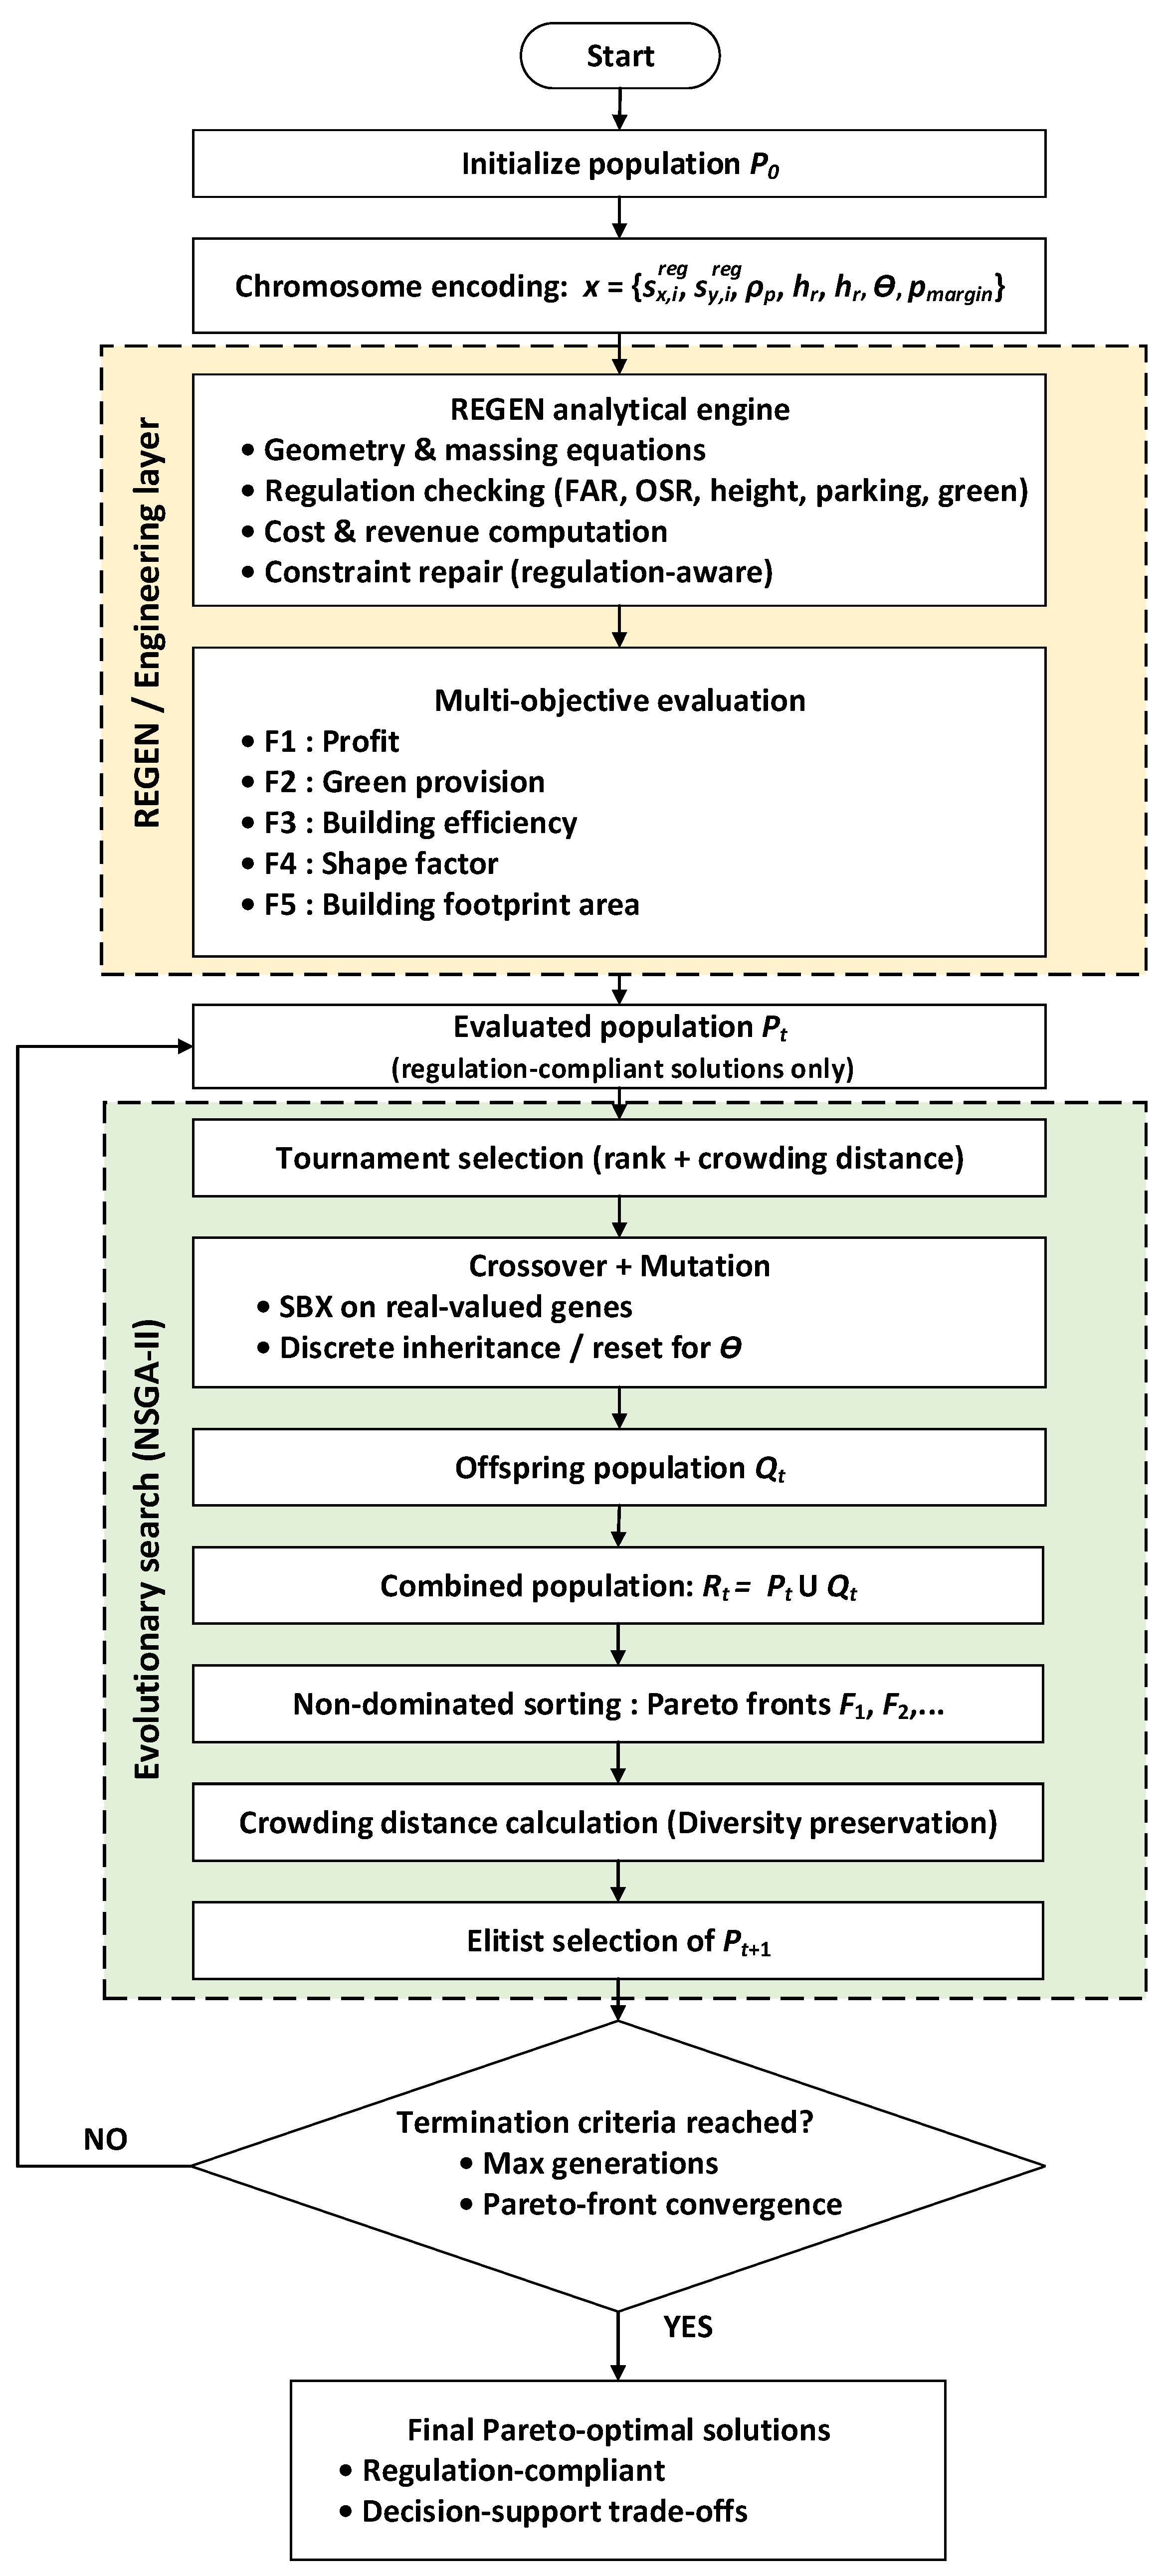
Figure 3 presents an overview of the proposed REGEN–NSGA-II evolutionary optimization framework. The framework integrates an equation-based, regulation-aware building evaluation model (REGEN) with the elitist multi-objective evolutionary algorithm NSGA-II to systematically explore regulation-compliant design alternatives under conflicting objectives. At each generation
, a population
of candidate solutions is evaluated through the optimization framework, recombined via genetic operators, and ranked using non-dominated sorting and crowding distance. The evolutionary cycle iterates until termination criteria are satisfied, yielding a Pareto-optimal set of design solutions that explicitly represent trade-offs among economic, spatial, environmental, and geometric performance criteria.
3.1. Generating Initial Population
The optimization begins by initializing a population
of
chromosomes. Each chromosome encodes a mixed-variable decision vector
as illustrated in
Figure 4. Real-valued genes
are sampled within admissible bounds specified in
Table 2 (and/or regulation-derived bounds), while the discrete shape gene
is sampled from the finite set of allowable plan configurations. This mixed-variable initialization ensures that the search starts from a diverse set of physically meaningful design alternatives, while remaining consistent with the decision-variable definitions used by the REGEN analytical mapping.
3.2. Evaluating the Fitness Value
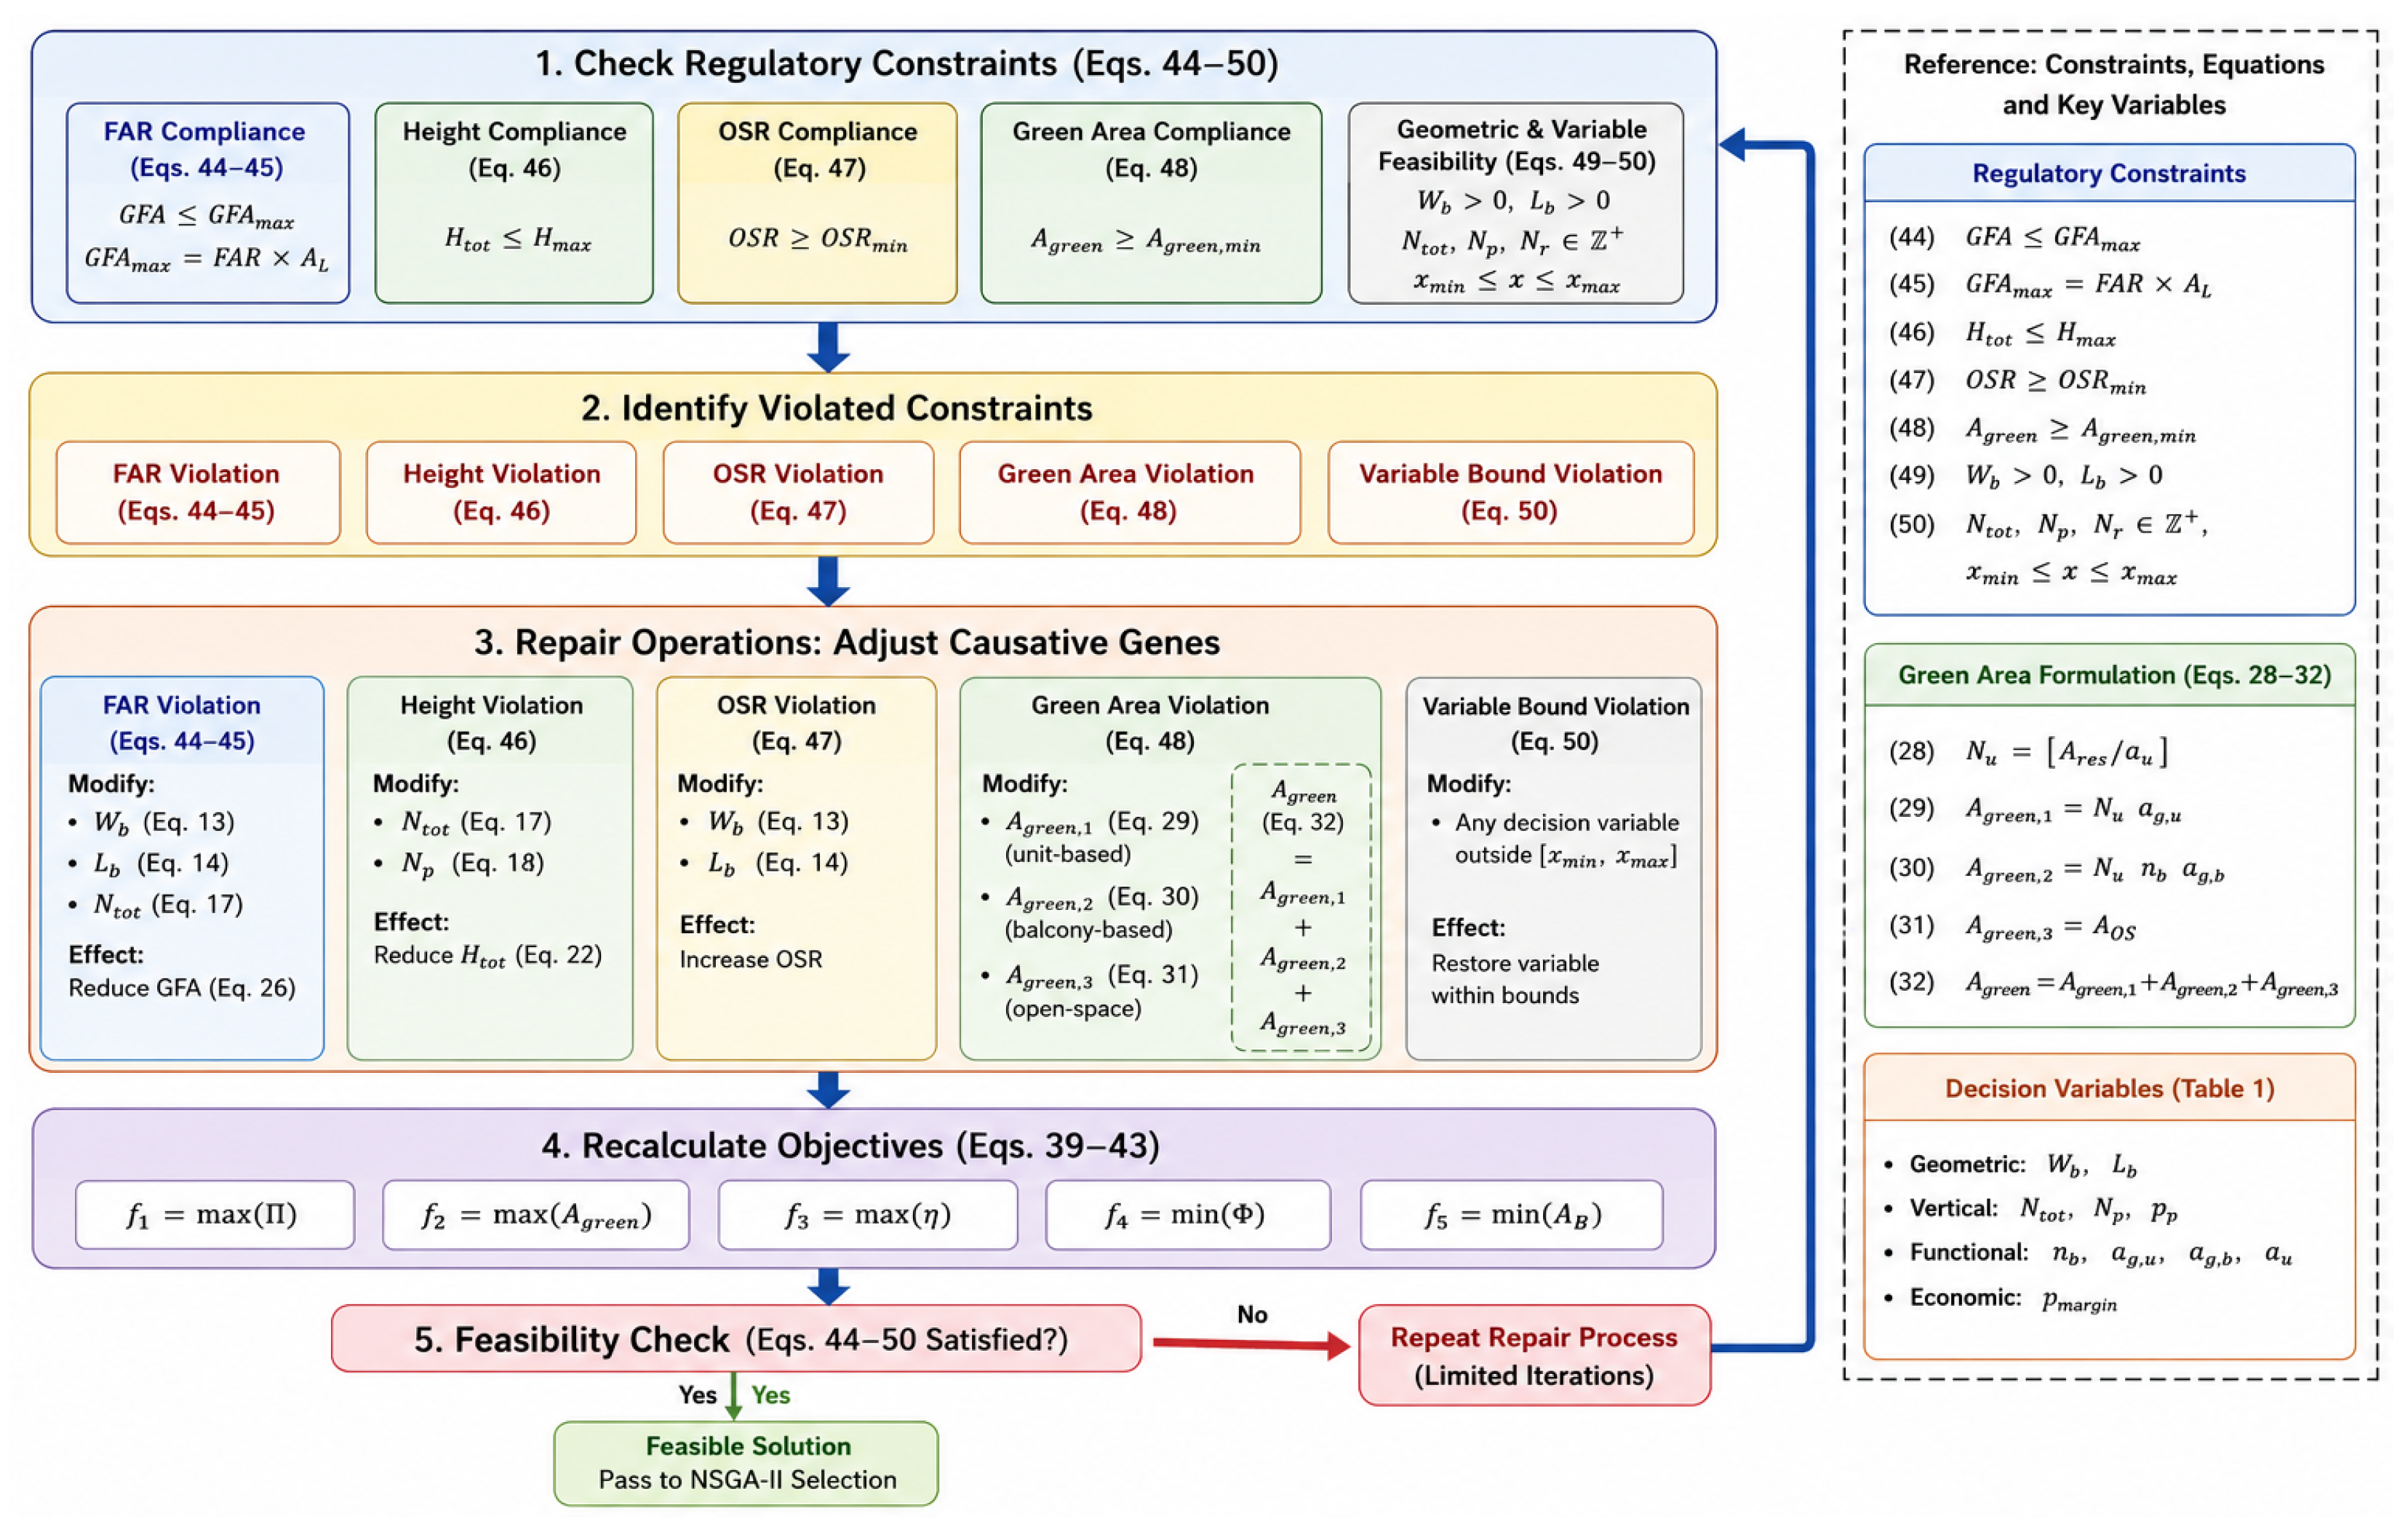
Each chromosome is deterministically evaluated using the REGEN analytical model. Given the encoded variables, the proposed framework computes intermediate quantities such as buildable footprint dimensions, total floor area, number of floors, functional allocation, green-area provision, and parking supply. These quantities are subsequently used to evaluate five objective functions defined consistently in Equations (39)–(43): (project profit), (total green area), (building efficiency), (shape factor), and (building footprint area). Regulatory constraints encoded within the framework, including FAR, OSR, building-height limitations, setback requirements, parking provisions, and green-area requirements, are checked simultaneously using Equations (44)–(50). When violations occur, a repair mechanism modifies only the causative genes responsible for the infeasibility (e.g., increasing setbacks, reducing building dimensions, or adjusting floor allocations) before re-evaluation. Consequently, each individual entering the NSGA-II ranking process satisfies the encoded planning and building-control regulations considered in this study.
Constraint handling was implemented through a repair-based feasibility-preserving strategy. Following chromosome evaluation, all regulatory constraints defined by Equations (44)–(50) were checked sequentially. Whenever a violation was detected, only the decision variables directly responsible for the violation were modified. FAR violations triggered adjustments to setback variables to reduce buildable area, height violations were corrected through modifications of floor-height variables or parking-floor allocation, open-space violations were resolved by increasing setback distances, green-area violations resulted in reductions of building footprint dimensions, and variable-bound violations were repaired by projecting variables to their nearest admissible bounds. The repaired solution was then re-evaluated until all regulatory requirements were satisfied. Consequently, infeasible solutions were not permitted to participate in Pareto ranking or evolutionary selection.
The detailed workflow of the repair-based feasibility preservation strategy is illustrated in
Figure 5. Following objective evaluation and regulatory checking, each chromosome is examined against the regulatory constraints defined by Equations (44)–(50). If no violation is detected, the solution is directly transferred to the NSGA-II ranking and selection process. Otherwise, the violated constraint and its associated causative decision variables are identified. Targeted repair operations are then applied according to the type of violation, including FAR, building-height, open-space, green-area, parking, and variable-bound violations. After repair, all dependent variables and objective values are recalculated and the constraint-checking process is repeated until a feasible solution is obtained.
As shown in
Figure 5, the proposed repair mechanism modifies only the decision variables directly responsible for regulatory violations while preserving all unaffected genes. This causative-gene modification strategy minimizes unnecessary disruption of chromosome structure and helps maintain population diversity throughout the evolutionary search process. Consequently, the repair mechanism acts primarily as a feasibility-restoration procedure rather than a search-direction mechanism, thereby reducing the likelihood of introducing systematic bias into the Pareto-front formation process. Although quantitative comparison of objective-space distributions before and after repair was beyond the scope of the present study, the localized nature of the repair strategy was specifically designed to preserve diversity and minimize distortion of the underlying search dynamics.
3.3. Applying Crossover and Mutation
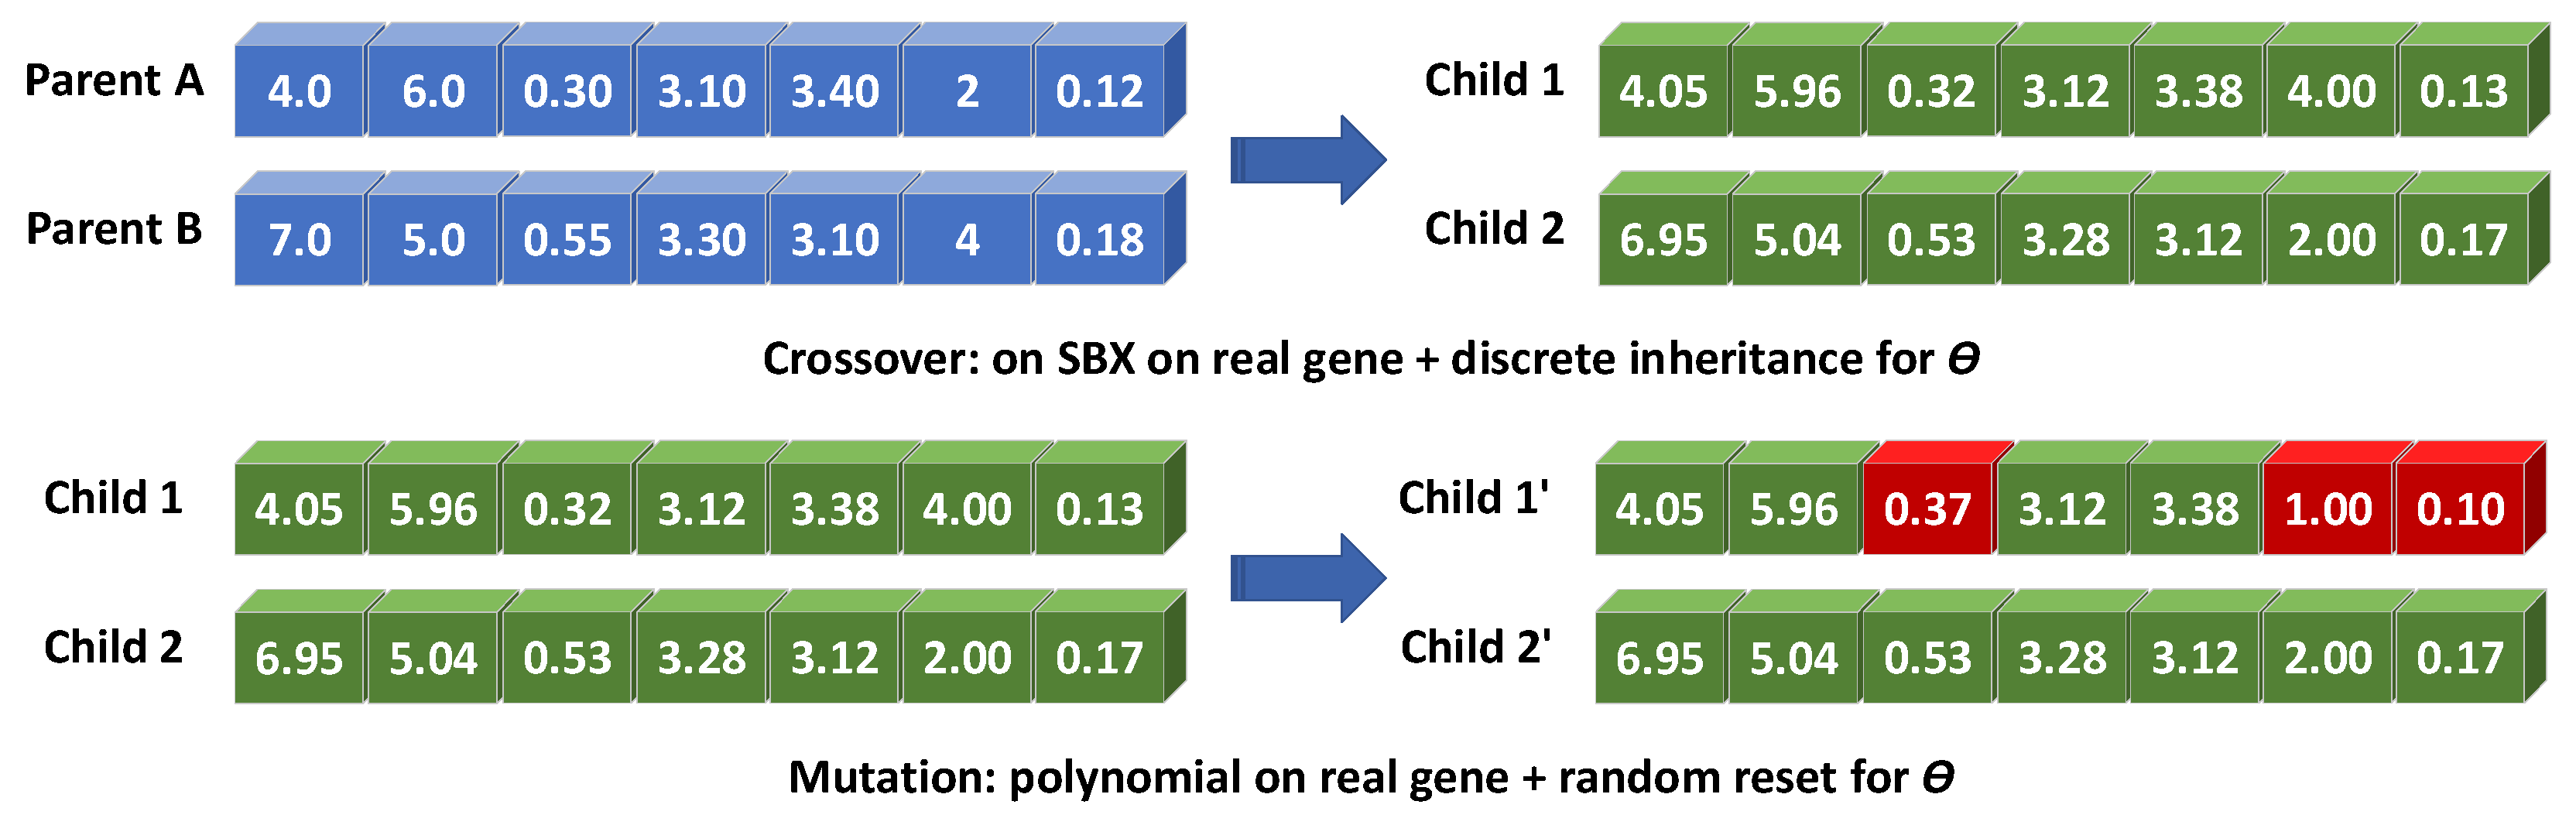
Offspring generation in the proposed framework uses mixed-variable genetic operators as illustrated in
Figure 6. Real-valued genes are recombined via simulated binary crossover (SBX), whereas the discrete
gene is inherited categorically (discrete inheritance). For a single real-valued gene
from Parent A (
) and Parent B (
), SBX generates two offspring genes
and
as Equations (51) and (52).
The spread factor
is sampled per gene using a random variable
and a distribution index
(here illustrated with
) using Equation (53).
As illustrated in
Figure 6, two parent chromosomes,
= [4.0, 6.0, 0.30, 3.10, 3.40, 2, 0.12] and
= [7.0, 5.0, 0.55, 3.30, 3.10, 4, 0.18], are recombined to produce two offspring whose gene values lie between, or close to, the parental values for all real-coded variables. For example, the setback genes
and
yield offspring values of 4.05–6.95 and 5.96–5.04, respectively, while the parking proportion
and floor-to-floor height genes generate intermediate yet distinct values that reflect both parental designs. For the discrete shape gene, offspring inherit
directly from one parent without interpolation (e.g.,
= 4 for Child 1 and
= 2 for Child 2), ensuring that all generated solutions remain architecturally meaningful and regulation-consistent.
The resulting offspring after crossover are therefore identical to those shown in
Figure 6. Mutation is subsequently applied to maintain population diversity and prevent premature convergence. Polynomial mutation perturbs real-valued genes within their admissible bounds, whereas the discrete shape gene may undergo random-reset mutation with a low probability. In the illustrated example (
Figure 6), Child 1 experiences mutations in the parking proportion (
: 0.32 to 0.37), pricing margin (
: 0.13 to 0.10), and shape configuration (
= 4 to 1), while Child 2 remains unchanged. Because the proposed framework requires discrete quantities for downstream geometric and regulatory computations, a mapping step is then applied. For instance, if the proposed framework vertical configuration yields
= 20 floors, the mutated parking proportion results in
= round (0.37 × 20) = 7 parking floors and
= 13 residential floors. The offspring are finally checked against all regulatory constraints and repaired if necessary, ensuring that only regulation-compliant solutions proceed to the subsequent evolutionary selection stage.
The repair mechanism was designed to preserve as much genetic information as possible while restoring feasibility. For example, violations of maximum building height were corrected by reducing floor-to-floor heights or the proportion of residential floors, whereas FAR violations were corrected by reducing buildable area through setback adjustment. Green-area and open-space violations triggered localized geometric modifications that increased the corresponding environmental provisions. This targeted repair strategy minimized disruption to chromosome diversity and reduced the risk of premature convergence.
3.4. Non-Dominated Sorting
After evaluating all individuals in the combined population
, NSGA-II applies non-dominated sorting to classify candidate solutions into a hierarchy of Pareto fronts
. In the mixed minimization–maximization setting adopted in the optimization framework, a solution
is said to dominate another solution
(denoted
) if
is no worse than
in all objectives and strictly better in at least one objective. For minimization objectives, the dominance relationship is defined as Equations (54) and (55).
The first Pareto front consists of all non-dominated solutions in and represents the current approximation of the Pareto frontier. Once is identified and removed, the same dominance evaluation is repeated on the remaining solutions to obtain subsequent fronts …. Solutions in lower-index fronts therefore represent superior trade-offs, whereas higher-index fronts contain progressively inferior compromises.
In the context of the proposed framework, the first front does not identify a single “optimal” design but rather a set of regulation-compliant alternatives reflecting different managerial priorities, such as profit-oriented, green-oriented, or compactness-oriented solutions. This ranking mechanism is essential for supporting informed decision-making in construction planning, where trade-offs among competing objectives are unavoidable.
3.5. Crowding Distance Sorting
Within each Pareto front, NSGA-II applies crowding distance sorting to preserve diversity along the trade-off surface. For a given front
, solutions are sorted independently for each objective
. The crowding distance contribution of solution
with respect to objective
is computed as Equation (56)
where
and
denote the objective values of the neighboring solutions in the sorted list, while
and
are the maximum and minimum objective values within the front. Boundary solutions are assigned an infinite (or sufficiently large) distance to ensure their preservation at the extremes of the objective space.
The overall crowding distance for a solution is obtained by summing the contributions across all objectives as Equation (57)
A larger crowding distance indicates that a solution lies in a less crowded region of the objective space. During the elitist replacement step, if a Pareto front cannot be fully accommodated in the next generation , NSGA-II preferentially selects solutions with larger crowding distances. This mechanism ensures that the retained population spans the Pareto frontier rather than clustering around a narrow region, thereby maintaining a diverse set of regulation-compliant design alternatives throughout the REGEN–NSGA-II evolutionary search.
3.6. REGEN–NSGA-II Evolutionary Search Cycle
As illustrated in
Figure 3, the evolutionary search proceeds iteratively. Starting from
, parent selection, crossover, mutation, and evaluation generate
. The combined set
is ranked via non-dominated sorting and crowding distance, and the best
solutions are retained as
. This elitist cycle ensures that high-quality solutions are preserved while new regions of the design space are explored.
3.7. NSGA-II Parameter Settings
To ensure reproducibility and transparency of the optimization process, the principal NSGA-II settings adopted in this study are summarized in
Table 3. The optimization was performed using a population size of 100 individuals for 200 generations. Simulated binary crossover (SBX) and polynomial mutation were employed for real-valued variables, while discrete inheritance and random-reset mutation were used for categorical variables. The crossover and mutation probabilities were set to 0.90 and 0.10, respectively, following commonly adopted practices in multi-objective evolutionary optimization. The SBX distribution index (ηc) and polynomial mutation distribution index (ηm) were both set to 20, providing a balanced trade-off between global exploration and local exploitation of the search space.
3.8. Termination Criteria Are Reached
The optimization process was terminated after reaching the predefined maximum number of generations (200 generations). In addition, convergence behavior was monitored through stabilization of the Pareto-front structure and objective-value distributions over successive generations. To account for the stochastic nature of NSGA-II, 30 independent optimization runs were conducted using different random seeds. The final Pareto front reported in this study corresponds to the run exhibiting the best balance between convergence quality and solution diversity among all completed runs.
The resulting first non-dominated front represents a set of regulation-compliant, Pareto-optimal building designs. These solutions provide decision-makers with explicit and interpretable trade-offs among economic performance, spatial efficiency, environmental quality, and geometric compactness.
5. Numerical Experiments
This study employs a real condominium feasibility case in Bangkok, Thailand, originally developed using CAD and spreadsheets by Sirivirotsakul (2020), as the baseline design scenario [
33]. The site area is 2474 m
2 under orange zoning (Y.5) with FAR = 4:1, irregular geometry, road frontage of 9.30 m, and a height limit of 8 stories (≤23 m). Using identical site conditions and regulatory constraints, the convergence behavior and Pareto-front formation of the proposed framework are first examined in
Figure 8 and
Figure 9, demonstrating the stabilization of non-dominated solutions over successive generations. Design outcomes from conventional practice (baseline), parametric BIM-based design [
6], and the proposed framework are then quantitatively compared in
Table 4, while the resulting trade-offs among profit, green area, building efficiency, shape factor, and footprint area are visualized in
Figure 10, enabling a controlled assessment of the added value of evolutionary multi-objective optimization.
The present case study was selected to demonstrate the practical feasibility of integrating regulation-aware optimization within a realistic residential development context. Although the use of a representative condominium project enables controlled comparison among conventional practice, parametric BIM-based design, and the proposed framework under identical regulatory conditions, the findings should not be interpreted as universal evidence of generalizability. Additional validation across multiple projects involving different site geometries, zoning conditions, development typologies, and regulatory environments is necessary to further assess the robustness and transferability of the proposed framework.
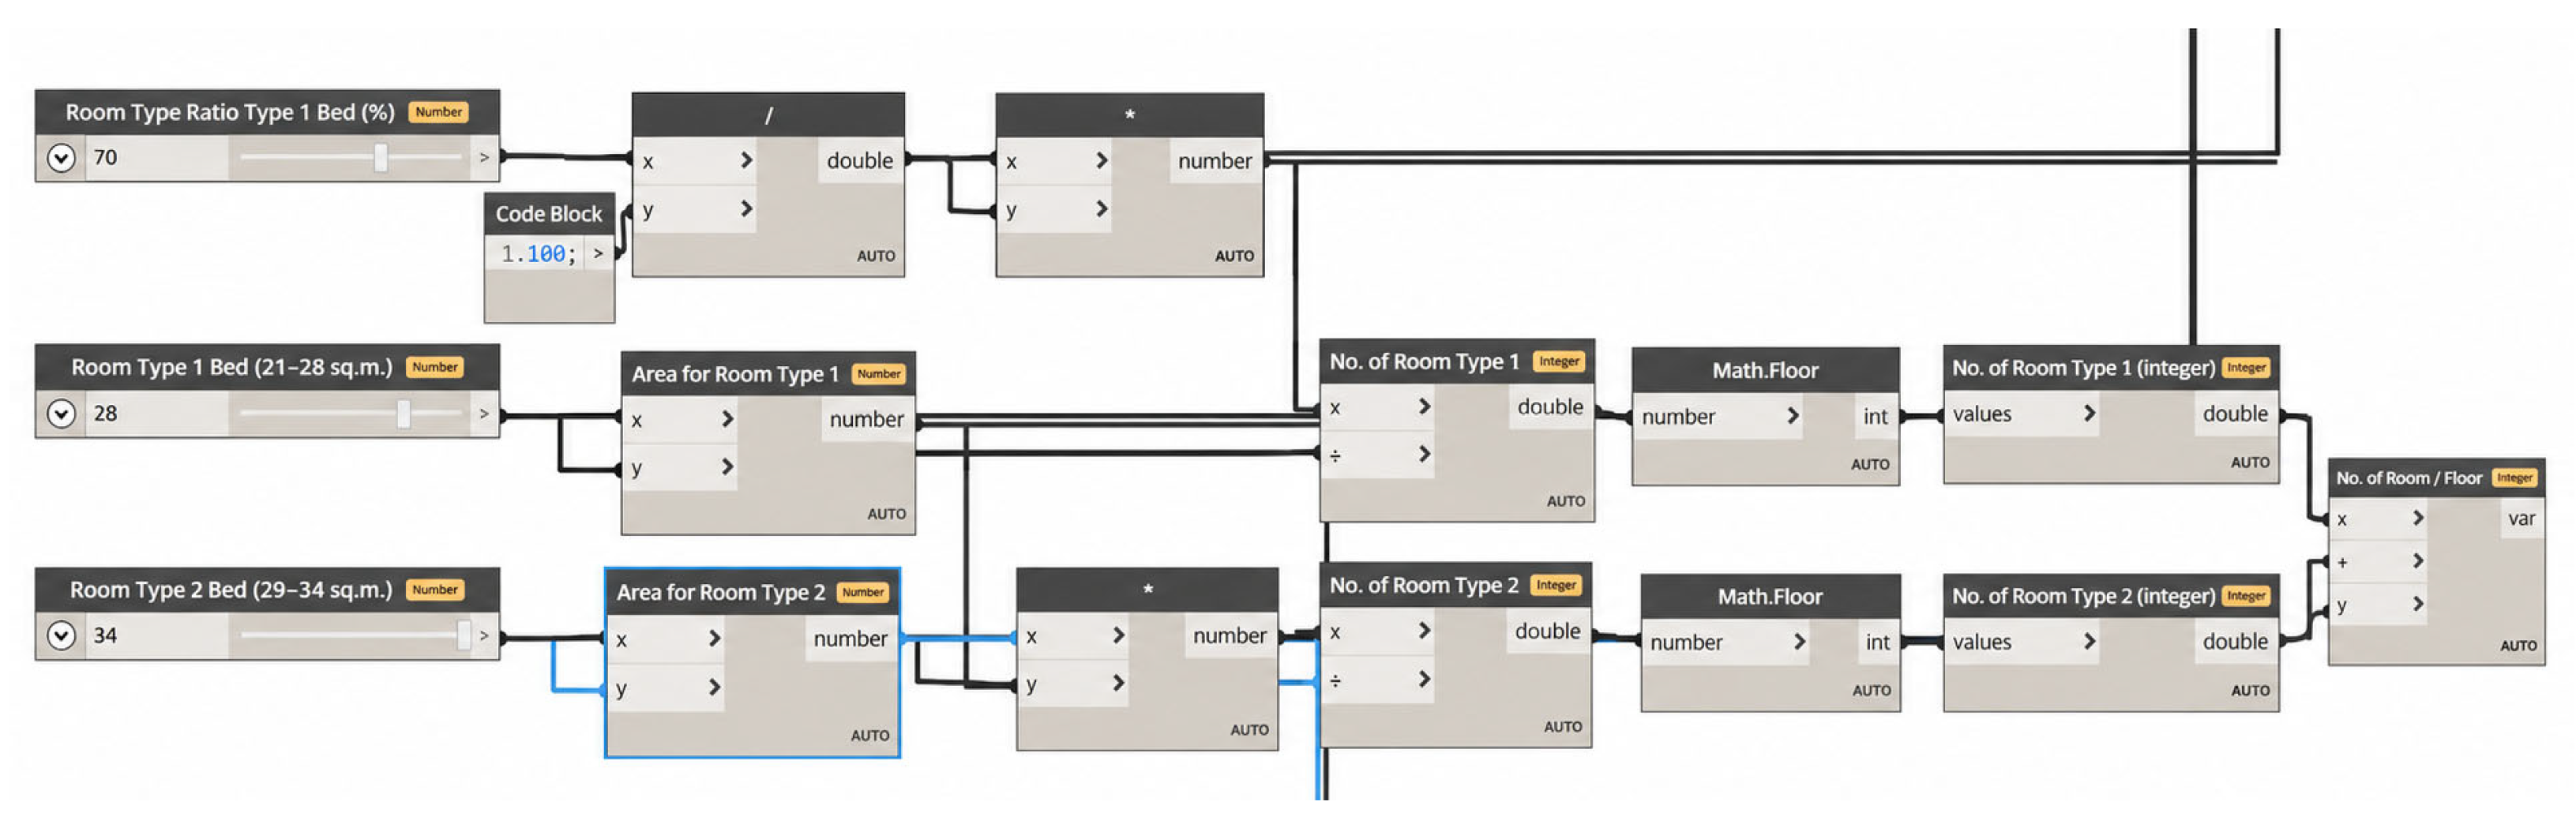
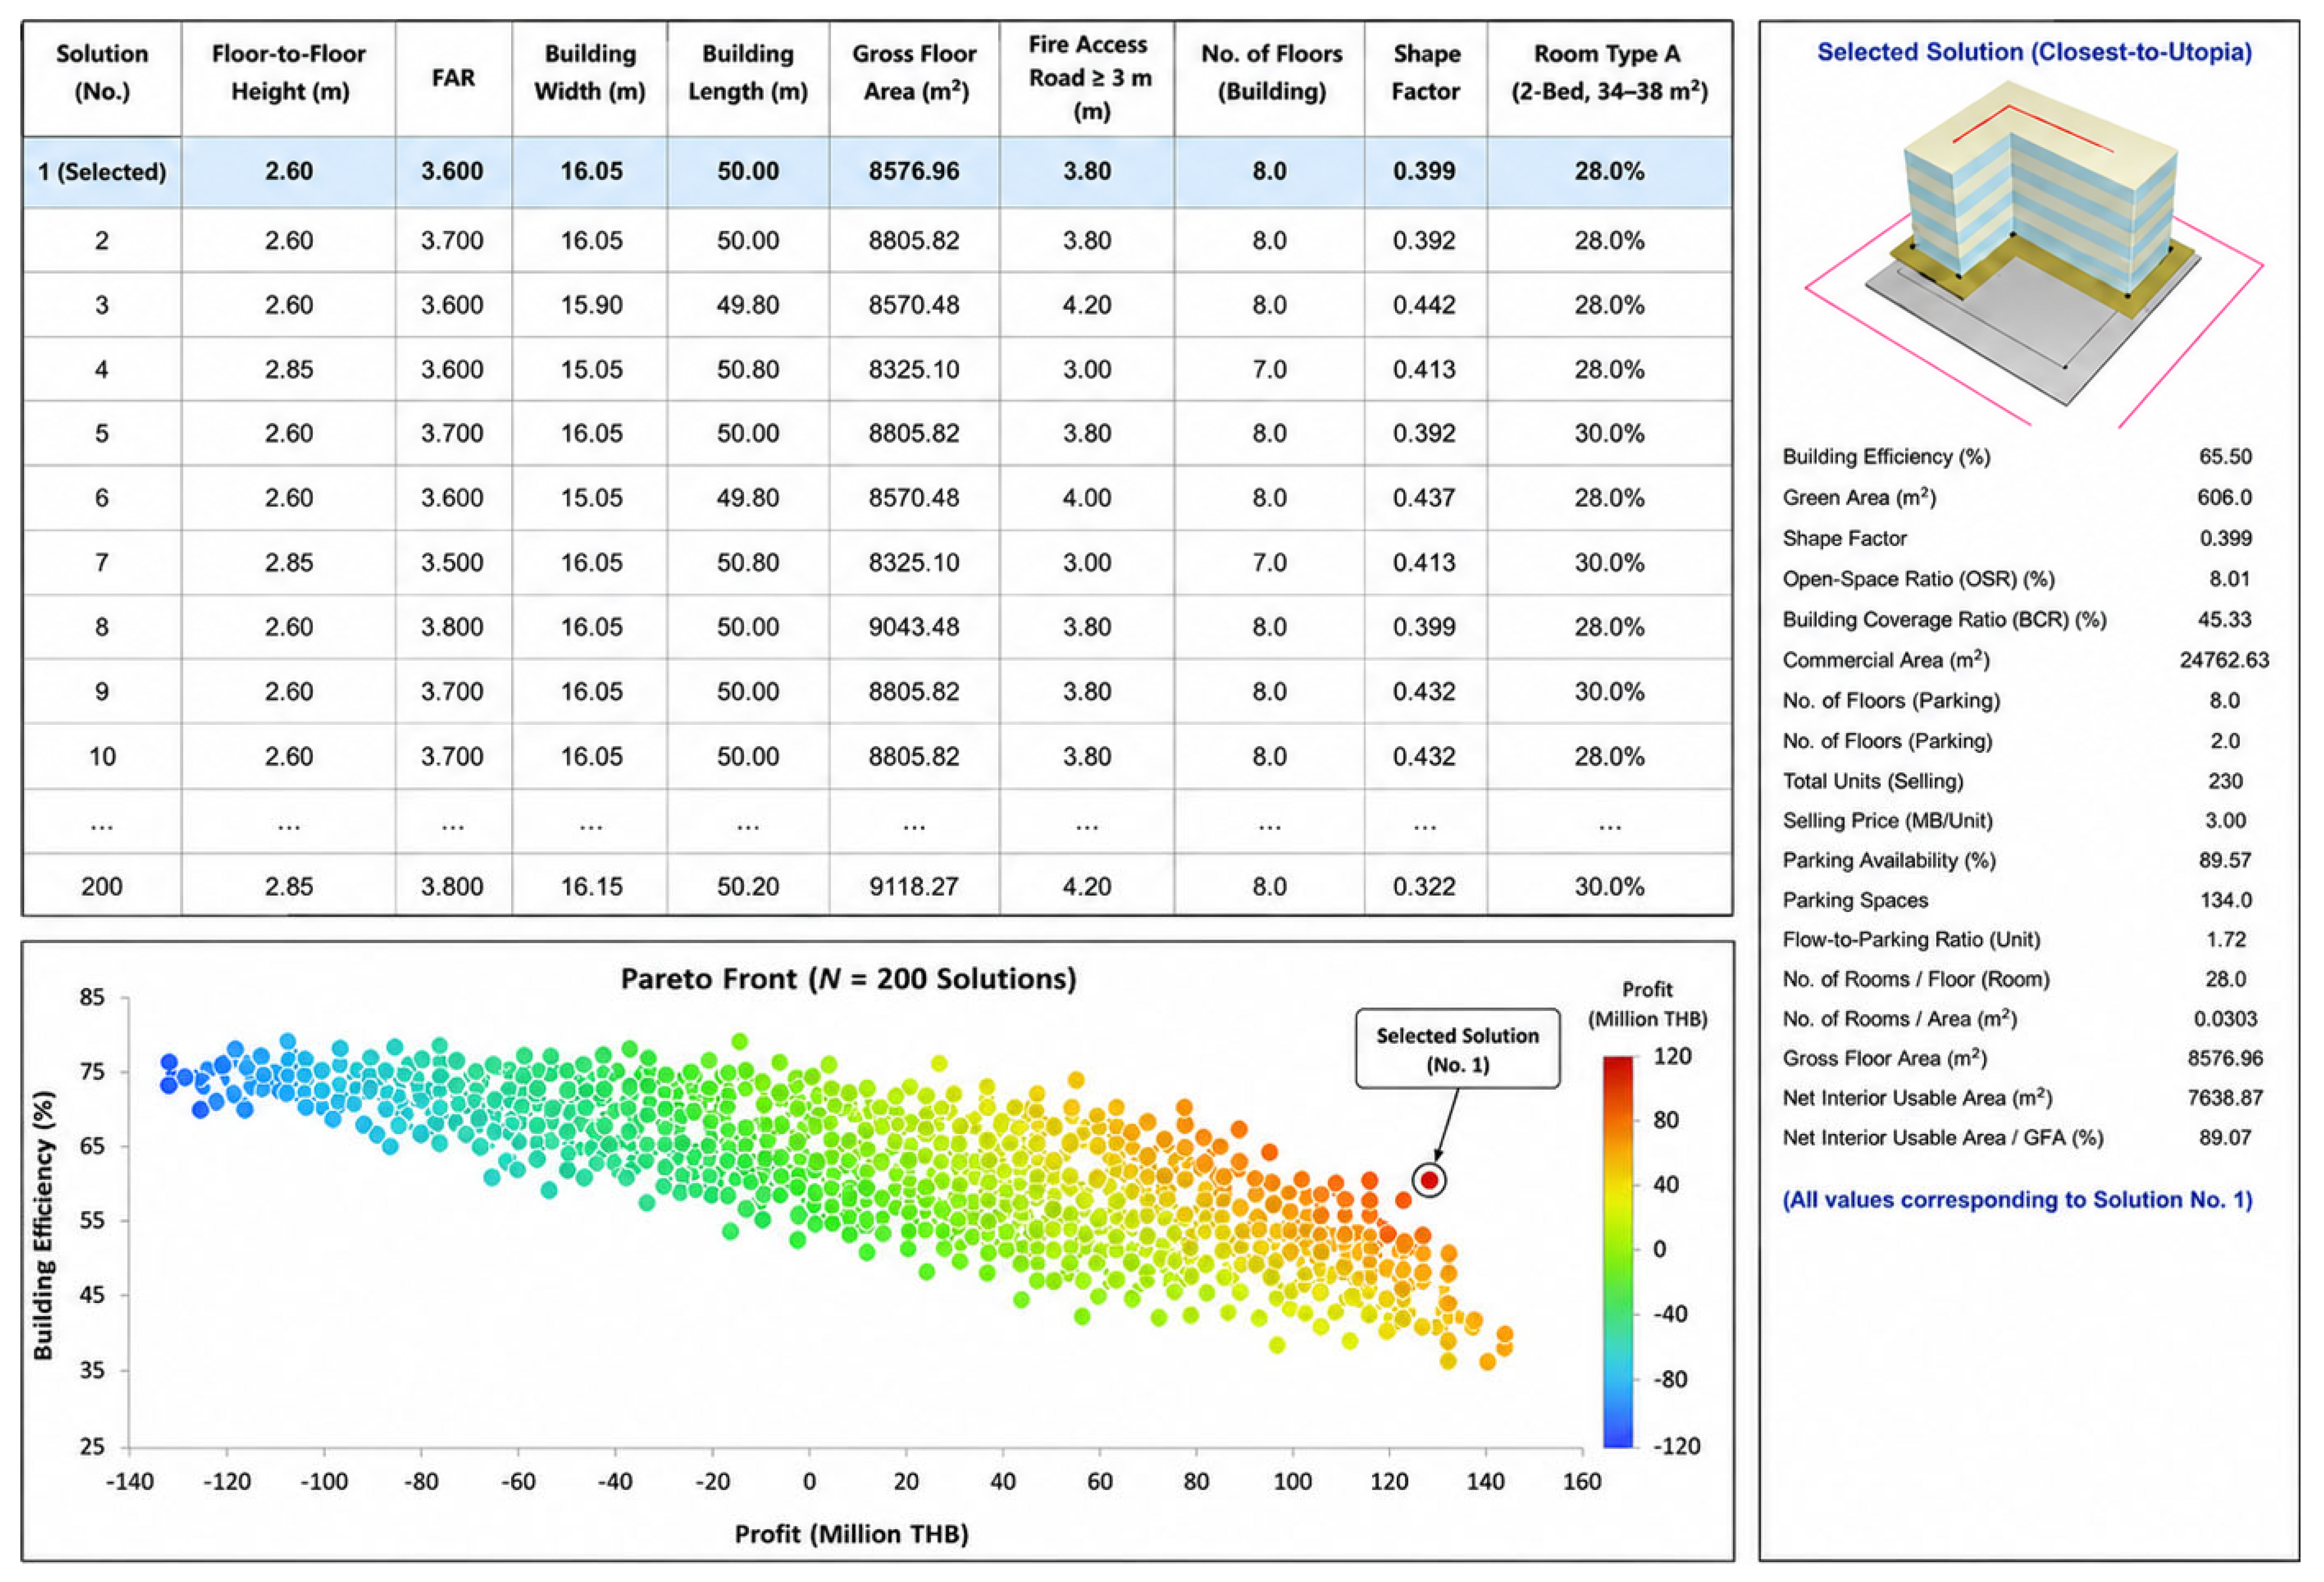
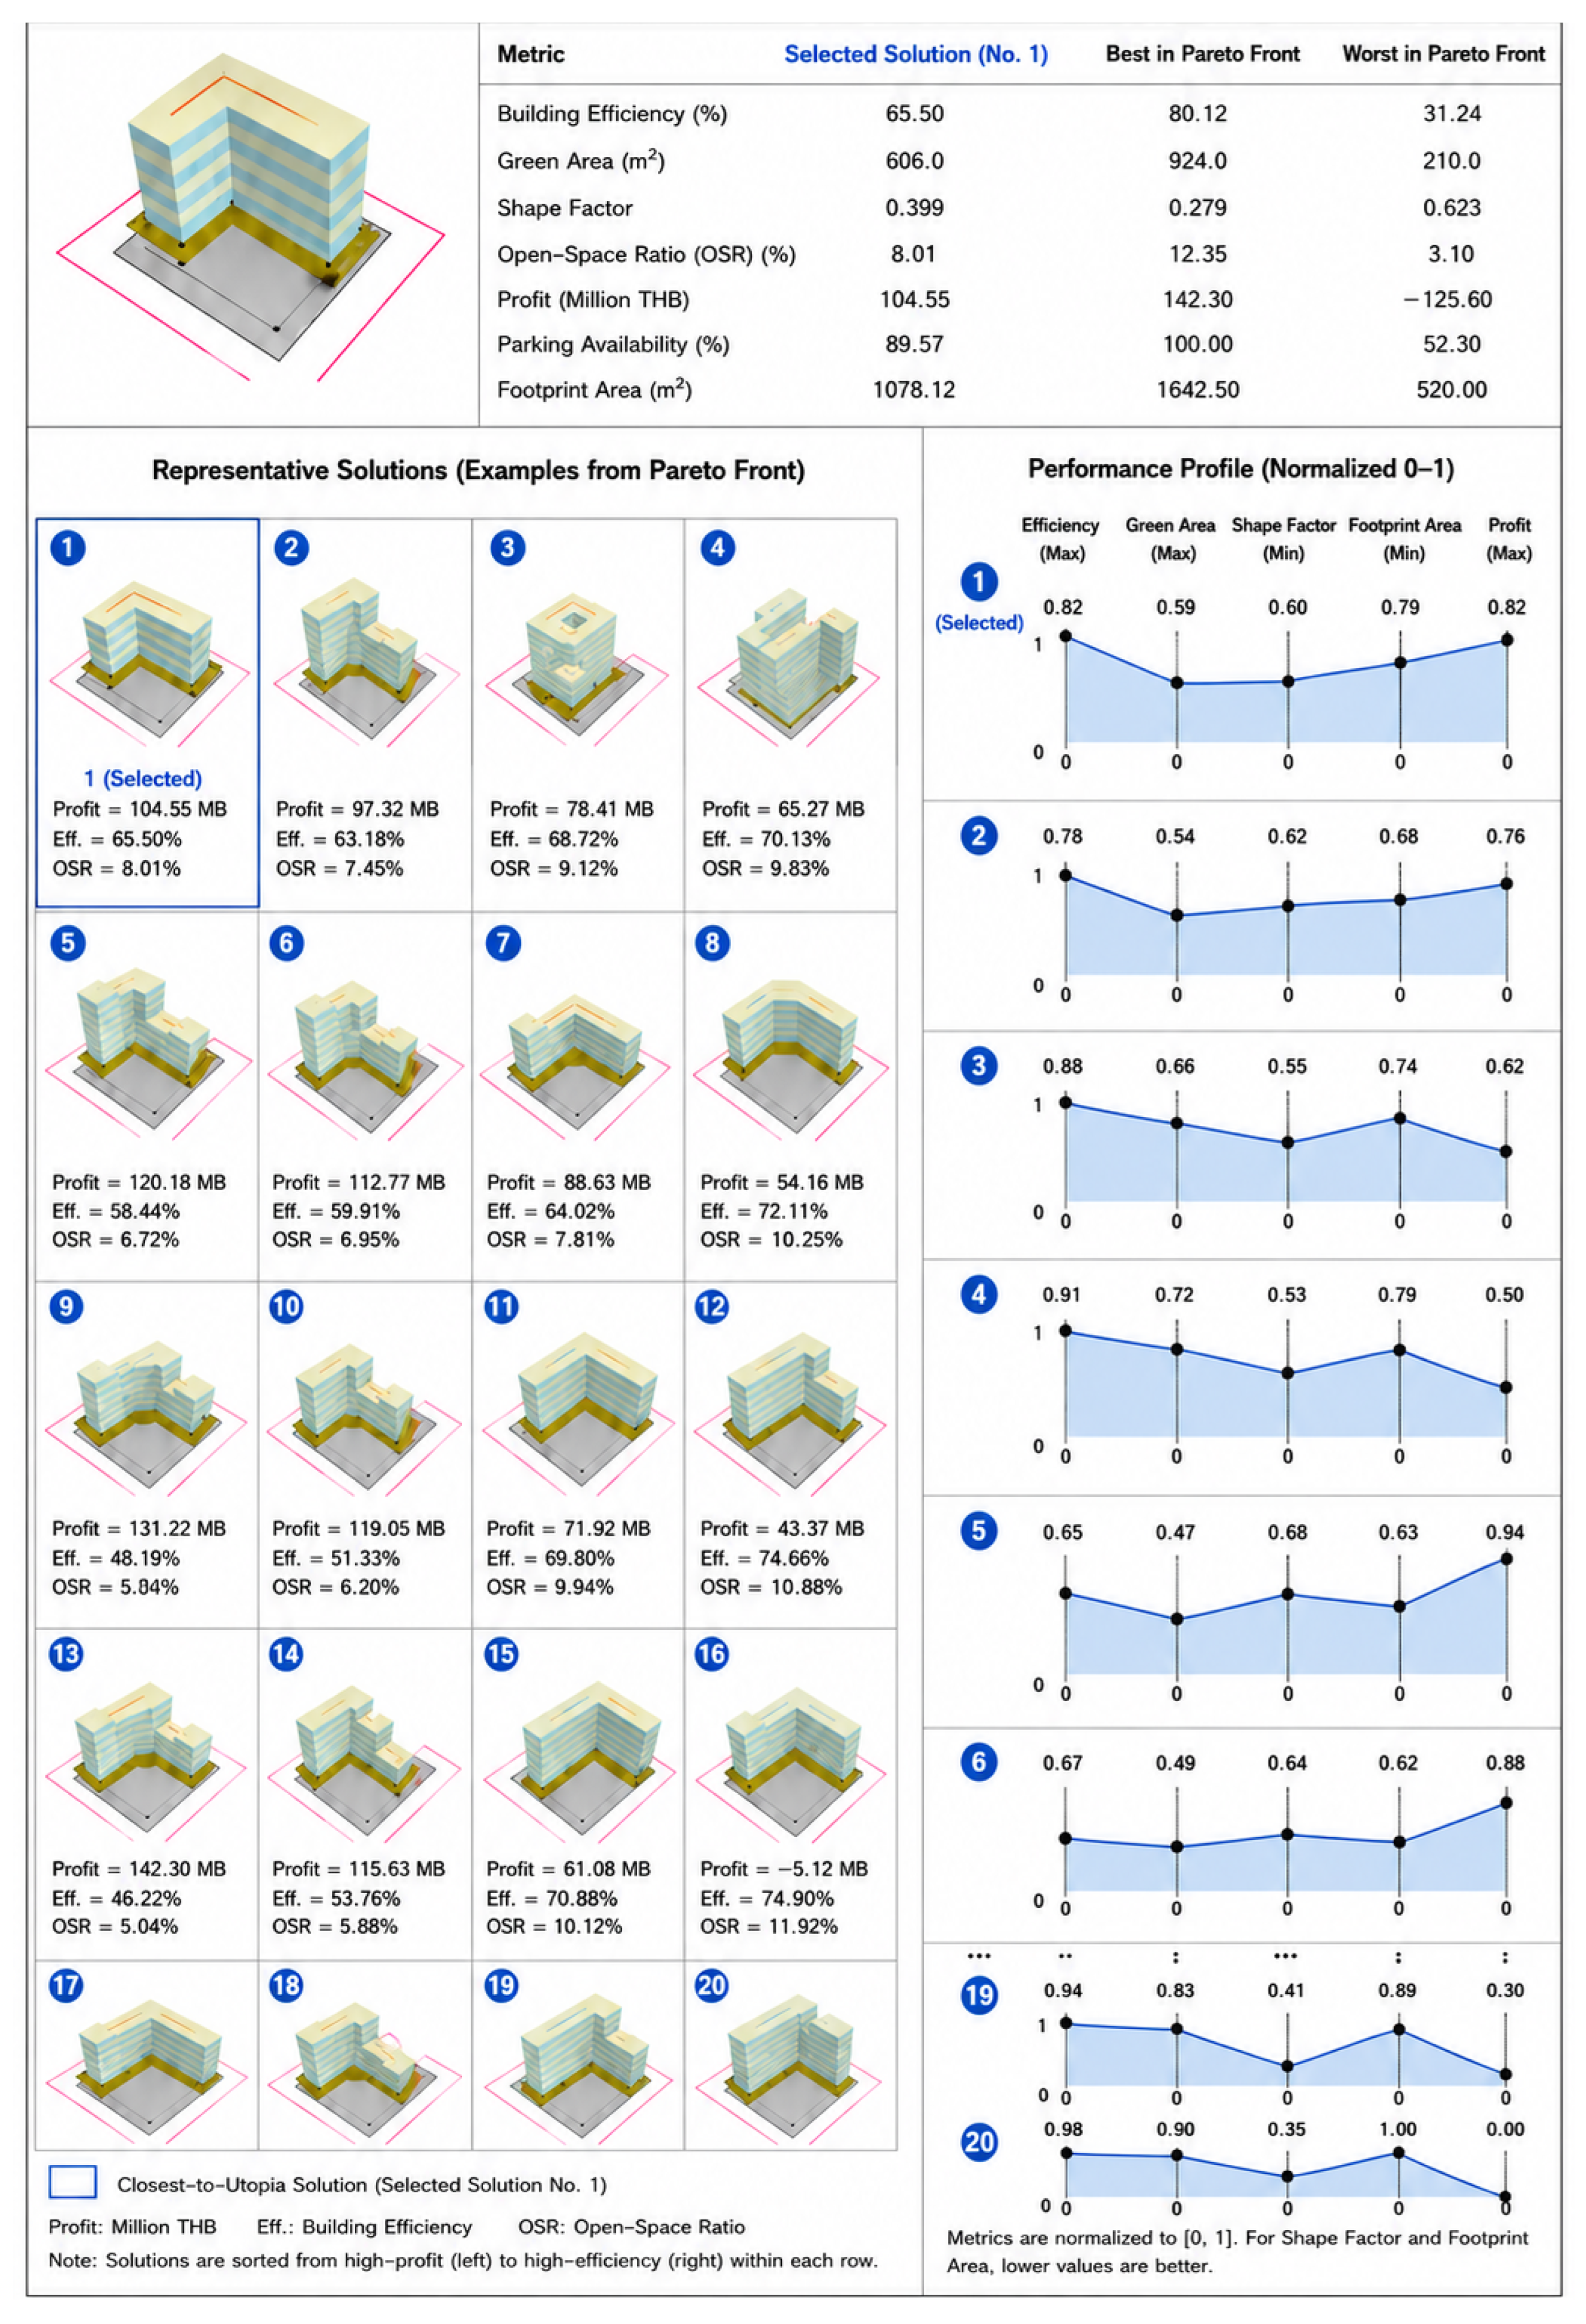
Figure 8 presents the graphical user interface and visualization outputs generated by the optimization framework during the multi-objective design exploration. It shows the population of candidate solutions and their performance distribution across the five objectives, forming the Pareto front. It illustrates the ranked design alternatives with corresponding parametric BIM models generated automatically through the Dynamo–Revit environment
Figure 9 displays the normalized multi-objective-performance profiles used to support decision-making and identify the recommended solution. Based on the Pareto-front analysis, the optimal solution—defined as the design closest to the utopia point—achieves a balanced trade-off among all five objectives, namely, minimizing shape factor and building footprint area while simultaneously maximizing project profit, green area, and building efficiency. The selected optimal solution exhibits a shape factor of 0.399, profit of 104.548 million THB, green area of 606.0 m
2, building efficiency of 65.501%, and a footprint area of 1078.15 m
2.
From a computational perspective, the Pareto-front structure exhibited progressive stabilization during the later stages of the evolutionary search, indicating satisfactory convergence under the adopted population size and generation settings. The optimization problem considered in this study comprises seven decision variables and five objective functions, which remained computationally manageable within the Dynamo–NSGA-II integration environment. Nevertheless, computational complexity is expected to increase as additional objectives, design variables, or regulatory constraints are introduced.
Table 4 reports a quantitative comparison between conventional design practice, parametric BIM-based design, and the proposed framework under identical geometric and regulatory constraints. In contrast to the baseline and parametric approaches, REGEN formulates early-stage building design as a constrained multi-objective optimization problem, simultaneously maximizing profit, green area, and building efficiency while minimizing shape factor and footprint area. Consequently, the proposed framework solution does not converge toward boundary solutions (e.g., FAR = 4.0) but instead selects a Pareto-optimal design at FAR = 3.6 that minimizes global trade-off distance in the objective space.
From a geometric standpoint, the proposed framework solution achieves the minimum shape factor (0.399) and footprint area (1078 m2), indicating a locally optimal surface-to-volume configuration within the feasible region. Importantly, this compactness does not arise from heuristic form manipulation but from evolutionary search guided by dominance ranking and diversity preservation. The resulting configuration yields the highest building efficiency (65.50%) despite a reduced gross floor area, confirming that efficiency gains emerge from nonlinear interactions between geometry, circulation, and unit layout rather than monotonic scaling of floor area.
Economically,
Table 4 reveals that profit maximization is not a single-objective extremum but a trade-off-sensitive outcome. While the parametric BIM-based design attains the highest absolute profit through aggressive FAR utilization, the developed approach identifies a Pareto-optimal solution that balances profit (104.55 million THB) against geometric compactness and environmental objectives. This solution corresponds to the point with minimum Euclidean distance to the utopia point in the normalized objective space, thereby formalizing decision-maker preference articulation within the optimization process.
Environmental performance further illustrates REGEN’s algorithmic advantage. By jointly minimizing footprint area and maximizing green area, the proposed framework identifies solutions that dominate both baseline and parametric designs in the green–footprint subspace, achieving a green area of 606 m2 and an open-space ratio of 15%. These outcomes suggest that the proposed framework may facilitate exploration of non-intuitive regions of the feasible design space that could be difficult to identify through conventional manual iteration within the investigated case study.
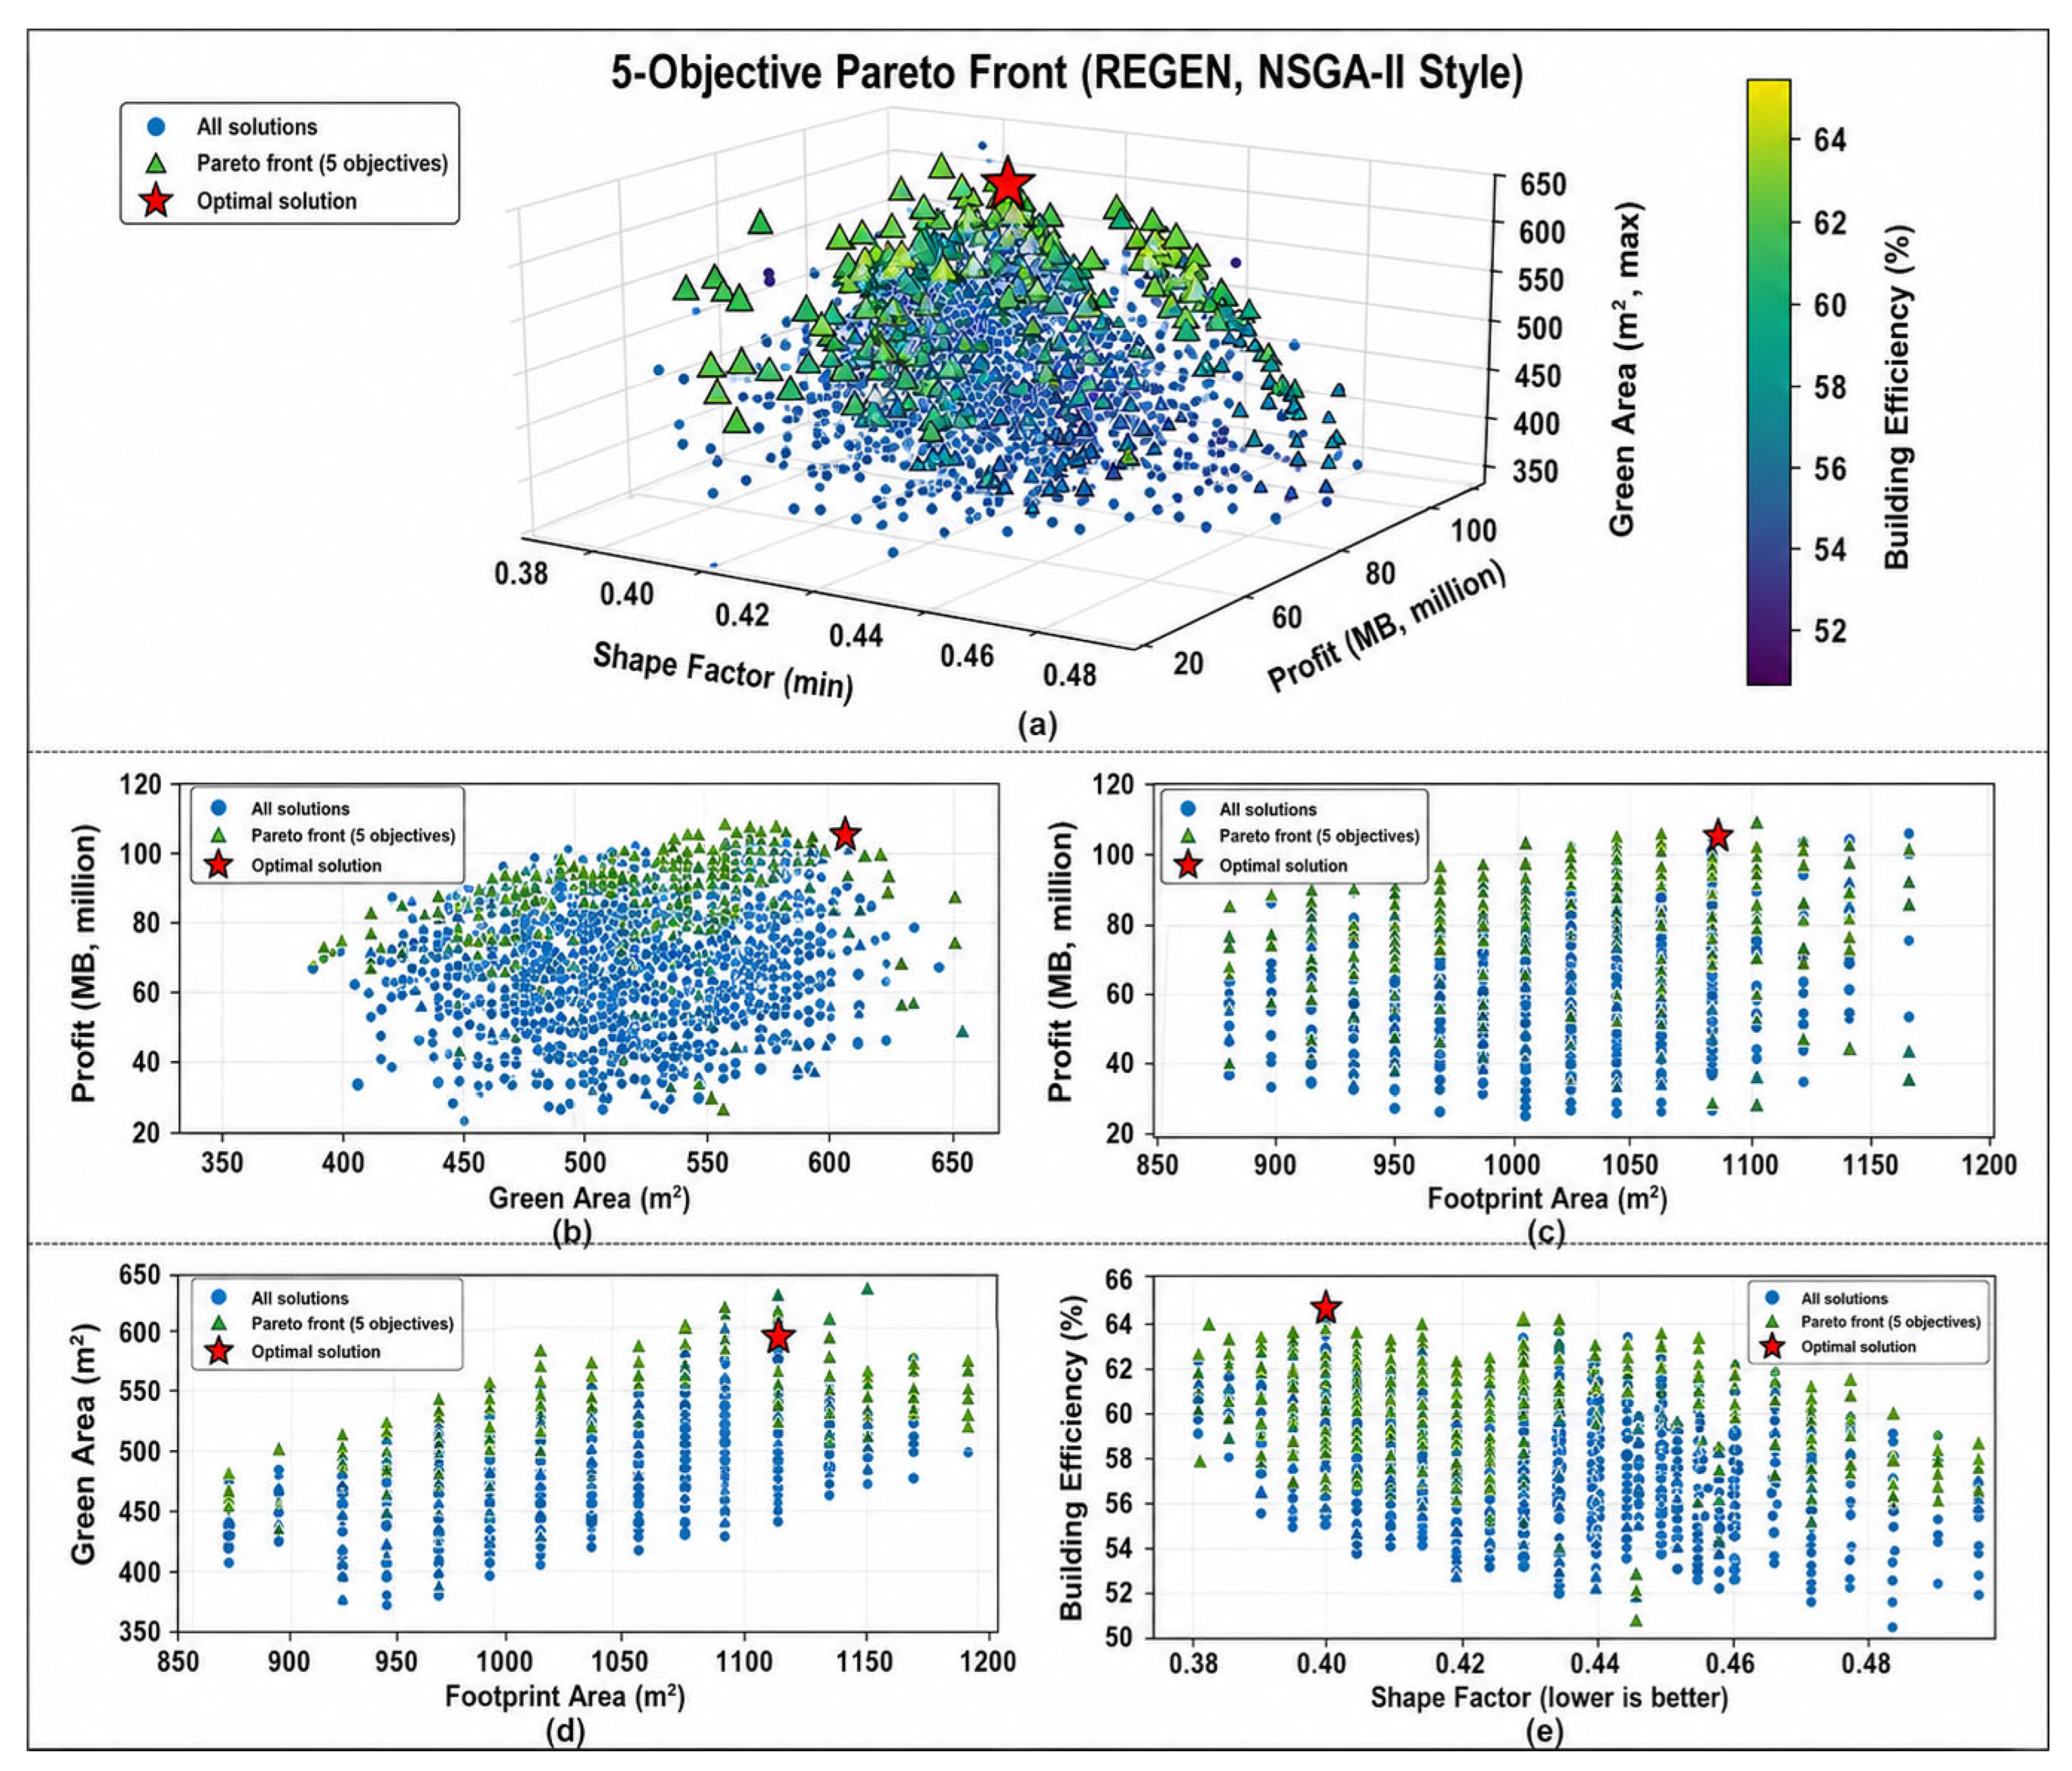
Figure 10 illustrates the pairwise trade-off structure among the five competing objectives optimized by the proposed framework using NSGA-II: maximization of project profit, maximization of green area, maximization of building efficiency, minimization of shape factor, and minimization of building footprint area. Each subplot visualizes a two-dimensional projection of the high-dimensional Pareto set, where blue markers represent all feasible solutions generated during the evolutionary search, orange markers denote non-dominated (Pareto-optimal) solutions, and the red star highlights the selected compromise solution identified as the closest-to-utopia point.
Figure 10a presents the three-dimensional Pareto structure spanned by shape factor, profit, and green area, with building efficiency encoded as a color gradient. The resulting Pareto surface is non-convex and discontinuous, reflecting strong nonlinear coupling between geometric compactness, environmental provision, and economic return. Solutions with lower shape factors tend to cluster toward higher efficiency values, indicating that geometric compactness is structurally aligned with improved internal space utilization. However, profit does not monotonically increase along the same direction, confirming that economic optimality emerges from a balance between geometric efficiency and regulatory-constrained land use rather than from single-objective intensification.
Figure 10b (profit vs. green area) and
Figure 10d (green area vs. footprint area) jointly demonstrate that green-area maximization is not achieved through footprint expansion but through geometric reconfiguration and vertical efficiency. Pareto-optimal solutions form an upward-sloping frontier, indicating that moderate profit levels can coexist with substantial green provision. The selected compromise solution lies near the upper envelope of green area while maintaining competitive profit, illustrating that REGEN can identify environmentally favorable designs without resorting to economically extreme configurations.
Figure 10c reveals a nonlinear and heteroscedastic relationship between profit and footprint area. While larger footprints provide higher development capacity, marginal profit gains diminish beyond a threshold due to increased construction cost and reduced efficiency. The Pareto front therefore bends inward, highlighting diminishing returns from horizontal expansion. The optimal solution is located near this knee region, where
Figure 10e indicates a strong inverse relationship between shape factor and building efficiency within the Pareto-optimal solutions obtained from the investigated case study. Solutions with lower shape factors were generally associated with higher building efficiency, suggesting that the proposed shape-factor formulation captures aspects of geometric compactness relevant to spatial utilization and constructability. The selected compromise solution was located near the lower bound of shape factor while maintaining high building efficiency, indicating that the proposed framework can promote geometrically compact and efficient design alternatives under the encoded regulatory conditions. However, the generalizability of this relationship should be further evaluated through additional case studies involving different development contexts and regulatory environments.
The highlighted solution corresponds to the minimum Euclidean distance to the utopia point in the normalized objective space, where all objectives simultaneously attain their ideal values. This selection mechanism transforms the Pareto set into an actionable decision-support output by explicitly encoding decision-maker preferences without collapsing the problem into a single-objective formulation. Importantly, the location of the selected solution on the Pareto surface confirms that it is not an extreme point but a mathematically defensible compromise that balances profitability, environmental quality, spatial efficiency, and geometric compactness.
Collectively,
Figure 10 demonstrates that the developed approach does not merely generate isolated optimal designs but reveals the underlying structure of trade-offs inherent in regulation-constrained residential development. By exposing the geometry of the Pareto front and enabling formal closest-to-utopia selection, the framework provides a transparent and reproducible basis for early-stage decision-making. This capability extends beyond conventional manual design iteration and parametric sensitivity analysis by providing a transparent and reproducible basis for exploring regulation-constrained trade-offs. These findings suggest that the proposed framework has the potential to serve as a mathematically grounded decision-support framework for construction engineering and management applications.
It should be emphasized that the Pareto-front visualizations presented in
Figure 8,
Figure 9 and
Figure 10 serve not only as optimization outputs but also as decision-support instruments. By explicitly visualizing trade-offs among profit, green area, building efficiency, shape factor, and footprint area, the framework enables stakeholders to understand the implications of alternative design priorities before selecting a preferred solution. Consequently, the Pareto front should be interpreted as a spectrum of feasible design choices rather than a single optimal answer.
Table 5 and
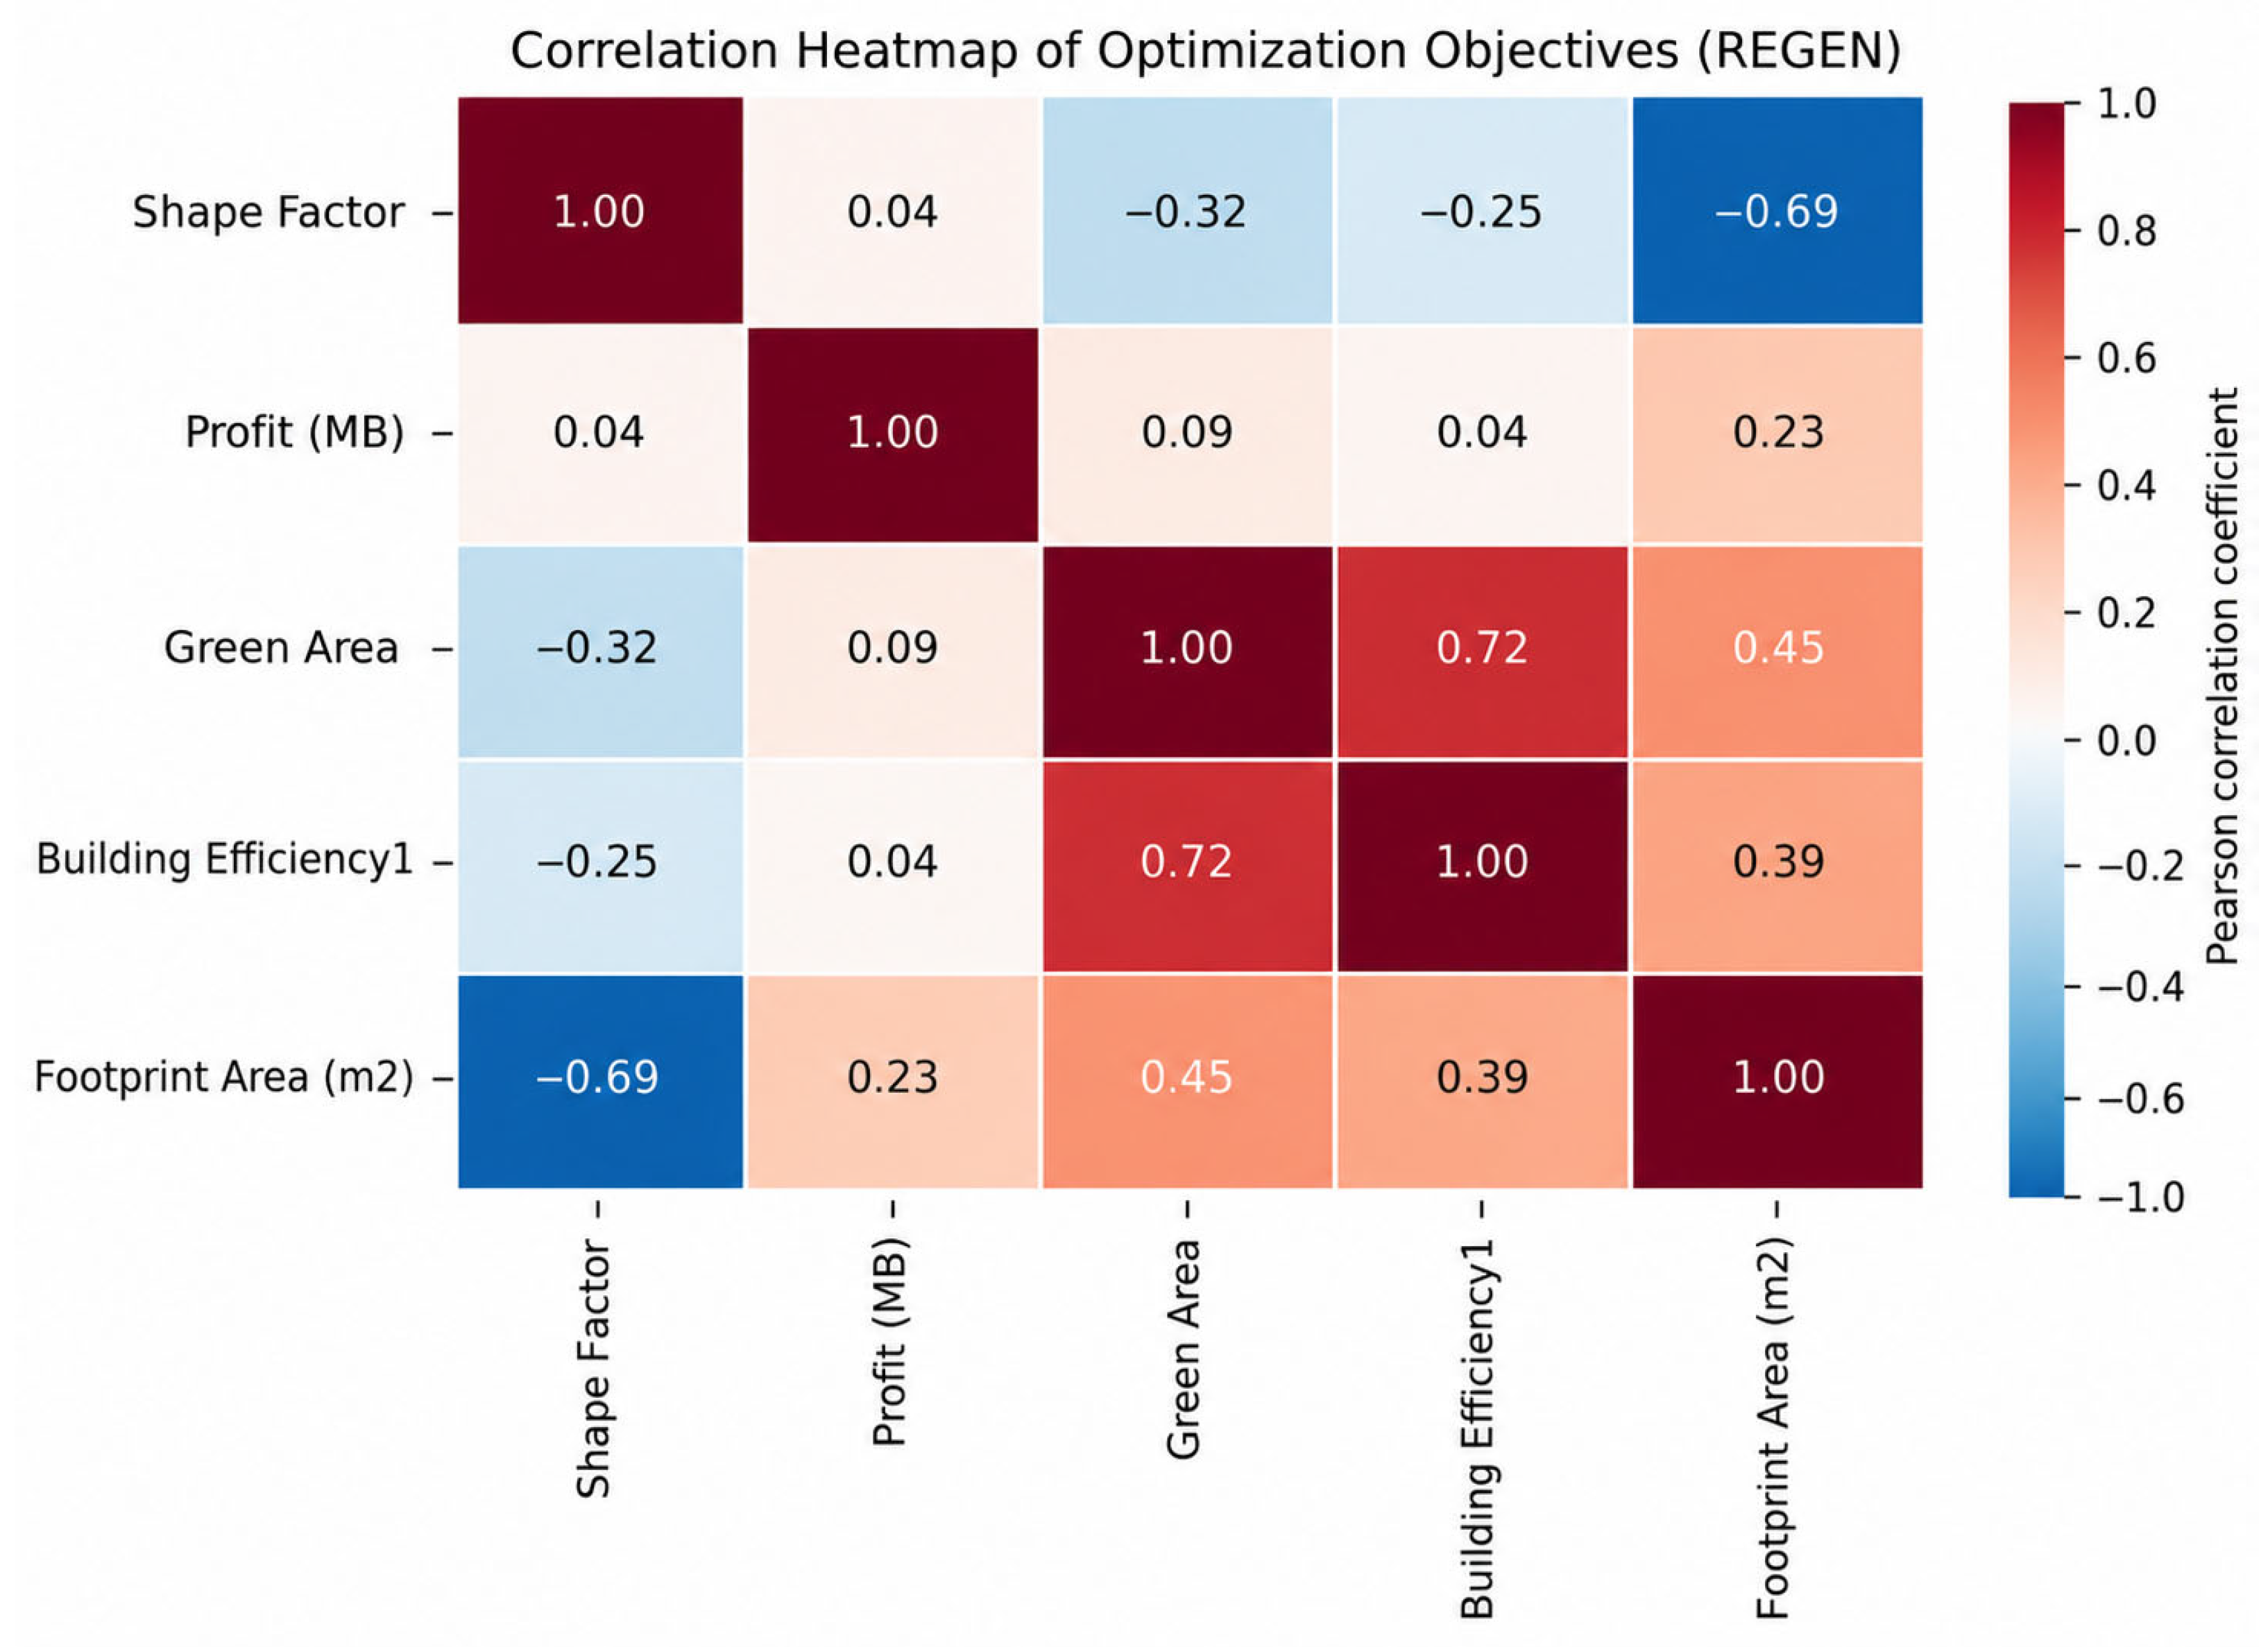
Table 6 report the Pearson and Spearman correlation matrices, respectively, computed from the Pareto-optimal solution set generated by the proposed framework. The Pearson coefficients quantify linear dependencies, while the Spearman coefficients capture monotonic but potentially nonlinear relationships, providing a robustness check against distributional and functional assumptions.
Across both matrices, a strong and consistent negative correlation is observed between shape factor and footprint area (Pearson: −0.686; Spearman: −0.676), confirming that geometric compactness is structurally coupled with horizontal land consumption. This relationship is algorithmically significant, as both objectives are simultaneously minimized in the proposed framework formulation, and their correlation indicates a partially aligned objective space rather than a purely conflicting one.
In contrast, profit exhibits weak correlations with most geometric and environmental objectives (|ρ| < 0.26 in both Pearson and Spearman matrices), implying that profitability emerges as a weakly coupled objective within the Pareto set. This decoupling explains why profit-maximizing solutions do not trivially dominate the Pareto front and why the proposed framework is able to identify high-profit alternatives that preserve environmental and geometric performance. A strong positive correlation between green area and building efficiency is consistently observed (Pearson: 0.723; Spearman: 0.717). This finding provides quantitative evidence that vertical efficiency gains and environmental performance are not antagonistic in this case study but instead co-evolve through compact massing and optimized floor-plate utilization. The persistence of this relationship across both correlation measures reinforces its structural robustness.
From a practical perspective, the strong positive relationship between green area and building efficiency suggests that compact building configurations may simultaneously support environmental and spatial objectives within the investigated regulatory context. Conversely, the weak correlations involving project profit indicate that economic performance is influenced by multiple interacting factors and cannot be explained solely by geometric characteristics. These findings highlight the importance of multi-objective optimization approaches capable of simultaneously considering diverse and partially conflicting performance criteria during early-stage residential design.
Figure 11 reveals a structured dependency among optimization objectives driven by FAR, height, and access-road constraints. Strong coupling between shape factor and footprint area reflects geometric–land-use interdependence, while the positive correlation between green area and building efficiency indicates a synergy induced by compact massing under height limits. Profit remains weakly correlated with geometric metrics, confirming its emergent, multi-variable nature. These correlation patterns motivate the surrogate regression formulations in Equations (58)–(60), which analytically approximate Pareto-front interactions for subsequent sensitivity analysis.
The surrogate regression equations presented in Equations (58)–(60) were developed to facilitate interpretation of the relationships among the objective functions and performance indicators observed within the Pareto-optimal solution set. These models should be interpreted as descriptive representations intended to improve understanding of the dominant trends identified in the investigated case study rather than universally applicable predictive models. The correlation analyses presented in
Table 4 and
Table 5 further support the consistency of these relationships under both linear and monotonic assumptions. Future studies should investigate additional model quality indicators, including R
2, RMSE, and MAPE, to further assess predictive performance under broader validation scenarios.
6. Conclusions and Recommendations
This study proposed REGEN, a regulation-aware generative design framework that integrates algebraic representation of planning and building-control regulations with parametric BIM and NSGA-II-based multi-objective optimization. The framework addresses a critical gap in early-stage residential building design, where geometric configuration, regulatory compliance, and economic feasibility are typically evaluated through fragmented and experience-driven workflows.
6.1. Key Findings and Scientific Contributions
The numerical experiments demonstrate that regulatory compliance can be embedded as an intrinsic property of the design-generation process, rather than treated as a post hoc step. By formalizing FAR, height limits, setbacks, and open-space, green-area, and parking requirements as explicit algebraic constraints, the proposed framework ensures that all candidate solutions entering the evolutionary search satisfy the encoded planning and building-control regulations by construction. This characteristic differentiates the proposed framework from conventional CAD–spreadsheet workflows within the context of the investigated case study.
The resulting Pareto fronts reveal non-intuitive trade-off structures among profit, green area, building efficiency, shape factor, and footprint area that cannot be identified through manual iteration. In particular, the results show that:
Geometric compactness (low shape factor) is structurally aligned with higher building efficiency and reduced footprint area under FAR and height constraints;
Green-area provision and spatial efficiency co-evolve positively when compact massing strategies are enforced within regulatory envelopes;
Profit emerges as a weakly coupled objective, governed by nonlinear interactions among efficiency, footprint, and pricing rather than by FAR maximization alone.
The findings reported in this study should be interpreted at three complementary levels. First, demonstrated findings directly supported by the optimization results include the existence of trade-offs among profit, green area, building efficiency, shape factor, and footprint area, as well as the ability of the proposed framework to generate regulation-compliant Pareto-optimal solutions. Second, several observations—including the positive association between green area and building efficiency and the weak coupling between profit and geometric metrics—are specific to the investigated Bangkok condominium case study and may vary under different regulatory or market conditions. Third, broader implications concerning the applicability of regulation-aware generative optimization as a decision-support paradigm should be interpreted as promising directions requiring further validation through additional case studies and regulatory environments.
The closest-to-utopia solution selected from the Pareto front provides a transparent and systematic approach for supporting decision-making under multiple competing objectives. Rather than converging toward boundary solutions (e.g., FAR = 4.0), the proposed framework identified compromise solutions characterized by shorter global trade-off distances across the considered objectives. Within the investigated case study, the selected solution suggests that maximizing development intensity may not necessarily produce the most balanced economic and environmental outcomes. This observation highlights the potential value of multi-objective optimization for supporting early-stage residential design decisions; however, further validation across additional development scenarios and regulatory contexts is required before broader generalizations can be established.
Although the closest-to-utopia strategy provides an objective and reproducible mechanism for identifying a representative compromise solution, it should not be interpreted as prescribing a universally preferred design. Different stakeholders may assign different levels of importance to economic performance, environmental quality, spatial efficiency, or geometric compactness. Consequently, alternative Pareto-optimal solutions may be preferred depending on project-specific priorities and decision-making contexts.
From a methodological standpoint, the correlation and regression analyses further contribute by revealing latent structural relationships among objectives. The consistency between Pearson and Spearman correlations confirms that observed dependencies are robust to linearity assumptions, while the surrogate regression equations provide interpretable approximations of Pareto-front behavior. These analytical results extend the contribution of the proposed framework beyond optimization by offering explainable insights into how regulatory constraints shape feasible and efficient design spaces.
It should be noted that the present study focuses on validating the proposed framework rather than conducting a comprehensive benchmarking study of multi-objective optimization algorithms. Accordingly, NSGA-II was adopted as a representative and well-established evolutionary optimization method, allowing the investigation to concentrate on regulation-aware design generation and decision-support capabilities.
Although the proposed framework demonstrated promising performance within the selected condominium case study, broader validation across multiple residential development scenarios remains necessary to establish external validity. Future investigations should evaluate the framework under diverse site conditions, regulatory contexts, and development typologies to further assess its robustness, scalability, and generalizability.
The profit objective employed in the regulation-aware design framework should be interpreted as a deterministic economic-performance indicator intended for comparative evaluation of design alternatives during the preliminary design stage. While this formulation is appropriate for framework validation and early-stage decision support, it does not represent a complete financial investment model incorporating market uncertainty, financing structure, sales absorption behavior, discount rates, or operational performance throughout the project life cycle.
Moreover, the separation between regulatory representation and evolutionary optimization establishes a scalable computational architecture that can potentially support future ontology-driven and knowledge-graph-based regulatory modeling environments. This characteristic enhances the long-term extensibility of the proposed framework beyond the specific Bangkok case study investigated herein.
Although the computational performance observed in the present case study was satisfactory, scalability considerations become increasingly important for larger optimization problems involving additional design variables, regulatory constraints, or many-objective formulations. Consequently, systematic investigation of convergence characteristics, computational efficiency, and scalability behavior constitutes an important direction for future research.
6.2. Contributions to Construction Engineering and Management
From a construction engineering and management perspective, this study contributes in three principal dimensions:
Decision support under regulatory uncertainty.
REGEN transforms early-stage residential design into a transparent, data-driven decision-support process, enabling systematic comparison of regulation-compliant alternatives before irreversible commitments are made. This capability directly addresses sources of rework, delay, and cost escalation that originate from late-stage regulatory conflicts.
Integration of geometry, regulation, and economics.
By explicitly linking geometric configuration to regulatory capacity and economic outcomes, the framework bridges architectural design reasoning with construction and development decision-making. The optimization outputs are therefore interpretable and actionable for construction managers, developers, and multidisciplinary teams.
Mathematically grounded trade-off exploration.
The use of NSGA-II, combined with utopia-distance-based selection, provides a rigorous mechanism for navigating competing objectives without collapsing them into arbitrary weighted sums. This supports reproducible and auditable decision-making, which is essential in professional and regulatory contexts.
6.3. Practical Recommendations and Future Applications
For professional practice, REGEN can be directly implemented within standard Dynamo–Revit environments, allowing architects, engineers, and developers to rapidly generate and evaluate hundreds of regulation-compliant design alternatives at the feasibility stage. The framework is particularly suited for dense urban contexts where FAR, height, and access-road constraints strongly interact and where early misjudgments have disproportionate downstream impacts.
Municipal authorities and permitting agencies may also adopt the REGEN logic as a foundation for automated pre-screening of development proposals, improving consistency and reducing administrative burden. The algebraic formulation of regulations provides a transparent and auditable basis for such applications.
Although REGEN demonstrates the feasibility of embedding planning regulations within generative optimization workflows, the current implementation should be interpreted as an early-stage feasibility assessment and decision-support tool rather than a comprehensive permitting system. The present framework explicitly incorporates selected feasibility-related planning and building-control regulations, including floor-area ratio (FAR), open-space ratio (OSR), building-height limitations, setback requirements, parking provisions, and green-area requirements. However, additional regulatory domains commonly required during formal permitting processes—such as structural safety codes, fire-protection regulations, accessibility standards, environmental approvals, utility coordination requirements, and jurisdiction-specific administrative procedures—remain beyond the scope of the current implementation. Future extensions of REGEN should therefore expand the regulatory representation to support more comprehensive permit-readiness evaluation.
Future research should extend the framework by incorporating additional objectives relevant to construction management, including construction duration, carbon emissions, life-cycle cost, and uncertainty-aware economic-performance measures. Potential developments include Monte Carlo simulation, stochastic programming, interval optimization, and scenario-based market analysis to account for uncertainty in selling prices, construction costs, financing conditions, discount rates, and sales absorption rates. In addition, future versions of REGEN may integrate discounted cash-flow analysis, Net Present Value (NPV), Internal Rate of Return (IRR), Value at Risk (VaR), Conditional Value at Risk (CVaR), and life-cycle cost assessment as additional optimization objectives. Such enhancements would enable simultaneous evaluation of expected financial return and financial risk, thereby providing more comprehensive support for real-estate development decision-making under uncertainty.
Further research could examine the sensitivity of optimization outcomes to economic assumptions, including selling price, construction cost, design fee, financing conditions, and market-demand characteristics. Sensitivity analysis techniques, scenario-based evaluation, Monte Carlo simulation, and stochastic optimization approaches would provide a more comprehensive understanding of the robustness of Pareto-optimal solutions under uncertain economic environments.
Another important research direction concerns the development of preference-aware decision-support mechanisms for navigating Pareto-optimal solution sets. Although the current framework employs a closest-to-utopia strategy to identify a representative compromise solution, future versions of REGEN may integrate reference-point-based evolutionary optimization approaches such as R-NSGA-II, allowing decision-makers to explicitly specify preferred objective regions during the optimization process. Interactive visualization tools may further enhance stakeholder engagement and decision transparency. Potential approaches include parallel-coordinate plots, trade-off matrices, dashboard interfaces, and real-time preference adjustment mechanisms. Such developments would transform REGEN from a static optimization framework into an interactive decision-support platform capable of adapting recommendations according to evolving project priorities.
Another important direction for future research concerns comparative evaluation of alternative multi-objective optimization algorithms within the REGEN framework. Although NSGA-II was adopted in the present study because of its maturity and widespread use in engineering optimization, future studies may explore its performance against alternative approaches, such as MOPSO, SMPSO, MOEA/D, and NSGA-III. Comparative benchmarking using hypervolume, generational distance, inverted generational distance, spacing metrics, and statistical significance tests such as the Wilcoxon signed-rank test would provide deeper insight into algorithmic efficiency, convergence behavior, and solution diversity under regulation-aware design environments.
Another important research direction concerns computational scalability and real-time decision support. While direct evaluation through the Dynamo-based analytical engine was computationally feasible for the current problem size, future large-scale applications may benefit from surrogate-assisted optimization techniques. Potential approaches include Kriging models, Gaussian-process regression, response-surface methodologies, machine learning surrogates, and neural-network-based predictors capable of approximating objective-function evaluations with substantially lower computational cost. Subsequent work may consider population-size sensitivity, convergence-performance trade-offs, and many-objective optimization environments involving a larger number of competing objectives than those considered in the present study.
Another important research direction concerns the development of a regulatory abstraction layer for cross-regional deployment. In the current implementation, regulations are represented through parameterized algebraic formulations derived from Bangkok planning regulations. Future studies may extend this concept by incorporating ontology-based regulation modeling and knowledge graphs. Machine-readable rule repositories could allow local regulations to be defined through external configuration files rather than embedded equations. Such a development would enable REGEN to operate as a jurisdiction-independent regulation-aware design platform applicable across different cities and countries while preserving transparency and auditability of regulatory reasoning.
In summary, the findings of this study suggest that regulation-aware multi-objective optimization represents a promising approach for supporting early-stage residential building design. The proposed framework provides a practical and mathematically rigorous mechanism for exploring regulation-compliant design alternatives and facilitating decision-making in complex urban environments.