Article

FarmMap-Integrated Spatial Prioritization for Circular and Ecological Sphere-Oriented Rural Sustainability Planning: A GIS Case Study of Yangpyeong-gun, Korea

Environmental Planning Institute, Seoul National University, 1 Gwanak-ro, Gwanak-gu, Seoul 08826, Republic of Korea
Sustainability 2026, 18(12), 6147; https://doi.org/10.3390/su18126147
Submission received: 17 May 2026 / Revised: 8 June 2026 / Accepted: 12 June 2026 / Published: 15 June 2026
(This article belongs to the Collection Sustainability in Agricultural Systems and Ecosystem Services)

Abstract

Rural sustainability planning requires spatially explicit methods that integrate agricultural resource bases, ecological condition, low-carbon feasibility, community implementation support, and cultural landscape values. Although the Circular and Ecological Sphere (CES) concept offers an integrative framework for rural transition, empirical CES studies remain largely qualitative or policy-oriented. This study develops a FarmMap-integrated Python-GIS workflow for proxy-based CES-oriented spatial prioritization in Yangpyeong-gun, a peri-rural county on the eastern fringe of the Seoul metropolitan region in Korea. Public spatial and administrative datasets were integrated into thirteen indicators grouped under five CES-relevant axes. The model does not measure realized circular material flows, governance quality, resident participation, or carbon emission reduction directly; instead, it identifies where CES-relevant spatial potentials co-occur. An axis-balanced entropy model assigned equal total weight to each axis while applying entropy weighting within axes. Robustness was tested through equal-weight, axis-emphasis, raw entropy diagnostic, Monte Carlo perturbation, and spatial-scale sensitivity analyses using 100 m diagnostic, 500 m, and eup/myeon supports. The final 250 m priority surface identified the top fifth of analyzed Yangpyeong-gun area as very-high relative priority and remained stable across weighting and spatial-support diagnostics. Rural-experience villages and village enterprises had significantly higher CES scores than random background locations. The results demonstrate a reproducible first-stage spatial screening workflow for CES-oriented rural planning while clarifying the limits of proxy-based circularity, governance, and low-carbon indicators.

1. Introduction

1.1. Rural Sustainability and the CES Perspective

Rural sustainability problems increasingly exceed the scope of sectoral agricultural policy. In East Asian rural regions, demographic aging, farm-household restructuring, land underuse, ecological fragmentation, and local-service decline interact spatially rather than independently. Korean demographic and rural-policy statistics document population aging and rural service-transition pressures [1,2]. National territorial and rural-policy studies further emphasize idle or underused land and the need for integrated rural-space management [3,4]. Agricultural resource-recycling research also shows why rural sustainability requires us to pay attention to the agro-residue and land resource systems rather than to agriculture alone [5]. These conditions require decision support methods that can show where agricultural resources, ecological functions, community infrastructure, low-carbon feasibility, and cultural landscape values coincide.
The Circular and Ecological Sphere (CES), also termed the Regional Circular and Ecological Sphere (R-CES), was advanced in Japan as a territorial sustainability concept linking resource circulation, ecological restoration, decentralization, and local self-reliance [6,7]. The broader Satoyama literature and R-CES applications show how rural sustainability can be framed through coupled landscape management and urban–rural resource flows [8,9]. The Satoyama-Satoumi and green-energy case materials further connect local ecological restoration with renewable energy and community learning platforms [10,11]. Regional CES reviews and circular ecological economy study the position of CES within wider debates on the integrated territorial sustainability [12,13]. Circular economy definition studies also clarify why material circularity claims should be distinguished from broader proxy-based sustainability assessment [14].
CES does not replace the Sustainable Development Goals, nature-based solutions, or ecosystem service assessment. The SDGs provide a broad normative agenda for sustainability localization [15]. Nature-based solution frameworks clarify the restoration, resilience, and climate-adaptation logics [16,17]. Cultural landscape and cultural ecosystem-service studies show that ecological benefits are often mediated by local knowledge, landscape values, and amenity use [18,19]. Public participation GIS and urban forest indicator studies further demonstrate how public use and ecological functions can be evaluated through spatial proxies while still requiring cautious interpretation [20,21]. CES adds a territorial integration lens: it asks how these goals and services can be organized as a place-based resource, ecological, cultural, and implementation-support relationships. This makes CES useful for rural spatial prioritization, but only if the concept is translated into measurable and reproducible spatial indicators.

1.2. From Qualitative CES Cases to Spatial Decision Support

Most empirical CES and R-CES studies remain qualitative, policy-oriented, or focused on inter-regional resource flows. They provide conceptual clarity and practical examples, but they rarely identify intra-municipal priority zones for implementation. Landscape ecology and connectivity theory provide a basis for interpreting spatial pattern, adjacency, and fragmentation [22,23]. Ecosystem-based planning and biomass carbon research support the inclusion of terrain, vegetation, and resource-based indicators in rural sustainability assessment [24,25]. Restoration opportunity and ecological assessment studies show how spatial indicators can be used to identify priority areas while avoiding claims of direct ecological performance [26,27]. In parallel, rural settlement and crop suitability studies demonstrate the value of GIS-MCDA for spatial decision support [28,29]. Recent AHP-sensitivity and Python-GIS MCDM studies show the importance of transparent weighting and reproducible geoprocessing [30,31]. Agricultural land suitability and green infrastructure studies provide additional benchmarks for land resource and multi-source spatial modeling [32,33]. Renewable energy zoning and spatial MCDA reviews further emphasize that suitability maps require explicit criteria, uncertainty checks, and policy interpretation [34,35]. Spatial uncertainty analysis and AHP theory support the use of robustness testing rather than reliance on a single untested weight vector [36,37]. However, these studies are usually organized around sectoral suitability—settlement, crop, renewable energy, or infrastructure—rather than a CES-specific synthesis of agricultural resource-based potential, ecological condition, low-carbon feasibility, community implementation support, and cultural landscape.
This study addresses this gap by translating CES into a proxy-based spatial decision support workflow for Yangpyeong-gun, Korea. The study does not claim to measure the realized circular material flows, social acceptance, governance quality, or carbon emission reduction directly. Instead, it develops a transparent screening model that identifies where mapped agricultural resource bases, ecological conditions, community-related implementation assets, low-carbon feasibility proxies, and cultural landscape values spatially align. This distinction is essential because public spatial data can support first-stage prioritization, but they cannot replace field verification, participatory planning, or material flow accounting.

1.3. Objectives and Contribution

The objectives are to: (1) translate a five-axis CES framework into empirically measurable and explicitly proxy-based spatial indicators for Yangpyeong-gun; (2) integrate FarmMap, Sentinel-2, DEM, hydrological, road, point-resource, and administrative datasets in a Python-GIS environment; (3) construct a FarmMap-integrated axis-balanced entropy model that preserves conceptual parity across CES-relevant axes while allowing within-axis data-driven differentiation; (4) test robustness through alternative weighting scenarios, Monte Carlo perturbation, and spatial-scale sensitivity diagnostics; and (5) validate the resulting priority surface against independent rural-experience, village-enterprise, and tourist site point sources using leave-one-source-out scoring.
The contribution is therefore methodological and empirical. Methodologically, the study offers a reproducible map-first workflow for converting a qualitative CES framework into a grid-based, proxy-based spatial prioritization. Empirically, it provides a Yangpyeong-gun case study that distinguishes peri-rural population growth from demographic aging and natural decrease, and it shows how agricultural resource maps can anchor CES-oriented spatial screening more directly than road-accessibility proxies alone.

2. Materials and Methods

2.1. Study Area

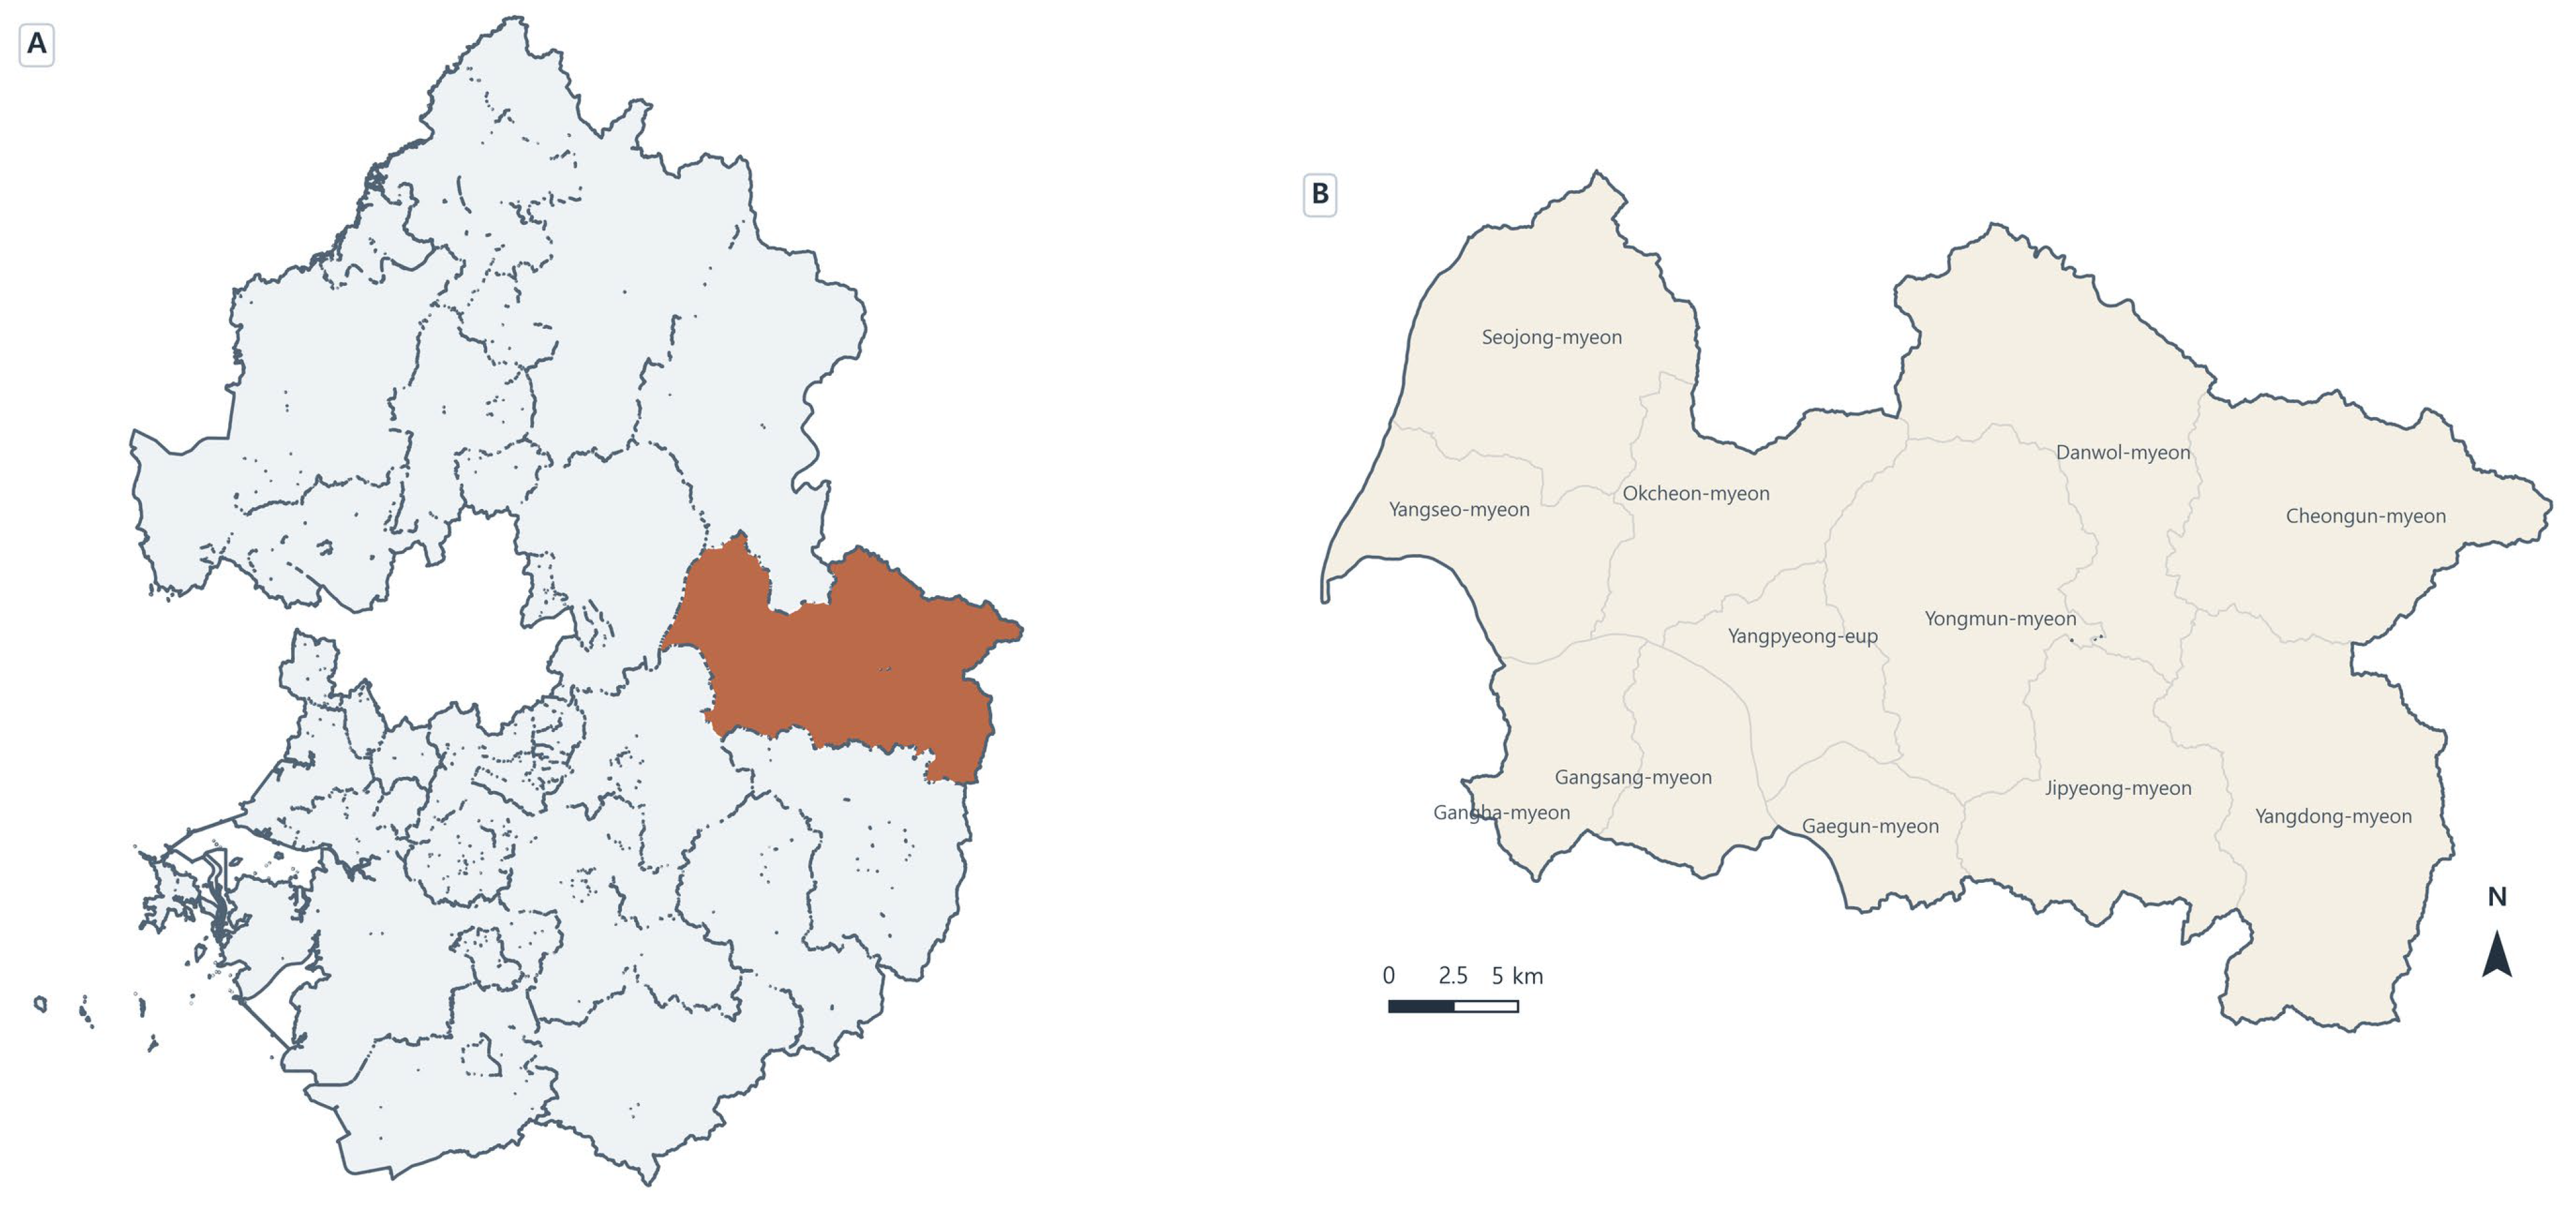
Yangpyeong-gun is located in eastern Gyeonggi-do, Korea, on the peri-rural fringe of the Seoul metropolitan region. It is not a simple depopulating rural county: registered population increased from 106,774 in 2014 to 127,421 in 2023, while the elderly ratio rose from 20.2% to 28.9%, and natural increase remained negative in recent years. This combination of metropolitan fringe growth, aging, agricultural land resources, ecological landscapes, tourism amenities, and development pressure makes Yangpyeong a suitable case for testing the CES-oriented spatial prioritization. Figure 1 shows the scope of the study area.
The county was selected because data availability is strong and thematically aligned with the original CES framework. FarmMap and Sentinel-2 products provided the agricultural land resource and vegetation condition layers used in the grid model [38,39]. NGII DEM data and VWorld spatial layers supplied the terrain, river, road, and administrative-boundary information needed for ecological and access-related indicators [40,41]. KOSIS statistics and Korea Rural Community Corporation data supported demographic context and rural experience village information [42,43]. Yangpyeong-gun local public datasets supplied tourism, village-enterprise, solar power, and rural lodging context records [44]. The analysis used a 250 m grid as the main unit, balancing intra-county spatial detail with the coarser reliability on social and institutional proxy variables.

2.2. Data Sources and Screening Procedure

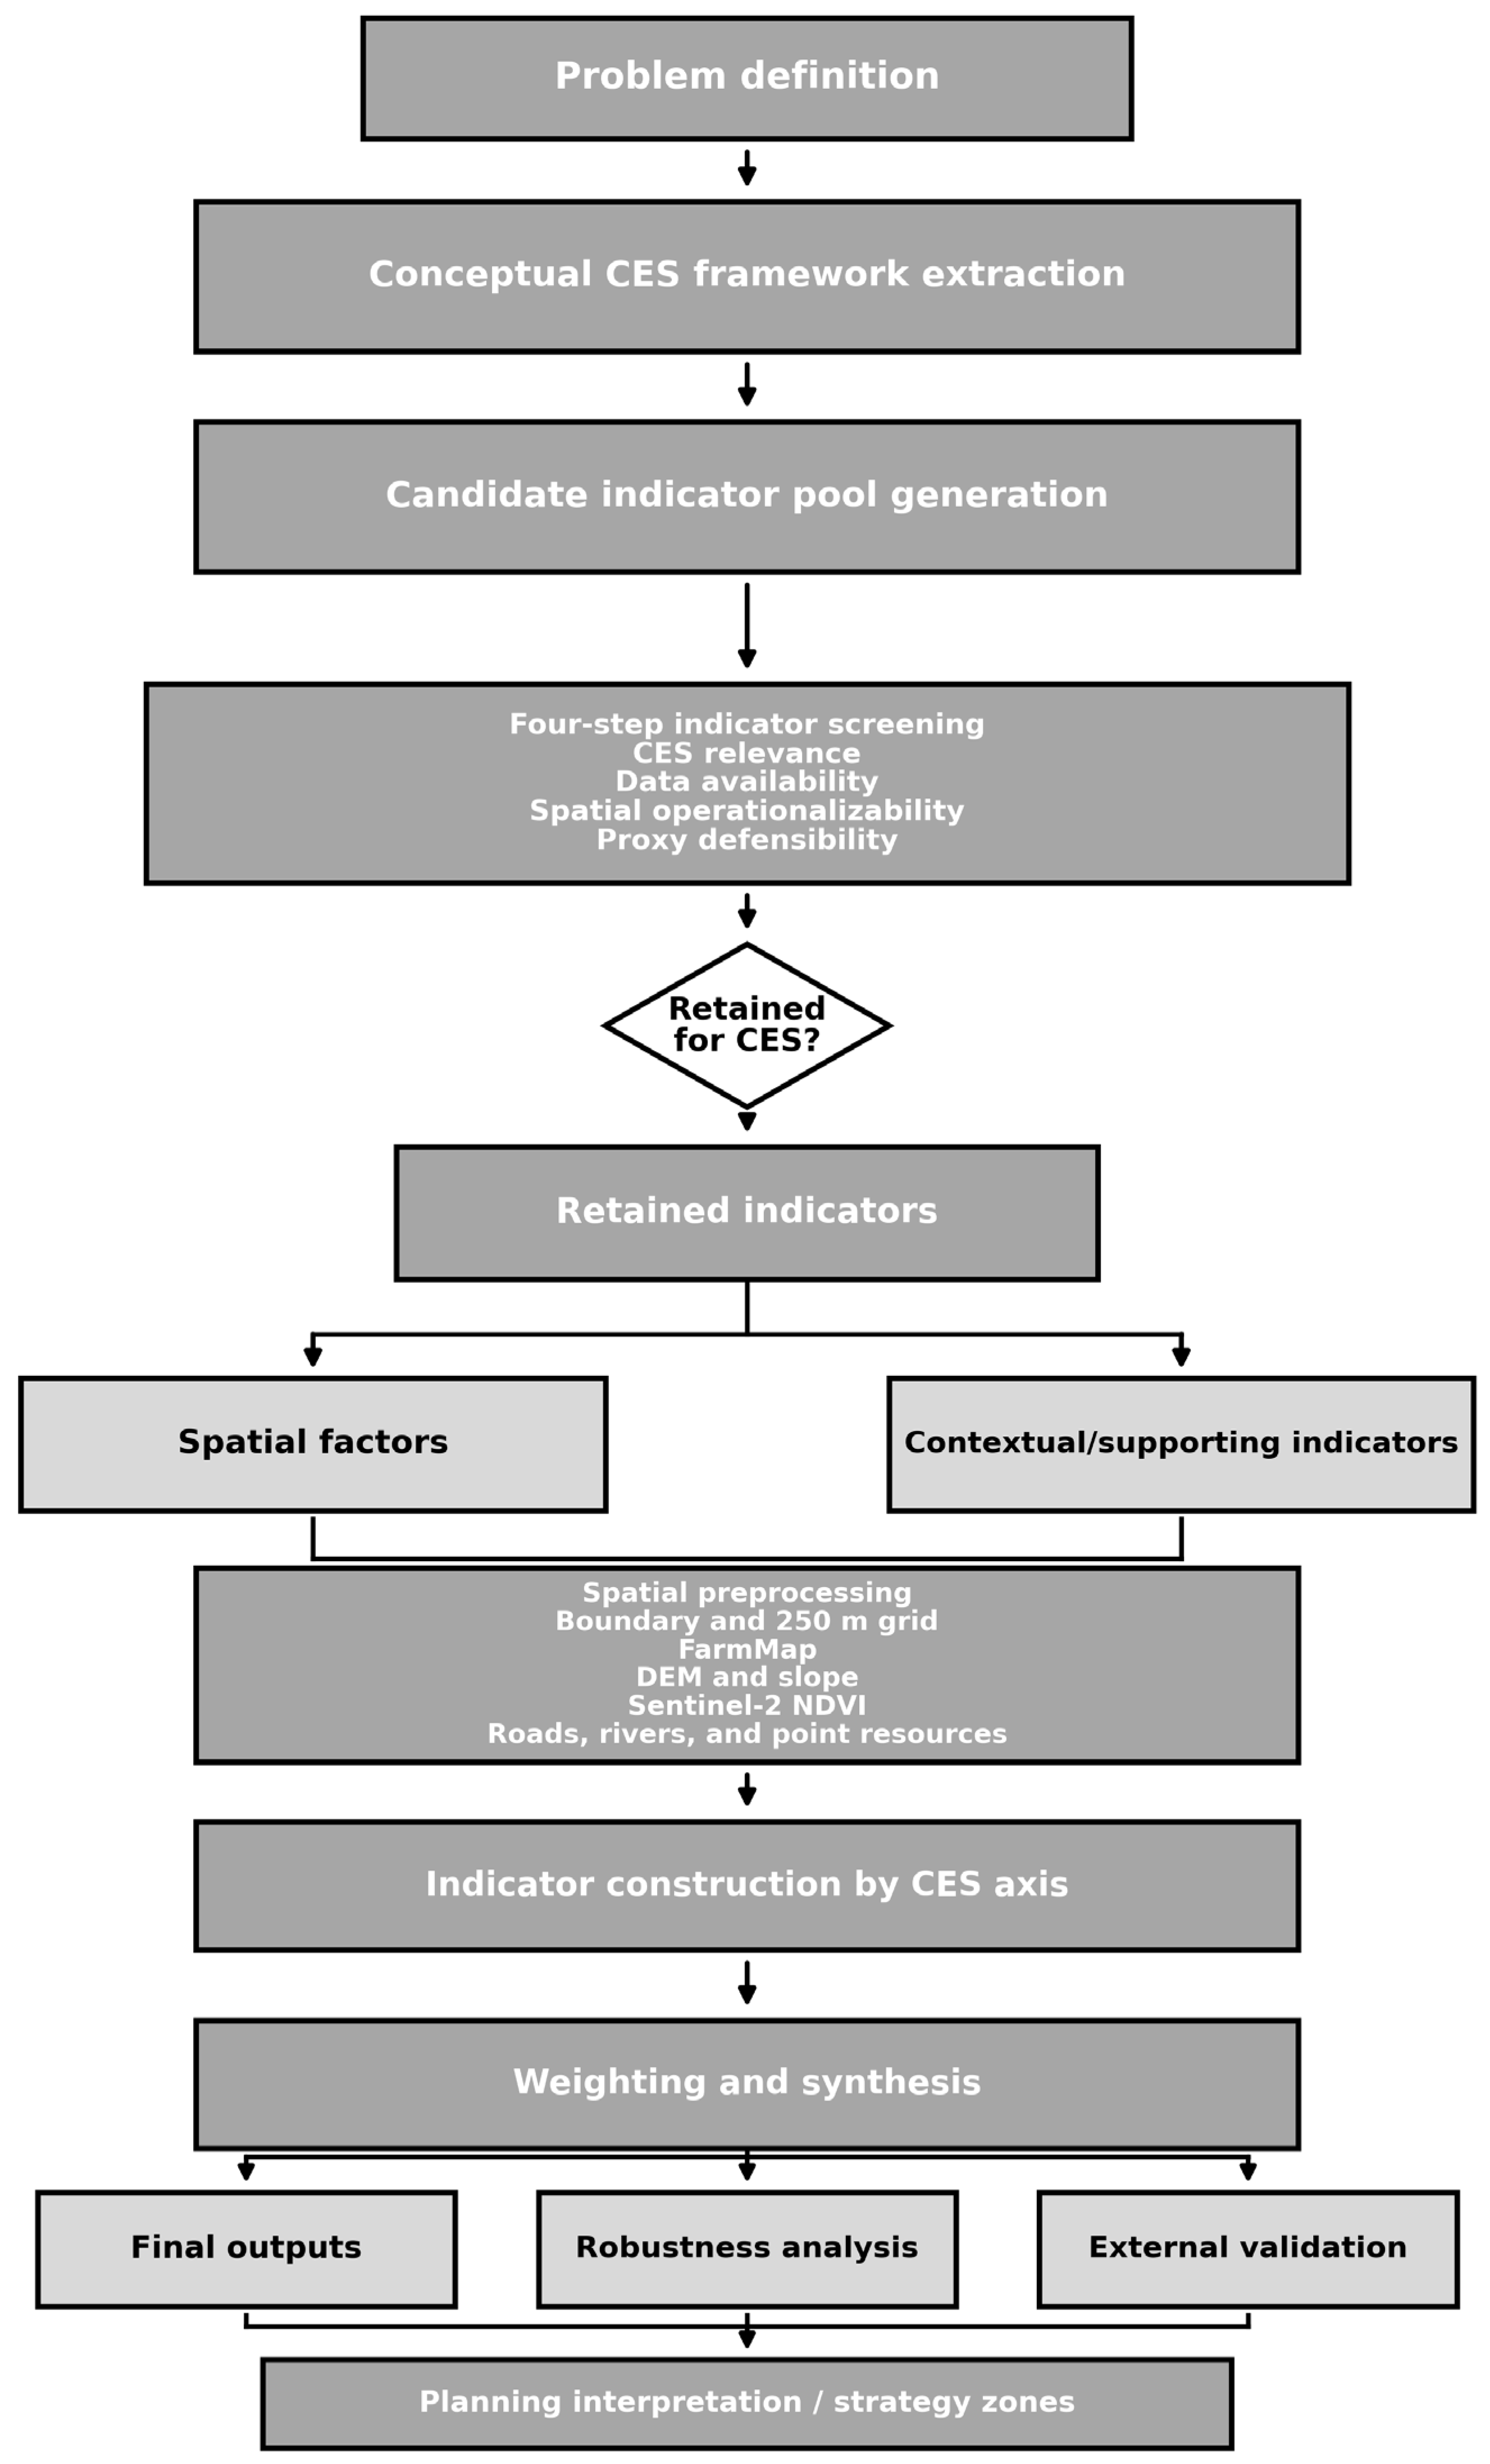
Data selection followed a four-step screening process. First, a candidate indicator pool was derived from the CES literature and from the earlier conceptual manuscript, but the empirical axes were renamed to avoid overclaiming: agricultural resource-based potential, ecological/environmental condition, low-carbon feasibility proxy, community implementation support, and cultural/landscape value. Second, indicators were retained only if they had a clear CES-oriented interpretation. Third, each candidate was checked against public data availability for Yangpyeong-gun. Fourth, indicators were retained only if they could be spatialized at a grid or eup/myeon scale without unverifiable assumptions. The overall sequence from problem definition and CES framework extraction to indicator screening, preprocessing, synthesis, validation, and planning interpretation is summarized in Figure 2.
This screening deliberately excluded indicators that would require surveys or specialized field measurements, including resident willingness, trust, governance quality, species richness, protected species habitat, soil organic carbon, and biomass-flow quantities. These remain important for future CES research, but the present study was designed as a reproducible public-data workflow. Table 1 summarizes the datasets used in the main analysis; the full source-theme counts and scene-level metadata are provided in Tables S1 and S2.

2.3. Spatial Preprocessing and Indicator Construction

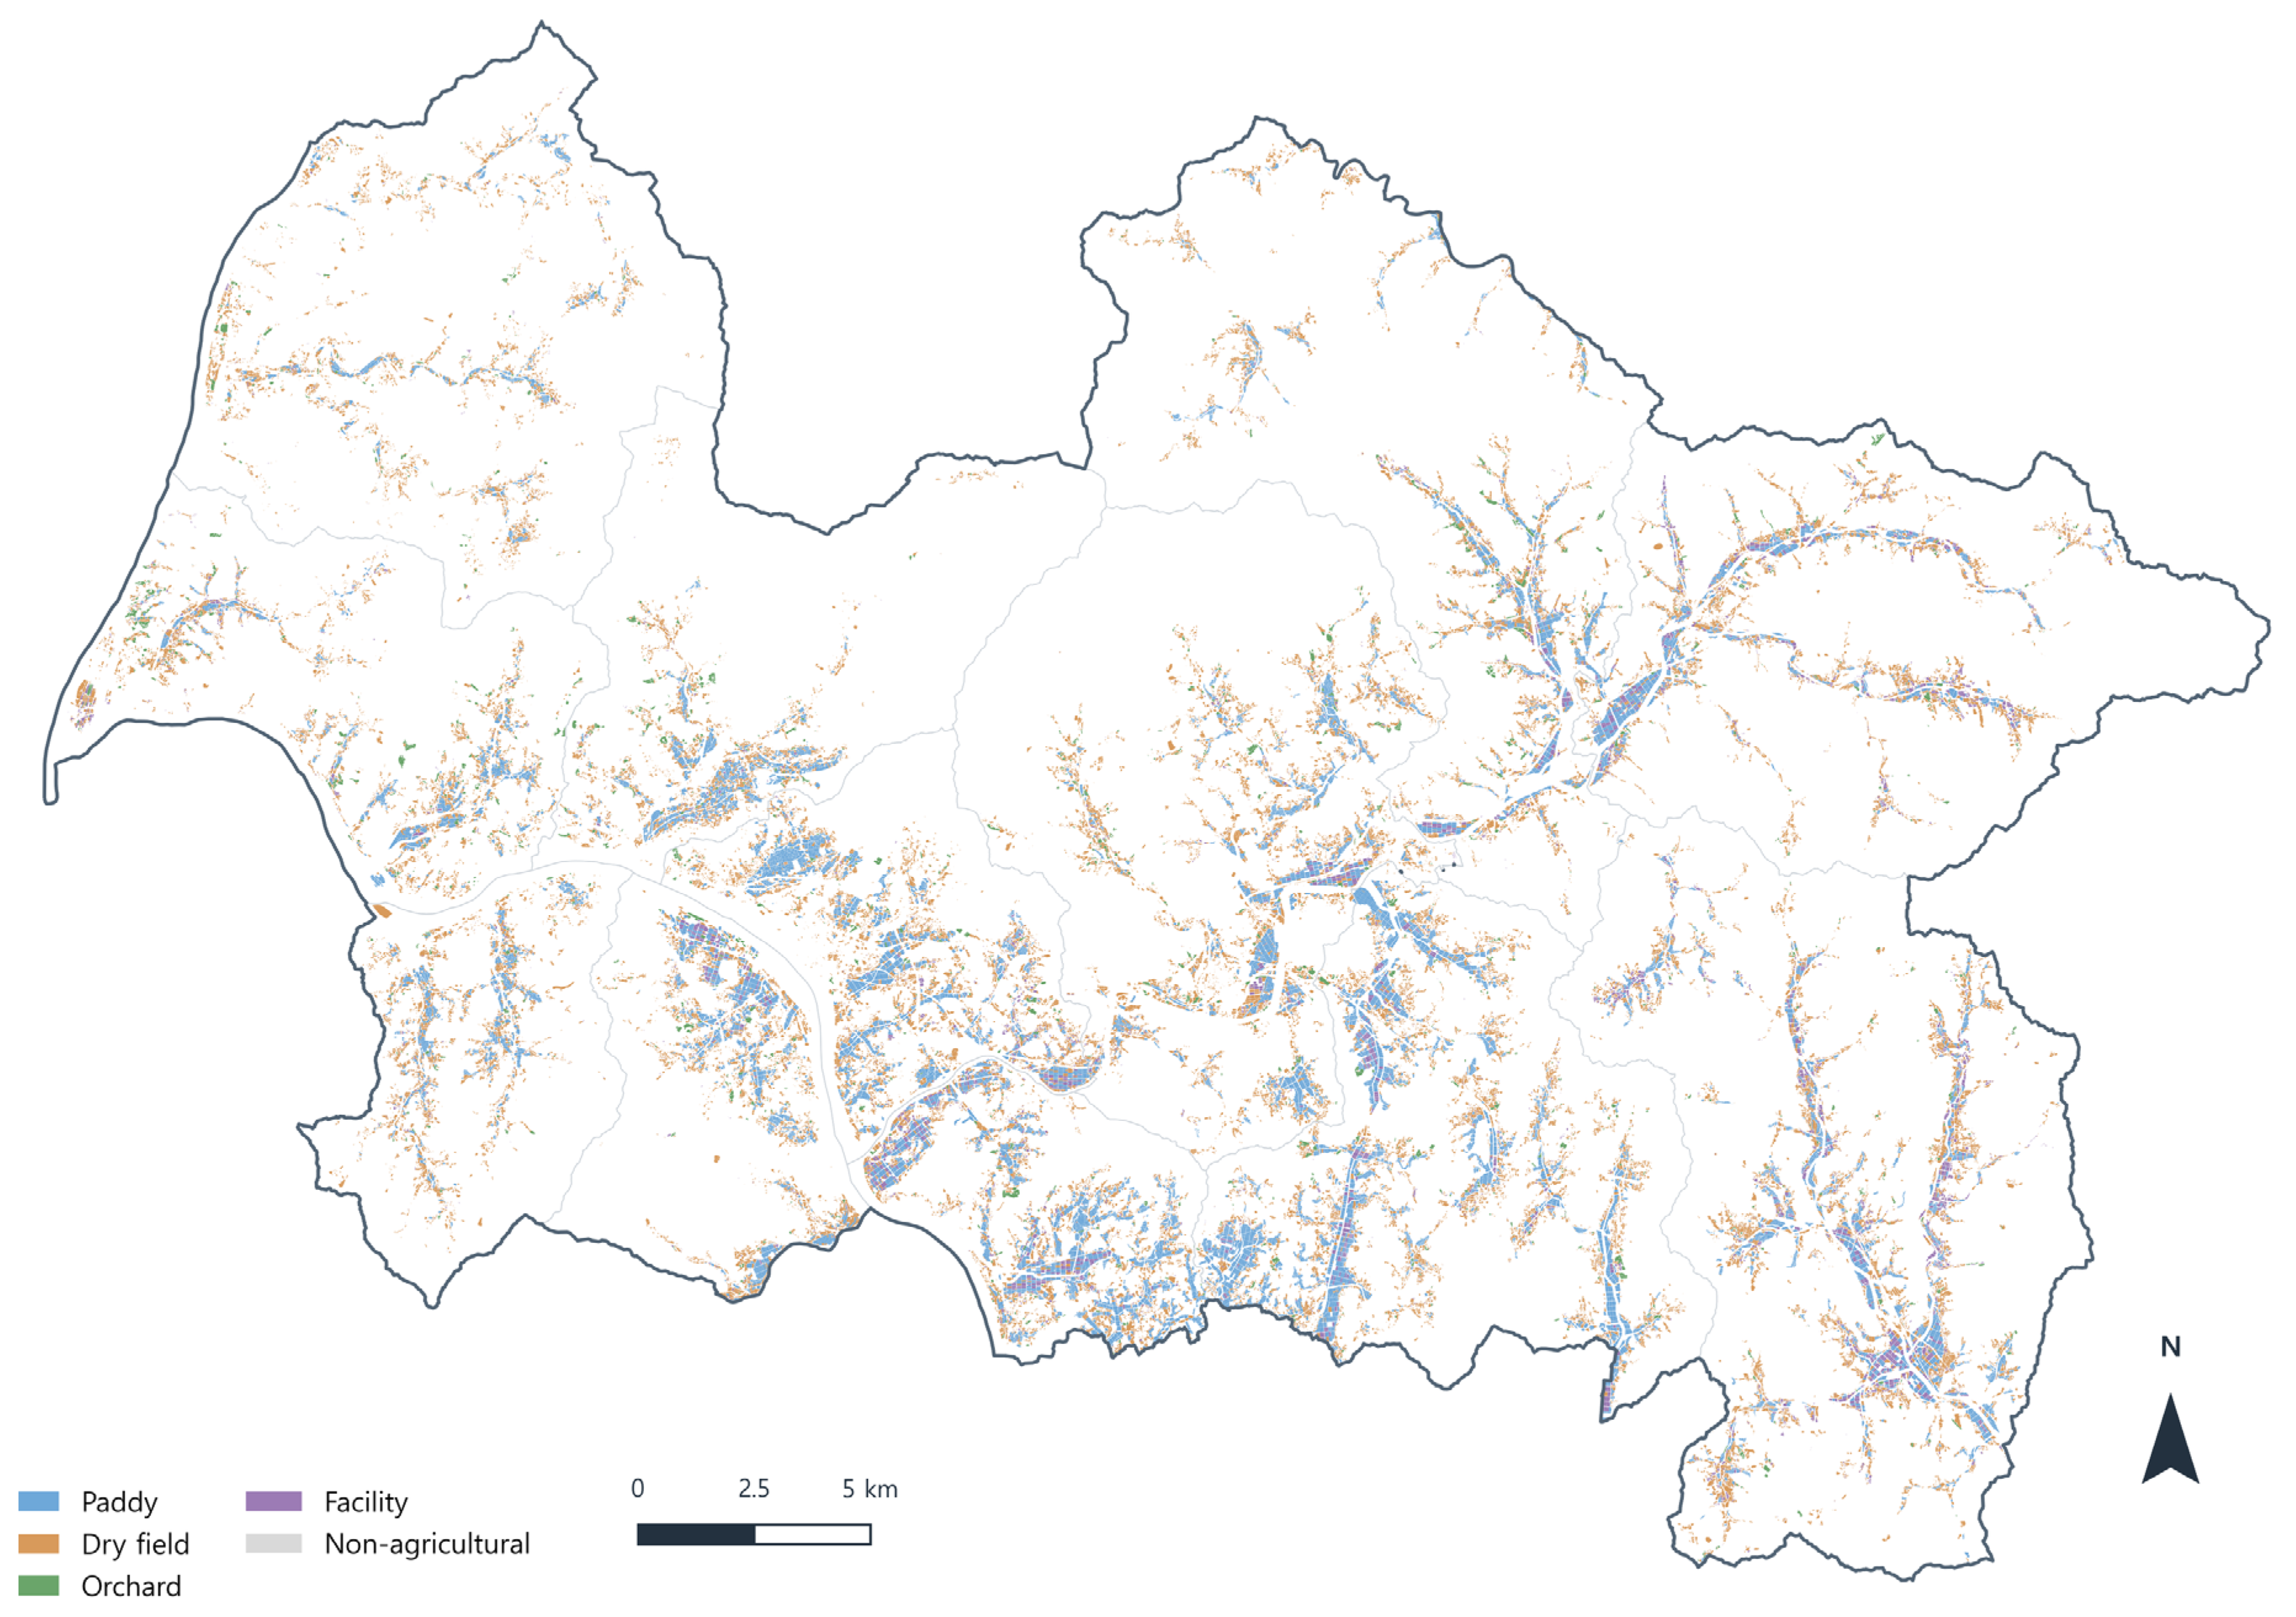
All spatial layers were reprojected to a common Korean projected coordinate system and clipped to the Yangpyeong-gun boundary. FarmMap polygons were overlaid with the 250 m grid using area-weighted intersection to calculate agricultural resource-based indicators. Farmland share was calculated as F_i = A_(i,farmland)/A_(i,cell). Road support access was calculated from the nearest road distance d_(i,road) using reverse min-max normalization, R_i = (max(d_road) − d_(i,road))/(max(d_road) − min(d_road)). Farmland support accessibility was then calculated as FAS_i = F_i × R_i, so the cells were scored highly only when the mapped farmland base and road support access coincided. The agricultural diversity indicator followed Shannon’s diversity formulation [45], H_norm = −Σ(p_c ln p_c)/ln(C), where p_c is the within-cell share of farmland class c, C is the number of included farmland classes, and 0 ln 0 is defined as 0. The diversity term used normalized Shannon diversity across mapped paddy, dry-field, and orchard shares. Because only three main farmland classes entered this term, its theoretical maximum is limited; it was therefore interpreted as a local land-use mix proxy rather than a comprehensive agricultural diversification measure. The resulting FarmMap land-resource classes used to construct the agricultural resource-base indicators are mapped in Figure 3.
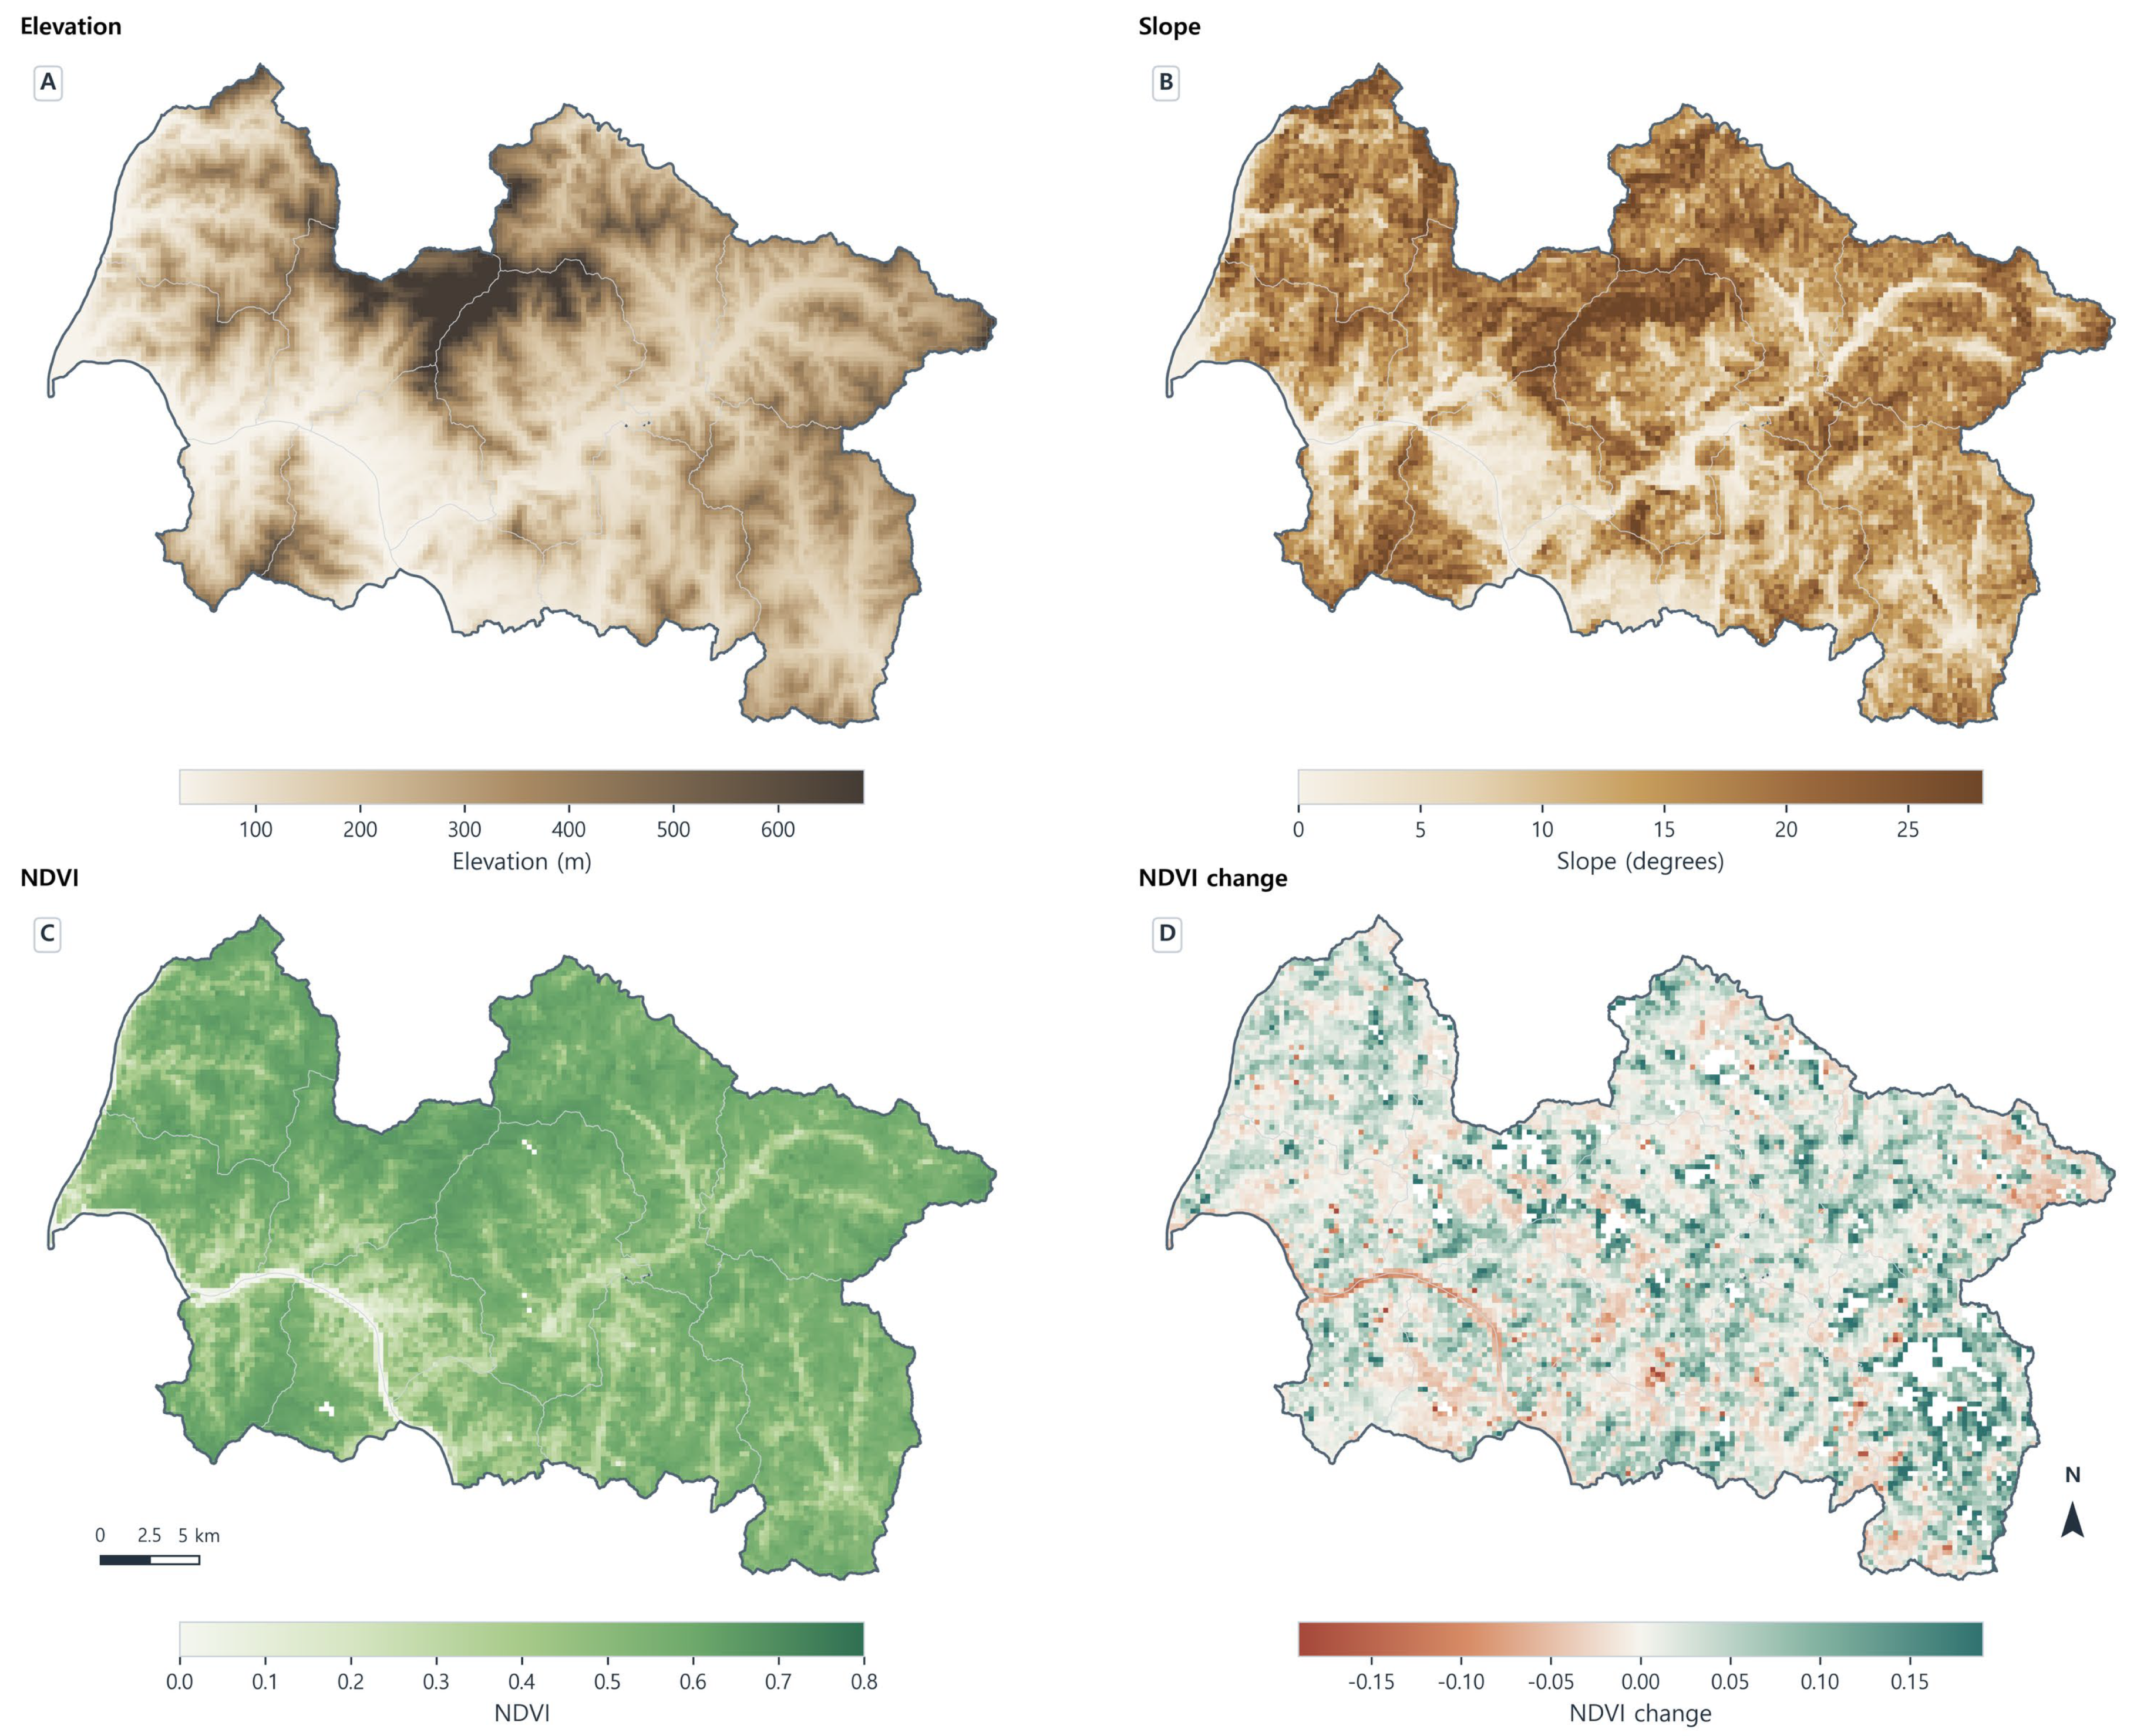
Sentinel-2 Level-2A scenes from 2021 to 2025 were processed using the 10 m red and near-infrared bands. NDVI was calculated as NDVI = (NIR − Red)/(NIR + Red), using B08 as NIR and B04 as Red. Scene Classification Layer masks were used where available to exclude no-data, cloud, cloud shadow, cirrus, and snow classes. Usable scenes included 22 May 2021, 17 May and 1 June 2022, 16 June 2023, 16 May, 31 May, and 10 June 2024, and 22 June 2025; the 5 June 2025 T52SDG scene was excluded because it did not spatially overlap with the Yangpyeong boundary. The usable scene counts were 1 in 2021, 2 in 2022, 1 in 2023, 3 in 2024, and 1 in 2025, with scene-level valid pixel coverages ranging from 34.6% to 54.6%. Because these scenes were sparse and concentrated in May–June, the outputs are described as limited growing-season NDVI snapshots/composites rather than full annual vegetation composites. The NDVI change indicator was calculated as ΔNDVI_i = NDVI_i,2025 − NDVI_i,2021 using the latest and earliest usable growing-season surfaces, while the NDVI trend indicator was calculated as the ordinary least-squares slope of annual NDVI values from 2021 to 2025. Both indicators were treated as relative vegetation-condition proxies and not as direct biodiversity, ecological recovery, or carbon sequestration measures. Raster-derived no-data cells were handled with neutral 0.5 imputation after normalization, preventing missing coverage from being interpreted as the lowest suitability. A zero-fill diagnostic yielded high rank consistency with the neutral approach (Spearman rho = 0.986; top 20% overlap = 0.970). The corresponding terrain and remote-sensing surfaces used for the ecological and low-carbon feasibility axes are shown in Figure 4.
For reproducibility, all indicators were normalized to a 0–1 scale before weighting. Beneficial indicators used x′_ij = (x_ij − min_j)/(max_j − min_j), whereas cost, distance, or constraint indicators used x′_ij = (max_j − x_ij)/(max_j − min_j). No winsorization or outlier clipping was applied; minima and maxima were calculated from retained non-missing grid cells, and zero-range indicators were assigned a neutral value of 0.5. The baseline 250 m model retained 14,524 grid cells covering 876.23 km2. Point-resource indicators, including village enterprises, rural experience villages, and tourism resources, were converted to grid-level Euclidean nearest-distance indicators from cell centroids to the closest geocoded point; no kernel density or additional distance-decay radius was used. These distance indicators were then cost-normalized so that shorter distance produced higher proximity support. River proximity used the same nearest-distance and cost-normalization logic relative to mapped river features. Table 2 shows the empirical CES indicators retained after data screening. Missing-value counts and final neutral-imputation decisions are reported in Table S12.

2.4. Axis-Balanced Entropy Synthesis

After normalization to a 0–1 scale, indicators were aggregated using an axis-balanced entropy model. The five CES-relevant axes each received an equal total weight of 0.20. Within each axis, entropy weighting was used to allocate weights among retained indicators according to information variation. This design was chosen because raw entropy across all indicators would over-weight sparse point-proximity variables and under-represent smoother ecological or terrain surfaces. Equal axis weighting is therefore used as a conceptual parity baseline rather than as a claim that all policy goals necessarily have equal local importance; the alternative weighting and Monte Carlo scenarios evaluate whether the priority surface is sensitive to this baseline assumption.
Let x_ij denote the normalized value of grid cell i for indicator j within axis k. Proportions were calculated as p_ij = x_ij/Σ_i x_ij. Entropy was computed as e_j = −(1/ln n)Σ_i p_ij ln(p_ij), with p_ij ln(p_ij) defined as 0 when p_ij = 0 to avoid logarithmic errors. The diversification coefficient was d_j = 1 − e_j, the within-axis entropy weight was w_j|k = d_j/Σ_j d_j, and the final indicator weight was W_j = 0.20 × w_j|k. The CES Priority Index for cell i was then CES_i = Σ_j W_j x_ij. Raw entropy, equal indicator weights, and equal-axis/equal-within-axis weights were retained as diagnostic comparisons rather than as the main models. The resulting axis-balanced entropy weights are reported in Table 3.

2.5. Robustness, Validation, and Strategy Typology

Robustness was tested with eight deterministic scenarios and one stochastic experiment: raw entropy diagnostic, equal indicator weights, equal axis/equal within-axis weights, five axis-emphasis scenarios, and 1000 Monte Carlo perturbations around the axis-balanced baseline. Monte Carlo weights were generated with a Dirichlet distribution centered on the baseline indicator weight vector, using a total concentration of 120 to represent moderate perturbation while preserving positive weights summing to one. Robustness was summarized using the Spearman rank correlation, top 20% overlap, and Monte Carlo top-priority membership frequency.
External validation used leave-one-source-out tests. For each validation source—rural experience villages, village enterprises, and tourist sites—the source being evaluated was excluded from the score used for validation, avoiding circular use of the same point layer as both input and validation target. Validation compared observed CES scores at point locations with random background draws and calculated enrichment in top-priority zones. Finally, eup/myeon strategy types were assigned by transparent rule-based interpretation using relative axis scores, top 20% area share, FarmMap context, and recovered non-geocoded context records.
Spatial-scale sensitivity was also evaluated. The 250 m grid was retained as the baseline because it balances FarmMap polygon detail, Sentinel-2/DEM aggregation, and the coarser reliability of social point-resource proxies. A 500 m support was produced by area-weighted aggregation of the normalized 250 m indicator surfaces followed by the same axis-balanced entropy synthesis. A 100 m layer was produced as a diagnostic resampling from the 250 m normalized indicator surfaces and is therefore interpreted as a spatial-support diagnostic rather than a full raw-data 100 m rerun. Eup/myeon aggregation used area-weighted means and top 20% area shares to test whether sub-county planning rankings remained stable.

3. Results

3.1. Administrative and Agricultural-Resource Context

Yangpyeong-gun shows a peri-rural demographic pattern. The population increased over the study period, but the ratio of elderly people rose steadily and natural increase remained negative. This supports the interpretation of Yangpyeong as a metropolitan-fringe rural county facing aging and service-transition pressures rather than simple demographic decline. The 2025 FarmMap layer identified approximately 80.89 km2 of mapped FarmMap classes in the county, of which paddy, dry field, and orchard polygons formed the main agricultural resource-based subset used in the CES-oriented spatial screening model. These patterns justify using FarmMap as an agricultural resource-based component while avoiding claims about realized circularity or biomass-flow performance. The selected demographic indicators supporting this interpretation are summarized in Table 4.

3.2. Spatial Indicator Surfaces

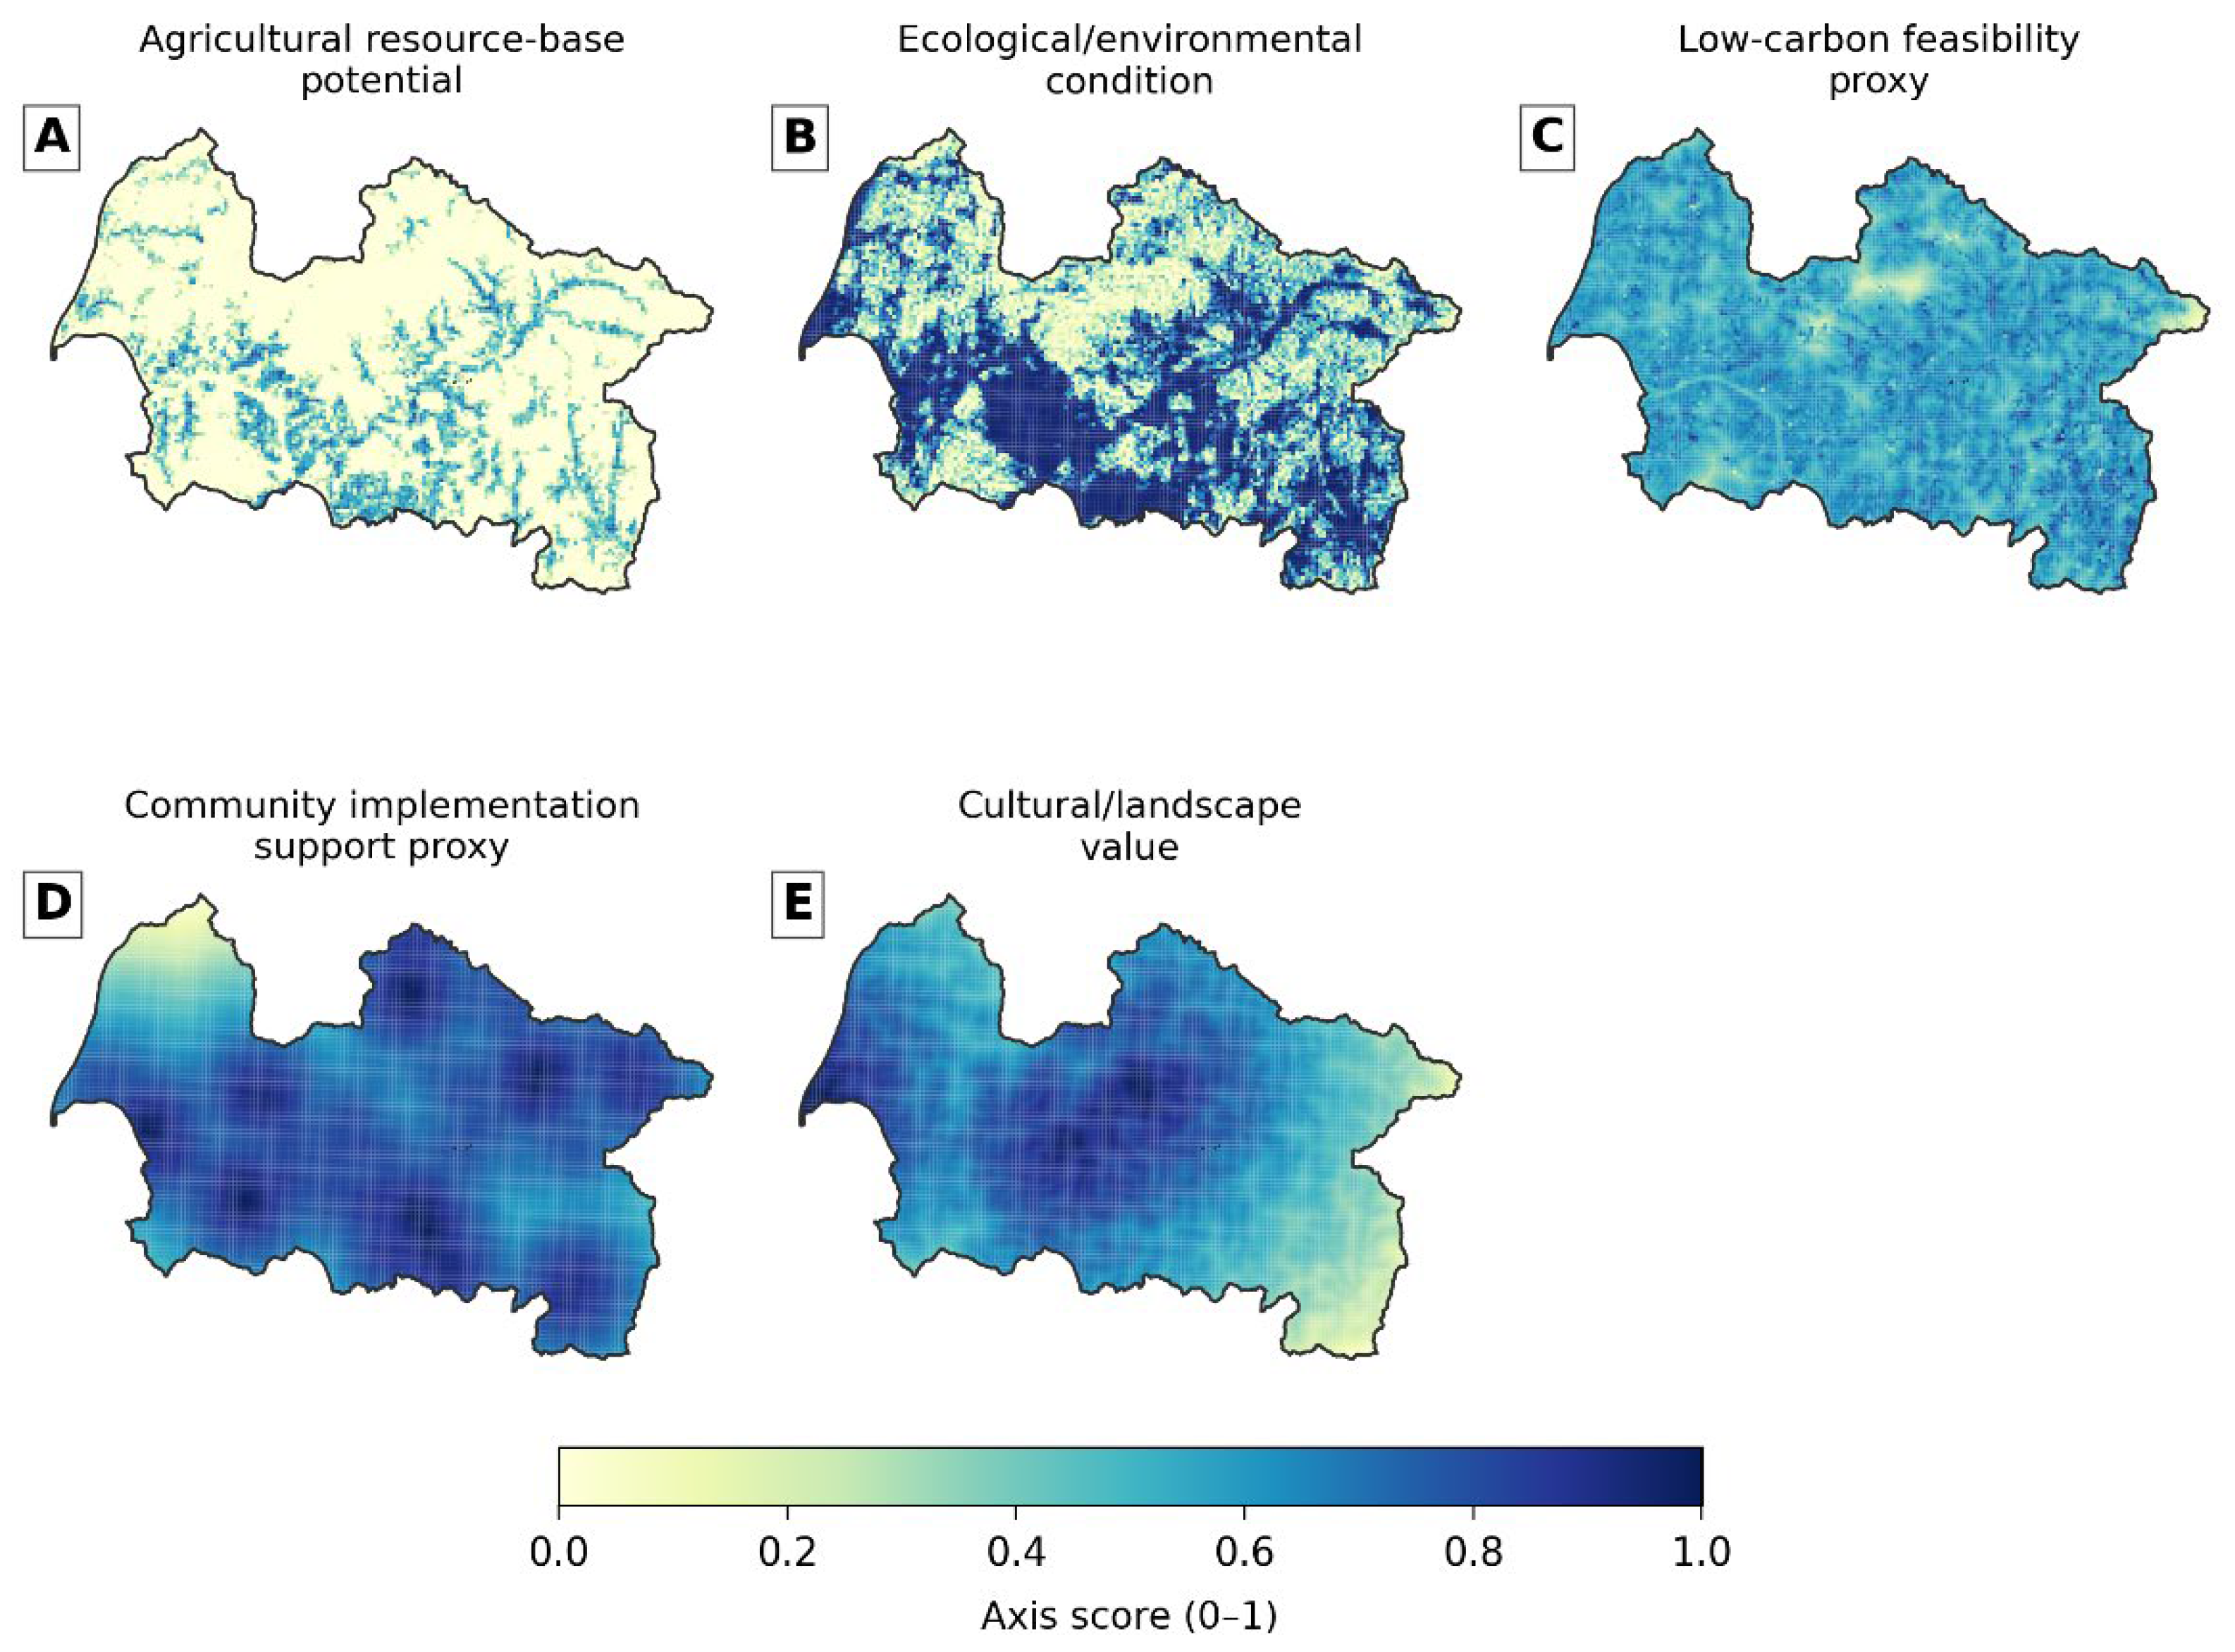
The five axis-level surfaces reveal that the CES-relevant dimensions are spatially distinct. The agricultural resource-based surface is concentrated where FarmMap farmland is denser and more accessible. The ecological/environmental surface reflects vegetation condition, river adjacency, and terrain constraints. The low-carbon feasibility surface captures vegetation-trend and terrain-access feasibility proxies, while the community implementation-support and cultural landscape surfaces reflect the distribution of village enterprises, rural experience villages, tourism resources, and river-landscape proximity. These maps are not final policy prescriptions or measured CES performance; rather, they show how each proxy dimension contributes spatially before synthesis. The resulting normalized axis-level spatial surfaces are shown in Figure 5.

3.3. Final CES Priority Surface

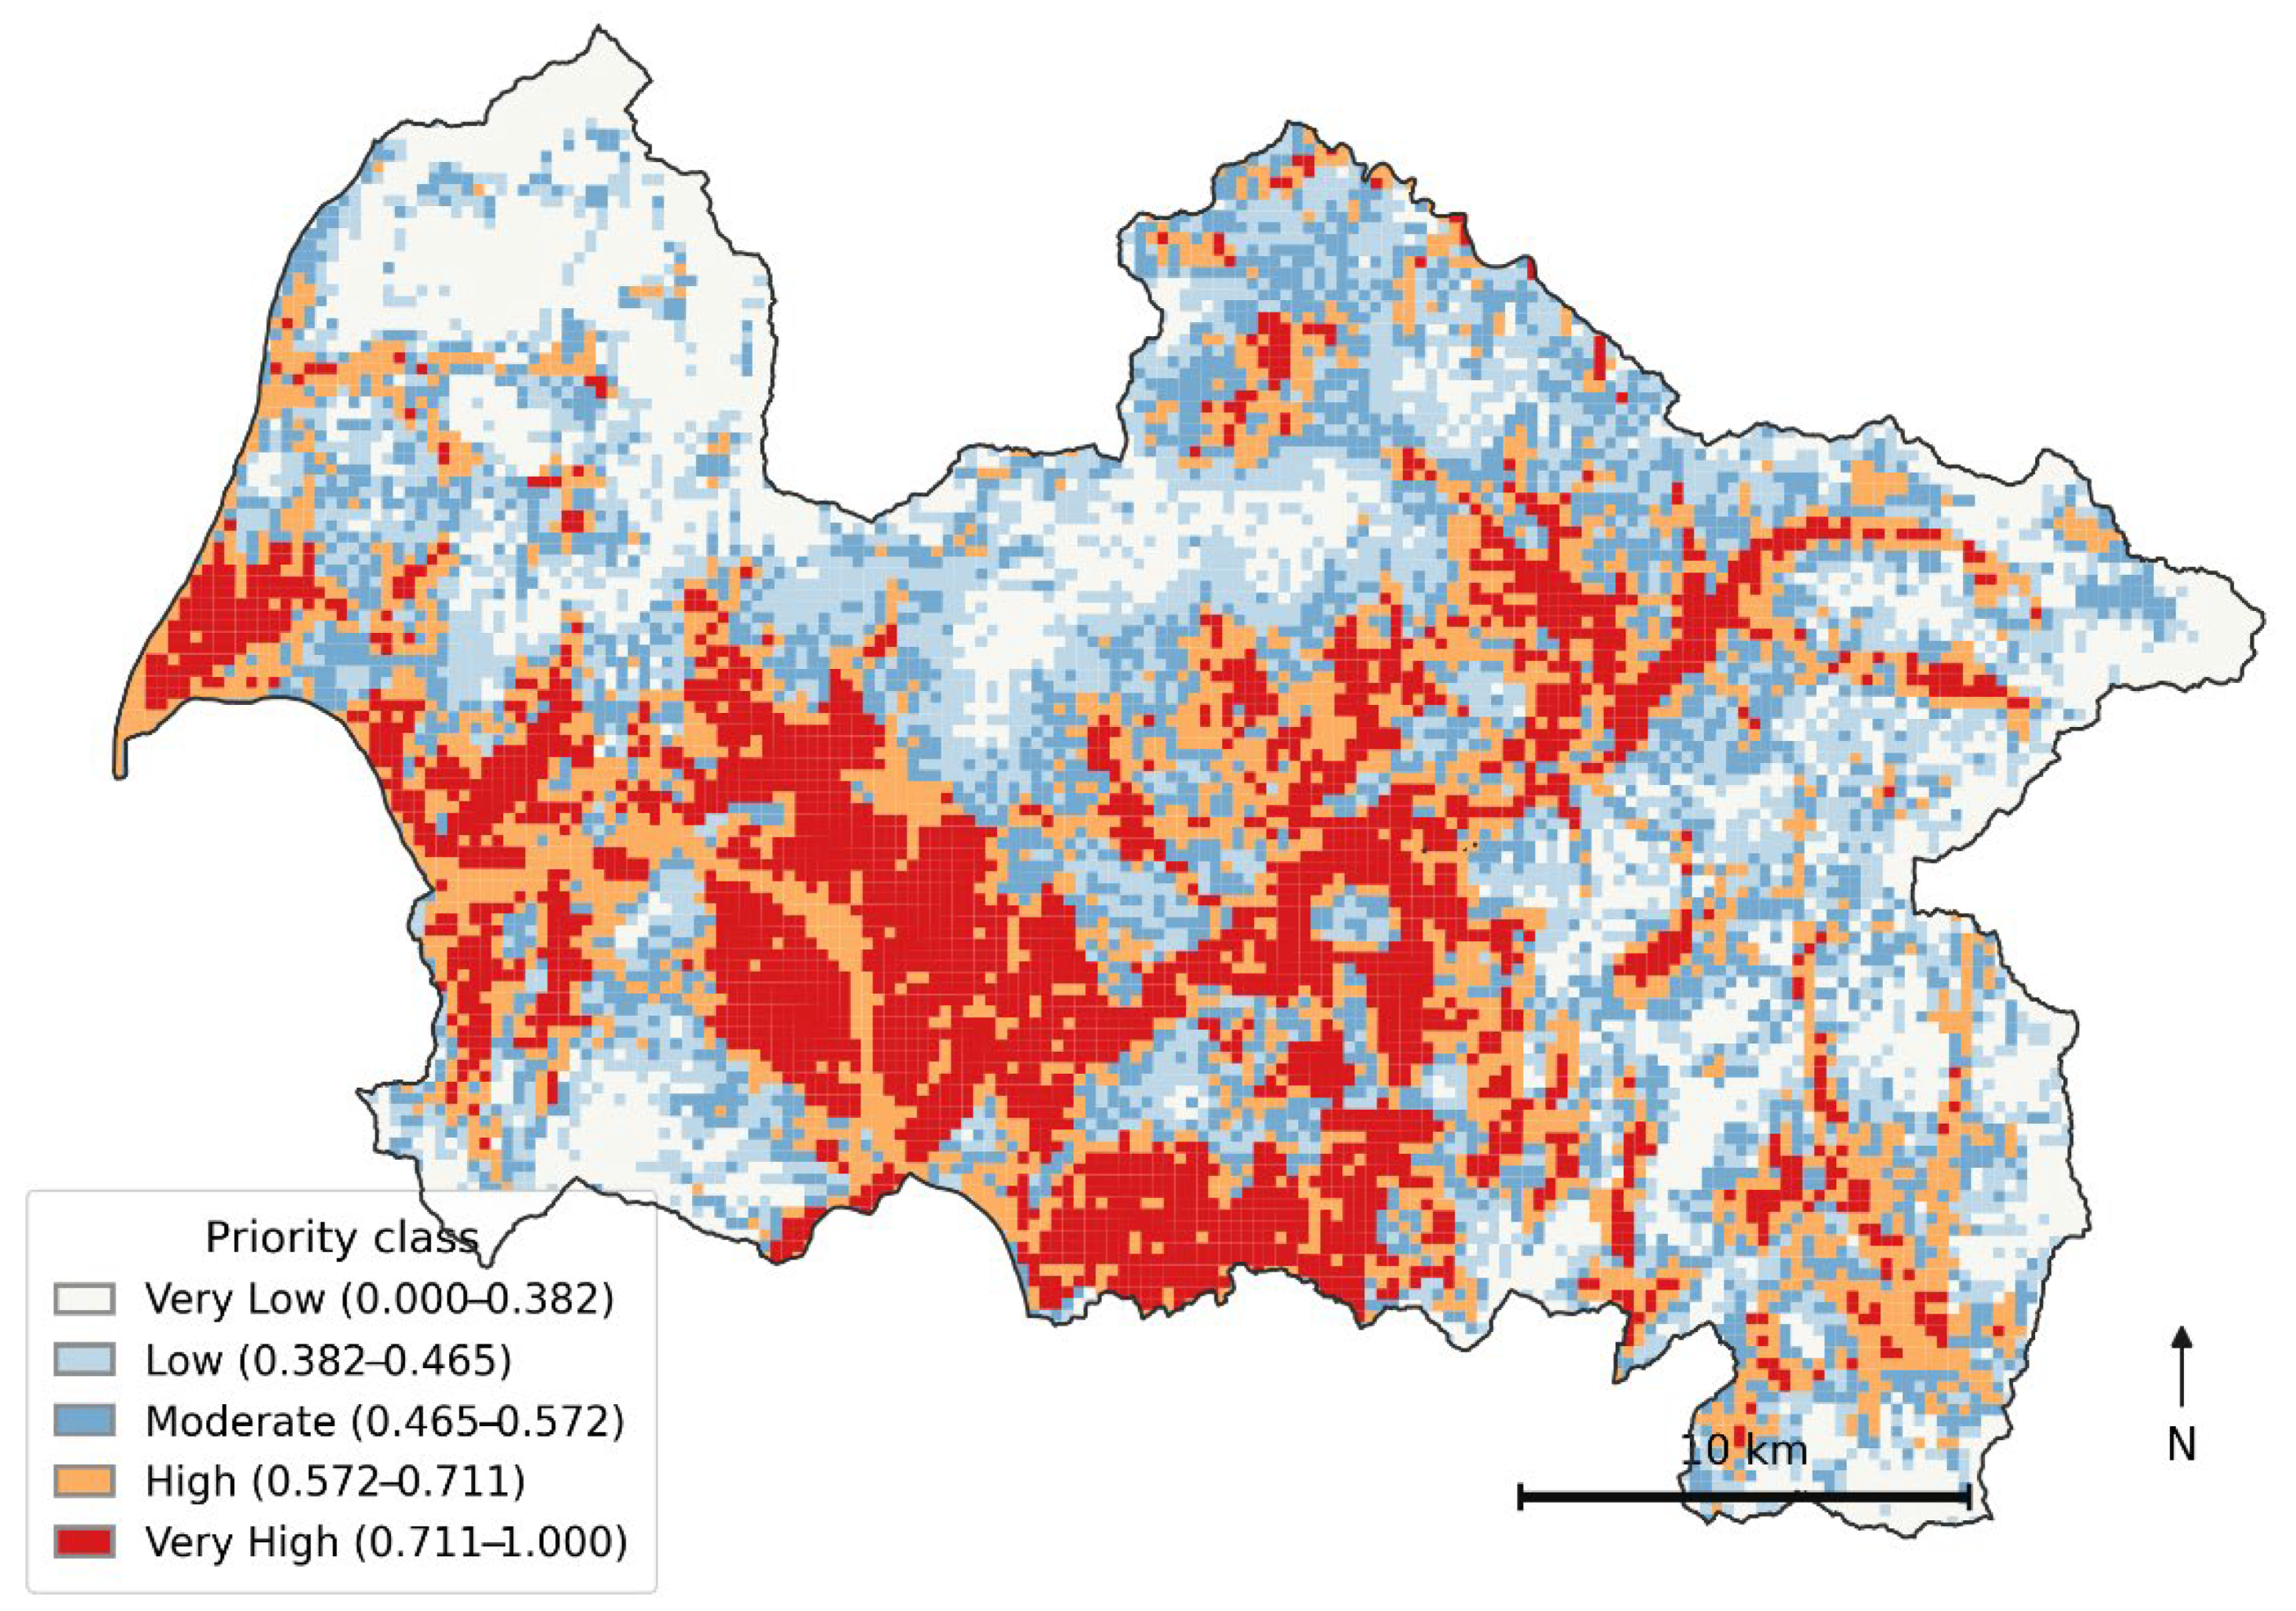
The FarmMap-integrated axis-balanced priority surface identified the strongest CES-oriented implementation potential in spatial corridors where agricultural resource-based potential, accessibility, ecological adjacency, and cultural or community implementation-support assets overlap. The very-high priority class covered 175.42 km2, corresponding to the top fifth of the analyzed county area by design under the area-weighted priority classification. The map is therefore best interpreted as a relative within-county prioritization surface, not as an absolute suitability threshold. The area-balanced priority-class distribution and final index threshold ranges are reported in Table 5.
The spatial distribution of the final FarmMap-integrated CES Priority Index is presented in Figure 6. Across the 14,524 retained 250 m grid cells, the final CES Priority Index had a mean of 0.533, median of approximately 0.507, standard deviation of 0.177, minimum of 0.000, and maximum of 1.000. These descriptive statistics and class thresholds are also reported in Tables S7 and S8.

3.4. Sensitivity and Robustness

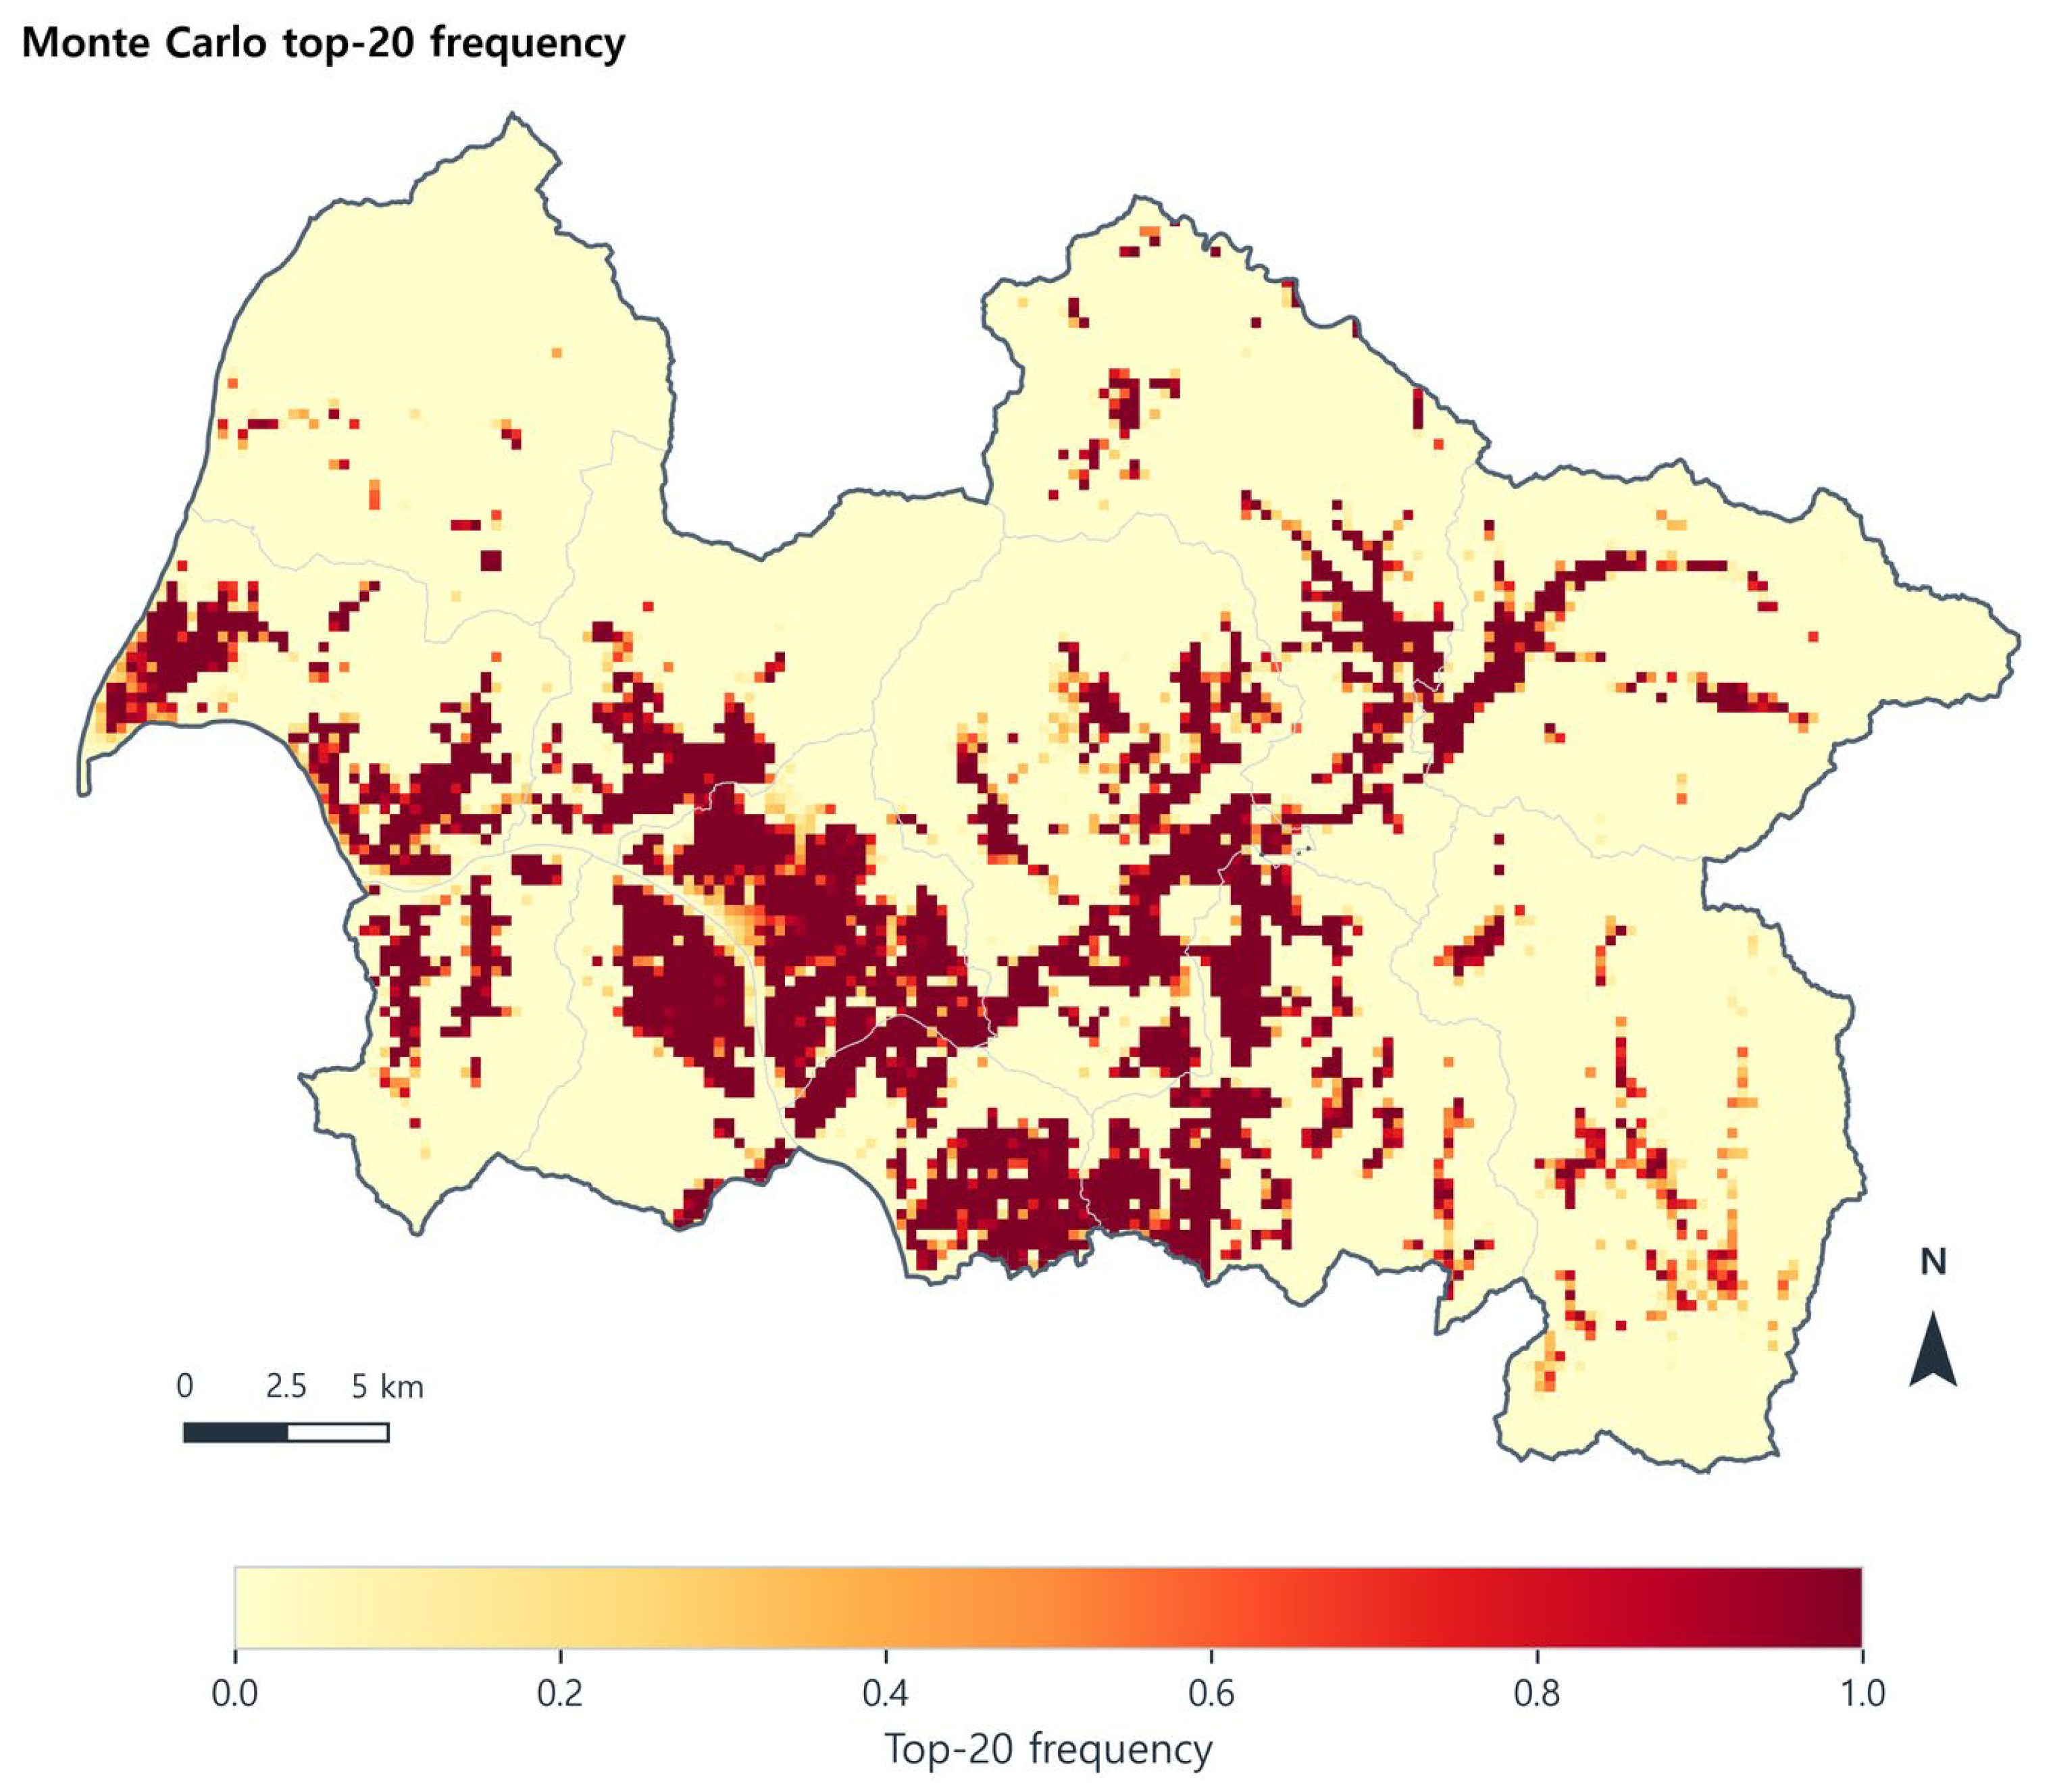
The priority surface remained stable across alternative weighting scenarios. Equal indicator weights and equal axis/equal within-axis weights both preserved high top 20% overlap with the baseline. Axis-emphasis scenarios also retained substantial overlap, with the climate-emphasis scenario showing the highest consistency. Raw entropy remained a useful diagnostic, but it diverged more strongly because it concentrated weight in high-variance variables. Monte Carlo perturbation further confirmed that the core high-priority corridor remained recurrent under stochastic weight variation. The Monte Carlo top-20% membership-frequency map is shown in Figure 7, and the deterministic sensitivity statistics are summarized in Table 6.
Spatial-scale sensitivity further supported the relative stability of the main priority structure without implying scale independence. The 500 m revision showed a Spearman rank correlation of 0.997 with the 250 m baseline, while the 100 m diagnostic showed a Spearman rank correlation of 0.999. Top 20% priority-zone Jaccard overlap was 0.632 for the 500 m support and 0.964 for the 100 m diagnostic. At the eup/myeon level, Yangpyeong-eup, Gaegun-myeon, and Yangseo-myeon remained stable high-priority units across evaluated spatial supports. These results support the 250 m baseline as a reasonable planning-support scale, while the 500 m overlap result also shows that top-priority boundaries remain partly support-dependent. Full model statistics, overlap measures, and eup/myeon rank-consistency diagnostics are provided in Tables S9–S11.

3.5. External Validation

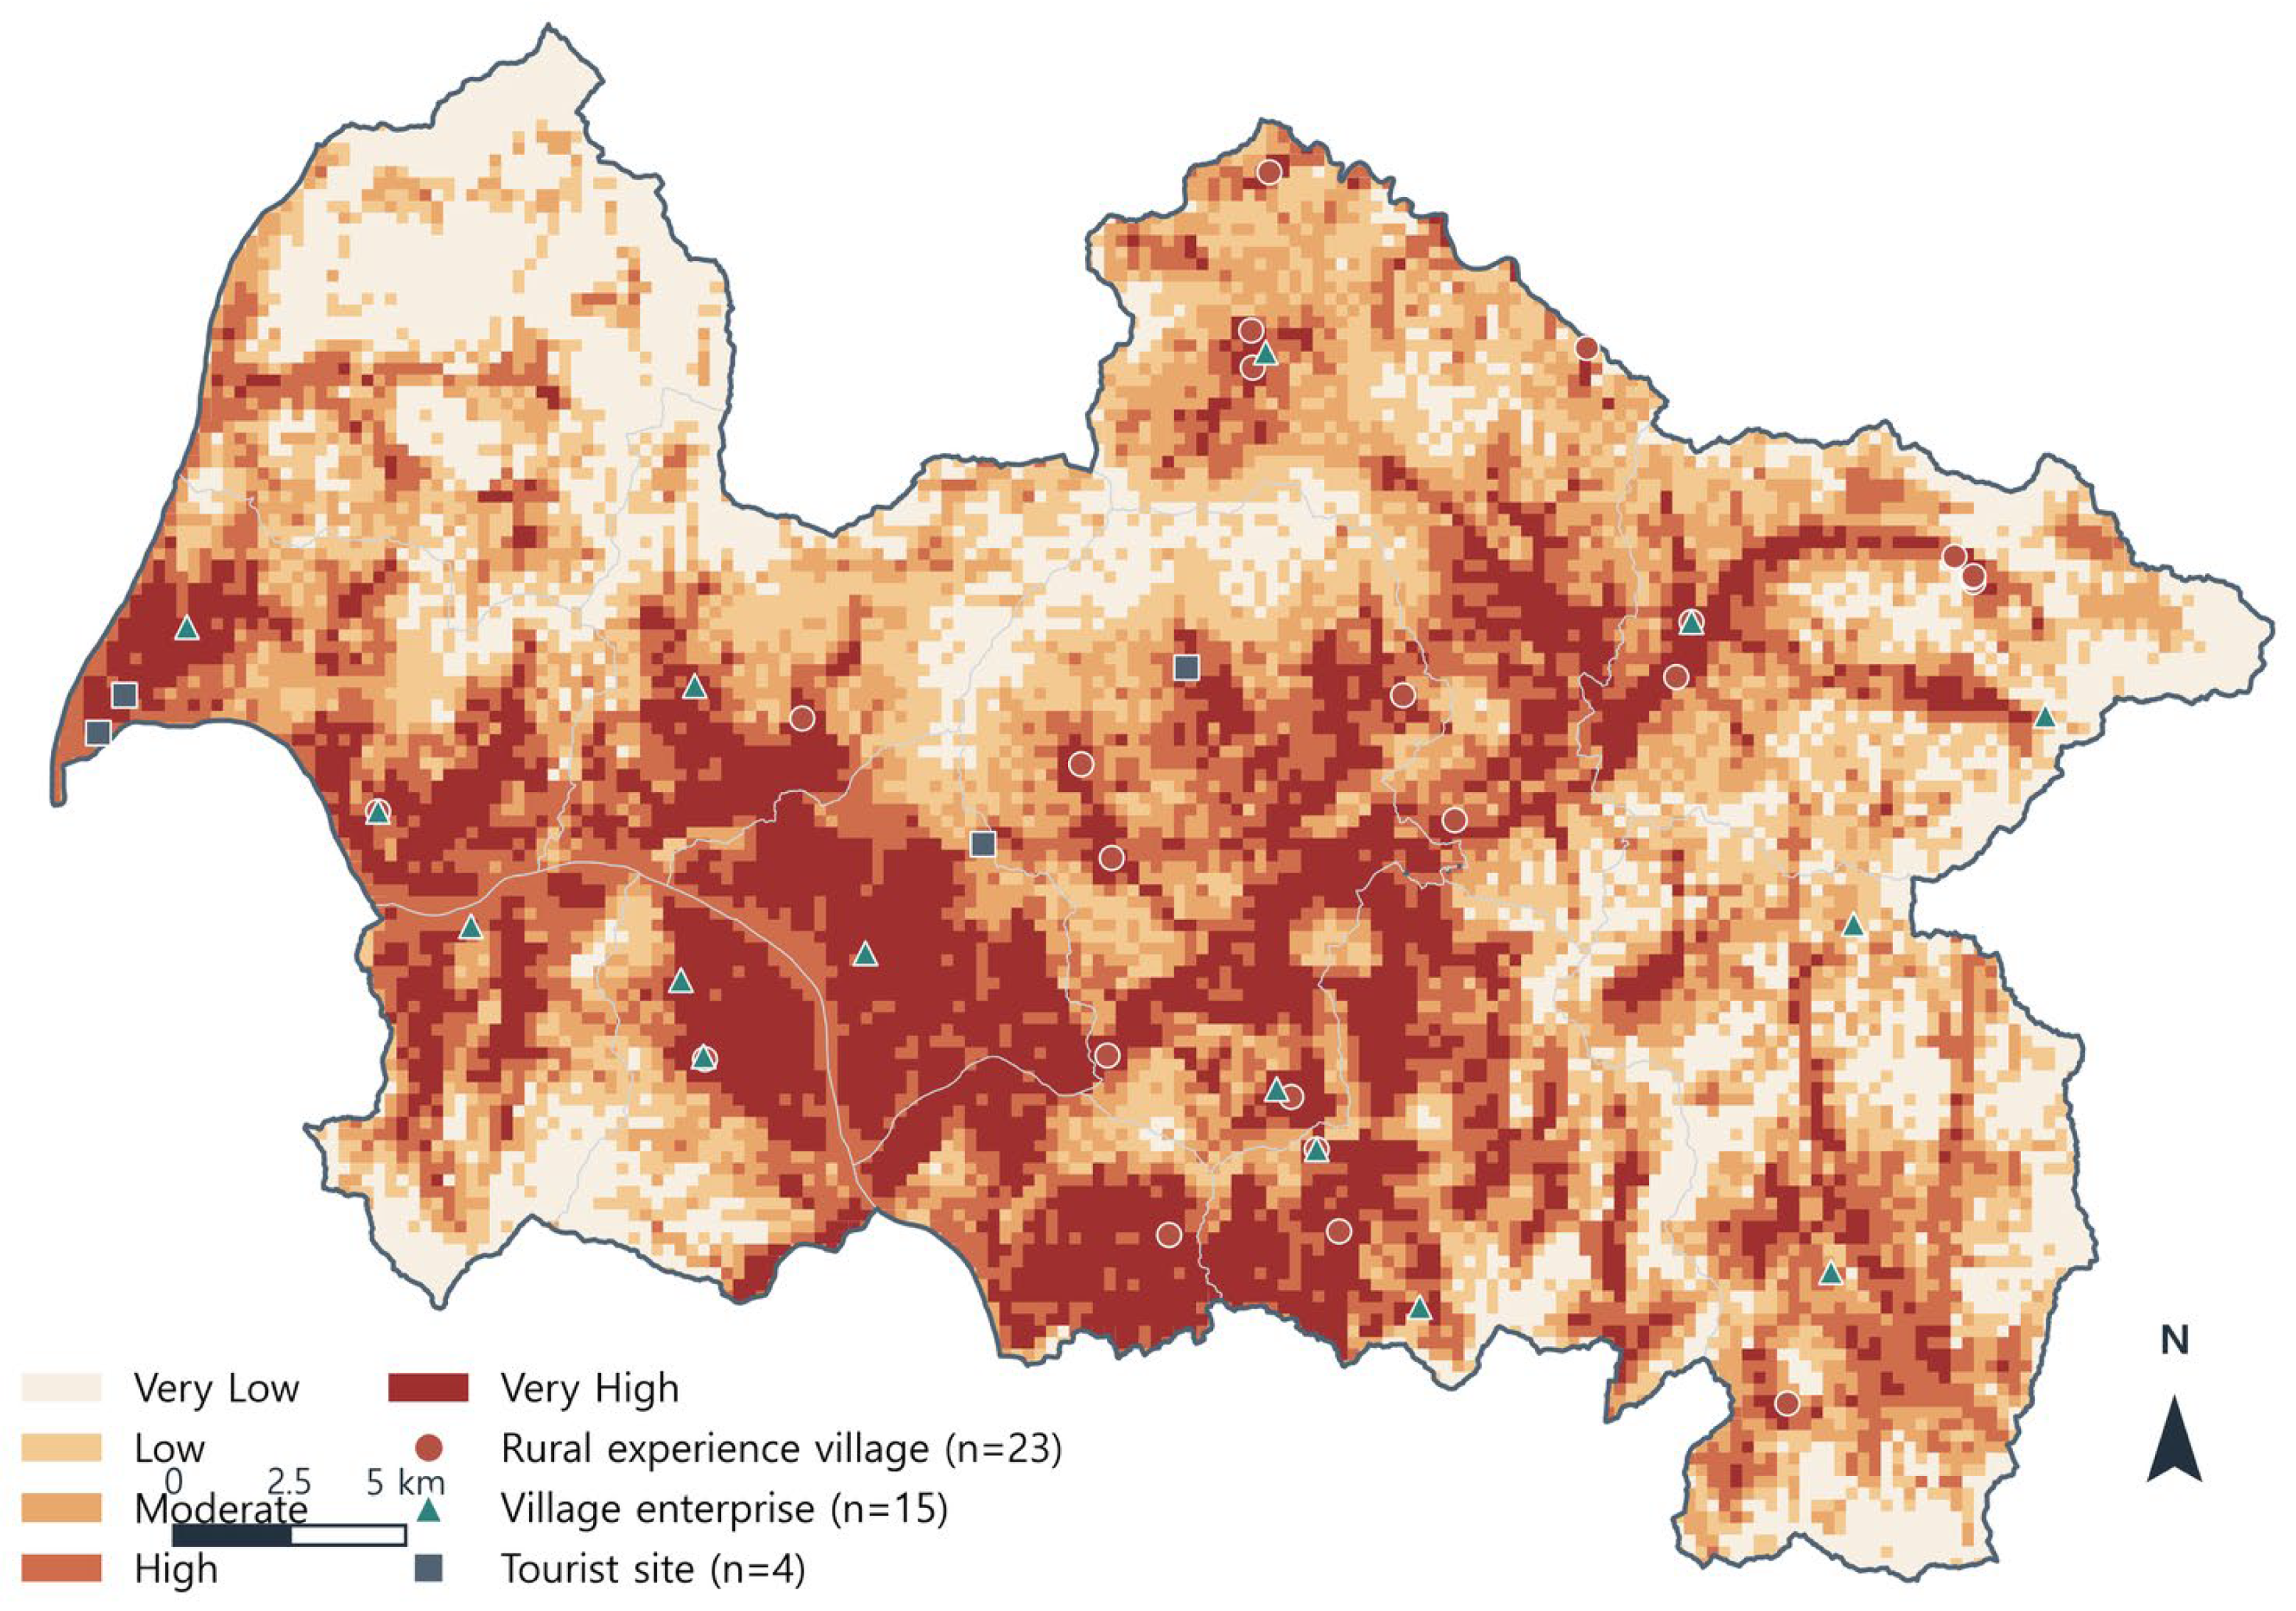
Leave-one-source-out validation showed that rural experience villages and village enterprises were located in areas with significantly higher CES scores than random background locations. Tourist site validation was positive but low-powered because only four geocoded tourist site points were available. These results do not prove social acceptance, governance quality, or implementation success, but they support the plausibility of the priority surface as a first-stage screening layer for rural activity and community resource nodes. The validation points are mapped against the final priority classes in Figure 8, and the leave-one-source-out validation statistics are summarized in Table 7.

3.6. Eup/Myeon Strategy Typology

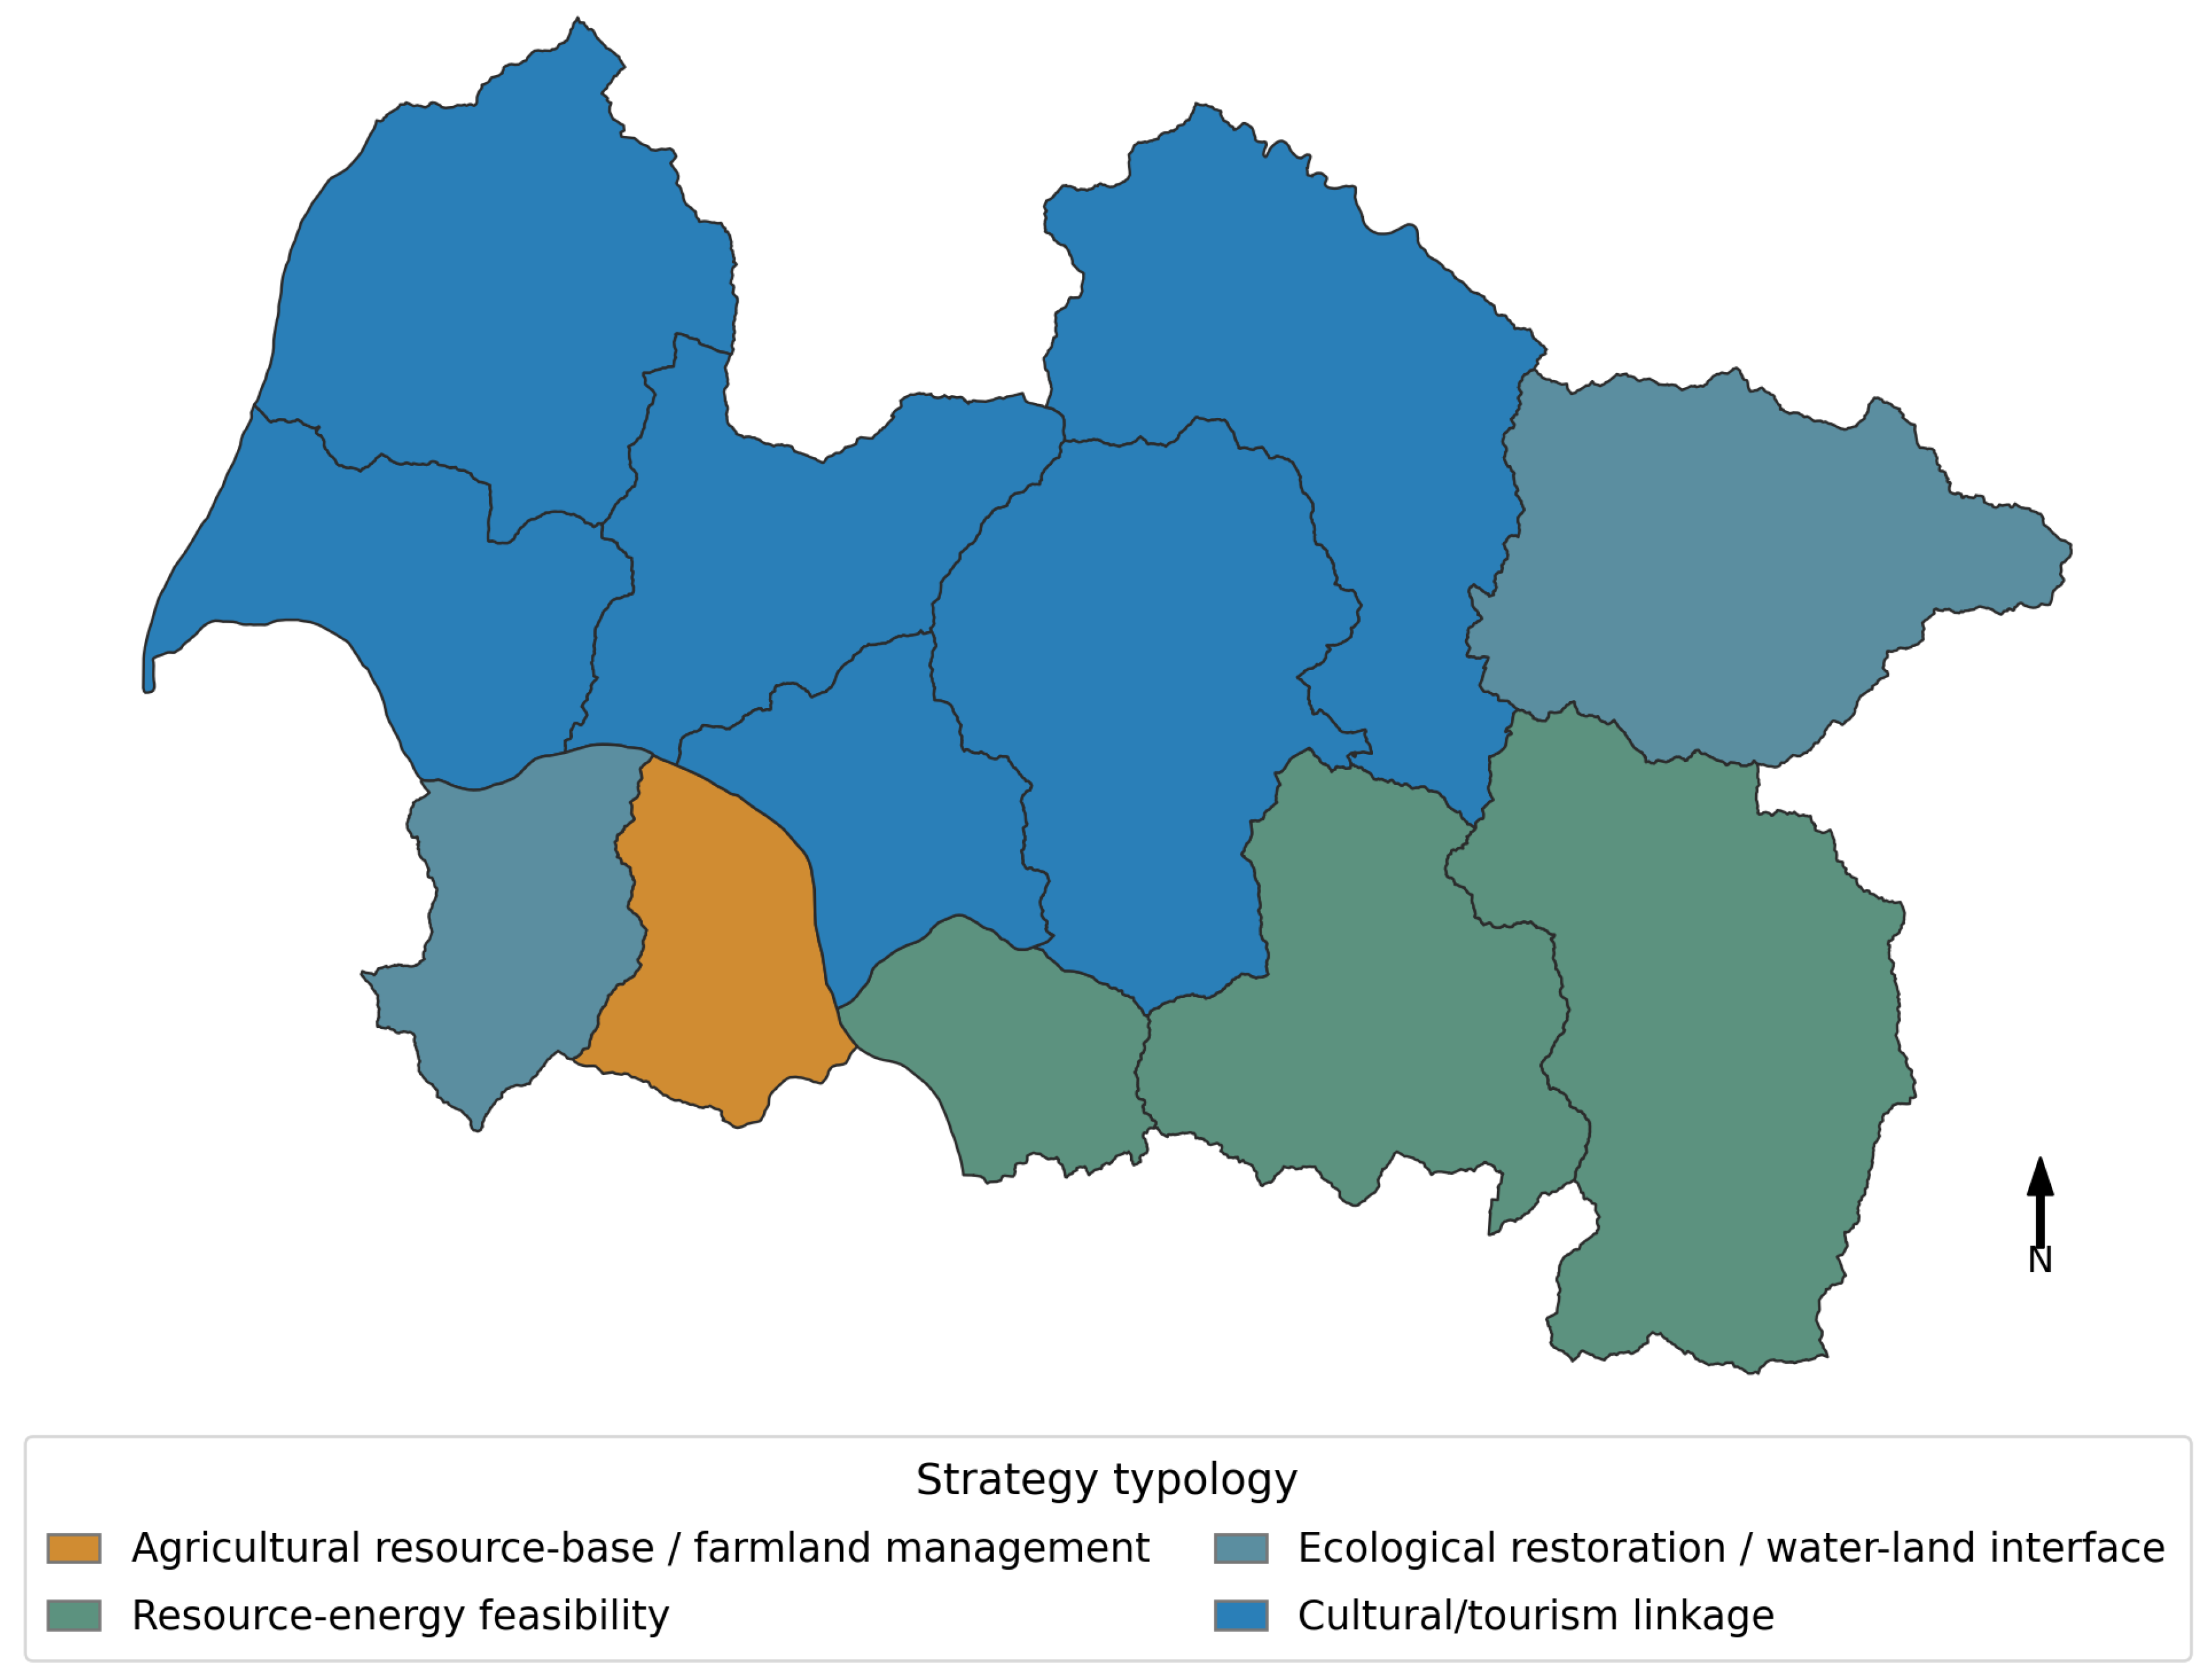
The eup/myeon typology translated the grid-level priority surface into planning-oriented strategy zones. The typology is rule-based and interpretive rather than a statistically validated cluster model. Six of the twelve eup/myeon units were assigned to the cultural/tourism linkage zone, showing that Yangpyeong has a broad amenity and visitor-resource structure. This concentration should not be read as homogeneous planning demand; the accompanying eup/myeon table and local field checks are needed to tailor interventions within the same broad type. The eup/myeon-level strategy typology is mapped in Figure 9 and summarized by zone in Table 8.

4. Discussion

4.1. Translating CES into a Reproducible Spatial Workflow

The main contribution of this study is not the invention of a new weighting algorithm, but the translation of CES into a reproducible, proxy-based spatial workflow. The CES/R-CES literature reviewed above clarifies the conceptual importance of resource circulation, ecological restoration, decentralization, territorial self-reliance, and community implementation. This study extends that literature by showing how a five-axis CES-oriented framework can be expressed through public datasets, 250 m spatial units, FarmMap-based agricultural-resource indicators, remote sensing, terrain variables, and point-based rural assets. The result is a decision support layer that can guide where field verification and participatory planning should begin, not a direct measurement of realized CES performance.
The FarmMap integration is particularly important. Before FarmMap, the resource dimension could only be represented by access feasibility or point-resource proxies. With FarmMap, the first CES axis is anchored in mapped agricultural land resource patterns. Nevertheless, FarmMap does not measure circular material flows, biomass generation, abandoned farmland, or actual reuse programs. It should therefore be interpreted as agricultural resource-based potential, not realized circularity performance.

4.2. Comparison with Recent GIS-MCDA and CES Studies

Compared with the qualitative CES case-study literature reviewed above, the present study offers finer intra-county spatial prioritization, formal robustness testing, leave-one-source-out validation, and spatial-scale sensitivity diagnostics. Compared with recent GIS-driven rural settlement, land suitability, renewable energy, and green infrastructure studies, it uses a simpler weighting structure but contributes a broader CES-oriented framing and stronger separation between conceptual axes and within-axis entropy. Compared with GIS-AHP and spatial-sensitivity frameworks, the present study avoids expert-survey dependency while still reporting scenario and Monte Carlo robustness. The approach is therefore most appropriate as a fast-track empirical screening workflow rather than as a replacement for participatory planning or detailed material-flow accounting. The benchmark correspondence between the present workflow and related CES and GIS-MCDA research streams is summarized in Table 9.

4.3. Planning Implications for Yangpyeong-gun

The results suggest that CES planning in Yangpyeong should not be framed as a uniform county-wide program. High-priority areas concentrate in locations where agricultural resource-based potential, amenity resources, ecological adjacency, and accessibility overlap. Yangpyeong-eup and several tourism-oriented eup/myeon units are suitable for pilot platforms linking cultural landscape, visitor routes, rural lodging, and experience villages. Agricultural-resource zones require parcel-level verification before proposing circularity programs, especially because FarmMap indicates land resource base but not idle status or biomass availability. Ecological and water-land interface zones require coordination with river management and slope constraints before any intervention is defined.
Concrete policy uses should therefore be staged. Agricultural resource-based zones can guide parcel-level farmland verification, idle-land registry checks, and pilot screening for composting, biomass, or agricultural byproduct programs. Community implementation-support zones can guide stakeholder workshops and rural experience village or village-enterprise platform building. Low-carbon feasibility zones should be used only as pre-screening layers before land-use regulation, grid connection, and resident acceptance checks. Ecological and river-adjacent zones can support riparian buffer restoration, stream-corridor management, and terrain-sensitive blue-green infrastructure planning. Cultural/tourism linkage zones can support visitor-route management and landscape-sensitive tourism zoning rather than broad tourism expansion. These staged uses are consistent with recent ecological-corridor and rural-tourism studies [46,47]. They also align with community-empowerment and renewable energy research that treats implementation capacity as a practical condition rather than a guaranteed outcome [48,49]. Ecosystem-risk and regeneration studies further show why spatial priority surfaces should be linked to field verification and policy staging [50,51]. Integrated territorial-planning research supports using such outputs as coordination tools across rural, environmental, and land-management policies [52].

4.4. Limitations

Several limitations must be emphasized. First, proxy variables were used for governance, circularity, low-carbon feasibility, and cultural landscape potential. Village enterprises and rural experience villages are implementation-support indicators, not direct evidence of resident willingness, trust, participation, or governance quality. Second, FarmMap identifies agricultural land resource classes but not realized resource circulation, agricultural byproduct flows, biomass quantities, idle farmland, or actual reuse programs. Third, Sentinel-derived NDVI is a broad vegetation-condition proxy; because the usable scenes were sparse and concentrated in the early growing season, NDVI change and trend should not be interpreted as direct biodiversity, ecological recovery, or carbon-sequestration measures. Fourth, the Shannon diversity indicator is constrained by the limited number of mapped farmland classes and should be read only as a simple farmland-mix proxy. Fifth, the 250 m grid is a planning-support compromise and cannot remove all spatial-support effects; the scale-sensitivity diagnostics support overall rank stability, but the 500 m top 20% overlap result shows that local priority boundaries remain partly scale-dependent. Sixth, tourist site validation is low-powered because only four geocoded tourist site points were available. Seventh, the strategy typology is an interpretive planning classification; the fact that six eup/myeon units fall into the cultural/tourism linkage category reflects broad amenity-resource concentration and requires local differentiation in implementation.

5. Conclusions

This study developed a FarmMap-integrated Python-GIS workflow for translating the Circular and Ecological Sphere concept into a proxy-based spatial prioritization model for rural sustainability. Using Yangpyeong-gun as a case, the study integrated FarmMap, Sentinel-2, DEM, hydrological and road layers, point-resource data, and demographic statistics into thirteen indicators grouped under five CES-oriented axes. The axis-balanced entropy model produced a robust priority surface, and leave-one-source-out validation supported the plausibility of high-priority areas for rural experience villages and village enterprises.
The findings show that CES can be translated from a qualitative sustainability concept into a reproducible, proxy-based spatial decision support workflow. At the same time, the results should be used as a first-stage screening basis for field verification and participatory planning rather than as final implementation decisions or evidence of realized circularity, governance quality, or carbon emission reduction. Future research should add resident surveys, expert-based AHP comparison, material-flow or biomass data, parcel-level idle-farmland verification, and longitudinal ecological monitoring to connect spatial potential with social acceptance and actual circular-economy performance.

Supplementary Materials

The following supporting information can be downloaded at: https://www.mdpi.com/article/10.3390/su18126147/s1, Table S1: Integrated source-theme counts; Table S2: Sentinel-2 scene-level metadata; Table S3: Usable NDVI scene counts by year; Table S4: Full eup/myeon strategy table; Table S5: Full indicator metadata, formulas, spatial operations, favorable directions, normalization, and missing-value handling; Table S6: Entropy-weight details and zero-value handling; Table S7: Final CES Priority Index descriptive statistics; Table S8: Priority-class thresholds and area-balanced class areas; Table S9: Scale model statistics; Table S10: Scale correlation diagnostics; Table S11: Top 20% priority-zone overlap diagnostics; Table S12: Missing-value and neutral-imputation diagnostics.

Funding

This research received no external funding.

Institutional Review Board Statement

Not applicable.

Informed Consent Statement

Not applicable.

Data Availability Statement

The original contributions presented in this study are included in the Supplementary Materials, reference number: Tables S1–S12. These data were derived from the following resources available in the public domain: Statistics Korea/KOSIS (https://kosis.kr accessed on 23 April 2026), Korea Public Data Portal (https://www.data.go.kr accessed on 23 April 2026), Copernicus Data Space Ecosystem (https://dataspace.copernicus.eu accessed on 23 April 2026), National Geographic Information Institute (https://www.ngii.go.kr accessed on 23 April 2026), VWorld National Spatial Information Platform (https://www.vworld.kr accessed on 23 April 2026), Korea Rural Community Corporation public datasets distributed through the Korea Public Data Portal (https://www.data.go.kr accessed on 23 April 2026), and Yangpyeong-gun local public datasets distributed through the Korea Public Data Portal (https://www.data.go.kr accessed on 23 April 2026). Processed Supplementary Tables are provided in the Supplementary Files.

Acknowledgments

The author acknowledges the public data providers listed in the Data Availability Statement.

Conflicts of Interest

The author declares no conflicts of interest.

Abbreviations

The following abbreviations are used in this manuscript:
AbbreviationDefinition
CESCircular and Ecological Sphere
DEMDigital Elevation Model
GIS-MCDAGeographic Information System-based Multi-Criteria Decision Analysis
NDVINormalized Difference Vegetation Index
R-CESRegional Circular and Ecological Sphere

References

  1. Statistics Korea. 2023 Census of Agriculture, Forestry and Fisheries; Statistics Korea: Daejeon, Republic of Korea, 2023.
  2. Rural Development Administration. Comprehensive Plan for the Maintenance and Development of Rural Space; Rural Development Administration: Jeonju, Republic of Korea, 2021. [Google Scholar]
  3. Korea Research Institute for Human Settlements. Rural Spatial Planning and Idle Land Management Policy Studies; KRIHS: Sejong City, Republic of Korea, 2017. [Google Scholar]
  4. Korea Rural Economic Institute. Rural Decline and Sustainability Policy Reports; KREI: Naju, Republic of Korea, 2021. [Google Scholar]
  5. National Institute of Agricultural Sciences. Development of Composting Technology Using Low-Salinity Food Waste and Agro-Residues; Rural Development Administration: Jeonju, Republic of Korea, 2019. [Google Scholar]
  6. Ministry of the Environment, Japan. The Fifth Basic Environment Plan; Government of Japan: Tokyo, Japan, 2018.
  7. Institute for Global Environmental Strategies. Circulating and Ecological Sphere (CES) Concept for Integrated Sustainability Within a City Region; IGES: Hayama, Japan, 2022. [Google Scholar]
  8. Takeuchi, K. Rebuilding the relationship between people and nature: The Satoyama Initiative. Ecol. Res. 2010, 25, 891–897. [Google Scholar] [CrossRef] [Scilit]
  9. Thapa, K.; Sukhwani, V.; Deshkar, S.; Shaw, R.; Mitra, B.K. Strengthening urban-rural resource flow through Regional Circular and Ecological Sphere (R-CES) approach in Nagpur, India. Sustainability 2020, 12, 8663. [Google Scholar] [CrossRef] [Scilit]
  10. U.N.U.-I.A.S. OUIK. Satoyama and Satoumi of Ishikawa: Understanding the Linkage of Forest, Villages and Sea in Noto Peninsula; United Nations University Institute for the Advanced Study of Sustainability: Shibuya, Japan, 2013. [Google Scholar]
  11. Satoyama Initiative. Incorporating Green Energy into Smart Agriculture to Create Regional CES: Case Study from New Taipei City, Taiwan; IPSI/Satoyama Initiative: Tokyo, Japan, 2019. [Google Scholar]
  12. Asia-Pacific Network for Global Change Research. Fostering the regional circulating and ecological sphere approach to translate global goals into local actions. APN Sci. Bull. 2022, 14, 138–148. [Google Scholar]
  13. Azam, M.I.; Farid, M.T.; Lee, Y.Y.; Goh, S.K. Circular and ecological economy: Key principles and strategies. Resour. Conserv. Recycl. 2022, 180, 106206. [Google Scholar]
  14. Kirchherr, J.; Yang, N.H.N.; Schulze-Spuentrup, F.; Heerink, M.J.; Hartley, K. Conceptualizing the circular economy (revisited): An analysis of 221 definitions. Resour. Conserv. Recycl. 2023, 194, 107001. [Google Scholar] [CrossRef] [Scilit]
  15. United Nations. Transforming Our World: The 2030 Agenda for Sustainable Development; United Nations: New York, NY, USA, 2015.
  16. IUCN. Global Standard for Nature-Based Solutions; International Union for Conservation of Nature: Gland, Switzerland, 2020. [Google Scholar]
  17. Seddon, N.; Smith, A.; Smith, P.; Key, I.; Chausson, A.; Girardin, C.A.J.; House, J.; Srivastava, S.; Turner, B. Getting the message right on nature-based solutions to climate change. Glob. Change Biol. 2021, 27, 1518–1546. [Google Scholar] [CrossRef] [Scilit]
  18. Berkes, F.; Davidson-Hunt, I.J. Biodiversity, traditional management systems, and cultural landscapes: Examples from the boreal forest of Canada. Int. Soc. Sci. J. 2006, 58, 35–47. [Google Scholar] [CrossRef] [Scilit]
  19. Richards, D.R.; Friess, D.A. A rapid indicator of cultural ecosystem service usage at a fine spatial scale: Content analysis of social media photographs. Ecol. Indic. 2015, 53, 187–195. [Google Scholar] [CrossRef] [Scilit]
  20. Depietri, Y.; Ghermandi, A.; Campisi-Pinto, S.; Orenstein, D.E. Public participation GIS versus geolocated social media data to assess urban cultural ecosystem services: Instances of complementarity. Ecosyst. Serv. 2021, 50, 101277. [Google Scholar] [CrossRef] [Scilit]
  21. Jeong, J.; Park, C.R. Urban forest indicator assessment for nature-based solutions to connect biodiversity and people. Ecol. Indic. 2024, 169, 112843. [Google Scholar] [CrossRef] [Scilit]
  22. Turner, M.G.; Gardner, R.H.; O’Neill, R.V. Landscape Ecology in Theory and Practice; Springer: Berlin/Heidelberg, Germany, 2001. [Google Scholar]
  23. With, K.A.; Gardner, R.H.; Turner, M.G. Landscape connectivity and population distributions in heterogeneous environments. Oikos 1997, 78, 151–169. [Google Scholar] [CrossRef] [Scilit]
  24. Hammond, H. Ecosystem-Based Planning: Principles and Process; Silva Forest Foundation: Slocan Park, BC, Canada, 2002. [Google Scholar]
  25. Houghton, R.A.; Hall, F.; Goetz, S.J. Importance of biomass in the global carbon cycle. J. Geophys. Res. Biogeosci. 2009, 114, G00E03. [Google Scholar] [CrossRef] [Scilit]
  26. Brancalion, P.H.S.; Niamir, A.; Broadbent, E.N.; Crouzeilles, R.; Barros, F.S.M.; Zambrano, A.M.A.; Baccini, A.; Aronson, J.; Goetz, S.; Reid, J.L.; et al. Global restoration opportunities in tropical rainforest landscapes. Sci. Adv. 2019, 5, eaav3223. [Google Scholar] [CrossRef] [Scilit]
  27. Chen, X.; Li, F.; Li, X.; Liu, H.; Hu, Y.; Hu, P. Integrating ecological assessments to target priority restoration areas: A case study in the Pearl River Delta Urban Agglomeration, China. Remote Sens. 2021, 13, 2424. [Google Scholar] [CrossRef] [Scilit]
  28. Niyogakiza, A.; Liu, Q. GIS-driven multi-criteria assessment of rural settlement patterns and attributes in Rwanda’s Western Highlands (Central Africa). Sustainability 2025, 17, 6406. [Google Scholar] [CrossRef] [Scilit]
  29. Tuesta-Trauco, K.M.; Salas Lopez, R.; Barboza, E.; Zabaleta-Santisteban, J.A.; Medina-Medina, A.J.; Rivera-Fernandez, A.S.; Sanchez-Vega, J.A.; Noriega-Salazar, N.M.; Oliva-Cruz, M.; Tariq, A.; et al. Land suitability for pitahaya (Hylocereus megalanthus) cultivation in Amazonas, Peru: Integrated use of GIS, RS, F-AHP, and PROMETHEE. Remote Sens. 2025, 17, 637. [Google Scholar] [CrossRef] [Scilit]
  30. Ouerghi, S.; Elsheikh, R.; Amini, H.; Aldosari, S. An integrated GIS-AHP-sensitivity analysis framework for electric vehicle charging station site suitability in Qatar. ISPRS Int. J. Geo-Inf. 2026, 15, 54. [Google Scholar] [CrossRef] [Scilit]
  31. Ramos-Diez, I.; Barilari, S.; Ljunggren, J.; Hellsten, S.; Ferreras-Alonso, N. A Python GIS-based multi-criteria assessment to identify suitable areas for photovoltaic energy measures. ISPRS Int. J. Geo-Inf. 2026, 15, 157. [Google Scholar] [CrossRef] [Scilit]
  32. Moran-Alonso, N.; Viedma-Guiard, A.; Simon-Rojo, M.; Cordoba-Hernandez, R. Agricultural land suitability analysis for land use planning: The case of the Madrid Region. Land 2025, 14, 134. [Google Scholar] [CrossRef] [Scilit]
  33. Nathawat, R.; Gupta, S.K.; Kanga, S.; Singh, S.K.; Chakraborty, S.; Marazi, A.; Sajan, B.; Abouleish, M.Y.; Meraj, G.; Ali, T.; et al. Urban green infrastructure planning in Jaipur, India: A GIS-based suitability model for semi-arid cities. Sustainability 2025, 17, 2420. [Google Scholar] [CrossRef] [Scilit]
  34. Islam, A.; Shirowzhan, S.; Pettit, C.J. Geographic Information System based site selection for NSW’s renewable energy zones: Addressing SDG 7. Sustainability 2025, 17, 2708. [Google Scholar] [CrossRef] [Scilit]
  35. Malczewski, J.; Jankowski, P. Emerging trends and research frontiers in spatial multicriteria analysis. Int. J. Geogr. Inf. Sci. 2020, 34, 1257–1282. [Google Scholar] [CrossRef] [Scilit]
  36. Feizizadeh, B.; Jankowski, P.; Blaschke, T. A GIS based spatially explicit sensitivity and uncertainty analysis approach for multi-criteria decision analysis. Comput. Geosci. 2014, 64, 81–95. [Google Scholar] [CrossRef] [Scilit]
  37. Saaty, T.L. The Analytic Hierarchy Process; McGraw-Hill: New York, NY, USA, 1980. [Google Scholar]
  38. Korea Agency of Education, Promotion and Information Service in Food, Agriculture, Forestry and Fisheries. FarmMap Spatial Data, Gyeonggi-do; Public Data Portal; Korea Agency of Education, Promotion and Information Service in Food, Agriculture, Forestry and Fisheries: Sejong-si, Republic of Korea, 2025.
  39. Copernicus Data Space Ecosystem. Sentinel-2 Level-2A Products; European Union Copernicus Programme: Brussels, Belgium, 2025. [Google Scholar]
  40. National Geographic Information Institute. Public DEM Data; NGII: Suwon, Republic of Korea, 2025. [Google Scholar]
  41. VWorld. National Spatial Information Download Services: River, Road, and Administrative Boundary Layers; Ministry of Land, Infrastructure and Transport: Sejong City, Republic of Korea, 2026. [Google Scholar]
  42. KOSIS. Yangpyeong-gun Demographic and Population-Dynamics Statistics; Korean Statistical Information Service: Daejeon, Republic of Korea, 2026. [Google Scholar]
  43. Korea Rural Community Corporation. Rural Experience Village Data; Public Data Portal; Korea Rural Community Corporation: Naju, Republic of Korea, 2023. [Google Scholar]
  44. Yangpyeong-gun. Local Public Datasets: Solar Power Plants, Rural Lodging, Tourism Resources, and Village Enterprises; Public Data Portal; Yangpyeong-gun Office: Yangpyeong-gun, Republic of Korea, 2025. [Google Scholar]
  45. Shannon, C.E. A mathematical theory of communication. Bell Syst. Tech. J. 1948, 27, 379–423, 623–656. [Google Scholar] [CrossRef] [Scilit]
  46. Bai, Y.; Zhao, J.; Shen, H.; Li, X.; Wen, B. The evolution of forest landscape connectivity and ecological network construction: A case study of Zhejiang’s ecological corridors. Sustainability 2024, 16, 5868. [Google Scholar] [CrossRef] [Scilit]
  47. Lapuz, M.C.M. The role of local community empowerment in the digital transformation of rural tourism development in the Philippines. Technol. Soc. 2023, 74, 102308. [Google Scholar] [CrossRef] [Scilit]
  48. Li, X.; Kim, J.S.; Lee, T.J. Contribution of supportive local communities to sustainable event tourism. Sustainability 2021, 13, 7853. [Google Scholar] [CrossRef] [Scilit]
  49. Surya, B.; Suriani, S.; Menne, F.; Abubakar, H.; Idris, M.; Rasyidi, E.S.; Remmang, H. Community empowerment and utilization of renewable energy. Sustainability 2021, 13, 3178. [Google Scholar] [CrossRef] [Scilit]
  50. Tang, L.; Long, H.; Aldrich, D.P. Putting a price on nature: Ecosystem service value and ecological risk in the Dongting Lake Area, China. Int. J. Environ. Res. Public Health 2023, 20, 4649. [Google Scholar] [CrossRef] [Scilit]
  51. Peng, Y.; Lai, Y.; Li, X.; Zhang, X. An alternative model for measuring the sustainability of urban regeneration: The way forward. J. Clean. Prod. 2015, 109, 76–83. [Google Scholar] [CrossRef] [Scilit]
  52. Yoon, H.J.; Yum, S.J. Integrated planning in national territorial and environmental policy: A study of coordination models. J. Environ. Sci. Soc. 2024, 33, 403–415. [Google Scholar]
Figure 1. Spatial context of Yangpyeong-gun. Panel (A) locates the study area within Gyeonggi-do. The grey area shows the region of Gyeonggi-do and brown area is where Yangpyeong-gun is located. Panel (B) shows the eup/myeon structure used for sub-county interpretation. Population trends are reported in Section 3, while source-theme counts are reported in Table S1.
Sustainability 18 06147 g001
Figure 2. FarmMap-integrated CES analytical flowchart. The workflow traces conceptual CES extraction, four-step indicator screening, spatial preprocessing, indicator construction, axis-balanced entropy synthesis, final outputs, robustness testing, external validation, and planning interpretation. Arrows indicate the sequential analytical flow and branch points between retained indicator groups and evaluation modules.
Sustainability 18 06147 g002
Figure 3. FarmMap land resource classes in Yangpyeong-gun. The map summarizes paddy, dry field, orchard, facility, and non-agricultural or uncertain classes used to construct the agricultural resource-based axis.
Sustainability 18 06147 g003
Figure 4. Remote sensing and terrain indicators used in the ecological and low-carbon feasibility axes. The panels show elevation, slope, the latest growing-season NDVI snapshot/composite, and multi-year NDVI change proxy. Scene dates, valid-pixel shares, and compositing decisions are reported in Tables S2 and S3.
Sustainability 18 06147 g004
Figure 5. Revised axis-level CES surfaces after FarmMap integration. The five panels show normalized relative spatial-potential scores for agricultural resource-based potential, ecological/environmental condition, low-carbon feasibility proxy, community implementation support, and cultural/landscape value on a common 0–1 scale. The revised color hierarchy improves map readability and does not represent realized circularity, governance quality, or measured carbon reduction.
Sustainability 18 06147 g005
Figure 6. Revised final FarmMap-integrated CES Priority Index. Priority classes are area-balanced; Very High indicates the top fifth within Yangpyeong-gun rather than an absolute suitability threshold. The revised legend reports the class threshold ranges used for the final 250 m baseline.
Sustainability 18 06147 g006
Figure 7. Monte Carlo top 20% membership frequency under stochastic weight perturbation. Darker cells indicate grid cells that repeatedly entered the top 20% priority zone across Monte Carlo runs; scenario correlation and overlap statistics are reported in Table 6 and Tables S9–S11.
Sustainability 18 06147 g007
Figure 8. Leave-one-source-out external validation map after FarmMap integration. Validation points are overlaid on the final priority classes; the tested source was excluded from the score used for its evaluation. Point means and empirical p-values are reported in Table 7. Tourist site validation remains low-powered because only four geocoded tourist site points were available.
Sustainability 18 06147 g008
Figure 9. Revised eup/myeon-level rule-based CES strategy typology. The figure presents the interpretive planning typology with an enlarged legend and clearer category labels. Detailed eup/myeon scores, top 20% area shares, and typology rules are reported in Table 8 and Table S4. Typology indicates dominant planning orientation rather than statistically validated clusters.
Sustainability 18 06147 g009
Table 1. Public data groups used in the Yangpyeong CES analysis.
Data GroupMain VariablesCES UseKey Caveat
FarmMap 2025Paddy, dry field, orchard, facility polygonsAgricultural resource baseNot biomass flow or idle land
Sentinel-2 L2ALimited growing-season NDVI snapshots/composites; NDVI change and trend proxiesEcology; vegetation-condition proxySparse early-growing-season scenes; not biodiversity or carbon measurement
NGII DEMElevation, slopeTerrain and feasibilityCounty-scale, not parcel micro-topography
River/road layersProximity and access metricsEcology; implementation feasibilityProximity is not quality
Rural point resourcesExperience villages, village enterprises, tourism sitesImplementation-support and cultural proxiesPoint availability varies; not governance quality or resident participation
KOSIS/local statisticsPopulation, aging, births, deathsStudy-area contextMostly county or eup/myeon scale
Table 2. Empirical CES indicators retained after data screening. Axis labels indicate proxy-based spatial-potential dimensions rather than measured CES performance.
CES AxisIndicatorsMain DataInterpretation
Agricultural resource-base potentialFarmland share; farmland accessibility support; agricultural diversityFarmMap; roadsMapped agricultural resource-base potential, not realized material circularity
Ecology and environmentLatest NDVI snapshot/composite; NDVI change proxy; river proximity; steep-land constraintSentinel-2; rivers; DEMVegetation condition and blue-green adjacency proxies
Low-carbon feasibility proxyVegetation trend proxy; accessible low-slope feasibilitySentinel-2; DEM; roadsFeasibility proxy, not emissions inventory or measured carbon reduction
Community implementation supportVillage-enterprise proximity; rural experience village proximityLocal point dataImplementation-support proxy, not participation or governance-quality survey
Cultural landscapeTourism-resource proximity; river-landscape proximityTourism points; riversAmenity and landscape-linkage proxy
Table 3. Final FarmMap-integrated axis-balanced entropy weights. Each CES-oriented axis is constrained to a total weight of 0.20; entropy weighting operates only within axes. Zero-value entropy terms were handled by defining p_ij ln(p_ij) = 0 when p_ij = 0.
AxisIndicatorWithin-Axis wFinal W
Resource-baseFarmland base0.3210.064
Resource-baseFarmland accessibility0.3220.064
Resource-baseAgricultural diversity0.3570.071
EcologyLatest NDVI0.0630.013
EcologyNDVI change0.0950.019
EcologyRiver proximity0.0590.012
EcologySteep-land constraint0.7830.157
Low carbonNDVI trend0.6100.122
Low carbonAccessible low-slope feasibility0.3900.078
CommunityVillage-enterprise proximity0.4290.086
CommunityRural-experience proximity0.5710.114
CultureTourism proximity0.7730.155
CultureRiver-landscape adjacency0.2270.045
Table 4. Selected demographic context of Yangpyeong-gun.
YearPopulationElderly Ratio (%)BirthsDeathsNatural Increase
2014106,77420.2666905−239
2018117,67022.9520981−461
2020120,17425.44931042−549
2021122,53926.44741115−641
2022123,70427.74591284−825
2023127,42128.94471193−746
Table 5. Area-balanced distribution of CES priority classes with final index threshold ranges.
Priority Class (Final Index Range)Area (km2)Area Share (%)
Very Low (0.000–0.382)175.2420.0
Low (0.382–0.465)175.2520.0
Moderate (0.465–0.572)175.2320.0
High (0.572–0.711)175.2420.0
Very High (0.711–1.000)175.2720.0
Table 6. Sensitivity summary relative to the axis-balanced FarmMap baseline. SD denotes the standard deviation of the normalized scenario score.
Scenario SD of Normalized Scenario Score Top 20 Overlap Interpretation
raw entropy diagnostic farmmap0.1970.648Diagnostic contrast
equal indicator weights0.1370.780High consistency
equal axis equal within0.1330.804High consistency
ecology emphasis0.2030.851High consistency
resource emphasis0.1630.789High consistency
governance emphasis0.1450.810High consistency
culture emphasis0.1600.729Diagnostic contrast
climate emphasis0.1460.908High consistency
Table 7. Leave-one-source-out validation results.
Validation SourcenPoint MeanRandom Meanp-ValueInterpretation
Rural experience village230.7850.5980.001Enriched
Village enterprise150.8070.6160.001Enriched
Tourist site40.7080.6050.093Suggestive
Table 8. Rule-based eup/myeon strategy typology, summarized by zone.
Strategy ZoneEup/Myeon UnitsEvidence UsedPlanning Focus
Agricultural resource-based/farmland management priorityGangsang-myeonHigh FarmMap agricultural resource-based score and priority concentrationPilot farmland-linked resource-based management and parcel-level field checks
Cultural/tourism linkage zoneYangpyeong-eup, Yangseo-myeon, Yongmun-myeon, Danwol-myeon, Okcheon-myeon, Seojong-myeonCultural/landscape scores or lodging contextLink visitor routes, rural lodging, and landscape management
Ecological restoration and water-land interface priorityGangha-myeon, Cheongun-myeonWater-land and ecological management saliencePrioritize restoration and blue-green interface management
Resource-energy feasibility zoneGaegun-myeon, Jipyeong-myeon, Yangdong-myeonLow-carbon feasibility or solar-context indicatorsCoordinate renewable energy and rural-service feasibility checks after land-use and resident-acceptance review
Table 9. Benchmark correspondence with related CES and GIS-MCDA studies.
Benchmark StreamTypical StrengthRemaining GapResponse in This Study
CES/R-CES case studiesTerritorial sustainability framingLimited grid-level prioritizationCES converted to 250 m priority surface
Agricultural land suitabilityDetailed land resource criteriaOften sectoral or crop-specificFarmMap anchors resource axis in multi-axis CES
Rural GIS-MCDAMulti-source spatial integrationOften expert-weight dependentAxis-balanced entropy avoids survey dependency
Sensitivity/uncertainty studiesRobustness diagnosticsOften separate from CES theoryScenario and Monte Carlo testing included
Validation-oriented studiesExternal plausibility checksRisk of circular validationLeave-one-source-out validation applied
Disclaimer/Publisher’s Note: The statements, opinions and data contained in all publications are solely those of the individual author(s) and contributor(s) and not of MDPI and/or the editor(s). MDPI and/or the editor(s) disclaim responsibility for any injury to people or property resulting from any ideas, methods, instructions or products referred to in the content.