Article

Spatiotemporal Patterns and Regional Heterogeneity of Nitrogen Use Efficiency for Major Cereal and Oil Crops in Sichuan Province: A Regional Nitrogen Balance Perspective


1
Research Center of Agricultural Economy, Sichuan University of Science & Engineering, Zigong 643000, China
2
Shipping Logistics Collaborative Innovation Center in the Upper Reaches of Yangtze River, Yibin University, Yibin 644000, China
*
Authors to whom correspondence should be addressed.
These authors contributed equally to this work.
Sustainability 2026, 18(12), 6071; https://doi.org/10.3390/su18126071
Submission received: 11 May 2026 / Revised: 3 June 2026 / Accepted: 6 June 2026 / Published: 12 June 2026

Abstract

Enhancing nitrogen (N) use efficiency (NUE) is crucial for reconciling food security with fertilizer reduction and environmental protection in Sichuan province. This study used statistical data of rice, wheat, maize, and rapeseed in Sichuan Province from 2008 to 2022 to evaluate crop NUE within a regional N balance framework and compare spatiotemporal differences across the five major economic zones. Results showed that provincial NUE presented a distinct three-stage pattern: a gradual increase from 2008 to 2014, a significant surge in 2015, and a period of high-level but fluctuating NUE after 2016, the drivers of which require further investigation. By 2022, rice and rapeseed demonstrated the highest NUE values (42.89% and 42.90%, respectively), followed by maize (35.46%) and wheat (28.77%). Notable spatial heterogeneity was detected, with a general tendency of higher NUE in the southeastern and basin areas and lower NUE in the northwestern mountainous areas. Northeastern Sichuan, Southern Sichuan and the Chengdu Plain consistently exhibited better performance, while Northwest Sichuan remained the region with the weakest performance. These findings suggest that improving NUE in Sichuan province necessitates region- and crop-specific strategies, with priority being given to stabilizing the high NUE of rice and rapeseed, while targeting infrastructure improvement and precision fertilizer management in wheat-dominated and low-efficiency areas.

1. Introduction

Nitrogen (N) serves as a vital nutrient element for crop growth, with roughly half of the world’s grain production dependent on the application of synthetic N fertilizers. However, N use efficiency (NUE) varies widely across the globe. A global meta-analysis of 3586 observations from 261 peer-reviewed papers reported that the mean nitrogen recovery efficiency across major cereals was 39%, with crop-specific values of 42% for rice and wheat and 36% for maize [1]. Although recent estimates vary by methodology, the United States generally exhibits higher NUE (around 45%) than China (around 40%) and India (around 22–25%), reflecting substantial variations in fertilization management, soil conditions and policy frameworks. The disparities in NUE suggest that there are substantial variations among countries in terms of fertilization management techniques, soil conditions and policy frameworks.
Enhancing NUE has become a priority in China to balance food security goals with the need to reduce fertilizer inputs and promote sustainable agriculture [2,3]. While recent national evaluations indicate a gradual improvement in crop-production NUE, substantial spatial heterogeneity persists among regions and farming systems [4]. Sichuan province, which is a key producer of grain and oil crops in western China and has long been renowned as the ‘granary of the land’, presents a compelling case for investigation.
As one of China’s 13 major grain-producing provinces [5], Sichuan’s agricultural output is vital. Rice, wheat, maize and rapeseed occupied more than 50% of the province’s total crop-sown area, underpinning regional food security and economic growth. Despite their importance, the NUE of these crops in Sichuan is reported to be relatively low compared to the national average [6]. Furthermore, rapeseed cultivation, a significant component of local agriculture, also struggles with low N fertilizer efficiency [7], falling short of the targets for green and efficient agricultural development [8]. Low NUE leads to considerable nutrient losses, raising production costs and intensifying environmental pressures [9].
Existing research has shed light on NUE patterns at the national scale in China [10,11] or within specific regional contexts [12]. Nonetheless, a gap remains in studies that systematically examined the long-term spatiotemporal trends in NUE for multiple staple crops at the provincial level, and that further dissected these patterns across distinct socio-economic zones. A detailed, region-specific analysis was crucial for developing targeted, effective nutrient management policies.
To address this gap, our study had three primary objectives: (1) to assess the NUE of rice, wheat, maize, and rapeseed in Sichuan Province from 2008 to 2022 using a regional N balance framework; (2) to analyze the temporal dynamics and crop-specific differences in provincial NUE; and (3) to elucidate the spatial heterogeneity of NUE across Sichuan’s five major economic zones. By leveraging long-term statistical data and a macro-scale evaluation approach, this research aimed to identify the key drivers of NUE change in Sichuan. The results are intended to inform differentiated strategies for reducing fertilizer use, increasing efficiency, and promoting sustainable agricultural practices in Sichuan and comparable agricultural regions. Unlike plot-level indicators such as recovery efficiency or agronomic efficiency, the regional N balance approach is more suitable for long-term, large-scale assessments based on statistical yearbook data, as it integrates all major N inputs and outputs within the system boundary.

2. Materials and Methods

2.1. Overview of the NUE Framework

The regional N balance approach assumes that all N inputs are fully accounted for and that changes in soil N stocks are negligible over the multi-year period. It does not track N losses via volatilization, leaching, or denitrification. Thus, the estimated NUE represents an apparent efficiency at the macro level. This limitation is acceptable for comparing long-term trends across regions and crops, but the absolute NUE values should be interpreted as relative indicators rather than true physiological efficiencies. In this study, NUE in agronomy quantifies the efficiency with which crops convert N inputs into harvested products. Common metrics derived from field-plot experiments include Recovery Efficiency (RE), Agronomic Efficiency (AE), Partial Factor Productivity (PFP), and Physiological Efficiency (PE) [3,13,14,15,16]. However, these metrics typically require controlled treatment-level data (e.g., yield and N uptake with and without fertilizer application), making them less suitable for long-term, regional-scale comparisons based on statistical yearbook data.
Therefore, this study adopted a regional N balance approach to assess NUE. This macro-scale method defines NUE as the ratio of total crop N output (harvested N) to total N input within a specific agricultural system over a given period and area [2,11,17]. The formula is as follows:
N U E = N y i e l d N i n p u t = C r o p   N   u p t a k e T o t a l   N   i n p u t
where N output (Crop N uptake) is the total amount of N removed by the harvested crop and its residues, and N input is the sum of all direct and indirect N sources entering the cropping system.

2.2. Data Sources and Processing

2.2.1. Data Collection

The primary data covered the period from 2008 to 2022 and included crop-sown area, yield, and fertilizer application for Sichuan Province and its five major economic zones. Data on crop area and production were obtained from the Sichuan Statistical Yearbook [18]. Crop-specific fertilizer input data (e.g., application rates of urea, ammonium carbonate, and compound fertilizers per hectare) were sourced from the National Compilation of Agricultural Product Cost–Benefit Data (Sichuan volume) [19]. These datasets were matched by crop type (rice, wheat, maize, rapeseed), year, and region to construct a panel for N balance calculation.

2.2.2. Calculation Procedures

This regional N balance framework provides a consistent basis for comparing NUE across different crops, time periods, and regions with varying agricultural systems, as it integrates all major N sources and outputs within the defined system boundary. The calculation of regional NUE involved four consecutive steps:
(1)
Crop N Uptake (N output): The N output for each crop was estimated by multiplying the crop yield by its specific N concentration parameters, accounting for both the harvested grain/seeds and the residual straw. The parameters, including N content in the harvest, N content in the residue, and the residue-to-harvest ratio, were compiled from published regional N-balance studies and agronomic literature (Table 1 and Table 2) [11,12,20].
(2)
Total N Input (N input): Total N input was calculated as the sum of direct and indirect inputs.
Total N input = Direct N input + Indirect N input
(3)
Direct N Input: This included synthetic N fertilizers (urea, ammonium carbonate, compound fertilizers) and farmyard manure. Due to the lack of detailed organic fertilizer records in statistical sources, the manure component was estimated using provincial livestock population data and standard excretion parameters [2,21,22,23,24,25,26]. Provincial total manure N was allocated to each crop proportionally to its sown area, assuming uniform application intensity across crops in the absence of crop-specific manure use data.
Direct N input = Synthetic N fertilizer + Farmyard manure
(4)
Indirect N Input: This comprised biological N fixation and atmospheric N deposition. Crop-specific biological N fixation coefficients were applied: 30 kg N ha−1 yr−1 for rice, and 15 kg N ha−1 yr−1 for wheat, maize, and rapeseed [6]. For rice, the value of 30 kg N ha−1 yr−1 accounts for associative nitrogen fixation by rhizosphere bacteria in flooded paddy systems, following established regional N balance studies [11]. Atmospheric N deposition was set at 20.05 kg N ha−1 yr−1 for 2008–2010 and 20.40 kg N ha−1 yr−1 for 2011–2022, based on regional estimates [27,28].
Indirect N input = Biological N fixation + Atmospheric N deposition

2.3. Regional Aggregation

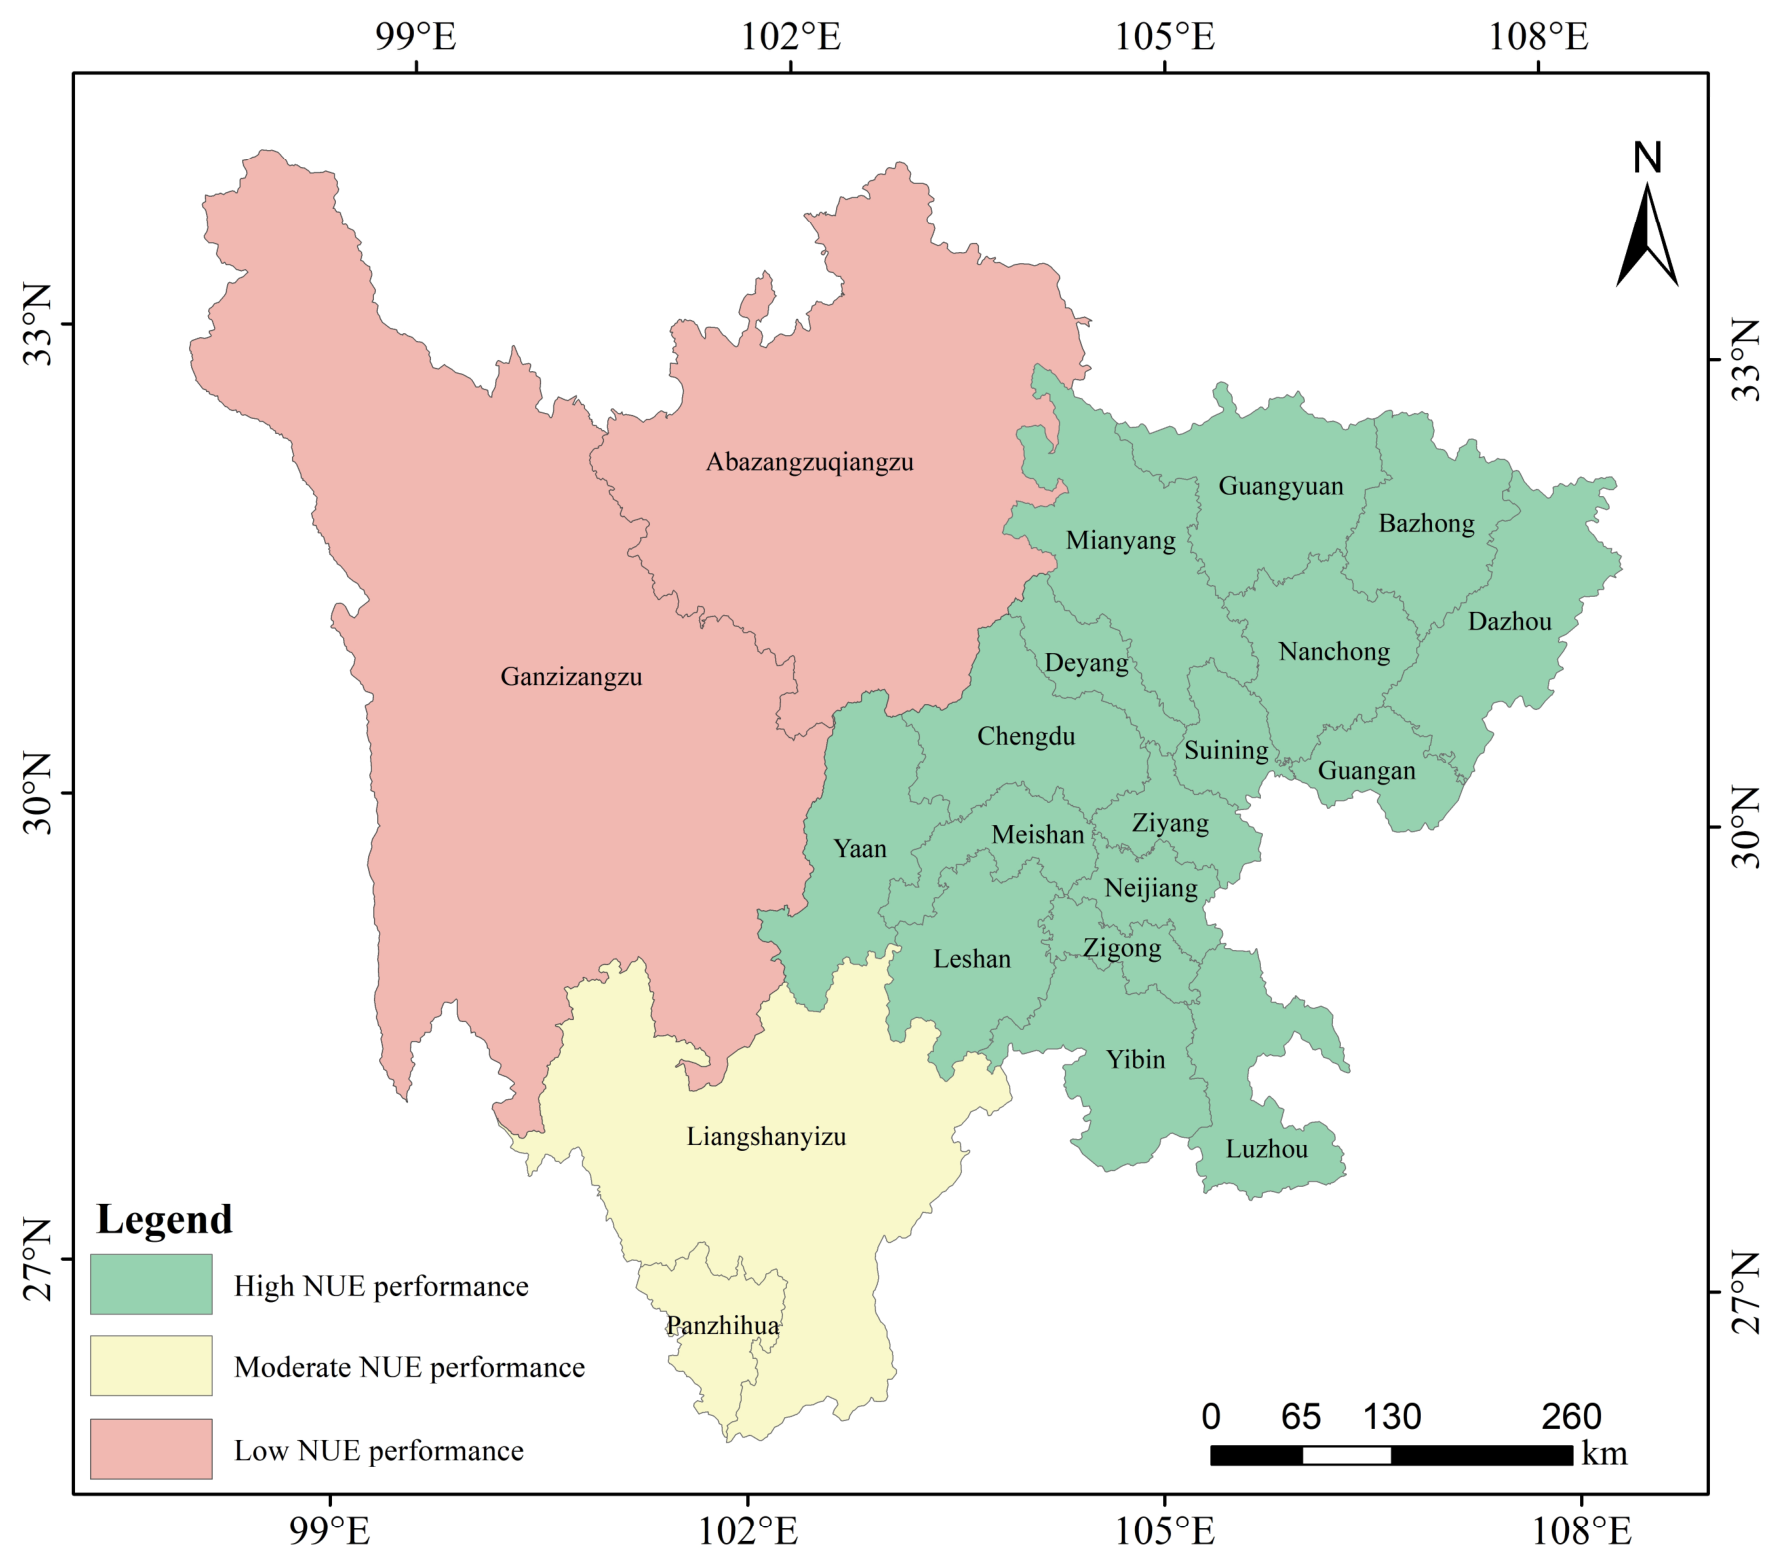
The calculated crop N uptake and total N input for each crop, year, and prefecture-level city were aggregated to the provincial level and the five economic zones (Chengdu Plain, Southern Sichuan, Northeastern Sichuan, Panxi, Northwest Sichuan) for analysis. The spatial distribution of the five economic zones is shown in Figure 1.

2.4. Uncertainty and Parameter Sensitivity
The coefficients for N content, residue ratios, and biological fixation were drawn from the literature and assumed constant across time and space. This may introduce bias if regional differences in crop varieties or management practices exist. However, given the absence of zone-specific parameters for the entire study period, we adopted a conservative approach. A sensitivity analysis (e.g., varying key coefficients by ±20%) showed that relative spatiotemporal patterns remained consistent. In addition to parameter uncertainty, the regional N balance framework does not explicitly account for N losses via ammonia volatilization, nitrate leaching, or denitrification. Consequently, the estimated NUE represents an apparent efficiency at the system boundary rather than true physiological efficiency. If the proportion of N losses varies systematically across regions (e.g., higher leaching in the mountainous Northwest Sichuan due to shallower soils and heavier rainfall), the absolute NUE values may be biased. However, our primary conclusions-regarding the temporal three-stage pattern, the relative ranking among crops, and the classification of regions into high-, moderate-, and low-efficiency categories-are expected to be robust, because the framework applies the same accounting rules consistently across all regions and years. The observed spatial heterogeneity is so large that it is unlikely to be overturned by unmodeled loss processes alone.
Figure 1. Spatial distribution of the five major economic zones in Sichuan Province. Colors indicate relative NUE performance levels: green—high efficiency (>35%), yellow—moderate efficiency (25–35%), red—low efficiency (<25%). CP: Chengdu Plain; SS: Southern Sichuan; NES: Northeastern Sichuan; PX: Panxi; NWS: Northwest Sichuan.
Sustainability 18 06071 g001

3. Results

3.1. Temporal Dynamics of NUE at the Provincial Level

3.1.1. Provincial-Scale Temporal Dynamics of NUE

Temporal evolution of NUE for rice, wheat, maize, and rapeseed in Sichuan Province from 2008 to 2022 was depicted (Figure 2). Although crop-specific disparities in magnitude were evident, all four crops generally followed a similar three-stage pattern: a phase of gradual increase from 2008 to 2014, a significant upward surge in 2015, and a period of high-level fluctuations after 2016.
From 2008 to 2014, the NUE of all crops remained at a relatively low level but exhibited a gradual upward trend. Rice NUE ranged from 32.80% to 38.26%, wheat remained the least efficient (19.17–21.89%), maize fluctuated between 24.33% and 29.37%, and rapeseed maintained a relatively higher NUE (28.27% to 33.04%). The annual growth rates during this period were all below 2.5%, suggesting incremental rather than rapid improvement.
A distinct turning point occurred in 2015. Compared to 2014, all four crops exhibited a substantial increase in NUE: rice from 37.99% to 49.20% (a rise of 11.21 percentage points), wheat from 21.89% to 28.12% (+6.23 pp), maize from 29.07% to 37.16% (+8.09 pp), and rapeseed from 33.04% to 43.46% (+10.42 pp) (Figure 2). This concurrent leap suggests a province-wide shift in N management rather than crop-specific random variation.
Following 2016, NUE levels remained higher than the pre-2015 baseline but exhibited crop-specific fluctuations. Rice peaked at 49.22% in 2016 and then gradually declined. Wheat showed an upward fluctuation, reaching 31.77% in 2021 before reverting to 28.77% in 2022. Maize exhibited the most pronounced volatility, with its NUE dropping from a peak of 43.18% in 2017 to 35.46% in 2022. Rapeseed remained relatively stable within the range of 42.28–47.13%.
Overall, the provincial findings indicate that 2015 marked a structural break in NUE trends. The subsequent period was characterized not by a reversion to the pre-2015 baseline but by high-level adjustments, suggesting that the efficiency gains realized around 2015 were at least partially sustained.

3.1.2. Crop-Specific Differences in NUE

Despite the common three-phase pattern, significant crop-specific disparities in the magnitude, peak values, and post-2015 stability of NUE were evident (Table 3). This indicates that crop type was a crucial source of heterogeneity in provincial NUE performance.
Rice maintained the highest average NUE throughout the study period at 40.45%. It experienced a sharp increase in 2015, reached its peak of 49.22% in 2016, and subsequently declined gradually, indicating both a high efficiency level and relative stability (Table 3).
Wheat consistently demonstrated the lowest NUE, with an average of only 25.43%—approximately 15 percentage points lower than rice. Although wheat also increased significantly in 2015, its subsequent trend was more erratic, reflecting a weaker and less stable response compared to other crops.
Maize occupied an intermediate position with an average NUE of 33.29% but exhibited the most substantial post-2015 fluctuations. It reached its peak of 43.18% in 2017 and then declined continuously, showing the weakest post-peak stability among the four crops (Table 3).
Rapeseed ranked second in average NUE at 38.36% and displayed the most stable trajectory after 2015. Following the 2015 increase, rapeseed NUE remained within a relatively narrow high-efficiency range, peaking at 47.13% in 2018.

3.2. Spatiotemporal Evolution Across the Five Major Economic Zones

3.2.1. Regional Temporal Trajectories

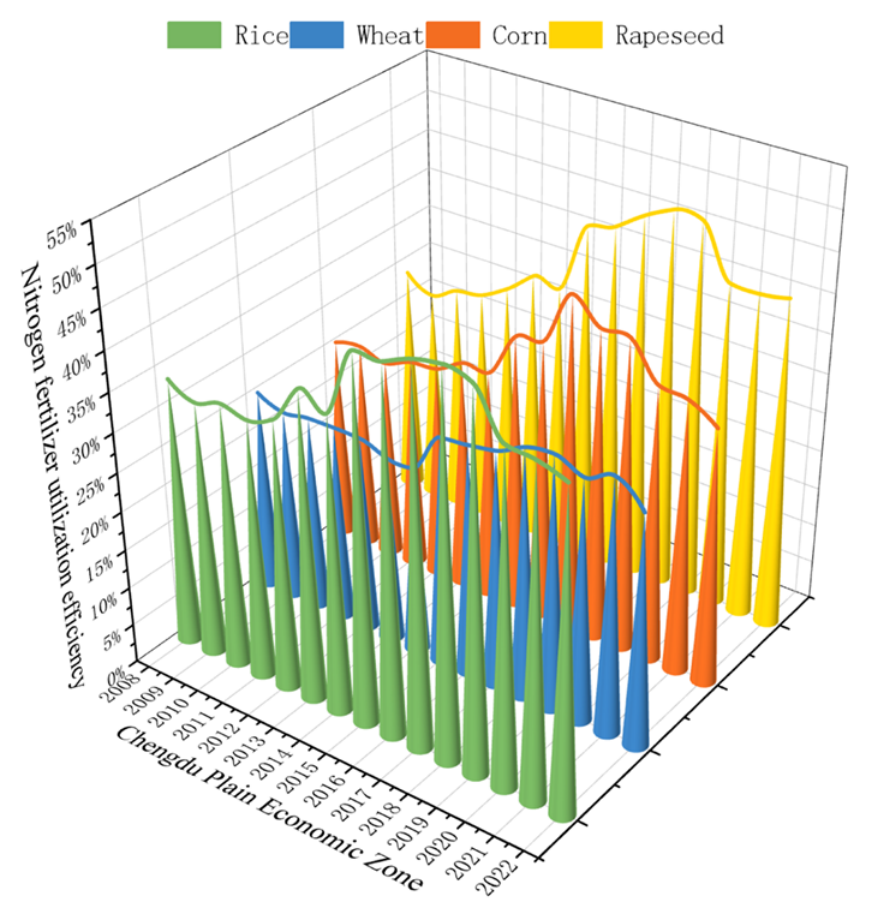
All five economic zones demonstrated the general pattern of gradual improvement (Figure 3, Figure 4, Figure 5, Figure 6 and Figure 7), a significant leap in 2015, and subsequent high-level fluctuations. However, the magnitude of the increase, absolute efficiency levels, and post-peak stability varied considerably. Chengdu Plain: As the core agricultural area, this region exhibited relatively stable NUE trajectories. The crop efficiency pattern consistently followed: rice > rapeseed > maize > wheat (Figure 3). From 2008–2014, the NUE of rice and rapeseed improved more rapidly than that of maize and wheat. After the 2015 surge, all crops entered a high-efficiency stage, peaking around 2018. The post-peak decline was moderate, indicating a relatively strong buffering capacity against short-term efficiency fluctuations (Table 4).
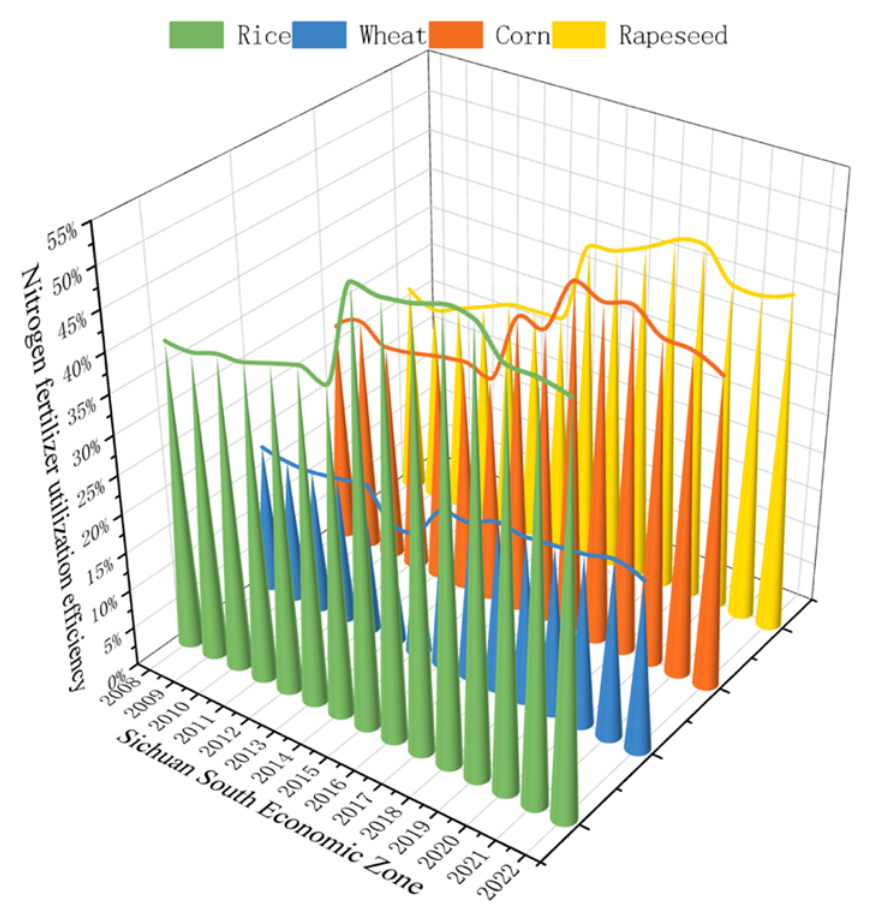
Southern Sichuan: This warm, humid region also followed the order: rice > rapeseed > maize > wheat (Figure 4). Rice remained the most efficient crop, reaching the highest provincial regional peak of 54.36% in 2019. Wheat NUE remained consistently low. After 2015, rice and rapeseed maintained relatively high NUE, while maize and wheat showed weaker and less stable performance (Table 5).
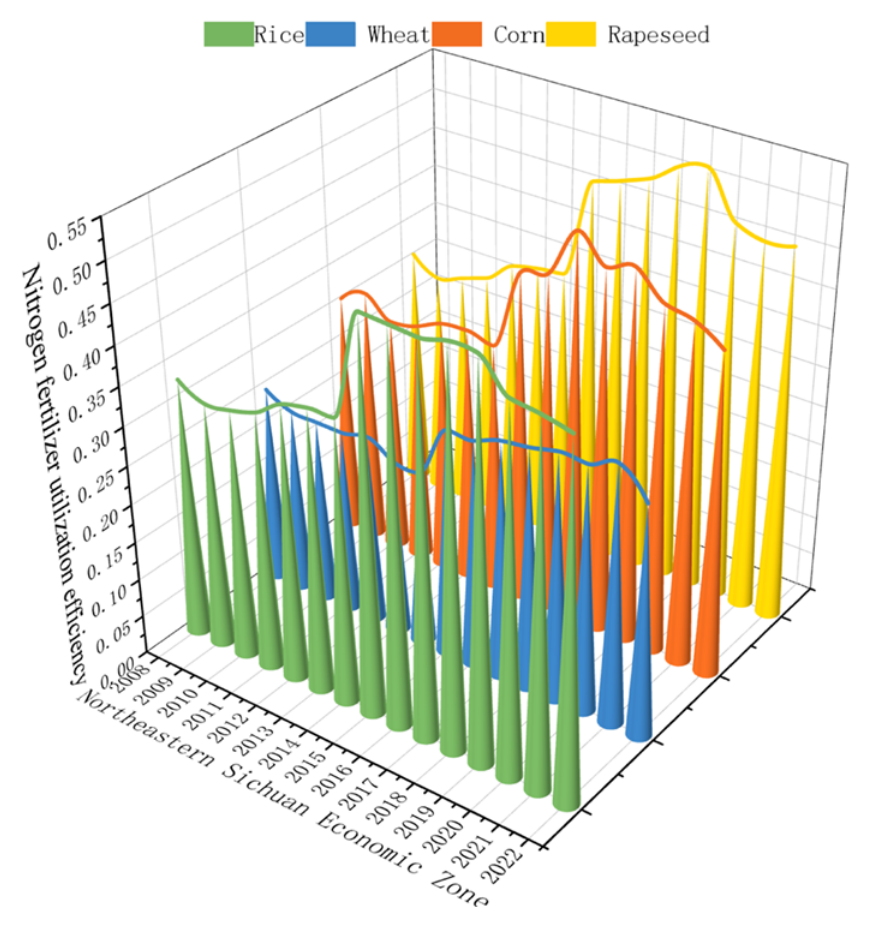
Northeastern Sichuan: This region exhibited the highest overall NUE among the five zones and the most distinct high-efficiency pattern after 2015. The crop ranking here differed: rapeseed > rice > maize > wheat (Figure 5). All four crops reached relatively high peaks in 2019 (rapeseed: 53.75%, rice: 50.00%, maize: 47.59%, wheat: 32.00%). Thus, this region combined high absolute efficiency with a strong post-2015 response (Table 6).

3.2.2. Cross-Regional Comparison of Efficiency Levels and Stage-Specific Growth Rates

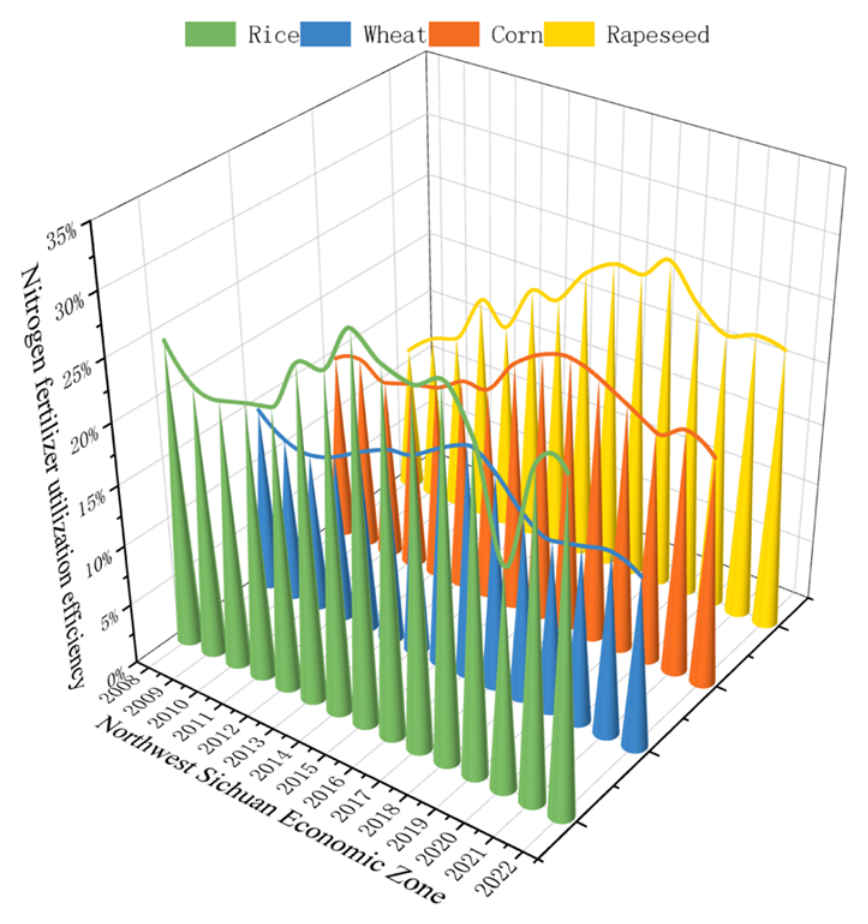
Cross-regional comparison revealed distinct spatial heterogeneity in crop efficiency (Figure 6; Table 7). For rice, the highest NUE was observed in Southern Sichuan (54.36%), while the lowest was in Northwest Sichuan (27.18%). For rapeseed and maize, the highest values were recorded in Northeastern Sichuan (53.75% and 47.59%, respectively), with Northwest Sichuan again showing the lowest. Wheat presented a narrower regional variation compared to other crops and consistently exhibited the lowest efficiency across all regions.
The stage-specific growth rates further indicated that low-efficiency regions often experienced more rapid improvement during 2008–2014 due to a lower initial baseline, but were also more susceptible to decline after 2016 (Figure 6). Northwest Sichuan generally showed the fastest early-stage growth but also the most significant post-2016 decline. In contrast, Panxi exhibited relatively moderate early growth but the lowest decline rates after 2016, indicating stronger temporal resilience.
Overall, the five economic zones could be classified into three broad categories: (1) high-efficiency regions with strong post-2015 performance (Northeastern Sichuan, Southern Sichuan, Chengdu Plain); (2) a region with moderate efficiency but high stability (Panxi); and (3) a region with persistently low efficiency and weak stability (Northwest Sichuan). This spatial patterning suggests that the province-wide policy intervention in 2015 had extensive coverage, but the magnitude and persistence of the response were mediated by regional production conditions, infrastructure, and technology diffusion capacity.

3.2.3. Panxi Economic Zone

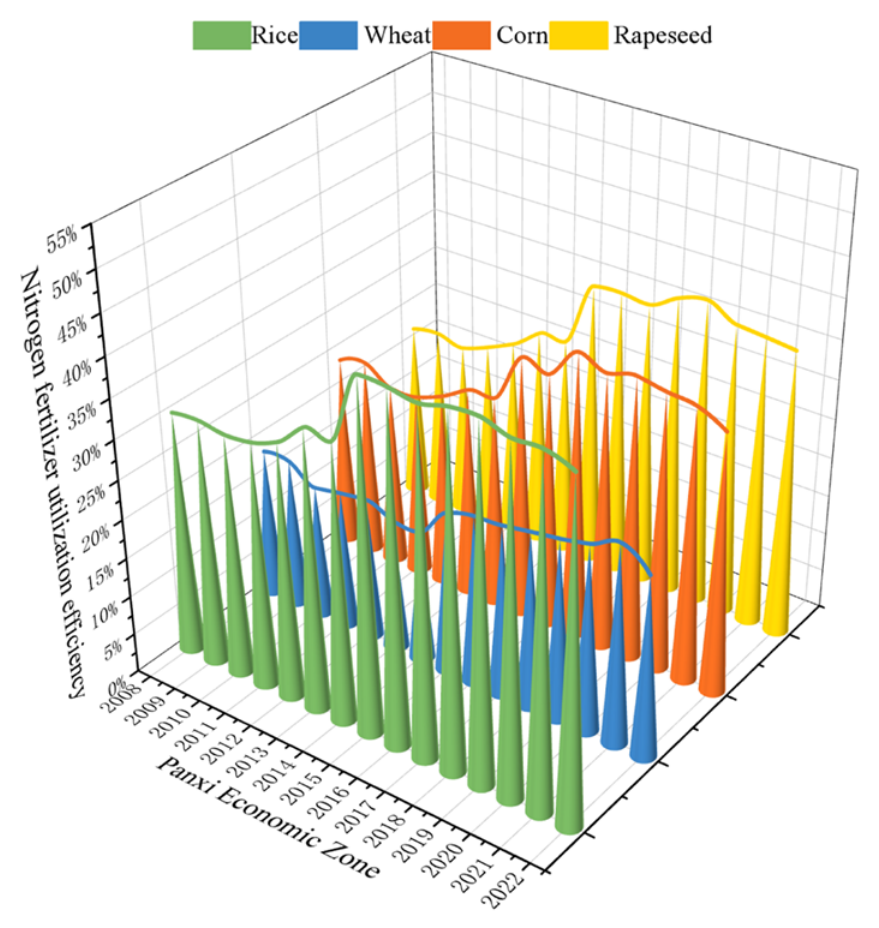
The Panxi zone exhibited moderate NUE levels compared to the high-efficiency regions, but showed the smallest post-peak decline among all zones (Figure 7, Table 8). This suggests that while absolute efficiency was not the highest, temporal stability was a distinguishing feature of this region.

4. Discussion

Over recent decades, China’s remarkable agricultural achievements have led to substantial improvements in food supply and farm income, enabling it to feed approximately 20% of the global population [29]. The nation comprises 23 provinces, five autonomous regions, four municipalities, and two special administrative regions [30]. Prior research indicates significant spatial variation in NUE across China [10]. Currently, most Chinese farmers still rely on empirical knowledge to determine fertilization rates [31], resulting in the prevalent “high input-high output” paradigm. Over the years, the Chinese government introduced a series of policies to improve NUE and change farmers’ N fertilization practices. Notable examples included the “Action Plan for Zero Growth of Fertilizer Use by 2020” launched in 2015 [32], the “Technical Guidelines for Green Agricultural Development (2018–2030)” in 2018 [33], and the “14th Five-Year National Plan for Agricultural Green Development” in 2021. Among these, the 2015 “Zero Growth Action Plan” drew particular attention as it reflected the government’s firm commitment to curbing excessive N fertilizer input and enhancing NUE in agriculture [34].
Our analysis revealed that the average provincial NUE for the four crops followed a distinct three-stage trajectory: a period of gradual increase from 2008 to 2014, a significant surge in 2015, and a phase of high-level fluctuations after 2016. The synchronous increase in NUE across all crops in 2015 coincides with the launch of China’s ‘Zero Growth Action Plan’. While this temporal alignment is suggestive, causality cannot be firmly established with our aggregated data. Alternative or contributing factors—such as favorable weather, changes in fertilizer composition, or improved extension services—may also have played a role. Thus, we present this as a plausible hypothesis rather than a definitive causal attribution. The subsequent period of elevated, albeit fluctuating, NUE indicated that these gains were at least partially sustained and did not revert to pre-2015 baselines. This pattern aligned with national studies reporting gradual improvements in crop-production NUE in recent years [4,11]. However, our findings further highlighted pronounced within-province heterogeneity, which provincial or national averages might obscure [17].
The Chengdu Plain Economic Zone, as the core agricultural area of Sichuan, demonstrated relatively stable NUE trajectories. However, for economic crops, the NUE in the Chengdu Plain remained relatively low, generally below 30% [12]. The trends suggest that 2015 was a pivotal year for enhancing NUE across crops. Following 2015, the NUE of rice, wheat, maize, and rapeseed increased significantly, with the improvement in rapeseed being particularly notable. Rapeseed’s relatively high and stable NUE after 2015 may be attributed to its deep rooting system, long growing season, and responsiveness to improved split-application techniques, which enhance N uptake efficiency. Crop-specific differences were equally significant. Rice and rapeseed consistently outperformed maize and wheat, though likely for different reasons. Rice likely benefited from well-established management systems and more standardized cultivation practices in its major production areas. Rapeseed, on the other hand, appeared to respond favorably to enhanced fertilization practices, leading to relatively high and stable NUE after 2015. Throughout the study period, wheat remained the worst-performing crop, suggesting its production system in Sichuan did not benefit equally from recent efficiency-enhancing measures. Maize occupied an intermediate position but exhibited the greatest volatility, indicating weaker post-peak stability [13,18].
Regional heterogeneity reflected the combined effects of geography, production conditions, and technology adoption. High-efficiency regions like Northeastern Sichuan, Southern Sichuan, and the Chengdu Plain were predominantly located in the basin and southeastern areas, which enjoyed better soil quality, irrigation conditions, and access to extension services. In contrast, Northwest Sichuan was constrained by high altitude, fragmented farmland, limited thermal resources, and weaker agricultural infrastructure, all of which hindered the implementation and sustainability of advanced nutrient management practices [35]. Panxi presented an interesting case; although its absolute efficiency was not the highest, its post-peak decline was the smallest, suggesting that stability should also be considered when evaluating regional NUE performance. The synchronized surge around 2015 aligned with the timeline of China’s fertilizer reduction initiatives. However, the declines or fluctuations observed after the peak years suggest that policy-driven improvements might diminish over time if not reinforced by local agronomic adaptation, infrastructure support, and continuous technical services. Therefore, the enhancement of NUE should be viewed not as a one-time policy outcome but as an ongoing process requiring sustained, region-specific management [11,17].
This research also has several limitations. First, the analysis was based on statistical data and a regional N balance framework rather than field-measured plot data. Consequently, the estimated NUE values should be regarded as macro-level indicators rather than direct experimental observations. Second, despite accounting for indirect N inputs, the lack of detailed organic fertilizer data might have influenced the estimation of total N input in certain areas. Third, climate variability, particularly differences in rainfall and temperature across years and regions, was not explicitly integrated into the analytical framework. Future studies should, therefore, combine field experiments, high-resolution management data, and climate information to validate the robustness of the observed temporal turning points and regional disparities.
The post-2016 decline in NUE for rice and maize could be linked to several non-exclusive factors: interannual climate variability (e.g., drought or heat stress reducing yields), relaxation of policy enforcement after initial targets were met, and rising input costs leading farmers to adjust fertilization rates suboptimally. Further investigation with farm-level panel data is needed to disentangle these effects. Future work should employ process-based models [36,37,38] to disentangle the contributions of climate, management, and soil properties to the observed NUE dynamics, thereby overcoming the limitations of the statistical balance framework.

5. Conclusions

This study investigated the NUE of rice, wheat, maize, and rapeseed in Sichuan province from 2008 to 2022, analyzing temporal trends, crop-specific differences, and spatial heterogeneity across economic zones. We draw three main findings.
First, at the provincial level, the NUE for all four crops exhibited a distinct three-stage temporal pattern: a phase of gradual increase from 2008 to 2014, a significant surge in 2015, and a period of high-level fluctuations thereafter without a return to pre-2015 baselines.
Second, substantial crop-specific disparities were observed. Rice had the highest average NUE over the full period, although it declined after 2016; rapeseed showed both high NUE and notable stability after 2015. In contrast, wheat exhibited the lowest efficiency throughout the study period. Maize occupied an intermediate position but displayed the greatest volatility, indicating weaker post-peak stability.
Third, a pronounced spatial heterogeneity in NUE was identified across Sichuan’s five major economic zones. Northeastern Sichuan, Southern Sichuan, and the Chengdu Plain consistently demonstrated better performance. Northwest Sichuan remained the region with the weakest and least sustained efficiency gains. The Panxi region, while not achieving the highest absolute efficiency, showed the strongest stability after the 2015 turning point.
These results suggest that future strategies for enhancing N management in Sichuan should move beyond uniform fertilizer-reduction targets. Differentiated approaches are necessary. For high-performing crops (e.g., rice, rapeseed) and regions, the focus should be on consolidating achievements through refined nutrient management. For low-efficiency crops like wheat and structurally constrained regions such as Northwest Sichuan, efforts could prioritize improving foundational production conditions, strengthening technology extension, and adopting more adaptable fertilizer practices. This study has limitations: (1) NUE estimates rely on statistical data and literature-derived coefficients, which may contain uncertainties; (2) the regional N balance framework does not account for interannual N losses or residue management variations; and (3) causal attribution of observed trends requires field-level data and process-based modeling. Future research should combine high-resolution management data, climate information, and deterministic models to validate and extend our findings.

Author Contributions

G.Z. analyzed the data and wrote the manuscript; T.D., Y.Y. and Y.C. participated in data analysis; X.G. and Y.C. drafted the work and revised the manuscript critically. All authors have read and agreed to the published version of the manuscript.

Funding

This study was financially supported by the Project approved in 2025 by the Sichuan Provincial Engineering Research Center of Resource Utilization for Agricultural and Forestry Wastes (NLFQW202514), the General project of the Shipping Logistics Collaborative Innovation Center in the Upper reaches of Yangtze River (XTCX2025A05), and the Scientific Research and Innovation Team Program of Sichuan University of Science and Technology (SUSE652B001).

Institutional Review Board Statement

Not applicable.

Informed Consent Statement

Not applicable.

Data Availability Statement

The datasets generated and/or analyzed during the current study are available from the corresponding author on reasonable request.

Conflicts of Interest

The authors declare no conflict of interest.

References

  1. Yu, X.; Keitel, C.; Zhang, Y.; Wangeci, A.N.; Dijkstra, F.A. Global meta-analysis of nitrogen fertilizer use efficiency in rice, wheat and maize. Agric. Ecosyst. Environ. 2022, 338, 108089. [Google Scholar] [CrossRef]
  2. Chen, X.; Ma, L.; Ma, W.; Wu, Z.; Cui, Z.; Hou, Y.; Zhang, F. What has caused the use of fertilizers to skyrocket in China? Nutr. Cycl. Agroecosyst. 2018, 110, 241–255. [Google Scholar] [CrossRef]
  3. Roberts, T.L. Improving nutrient use efficiency. Turk. J. Agric. For. 2008, 32, 177–182. [Google Scholar]
  4. Yan, X.; Ti, C.; Vitousek, P.; Chen, D.; Leip, A.; Cai, Z.; Zhu, Z. Fertilizer nitrogen recovery efficiencies in crop production systems of China with and without consideration of the residual effect of nitrogen. Environ. Res. Lett. 2014, 9, 095002. [Google Scholar] [CrossRef]
  5. Wang, S.; Wu, H.; Li, J.; Xiao, Q.; Li, J. Assessment of the effect of the main grain-producing areas policy on China’s food security. Foods 2024, 13, 654. [Google Scholar] [CrossRef] [PubMed]
  6. Liu, Z.; Wang, Z.; Wu, G.; Chen, J.; He, J.; Wu, M.; Wang, D.; Wei, X.; Tian, P.; Wu, Z.; et al. Optimizing the Ratio of One-Off Slow-Release Fertilizer Can Improve the Nitrogen Use Efficiency and Yield of Rice Under the Condition of Nitrogen Reduction. Plants 2025, 14, 3650. [Google Scholar] [CrossRef]
  7. Zhang, Y.; Mei, H.; Yan, Z.; Hu, A.; Wang, S.; Feng, C.; Chen, K.; Li, W.; Zhang, X.; Ji, P.; et al. Year-round production of cotton and wheat or rapeseed regulated by different nitrogen rates with crop straw returning. Agronomy 2023, 13, 1254. [Google Scholar] [CrossRef]
  8. Xie, W.; Zhu, A.; Ali, T.; Zhang, Z.; Chen, X.; Wu, F.; Huang, J.; Davis, K.F. Crop switching can enhance environmental sustainability and farmer incomes in China. Nature 2023, 616, 300–305. [Google Scholar] [CrossRef]
  9. Altuntaş, Ö. Application of AMF under continuous and diverse fertilization regime: Case studies. In Arbuscular Mycorrhizal Fungi in Sustainable Agriculture: Inoculum Production and Application; Springer: Singapore, 2024; pp. 333–360. [Google Scholar]
  10. Chen, B.; Ren, C.; Wang, C.; Duan, J.; Reis, S.; Gu, B. Driving forces of nitrogen use efficiency in Chinese croplands on county scale. Environ. Pollut. 2023, 316, 120610. [Google Scholar] [CrossRef]
  11. Yan, X.; Xia, L.; Ti, C. Temporal and spatial variations in nitrogen use efficiency of crop production in China. Environ. Pollut. 2022, 293, 118496. [Google Scholar] [CrossRef]
  12. Hou, L.; Ma, C.; Liu, T. Revealing Greenhouse Gas Emission and Nitrogen Fertilizer Destination: A Case Study in Chengdu Plain Cultivation Industry. Sustainability 2024, 16, 6073. [Google Scholar] [CrossRef]
  13. Semenov, M.A.; Jamieson, P.D.; Martre, P. Deconvoluting nitrogen use efficiency in wheat: A simulation study. Eur. J. Agron. 2007, 26, 283–294. [Google Scholar] [CrossRef]
  14. Tilman, D.; Cassman, K.G.; Matson, P.A.; Naylor, R.; Polasky, S. Agricultural sustainability and intensive production practices. Nature 2002, 418, 671–677. [Google Scholar] [CrossRef] [PubMed]
  15. Fixen, P.E.; Jin, J.; Tiwari, K.N.; Stauffer, M.D. Capitalizing on multi-element interactions through balanced nutrition-A pathway to improve nitrogen use efficiency in China, India and North America. Sci. China Ser. C Life Sci. 2025, 48, 780–790. [Google Scholar] [CrossRef] [PubMed]
  16. Novoa, R.; Loomis, R.S. Nitrogen and plant production. Plant Soil 1981, 58, 177–204. [Google Scholar] [CrossRef]
  17. Zhang, X.; Davidson, E.A.; Mauzerall, D.L.; Searchinger, T.D.; Dumas, P.; Shen, Y. Managing nitrogen for sustainable development. Nature 2015, 528, 51–59. [Google Scholar] [CrossRef]
  18. Sichuan Provincial Bureau of Statistics. Available online: https://tjj.sc.gov.cn/scstjj/c105855/nj.shtml (accessed on 10 May 2026).
  19. National Development and Reform Commission. Available online: https://www.ndrc.gov.cn/xwdt/ztzl/ncpdc70zn/202408/t20240805_1392196.html (accessed on 10 May 2026).
  20. Narits, L. Effect of nitrogen rate and application time to yield and quality of winter oilseed rape. Brassica napus L. var. oleifera subvar. biennis. Agron. Res. 2010, 8, 681–686. [Google Scholar]
  21. Liu, Y.; Ma, J.; Ding, W.; He, W.; Lei, Q.; Gao, Q.; He, P. Temporal and spatial variation of potassium balance in agricultural land at national and regional levels in China. PLoS ONE 2017, 12, e0184156. [Google Scholar] [CrossRef]
  22. Pan, H.; Zheng, X.; Wu, R.; Liu, X.; Xiao, S.; Sun, L.; Hu, T.; Gao, Z.; Yang, L.; Huang, C.; et al. Agriculture related methane emissions embodied in China’s interprovincial trade. Renew. Sustain. Energy Rev. 2024, 189, 113850. [Google Scholar] [CrossRef]
  23. Yin, H.; Zhao, W.; Li, T.; Cheng, X.; Liu, Q. Balancing straw returning and chemical fertilizers in China: Role of straw nutrient resources. Renew. Sustain. Energy Rev. 2018, 81, 2695–2702. [Google Scholar] [CrossRef]
  24. Yu, J.; Peng, S.; Chang, J.; Ciais, P.; Dumas, P.; Lin, X.; Piao, S. Inventory of methane emissions from livestock in China from 1980 to 2013. Atmos. Environ. 2018, 184, 69–76. [Google Scholar] [CrossRef]
  25. Zhang, D.; Shen, J.; Zhang, F.; Li, Y.; Zhang, W. Carbon footprint of grain production in China. Sci. Rep. 2017, 7, 4126. [Google Scholar] [CrossRef]
  26. Zhang, L.; Tian, H.; Shi, H.; Pan, S.; Qin, X.; Pan, N.; Dangal, S.R. Methane emissions from livestock in East Asia during 1961−2019. Ecosyst. Health Sustain. 2021, 7, 1918024. [Google Scholar] [CrossRef]
  27. Yu, G.; Jia, Y.; He, N.; Zhu, J.; Chen, Z.; Wang, Q.; Piao, S.; Liu, X.; He, H.; Guo, X.; et al. Stabilization of atmospheric nitrogen deposition in China over the past decade. Nat. Geosci. 2019, 12, 424–429. [Google Scholar] [CrossRef]
  28. Liu, X.; Zhang, Y.; Han, W.; Tang, A.; Shen, J.; Cui, Z.; Vitousek, P.; Erisman, J.W.; Goulding, K.; Christie, P.; et al. Enhanced nitrogen deposition over China. Nature 2013, 494, 459–462. [Google Scholar] [CrossRef]
  29. Sha, Z.; Liu, H.; Wang, J.; Ma, X.; Liu, X.; Misselbrook, T. Improved soil-crop system management aids in NH3 emission mitigation in China. Environ. Pollut. 2021, 289, 117844. [Google Scholar] [CrossRef]
  30. Ding, Y.; McQuoid, A.; Karayalcin, C. Fiscal decentralization, fiscal reform, and economic growth in China. China Econ. Rev. 2019, 53, 152–167. [Google Scholar] [CrossRef]
  31. Ding, Y.; McQuoid, A.; Karayalcin, C. Estimating regional N application rates for rice in China based on target yield, indigenous N supply, and N loss. Environ. Pollut. 2020, 263, 114408. [Google Scholar] [CrossRef]
  32. Liu, X.; Vitousek, P.; Chang, Y.; Zhang, W.; Matson, P.; Zhang, F. Evidence for a historic change occurring in China. Environ. Sci. Technol. 2016, 50, 505–506. [Google Scholar] [CrossRef] [PubMed]
  33. Mao, H.; Zhou, L.; Ying, R.; Pan, D. Time Preferences and green agricultural technology adoption: Field evidence from rice farmers in China. Land Use Policy 2021, 109, 105627. [Google Scholar] [CrossRef]
  34. Liu, Z.; Zhao, Y.; Guo, S.; Cheng, S.; Guan, Y.; Cai, H.; Mi, G.; Yuan, L.; Chen, F. Enhanced crown root number and length confers potential for yield improvement and fertilizer reduction in nitrogen-efficient maize cultivars. Field Crops Res. 2019, 241, 107562. [Google Scholar] [CrossRef]
  35. Chandio, A.A.; Nasereldin, Y.A.; Anh, D.L.T.; Tang, Y.; Sargani, G.R.; Zhang, H. The impact of technological progress and climate change on food crop production: Evidence from Sichuan—China. Int. J. Environ. Res. Public Health 2022, 19, 9863. [Google Scholar] [CrossRef] [PubMed]
  36. Jia, M.; Lapen, D.R.; Su, D.; Mayer, K.U. Multi-domain reactive transport modeling of GHG emissions from macroporous agricultural soils with a focus on N2O hotspots and hot moments. Water Resour. Res. 2025, 61, e2025WR040588. [Google Scholar] [CrossRef]
  37. Pellegrini, P.; Roberto, R. Crop intensification, land use, and on-farm energy-use efficiency during the worldwide spread of the green revolution. Proc. Natl. Acad. Sci. USA 2018, 115, 2335–2340. [Google Scholar] [CrossRef]
  38. Rateb, A.; Scanlon, B.R.; Pokhrel, Y.; Shrestha, A.; Jia, M.; Peng, B. Freshwater availability in the Mississippi River Basin and adjacent Texas aquifers under human and climate pressures. Earth’s Future 2026, 14, e2025EF006653. [Google Scholar] [CrossRef]
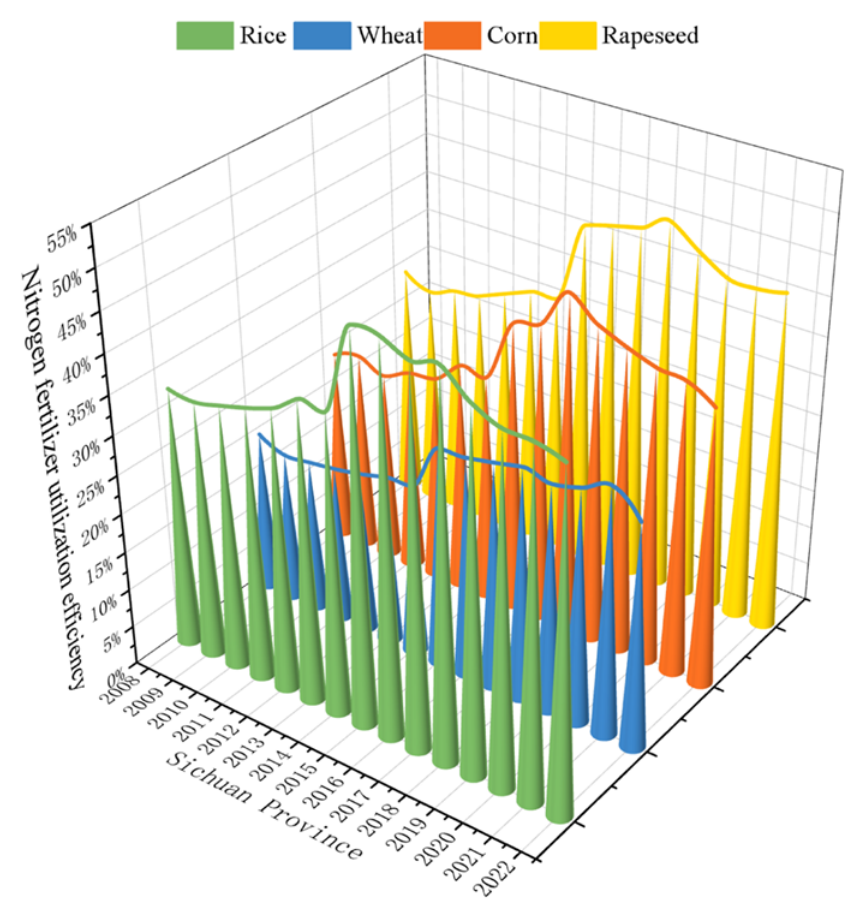
Figure 2. Interannual variation of N fertilizer utilization efficiency of grain and oil crops in Sichuan Province.
Sustainability 18 06071 g002
Figure 3. Interannual variation of N fertilizer utilization efficiency of grain and oil crops in the Chengdu Plain Economic Zone.
Sustainability 18 06071 g003
Figure 4. Interannual variation of N fertilizer utilization efficiency of grain and oil crops in Southern Sichuan Economic Zone.
Sustainability 18 06071 g004
Figure 5. Interannual variation of N fertilizer utilization efficiency of grain and oil crops in Northeastern Sichuan Economic Zone.
Sustainability 18 06071 g005
Figure 6. Interannual variation of N fertilizer utilization efficiency of grain and oil crops in the Northwest Sichuan Economic Zone.
Sustainability 18 06071 g006
Figure 7. Interannual variation of N fertilizer utilization efficiency of grain and oil crops in Panxi Economic Zone.
Sustainability 18 06071 g007
Table 1. N uptake of four major crops in China (the residue-to-harvest ratios (1.00 for rice, 2.50 for rapeseed) were derived from regional field surveys in the Sichuan Basin; these values reflect local high-biomass production systems).
CropN content of Harvest (%)
(Seed N Content)
Residue/Harvest RatioN Content of Residue (%)
(Straw N Content)
Rice1.301.000.91
Wheat2.301.200.65
Maize1.501.200.92
Rapeseed3.902.500.87
Table 2. Explanation and statistical description of formula selection and calculation.
Indicator NameIndicator DefinitionCalculation Formula and Explanation
Total N inputkg N ha−1 yr−1Direct N input + Indirect N input
Synthetic N fertilizerkg N ha−1 yr−1Urea + Ammonium carbonate + Compound fertilizer
Farmyard manurekg N ha−1 yr−1Livestock and human excrement
Direct N inputkg N ha−1 yr−1Synthetic N fertilizer + Farmyard manure
Biological N fixationkg N ha−1 yr−130 for rice, and 15 for wheat, maize, and rapeseed
Atmospheric N depositionkg N ha−1 yr−120.05 for 2008–2010, 20.40 for 2011–2022
Indirect N inputkg N ha−1 yr−1Biological N fixation + Atmospheric N deposition
Table 3. The stage change trends of major grain and oil crops in Sichuan Province.
Crop TypeMean ValueMinimum ValueMaximum Value2008–2014 Average Annual Growth Rate2016–2022 Average Annual Growth Rate
Rice40.4532.80 (2009)49.22 (2016)1.92−1.95
Wheat25.4319.17 (2009)31.77 (2021)1.781.63
Maize33.2924.33 (2010)43.18 (2017)2.35−2.86
Rapeseed38.3628.27 (2009)47.13 (2018)1.96−1.42
Table 4. Statistical Characteristics of N Fertilizer Utilization Efficiency (NUE) of Four Major Crops in Chengdu Plain Economic Zone from 2008 to 2022.
Crop TypeMinimum ValueMaximum Value2008–2014 Average Annual Growth Rate2016–2022 Average Annual Growth RatePeak Year
Rice32.37 (2009)48.18 (2018)2.01−2.352018
Wheat27.36 (2009)48.08 (2018)1.98−1.892018
Maize25.62 (2009)39.70 (2018)1.52−2.212018
Rapeseed23.85 (2009)31.95 (2018)1.03−1.762018
Table 5. Statistical Characteristics of N Fertilizer Utilization Efficiency (NUE) of Four Major Crops in the Southern Sichuan Economic Zone from 2008 to 2022.
Crop TypeMinimum ValueMaximum Value2008–2014 Average Annual Growth Rate2016–2022 Average Annual Growth RatePeak Year
Rice38.86 (2009)54.36 (2019)1.68−1.222019
Wheat15.78 (2009)21.49 (2019)0.04−1.682019
Maize27.94 (2009)43.80 (2019)1.42−1.562019
Rapeseed25.62 (2009)45.08 (2019)1.55−1.312019
Table 6. Statistical Characteristics of N Fertilizer Utilization Efficiency (NUE) of Four Major Crops in the Northeastern Sichuan Economic Zone from 2008 to 2022.
Crop TypeMinimum ValueMaximum Value2008–2014 Average Annual Growth Rate2016–2022 Average Annual Growth RatePeak Year
Rice33.27 (2009)50.00 (2019)1.85−1.922019
Wheat22.46 (2009)32.00 (2019)1.56−1.812019
Maize30.44 (2009)47.59 (2019)1.72−1.982019
Rapeseed31.25 (2009)53.75 (2019)1.92−1.782019
Table 7. Statistical Characteristics of N Fertilizer Utilization Efficiency (NUE) of Four Major Crops in the Northwest Sichuan Economic Zone from 2008 to 2022.
Crop TypeMinimum ValueMaximum Value2008–2014 Average Annual Growth Rate2016–2022 Average Annual Growth RatePeak Year
Rice21.65 (2010)27.18 (2018)2.13−3.892018
Wheat11.93 (2010)20.85 (2018)2.89−3.122018
Maize14.74 (2010)17.39 (2018)2.35−3.672018
Rapeseed12.93 (2010)16.36 (2018)2.52−4.012018
Table 8. Statistical Characteristics of N Fertilizer Utilization Efficiency (NUE) of Four Major Crops in Panxi Economic Zone from 2008 to 2022.
Crop TypeMinimum ValueMaximum Value2008–2014 Average Annual Growth Rate2016–2022 Average Annual Growth RatePeak Year
Rice30.56 (2010)44.42 (2019)1.79−1.022019
Wheat22.10 (2010)38.81 (2019)1.85−0.912019
Maize23.15 (2010)35.87 (2019)1.62−0.892019
Rapeseed16.62 (2010)23.07 (2019)1.52−0.942019
Disclaimer/Publisher’s Note: The statements, opinions and data contained in all publications are solely those of the individual author(s) and contributor(s) and not of MDPI and/or the editor(s). MDPI and/or the editor(s) disclaim responsibility for any injury to people or property resulting from any ideas, methods, instructions or products referred to in the content.