Article

Sustainability of Island Pastures Under Global Warming: Impacts on Forage Productivity, Soil Fertility and Forage Quality


by
Catarina Drumonde Melo
1,2,*,
Sophie Wallon
1,
Cristiana S. A. M. Maduro Dias
3,
Alfredo E. S. Borba
3,
João Madruga
3,
Hélder P. B. Nunes
3 and
Rui B. Elias
1
1
Azorean Biodiversity Group, Faculdade de Ciências Agrárias e do Ambiente, cE3c—Center for Ecology Evolution and Environmental Changes, CHANGE—Global Change and Sustainability Institute, Universidade dos Açores, Rua Capitão João D’Ávila, São Pedro, PT-9700-042 Angra do Heroísmo, Portugal
2
CFE—Centre for Functional Ecology, Department of Life Sciences, University of Coimbra, PT-3001-401 Coimbra, Portugal
3
IITAA—Institute of Agricultural and Environmental Research and Technology, Universidade dos Açores, Rua Capitão d’Ávila, São Pedro, PT-9700-042 Angra do Heroísmo, Portugal
*
Author to whom correspondence should be addressed.
Sustainability 2026, 18(12), 6029; https://doi.org/10.3390/su18126029
Submission received: 17 March 2026 / Revised: 15 May 2026 / Accepted: 5 June 2026 / Published: 12 June 2026

Abstract

The Azorean livestock system depends strongly on pasture-based feeding, making regional agriculture sensitive to global warming. This study assessed the effects of experimental warming on forage productivity, forage quality, and soil fertility in three pastures along an altitudinal gradient over two years (2020–2021). Open-top chambers were used to create warmer conditions, and soil and forage samples were analysed for chemical and mineral composition. Warming increased net forage productivity by 30% and 70% in the lower-altitude pasture in 2020 and 2021, respectively, and by 56% in the intermediate-altitude pasture in 2021. Responses at the highest altitude were weak or not significant. Effects on forage quality were seasonal. In winter and early spring, warming increased crude protein by 14–45% and ash by 4–13% in the lower- and intermediate-altitude pastures. Later in the season, warming was associated with higher fibre fractions, especially in the intermediate-altitude pasture, indicating faster plant maturation. Soil factors significantly structured forage quality, with phosphorus as the main driver. This study contributes to understanding how climate change may affect the sustainability of pasture-based livestock systems in island environments, supporting the development of adaptive management strategies to safeguard productivity, soil fertility, and ecosystem resilience.

1. Introduction

Climatic change is mainly driven by anthropogenic greenhouse gas emissions, especially carbon dioxide (CO2), methane, and nitrous oxide, and is expected to alter temperature and precipitation patterns over the coming decades [1]. Over the next 30–50 years, global temperature is projected to rise by approximately 2–3 °C, together with changes in the frequency, intensity, and duration of heat waves and other extreme thermal events [2]. These changes are also likely to affect soil function by modifying fertility, salinisation, CO2 release, and microbial activity [3,4]. In addition, changes in soil organic matter may influence soil aggregation, stability, water availability, cation exchange processes, and nutrient status [3,5].
Ruminant livestock systems are both contributors to and affected by climate change. Livestock production accounts for a substantial share of anthropogenic greenhouse gas emissions worldwide [6], while climate-related changes in feed resources, water availability, animal health, and productivity are expected to affect the sector directly [7,8]. In this context, one of the major challenges for agriculture is maintaining a balance among productivity, food security, and environmental sustainability [9].
The impacts of climate change on agricultural and livestock systems are difficult to establish. Some regions may benefit from improved production, whereas others may face declines [10,11]. Various climate models have been proposed to predict the potential impacts of warming on pasture productivity [12,13]. In grassland systems, precipitation remains a key driver of annual pasture productivity, but growing-season temperature is also critical [1,14]. For this reason, reliable projections of pasture performance under future climate scenarios need to consider both variables together [15].
In the Azores, projected warming and shifts in precipitation patterns are expected to alter seasonal pasture dynamics. By the end of the century, temperatures are expected to rise by approximately +1.5 °C to +2.8 °C under the best- and worst-case climate scenarios, respectively. Such changes are likely to influence both the quantity and quality of forage available to livestock [16].
Forage quality varies throughout the growing season as plant development progresses and the leaf-to-stem ratio shifts [1,15]. Both forage production and forage quality vary across sites and seasons, reflecting differences in management practices [17,18], climatic conditions [19,20], plant community composition [21,22,23], and soil nutrient availability [15,20].
Temperature changes may affect species composition and competitive interactions in pastures, favouring C3 over C4 plants [24,25]. The duration of the growing season is also relevant to forage quality and quantity, as it determines the timing and availability of forage [8]. Previous studies suggest that higher temperatures may either lengthen the active growth period or accelerate plant development, depending on the system considered, thereby affecting productivity in different ways [26,27].
Important forage quality parameters such as dry matter (DM), crude protein (CP), ether extract (EE), ash, neutral detergent fibre (NDF), acid detergent fibre (ADF), and acid detergent lignin (ADL) can all vary in response to environmental conditions. Among these, NDF, ADF, and ADL are commonly used to assess forage quality because higher values are generally associated with lower digestibility, especially for ADL [28,29].
The temperature rise has been shown to induce rapid plant maturation, which increases the stem-to-leaf ratio and the fibre contents (NDF, ADF, and ADL) and decreases CP and digestibility [8,29], thereby reducing nutrient availability for livestock [30].
Several strategies have been proposed to reduce the vulnerability of livestock systems to climate change, including adjustments in stocking rates, diversification of forage and livestock species, and the adoption of mixed crop–livestock systems [8,10,31]. In the Azores, where livestock—particularly dairy farming—plays a central role in the regional economy, understanding how pastures respond to warming is especially important for supporting future adaptation. However, information on how forage production, forage quality, and soil fertility in Azorean pastures respond to increasing temperature remains limited.
This lack of knowledge is especially relevant because pasture responses are unlikely to be uniform across the landscape. The use of an altitudinal gradient is particularly useful in this context because altitude integrates several environmental factors directly related to pasture functioning, including temperature, precipitation, soil moisture, and soil properties [32]. As a result, mountain and altitudinal gradients are often regarded as natural laboratories for studying climate-change responses, as they allow similar vegetation types to be evaluated under contrasting thermal and edaphic conditions [33]. In grassland systems, previous studies have shown that altitude can strongly influence the sensitivity of plant productivity, community structure, and soil properties to warming, leading to contrasting responses between lower and higher elevations [4,23,34].
In the Azores, where future warming is expected to occur under already marked local contrasts in altitude and moisture, evaluating pasture responses along an altitudinal gradient is essential to determine whether warming effects remain consistent across sites or depend on local environmental conditions. Accordingly, this study aimed to assess the effects of experimental warming on forage production, forage quality, and soil nutrient availability in three pastures located at different altitudes, and to determine whether these responses vary seasonally and along the gradient. We hypothesised that rising temperature (i) would stimulate plant growth, particularly at lower altitudes where thermal limitation is weaker, but would not necessarily improve forage quality because faster development may increase fibre accumulation; (ii) would increase soil organic matter inputs through greater plant production; and (iii) would enhance soil nutrient availability by stimulating nutrient cycling and nutrient release. Understanding these responses is essential to support the sustainability and resilience of pasture-based livestock systems under future climate conditions.

2. Materials and Methods

2.1. Experimental Design

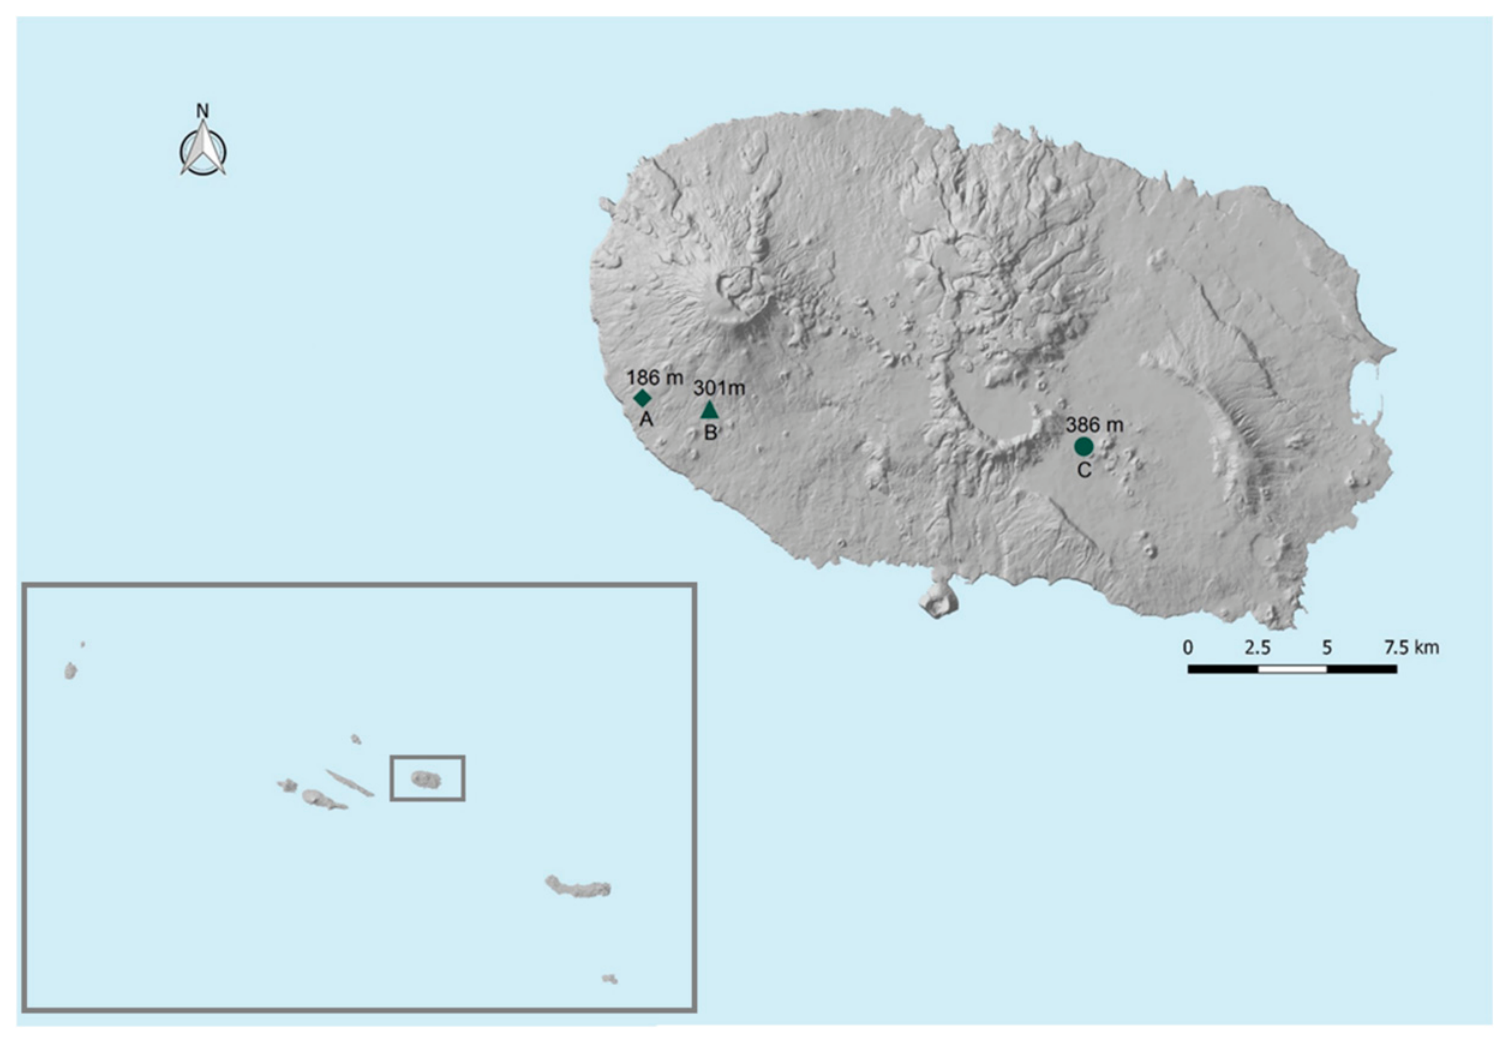
This study was carried out on Terceira Island, the third-largest island in the Azorean archipelago (402 km2). Three artificial/sown, intensively managed pastures were selected at three different altitudinal levels, namely, pasture A (186 m a.s.l.; latitude: 38.703596 N; longitude: −27.353805 W), pasture B (301 m a.s.l.; latitude: 38.701639 N; longitude: −27.325783 W) and pasture C (386 m a.s.l.; latitude: 38.697770 N; longitude: −27.170075 W) (Figure 1). Lolium multiflorum is the dominant grass in pastures A and B, while Holcus lanatus dominates in pasture C. The use of this altitudinal gradient allowed the evaluation of warming effects under contrasting environmental conditions, particularly temperature, moisture, and soil characteristics, which are expected to vary with elevation.
The experimental sites are located on a Placaquand soil, characterised by predominantly sandy textures and the presence of a Bsm horizon at approximately 19 cm depth, indicating a discontinuous horizontal accumulation of iron and manganese oxides [35].
To simulate rising temperatures and analyse their potential effects on forage productivity and quality, open-top chambers (OTCs) were used. The use of open-top chambers has been well documented to consistently achieve higher temperatures and is a quick, less expensive way to enable in situ temperature manipulation [36].
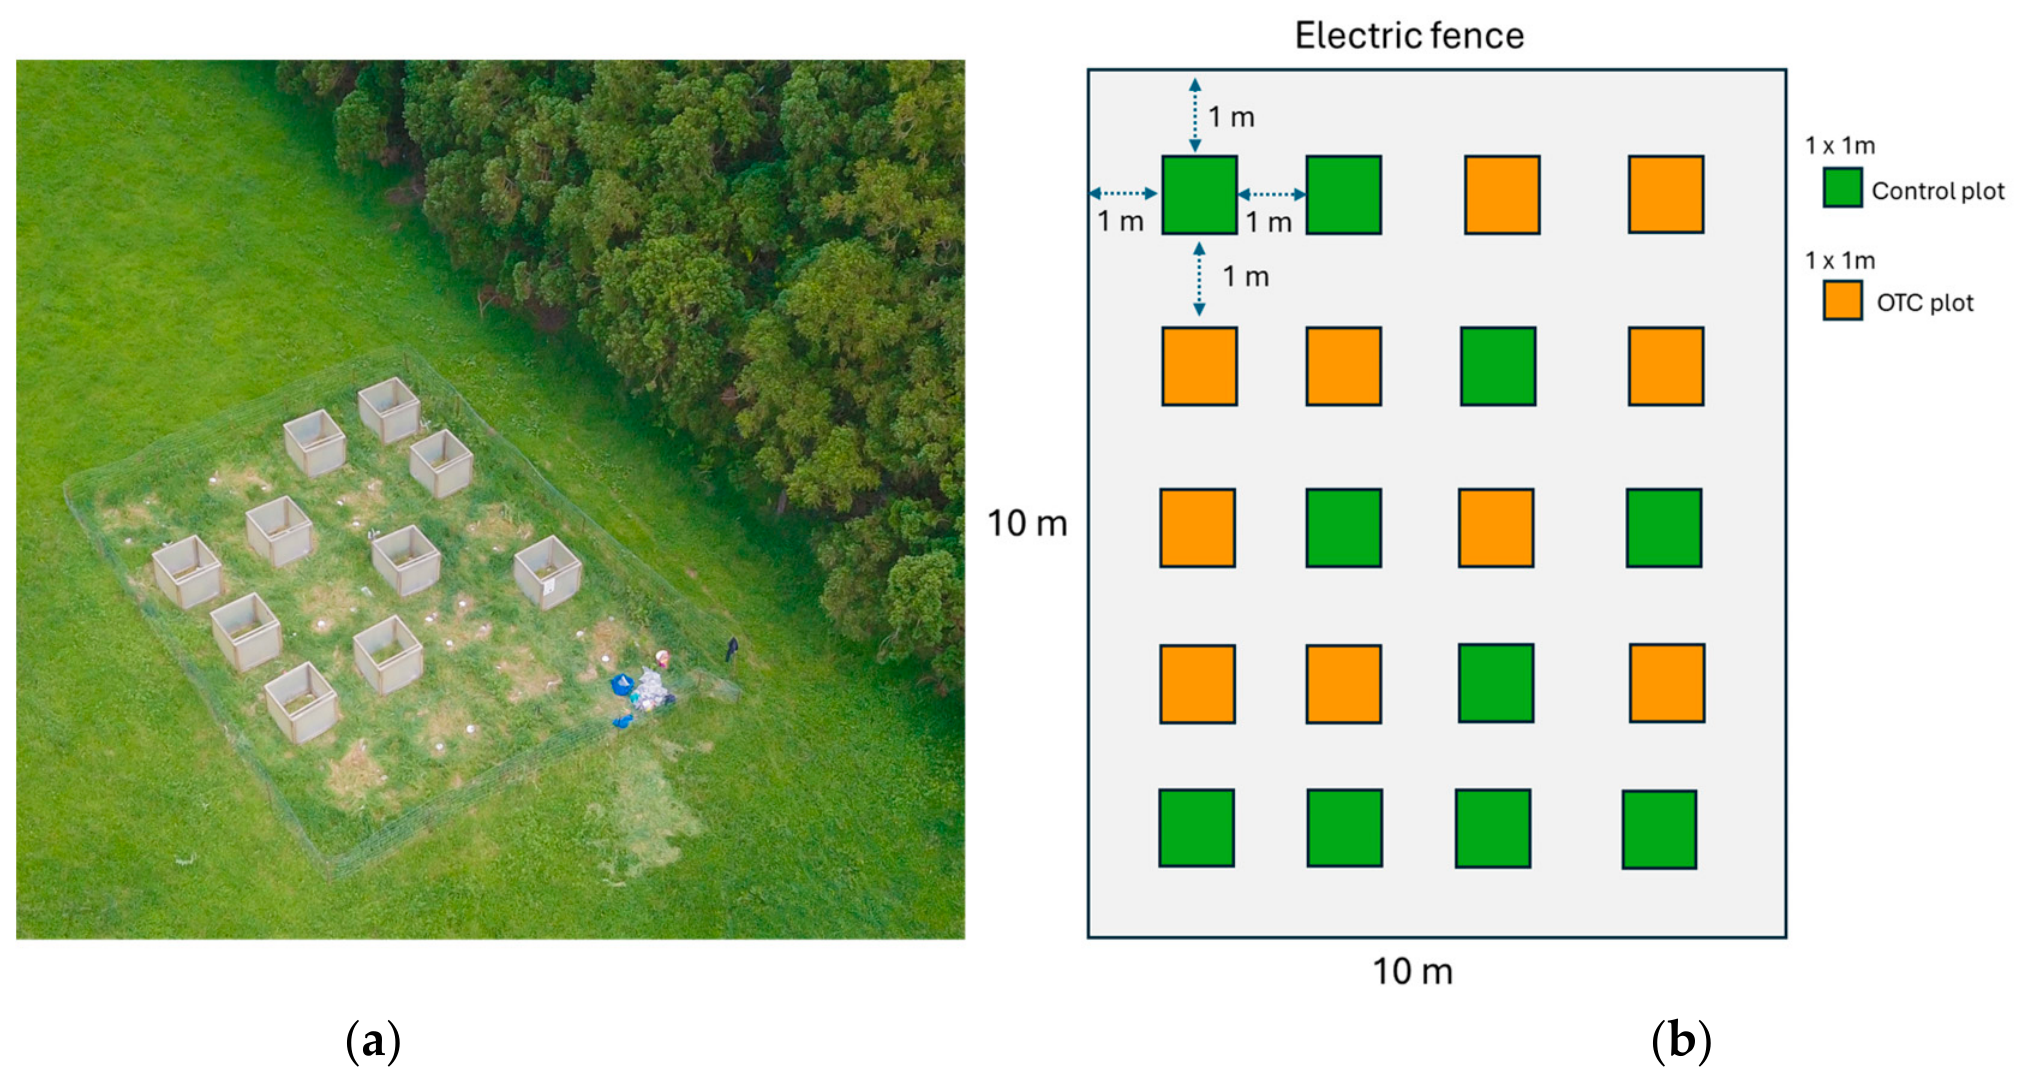
In each pasture, 20 plots, each measuring 1 × 1 m, were established: 10 control plots and 10 equipped with open-top chambers (OTCs) (Figure 2). Overall, this design resulted in 60 plots installed across the three pastures. The same control and OTCs plots were sampled repeatedly across all sampling dates in each study year. The plots were randomly distributed within an experimental area of approximately 100 m2, enclosed by an electric fence to prevent grazing and external disturbance. The experimental area was located at least 10 m from the pasture boundary wall to minimise edge effects. Plots were arranged in blocks, with a minimum distance of 1 m between adjacent blocks and 1 m between each block and the fence, ensuring independence among plots and reducing potential treatment interference.
In each pasture, five data loggers were installed to measure surface temperature and relative humidity hourly: three in OTC plots and two in control plots. A larger number of data loggers was placed in OTC plots to better characterise the microclimatic conditions inside the chambers, while the control plots were used as a reference for ambient conditions. Measurements were made with Easy Log (EL-USB-2), Temperature and Relative Humidity USB Data Loggers (Lascar Electronics, Wiltshire, UK).

2.2. Forage Collection and Preparation

In the first year (2020) of this study, the plant samples were harvested at five sampling dates (see Table S1 for further details): winter, early spring, late spring, summer, and autumn. In the second year (2021), the plant samples were collected at four sampling dates (see Table S2 for further details): during the four growth seasons—winter, spring, summer, and autumn. In both study years, it was not possible to sample in the summer and autumn in pasture A, or in the autumn in pasture B, because grasses dry up in these pastures after spring and summer, respectively, and they have to be sown again in autumn. Plant samples (leaves and pseudo-stems) were collected manually.
Laboratory analyses were conducted in the Animal Nutrition Lab, Department of Agricultural Sciences, University of the Azores, located in Angra do Heroísmo, Terceira, Azores, Portugal. Plant samples were first cut into fragments of approximately 2–3 cm and then ground using a laboratorye mill (Retsch GmbH, Haan, Germany; model SP2) for subsequent chemical analysis. To determine forage productivity and nutritive parameters, we harvested only the dominant plant species in each pasture, i.e., L. multiflorum (pastures A and B) and H. lanatus (pasture C), and excluded all other species. Therefore, the productivity and nutritional results presented in this study reflect the dominant species in each pasture, not the entire pasture community.

2.3. Forage Chlorophyll Measurement

To evaluate the effect of rising temperature on the chlorophyll content, in each sampling date, five random measures on intact and not wet leaves of the dominant plant species (Lolium multiflorum, in pastures A and B, and Holcus lanatus in pasture C) were made per control and OTC plots in each pasture. Measurements were made with the atLEAF CHL PLUS Chlorophyll meter (FT Green LLC, Wilmington, DE, USA). Chlorophyll content per plot was determined by the average of the five atLEAF CHL measures in each plot. The total chlorophyll was obtained by converting atLEAF CHL values to SPAD and using the relationship between chlorophyll content and SPAD units [37,38].

2.4. Forage Net Productivity

The grasses of each plot were harvested with hand shears about 5 cm above ground level. Samples were kept separately in transparent plastic bags and brought to the lab for weighing on a laboratory scale (Precision balances, model SE2201 VWR International, Radnor, PA, USA). To determine the biomass, samples were dried at 65 °C and weighed daily until the dry weight stabilised (this occurred after 6–7 days). As the study focused on the dominant plant species in each pasture (Lolium multiflorum in pastures A and B, and Holcus lanatus in pasture C), special care was taken to remove any other species present in the samples before weighing and drying. Net productivity of the dominant species was estimated by dividing the biomass (dry weight) of each plot by the number of growth days between each cut (average productivity per cut).

2.5. Forage Chemical Analysis

Different nutritive parameters were analysed in this study: namely, dry matter (DM), crude protein (CP), neutral detergent fibre (NDF), acid detergent lignin (ADL), acid detergent fibre (ADF), ether extract (EE) and mineral ash (Ash). Forage samples were dried in a forced-air oven at 65 °C until constant weight (this typically took 6 to 7 days). Following that, they were ground to pass through a 1 mm sieve type SR2 in a Retsch mill (Retsch GmbH, 5657 Haan, Germany). For chemical characterisation of the forage, the Weende system was used to determine DM (method 930.15), CP (method 954.01), EE (method 920.39), and total ash (method 942.05) according to the A.O.A.C. standard methods [39]. The DM content of the forage was determined by drying the sample in a forced-air oven (Memmert drying oven; Memmert, Schwabach, Germany) at 105 °C for 24 h. Total ash was evaluated by igniting samples in a muffle furnace (M110 Muffle furnace; Heraeus, Hanau, Germany) at 500 °C for 12 h. CP was determined by the Kjeldahl method, and EE was measured by refluxing forage samples with petroleum ether in a Soxhlet system. NDF, ADF, and ADL were determined according to Goering and Van Soest [40]. Both nutritive parameters, NDF and ADF, were determined by weighing 1 g of each plant sample into a 600 mL glass digestion cup and adding 100 mL of NDF and ADF solutions, respectively. In the case of NDF, 0.5 g of Na2SO3 (sodium sulphite) was also added to the mixture. Next, both NDF and ADF mixtures were placed in an extraction apparatus. From the moment the mixture began to boil (which should happen constantly), 1 h was allowed to pass. At the end of this time, each glass digestion cup was washed and filtered into a preweighed porous plate glass crucible. Subsequently, the residue was washed with acetone, and the crucibles were placed in the oven at 105 °C for at least 8 h to be reweighed. Both NDF and ADF were expressed without residual ash. For the ADL, the crucibles with the ADF residue, after being weighed, were placed in a vat with 72% H2SO4 for 3 h. The crucibles were then filtered and washed thoroughly with hot water, then placed in an oven at 105 °C for 12 h. The resulting ADL residue was weighed, and the crucibles were placed in a muffle furnace at 500 °C for at least 8 h. They then spent at least 8 h in an oven at 105 °C before being weighed to determine the ash weight of the ADL residue.

2.6. Soil Analysis

The soil analyses were performed at the University of Azores Soil Laboratory from IITAA. For each plot, one soil sample was collected during two sampling dates in each study year. In 2020, soil samples were collected for analysis in winter and late spring, while in 2021, they were collected in winter and summer. Potassium (K), calcium (Ca) and magnesium (Mg) were extracted with sodium acetate (1/10) at pH 7 and determined using a Varian ICP atomic emission spectrophotometer (Varian Inc., Palo Alto, CA, USA). Soil pH was measured from a soil and water paste (1:2.5 v/v), and available phosphorus (P) (1:20) [41] by spectrometry after extraction with NaHCO3 solution at pH 8.5. Organic matter (OM) was also measured by dry ashing at 500 °C in accordance with EN 15936 [42] (or the equivalent national standard).

2.7. Data Analysis

Differences in soil chemical elements were tested by one-way analysis of variance and Tukey honestly significant difference test at p < 0.05. Climatic data were not normally distributed; thus, differences between treatments were analysed using the non-parametric Kruskal–Wallis test. Both analyses were computed using IBM SPSS Statistics for Windows (Version 30.0, IBM Corp., Armonk, NY, USA) [43].
Differences in net forage productivity between experimental treatments (control and OTC) were analysed using linear mixed-effects modelling to account for the hierarchical and non-independent structure of the experimental design. This approach was preferred over classical ANOVA or generalised linear models, as it allows the inclusion of random effects and accommodates repeated measurements within sampling units.
An initial linear mixed-effects model (LMM; Gaussian error distribution) was fitted with Treatment (control vs. OTC), Pasture, Year, and their interactions as fixed effects, and plot identity was included as a random effect to account for repeated measures and non-independence of observations. Pasture was treated as a grouping factor because each elevation level was represented by a single experimental pasture, resulting in confounding between elevation and pasture identity.
Model assumptions were evaluated using residual and Q–Q plots, and homogeneity of variance was tested with Levene’s test [44,45], which indicated significant heteroscedasticity. To account for this, a variance structure allowing unequal variances among treatment × pasture combinations was included in the model “nlme” [46]. Model comparison using Akaike’s Information Criterion (AIC) [47] showed a substantially improved fit, and this model was retained for subsequent analyses. Estimated marginal means (EMMs) [48] were used for pairwise comparisons between treatments within each pasture × year combination, with significance assessed using t-tests within the mixed-effects model structure.
Finally, graphical representations of treatment effects were produced using boxplots stratified by pasture and year, with statistical significance derived from model-based pairwise comparisons.
In addition to forage productivity, the effects of experimental treatments on forage nutritive quality were assessed using linear mixed-effects models fitted with the lme function from the nlme package in R (version 4.5.2, R Core Team, Vienna, Austria). Seven nutritive variables were analysed separately: DM, CP, NDF, ADF, ADL, EE, and ash content. For each response variable, a linear mixed-effects model (LMM; Gaussian error distribution) was fitted including Treatment (control vs. OTC), Field, Year, and Season as fixed effects, as well as their first-order interactions involving Treatment (Treatment × Pasture, Treatment × Year, and Treatment × Season). Plot identity was included as a random intercept to account for repeated measurements and non-independence among observations within sampling units. Heteroscedasticity was accounted for by incorporating a variance structure that allows unequal residual variances across Treatment × Pasture combinations, using the varIdent function. Estimated marginal means (EMMs) were computed using the emmeans package, and pairwise comparisons between treatments were performed within each Pasture × Year × Season combination. Tukey’s method was used to adjust for multiple comparisons. Chlorophyll concentration between control plots and OTC plots was analysed using the same linear mixed-effects modelling framework described for forage productivity and nutritive metrics and results were visualised using boxplots stratified by pasture and year. Analyses regarding forage productivity, nutritive quality, and chlorophyll content were performed using R software (version 4.5.2, R Core Team, Vienna, Austria).
To explore the effects of rising temperatures on soil chemical elements and their impacts on the distribution of different nutritive parameters, redundancy analysis (RDA) in Canoco 5.1 (Microcomputer Power, Ithaca, NY, USA) [49] was performed, using only the 2021 nutritive data. The RDA was restricted to 2021 data because it was the only year in which soil chemical data and corresponding forage nutritive parameters were available on the same sampling dates.

3. Results

3.1. Soil Features

In both years of the experiment (2020 and 2021), mean monthly temperature was consistently higher in OTCs than in control plots, whereas mean monthly relative humidity was lower under OTC conditions in all three pastures (Table 1). Across the three pastures, OTC treatment increased mean monthly temperature by 0.79 to 2.52 °C and reduced mean monthly relative humidity by 0.87 to 5.85 percentage points relative to the control, confirming that the warming treatment effectively altered the microclimatic conditions in each pasture.
However, the effects of warming on soil properties were not uniform along the altitudinal gradient. In 2020, differences in soil parameters between treatments were observed only in pasture B, with OM content higher in the OTCs than in control plots (Table 1). During 2021, OM content varied significantly across treatments in lowland pastures (A and B), with the maximum observed in the OTC plots. In lowland pastures, significant differences between treatments were also observed for Ca. In both pastures, Ca was higher in OTCs than in control plots. Moreover, changes between treatments were found in Mg content, which was higher in OTC plots than in the control, but only in pasture B.

3.2. Forage Production

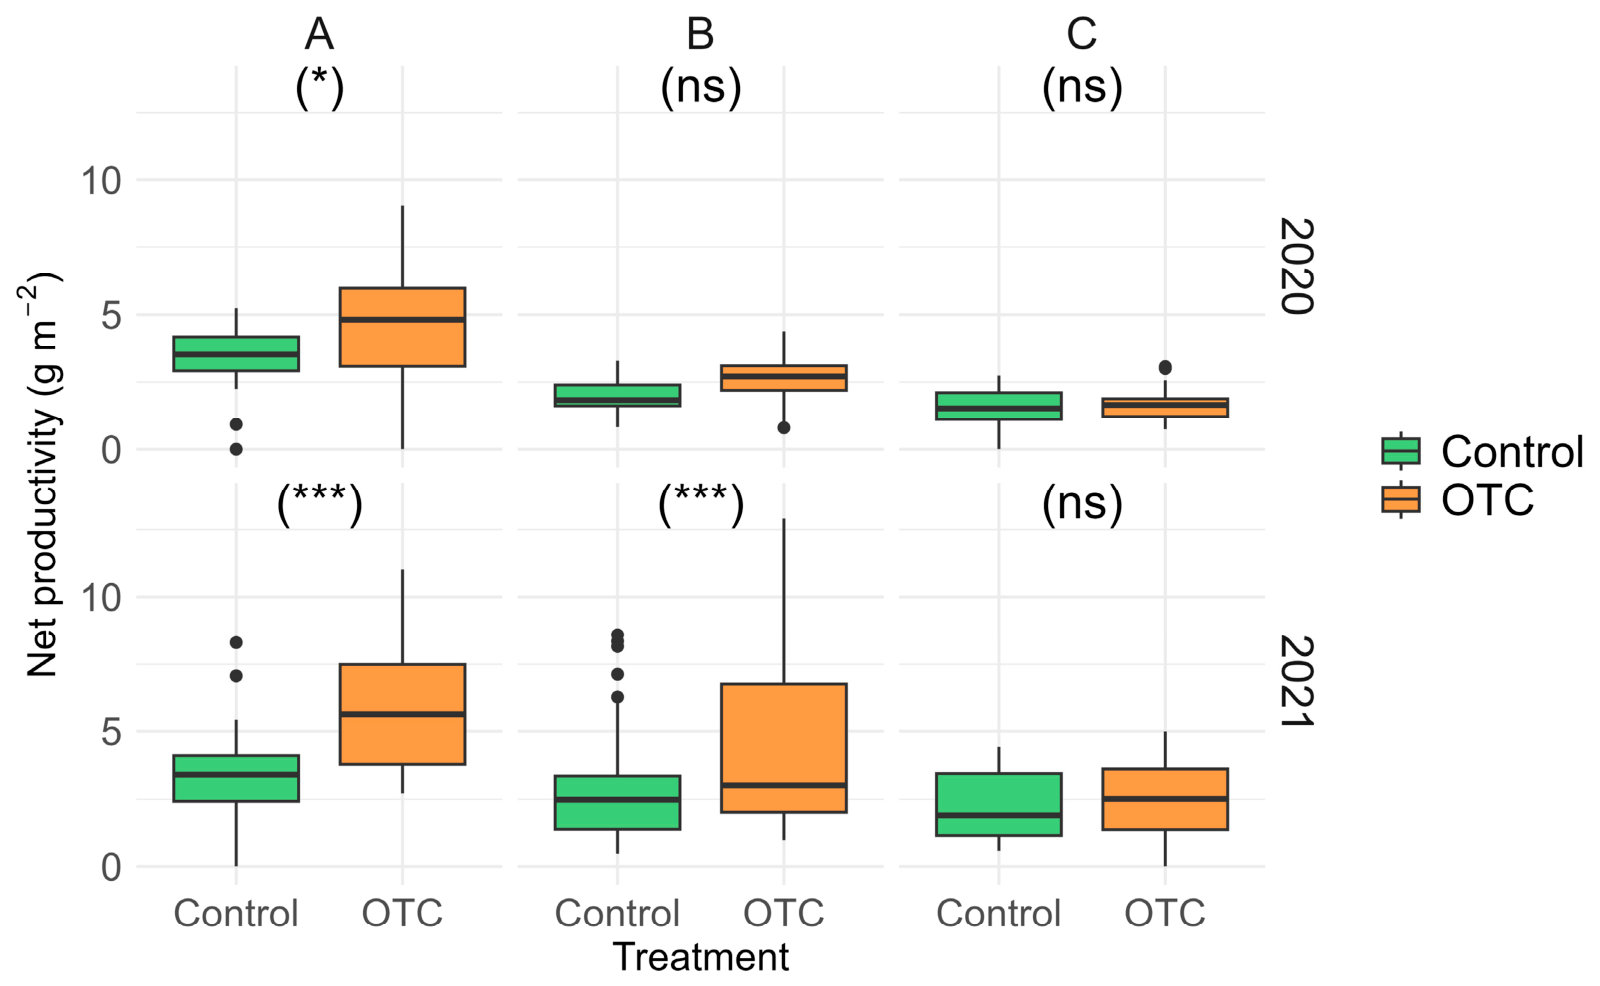
Net forage productivity was significantly influenced by pasture and year, whereas the overall effect of treatment was not statistically significant. Significant treatment × pasture interactions indicated that treatment effects varied among pastures, while interactions involving year were not significant. Model fit was substantially improved by incorporating a heteroscedastic variance structure (AIC = 1639.77), compared with the homoscedastic model (AIC = 1770.37). The model explained a moderate proportion of the variance, with marginal and conditional R2 values of 0.418 and 0.421, respectively.
Pairwise comparisons showed that treatment effects varied across pastures and years (Table 2; Figure 3).
In 2020, net forage productivity was significantly higher under OTC conditions only in pasture A, whereas no significant differences were detected in pastures B and C. In 2021, productivity was significantly higher under OTC treatment in pastures A and B, while no significant effect was observed in pasture C. Overall, these results indicate that the effect of warming on net forage productivity was context-dependent, varying across spatial and temporal scales, with stronger and more consistent positive effects observed in 2021, particularly in the two lower-altitude pastures.

3.3. Forage Chlorophyll Content

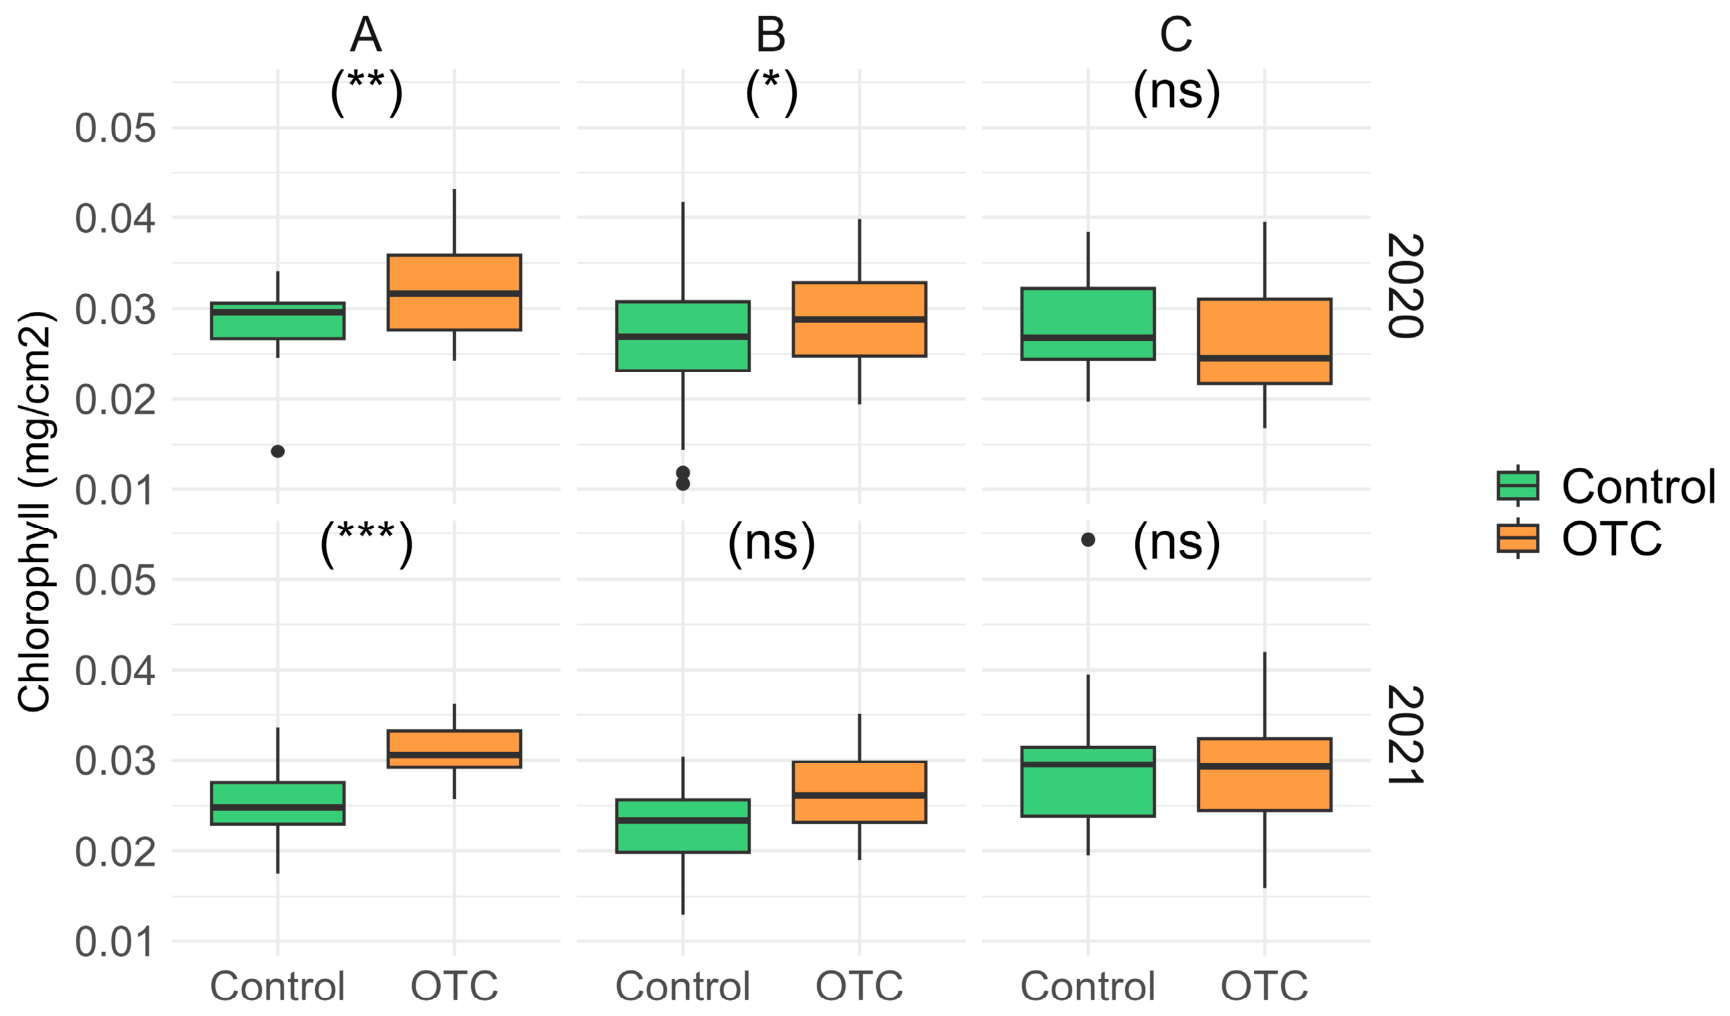
Pairwise comparisons showed that the effect of OTC treatment on chlorophyll content varied across fields and years (Table 3; Figure 4). In 2020, chlorophyll content was significantly higher under OTC conditions in fields A and B, whereas no significant difference was observed in field C. In 2021, chlorophyll content remained significantly higher under OTC treatment only in field A, while no significant differences were detected in fields B and C. Overall, these results indicate that the effect of warming on chlorophyll content was field- and year-dependent, with the most consistent positive response observed in field A.

3.4. Forage Nutritive Parameters

During 2020, the nutritive parameters varied significantly across treatments and sampling dates in the three pastures (Table 4).
In pasture A, during winter, ADL was higher under control conditions than in OTC plots, whereas the opposite pattern was observed for ash and CP, which increased by approximately 8% and 2%, respectively, under warming conditions (Figure S1). In early spring, DM and ADL decreased in OTC plots, while CP and NDF increased by 23% and 10%, respectively, relative to the control (Figure S1). In late spring, DM values differed significantly between treatments, with higher values in the control than in the OTC plots. In contrast, NDF showed the opposite pattern, with higher values under warming conditions (Table 4; Figure S1).
In pasture B, during winter, warming conditions led to increases in CP, ash, and ADF of approximately 18%, 13%, and 2%, respectively, compared to control plots (Figure S2). A similar response was observed in early spring, with warming increasing CP, ash, and ADF by approximately 34%, 8%, and 2%, respectively, relative to the control (Figure S2). In late spring, significant treatment effects were detected only for fibre fractions, with NDF, ADF, and ADL values being higher in OTC than in control plots (Table 4). ADL increased by approximately 43% under OTC conditions, while the increases in NDF and ADF were more moderate (3% and 8%, respectively). In summer, only ADF and ash differed significantly between treatments, with both parameters showing higher values under warming conditions. OTC treatment increased ash and ADF values by approximately 7% and 4%, respectively (Table 4).
In pasture C, during winter, only ash, NDF, and ADL varied significantly between treatments. Ash values increased by approximately 22% under OTC conditions relative to the control, whereas the opposite pattern was observed for NDF and ADL (Figure S3). During early and late spring, no significant differences in nutritive parameters were found between treatments in pasture C (Table 4). In summer, only NDF differed significantly between treatments, with higher values under control conditions than in OTC plots (Table 4). A similar pattern was observed for EE, which was also higher in control than in OTC plots (Table 4).
In the second year of this study, nutritive parameters also varied significantly between treatments across the different sampling dates (Table 5).
In pasture A, during winter, CP and ash values were higher in OTC plots than in control plots, whereas the opposite pattern was observed for ADL. Warming conditions increased CP and ash by approximately 14% and 4%, respectively (Figure S4). During spring, only ash varied significantly between treatments, showing an opposite response compared to winter, with higher values under control than under OTC conditions (Table 5; Figure S4).
In pasture B, significant treatment effects were detected during winter for DM, CP, and ADF (Table 5). Except for DM, all nutritive parameters were higher under OTC conditions, with warming leading to approximately 45% increases in CP and 9% in ADF relative to the control (Figure S5). During spring, CP, ADF, and ADL also differed significantly between treatments and were consistently higher in OTC than in control plots (Table 5). Under warming conditions, CP, ADF, and ADL increased by approximately 5%, 3%, and 4%, respectively (Figure S5). In summer, fibre fractions (ADF and ADL) exhibited a similar pattern, being higher under OTC conditions (Table 5). Warming increased ADF and ADL values by approximately 16% and 12%, respectively (Figure S5).
In pasture C during winter, CP values were higher in the control than in the OTC plots (Figure S6). In spring, DM, NDF, and ADL varied significantly between treatments (Table 5). Warming increased DM and ADL values by approximately 19% and 12%, respectively, while NDF showed the opposite response, with higher values under control conditions (Figure S6). During summer, no significant differences in nutritive parameters were detected between treatments. In autumn, only ash and EE differed significantly between treatments, with higher values in control than in OTC plots (Table 5; Figure S6).

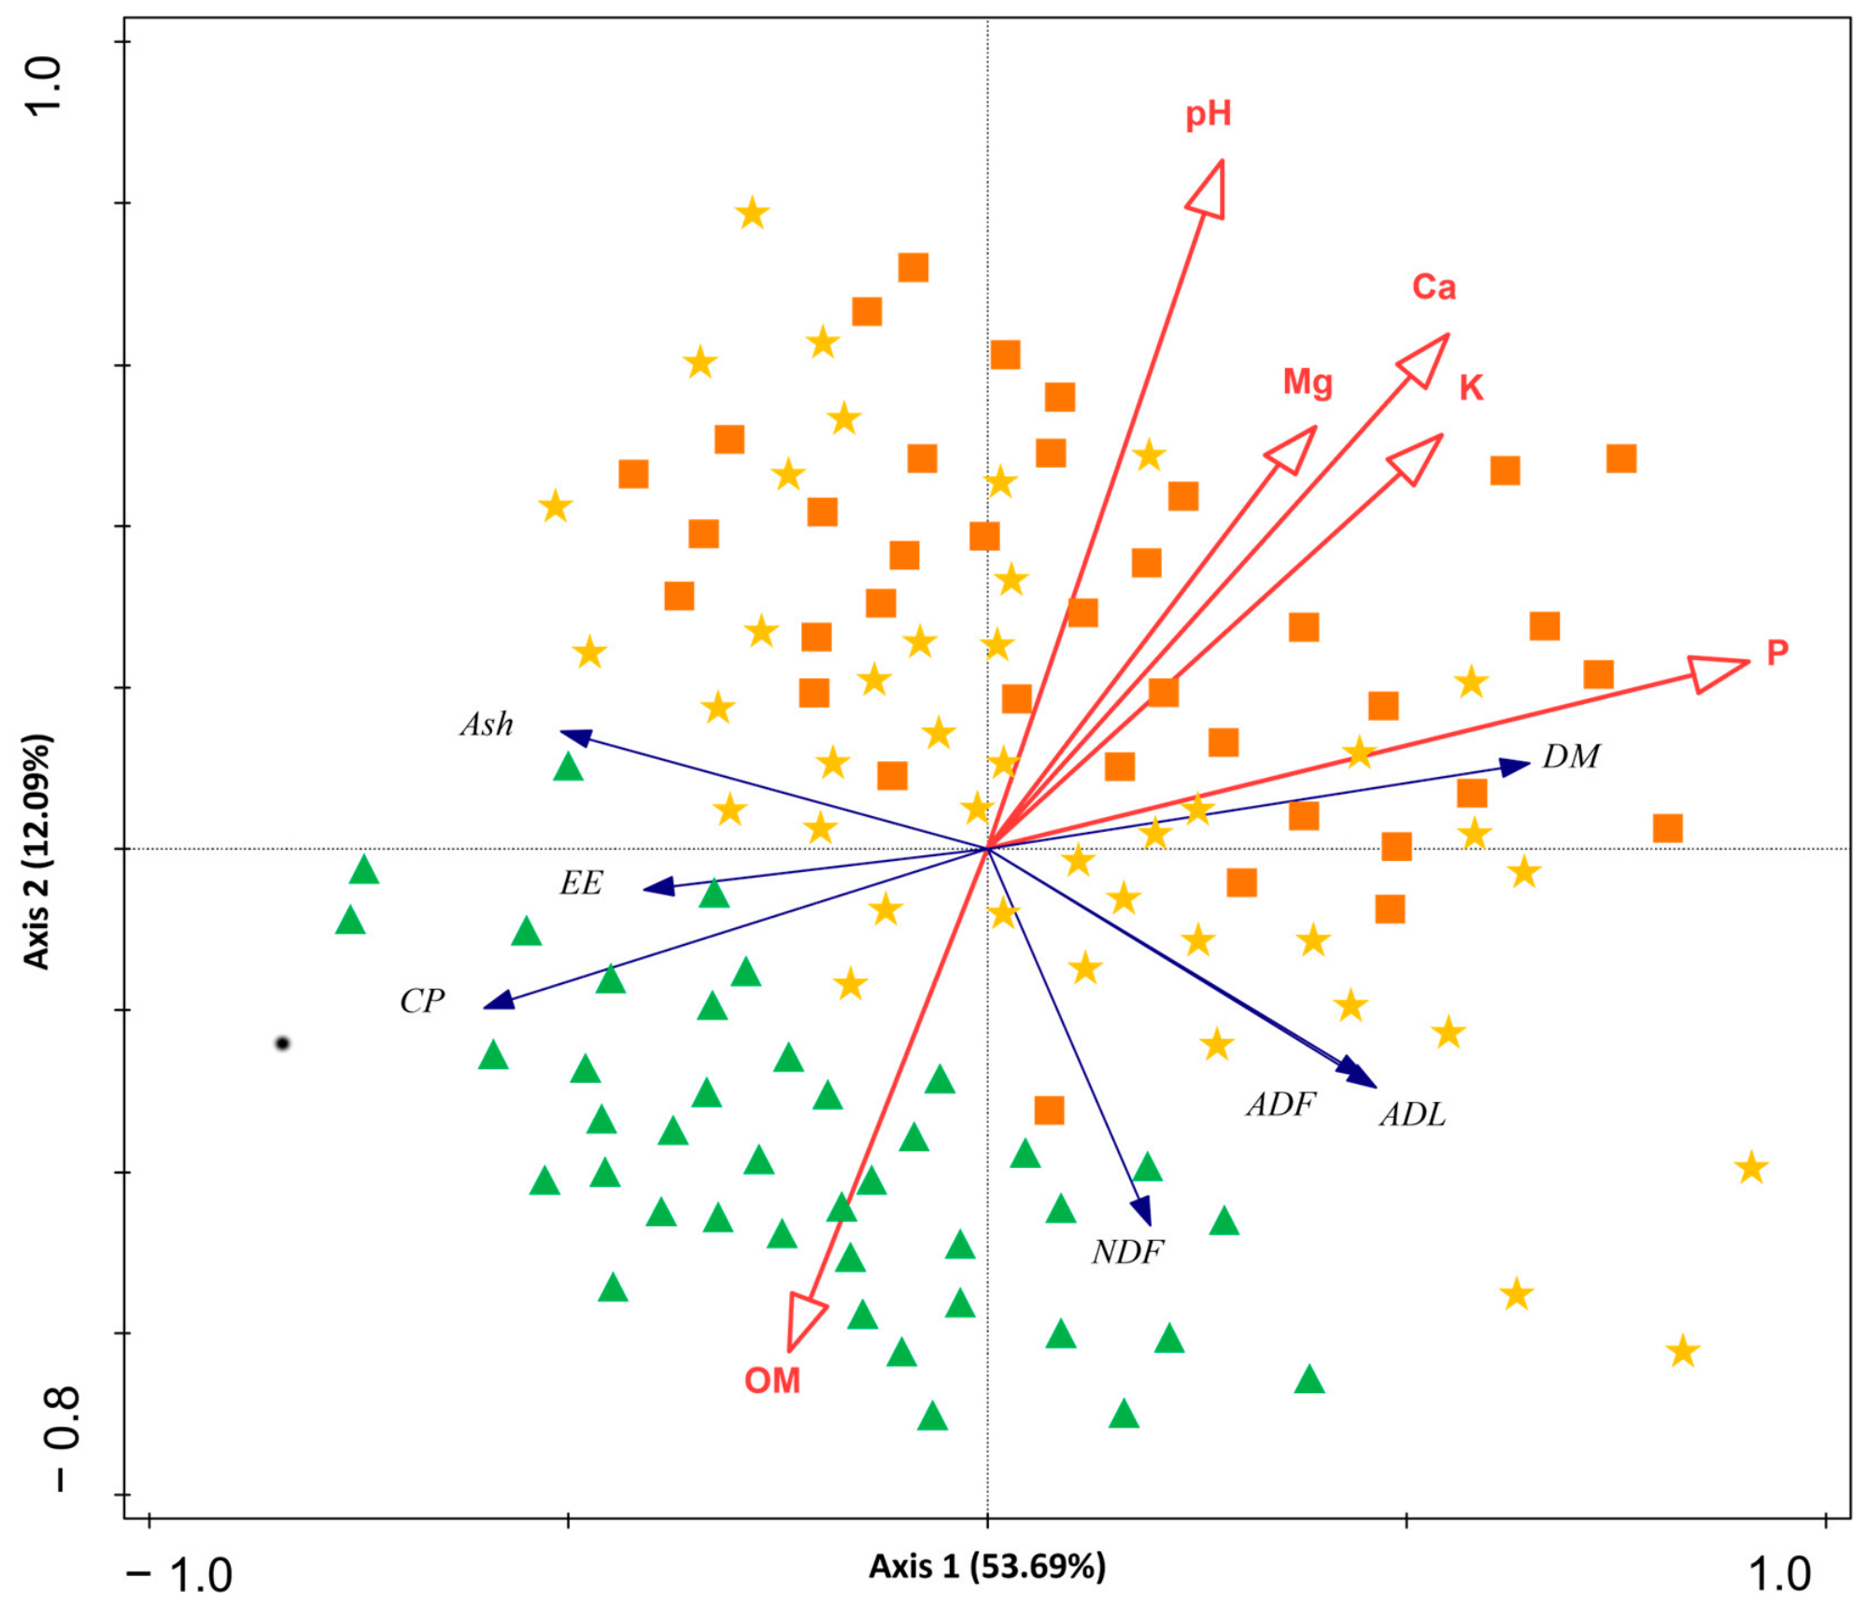
3.5. Correlation Between Soil Chemical Elements and Forage Nutritive Parameters

Figure 5 shows the redundancy analysis (RDA) triplot based on the first two canonical axes. According to the statistical summary, Axis 1 explained 49.14% and Axis 2 12.09% of the total variation, together accounting for 61.23%. Overall, the explanatory variables accounted for 65.78% of the total variance, with an adjusted explained variation of 63.39%. The overall RDA model was statistically significant according to the Monte Carlo permutation test (pseudo-F = 27.5; p = 0.002; 999 permutations).
Individual permutation tests further showed that all selected soil variables significantly contributed to the ordination pattern. Phosphorus (P) was the most important ex-planatory factor (F = 39.7; p = 0.001), followed by Ca (F = 14.3; p = 0.001), K (F = 13.4; p = 0.002), Mg (F = 8.5; p = 0.001), pH (F = 6.7; p = 0.005), and OM (F = 4.1; p = 0.020). These results indicate that mineral-related soil properties, particularly P, Ca, and K, were the main drivers of the variation in forage nutritive parameters.
Organic matter was positively associated with CP, ether extract EE, and ash, and this relationship was mainly linked to samples from pasture C, where the highest OM values were observed. In contrast, these nutritive parameters were negatively associated with soil pH and with concentrations of P, K, Ca, and Mg.
Conversely, DM and the fibre fractions (ADF, NDF, and ADL) were positively associated with soil pH and P, K, Ca, and Mg, whereas they were negatively associated with OM. Samples from pastures A and B were distributed mainly on the positive side of Axis 1, reflecting their association with higher concentrations of soil minerals and with fibre-related nutritive parameters. By contrast, samples from pasture C were concentrated on the negative side of Axis 1 and were more closely associated with higher OM, CP, EE, and ash values. This distribution indicates a clear ecological separation among pastures, with A and B associated with more mineral- and fibre-enriched conditions, whereas C was associated with greater organic matter accumulation and higher nutritive quality.

4. Discussion

4.1. Soil Properties

Climate change may alter several aspects of soil chemistry, including pH, salinity, and nutrient availability [4,50]. Experimental warming led to higher OM content, possibly due to higher plant productivity and its greater contribution to soil, especially in lowland pastures. Warming was also linked to higher Ca and Mg concentrations in the lower pastures. One possible explanation is that changes in OM inputs and turnover under warmer conditions affected nutrient retention in these soils [51,52,53].

4.2. Forage Production Dynamics

Forage production in grassland systems reflects the combined influence of several environmental factors, especially temperature and precipitation, which also affect plant phenology and forage quality [7,10,11]. In this study, the effects of warming differed along the altitudinal gradient: the strongest positive responses occurred in pastures A and B, while pasture C showed weaker and more variable responses. This result contradicts previous studies in which biomass decreases with increasing temperature [54,55,56]. However, several studies also reported a positive effect of rising temperature on forage productivity. Chaplin-Kramer and George [14] projected an increase in forage production within the growing season, counterbalanced by shorter growing seasons. More recently, Gómara et al. [13] reported that simulated productivity during 1955–2015 was 29% higher than during 1959–1979. The authors further suggested that this increase was consistent with the observed long-term rise in temperature and atmospheric CO2, as well as multi-decadal changes in incident solar radiation. Nevertheless, during both study years, no significant change in net forage productivity was detected in the upland pasture. This suggests that, at higher altitude, a simple increase in temperature was not sufficient to consistently enhance either physiological activity or forage production, indicating the persistence of other limiting environmental factors. Previous studies on the warming effect on plant productivity have shown inconsistent results in high-altitude pastures. For example, Volk et al. [57] showed that the productivity of seminatural systems responds positively to warming of up to +1.8 °C during the growing season, corresponding to +1.3 °C in mean annual temperature. By contrast, Liu et al. [21], in a manipulative experiment in Tibetan grassland, found that climate warming and the associated drying did not affect net primary production, but did shift biomass allocation belowground due to changes in plant community composition.
A similar altitudinal pattern was observed for chlorophyll content, which increased significantly under warming in the most responsive pastures (A and B). This finding is ecologically relevant because chlorophyll is closely associated with photosynthetic capacity and plant productivity. Previous studies have shown that warming can increase chlorophyll concentration and modify its distribution in grassland systems, particularly where temperature remains a key limiting factor [58]. In addition, seasonal variation in grassland photosynthetic capacity is strongly regulated by temperature and atmospheric demand. Therefore, the higher chlorophyll content observed under OTC conditions is consistent with enhanced physiological activity and, consequently, greater biomass accumulation in the lower-altitude pastures [55,56].

4.3. Forage Quality

Forage quality is a key factor for pasture use and directly affects livestock performance [59]. However, forage quality can vary greatly over the growth season due to several factors, with precipitation and temperature being the most important [1,15,20]. The response of forage nutritive quality to warming was more complex than the response of productivity or chlorophyll, but it still varied clearly with season and altitude. This shows that warming did not affect all nutritive traits in the same way. During winter and early spring, warming often increased CP and ash, especially in pastures A and B, indicating improved forage value during cooler periods, when growth is usually temperature-limited [60,61]. Our finding is consistent with that of Fariaszewska et al. [62], who reported a similar response in Lolium perenne. Likewise, Li et al. [34] observed an increase in CP content under warming in alpine meadows, suggesting that the direction of nutritive responses depends on site conditions and on the balance between growth stimulation and shifts in plant composition.
In addition, in pasture A, the consistent increase in CP and ash under warming conditions during winter and early spring, together with the reduction in ADL during the same periods, suggests an improvement in both forage nutritive value and digestibility. However, in pasture B, the warming-induced increase in CP was increasingly accompanied by higher fibre fractions (NDF, ADF, and ADL) later in the season. These results suggest that warming may initially enhance forage nutritive quality, but later accelerate plant development and tissue maturation, leading to increased structural carbohydrate accumulation and reduced digestibility during the warmer seasons [1,20,63].
By contrast, pasture C showed fewer and less consistent responses in nutritive parameters, and some forage quality variables were even higher under control conditions in certain seasons. These findings were consistent with studies showing that warming effects across elevations can differ substantially, as climatic sensitivity is influenced by topography, soil properties, and plant community structure [3,23,34]. In other words, warming does not necessarily improve forage quality at higher elevations, particularly where other environmental constraints remain dominant.

4.4. Soil–Forage Relationships

These contrasting responses can be better understood in light of the RDA results, which showed that forage nutritive parameters were strongly structured by soil chemical properties. Among the soil variables measured, P showed the strongest association with the observed variation in forage traits, followed by Ca, K, Mg, pH, and OM. This result is consistent with the central role of phosphorus in plant growth and with the influence of soil pH on nutrient availability [64,65]. In grassland systems, warming may also affect phosphorus dynamics through changes in plant uptake, microbial activity, and enzyme-mediated processes, with these responses varying according to temperature and soil chemical conditions [5,66]. The ordination separated pastures A and B from pasture C, with pastures A and B being associated with higher P, Ca, K, Mg, pH, as well as DM and fibre fractions, whereas pasture C was more closely associated with OM, CP, EE, and ash.
This suggests that the lower- and intermediate-altitude pastures operated under a more mineral-driven fertility regime, whereas the highest-altitude pasture was more closely linked to organic matter-related processes. Similar patterns have been reported in grasslands where nutrient supply, especially phosphorus balance, affects forage yield and quality, while organic matter contributes to nutrient buffering and greater system stability [67,68].
This interpretation explains why warming in pastures A and B was more often associated with higher DM and fibre fraction traits, particularly later in the season, whereas pasture C showed fewer and less consistent responses. Our previous study [20] also demonstrated a positive correlation between DM and fibre fractions in pastures A and B. This finding is in line with previous studies [20,29,69] and could be explained by a more rapid plant maturation, which increases the stem-to-leaf ratio and cell wall content, including lignin, due to higher temperatures during the warmer seasons. Perotti et al. [15] revealed that higher forage NDF and ADF contents are associated with sites with higher temperatures, lower precipitation, and higher soil K availability. Overall, the RDA suggests that warming responses depend on both temperature and local soil fertility.

4.5. Future Perspectives

This study provides new insights into how pasture systems in the Azores may respond to rising temperature across an altitudinal gradient. It improves current understanding of how rising temperature may influence forage production, chlorophyll content, and forage quality in this system. The results also show that soil fertility, season, and local site conditions must be considered when interpreting pasture responses to warming. Further work is needed to better understand how climate, vegetation, and management interact across different timescales.
In addition, government entities need to implement efficient adaptation strategies, such as defining grazing intensity based on pasture forage production and quality, and reducing stocking numbers to avoid pasture degradation, especially in lowland pastures. Furthermore, the effect of increasing temperature on forage productivity and quality still needs to be evaluated in the near future across different pasture management systems, including seminatural pastures.

5. Conclusions

Over the two years of study, experimental warming influenced pasture productivity, chlorophyll content, and forage nutritive quality along the altitudinal gradient, with responses varying across years and seasons. The most consistent positive responses occurred in the lower- and intermediate-altitude pastures, where warming increased forage productivity, chlorophyll content, and, during winter and early spring, crude protein and ash. However, warming also promoted higher fibre fractions later in the season, indicating accelerated plant maturation and a potential decline in digestibility.
The RDA showed that these responses were strongly associated with soil fertility gradients, particularly those related to P, Ca, K, Mg, pH, and OM, demonstrating that warming effects depended not only on temperature increase itself, but also on the edaphic context in which the pasture developed. Overall, the results indicate that climate warming is likely to alter both the quantity of forage produced and the seasonal patterns of forage quality, highlighting the need to integrate soil–plant relationships, productivity, physiology, and forage quality when evaluating the sustainability of pasture-based livestock systems under future climate scenarios.
These findings suggest that adaptation of pasture-based livestock systems to climate warming will depend not only on changes in forage production, but also on the ability to manage seasonal shifts in forage quality across contrasting soil and altitudinal conditions. Moreover, given the expected changes in precipitation patterns, effective adaptation strategies will be required to address both the challenges and opportunities associated with future climate change in this ecosystem.

Supplementary Materials

The following supporting information can be downloaded at https://www.mdpi.com/article/10.3390/su18126029/s1, Table S1: Sampling dates in pasture A (186 m a.s.l.), B (301 m a.s.l.) and C (386 m a.s.l.) in year 2020; Table S2: Sampling dates in pasture A (186 m a.s.l.), B (301 m a.s.l.) and C (386 m a.s.l.) in year 2021; Figure S1: Variation of the nutritive parameters of forage plants between treatments (control and open top chamber—OTC) among the three sampling dates: winter, early spring and late spring in pasture A (186 m a.s.l.) during year 2020; Figure S2: Variation of the nutritive parameters of forage plants between treatments (control and open top chamber—OTC) among the four sampling dates: winter, early spring, late spring and summer in pasture B (301 m a.s.l.) during year 2020; Figure S3: Variation of the nutritive parameters of forage plants between treatments (control and open top chamber—OTC) among the five sampling dates: winter, early spring, late spring, summer and autumn in pasture C (386 m a.s.l.) during year 2020; Figure S4: Variation of the nutritive parameters of forage plants between treatments (control and open top chamber—OTC) between the two sampling dates: winter and spring in pasture A (186 m a.s.l.) during year 2021; Figure S5: Variation of the nutritive parameters of forage plants between treatments (control and open top chamber—OTC) among the three sampling dates: winter, spring, and summer in pasture B (301 m a.s.l.) during year 2021; Figure S6: Variation of the nutritive parameters of forage plants between treatments (control and open top chamber—OTC) among the three sampling dates: winter, spring, and summer in pasture C (386 m a.s.l.) during year 2021.

Author Contributions

Conceptualization, C.D.M. and R.B.E.; Formal analysis, C.D.M., S.W.; Funding acquisition, R.B.E.; Investigation, C.D.M., S.W., C.S.A.M.M.D. and R.B.E.; Methodology, C.D.M., S.W., C.S.A.M.M.D., A.E.S.B., J.M. and R.B.E.; Project administration, R.B.E.; Resources, A.E.S.B., J.M. and R.B.E.; Supervision, R.B.E.; Validation, C.D.M. and R.B.E.; Visualization, C.D.M., S.W., C.S.A.M.M.D., H.P.B.N., A.E.S.B., J.M. and R.B.E.; Writing—original draft, C.D.M.; Writing—review and editing, C.D.M., R.B.E. and H.P.B.N. All authors interpreted the results and contributed to the final manuscript and C.D.M. lead the writing of the manuscript. All authors have read and agreed to the published version of the manuscript.

Funding

This work was supported by FEDER, in 85%, and by Azorean Public funds, 15%, through Operational Programme Azores 2020 under the project PASTURCLIM (ACORES-01-0145-FEDER-000082).

Institutional Review Board Statement

Not applicable.

Informed Consent Statement

Not applicable.

Data Availability Statement

The original contributions presented in this study are included in the article. Further inquiries can be directed to the corresponding author.

Acknowledgments

We gratefully acknowledge Virginia Pires for permitting us to use pastures A and B. We thank Francisco Reis of the AEAI/CLIMAAT_Azores project for providing climate data; Enésima Pereira of the Azorean Biodiversity Group for providing the imaging software; and Sébastien Lhoumeau of Sebeyes Production for providing the imaging software and the drone images.

Conflicts of Interest

The authors have declared that no competing interests exist.

References

  1. Dumont, B.; Andueza, D.; Niderkorn, V.; Lüscher, A.; Porqueddu, C.; Picon-Cochard, C. A Meta-Analysis of Climate Change Effects on Forage Quality in Grasslands: Specificities of Mountain and Mediterranean Areas. Grass Forage Sci. 2015, 70, 239–254. [Google Scholar] [CrossRef] [Scilit]
  2. IPCC. The Physical Science Basis. In Contribution of Working Group I to the Fifth Assessment Report of the Intergovernmental Panel on Climate Change; Stocker, T.F., Qin, D., Plattner, G.-K., Tignor, M., Allen, S.K., Boschung, J., Nauels, A., Xia, Y., Bex, V., Midgley, P.M., Eds.; Cambridge University Press: Cambridge, UK; New York, NY, USA, 2013; 1535p. [Google Scholar]
  3. Gelybó, G.; Tóth, E.; Farkas, C.; Horel, Á.; Kása, I.; Bakacsi, Z. Potential Impacts of Climate Change on Soil Properties. Agrokém. Talajt. 2018, 67, 121–141. [Google Scholar] [CrossRef] [Scilit]
  4. Mondal, S. Impact of Climate Change on Soil Fertility. In Climate Change and the Microbiome: Sustenance of the Ecosphere; Choudhary, D.K., Mishra, A., Varma, A., Eds.; Soil Biology; Springer International Publishing: Cham, Switzerland, 2021; pp. 551–569. [Google Scholar]
  5. Brevik, E.C. The Potential Impact of Climate Change on Soil Properties and Processes and Corresponding Influence on Food Security. Agriculture 2013, 3, 398–417. [Google Scholar] [CrossRef] [Scilit]
  6. Gerber, P.J.; Steinfeld, H.; Henderson, B.; Mottet, A.; Opio, C.; Dijkman, J.; Falcucci, A.; Tempio, G. Tackling Climate Change through Livestock: A Global Assessment of Emissions and Mitigation Opportunities; FAO: Rome, Italy, 2013. [Google Scholar]
  7. Godde, C.M.; Mason-D’Croz, D.; Mayberry, D.E.; Thornton, P.K.; Herrero, M. Impacts of Climate Change on the Livestock Food Supply Chain; a Review of the Evidence. Glob. Food Secur. 2021, 28, 100488. [Google Scholar] [CrossRef] [Scilit]
  8. Rojas-Downing, M.M.; Nejadhashemi, A.P.; Harrigan, T.; Woznicki, S.A. Climate Change and Livestock: Impacts, Adaptation, and Mitigation. Clim. Risk Manag. 2017, 16, 145–163. [Google Scholar] [CrossRef] [Scilit]
  9. Fan, M.; Shen, J.; Yuan, L.; Jiang, R.; Chen, X.; Davies, W.J.; Zhang, F. Improving Crop Productivity and Resource Use Efficiency to Ensure Food Security and Environmental Quality in China. J. Exp. Bot. 2012, 63, 13–24. [Google Scholar] [CrossRef] [Scilit]
  10. Cheng, M.; McCarl, B.; Fei, C. Climate Change and Livestock Production: A Literature Review. Atmosphere 2022, 13, 140. [Google Scholar] [CrossRef] [Scilit]
  11. Rust, J.M.; Rust, T. Climate Change and Livestock Production: A Review with Emphasis on Africa. South Afr. J. Anim. Sci. 2013, 43, 255–267. [Google Scholar] [CrossRef] [Scilit]
  12. Bathiany, S.; Dijkstra, H.; Crucifix, M.; Dakos, V.; Brovkin, V.; Williamson, M.S.; Lenton, T.M.; Scheffer, M. Beyond Bifurcation: Using Complex Models to Understand and Predict Abrupt Climate Change. Dyn. Stat. Clim. Syst. 2016, 1, dzw004. [Google Scholar] [CrossRef] [Scilit]
  13. Gómara, I.; Bellocchi, G.; Martin, R.; Rodríguez-Fonseca, B.; Ruiz-Ramos, M. Influence of Climate Variability on the Potential Forage Production of a Mown Permanent Grassland in the French Massif Central. Agric. For. Meteorol. 2020, 280, 107768. [Google Scholar] [CrossRef] [Scilit]
  14. Chaplin-Kramer, R.; George, M.R. Effects of Climate Change on Range Forage Production in the San Francisco Bay Area. PLoS ONE 2013, 8, e57723. [Google Scholar] [CrossRef] [Scilit]
  15. Perotti, E.; Huguenin-Elie, O.; Meisser, M.; Dubois, S.; Probo, M.; Mariotte, P. Climatic, Soil, and Vegetation Drivers of Forage Yield and Quality Differ across the First Three Growth Cycles of Intensively Managed Permanent Grasslands. Eur. J. Agron. 2021, 122, 126194. [Google Scholar] [CrossRef] [Scilit]
  16. Cavalheiro, G. (Ed.) PRAC—Programa Regional Para as Alterações Climáticas dos Açores; CAOS: Queluz, Portugal, 2017; 181p. [Google Scholar]
  17. Baizán, S.; Vicente, F.; Martínez-Fernández, A. Management Influence on the Quality of an Agricultural Soil Destined for Forage Production and Evaluated by Physico-Chemical and Biological Indicators. Sustainability 2021, 13, 5159. [Google Scholar] [CrossRef] [Scilit]
  18. Loucougaray, G.; Dobremez, L.; Gos, P.; Pauthenet, Y.; Nettier, B.; Lavorel, S. Assessing the Effects of Grassland Management on Forage Production and Environmental Quality to Identify Paths to Ecological Intensification in Mountain Grasslands. Environ. Manag. 2015, 56, 1039–1052. [Google Scholar] [CrossRef] [Scilit]
  19. Lee, J.M.; Clark, A.J.; Roche, J.R. Climate-Change Effects and Adaptation Options for Temperate Pasture-Based Dairy Farming Systems: A Review. Grass Forage Sci. 2013, 68, 485–503. [Google Scholar] [CrossRef] [Scilit]
  20. Melo, C.D.; Maduro Dias, C.S.A.M.; Wallon, S.; Borba, A.E.S.; Madruga, J.; Borges, P.A.V.; Ferreira, M.T.; Elias, R.B. Influence of Climate Variability and Soil Fertility on the Forage Quality and Productivity in Azorean Pastures. Agriculture 2022, 12, 358. [Google Scholar] [CrossRef] [Scilit]
  21. Liu, H.; Mi, Z.; Lin, L.; Wang, Y.; Zhang, Z.; Zhang, F.; Wang, H.; Liu, L.; Zhu, B.; Cao, G.; et al. Shifting Plant Species Composition in Response to Climate Change Stabilizes Grassland Primary Production. Proc. Natl. Acad. Sci. USA 2018, 115, 4051–4056. [Google Scholar] [CrossRef] [Scilit]
  22. Nunes, H.P.B.; Maduro Dias, C.; Abreu, A.; Borba, A.; Melo, C.D. Insights into Enteric Methane Emissions in Conventional and Organic Dairy Grazing Systems in Island Regions. Sustainability 2025, 17, 4944. [Google Scholar] [CrossRef] [Scilit]
  23. Peng, A.; Klanderud, K.; Wang, G.; Zhang, L.; Xiao, Y.; Yang, Y. Plant Community Responses to Warming Modified by Soil Moisture in the Tibetan Plateau. Arct. Antarct. Alp. Res. 2020, 52, 60–69. [Google Scholar] [CrossRef] [Scilit]
  24. Barbehenn, R.V.; Chen, Z.; Karowe, D.N.; Spickard, A. C3 Grasses Have Higher Nutritional Quality than C4 Grasses under Ambient and Elevated Atmospheric CO2: Elevated CO2 and Grass Nutritional Quality. Glob. Change Biol. 2004, 10, 1565–1575. [Google Scholar] [CrossRef] [Scilit]
  25. Bell, M.J.; Eckard, R.J.; Harrison, M.T.; Neal, J.S.; Cullen, B.R. Effect of Warming on the Productivity of Perennial Ryegrass and Kikuyu Pastures in South-Eastern Australia. Crop Pasture Sci. 2013, 64, 61. [Google Scholar] [CrossRef] [Scilit]
  26. Hatfield, J.L.; Prueger, J.H. Temperature Extremes: Effect on Plant Growth and Development. Weather Clim. Extrem. 2015, 10, 4–10. [Google Scholar] [CrossRef] [Scilit]
  27. Izaurralde, R.C.; Thomson, A.M.; Morgan, J.A.; Fay, P.A.; Polley, H.W.; Hatfield, J.L. Climate Impacts on Agriculture: Implications for Forage and Rangeland Production. Agron. J. 2011, 103, 371–381. [Google Scholar] [CrossRef] [Scilit]
  28. Capstaff, N.M.; Miller, A.J. Improving the Yield and Nutritional Quality of Forage Crops. Front. Plant Sci. 2018, 9, 535. [Google Scholar] [CrossRef] [Scilit]
  29. Lee, M.A.; Davis, A.P.; Chagunda, M.G.G.; Manning, P. Forage Quality Declines with Rising Temperatures, with Implications for Livestock Production and Methane Emissions. Biogeosciences 2017, 14, 1403–1417. [Google Scholar] [CrossRef] [Scilit]
  30. Berhe, G.; Aregawi, T.; Sisay, A. Seasonal Variation of Chemical Composition and In vitro Dry Matter Digestibility of Forages in Eastern Zone of Tigray. J. Sci. Dev. 2024, 12, 72–88. [Google Scholar] [CrossRef]
  31. Ghahramani, A.; Howden, S.M.; del Prado, A.; Thomas, D.T.; Moore, A.D.; Ji, B.; Ates, S. Climate Change Impact, Adaptation, and Mitigation in Temperate Grazing Systems: A Review. Sustainability 2019, 11, 7224. [Google Scholar] [CrossRef] [Scilit]
  32. Hou, X.; Kou, D.; Hirota, M.; Guo, T.; Lang, T. Altitudinal Variations of the Rate and Temperature Sensitivity of Soil Nitrogen Mineralization on the Qinghai-Tibetan Plateau. J. Plant Ecol. 2023, 16, rtad005. [Google Scholar] [CrossRef] [Scilit]
  33. Tito, R.; Vasconcelos, H.L.; Feeley, K.J. Mountain Ecosystems as Natural Laboratories for Climate Change Experiments. Front. For. Glob. Change 2020, 3, 38. [Google Scholar] [CrossRef] [Scilit]
  34. Li, C.; Peng, F.; Xue, X.; You, Q.; Lai, C.; Zhang, W.; Cheng, Y. Productivity and Quality of Alpine Grassland Vary with Soil Water Availability Under Experimental Warming. Front. Plant Sci. 2018, 9, 1790. [Google Scholar] [CrossRef] [Scilit]
  35. Fontes, J.C. Comportamento Hidrológico dos Solos Agrícolas da Terceira: Avaliação e Simulação com o Modelo OPUS. Ph.D. Thesis, Departamento de Ciências Agrárias, Universidade dos Açores, Angra do Heroísmo, Portugal, 1999. [Google Scholar]
  36. Welshofer, K.B.; Zarnetske, P.L.; Lany, N.K.; Thompson, L.A.E. Open-Top Chambers for Temperature Manipulation in Taller-Stature Plant Communities. Methods Ecol. Evol. 2018, 9, 254–259. [Google Scholar] [CrossRef] [Scilit]
  37. Richardson, A.D.; Duigan, S.P.; Berlyn, G.P. An Evaluation of Noninvasive Methods to Estimate Foliar Chlorophyll Content. New Phytol. 2002, 153, 185–194. [Google Scholar] [CrossRef] [Scilit]
  38. Zhu, J.; Tremblay, N.; Liang, Y. Comparing SPAD and atLEAF Values for Chlorophyll Assessment in Crop Species. Can. J. Soil Sci. 2012, 92, 645–648. [Google Scholar] [CrossRef] [Scilit]
  39. AOAC International. Official Methods of Analysis of AOAC International, 22nd ed.; Latimer, G.W., Jr., Ed.; AOAC International: Rockville, MD, USA, 2023. [Google Scholar]
  40. Goering, H.K.; Van Soest, P.J. Forage Fiber Analyses. Agricultural Handbook n_379; Agricultural Research Service, United States Department of Agriculture: Washington, DC, USA, 1970; pp. 1–19.
  41. Olsen, S.R.; Sommers, L.E. Phosphorus. In Methods of Soil Analysis; Page, A.L., Miller, R.H., Keeney, D.R., Eds.; American Society of Agronomy: Madison, WI, USA, 1982; pp. 403–427. [Google Scholar]
  42. EN 15936; Sludge, Treated Biowaste and Soil—Determination of Total Organic Carbon (TOC) by Dry Combustion. European Committee for Standardization (CEN): Brussels, Belgium, 2012.
  43. IBM Corp. IBM SPSS Statistics for Windows, Version 30.0; IBM Corp.: Armonk, NY, USA, 2024. [Google Scholar]
  44. Brown, M.B.; Forsythe, A.B. Robust Tests for the Equality of Variances. J. Am. Stat. Assoc. 1974, 69, 364–367. [Google Scholar] [CrossRef]
  45. Hui, W.; Gel, Y.R.; Gastwirth, J.L. Lawstat: An R Package for Law, Public Policy and Biostatistics. J. Stat. Softw. 2008, 28, 1–26. [Google Scholar] [CrossRef] [Scilit]
  46. Pinheiro, J.; Bates, D. Mixed-Effects Models in S and S-PLUS; Springer: New York, NY, USA, 2000. [Google Scholar]
  47. Akaike, H. A New Look at the Statistical Model Identification. IEEE Trans. Autom. Control 1974, 19, 716–723. [Google Scholar] [CrossRef] [Scilit]
  48. Lenth, R.V. Least-Squares Means: The R Package Lsmeans. J. Stat. Softw. 2016, 69, 1–33. [Google Scholar] [CrossRef] [Scilit]
  49. ter Braak, C.J.F.; Šmilauer, P. Canoco Reference Manual and User’s Guide: Software for Ordination (Version 5.0); Microcomputer Power: Ithaca, NY, USA, 2012. [Google Scholar]
  50. Karmakar, R.; Indranil, D.; Debashis, D.; Amitava, R. Potential Effects of Climate Change on Soil Properties: A Review. Sci. Int. 2016, 4, 51–73. [Google Scholar] [CrossRef] [Scilit]
  51. Cotrufo, M.F.; Lavallee, J.M. Chapter One-Soil Organic Matter Formation, Persistence, and Functioning: A Synthesis of Current Understanding to Inform Its Conservation and Regeneration. In Advances in Agronomy; Sparks, D.L., Ed.; Academic Press: Cambridge, MA, USA, 2022; Volume 172, pp. 1–66. [Google Scholar]
  52. Magdoff, F.; Weil, R.R. (Eds.) Soil Organic Matter in Sustainable Agriculture; CRC Press: Boca Raton, FL, USA, 2004. [Google Scholar]
  53. Solly, E.F.; Weber, V.; Zimmermann, S.; Walthert, L.; Hagedorn, F.; Schmidt, M.W.I. A Critical Evaluation of the Relationship Between the Effective Cation Exchange Capacity and Soil Organic Carbon Content in Swiss Forest Soils. Front. For. Glob. Change 2020, 3, 98. [Google Scholar] [CrossRef] [Scilit]
  54. Alhaithloul, H.A.S. Impact of Combined Heat and Drought Stress on the Potential Growth Responses of the Desert Grass Artemisia Sieberi Alba: Relation to Biochemical and Molecular Adaptation. Plants 2019, 8, 416. [Google Scholar] [CrossRef] [Scilit]
  55. Caudle, K.L.; Maricle, B.R. Effects of Flooding on Photosynthesis, Chlorophyll Fluorescence, and Oxygen Stress in Plants of Varying Flooding Tolerance. Trans. Kans. Acad. Sci. 2012, 115, 5–18. [Google Scholar]
  56. Cui, L.; Li, J.; Fan, Y.; Xu, S.; Zhang, Z. High Temperature Effects on Photosynthesis, PSII Functionality and Antioxidant Activity of Two Festuca Arundinacea Cultivars with Different Heat Susceptibility. Bot. Stud. 2006, 47, 61–69. [Google Scholar]
  57. Volk, M.; Suter, M.; Wahl, A.-L.; Bassin, S. Subalpine Grassland Productivity Increased with Warmer and Drier Conditions, but Not with Higher N Deposition, in an Altitudinal Transplantation Experiment. Biogeosciences 2021, 18, 2075–2090. [Google Scholar] [CrossRef] [Scilit]
  58. Zhang, Y.; He, N.; Yu, G. Opposing Shifts in Distributions of Chlorophyll Concentration and Composition in Grassland under Warming. Sci. Rep. 2021, 11, 15736. [Google Scholar] [CrossRef] [Scilit]
  59. Li, T.; Peng, L.; Wang, H.; Zhang, Y.; Wang, Y.; Cheng, Y.; Hou, F. Multi-Cutting Improves Forage Yield and Nutritional Value and Maintains the Soil Nutrient Balance in a Rainfed Agroecosystem. Front. Plant Sci. 2022, 13, 825117. [Google Scholar] [CrossRef] [Scilit]
  60. Miao, Y.; Liu, M.; Xuan, J.; Xu, W.; Wang, S.; Miao, R.; Wang, D.; Wu, W.; Liu, Y.; Han, S. Effects of Warming on Soil Respiration during the Non-Growing Seasons in a Semiarid Temperate Steppe. J. Plant Ecol. 2020, 13, 288–294. [Google Scholar] [CrossRef] [Scilit]
  61. Tao, X.; Yang, Z.; Feng, J.; Jian, S.; Yang, Y.; Bates, C.T.; Wang, G.; Guo, X.; Ning, D.; Kempher, M.L.; et al. Experimental Warming Accelerates Positive Soil Priming in a Temperate Grassland Ecosystem. Nat. Commun. 2024, 15, 1178. [Google Scholar] [CrossRef] [Scilit]
  62. Fariaszewska, A.; Aper, J.; Van Huylenbroeck, J.; Baert, J.; De Riek, J.; Staniak, M.; Pecio, Ł. Mild Drought Stress-Induced Changes in Yield, Physiological Processes and Chemical Composition in Festuca, Lolium and Festulolium. J. Agron. Crop Sci. 2017, 203, 103–116. [Google Scholar] [CrossRef] [Scilit]
  63. Mountousis, I.; Papanikolaou, K.; Stanogias, G.; Chatzitheodoridis, F.; Roukos, C. Seasonal Variation of Chemical Composition and Dry Matter Digestibility of Rangelands in NW Greece. J. Cent. Eur. Agric. 2008, 9, 547–555. [Google Scholar]
  64. Corbett, D.; Wall, D.P.; Lynch, M.B.; Tuohy, P. The influence of phosphorus application and varying soil pH on soil and herbage properties across a range of grassland soils with impeded drainage. J. Agric. Sci. 2022, 160, 516–527. [Google Scholar] [CrossRef] [Scilit]
  65. Penn, C.J.; Camberato, J.J. A Critical Review on Soil Chemical Processes That Control How Soil pH Affects Phosphorus Availability to Plants. Agriculture 2019, 9, 120. [Google Scholar] [CrossRef] [Scilit]
  66. Hu, W.; Tan, J.; Shi, X.; Lock, T.R.; Kallenbach, R.L.; Yuan, Z. Nutrient Addition and Warming Alter the Soil Phosphorus Cycle in Grasslands: A Global Meta-Analysis. J. Soils Sediments 2022, 22, 2608–2619. [Google Scholar] [CrossRef] [Scilit]
  67. Bi, Y.; Yang, G.; Wei, Y.; Wilson, G.W.T.; Wei, B.; He, Y.; Yu, H.; Liu, N.; Zhang, Y. Low Legume-Grass Seeding Ratio Combined with Phosphorus Fertilization Promotes Forage Yield and Soil Quality in Managed Grasslands. Agron. Sustain. Dev. 2024, 44, 36. [Google Scholar] [CrossRef] [Scilit]
  68. Filipiak, M.; Kuka, K. Comparison of Chemical Soil Properties of Temperate Grassland and Arable Land—A Review. Soil Syst. 2026, 10, 20. [Google Scholar] [CrossRef] [Scilit]
  69. Koidou, M.; Mountousis, I.; Dotas, V.; Zagorakis, K.; Yiakoulaki, M. Temporal Variations of Herbage Production and Nutritive Value of Three Grasslands at Different Elevation Zones Regarding Grazing Needs and Welfare of Ruminants. Arch. Anim. Breed. 2019, 62, 215–226. [Google Scholar] [CrossRef] [Scilit]
Figure 1. Digital elevation model (DEM) of Terceira Island in the Azores archipelago, with the location of pastures A, B and C marked with three different symbols.
Sustainability 18 06029 g001
Figure 2. (a) Aerial photo of the plots in pasture C (386 m a.s.l.) and (b) the respective experimental design.
Sustainability 18 06029 g002
Figure 3. Net forage productivity (g m−2) per treatment (control and OTC) across pastures A (186 m a.s.l.), B (301 m a.s.l.) and C (386 m a.s.l.) in 2020 and 2021. Significance from the linear mixed-effects model is represented on the graph as follows: ns = not significant; * p < 0.05; *** p < 0.001.
Sustainability 18 06029 g003
Figure 4. Mean chlorophyll content per treatment (control and open top chamber—OTC) in pastures A (186 m a.s.l.), B (301 m a.s.l.) and C (386 m a.s.l.) over two years of study—2020 and 2021. Significance indicates pairwise differences between treatments within each pasture and year, based on a linear mixed-effects model. ns = not significant; * p < 0.05; ** p < 0.01; *** p < 0.001.
Sustainability 18 06029 g004
Figure 5. Redundancy analysis (RDA) of the relationships between soil chemical elements (red lines) and forage nutritive parameters (blue lines) from pastures A (orange squares), B (yellow stars) and C (green triangles) using Canoco 5.0. DM—dry matter, CP—crude protein, NDF—neutral detergent fibre, ADF—acid detergent fibre, ADL—acid detergent lignin, EE—ether extract, Ash—mineral ash, P—Olsen phosphorus, K—potassium, Mg—magnesium, Ca—calcium, OM—organic matter, pH.
Sustainability 18 06029 g005
Table 1. Temperature, relative humidity and soil parameters in control and open top chamber (OTC) plots in pastures A, B and C during 2020 and 2021.
Pasture A (186 m)Pasture B (301 m)Pasture C (386 m)
ParametersControlOTCsControlOTCsControlOTCs
Year 2020
Mean monthly temperature (°C)20.07 ± 6.88 a21.38 ± 8.23 b18.83 ± 6.56 a20.56 ± 8.13 b17.10 ± 5.98 a17.89 ± 6.78 b
Mean monthly relative humidity (%)77.52 ± 17.85 a73.38 ± 20.71 b82.42 ± 16.76 a77.81 ± 19.89 b89.17 ± 13.67 a86.10 ± 15.80 b
pH6.80 ± 0.06 a6.69 ± 0.86 a6.32 ± 0.05 a6.30 ± 0.02 a5.58 ± 0.05 a5.52 ± 0.05 a
P (mg kg−1)96.55 ± 3.89 a105.40 ± 6.49 a81.05 ± 5.78 a74.65 ± 4.13 a25.65 ± 2.67 a30.30 ± 2.26 a
K (mg kg−1)377.75 ± 34.59 a459.90 ± 35.20 a162.80 ± 11.69 a128.80 ± 13.24 b98.10 ± 16.82 a96.90 ± 11.10 a
Ca (mg kg−1)1693.40 ± 47.16 a1735.70 ± 65.05 a1290.05 ± 36.17 a1256.45 ± 70.45 a433.30 ± 36.14 a469.05 ± 28.46 a
Mg (mg kg−1)336.70 ± 21.48 a345.00 ± 17.49 a131.45 ± 8.35 a148.70 ± 7.47 a153.20 ± 15.92 a149.60 ± 11.32 a
OM (%)6.56 ± 0.23 a7.11 ± 0.29 a8.16 ± 0.31 a9.11 ± 0.18 b11.20 ± 0.24 a11.44 ± 0.23 a
Year 2021
Mean monthly temperature18.63 ± 6.86 a19.96 ± 8.24 b16.54 ± 6.00 a19.06 ± 8.06 b16.41 ± 6.31 a17.22 ± 6.93 b
Mean monthly relative humidity82.81 ± 15.30 a77.98 ± 19.84 b85.61 ± 13.64 a79.76 ± 18.44 b90.73 ± 11.58 a89.86 ± 14.32 b
pH6.70 ± 0.06 a6.69 ± 0.06 a6.30 ± 0.04 a6.23 ± 0.28 a5.73 ± 0.06 a5.61 ± 0.04 a
P (mg kg−1)85.35 ± 5.57 a94.10 ± 6.84 a69.90 ± 7.41 a68.60 ± 5.92 a27.60 ± 3.70 a31.55 ± 2.48 a
K (mg kg−1)333.15 ± 42.60 a407.10 ± 39.77 a158.45 ± 23.07 a128.15 ± 18.76 a52.45 ± 6.03 a47.50 ± 5.68 a
Ca (mg kg−1)1629.15 ± 46.83 a1833.65 ± 72.75 b1134.65 ± 49.13 a1281.10 ± 51.19 b268.20 ± 19.71 a242.15 ± 16.54 a
Mg (mg kg−1)311.90 ± 14.19 a349.15 ± 20.25 a125.00 ± 9.54 a158.85 ± 10.16 b87.45 ± 7.22 a77.90 ± 5.60 a
OM (%)7.30 ± 0.25 a7.87 ± 0.16 b8.52 ± 0.34 a9.54 ± 0.17 b9.90 ± 0.29 a10.00 ± 0.26 a
Captions: °C—degrees celsius; %—percentage; mg kg−1—milligram per kilogram. Values are mean values of 10 samples ± SE. The means with different letters are significantly different (Tukey test, p < 0.05).
Table 2. Differences in net productivity between treatments (control and OTCs) in pastures A, B and C during 2020 and 2021. n.s. = not significant; * p < 0.05; ** p < 0.01; *** p < 0.001.
YearPastureContrastEstimateSEdfT-Ratiop-Value
2020AControl-OTC−1.0630.486234−2.185*
BControl-OTC−0.7590.610234−1.246n.s.
CControl-OTC−0.0450.194234−0.231n.s.
2021AControl-OTC−2.3070.486194−4.743***
BControl-OTC−1.8170.528194−3.443**
CControl-OTC−0.2690.217194−1.237n.s.
Table 3. Differences in total chlorophyll content between treatments (control and OTCs) in pastures A, B and C during 2020 and 2021. n.s. = not significant; * p < 0.05; ** p < 0.01; *** p < 0.001.
YearPastureContrastEstimateStd. Errordft-Valuep-Value
2020AControl − OTC−2.6400.91754.000−2.877**
BControl − OTC−4.0371.82054.000−2.222*
CControl − OTC1.6051.04054.0001.546n.s.
2021AControl − OTC−4.7861.10054.000−4.362***
BControl − OTC−3.0572.35054.000−1.303n.s.
CControl − OTC−0.02851.0454−0.027n.s.
Table 4. Differences in nutritive parameters between treatments (control and OTCs) in pastures A, B and C, during winter, early spring, late spring, summer and autumn of 2020. n.s. = not significant; * p < 0.05; ** p < 0.01; *** p < 0.001.
Pasture A (186 m)Pasture B (301 m)Pasture C (386 m)
2020MetricEstimateSEp-ValueEstimateSEp-ValueEstimateSEp-Value
WinterDM2.191.43n.s.1.641.10n.s.−0.100.64n.s.
CP−1.910.57***−2.350.64***−0.620.64n.s.
NDF0.861.06n.s.0.401.10n.s.3.411.10***
ADF0.530.56n.s.−2.120.59***−0.580.57n.s.
ADL0.960.27***0.100.19n.s.0.530.21*
EE−0.020.11n.s.0.010.13n.s.0.210.13n.s.
Ash−1.300.31***−1.430.35***−1.460.36***
Early springDM3.451.50*2.901.17*1.160.76n.s.
CP−3.220.65***−3.660.69***−1.930.70*
NDF−4.541.19***−4.991.21***−1.991.21n.s.
ADF0.200.63n.s.−2.450.65***−0.910.64n.s.
ADL0.750.29*−0.110.21n.s.0.320.23n.s.
EE−0.080.13n.s.−0.060.14n.s.0.150.14n.s.
Ash−0.580.34n.s.−0.710.37n.s.−0.730.38n.s.
Late springDM3.481.50*2.931.18*1.180.76n.s.
CP0.620.650.340.180.70n.s.1.910.700.01
NDF−2.711.19*−3.171.22*−0.161.21n.s.
ADF0.470.63n.s.−2.190.66***−0.650.64n.s.
ADL−0.420.29n.s.−1.280.21***−0.850.24***
EE0.050.13n.s.0.070.15n.s.0.280.14n.s.
Ash0.480.34n.s.0.350.38n.s.0.320.39n.s.
SummerDM---1.831.10n.s.0.090.64n.s.
CP---−0.440.71n.s.1.290.71n.s.
NDF---0.471.21n.s.3.471.20*
ADF---−1.810.64**−0.270.62n.s.
ADL---−0.180.20n.s.0.250.22n.s.
EE---−0.140.15n.s.0.070.14n.s.
Ash---−0.870.39*−0.890.40*
AutumnDM------−0.600.67n.s.
CP------0.200.88n.s.
NDF------−0.241.47n.s.
ADF------0.260.76n.s.
ADL------0.180.30n.s.
EE------0.910.17***
Ash------0.050.50n.s.
Dry matter (DM: %), crude protein (CP: % DM), neutral detergent fibre (NDF: % DM), acid detergent fibre (ADF: % DM), acid detergent lignin (ADL: % DM), ether extract (EE: % DM), ash (% DM).
Table 5. Differences in nutritive parameters between treatments (control and OTCs) in pastures A, B and C, during winter, early spring, late spring, summer and autumn of 2021. n.s. = not significant; * p < 0.05; ** p < 0.01; *** p < 0.001.
Pasture A (186 m)Pasture B (301 m)Pasture C (386 m)
2021MetricEstimateSEp-ValueEstimateSEp-valueEstimateSEp-Value
WinterDM3.161.43n.s.2.611.10**0.860.64n.s.
CP−2.660.58***−3.100.64***1.360.65*
NDF−1.011.06n.s.−1.461.11n.s.1.541.10n.s.
ADF0.180.56n.s.−2.470.59***−0.930.57n.s.
ADL0.720.27**−0.150.19n.s.0.280.21n.s.
EE−0.040.11n.s.−0.010.13n.s.0.190.13n.s.
Ash−0.150.31***−0.280.35n.s.−0.310.36n.s.
SpringDM0.721.49n.s.0.171.17n.s.−1.580.76*
CP−1.120.64n.s.−1.560.69**0.180.70n.s.
NDF0.481.17n.s.0.031.21n.s.3.031.20*
ADF1.190.62n.s.−1.460.65**0.070.63n.s.
ADL−0.130.28n.s.−1.000.21***−0.570.23*
EE−0.150.12n.s.−0.130.14n.s.0.080.14n.s.
Ash0.740.34*0.610.37n.s.0.590.38n.s.
SummerDM---2.801.10n.s.1.060.64n.s.
CP---−1.190.71n.s.0.550.71n.s.
NDF---−1.401.21n.s.1.601.20n.s.
ADF---−2.160.64***−0.620.62n.s.
ADL---−0.420.20***0.010.22n.s.
EE---−0.160.15n.s.0.050.14n.s.
Ash---0.280.39n.s.0.250.40n.s.
AutumnDM------0.370.68n.s.
CP------−0.550.89n.s.
NDF------−2.111.49n.s.
ADF------−0.080.77n.s.
ADL------−0.070.30n.s.
EE------0.890.17***
Ash------1.200.50*
Dry matter (DM: %), crude protein (CP: % DM), neutral detergent fibre (NDF: % DM), acid detergent fibre (ADF: % DM), acid detergent lignin (ADL: % DM), ether extract (EE: % DM), ash (% DM).
Disclaimer/Publisher’s Note: The statements, opinions and data contained in all publications are solely those of the individual author(s) and contributor(s) and not of MDPI and/or the editor(s). MDPI and/or the editor(s) disclaim responsibility for any injury to people or property resulting from any ideas, methods, instructions or products referred to in the content.