Abstract
A pot experiment was carried out to evaluate the effects of composts, vermicomposts, and mineral fertilization on maize (Zea mays L.) growth, grain quality, soil chemical properties, and nematode communities. Eight treatments were tested, including organic amendments combined with mineral nitrogen, exclusive mineral fertilization, and an unfertilized control. Soil chemical properties, including pH, salinity, nitrogen compounds, and macro- and microelements, varied notably across treatments. Nematode community analysis revealed distinct patterns among treatments: Shannon diversity was moderate and relatively stable across most treatments, but a statistically significant reduction was recorded in treatment 7. In contrast, the Plant Parasitic Index (PPI) varied significantly, reflecting differences in community maturity and parasitic pressure. Bacterivores and fungivores indicated active nutrient cycling, while omnivores and predators reflected soil food web stability. Fertilization treatments significantly affected maize grain development. The highest thousand-kernel weight (TKW) was recorded in treatment 6 (+8.9% vs. control) and treatment 4 (+7.4% vs. control). The kernel number per cob was greatest in treatments 4 and 5 (+38% and +32%), with corresponding increases in grain mass per cob (+48% and +40%). The mean cob core weight ranged from 20.1 g in the control treatment to 30.2 g in treatment 1. The greatest increases compared to the control were observed in treatments 1 and 5, amounting to 50.2% and 44.8%, respectively. Overall, fertilization influenced grain quality, soil chemistry, and nematode communities, highlighting the importance of integrating organic and mineral amendments for sustainable crop production.
1. Introduction
Inorganic fertilizers supply plants with readily bioavailable nutrients, including nitrogen (N), phosphorus (P), and potassium (K). Adequate nitrogen availability promotes vegetative growth, enhances biomass accumulation, and improves the nutritional quality of aboveground plant tissues [1,2]. However, long-term application of inorganic fertilizers often leads to soil acidification, eutrophication, and disruption of nutrient balance [3,4]. Moreover, the high cost of inorganic fertilizers limits their widespread use.
According to the Food and Agriculture Organization (FAO) [5], sustainable agriculture is the capacity to maintain food production in an environmentally sound, economically viable, and socially responsible way. In this context, organic fertilizers represent a sustainable alternative that enhances soil physicochemical properties and mitigates environmental impacts [6,7,8,9]. Additionally, organic fertilizers have been reported to improve plant stress tolerance [10]. Nevertheless, the release and availability of nutrients from organic fertilizers are typically slower and not always synchronized with the nutrient requirements of cultivated crops [11]. For this reason, in agricultural practice, organic fertilizers are frequently applied in combination with mineral fertilizers in appropriate proportions.
Generally, organic fertilizers are made from the composting of animal manure, household waste, municipal waste and agriculture waste [12]. Composting converts organic waste into valuable soil amendments, enhancing soil organic matter, microbial activity, and nutrient availability [13]. The application of organic fertilizers enhances soil organic matter, enzymatic activities, and microbial function, thereby promoting plant growth and yield. Shakoor et al. [14] reported that manure application improves soil fertility and enhances crop productivity. However, organic fertilizers typically contain low nutrient concentrations, making their large-scale use in agriculture challenging without supplementation with chemical fertilizers [15]. The nutrient content of organic fertilizers can be highly inconsistent, making precise nutrient management for crops difficult.
In the cultivation of high-yielding maize varieties, mineral nitrogen fertilization is particularly important. On one hand, nitrogen increases yield; on the other hand, it can cause environmental problems [16,17,18]. Kandil et al. [19] report that high nitrogen doses significantly increased several maize parameters, including plant height, leaf area index (LAI), soil–plant analysis development (SPAD), number of kernels per cob, thousand-kernel weight, grain yield, and protein content. They conclude that new hybrid maize varieties require high nitrogen rates. Other authors [20,21] also demonstrated that maize requires high fertilization, particularly with nitrogen, to achieve high grain yields. However, Song et al. [17] reported that the excessive use of chemical fertilizers can lead to environmental issues such as soil degradation, nutrient leaching, water contamination, and greenhouse gas emissions. Therefore, in maize cultivation, they recommend replacing inorganic fertilizers with organic or alternative fertilizers without significantly reducing yield. Previous studies [22,23,24,25] have demonstrated that integrating inorganic and organic fertilizers in maize cultivation contributes to environmentally sound agricultural production. Building on this background, the present study aims to deepen understanding by assessing the effects of various compost and vermicompost types on maize yield, soil chemical properties, and nematode community composition under controlled conditions.
Biodiversity within composting systems involves a variety of microorganisms including nematodes [26]. Integrating compost application with nematode-based assessment supports sustainable agriculture and ecological engineering. Nematode assemblage characteristics, such as community abundance, diversity, and composition, serve as key indicators of environmental conditions and soil ecosystem health [27,28,29]. Changes in the soil ecological environment can be assessed using a range of ecological indices calculated from the structure of nematode communities, including diversity and functional indices [30]. Monitoring nematode communities provides insight into soil quality, organic matter dynamics, and the effects of agricultural practices. Nematodes serve as sensitive bioindicators of soil function [31]. Bacterivores and fungivores reflect microbial activity and nutrient cycling; predatory and omnivorous nematodes indicate food web complexity and ecosystem stability; plant-parasitic species reveal root health and crop risk [32,33].
This study aimed to evaluate organic and mineral amendments, alongside nematode-based soil diagnostics, to enhance maize yield and grain quality. We hypothesized that (1) integrated fertilization strategies combining organic and mineral inputs enhance both crop performance and soil ecological balance; (2) soil chemical variability is closely linked with the abundance of specific nematode trophic groups; and (3) organic and mineral fertilizers drive distinct changes in maize soil nematode communities.
2. Materials and Methods
2.1. Experiment Design
The pot experiment was conducted in 2024 in the laboratory of the Department of Crop Production at the University of Rzeszów, Poland. Plastic pots (20 L volume, 30 cm diameter) were filled with Haplic Cambisol (Cmha) [34], a soil obtained from the Experimental Station of the University of Rzeszów, located in Krasne near Rzeszów, Poland.
The soil used in the experiment was acidic (pH 5.1) with low salinity (0.36 g·L−1 NaCl). The content of nitrogen was determined at the level of 105.6 mg·kg−1 (N-NO3) and 24 mg·kg−1 (N-NH4), phosphorus at 69 mg·kg−1, potassium at 124.6 mg·kg−1, calcium at 424.4 mg·kg−1, and magnesium at 88 mg·kg−1. The concentrations of micronutrients were recorded at the following levels: iron 231 mg·kg−1, manganese 115.8 mg·kg−1, copper 4.98 mg·kg−1, zinc 12.56 mg·kg−1, and boron 1.47 mg·kg−1. The organic carbon content was determined at the level of 1.98%.
Previously prepared composts, described in detail by Zapałowska et al. [26], were applied. Eight treatment combinations were tested:
- (1)
- Compost (A) (obtained from sewage sludge and sawdust) + mineral nitrogen fertilizer (75 kg∙ha−1 N);
- (2)
- Compost (B) (obtained from sewage sludge, sawdust, and green waste) + mineral nitrogen fertilizer (75 kg∙ha−1 N);
- (3)
- Compost (C) (obtained from green waste and sawdust) + mineral nitrogen fertilizer (75 kg∙ha−1 N);
- (4)
- Vermicompost (D) (derived from sewage sludge and sawdust processed by Eisenia fetida) + mineral nitrogen fertilizer (75 kg∙ha−1 N);
- (5)
- Vermicompost (E) (derived from a mixture of sewage sludge, sawdust, and green waste processed by Eisenia fetida) + mineral nitrogen (75 kg∙ha−1 N);
- (6)
- Vermicompost (F) (prepared from green waste and sawdust, processed by Eisenia fetida)+ mineral nitrogen fertilizer (75 kg∙ha−1 N);
- (7)
- Mineral fertilization (NPK)—exclusive use of mineral fertilizers at recommended rates (150 kg∙ha−1 N, 96 kg∙ha−1 P2O5, and 96 kg∙ha−1 K2O).
- (8)
- Control (soil without any fertilizer or amendment applied).
A single-factor experiment was carried out in three replications.
The chemical composition of the composts used in the experiment is presented in Table 1. The pH ranged from slightly acidic (5.8 in vermicompost D) to alkaline (8.1 in vermicompost F). Phosphorus content was the highest in compost A (13.00 g·kg−1), while potassium was most abundant in vermicompost E (7.63 g·kg−1). The highest total nitrogen concentration was recorded in compost A (4.02%), whereas the lowest was found in compost C (1.01%). Calcium and magnesium contents showed moderate variation, with maximum values of 2.34% Ca (vermicompost F) and 0.51% Mg (vermicompost F). The C/N ratio ranged from 19.25 (compost A) to 37.72 (compost C), indicating differences in compost maturity and nutrient availability.

Table 1.
Chemical properties of composts (A), (B), (C) and vermicomposts (D), (E), (F) used in experiment.
The doses of compost, vermicompost, and mineral nitrogen in treatments 1 to 6 were calculated per pot to supply 150 kg·ha−1 of nitrogen (Pulrea + INu, 46% N), while other nutrients were not balanced, assuming that soil fertility would improve. No mineral P or K fertilization was applied in treatments 1–6.
In treatment 7, mineral fertilization involved two fertilizers: Polifoska®8 (8% N, 24% P2O5, 24% K2O) and Pulrea + INu (46% N). The doses of NPK fertilizers were calculated so that each pot received 150 kg·ha−1 N, 96 kg·ha−1 P2O5, and 96 kg·ha−1 K2O. This represents standard NPK fertilization practice for maize in the study area.
2.2. Seed Material
Seeds of maize cultivar GS 210 (Agro Seed Sp. z o.o., Brzezie, Poland) were originally treated with two active substances: metalaxyl and prothioconazole.
Maize seeds were sown on 5 April 2024, three seeds per pot. Pots were then placed in growth chambers (Model GC-300/1000; JEIO Tech Co., Ltd., Seoul, Republic of Korea) under the following conditions: temperature 20 ± 1 °C, relative humidity 60 ± 3%, photoperiod 16/8 h (L/D), and maximum light intensity of approximately 300 µmol m−2 s−1 during the day. Soil moisture was maintained at 60% of field water capacity. Pot positions were randomized every 5 days.
2.3. Soil Analysis
Soil chemical properties, including pH, salinity (as total dissolved salts), and the content of plant-available nutrients, were determined using a standardized universal method [33]. Readily available forms of nitrogen (N-NO3 and N-NH4), phosphorus (P), potassium (K), magnesium (Mg), and calcium (Ca) were extracted with 0.03 N acetic acid at a soil-to-extractant volume ratio of 1:10. In the soil extracts, nitrate (N-NO3) and ammonium (N-NH4) were measured potentiometrically using ion-selective electrodes (Thermo Scientific, Waltham, MA, USA, NO3−: model 93-07; NH4+: model 93-1801), while phosphorus (P) was determined by a colorimetric method.
The remaining macroelements were determined in the soil using atomic absorption spectroscopy (AAS, Thermo Electron Corp., M Series, Waltham, MA, USA). Potassium (K) was measured using a cathode (hollow) lamp at a wavelength of 766.5 nm, magnesium (Mg) at 285.2 nm, calcium (Ca) at 422.9 nm, and sodium (Na) at 589.0 nm. The content of the remaining elements was determined using an inductively coupled plasma optical emission spectrometer (ICP-OES, Perkin-Elmer OPTIMA 2000 DV, PerkinElmer Inc., Waltham, MA, USA). Each element was measured at its characteristic wavelength [35,36,37,38,39]. Organic matter content was determined by dry combustion in a muffle furnace at 550 °C. The results are expressed as a percentage of dry organic matter (% DM).
Organic carbon content (C org) was calculated based on the organic matter using the conversion factor specified in [40].
2.4. Nematode Isolation and Analysis
Soil samples (500 cm3) were collected, and four 100 cm3 subsamples from each were processed using the centrifugation method modified by Szczygieł [41]. Nematodes were extracted, counted, and assigned to five trophic groups: bacterivores, fungivores, plant-parasitic nematodes, predators, and omnivores. Population densities are reported per 100 cm3 of soil. Analysis of the nematode was carried out according to Stefanovska et al. [42].
Briefly, 500 cm3 of the collected soil sample was gently mixed and separated into 100 cm3 subsamples. The sediment suspension was transferred for centrifugation at 2000× g (RCF) for 3 min. The supernatant was discarded, and the precipitate was resuspended using 80 cm3 of 1 molar sucrose solution.
The tubes were subjected to a final centrifugation at 2000× g (relative centrifugal force) for 2 min. The supernatant, containing the nematodes, was passed through a 25 μm sieve and rinsed three times with water to remove sucrose from the nematode bodies. The collected nematodes were then transferred to glass containers. To ensure thermal inactivation, the nematodes were treated with a 6% formalin solution at 90 °C, followed by fixation with an equal volume of water.
The isolated nematodes were transferred to a fixation container containing the S1 solution, which consisted of 20 cm3 of 96% ethanol, 1 cm3 of glycerol, and 79 cm3 of distilled water. These containers were then placed in a desiccator with a thin layer of 96% ethanol and subsequently moved to an incubator at 40 °C. After 24 h in the desiccator, S2 solution-composed of 93 cm3 of 96% ethanol and 7 cm3 of glycerol-was gradually added to the nematodes, with a few drops introduced each hour over 8 h. The nematodes were found to become fully saturated with glycerol after 24 h in the incubator.
For microscopic observation, nematodes embedded in glycerol were mounted on glass slides using drops of anhydrous glycerol, following the paraffin ring method. Identification was based on morphological characteristics, examined with a Carl Zeiss Jena A-Scope microscope and guided by the diagnostic keys of Brzeski [43] and Andrássy [44].
Next, three ecological indices were calculated for each sample to further assess soil nematode community structure and ecological status:
- Maturity Index (MI), calculated following Bongers [45,46]: ∑vini/∑ni, where vi is the colonizer–persister (c-p) value assigned to taxon i, and ni is the number of nematodes in each of the taxa that meet the criteria;
- Shannon Diversity Index (H’): H’ = −∑Pi (lnPi) (Pi is the proportion of the genus divided by the total nematode abundance in the sample),
- Plant Parasitic Index (PPI), comparable to the MI but computed only for the plant-feeding nematodes.
Calculations of the Shannon diversity index (H’) for individual taxa were performed using the PAST software, version 5.3. [47].
Nematode-specific indices were calculated using the NINJA tool (https://shiny.wur.nl/ninja/), following the methodology of Sieriebriennikov et al. [48]. NINJA is an automated system for nematode-based biological monitoring, allowing for the computation of various ecological and functional indices.
2.5. Biometric and Chemical Characteristics of Plants
The developmental stages of maize were recorded according to the BBCH scale (Bundesanstalt, Bundessortenamt und Chemische Industrie) [49].
At the 1-leaf stage (11 BBCH), plants were thinned to one per pot. At the 4-leaf stage (14 BBCH), pots were transferred to a greenhouse with natural light and a temperature of 20 ± 1 °C. Soil moisture was maintained at 60% of field water capacity. The experiment continued until full maturity (89 BBCH), after which plants were harvested and biometric measurements were performed: thousand kernel weight (TKW), number of kernels per cob, mass of kernel per cob, cob core.
The chemical composition of grains (protein, fat, fiber, ash, and dry matter) was determined with near-infrared spectroscopy using a FT-LSD MPA spectrometer (Bruker, Karlsruhe, Germany) at the Department of Crop Production of the University of Rzeszów. This instrument applies Fourier Transform Near-Infrared (FT-NIR) spectroscopy, which enables rapid, non-destructive analysis of liquid, solid, and semi-solid materials.
2.6. Statistical Analysis
Data were analyzed using Statistica 13.3 (StatSoft Inc., Hamburg, Germany). The normality of data distribution was assessed using the Shapiro–Wilk test, and the homogeneity was verified using Levene’s test. A one-way analysis of variance (ANOVA) was then performed, followed by Fisher’s least significant difference (LSD) and Tukey’s post hoc tests (p < 0.05). Pearson correlation coefficients were adjusted using the Bonferroni correction. Sample sizes were determined based on pilot experiments, with power analysis confirming that they were sufficient to detect the observed effects.
3. Results
3.1. Chemical Properties of Treatment Combination
The analysis of chemical parameters revealed significant differences among the treatments. pH ranged from 5.1 to 6.4, with the lowest value observed in treatment 8 (5.1) and the highest in treatment 6 (6.4) (Figure 1A).
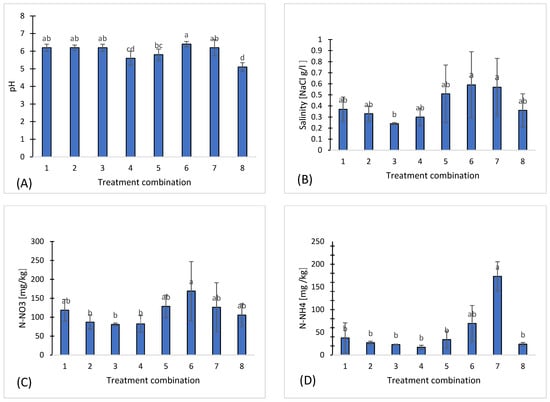
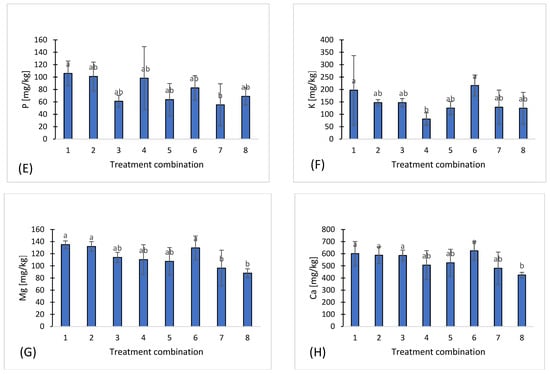
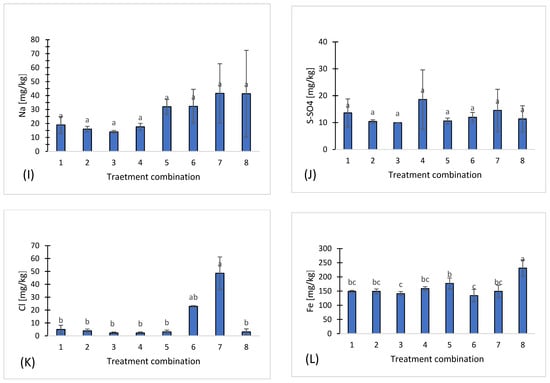
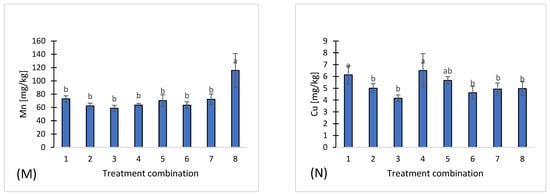
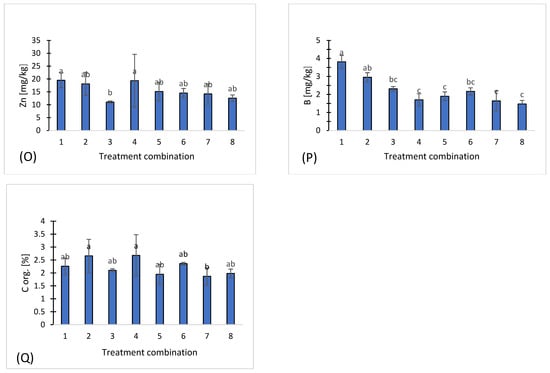
Figure 1.
Chemical properties of eight treatments: pH (A), salinity (B), nitrate (C), ammonium (D), phosphorus (E), potassium (F), magnesium (G), calcium (H), sodium (I), sulfates (J), chloride (K), iron (L), manganese (M), copper (N), zinc (O), boron (P), organic carbon (Q). Different letters indicate significant differences (p < 0.05), (n = 3). Bars represent standard deviation (SD).
Salinity (NaCl) varied between 0.24 g·L−1 in treatment 3 and 0.59 g·L−1 in treatment 6, indicating moderate variability among the samples (Figure 1B).
Macroelements showed considerable variation. Regarding nitrogen compounds, nitrate (N-NO3) concentrations ranged from 80.6 mg·kg−1 in treatment 3 to 169 mg·kg−1 in treatment 6 (Figure 1C), whereas ammonium (N-NH4) exhibited higher variability, ranging from 17 mg·kg−1 in treatment 4 to 173.3 mg·kg−1 in treatment 7 (Figure 1D).
Phosphorus (P) ranged from 55.3 mg·kg−1 in treatment 7 to 106 mg·kg−1 in treatment 1 (Figure 1E), potassium (K) from 81 mg·kg−1 in treatment 4 to 216 mg·kg−1 in treatment 6 (Figure 1F), magnesium (Mg) from 88 mg·kg−1 in treatment 8 to 135 mg·kg−1 in treatment 1 (Figure 1G), and calcium (Ca) from 424.4 mg·kg−1 in treatment 8 to 624.6 mg·kg−1 in treatment 6 (Figure 1H). Sodium (Na) ranged from 14 mg·kg−1 in treatment t 3 to 41.6 mg·kg−1 in treatment 7 (Figure 1I), while sulfur in the form of sulfates (S-SO4) varied between 9.93 mg·kg−1 in treatment 3 and 18.6 mg·kg−1 in treatment 4 (Figure 1J). Chloride (Cl) concentrations were the most variable, ranging from 2.24 mg·kg−1 in treatment 3 to 48.6 mg·kg−1 in treatment 7, demonstrating local differences in salinity or chloride sources (Figure 1K).
Among microelements, the highest concentrations of iron (Fe) were observed in treatment 8 (231 mg·kg−1) (Figure 1L), and manganese (Mn) also reached a maximum in treatment 8 (115.8 ± 25.3 mg·kg−1) (Figure 1M). In contrast, copper (Cu) (Figure 1N), zinc (Zn) (Figure 1O), and boron (B) (Figure 1P) exhibited moderate and relatively stable concentrations across all treatments.
Organic carbon (C org) concentrations were variable among the treatments, ranging from 1.87% in variant 7 to 2.68% in treatment 4, indicating differences in carbon content among the samples (Figure 1R). Treatments 1, 2, and 6 exhibited intermediate organic carbon levels (2.26–2.36%), while treatments 3, 5, and 8 showed moderate concentrations (1.99–2.10%).
3.2. Nematode Analysis
The classification of nematodes according to trophic groups provides a comprehensive functional picture of the soil, allowing for the assessment of microorganism activity, the dynamics of organic matter, the health of the root system, and the level of anthropogenic impact. Analysis of nematode communities revealed distinct patterns across trophic groups, including plant-parasitic nematodes (PPN), bacterivores, fungivores, omnivores, and predators (Figure 2).
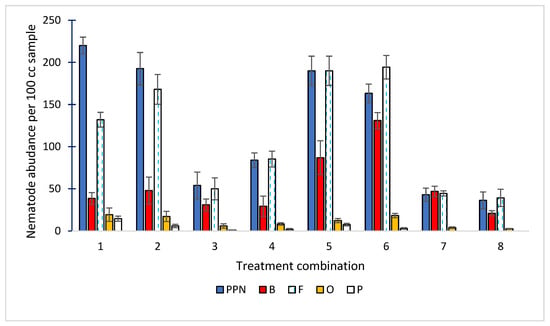
Figure 2.
Abundance (individuals per 100 g soil) of five trophic groups of nematodes, namely plant-parasitic nematodes (PPN); bacterivores (B); fungivores (F); omnivores (O); and predators (P), across eight experimental treatments: 1—Compost (A) + (N); 2—Compost (B) + (N); 3—Compost (C) + (N); 4—Vermicompost (D) + (N); 5—Vermicompost (E) + (N); 6—Vermicompost (F) + (N); 7—(NPK); 8—Control, (n = 3). Bars represent standard deviation (SD).
The highest abundance of plant-parasitic nematodes (PPN) was observed in treatment 1 (220 ind./100 g soil), while the lowest was recorded in treatment 8 (36 ind./100 g soil). Abundances in these treatments showed positive correlations with soil magnesium (Mg) (r = 0.576), and boron (B) (r = 0.675) concentrations (Figure 3).
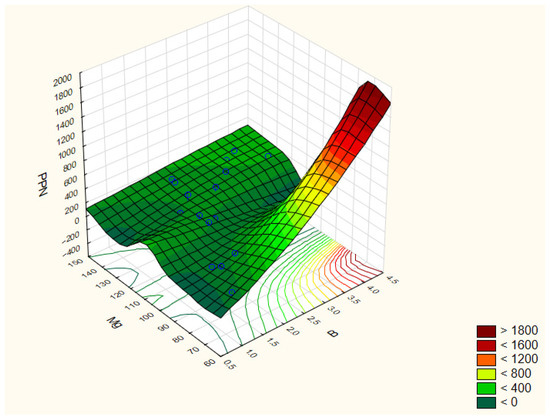
Figure 3.
Correlation coefficients between the selected parameters of the analyzed traits: PPN/Mg/B. The correlation coefficients are considered significant at p < 0.05.
Bacterivorous nematodes are a major trophic group in soil ecosystems, feeding mainly on free-living and rhizosphere-associated bacteria. They possess a simple buccal cavity without a stylet, adapted for bacterial ingestion. Due to their short life cycle and high reproductive rate, they respond rapidly to environmental changes and are widely used as bioindicators of soil fertility and microbial activity. Ecologically, they play an important role in nutrient cycling, particularly nitrogen, by regulating bacterial populations and enhancing mineralization processes. The highest abundance of bacterivores was recorded in treatment 6 (131 ind./100 g soil). This treatment showed a positive correlation with salinity (r = 0.489) and with N-NO3 concentration (r = 0.55) (Figure 4).
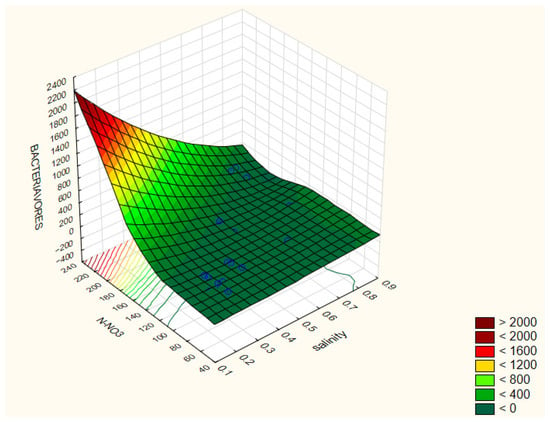
Figure 4.
Correlation coefficients between the selected parameters of the analyzed traits: Bacteriavores/N-NO3/salinity (B). The correlation coefficients are considered significant at p < 0.05.
Fungivores reached the highest abundance in treatment 6 (194 ind./100 g soil) and the lowest in treatment 8 (39 ind./100 g soil). Their abundance showed positive correlations with soil magnesium (Mg) (r = 0.492) and calcium (Ca) (r = 0.405) concentrations (Figure 5).
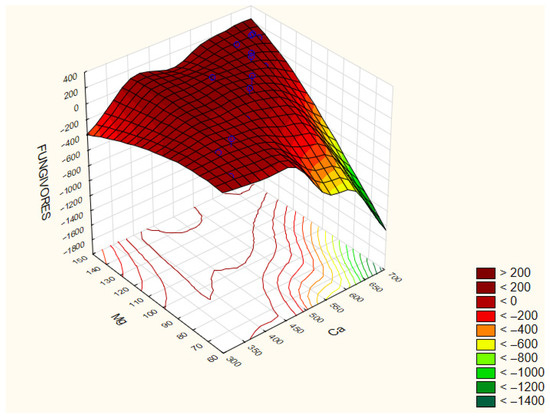
Figure 5.
Correlation coefficients between the selected parameters of the analyzed traits: Fungivores/Mg/Ca. The correlation coefficients are considered significant at p < 0.05.
Omnivores contribute to stabilizing soil food webs by connecting multiple trophic levels and buffering fluctuations in resource supply. Due to their long life cycles and sensitivity to environmental changes, they are considered indicators of soil ecosystem maturity and stability. The highest abundances were observed in treatment 1 (19 ind./100 g soil) and treatment 6 (18 ind./100 g soil), while the lowest were in treatments 7 and 8 (4 and 3 ind./100 g soil, respectively). Their abundance showed positive correlations with soil pH (r = 0.476), phosphorus (P) (r = 0.446), magnesium (Mg) (r = 0.642), calcium (Ca) (r = 0.597), and boron (B) (r = 0.627), and negative correlations with iron (Fe) (r = −0.437) and manganese (Mn) (r = −0.407) (Figure 6 and Figure 7).
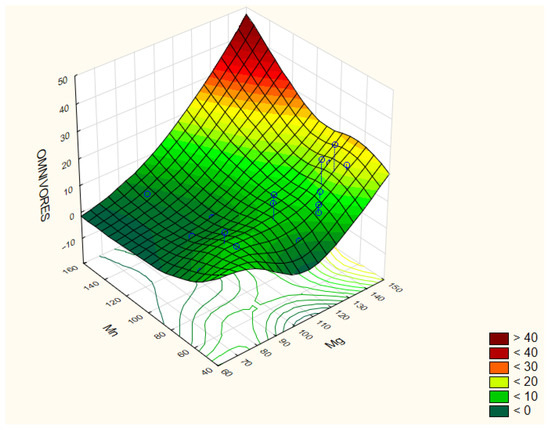
Figure 6.
Correlation coefficients between the selected parameters of the analyzed traits: Omnivores/Mn/Mg. The correlation coefficients are considered significant at p < 0.05.
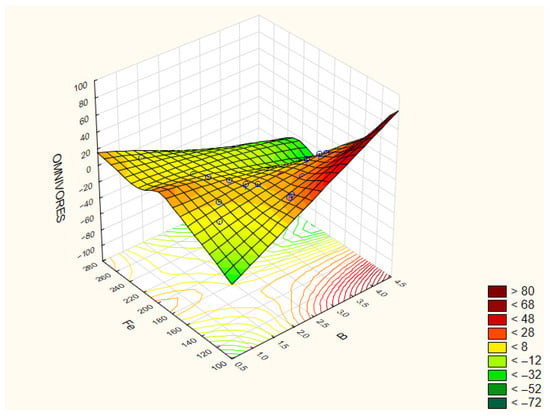
Figure 7.
Correlation coefficients between the selected parameters of the analyzed traits: Omnivores/Fe/B. The correlation coefficients are considered significant at p < 0.05.
Plant parasitic nematodes contribute significantly to nutrient cycling by impacting primary production and the diversity of plants. The highest abundance of predators was observed in treatment 1 (15 ind./100 g soil), while no individuals were recorded in treatments 7 and 8. Predator abundance showed positive correlations with soil magnesium (Mg) (r = 0.478) and boron (B) (r = 0.782) (Figure 8).
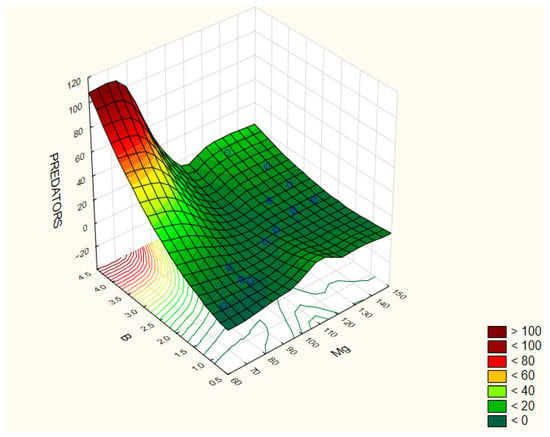
Figure 8.
Correlation coefficients between the selected parameters of the analyzed traits: Predators/B/Mg. The correlation coefficients are considered significant at p < 0.05.
The research identified a collective total of 7 species categorized as parasitic nematodes (PPNs): Pratylenchus neglectus; Merlinius brevidens, M. nothus, Amlimerlinus globigerus, Helicotylenchus digonicus, H. pseudorobustus, Paratylenchus projectus (Figure 9A); 4 species categorized as bacteriavores: Acrobeles spp., Acrobeloides spp., Rhabditis spp., and Diplogaster spp. (Figure 9B); 4 species categorized as fungivores: Aphelenchus spp., Aphelenchoides spp., Filenchus spp., and Tylenchus spp. (Figure 9C); 2 species categorized as omnivores: Eudorylaimus spp. and Dorylaimus spp. (Figure 9D); and 2 species categorized as predators: Mylonchulus spp. and Clarkus spp. (Figure 9E).
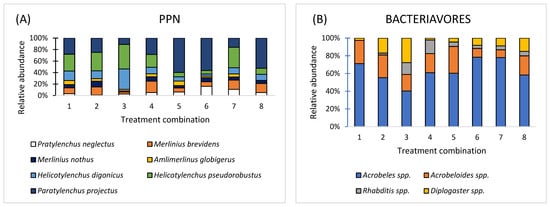
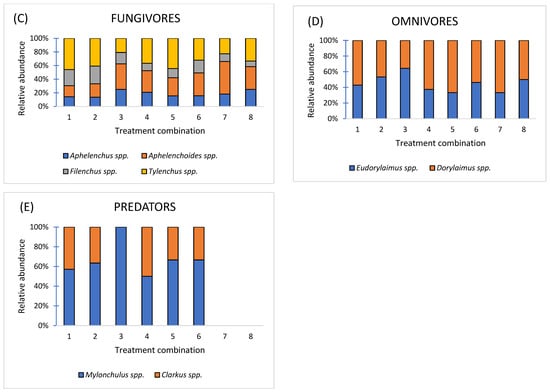
Figure 9.
Relative abundance at the level of five trophic groups: plant-parasitic nematodes (A); bacterivores (B); fungivores (C); omnivores (D); and predators (E) in eight treatments: 1—Compost (A) + (N); 2—Compost (B) + (N); 3—Compost (C) + (N); 4—Vermicompost (D) + (N); 5—Vermicompost (E) + (N); 6—Vermicompost (F) + (N); 7—(NPK); 8—Control, (n = 3).
The nematode community reflects a moderately disturbed but functionally diverse soil ecosystem. Plant-parasitic herbivores (C-p 0, P-p 2–3) indicate potential stress for crops, while fungivores and bacterivores contribute to active nutrient cycling and soil fertility. The presence of predators and omnivores (C-p 4) demonstrates a partially structured and stable soil food web (Table 2).

Table 2.
Species characteristics of nematodes: c-p class, p-p class, feeding type, and individual mass (µg).
Analysis of nematode ecological indices across the eight experimental treatments revealed distinct patterns in community structure and functional composition.
The Shannon Index (H’) ranged from 2.22 (treatment 7) to 2.55 (treatment 2), indicating that overall species richness and evenness were relatively stable across treatments, with only minor fluctuations.
In contrast, the Maturity Index (MI), which reflects the proportion of nematodes at higher trophic levels and the ecological stability of the soil food web, varied more noticeably. Values ranged from 2.00 (treatment 7) to 2.38 (treatment 1), demonstrating differences in soil food web maturity, with lower MI values indicating a community dominated by opportunistic nematodes and higher values reflecting a more balanced, structured community.
The Plant Parasitic Index (PPI), calculated similarly to MI but restricted to plant-parasitic nematodes, showed pronounced variation between 2.22 (treatment 5) and 2.82 (treatment 3). High PPI values indicate a community dominated by long-lived, specialized plant parasites, often associated with enriched soils, whereas low PPI reflects dominance of short-lived, generalist species such as Paratylenchus projectus, which tolerates a wide range of conditions and lowers overall PPI despite the presence of more specialized nematodes.
Overall, these results demonstrate that while species diversity remained relatively stable, fertilization regimes influenced ecological maturity and parasitic pressure, highlighting the sensitivity of nematode functional structure to soil management practices (Table 3).

Table 3.
Ecological indicators of nematodes across eight treatment combination, (mean ± SD, n = 3).
3.3. Biometric Parameters of Plants
The observed differences in thousand-kernel weight (TKW) among treatments demonstrate that fertilization treatments significantly influenced maize grain development (Figure 10A). Treatment 6, which achieved the highest TKW (297.3 g, +8.9% compared to the control), and treatment 4 (293.3 g, +7.4%) likely benefited from nutrient availability and soil fertility. Moreover, these treatments also showed more favorable nematode community structures, with balanced populations of bacterivores, fungivores, and omnivores, indicating a functionally diverse and resilient soil food web (Figure 2).
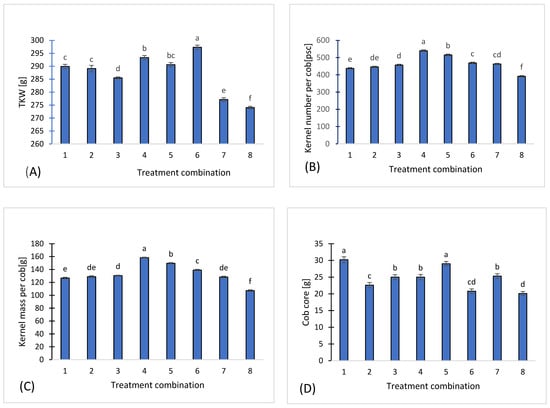
Figure 10.
TKW [g] (A), Kernel number per cob [pcs] (B), Kernel mass per cob [g] (C), Cob core [g] (D) for the eight treatments. Different letters indicate significant differences (p < 0.05), (n = 3). Bars represent standard deviation (SD).
Significant variation was also observed in the mean kernel number per cob. Treatment 4 and treatment 5 produced the highest grain numbers, while variants. Compared to the control (variant 8, 391 kernels per cob), treatment 4 (539.7 kernels) showed an increase of 38%, while variant 5 (515 kernels) increased by 32% (Figure 10B).
The highest grain mass per cob was observed in treatment 4 and treatment 5 whereas the lowest was recorded in the control, treatment 8. Relative to the control, grain mass per cob increased by 48% in treatment 4 and by 40% in treatment 5, highlighting the substantial effect of the applied fertilization strategies on maize yield (Figure 10C).
Alongside these findings, mean cob weights varied significantly across the experimental variants. A noticeable increase in cob core weight compared to the control (treatment 8) ranged from 3.5% to 50.2%. Mean cob core weight varied from 20.1 g in the control (treatment 8) to 30.2 g in treatment 1. Treatment 1 and 5 exhibited the highest increases (+50.2% and +44.8%, respectively), demonstrating that these fertilization regimes were most effective in enhancing cob mass (Figure 10D).
The correlation analysis (n = 24) revealed several significant relationships (p < 0.05) between soil and yield-related traits. Among the macronutrients, Mg (r = 0.59) and Ca (r = 0.52) showed significant positive correlations with TKW, indicating that higher Mg and Ca availability was associated with improved plant performance. In contrast, Fe (r = −0.55) and Mn (r = −0.64) were significantly and negatively correlated with TKW, grain number, and grain mass, demonstrating that elevated concentrations of these elements may have detrimental effects on yield formation.
Regarding micronutrients, Cu exhibited strong positive correlations with grain number (r = 0.49) and grain mass (r = 0.48), while B was positively correlated with cob core weight (r = 0.44). Zinc (Zn) also showed moderate positive associations with cob core (r = 0.30) and grain mass per ear (r = 0.28).
Overall, the results emphasize the beneficial role of Mg, Ca, Cu, and B in yield formation, while excessive levels of Fe and Mn appear to negatively affect maize productivity (Table 4).

Table 4.
Correlation coefficients (r) between maize yield and soil components (n = 24).
The chemical composition of maize showed noticeable variation between the studied treatments. Protein and fat contents were the most variable parameters, whereas fiber and dry matter remained relatively stable. Statistical analysis confirmed that certain treatments differed significantly in protein concentration, with treatment 5 containing the highest and treatment 3 the lowest levels. Protein values ranged from 8.44% (treatment 3) to 9.26% (treatment 5), showing relatively small variation between samples. Fat content varied more noticeably, from 4.11% in treatment 6 to 4.85% in treatment 4. Fiber remained relatively stable across variants, mostly around 2.74%, with slightly higher values in variant 1 (3.02%) and treatment 8 (2.98%). Ash content was the lowest in treatment 7 (0.65%) and the highest in treatment 1 (0.87%), indicating some variation in mineral content. Dry matter levels were consistently high, ranging from 89.21% (treatment 4) to 89.97% (treatment 1), with only minimal differences between treatments (Table 5).

Table 5.
The chemical composition of maize (mean ± SD, n = 3).
Correlation analysis revealed significant positive relationships between several nutritional components. Protein was positively correlated with fat (r = 0.517) and ash (r = 0.495), demonstrating that higher protein content is often associated with increased lipid and mineral fractions. Fat also correlated positively with ash (r = 0.519). Strong correlations were observed between fiber and ash (r = 0.678) as well as between fiber and dry matter (r = 0.666), indicating that these structural and mineral components tend to increase together. In addition, ash showed a moderate positive correlation with dry matter (r = 0.419).
Correlation analysis between maize chemical and physiological parameters and nematode trophic groups revealed several notable relationships. Protein content showed strong positive correlations with plant-parasitic nematodes (PPN) (r = 0.58) and fungivores (r = 0.67), as well as moderate correlations with bacterivores (r = 0.41), omnivores (r = 0.45), and predators (r = 0.44). Thousand-kernel weight (TKW) exhibited the strongest overall associations, correlating positively with all nematode groups, particularly fungivores (r = 0.76) and omnivores (r = 0.68). Similarly, cob core mass was positively related to predators (r = 0.65) and moderately to PPN (r = 0.43). By contrast, fat content displayed negative correlations with bacterivores (r = −0.35) and omnivores (r = −0.23), while fiber content also tended to correlate negatively with bacterivores (r = −0.34). Ash content and dry matter were positively related to predators (r = 0.53 and r = 0.50, respectively), though both showed negative correlations with bacterivores (r = −0.30 and r = −0.41, respectively). Finally, grain number and grain mass exhibited weak to moderate positive associations with fungivores (r = 0.31 and r = 0.43, respectively) and bacterivores (r = 0.27 and r = 0.35), though the relationships with other nematode groups were comparatively weaker (Table 6). These correlations strongly support the conclusion that nematode trophic group abundance is closely linked to maize chemical and physiological parameters.

Table 6.
Correlation coefficients (r) showing relationships among maize chemical and physiological parameters and nematode trophic group abundance (n = 24).
4. Discussion
The present study provides evidence that integrated fertilization, combining organic and mineral inputs, plays a crucial role in shaping soil chemical properties, nutrient dynamics, and overall ecological functioning in maize cultivation systems. One of the most notable effects was improved pH stability, which reduced the risk of excessive acidification often associated with sole mineral fertilization. Compared with single-source or unfertilized treatments, integrated fertilization improved soil pH stability, mitigating the acidification commonly associated with intensive mineral fertilization. Soil pH in treatment 6 increased by approximately 25.5% compared to the control. The more acidic conditions in the control likely restricted the availability of phosphorus and base cations such as calcium and magnesium, whereas the optimal pH observed in treatment 6 facilitated nutrient uptake and supported favorable growing conditions. Additionally, the inclusion of organic amendments enhanced soil organic carbon content, improved nutrient retention, and stimulated microbial activity, thereby promoting long-term soil fertility. Variations in salinity and micronutrient availability across treatments further highlight the influence of fertilization type on soil chemical balance, with organic inputs moderating potential salt stress and contributing to a more resilient soil ecosystem.
Salinity also varied considerably between treatments, with the highest value recorded in treatment 6 (0.59 g·L−1 NaCl), most likely reflecting higher mineral fertilizer inputs, particularly potassium chloride. Nevertheless, the inclusion of organic amendments appears to have mitigated potential salinity stress by improving soil structure and sorption capacity. Variability in chloride content across treatments, ranging from 2.24 mg·kg−1 in treatment 3 to 48.6 mg·kg−1 in treatment 7, represents an approximately 2070% increase, further illustrating differences in salt accumulation patterns.
Nutrient availability was strongly shaped by fertilization type. Treatment 7, with a higher proportion of mineral fertilizers, exhibited elevated concentrations of mineral nitrogen forms (N-NO3 and N-NH4). In contrast, the integration of organic fertilizers promoted gradual nutrient release, reducing leaching losses and ensuring longer nitrogen availability. For instance, nitrate concentrations increased by about 110% (from 80.6 in treatment 3 to 169 mg·kg−1 in treatment 6), while ammonium concentrations showed a much larger rise of approximately 919% (from 17 mg·kg−1 in treatment 4 to 173.3 mg·kg−1 in treatment 7), indicating strong differences among treatments. Treatments with limited or no organic inputs also showed reduced soil organic carbon and available nitrogen, consistent with previous studies demonstrating that organic amendments enhance microbial activity, carbon and nitrogen mineralization, and enzymatic processes associated with nutrient cycling [48].
Macronutrient dynamics further emphasized the benefits of integrated fertilization. Phosphorus and magnesium reached their highest levels in treatment 1 (106 mg·kg−1 P, 135 mg·kg−1 Mg), reflecting the contribution of organic amendments rich in these elements. Conversely, treatment 6 recorded the highest concentrations of potassium and calcium (216 mg·kg−1 K, 624.6 mg·kg−1 Ca), a result of intensive mineral fertilization complemented by organic inputs that likely enhanced cation exchange capacity and maintained ionic balance. By contrast, the low Ca and Mg contents in treatment 8 highlight the nutrient depletion and soil fertility decline associated with unbalanced fertilization strategies.
Micronutrient availability was also strongly influenced by soil conditions. Iron and manganese concentrations peaked in treatment 8 (Fe = 231 mg·kg−1, Mn = 115.8 mg·kg−1), likely due to increased solubility at lower pH. While this may temporarily increase micronutrient availability, it also poses risks of nutrient antagonism or potential toxicity when present in excess. In comparison, copper, zinc, and boron exhibited relatively stable concentrations across all treatments, suggesting that their availability was less sensitive to pH variation and fertilization type.
Organic carbon content proved highly responsive to the fertilization regime, increasing by approximately 43% from treatment 7 (1.87%) to treatment 4 (2.68%). Elevated levels corresponded with higher organic matter inputs, which improve soil water retention, enhance nutrient holding capacity, and stimulate microbial activity, thereby fostering more active nutrient cycling. In contrast, reduced organic carbon in treatments dominated by mineral fertilizers may reflect accelerated mineralization without adequate replenishment of organic matter. These results are consistent with earlier findings in maize systems, where combined organic–mineral fertilization improved yields, enhanced soil physicochemical properties, and contributed to long-term nutrient sustainability [50].
The results clearly indicate that integrated fertilization optimizes nutrient availability, as seen in the elevated levels of P, K, Ca, and Mg in treatments 1 and 6. Treatment combination dominated by mineral fertilizers (7) provided high nitrogen supply but carried risks of soil acidification and salinization, while those with higher organic input (e.g., treatment 4) enhanced soil organic carbon and biogeochemical balance. Overall, ecological equilibrium was best maintained under integrated management, which limited pH fluctuations, increased C org content, and promoted nutrient retention, supporting both crop performance and soil ecosystem stability. Similar conclusions were drawn by Abedi et al. [51], who reported that partial substitution of chemical nitrogen with organic fertilizer improved soil properties and nutrient use efficiency in wheat.
From a soil biological perspective, nematode communities responded sensitively to these fertilization regimes. Although plant-parasitic nematodes can cause considerable crop losses, beneficial nematodes are integral to soil food webs and nutrient mineralization [52]. Their abundance and diversity provide valuable bioindicators of soil health, reflecting physical, chemical, and biological changes in the soil [28]. Healthy soils, as indicated by high nematode diversity, support robust decomposition and nutrient cycling processes, underlining the role of integrated fertilization in promoting both productivity and ecological stability [29].
Fertilization influences nematode diversity both directly, by modifying soil physico-chemical properties, and indirectly, through above-ground processes. Inorganic fertiliza-tion often reduces nematode diversity. Several studies [53,54,55,56,57,58,59,60,61] have shown that increasing levels of inorganic fertilizer are associated with declines in nematode diversity, largely due to shifts within specific trophic groups.
Nematode communities are highly sensitive indicators of soil ecosystem status, responding to physical, chemical, and biological changes in the environment. The Maturity Index (MI), which reflects the proportion of higher trophic level nematodes, ranged near 2 in some treatments, demonstrating a moderately simplified soil food web under fertilization-induced disturbance. Inorganic fertilization negatively affected MI, particularly at higher application rates, favoring opportunistic nematodes through enrichment, consistent with previous studies [54,55,62,63,64].
Similarly, the Plant-Parasitic Index (PPI), calculated exclusively for plant-feeding nematodes, reflected the impact of nutrient availability on herbivore populations. Variants with higher Mg, Ca, and B concentrations (e.g., treatment 1) exhibited elevated PPN densities (220 ind./100 g soil), potentially indicating increased stress for root systems. Conversely, the lowest PPN densities occurred in treatment 8 (36 ind./100 g soil), associated with lower nutrient enrichment. These observations align with previous reports demonstrating positive correlations between Mg, salinity, organic matter, and PPN population density [65,66].
PPNs also play a nuanced ecological role. By feeding on roots, they contribute to nutrient cycling through interactions with plant roots and soil microbes [56,67]. Root herbivory fragments plant material and deposits it into the soil, stimulating microbial activity, carbon turnover, and nutrient mineralization. At low densities, PPNs can promote microbial activity while minimizing negative impacts on plants, helping to maintain a functional balance in the rhizosphere [67].
Beneficial nematodes, including bacterivores and fungivores, were most abundant in variants 6 and 5, correlating positively with salinity (r = 0.489), nitrate content (r = 0.55), and Mg and Ca levels. High bacterivore density (131 ind./100 g soil in treatment 6) indicates rapid responses to environmental changes and active microbial mineralization. Fungivores followed a similar pattern, with the highest abundance in treatment 6 (194 ind./100 g soil), reflecting active organic matter decomposition and nutrient cycling.
Omnivores and predators, which are considered K-strategists (c-p 4), provide insight into the stability of soil food webs. Omnivore populations peaked in treatments 1 (19 ind./100 g) and 6 (18 ind./100 g), correlating positively with pH (r = 0.476), P (r = 0.446), Mg (r = 0.642), Ca (r = 0.597), and B (r = 0.627), while showing negative correlations with Fe (r = −0.437) and Mn (r = −0.407). Predator abundance was highest in treatment 1 (15 ind./100 g) but absent in treatments 7 and 8, demonstrating disruptions in trophic regulation under some fertilization regimes. Their presence contributes to stabilizing the nematode food web by controlling opportunistic populations and supporting regulatory processes in soil.
Overall, nematode species richness was maintained despite moderate disturbances. Seven PPN species (e.g., Pratylenchus neglectus, Helicotylenchus digonicus), four bacterivore species (e.g., Rhabditis spp.), four fungivore species (e.g., Aphelenchus spp.), two omnivore species (Eudorylaimus spp., Dorylaimus spp.), and two predator species (Mylonchulus spp., Clarkus spp.) were identified, indicating a functionally diverse soil ecosystem capable of supporting both decomposition and regulatory processes.
The correlations observed between nematode groups and soil chemical parameters highlight the strong influence of Mg, Ca, and B on nematode community structure. Integrated organic-mineral fertilization enhanced the abundance of bacterivores and fungivores, promoting microbial activity and nutrient cycling, while the presence of omnivores and predators signaled partial stability within the soil food web. High PPN densities in certain treatments, particularly treatment 1, indicate potential risks for root system health, emphasizing the need for biological monitoring and management.
Taken together, these findings demonstrate that soil chemical properties, particularly those influenced by fertilization strategies, are key drivers of nematode community structure. Integrated fertilization not only supports nutrient availability and crop yield but also maintains functional diversity and stability within the soil ecosystem, balancing both enrichment and regulatory processes. Nematode community analysis, therefore, provides a sensitive and holistic tool for evaluating the long-term ecological impacts of different fertilization strategies, integrating chemical, biological, and functional aspects of soil health.
Maize (Zea mays L.), with its high production potential relative to other cereal crops, is a key component of global food security [68]. Its nutrient requirements, particularly nitrogen (N), phosphorus (P), and potassium (K), are commonly supplied through chemical fertilizers or organic manures to optimize growth and yield [69,70]. While genetic improvements and intensive fertilization have historically enhanced maize productivity, excessive reliance on synthetic fertilizers has led to environmental degradation, soil quality decline, and reduced long-term yields [71,72,73].
In this context, the incorporation of organic manures offers multiple advantages: they improve soil physicochemical properties, increase nutrient availability, and provide an eco-friendly, readily available source of nutrients, supporting sustainable crop production [74,75,76]. The present study confirms these benefits, as treatments receiving integrated fertilization (organic plus mineral) showed enhanced kernel weight, cob mass, and overall yield.
Nematodes are plant-parasitic organisms that cause alterations in the chemical and physical environment of soils [63,77,78] and their impact has been the subject of recent studies [79,80,81]. Among them, Jones et al. [82] identified Meloidogyne spp. as the most crucial plant-parasitic nematodes due to their ability to significantly affect crop yields. Besides Meloidogyne spp., maize (Zea mays) is affected by root lesion (Pratylenchus spp.) and cyst (Heterodera zeae) nematodes, which pose significant economic concerns [83]. Infections commonly result in mild galling, leaf chlorosis, and stunted growth, with Longidorus breviannulatus capable of causing substantial yield losses. Nematode diversity may further modulate the severity of these effects.
The diversity of nematodes may be factors influencing the increase in wheat yield. It has been found that plant dynamics including growth and reproduction are strongly affected by interactions between plant roots and the microflora of ground such as plant-feeding nematodes [84]. Therefore, understanding such interactions between maize and parasitic nematodes can provide crucial information on their management and enhancement of crop productivity. Correlative analysis revealed a strong link between nematode trophic group abundance and maize growth parameters (Table 6). Fungivores and omnivores were positively associated with thousand-kernel weight (TKW), indicating that microbial-driven nutrient cycling may support effective kernel filling. Although correlative, these findings highlight nematode trophic structure as a useful bioindicator of both soil processes and crop performance.
The observed 8–9% variation in TKW across experimental treatments is agronomically significant. Even modest improvements in kernel weight can translate into substantial yield gains at the field scale. Higher TKW in treatments such as 6 and 4 can be attributed to improved nutrient availability, enhanced soil fertility, and elevated biological activity, which collectively support efficient kernel development. In contrast, lower TKW in treatments like 8 likely resulted from nutrient limitations, suboptimal soil conditions, and reduced soil biological activity, which constrained kernel growth.
These findings underscore the broader implications of integrated nutrient management. Combining organic and mineral fertilizers not only balances immediate nutrient supply with longer-term soil fertility but also promotes a functionally diverse and stable soil food web, as reflected in nematode community composition. By maintaining both chemical and biological soil health, integrated fertilization strategies enhance maize productivity while mitigating the environmental risks associated with excessive synthetic fertilizer use.
5. Conclusions
This study demonstrates that compost and vermicompost applications enhance maize growth, grain quality, and soil chemical properties while affecting nematode community structure. These findings suggest benefits of integrating organic and mineral fertilizers, though multi-year field trials are needed to confirm their effects under diverse conditions.
Author Contributions
Conceptualization, A.Z.; methodology, A.T.S., W.J. and M.K.; formal analysis, A.Z.; investigation, A.Z., A.T.S., W.J. and M.K.; resources, A.T.S. and M.K.; writing—original draft preparation, A.Z.; writing—review and editing, A.Z.; visualization, A.Z.; supervision, A.T.S. and W.J. All authors have read and agreed to the published version of the manuscript.
Funding
This research is funded by financial resources of the Ministry of Science and Higher Education for scientific activities of the Institute of Agricultural Sciences, Land Management and Environmental Protection, University of Rzeszów.
Institutional Review Board Statement
Not applicable.
Informed Consent Statement
Not applicable.
Data Availability Statement
The data presented in this study are available on request from the corresponding author.
Acknowledgments
The authors are grateful for the assistance of Dawid Kozacki, of the National Institute of Horticultural Research in Skierniewice, for his help during this work.
Conflicts of Interest
The authors declare no conflicts of interest.
References
- Ma, D.; Teng, W.; Mo, Y.T.; Yi, B.; Chen, W.L.; Pang, Y.P.; Wang, L. Effects of nitrogen, phosphorus, and potassium fertilization on plant growth, element levels in plants and soil, and the relationships among nutrient concentrations, plant yield, and nutrient status in Erythropalum scandens (Blume). J. Plant Nutr. 2023, 47, 82–96. [Google Scholar] [CrossRef]
- Bindraban, P.S.; Dimkpa, C.; Nagarajan, L.; Roy, A.; Rabbinge, R. Revisiting fertilisers and fertilisation strategies for improved nutrient uptake by plants. Biol. Fertil. Soils 2015, 51, 897–911. [Google Scholar] [CrossRef]
- Rashmi, I.; Roy, T.; Kartika, K.S.; Pal, R.; Coumar, V.; Kala, S.; Shinoji, K.C. Organic and inorganic fertilizer contaminants in agriculture: Impact on soil and water resources. In Contaminants in Agriculture: Sources, Impacts and Management; Springer: Berlin/Heidelberg, Germany, 2020; pp. 3–41. [Google Scholar] [CrossRef]
- Gurmessa, B. Soil acidity challenges and the significance of liming and organic amendments in tropical agricultural lands with reference to Ethiopia. Env. Dev Sustain 2021, 23, 77–99. [Google Scholar] [CrossRef]
- FAO. Sustainable Food and Agriculture. 2014. Available online: https://www.fao.org/sustainability/en (accessed on 31 August 2025).
- Verma, B.C.; Pramanik, P.; Bhaduri, D. Organic Fertilizers for Sustainable Soil and Environmental Management. In Nutrient Dynamics for Sustainable Crop Production; Meena, R., Ed.; Springer: Berlin/Heidelberg, Germany, 2020. [Google Scholar] [CrossRef]
- Zheng, X.; Wei, L.; Lv, W.; Zhang, H.; Zhang, Y.; Zhang, H.; Zhang, H.; Zhu, Z.; Ge, T.; Zhang, W. Long-term bioorganic and organic fertilization improved soil quality and multifunctionality under continuous cropping in watermelon. Agric. Ecosyst. Environ. 2024, 359, 108721. [Google Scholar] [CrossRef]
- Pourhosseini, S.H.; Azizi, A.; Seyedi, F.S.; Hadian, J. Bio-fertilizer as a pathway to minimize nitrate leaching from chemical fertilizer in high yield peppermint production. J. Clean. Prod. 2024, 468, 143100. [Google Scholar] [CrossRef]
- Tang, Y.; Nian, L.; Zhao, X.; Li, J.; Wang, Z.; Dong, L. Bio-Organic Fertilizer Application Enhances Silage Maize Yield by Regulating Soil Physicochemical and Microbial Properties. Microorganisms 2025, 13, 959. [Google Scholar] [CrossRef]
- Liu, Y.; Lan, X.; Hou, H.; Ji, J.; Liu, X.; Lv, Z. Multifaceted Ability of Organic Fertilizers to Improve Crop Productivity and Abiotic Stress Tolerance: Review and Perspectives. Agronomy 2024, 14, 1141. [Google Scholar] [CrossRef]
- Delin, S.; Engström, L. Timing of organic fertiliser application to synchronise nitrogen supply with crop demand. Acta Agric. Scand. Sect. B-Soil Plant Sci. 2009, 60, 78–88. [Google Scholar] [CrossRef]
- Chew, K.W.; Chia, S.R.; Yen, H.W.; Nomanbhay, S.; Ho, Y.C.; Show, P.L. Transformation of biomass waste into sustainable organic fertilizers. Sustain 2019, 11, 2266. [Google Scholar] [CrossRef]
- Olaniyi, J.O.; Ajibola, A. Effects of Inorganic and Organic Fertilizers Application on the Growth, Fruit Yield and Quality of Tomato (Lycopersicon lycopersicum). J. Appl. Biosci. 2008, 8, 236–242. [Google Scholar]
- Shakoor, A.; Shakoor, S.; Rehman, A.; Ashraf, F.; Abdullah, M.; Shahzad, S.M.; Farooq, T.H.; Ashraf, M.; Manzoor, M.A.; Altaf, M.A. Effect of animal manure, crop type, climate zone, and soil attributes on greenhouse gas emissions from agricultural soils-A global meta-analysis. J. Clean. Prod. 2021, 278, 124019. [Google Scholar] [CrossRef]
- Vanlauwe, B.; Bationo, A.; Chianu, J.; Giller, K.E.; Merckx, R.; Mokwunye, U.; Sanginga, N. Integrated soil fertility management: Operational definition and consequences for implementation and dissemination. Outlook Agric. 2010, 39, 17–24. [Google Scholar] [CrossRef]
- Berenguer, P.; Santiveri, F.; Boixadera, J.; Lloveras, J. Nitrogen fertilization of irrigated maize under Mediterranean conditions. Eur. J. Agron. 2009, 30, 163–171. [Google Scholar] [CrossRef]
- Song, W.F.; Shu, A.P.; Liu, J.A.; Shi, W.C.; Li, M.C.; Zhang, W.X.; Li, Z.Z.; Liu, G.G.; Yuan, F.S.; Zhang, S.X.; et al. Effects of long-term fertilization with different substitution ratios of organic fertilizer on paddy soil. Pedosphere 2022, 32, 637–648. [Google Scholar] [CrossRef]
- Cela, S.; Salmerón, M.; Isla, R.; Cavero, J.; Santiveri, F.; Lloveras, S. Reduced nitrogen fertilization to corn following alfalfa in an irrigated semiarid environment. Agron. J. 2011, 103, 520–528. [Google Scholar] [CrossRef]
- Kandil, E.E.E. Response of some maize hybrids (Zea mays L.) to different levels of nitrogenous fertilization. J. Appl. Sci. Res. 2013, 9, 1902–1908. [Google Scholar]
- Law-Ogbomo, K.E.; Law-Ogbomo, J.E. The performance of Zea mays as influenced by NPK fertilizer application. Not. Sci. Biol. 2009, 1, 59–62. [Google Scholar] [CrossRef]
- Škarpa, P.; Antošovský, J.; Ryant, P.; Hammerschmiedt, T.; Kintl, A.; Brtnický, M. Using waste sulfur from biogas production in combination with nitrogen fertilization of maize (Zea mays L.) by foliar application. Plants 2021, 10, 2188. [Google Scholar] [CrossRef]
- Zha, Y.; Wu, X.-P.; He, X.-H.; Zhang, H.-M.; Gong, F.-F.; Cai, D.-X.; Zhu, P.; Gao, H.-J. Basic soil productivity of spring maize in black soil under long-term fertilization based on DSSAT model. J. Integr. Agric. 2014, 13, 577–587. [Google Scholar] [CrossRef]
- Sileshi, G.W. Nutrient Use Efficiency and Crop Yield Response to the Combined Application of Cattle Manure and Inorganic Fertilizer in Sub-Saharan Africa. Nutr. Cycl. Agroecosystems 2019, 113, 181–199. [Google Scholar] [CrossRef]
- Zhang, Y.; Li, T.; Wu, H.; Bei, S.; Zhang, J.; Li, X. Effect of different fertilization practices on soil microbial community in a wheat–maize rotation system. Sustainability 2019, 11, 4088. [Google Scholar] [CrossRef]
- Zerssa, G.W.; Kim, D.-G.; Koal, P.; Eichler-Löbermann, B. Combination of Compost and Mineral Fertilizers as an Option for Enhancing Maize (Zea mays L.) Yields and Mitigating Greenhouse Gas Emissions from a Nitisol in Ethiopia. Agronomy 2021, 11, 2097. [Google Scholar] [CrossRef]
- Zapałowska, A.; Skwiercz, A.; Tereba, A.; Puchalski, C.; Malewski, T. Next-Generation Sequencing for Evaluating the Soil Nematode Diversity and Its Role in Composting Processes. Int. J. Mol. Sci. 2023, 24, 15749. [Google Scholar] [CrossRef]
- Yeates, G.W. Nematodes as soil indicators: Functional and biodiversity aspects. Biol. Fertil. Soils 2003, 37, 199–210. [Google Scholar] [CrossRef]
- Ferris, H.; Bongers, T.; De Goede, R.G.M. A framework for soil food web diagnostics: Extension of the nematode faunal analysis concept. Appl. Soil Ecol. 2001, 18, 13–29. [Google Scholar] [CrossRef]
- Neher, D.A.; Darby, B.J. General community indices that can be used for analysis of nematode assemblages. In Nematodes as Environmental Indicators; Wilson, M.J., Kakouli-Duarte, T., Eds.; CaBi Publishing: Oxford, UK, 2009; pp. 107–123. [Google Scholar] [CrossRef]
- Biswal, D. Nematodes as ghosts of land use past: Elucidating the roles of soil nematode community studies as indicators of soil health and land management practices. Appl. Biochem. Biotechnol. 2022, 194, 2357–2417. [Google Scholar] [CrossRef]
- Griffiths, B.S.; Römbke, J.; Schmelz, R.M.; Scheffczyk, A.; Faber, J.H.; Bloem, J.; Pérès, G.; Cluzeau, D.; Chabbi, A.; Suhadolc, M.; et al. Selecting cost effective and policy-relevant biological indicators for European monitoring of soil biodiversity and ecosystem function. Ecol. Indic. 2016, 69, 213–223. [Google Scholar] [CrossRef]
- Jiang, Y.; Liu, M.; Zhang, J.; Chen, Y.; Chen, X.; Chen, L.; Li, H.; Zhang, X.X.; Sun, B. Nematode grazing promotes bacterial community dynamics in soil at the aggregate level. ISME J. 2017, 11, 2705–2717. [Google Scholar] [CrossRef]
- Grabau, Z.J.; Chen, S. Influence of long-term corn–soybean crop sequences on soil ecology as indicated by the nematode community. Appl Soil Ecol. 2016, 100, 172–185. [Google Scholar] [CrossRef]
- IUSS Working Group WRB. World Reference Base for Soil Resources. International Soil Classification System for Naming Soils and Creating Legends for Soil Maps, 4th ed.; International Union of Soil Sciences (IUSS): Vienna, Austria, 2022; Available online: https://files.isric.org/public/documents/WRB_fourth_edition_2022-12-18.pdf (accessed on 22 July 2025).
- Nowosielski, O. Zasady Opracowywania Zaleceń Nawozowych w Ogrodnictwie. Wyd. III uzupełnione. PWRiL Warszawa, 1988. p. 310. Available online: https://w.bibliotece.pl/402626/Zasady%20opracowywania%20zalece%C5%84%20nawozowych%20w%20ogrodnictwie (accessed on 31 August 2025). (In Polish).
- Komosa, A.; Breś, W.; Golcz, A.; Kozik, E. Żywienie Roślin Ogrodniczych—Podstawy i Perspektywy; Państwowe Wydawnictwo Rolnicze i Leśne (PWRiL): Poznań, Poland, 2012; p. 390. Available online: https://www.agroswiat.pl/zywienie-roslin-ogrodniczych-11920.html (accessed on 31 August 2025). (In Polish)
- Ostrowska, A.; Gawliński, S.; Szczubiałka, Z. Metody Analizy i Oceny Właściwości Gleb i Roślin; Instytut Ochrony: Środowiska, Warszawa, 1991; p. 334. Available online: https://www.scirp.org/reference/referencespapers?referenceid=1394461 (accessed on 31 August 2025). (In Polish)
- Antweiler, R.C.; Patton, C.J.; Taylor, H.E. Automated Colorimetric Methods for Determination Nitrate Plus Nitrite, Nitrite, Ammonium and Orthophosphate Ions in Natural Wather Samples; U.S. Geological Survey: Reston, VA, USA, 1996. [CrossRef]
- Zawadzińska, A.; Salachna, P.; Nowak, J.S.; Kowalczyk, W.; Piechocki, R.; Łopusiewicz, Ł.; Pietrak, A. Compost Based on Pulp and Paper Mill Sludge, Fruit-Vegetable Waste, Mushroom Spent Substrate and Rye Straw Improves Yield and Nutritional Value of Tomato. Agronomy 2022, 12, 13. [Google Scholar] [CrossRef]
- Regulation (EU) 2019/1009 of the European Parliament and of the Council, Dated 5 June 2019. Available online: http://data.europa.eu/eli/reg/2019/1009/oj (accessed on 31 August 2025).
- Szczygieł, A. Application of the Centrifugal Method for Extraction of Nematodes from Soil. J. Prog. Agric. Sci. 1971, 12, 169–179. [Google Scholar]
- Stefanovska, T.; Skwiercz, A.; Pidlisnyuk, V.; Zhukov, O.; Kozacki, D.; Mamirova, A.; Newton, R.A.; Ust’ak, S. The Short-Term Effects of Amendments on Nematode Communities and Diversity Patterns under the Cultivation of Miscanthus × giganteus on Marginal Land. Agronomy 2022, 12, 2063. [Google Scholar] [CrossRef]
- Brzeski, M.W. Nematodes of Tylenchina in Poland and Temperate Europe. In Muzeum i Instytutu Zoologii; Polska Akademia Nauk (MiIZ PAN): Warsaw, Poland, 1998; ISBN 83-85192-84-0. [Google Scholar]
- Andrássy, I. Free-Living Nematodes of Hungary (Nematoda Errantia). In Pedozoologica Hungarica; Csuzdi, C., Mahunka, S., Eds.; Hungarian Natural History Museum and Systematic Zoology Research Group of the Hungarian Academy of Sciences: Budapest, Hungary, 2007; Volume II, ISBN 963 7093 98 2. [Google Scholar]
- Bongers, T. The Maturity Index: An Ecological Measure of Environmental Disturbance Based on Nematode Species Composition. Oecologia 1990, 83, 14–19. [Google Scholar] [CrossRef]
- Bongers, T.; van der Meulen, H.; Korthals, G. Inverse relationship between the nematode maturity index and plant parasite index under enriched nutrient conditions. Appl. Soil Ecol. 1997, 6, 195–199. [Google Scholar] [CrossRef]
- PAST Software. Available online: https://www.nhm.uio.no/english/research/resources/past (accessed on 31 August 2025).
- Sieriebriennikov, B.; Ferris, H.; de Goede, R.G.M. NINJA: An automated calculation system for nematode-based biological monitoring. Eur. J. Soil Biol. 2014, 61, 90–93. [Google Scholar] [CrossRef]
- Meier, U. Growth Stages of Mono-and Dicotyledonous Plants. In BBCH Monograph; Federal Biological Research Centre for Agriculture and Forestry: Berlin, Germany; Braunschweig, Germany, 2001; p. 158. Available online: https://www.yumpu.com/en/document/read/16359822/growth-stages-of-mono-and-dicotyledonous-plants-regione- (accessed on 31 August 2025).
- Smith, L.; Papendick, R. Soil organic matter dynamics and crop residue management. In Soil Microbial Ecology; Applications in Agricultural and Environmental Management; Metting, F.B., Jr., Ed.; Marcel Dekker: New York, NY, USA, 1993; pp. 65–94. Available online: https://www.cabidigitallibrary.org/doi/full/10.5555/19931976430 (accessed on 31 August 2025).
- Abid, M.; Batool, T.; Siddique, G.; Ali, S.; Binyamin, R.; Shahid, M.J.; Rizwan, M.; Alsahli, A.A.; Alyemeni, M.N. Integrated Nutrient Management Enhances Soil Quality and Crop Productivity in Maize-Based Cropping System. Sustainability 2020, 12, 10214. [Google Scholar] [CrossRef]
- Abedi, T.; Alemzadeh, A.; Kazemeini, S.A. Effect of organic and inorganic fertilizers on grain yield and protein banding pattern of wheat. Aust. J. Crop Sci. 2010, 4, 384. [Google Scholar]
- Lambert, K.; Bekal, S. Introduction to plant-parasitic nematodes. Plant Health Instr. 2002, 10, 1094–1218. [Google Scholar] [CrossRef]
- Wang, P.; Yang, F.; Chen, X.; Li, J.; Zhou, X.; Guo, H. Long-term fertilisation effects on soil biotic communities are mediated by plant diversity in a Tibetan alpine meadow. Plant Soil 2022, 474, 525–540. [Google Scholar] [CrossRef]
- Liang, S.; Kou, X.; Li, Y.; Lü, X.; Wang, J.; Li, Q. Soil nematode community composition and stability under different nitrogen additions in a semiarid grassland. Glob. Ecol. Conserv. 2020, 22, e00965. [Google Scholar] [CrossRef]
- Wei, C.; Zheng, H.; Li, Q.; Lü, X.; Yu, Q.; Zhang, H.; Chen, Q.; He, N.; Kardol, P.; Liang, W.; et al. Nitrogen Addition Regulates Soil Nematode Community Composition through Ammonium Suppression. PLoS ONE 2012, 7, e43384. [Google Scholar] [CrossRef]
- Tu, C.; Koenning, S.R.; Hu, S. Root-parasitic nematodes enhance soil microbial activities and nitrogen mineralization. Microb. Ecol. 2003, 46, 134–144. [Google Scholar] [CrossRef]
- Li, J.; Wang, D.; Fan, W.; He, R.; Yao, Y.; Sun, L.; Zhao, X.; Wu, J. Comparative effects of different organic materials on nematode community in continuous soybean monoculture soil. Appl. Soil Ecol. 2018, 125, 12–17. [Google Scholar] [CrossRef]
- Raharijaona, S.; Blanchart, E.; Razafindrakoto, M.; Rafolisy, T.; Salgado, P.; Razafimbelo, T.; Autfray, P.; Ratsiatosika, O.; Bernard, L.; Trap, J. Responses of Soil Nematodes to Combined Bio-Organo-Mineral Fertilisers on Upland Rice Cropping in the Highlands of Madagascar. Proc. Zool. Soc. 2023, 76, 224–240. [Google Scholar] [CrossRef]
- Wu, L.; Hu, J.; Chen, H.; Wang, B.; Wu, Y.; Bai, Y.; Chen, D. Stronger effects of long-term P enrichment on soil biota than plants in grasslands. Soil Tillage Res. 2023, 229, 105668. [Google Scholar] [CrossRef]
- Qi, Y.; Sun, X.; Peng, S.; Tan, X.; Zhou, S. Effects of fertilisation on soil nematode communities in an alpine meadow of Qinghai-Tibet plateau. Front. Ecol. Evol. 2023, 11, 1122505. [Google Scholar] [CrossRef]
- Vestergård, M. Nematode assemblages in the rhizosphere of spring barley (Hordeum vulgare L.) depended on fertilisation and plant growth phase. Pedobiologia 2004, 48, 257–265. [Google Scholar] [CrossRef]
- Du Preez, G.; Daneel, M.; De Goede, R.; Du Toit, M.J.; Ferris, H.; Fourie, H.; Geisen, S.; Kakouli-Duarte, T.; Korthals, G.; Sánchez-Moreno, S.; et al. Nematode-based indices in soil ecology: Application, utility, and future directions. Soil Biol. Biochem. 2022, 169, 108640. [Google Scholar] [CrossRef]
- Benkovic-Lacic, T.; BrMez, M.; Ivezic, M.; Raspudic, E.; Pribetić, D.; Loncaric, Z.; Grubisic, D. Influence of organic and inorganic fertilisers on nematode communities in cornfield. Agric. Academy. Bulg. J. Agric. Sci. 2013, 19, 235–240. [Google Scholar]
- Gruzdeva, L.I.; Matveeva, E.M.; Kovalenko, T.E. Changes in soil nematode communities under the impact of fertilisers. Eurasian Soil Sci. 2007, 40, 681–693. [Google Scholar] [CrossRef]
- Skwiercz, A.T. Plant parasitic nematodes in the peat soils in Poland. Part II. Frequency of occurrence and population density in different chemical properties of peat. Rocz. Nauk Rolniczych. Ser. E. Ochr. Roślin 1991, 19, 101–111. [Google Scholar]
- Tahat, M.M.; Alananbeh, K.M.; Othman, Y.A.; Leskovar, D.I. Soil health and sustainable agriculture. Sustainability 2020, 12, 4859. [Google Scholar] [CrossRef]
- Gebremikael, M.T.; Steel, H.; Buchan, D.; Bert, W.; De Neve, S. Nematodes enhance plant growth and nutrient uptake under C and N-rich conditions. Sci. Rep. 2016, 6, 32862. [Google Scholar] [CrossRef] [PubMed]
- Nayak, A.; Gangwar, B.; Shukla, A.K.; Mazumdar, S.P.; Kumar, A.; Raja, R.; Kumar, A.; Kumar, V.; Rai, P.; Mohan, U. Long-term effect of different integrated nutrient management on soil organic carbon and its fractions and sustainability of rice-wheat system in Indo Gangetic Plains of India. Field Crops Res. 2012, 127, 129–139. [Google Scholar] [CrossRef]
- Abid, M.; Tian, Z.; Ata-Ul-Karim, S.T.; Cui, Y.; Liu, Y.; Zahoor, R.; Jiang, D.; Dai, T. Nitrogen nutrition improves the potential of wheat (Triticum aestivum L.) to alleviate the effects of drought stress during vegetative growth periods. Front. Plant Sci. 2016, 7, 981. [Google Scholar] [CrossRef] [PubMed]
- Güereña, D.T.; Kimetu, J.; Riha, S.; Neufeldt, H.; Lehmann, J. Maize productivity dynamics in response to mineral nutrient additions and legacy organic soil inputs of contrasting quality. Field Crops Res. 2016, 188, 113–120. [Google Scholar] [CrossRef]
- Hepperly, P.; Lotter, D.; Ulsh, C.Z.; Seidel, R.; Reider, C. Compost, manure and synthetic fertilizer influences crop yields, soil properties, nitrate leaching and crop nutrient content. Compost. Sci. Util. 2009, 17, 117–126. [Google Scholar] [CrossRef]
- Arif, M.; Ali, K.; Jan, M.T.; Shah, Z.; Jones, D.L.; Quilliam, R.S. Integration of biochar with animal manure and nitrogen for improving maize yields and soil properties in calcareous semi-arid agroecosystems. Field Crops Res. 2016, 195, 28–35. [Google Scholar] [CrossRef]
- Kumar, A.; Yadav, D.S. Long-Term Effects of Fertilizers on the Soil Fertility and Productivity of a Rice–Wheat System. J. Agron. Crop Sci. 2008, 186, 47–54. [Google Scholar] [CrossRef]
- Gangwar, K.; Singh, K.; Sharma, S.; Tomar, O. Alternative tillage and crop residue management in wheat after rice in sandy loam soils of Indo-Gangetic plains. Soil Tillage Res. 2006, 88, 242–252. [Google Scholar] [CrossRef]
- Teshita, A.; Khan, W.; Alabbosh, K.F.; Ullah, A.; Khan, A.; Jalal, A.; Iqbal, B. Dynamic changes of soil nematodes between bulk and rhizosphere soils in the maize (Zea mays L.)/alfalfa (Medicago sativa L.) intercropping system. Plant Stress 2024, 11, 100345. [Google Scholar] [CrossRef]
- Shokoohi, E.; Masoko, P. Association of Plant-Parasitic Nematodes and Soil Physicochemical Properties in Tomatoes in Turfloop, Limpopo Province. South Afr. Hortic. 2024, 10, 328. [Google Scholar] [CrossRef]
- van den Hoogen, J.; Geisen, S.; Routh, D.; Ferris, H.; Traunspurger, W.; Wardle, D.A.; de Goede, R.G.M.; Adams, B.J.; Ahmad, W.; Andriuzzi, W.S.; et al. Soil nematode abundance and functional group composition at a global scale. Nature 2019, 572, 194–198. [Google Scholar] [CrossRef]
- Mekuria, T.M.; Meressa, B.H.; Hundesa, W.B. Prevalence of major parasitic nematodes associated with tomatoes (Solanum lycopersicum L.) in two districts of Jimma, Ethiopia. Arch. Phytopathol. Plant Prot. 2023, 56, 158–174. [Google Scholar] [CrossRef]
- Karuri, H. Nematode community response to intensive tomato production in the tropics. Rhizosphere 2023, 25, 10068. [Google Scholar] [CrossRef]
- Shokoohi, E. Impact of agricultural land use on nematode diversity and soil quality in Dalmada. South Afr. Hortic. 2023, 9, 749. [Google Scholar] [CrossRef]
- Jones, J.T.; Haegeman, A.; Danchin, E.G.J.; Gaur, H.S.; Helder, J.; Jones, M.G.K.; Kikuchi, T.; Manzanilla-López, R.; Palomares-Rius, J.E.; Wesemael, W.M.L.; et al. Top 10 plant-parasitic nematodes in molecular plant pathology. Mol. Plant Pathol. 2013, 14, 946–961. [Google Scholar] [CrossRef] [PubMed]
- Das, S.; Bar, S.; Madhu, N.R.; Ghorai, S.K. Evaluating the Consequences of Parasitic Nematodes on Agricultural Productivity. Int. Acad. Publ. House 2024, 3, 93–127. [Google Scholar] [CrossRef]
- Maina, S.; Ng’endo, R.N. Influence of Spiral Nematodes (Scutellonema spp.) on Maize Performance and Growth under Natural Field Infestation in Mwea, Kenya. Hindawi Int. J. Agron. 2020, 2020, 9587569. [Google Scholar] [CrossRef]
Disclaimer/Publisher’s Note: The statements, opinions and data contained in all publications are solely those of the individual author(s) and contributor(s) and not of MDPI and/or the editor(s). MDPI and/or the editor(s) disclaim responsibility for any injury to people or property resulting from any ideas, methods, instructions or products referred to in the content. |
© 2025 by the authors. Licensee MDPI, Basel, Switzerland. This article is an open access article distributed under the terms and conditions of the Creative Commons Attribution (CC BY) license (https://creativecommons.org/licenses/by/4.0/).

