Article

The Impact of Artificial Intelligence Policies on Manufacturing Companies’ Environmental Information Disclosure


1
College of Business, Jinhua University of Vocational Technology, Jinhua 321017, China
2
Jinhua Innovation Joint Research Institute, Zhejiang University of Technology, Jinhua 321000, China
3
School of Law and Business, Wuhan Institute of Technology University, Wuhan 430205, China
*
Author to whom correspondence should be addressed.
Sustainability 2026, 18(12), 6030; https://doi.org/10.3390/su18126030
Submission received: 17 April 2026 / Revised: 1 June 2026 / Accepted: 9 June 2026 / Published: 12 June 2026

Abstract

Environmental information disclosure is a critical pathway for manufacturing enterprises to advance the modern environmental governance system. Using the New-Generation Artificial Intelligence Innovation and Development Pilot Zones (NAIDP) as a quasi-natural experiment, this study employs panel data of Chinese A-share listed manufacturing firms from 2011 to 2023 to investigate the effect and underlying mechanism of the NAIDP on corporate environmental information disclosure. The results indicate that the NAIDP significantly enhances enterprises’ environmental information disclosure, and this positive effect is more salient for non-state-owned, superior digital infrastructure, and non-heavy-pollution enterprises. Mechanism tests demonstrate that the NAIDP functions by mitigating information asymmetry and enhancing internal control. Further analysis of the moderating effect suggests that management’s environmental awareness and regional environmental regulation intensity positively strengthen the promotional effect of the NAIDP. This study not only supplements micro-level empirical evidence for the environmental governance effect of artificial intelligence applications but also provides practical insights for policy optimization to facilitate the green transformation of the manufacturing industry.

1. Introduction

In the global effort to address climate change, corporate environmental information disclosure serves as a vital channel for companies to fulfill their environmental obligations, and it directly affects the overall success of ecological civilization building [1,2]. Environmental information disclosure enhances corporate transparency and strengthens external supervision, thereby enabling enterprises to fulfill their environmental responsibilities and encouraging green upgrading of the industrial structure [3]. Despite becoming the largest industrial nation in the world, China still faces significant challenges in promoting green transformation. As of 2023, energy consumption in China’s energy-intensive industries still accounted for more than 75% of total industrial energy consumption, underscoring the distinctiveness of environmental governance in industry. Against the above background, systematically exploring the key aspects affecting environmental information disclosure by manufacturing enterprises and the paths for improvement can provide policy guidance for the manufacturing green transition.
The characteristics of the manufacturing sector make its environmental governance exceptionally complex. Environmental information disclosure directly affects its core competitiveness in the global value chain [4]. For manufacturing companies, environmental information disclosure is the point at which they fulfill social responsibilities and optimize governance logic. Environmental information disclosure not only helps manufacturing companies monitor and reduce pollutant emissions in real time throughout the production process, but also encourages them to conduct targeted green R&D, thereby achieving synergy between productive and ecological performance [5]. However, due to traditional data collection methods, manufacturing enterprises often struggle to obtain real-time, precise environmental information [6]. Therefore, enhancing environmental information disclosure for manufacturing enterprises has become the core of structural transformation.
Existing studies have analyzed the core drivers of corporate environmental information disclosure, generally in two main areas: internal governance and external environment. The former focuses on the micro-level resource endowment and governance structure, including functional background of the executive team [7], the level of corporate cash holdings [8], as well as green merger and acquisition strategies [9]. The latter focuses on the macro-level compliance pressure and market incentives, involving environmental regulation intensity [10], official assessment pressure [11], and the social supervision system constituted by long-term institutional investors [12].
However, the enabling function of artificial intelligence in environmental governance received little attention in these studies. Against the backdrop of China’s active promotion of deeper integration between artificial intelligence and the real economy, precise policy instruments such as new-generation artificial intelligence innovation and development pilot zones (NAIDP) have been implemented to drive industrial upgrading through technological innovation. However, systematic and in-depth research on how such initiatives enhance environmental information disclosure in manufacturing firms remains limited. In particular, it is still unclear how they reshape the underlying logic of manufacturing systems to achieve this effect.
To address the persistent challenges hindering the transformation in manufacturing and align with the national strategy facilitating the profound combination of the real and digital economies, the Chinese government launched the NAIDP in 2019. Designed as institutional experiments, this policy aims to foster regional innovation hubs that synergistically advance technological breakthroughs, demonstrate applications, and develop industrial ecosystems. Its overarching objective is to explore scalable, AI-driven paradigms for upgrading the real economy.
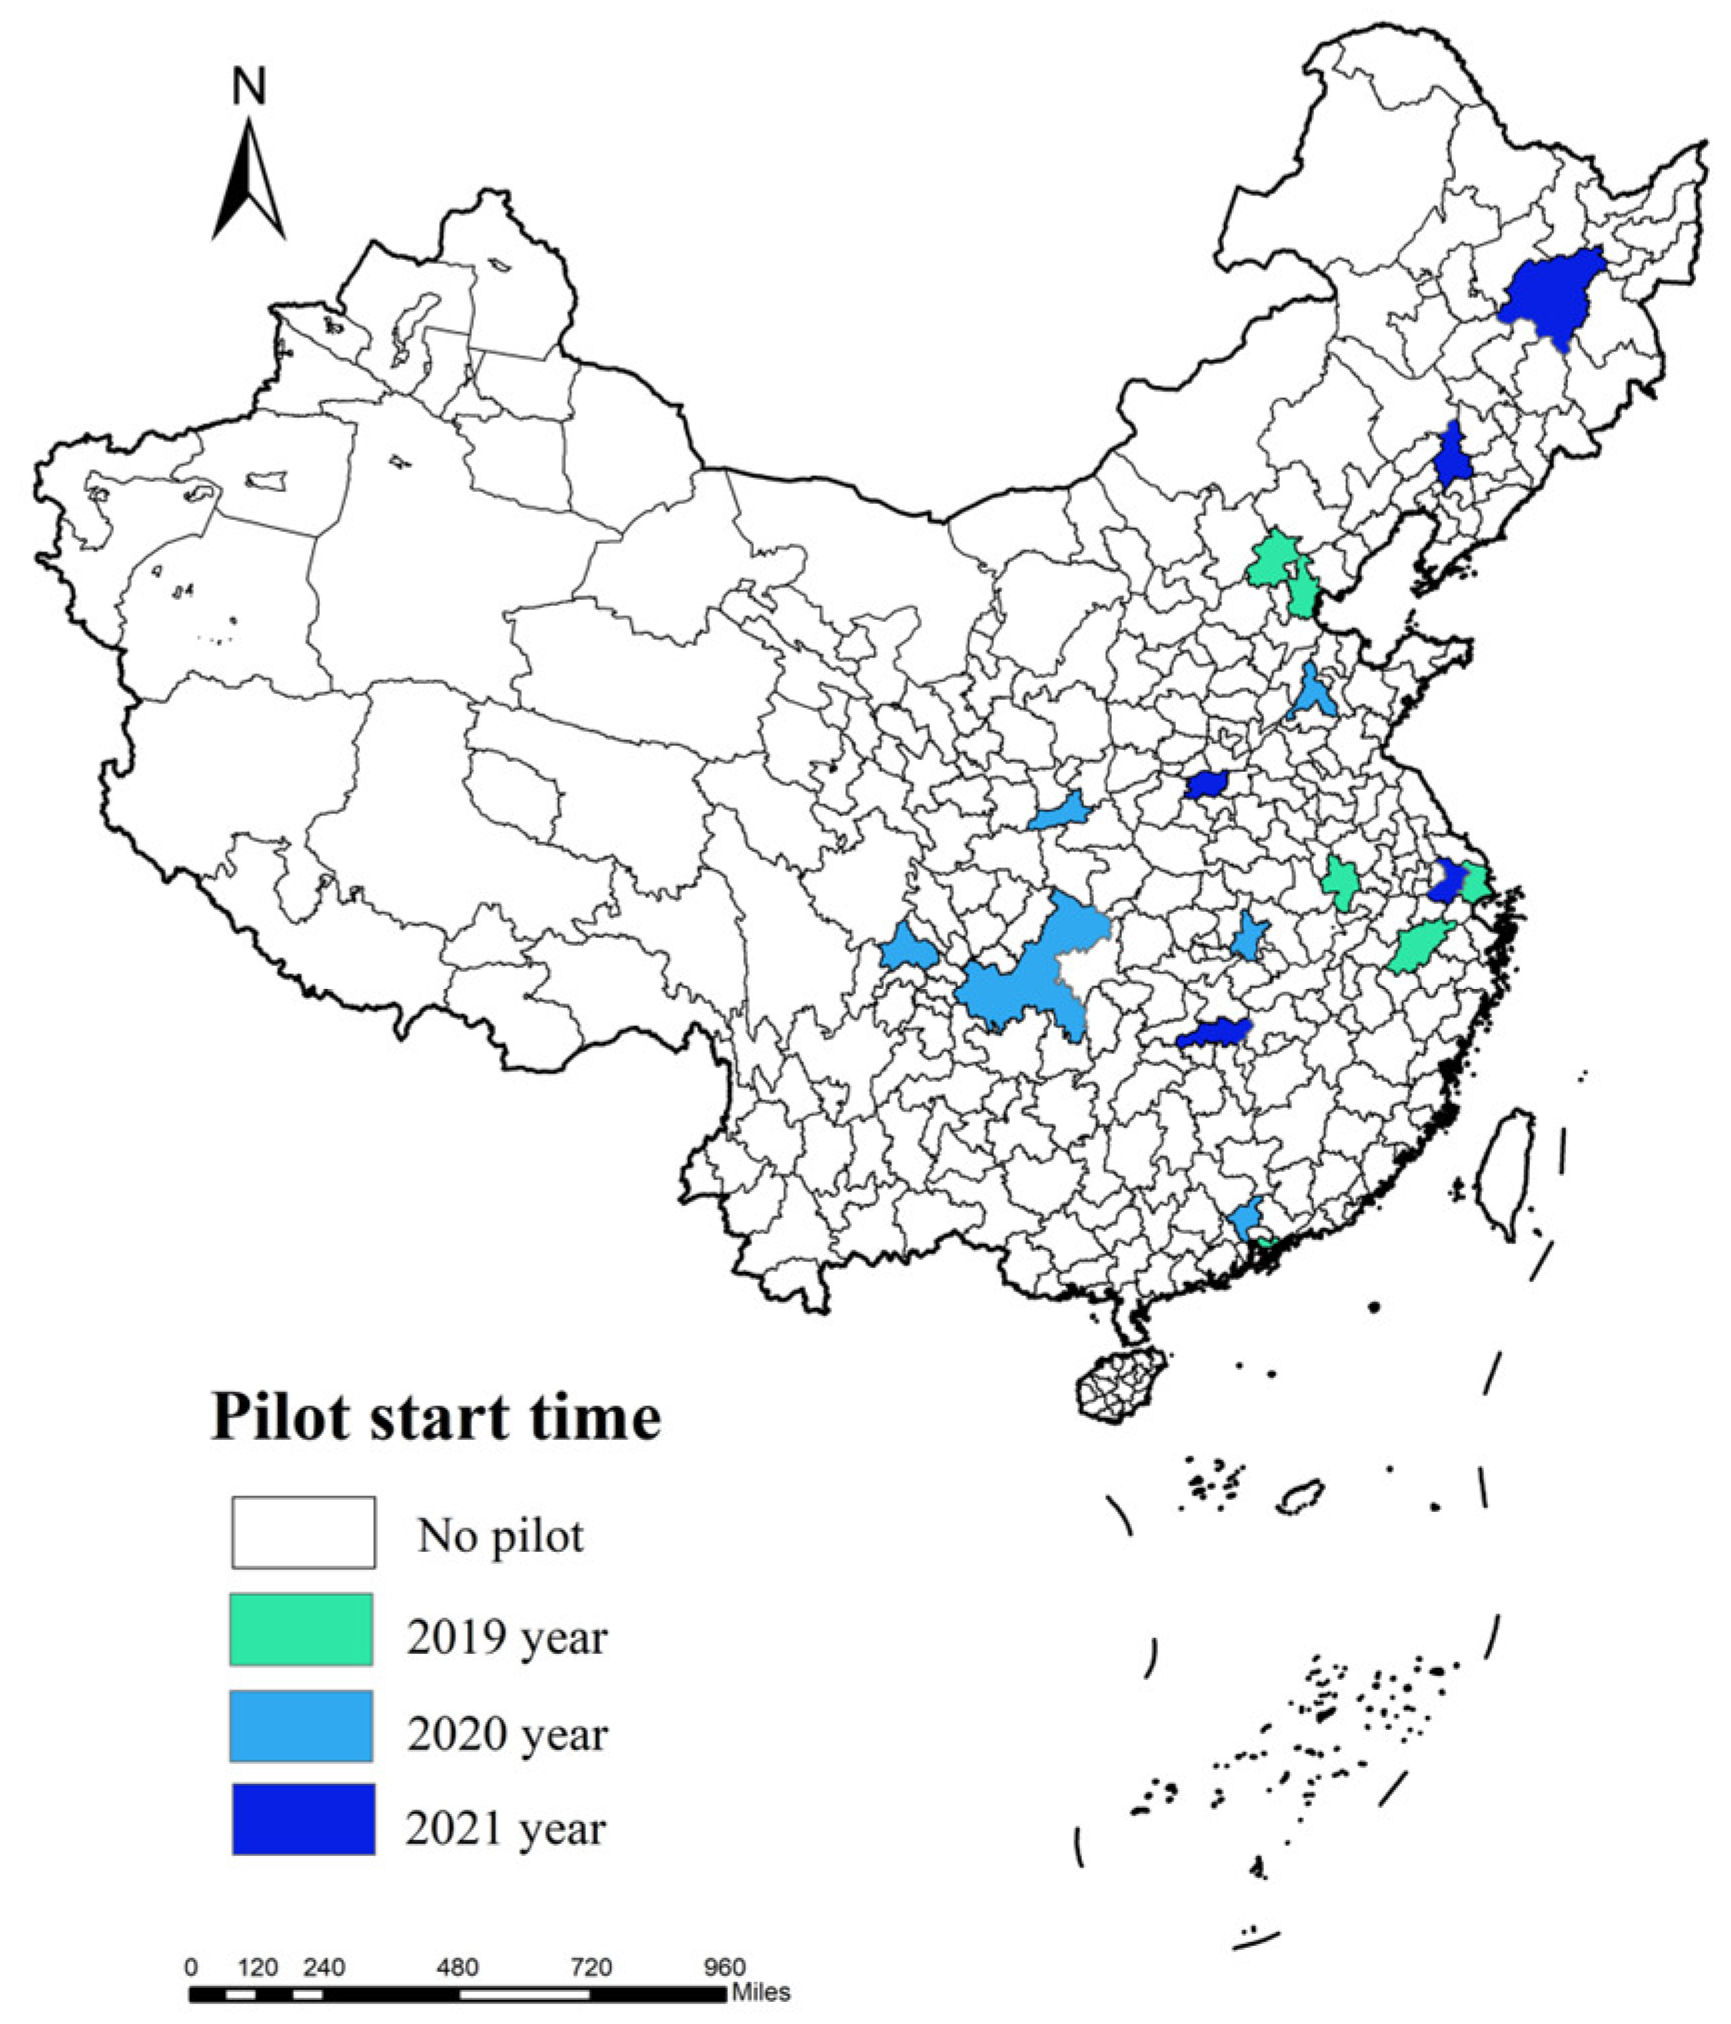
As shown in Figure 1, the Ministry of Industry and Information Technology has implemented a strategic rollout across key economic nodes, including Shanghai and 17 other cities. The NAIDP functions as a targeted policy instrument that combines industrial planning with localized experimentation. Within their jurisdictions, these policies have significantly reshaped both the external operating environment and the internal technological capacity constraints of manufacturing firms. Specifically, they provide high-performance computing infrastructure and enable data resources to be shared and circulated. Consequently, treating the NAIDP as a quasi-natural experiment and rigorously evaluating its environmental governance effects through empirical analysis offers significant insights into the micro-level transmission processes by which digital technology policies exert influence.
The NAIDP serves as a precise measure to guide technological governance transformation. It enhances environmental information disclosure in manufacturing companies through multiple paths. Firstly, based on information asymmetry theory, the NAIDP can alleviate information asymmetry between firms and external stakeholders by improving the generation, integration, and accessibility of environmental information, thereby enhancing environmental information disclosure [13]. Secondly, based on principal–agent theory, the NAIDP can strengthen firms’ internal control systems by improving their capabilities in risk identification, process supervision, and information integration capabilities, thereby constraining managerial opportunistic behavior and facilitating environmental information disclosure [14]. Therefore, can NAIDP enhance environmental information disclosure in manufacturing enterprises? Through which paths can this policy exert its effect? Compared to the universal policy, does it have a targeted optimization effect in manufacturing enterprises with different characteristics?
This paper uses a staggered difference-in-differences model (DID) to examine the impact of the NAIDP on environmental information disclosure, using a sample of manufacturing enterprises listed on the Chinese A-share market from 2011 to 2023. The study finds that the NAIDP has boosted environmental information disclosure. The mechanism analysis reveals two primary channels through which the NAIDP operates: alleviating information asymmetry and strengthening enterprise internal control. The moderation analysis shows that the management environmental background and the environmental regulation intensity can enhance the positive effect. Furthermore, the heterogeneity analysis shows that non-state-owned manufacturing firms, firms with higher degrees of digitization, and firms with lower pollution levels are more significantly affected by the NAIDP.
The possible marginal contribution lies in the following: Firstly, this study examines the influence of the NAIDP on environmental information disclosure in manufacturing enterprises. Existing research on the factors that drive environmental information disclosure mainly concentrates on traditional rigid regulations [10] or conventional corporate governance elements [8], while few studies have paid attention to regional industrial policies centered on artificial intelligence on enterprise environmental behavior.
Secondly, this paper identifies the transmission path of the NAIDP that enhances environmental information disclosure: improving the enterprise information environment disclosure and optimizing internal controls. The existing literature offers scattered discussions on how industrial policies are transmitted to enterprise performance in the environmental field [15,16] and lacks an integrated analysis of the reconfiguration of governance processes.
Thirdly, this paper reveals the moderating role of managerial environmental awareness and regional environmental regulation intensity. The existing literature on the environmental benefits of the NAIDP seldom attends to the potential asymmetry of policy effects across different organizational characteristics and external governance environments. The moderation analysis finds that both managerial environmental awareness and regional environmental regulation intensity significantly strengthen the promoting effect of NAIDP. These findings illuminate the context-dependent nature of the policy effect and offer empirical guidance for targeted policy implementation under varying conditions.

2. Literature Review

Existing research has demonstrated that variables influencing corporate environmental information disclosure may be classified into internal and external dimensions. As for internal factors, such as enterprise equity concentration [17], functional background of the executive team [7], the level of cash holdings of the enterprise [8], and the green acquisition strategy [9], they will affect environmental information disclosure. Specifically, more effective board supervision and checks and balances mechanisms can improve environmental information disclosure. In addition, basic operating conditions in enterprises, such as scale, profitability, asset liability structure, and cash flow status, directly determine the resources available to them to assume environmental responsibilities and to disclose relevant information. Large-scale, financially strong enterprises are usually more motivated to disclose environmental information to maintain their corporate reputation [5].
As for the external aspect, the environmental regulation intensity [18], the official assessment pressure [11], and the social supervision system composed of long-term institutional investors [12] are the motivating factors for the environmental information disclosure. Firstly, government regulations and policies are the most direct external constraints. Various environmental economic policies can significantly improve environmental information disclosure by exerting mandatory effects or through incentive mechanisms [19]. Secondly, the pressure of official assessment is linked to ecological indicators. This political pressure will be transformed into a hard constraint on enterprises within the jurisdiction through policy transmission [20]. External entities, such as green investors, creditors, media, and non-governmental organizations, through reputational mechanisms, force companies to improve their environmental performance and make compliant disclosures to gain legitimacy [3]. The existing literature has developed a relatively comprehensive analytical framework that spans both internal and external dimensions. However, few studies systematically examine how a regional, experiment-oriented national policy reshapes the motivation, resources, and capabilities of enterprises for environmental information disclosure.
The economic impacts of artificial intelligence (AI) are also the subject of recent studies. With the rise of artificial intelligence and its elevation to a national strategy, its economic effects have become an emerging topic. The related research mainly proceeds along two paths: technology adoption and policy intervention. In examining the economic impact of AI adoption, existing studies have moved from the macro level to the micro level. The use of AI not only improves the productivity and innovation performance in enterprises [21] but also enhances enterprise environmental performance [22], promotes the improvement of corporate governance levels [23], and stimulates the improvement of ESG performance [24]. Specifically, AI optimizes production processes, thereby improving enterprises’ total factor productivity and reconfiguring manufacturing operations to adapt to modern production environments [25]. Moreover, AI empowers energy management, pollution monitoring, and resource recycling, fundamentally driving the transformation of digital capabilities into green innovation [26] and effectively improving environmental information disclosure [18].
Regarding policy level, prior research has emphasized that the NAIDP exerts a strong guiding influence. The NAIDP can improve urban innovation by promoting human capital upgrading and enhancing absorptive capacity [27], and reducing carbon emission intensity through the rational allocation of resources [28]. Moreover, the NAIDP can drive enterprise digital transformation by offering tax incentives and subsidies that lower the technical costs of digital adoption [29] and enhance corporate ESG performance by stimulating green technology innovation and increasing R&D investment [30]. At the digital regulatory level, the NAIDP accelerates the digital transformation of regulatory tools by promoting the application of digital technologies such as artificial intelligence, thereby enhancing urban green economic efficiency [31] and reducing corporate pollution emissions [32]. In conclusion, the existing literature has confirmed the beneficial role of AI in economic growth as well as green transformation through both technical empowerment and policy effects. However, there is a lack of literature that systematically assesses the causal effect of the NAIDP on environmental information disclosure by manufacturing firms and the internal channels through which these policies operate.
There are still research gaps in the following three areas: Firstly, the majority of current research on environmental information disclosure focuses on burdensome regulations or traditional governance structures, while few studies examine the effects of the NAIDP on company environmental practices. Secondly, the existing literature still lacks a comprehensive assessment of the causal effects and internal mechanisms of the NAIDP on environmental information disclosure. Even though previous research has demonstrated AI’s beneficial effects on macroeconomic growth, empirical research remains limited in examining how the NAIDP drives manufacturing firms to improve environmental information disclosure. Thirdly, the existing literature has paid insufficient attention to the boundary conditions under which the NAIDP takes effect. Although some studies have preliminarily examined the differential effects of the NAIDP across firms or regions through subsample regressions, few have systematically analyzed how internal and external contextual factors strengthen or weaken the environmental governance effect of the NAIDP from a moderating perspective.

3. Policy Background and Research Hypotheses

3.1. Policy Background

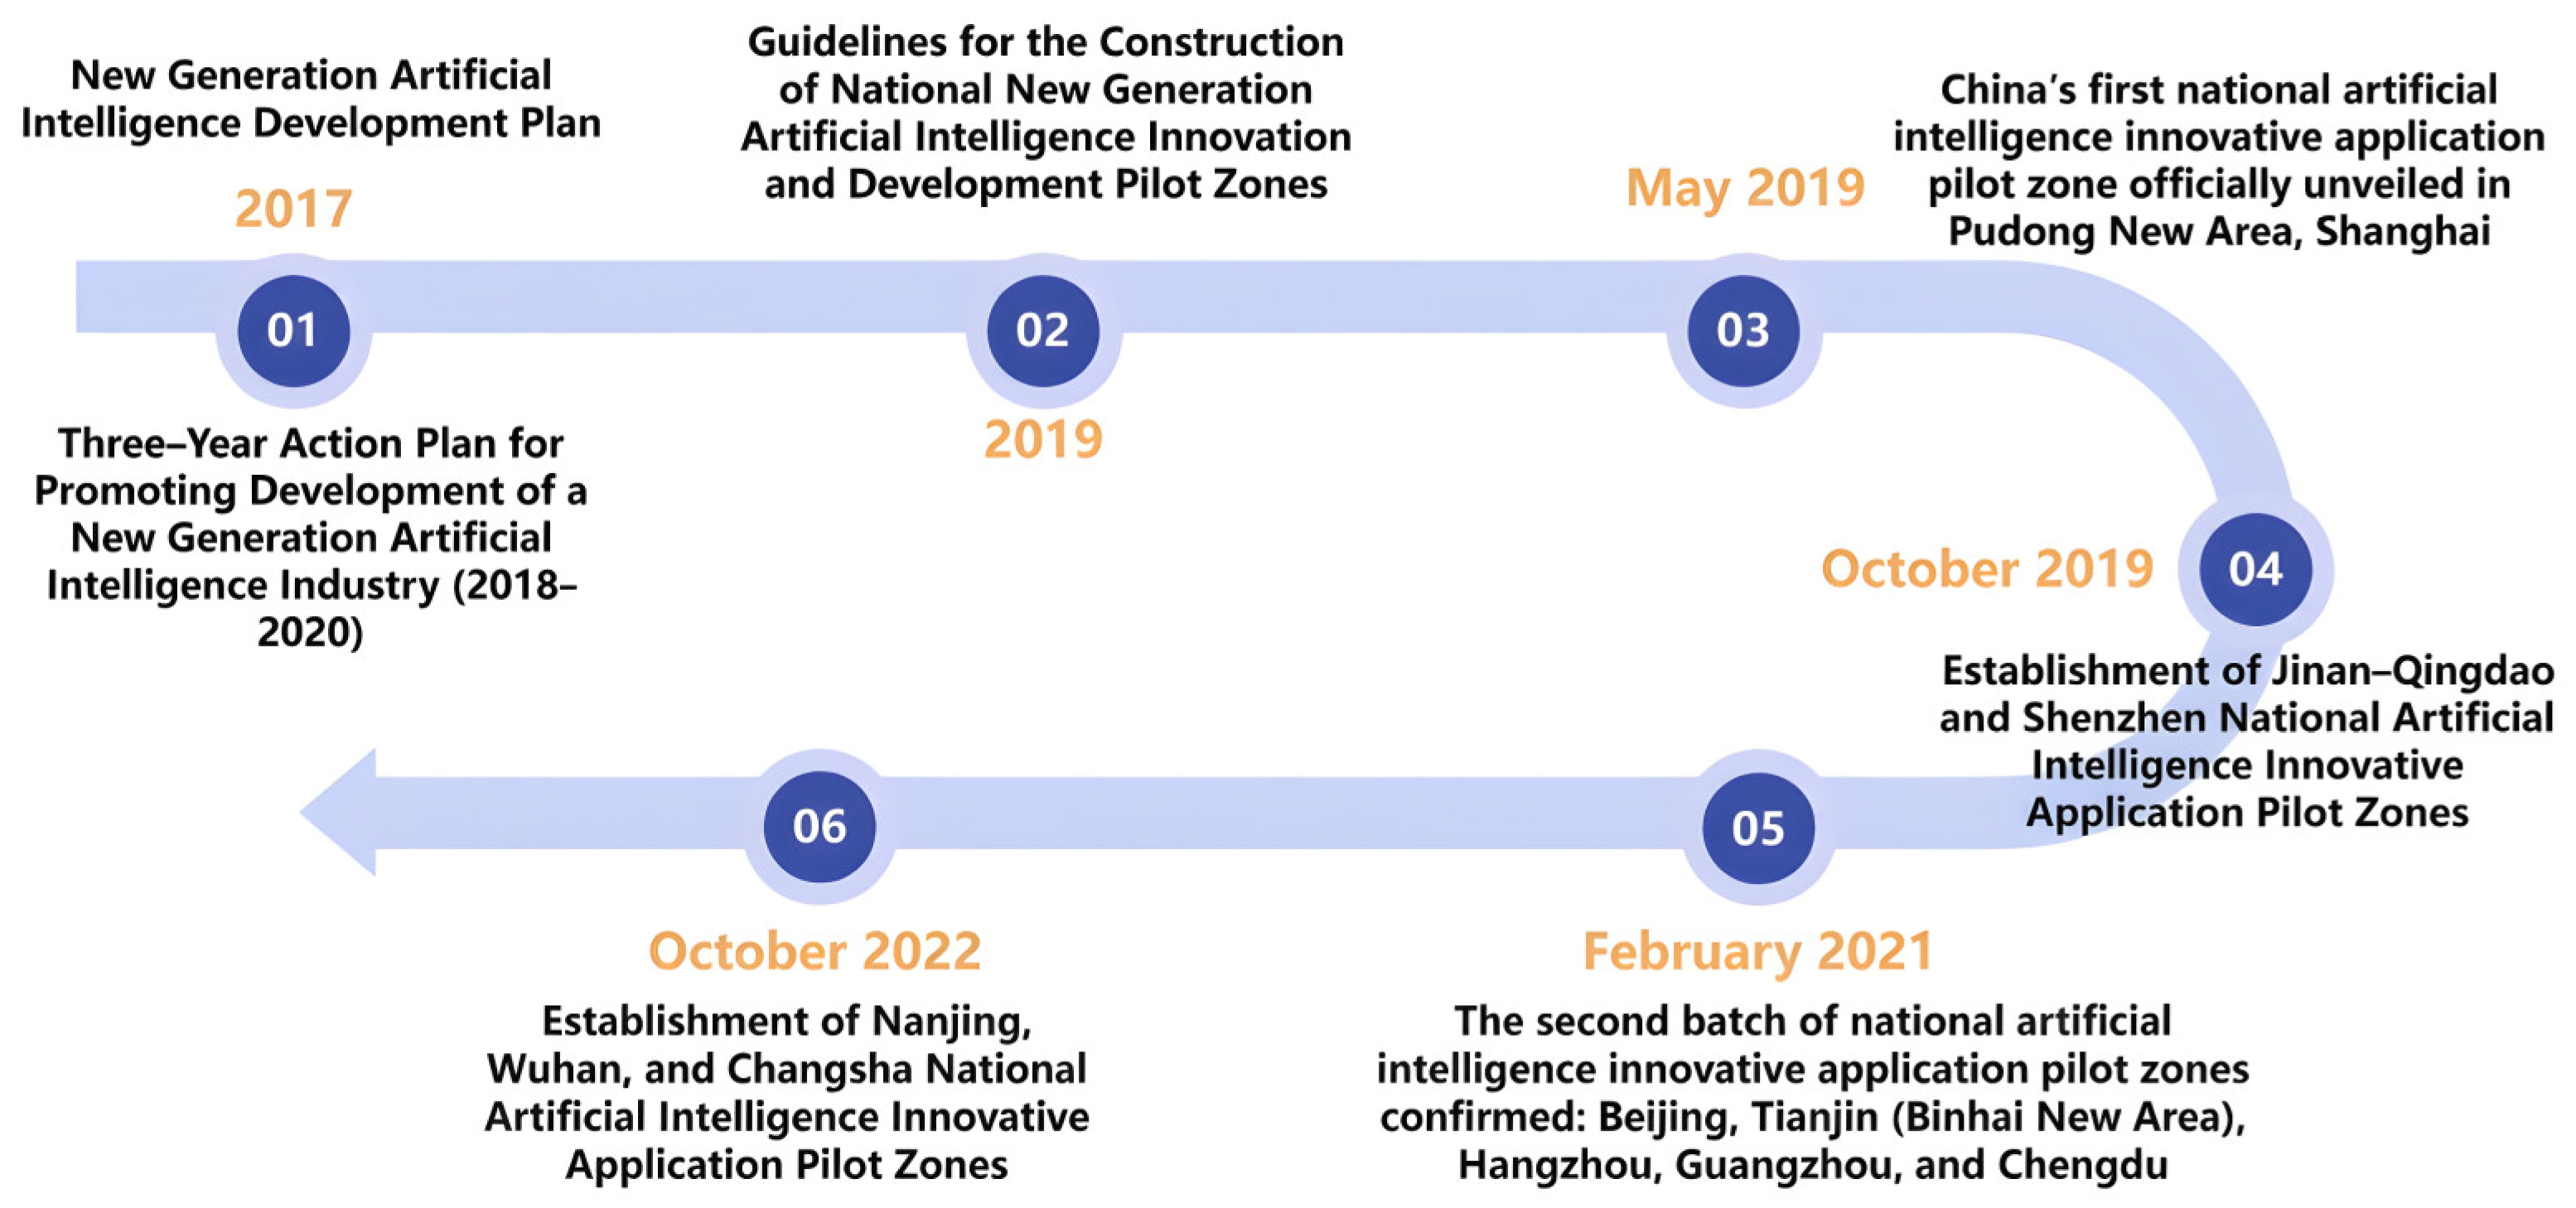
Encouraging the thorough integration of AI with the real economy constitutes a core national strategy for China to take advantage of the new phase of technological innovation. This strategic initiative is underpinned by a coherent, multi-tiered overarching design and a phased implementation pathway [33]. A pivotal milestone was the State Council’s issuance of the New Generation Artificial Intelligence Development Plan in 2017, which formally elevated AI development to a national priority. To operationalize this vision, the Guidelines for establishing the NAIDP were published by the Ministry of Industry and Information Technology (MITT) in 2019, recognizing the institutional start of a targeted, place-based policy instrument.
Building on this framework, China launched the NAIDP. From 2019 to 2022, the MIIT approved three successive batches totaling 11 pilot zones: the first zone was inaugurated in May 2019 in Shanghai. Two additional zones were authorized in October 2019 in the Jinan and Qingdao metropolitan cluster and Shenzhen. Five more were designated in February 2021, which are Beijing, Tianjin, Hangzhou, Guangzhou, and Chengdu. Then Nanjing, Wuhan, and Changsha were added in October 2022. Geographically, this tiered rollout strategically encompasses the Yangtze River Delta, the Guangdong–Hong Kong-Macao Greater Bay Area, the Beijing–Tianjin–Hebei region, and the Chengdu–Chongqing economic circle. By concentrating AI innovation infrastructure, talent, industry applications, and policy experimentation in these high-potential regions, the initiative aims to cultivate scalable models of AI-driven industrial upgrading and serve as national demonstration hubs for economic evolution. The timeline of NAIDP development is shown in Figure 2.
Since the implementation of this policy, sustained governmental support, cross-sectoral collaborative R&D initiatives, and strategic industrial clustering have collectively accelerated the commercialization of AI technologies and their deep integration with the real economy [2]. For example, Tianjin Binhai New Area has developed a vertically integrated AI industrial chain, encompassing core hardware, foundational software, computing infrastructure, and cybersecurity, fostering several AI industrial clusters at the national level. This ecosystem has incubated numerous industry-leading firms, contributing to an AI-related industrial output exceeding 300 billion RMB. Concurrently, the AI industry in Shenzhen reached 360 billion RMB in scale, while the AI industry in Shanghai surpassed 400 billion RMB. Collectively, these results demonstrate that pilot zone policies function not merely as localized institutional experiments but serve as pivotal catalysts for the leapfrog advancement of the national AI industry and the intelligent upgrading of the real economy.

3.2. Research Hypotheses

3.2.1. Direct Impact of the NAIDP

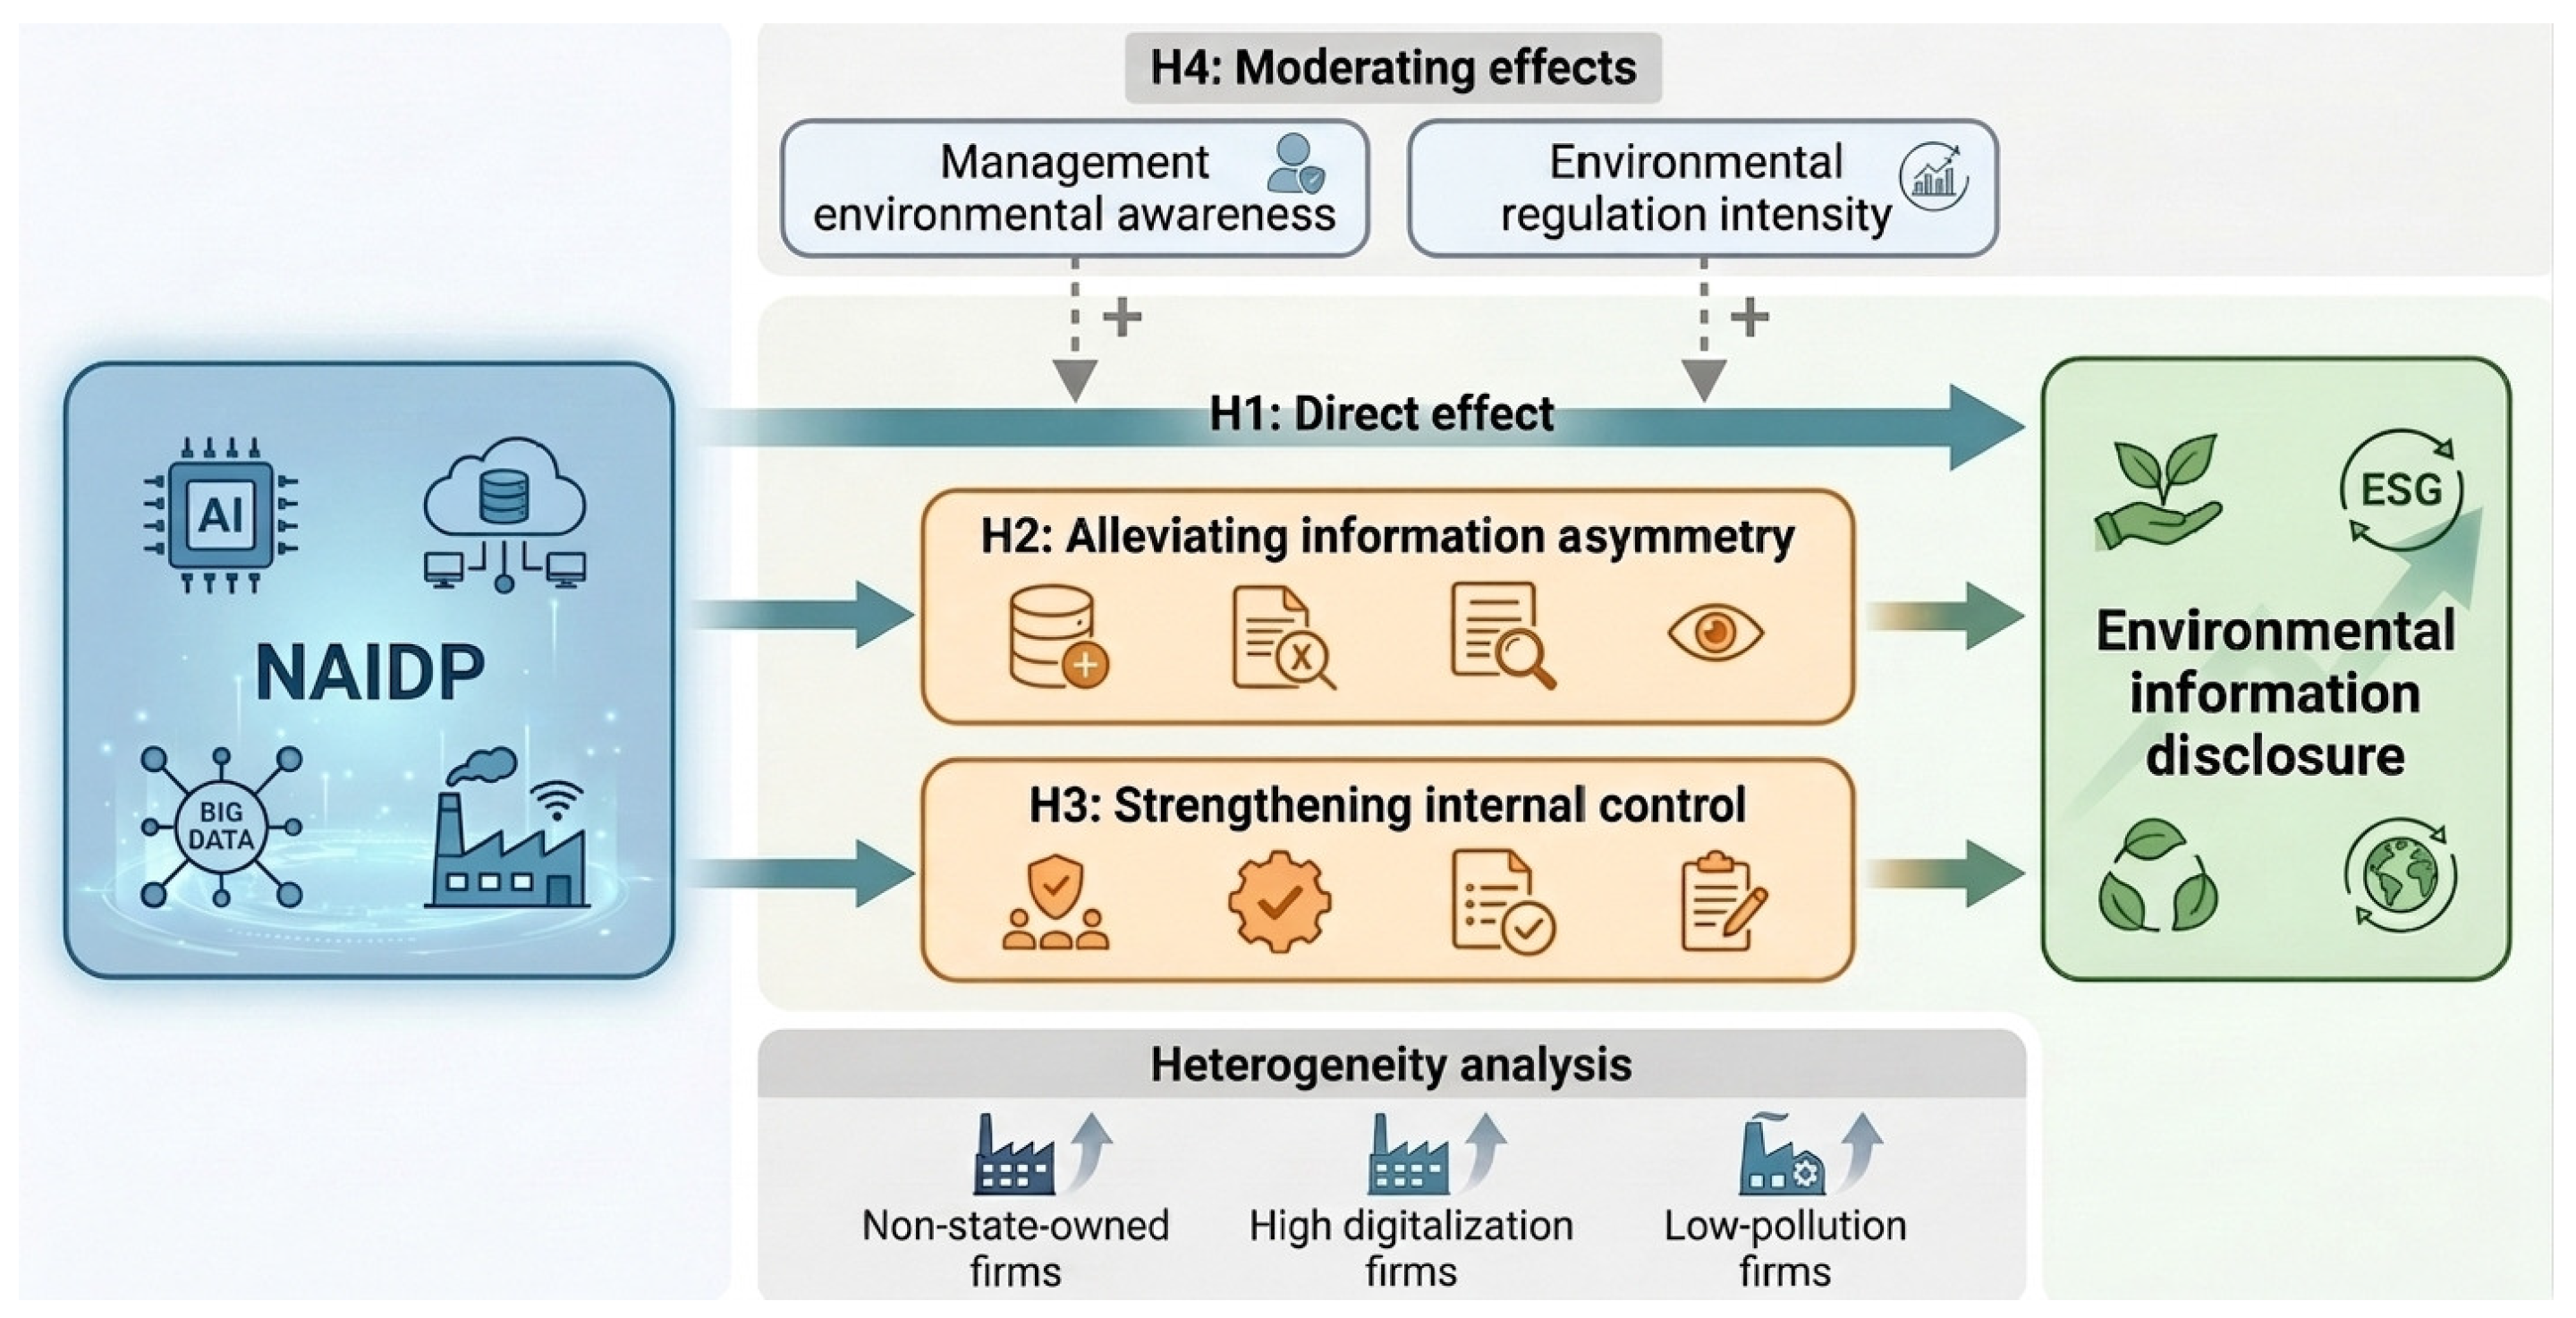
Based on signaling theory, environmental information disclosure serves as an important signal to external stakeholders of firms’ environmental governance capabilities and sustainability commitments [34]. However, due to the complexity of manufacturing processes and the numerous stages of energy consumption and pollution emissions, manufacturing firms’ environmental information is highly fragmented and process-dependent [35]. The collection and verification of environmental information not only rely on high information processing capabilities and institutionalized management costs, but also require substantial information processing costs [36]. Consequently, even firms with environmental governance motives may still under-disclose or delay disclosure due to high information generation and processing costs. Figure 3 presents a framework for this paper.
By promoting the application of artificial intelligence and other digital technologies in manufacturing firms, the NAIDP reshapes the environment in which firms generate and verify environmental information [37]. On the one hand, the NAIDP facilitates the adoption of AI, big data, industrial internet, and intelligent sensing technologies in manufacturing firms, enabling them to collect environmental data in real time and automatically record emission and energy consumption information [38]. This not only significantly reduces the time costs for manufacturing firms to generate and organize environmental information, but also improves information accuracy and traceability, thereby lowering the marginal cost of environmental information disclosure [39].
On the other hand, the NAIDP strengthens the institutional environment and market expectations for environmental information disclosure. The NAIDP reinforces the institutional orientation toward the digital economy and green transformation, making environmental governance capability an increasingly important basis for accessing policy support and institutional resources [40]. Meanwhile, with the advancement of digital regulation and information processing capabilities, the market’s ability to identify and evaluate firms’ environmental information is enhanced, and the credibility and differentiation of environmental information disclosure in capital markets improve accordingly [41]. Against this backdrop, environmental information disclosure is not merely a compliance behavior but gradually evolves into an important strategic signal through which firms demonstrate their green governance capabilities [34]. By proactively improving environmental information disclosure, firms can convey their environmental governance capabilities and sustainability commitments to the government, investors, and the public, thereby obtaining potential benefits such as institutional recognition, reputational enhancement, and capital market approval [38]. Therefore, this paper proposes:
H1. 
The NAIDP can improve environmental information disclosure in manufacturing enterprises.

3.2.2. Indirect Impact of the NAIDP

According to information asymmetry theory, information disparities between transacting parties are a fundamental source of market failure [42]. In the context of environmental information disclosure, manufacturing firms, as the information-advantaged party, possess accurate knowledge of their pollutant emissions and resource consumption. In contrast, external stakeholders are at an informational disadvantage, lacking both access to relevant information and the ability to effectively verify the authenticity and completeness of the disclosed information [43]. This information asymmetry weakens the ability of external stakeholders to monitor and constrain firms’ environmental behavior. Facing pressures such as regulatory scrutiny, reputational risk, and potential economic costs, manufacturing firms may tend to reduce disclosure or selectively disclose environmental information [44].
The NAIDP promotes environmental information disclosure by manufacturing firms by mitigating the information asymmetry between firms and external stakeholders. On the one hand, the NAIDP enhances firms’ capacity to generate and integrate environmental information, transforming previously fragmented and non-standardizable environmental data into accessible information resources, thereby improving the completeness and consistency of environmental information supply [13,18]. On the other hand, the NAIDP strengthens external stakeholders’ ability to identify and verify environmental information, enabling regulators, investors, and other parties to analyze and cross-validate disclosed information at lower cost. This significantly reduces the costs of information acquisition and verification, thereby reinforcing external monitoring capacity [37]. Under these combined effects, the external verifiability of firms’ environmental information disclosure is significantly enhanced, the room for information manipulation and selective disclosure is reduced, and the costs for firms to conceal negative environmental information rise accordingly [39]. The resulting strengthening of external monitoring makes low-quality disclosure strategies unsustainable, thereby providing more truthful and complete environmental information [45]. Therefore, this paper proposes:
H2. 
The NAIDP can improve manufacturing enterprises’ environmental information disclosure by alleviating information asymmetry.
Based on principal–agent theory, the separation of ownership and control creates conflicts of interest, which may lead management to conceal negative environmental information for self-interested reasons [46]. Internal control, as an important institutional arrangement to mitigate agency conflicts, can constrain management’s opportunistic behavior through monitoring and incentive-compatible mechanisms. In this process, it ensures the authenticity and completeness of environmental information disclosure [47]. However, traditional internal control systems in manufacturing firms still have notable limitations in the domain of environmental information disclosure. The lengthy production processes and the scattered distribution of environmental data across workshops and production lines make it difficult for traditional internal control methods to achieve real-time data collection and accurate verification. As a result, management retains considerable room for information manipulation, and constraining functions of internal control cannot be fully realized.
The NAIDP strengthens the role of internal control in ensuring environmental information disclosure by embedding artificial intelligence technologies into corporate internal control systems. On the one hand, the NAIDP enhances risk identification and assessment capabilities. AI technologies can identify potential environmental risks, analyze historical data to predict environmental regulatory trends, and embed the analytical results into the internal risk assessment system. This guides firms to adjust internal processes in advance, thereby avoiding the risk of insufficient disclosure [48]. Accurate risk assessment raises the priority of environmental risks within internal control, prompting firms to improve the forward-looking nature of their environmental information disclosure [39].
On the other hand, the NAIDP strengthens process monitoring and information integration, thereby reducing management’s room for manipulation [14,49]. Automated control mechanisms lower the operational costs of environmental information processing and disclosure. Their programmatic and rule-based nature reinforces the rigid constraints of internal control, limiting management’s ability to selectively disclose or manipulate information [50]. At the same time, improved information integration capabilities and cross-departmental coordination efficiency ensure the consistency and timeliness of environmental information disclosure. Dynamic monitoring mechanisms further enhance the self-correcting ability of internal control, ensuring compliance in environmental information disclosure. Therefore, this paper proposes:
H3. 
The NAIDP can improve manufacturing enterprises’ environmental information disclosure by strengthening internal control.

3.2.3. Moderation Effect of the NAIDP

Within the firm, the management of environmental awareness serves as the intrinsic, logical starting point for corporate strategic decisions, determining the depth and breadth of the application of AI for environmental governance in enterprises. Based on advanced theory, the management understanding and values regarding environmental issues will significantly influence the resource allocation and information disclosure preferences [51]. Specifically, strong environmental awareness can prompt the management team to actively integrate AI into green innovation and energy consumption monitoring processes, improving environmental data quality [52]. In addition, when the management team acknowledges the significance of environmental performance for the enterprise’s enduring brand and legitimacy, they are more likely to use intelligent technologies to improve environmental information disclosure in response to stakeholder expectations. Especially for executives with an environmental background, they often demonstrate stronger leadership in sustainable development, significantly optimizing the comprehensive ESG performance and thereby enhancing the internal driving force to disclose environmental information [53]. Thus, stronger environmental awareness among management leads to a more pronounced positive effect.
Based on institutional theory, mandatory environmental regulations can raise the cost of noncompliance, requiring firms to implement compliance methods. Enterprises face more strict monitoring and disclosure review pressures in areas with stronger environmental regulations [54]. At this time, the digital tools outlined in the NAIDP have become an effective means for enterprises to address regulatory pressures. Specifically, the pressure from strict regulations drives enterprises to adopt intelligent monitoring technologies more actively in the pilot zone to reduce errors in environmental data calculations [55]. Then, the harsh enforcement environment for environmental laws strengthens the guiding effect of the pilot, making precise disclosure enabled by intelligent technology to avoid administrative penalties. Studies have shown that environmental regulations can overcome governance inertia driven by political resource dependence and prompt enterprises to rely on technological progress to improve environmental performance [56]. Therefore, stricter environmental regulation intensity amplifies this targeted promotional effect. Therefore, this paper proposes:
H4. 
The management environmental awareness and intensity of environmental regulations positively influence the effect of the NAIDP on environmental information disclosure.

4. Research Design

4.1. Data Sources

This paper utilizes a sample of Chinese A-share listed manufacturing companies spanning the period from 2011 to 2023. Financial data for the enterprises mainly originated from the Wind and CSMAR databases. Data related to the NAIDP is obtained from the State Council document. The following sample data is excluded in this research: (1) ST and * ST enterprises are removed. (2) Companies without core variable data are not included. (3) Delisted companies or those facing delisting proceedings are excluded. To mitigate the impact of extremes on the research findings, this study truncated variables at the 1% and 99%, and 19,870 firm-year observations in total are obtained.

4.2. Model Setting

4.2.1. Baseline Regression Model

Since the NAIDP is implemented in different batches, this paper employs a staggered DID model to evaluate the policy effect on environmental information disclosure in manufacturing firms. The empirical specification for the baseline regression is as follows:
EID i , t   =   α 0   +   α 1 NA IDP i , t   +   X i , t   +   μ i   +   λ t   +   ϵ i , t
where EID i , t is the explained variable, meaning the environmental information disclosure level of enterprise i in year t; NA IDP i , t is the explanatory variable. X i , t represents a series of control variables. μ i represents a firm fixed effect, λ t represents a year fixed effect, ϵ i , t represents a random disturbance term.

4.2.2. Mechanism Analysis Model

Previous theoretical analysis shows that the NAIDP mainly affects environmental information disclosure through two indirect paths: alleviating information asymmetry and strengthening internal control. Therefore, this study specifies the following mediation framework:
Mediator it   =   β 0   +   β 1 NAIDP it   +   β 2 X it   +   μ i   +   λ t   +   ϵ it
where Mediator it serves as the mediating variable, representing information asymmetry (Asy) and internal control degree (Inter).

4.2.3. Moderation Analysis Model

To test the above moderating effect, this paper introduces the moderation model and constructs the following econometric model:
EID i , t   =   δ 0   +   δ 1 NA IDP i , t   +   δ 2 Moder it   +   δ 3 N A I D P it   ×   Moder it   +   δ 4 X i , t   +   μ i   +   λ t   +   ϵ i , t
where Moder it refers to moderation variables, representing management environmental awareness (Back) and environmental regulation intensity (Inten). The coefficient δ 3 of the interaction term is the focus.

4.3. Variable Definition

4.3.1. Dependent Variable

Environmental information disclosure (EID). Following Zhao et al. [39], we use the environmental research database within CSMAR to classify enterprises’ environmental information disclosure according to whether it is monetised. For monetised information, disclosure that is both quantitative and qualitative is assigned a value of 2, disclosure that is only qualitative is assigned 1, and non-disclosure is assigned 0. For non-monetised information, disclosed indicators receive a score of 2, while undisclosed ones are marked 0.
Specifically, disclosures related to environmental liabilities, environmental performance, and environmental governance consist of quantifiable, monetary-based metrics. In contrast, disclosures concerning environmental management, environmental certifications, and the carriers of environmental information disclosure are represented by non-monetary, qualitative measures. These two categories of information encompass five dimensions and 25 scoring indicators. After aggregating the scores across all indicators, a logarithmic transformation is applied to derive the environmental information disclosure index. This index provides a holistic assessment of a firm’s environmental reporting standards. Table 1 presents the specific scoring items.

4.3.2. Explanatory Variable

Following Guan et al. [59], this study regards the implementation of the NAIDP as a quasi-natural experiment. The explanatory variable is constructed as an interaction term, denoted as NA IDP i , t = T r e a t i × P o s t t , where T r e a t i is assigned a value of 1 if firm i is located in a pilot zone and 0 otherwise, and P o s t t is a time dummy assigned a value of 1 for the pilot year and thereafter. Specifically, P o s t t is assigned a value of 1 from 2019 onward for first-batch cities, from 2020 onward for second-batch cities, and from 2021 onward for third-batch cities, otherwise, it is 0.

4.3.3. Control Variables

Following Zhao et al. [60], this paper selects the enterprise-level control variables: company size (Size), fixed asset ratio (Fixed), return on total assets (ROA), cash ratio (Cr), board size (Board), and independent directors’ proportion (Indep). Controlling for these variables helps alleviate omitted-variable bias caused by enterprise heterogeneity, thereby providing more reliable causal inference into the net effect of NAIDP policy.

4.3.4. Mechanism Variables

Information asymmetry (Asy). Following Xu et al. [61], this paper conducts a principal component analysis on the stock liquidity indicator LR, the non-liquidity ratio indicator ILL, and the yield reversal indicator GAM. Both the first and second principal component scores, c1 and c2, are acquired. By weighting and summing c1 and c2, and then dividing by the cumulative variance explanation rate, the Asy is calculated.
Internal control (Inter). Internal control refers to the processes instituted by management to safeguard enterprise assets, maintain the legality and compliance of business operations, guarantee the reliability of accounting information, and improve operational efficiency. Following Cheng [62], this paper adopts the Dibo internal control index, transformed by taking the natural logarithm after adding one, as the proxy for internal control.

4.3.5. Moderation Variables

Management environmental awareness (Back): Following Tan and Zhu [52], this paper uses the Python 3.14 programming language to identify various terms related to the environment, demonstrating management emphasis on environmental preservation and energy conservation. By counting the number of times these words appear in corporate social responsibility reports, the management’s environmental protection awareness is measured.
Environmental regulation intensity (Erlten): Following Wang et al. [63], this study assesses the strength of environmental regulations by calculating the proportion of characters in texts containing environmental protection terms relative to the total number of characters in the texts. By calculating the logarithms of these frequency proportions, the differences in environmental regulatory intensity across regions are quantified. Table 2 delineates the precise measuring methodologies:

5. Empirical Results

5.1. Descriptive Statistics Result

The primary variables’ descriptive statistics are shown in Table 3. Panels A, B, and C report the variable distributions for the full sample, the treatment group, and the control group, respectively. In the full sample, environmental information disclosure (EID) ranges from 0.000 to 3.611, indicating significant differences across the sample enterprises. The median is 2.079, the mean is 1.879, showing that most of the environmental information disclosure in sample firms remains relatively low and has considerable room for improvement. The other control variables are all within a reasonable range. The sample sizes for the treatment and control groups are 7320 and 12,550, respectively, with the former accounting for approximately 36.8% of the full sample. Meanwhile, the two groups exhibit similar means and standard deviations for the main control variables, indicating comparable distribution characteristics.

5.2. Baseline Regression Result

From the results in column (1) in Table 4, the coefficient of NAIDP is positive at the 1% level, indicating that the application of NAIDP policies significantly drives EID by manufacturing enterprises. To reduce possible endogenous interference, we also include control variables and fixed effects in columns (2) to (4). Specifically, column (2) includes control variables that influence disclosure decisions. Column (3) further adds fixed effects to account for time-invariant characteristics and macro time trends. Column (4) reports the full model incorporating control variables and double fixed effects. The coefficient of NAIDP remains significantly positive. From an economic perspective, using the regression result in column (4) as an illustration, under the condition that other factors remain unchanged, if the NAIDP increases by one standard deviation, the EID of manufacturing enterprises could increase 7.6%. In summary, the results support hypothesis H1.
The possible economic explanations are as follows. Firstly, by promoting the application of digital technologies in manufacturing firms, the NAIDP improves the conditions for generating environmental information [37,38]. This enables firms to acquire and organize information on emissions, energy consumption, and environmental governance more efficiently and accurately, thereby reducing the marginal cost of environmental information disclosure and alleviating the problems of insufficient or delayed disclosure [39]. Second, the NAIDP strengthens the strategic value of environmental information disclosure. As the institutional emphasis on the digital economy and green transition intensifies, environmental governance capability has gradually become an important basis for firms to obtain institutional resources, market recognition, and reputational benefits [40,41]. In this context, by improving environmental information disclosure, manufacturing firms not only respond to external regulatory requirements but also demonstrate their green governance capability and sustainability commitment to the government, investors, and the public [34]. Consequently, after the implementation of the NAIDP, manufacturing firms are more motivated to enhance environmental information disclosure to send positive signals and gain external recognition [38].

5.3. Parallel Trend Test Result

Following Guan et al. [59], we construct the following econometric model to further investigate the dynamic effects of firms’ environmental information disclosure.
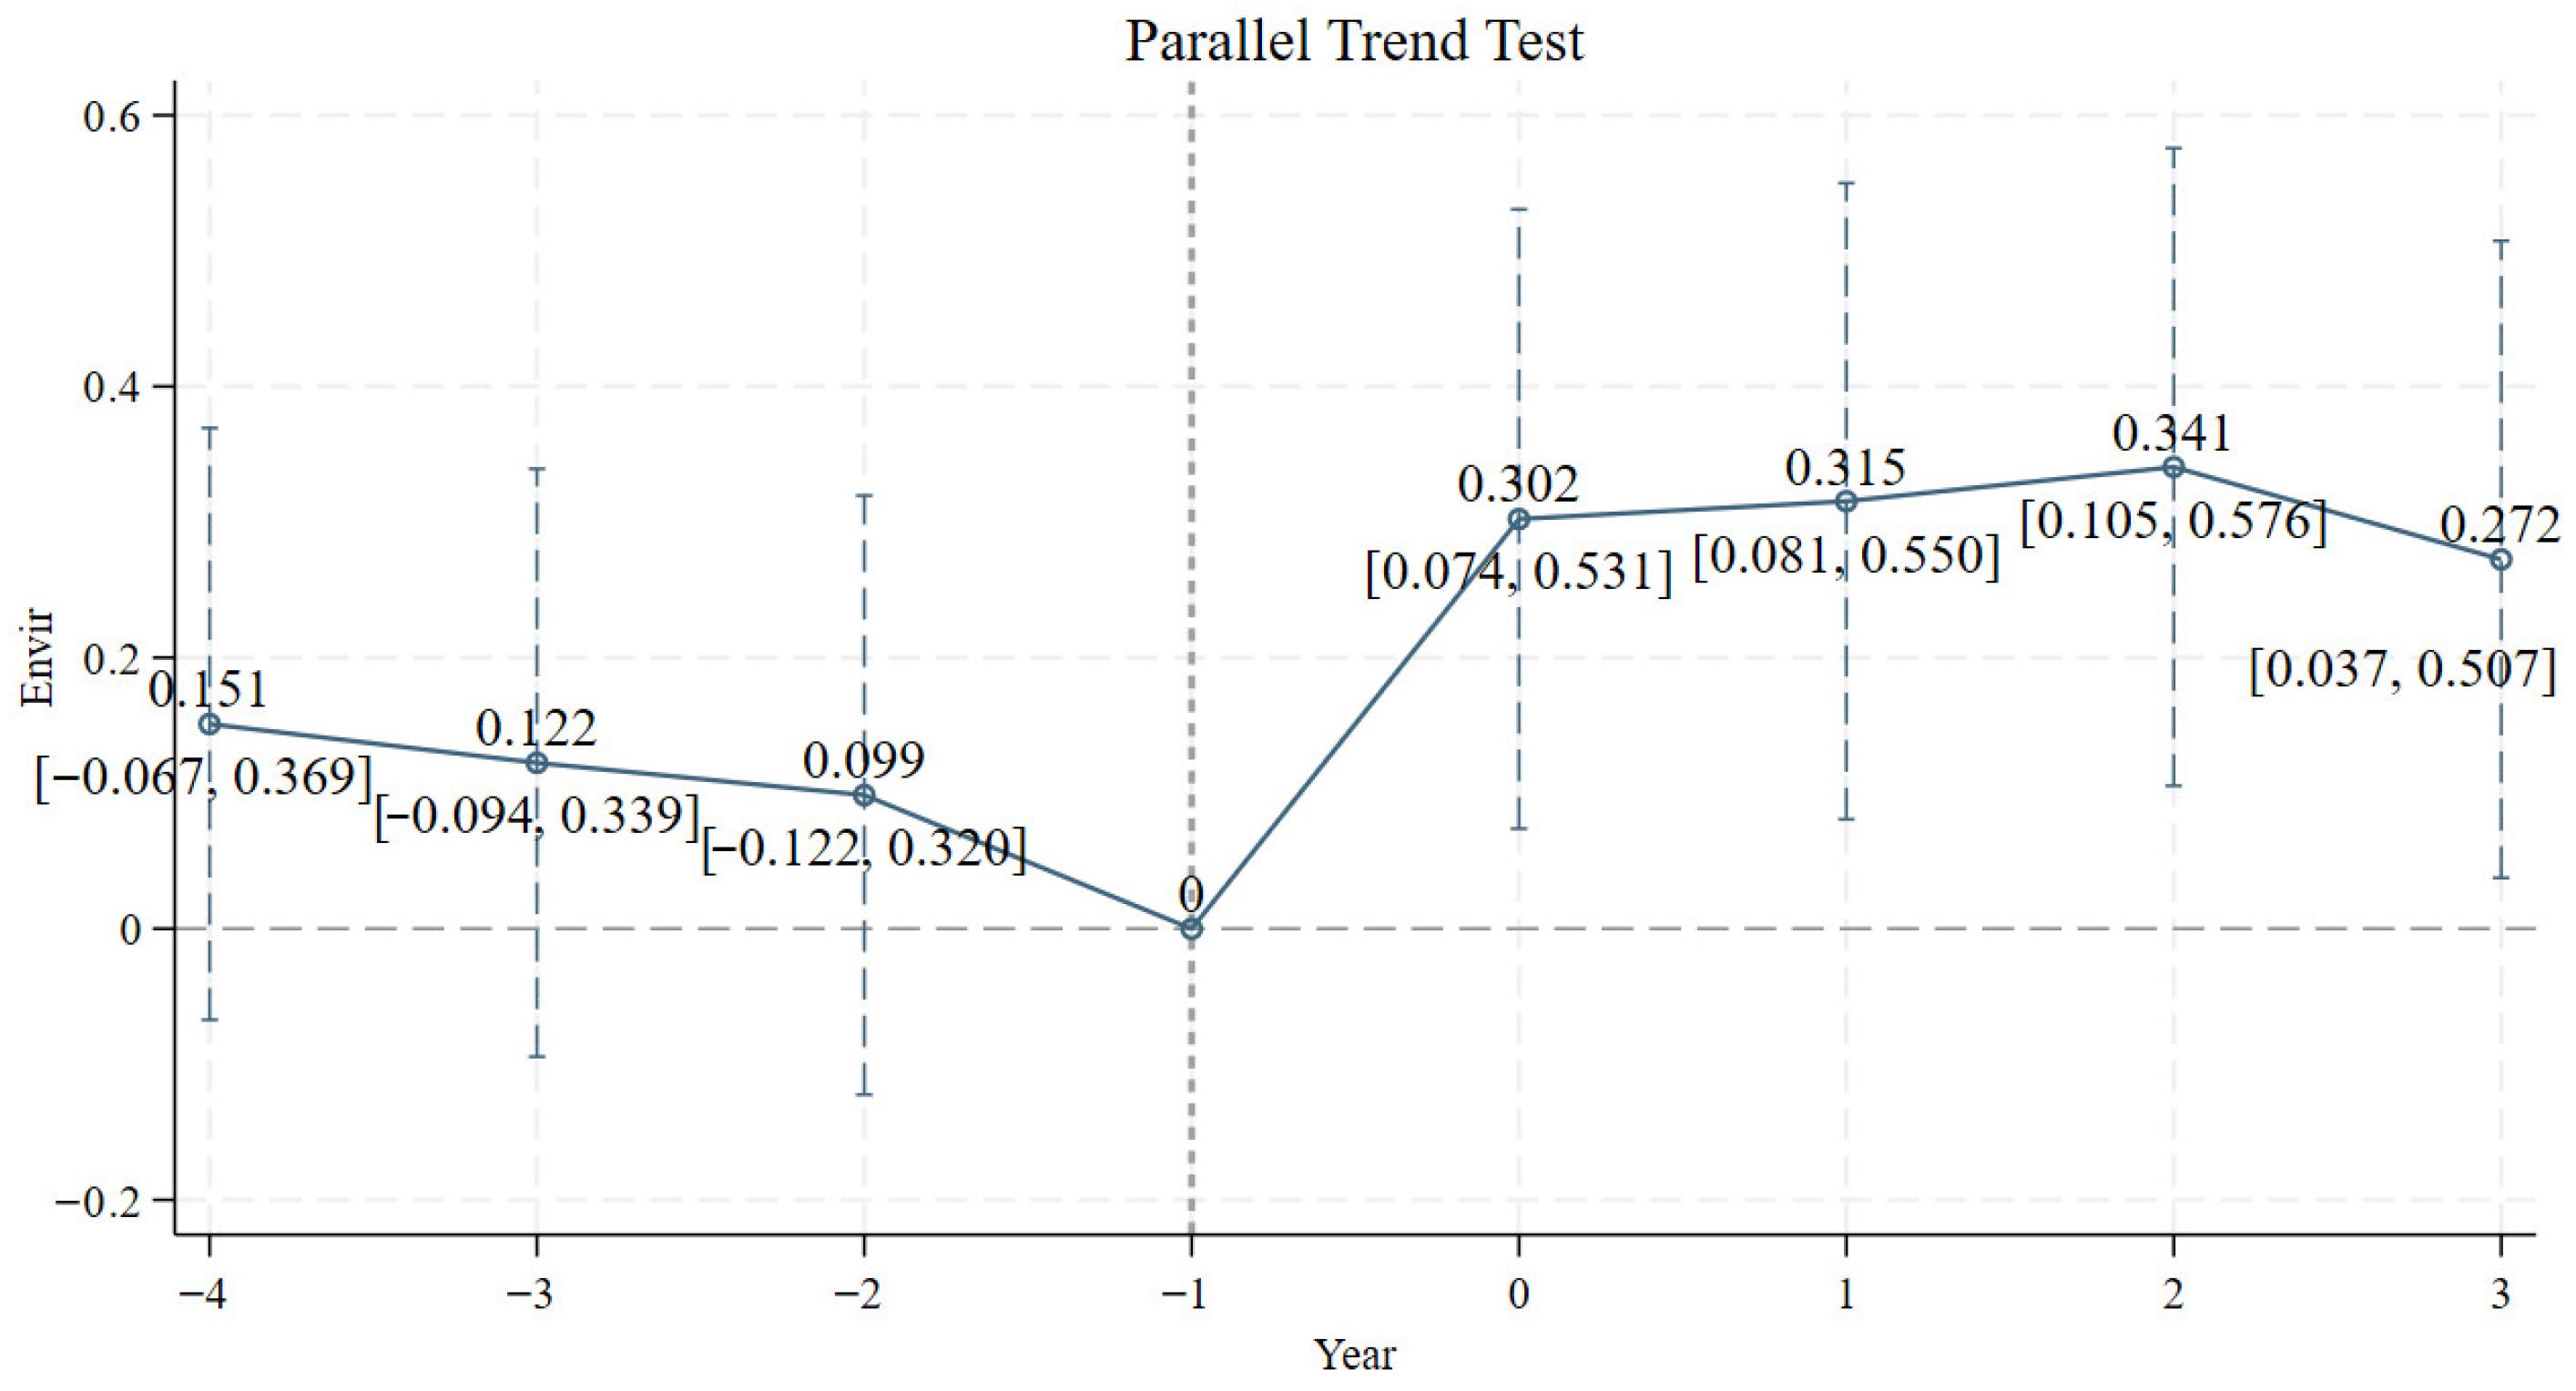
E I D i t = θ 0 + t = 4 , t 1 3 θ t N A I P D i t + κ 2 X i t + μ i + γ t + ε i t
where N A I P D i t is a dummy variable that equals 1 for pilot enterprises and 0 otherwise. In Equation (4), t ranges from 4 to 3, with t < 0 indicating years before the policy and t > 0 indicating years after the policy. We focus on the coefficients θ t , which capture the differences in environmental information disclosure quality between the treatment and control groups in each period relative to the baseline year. As illustrated in Figure 4, before the policy was developed, the coefficient was not significant, demonstrating that before the policy intervention, there were no consistent differences between the treatment and control groups. The coefficients are notably positive during the year the policy is implemented, persisting in subsequent periods, indicating that the NAIDP has a cumulative and sustained positive impact on firms’ environmental information disclosure.

5.4. Robustness Test Results

5.4.1. Lagging One Period of NAIDP

Given the potential time lag in the NAIDP’s impact on firm behavior, following Lan et al. [64], we re-estimate the model using a one-period lag of the policy variables. Column (1) of Table 5 reports the results. The coefficient on the lagged policy variable (NAIDP_lag) remains positive, indicating persistent policy effects and partially alleviating concerns over reverse causality.

5.4.2. Excluding the Samples from the Municipalities

Considering that centrally administered municipalities, namely Beijing, Shanghai, Chongqing, and Tianjin, possess distinct qualities in terms of economic strength, resource endowment, and administrative status, the policy implementation process in centrally administered municipalities may depart markedly from that of most prefecture-level cities [65]. Specifically, the four centrally administered municipalities enjoy provincial-level administrative status and are directly supervised by the central government, which grants them greater fiscal autonomy, superior public service provision, and closer alignment with national policy directives. These factors are plausibly correlated with both a city’s likelihood of being selected as a policy pilot and firms’ environmental information disclosure. Retaining such observations in the estimation sample could therefore confound the results, causing the estimates to be driven by the idiosyncratic characteristics of a few centrally administered municipalities rather than reflecting the genuine causal effect of the NAIDP.
To address this concern, we follow prior studies that exclude centrally administered municipalities in robustness checks and re-estimate the model after dropping manufacturing firm observations located in the four centrally administered municipalities: Beijing, Shanghai, Chongqing, and Tianjin [13,28]. Table 5 column (2) reports the results after removing the samples from these municipalities. The NAIDP coefficient remains significant, reflecting that the benchmark regression results are not driven by the unique features of municipalities and further confirming the reliability.

5.4.3. Excluding the Impact of the Pandemic

Considering the global public health emergencies that occurred after 2020 may have uneven effects on regular output and operations in manufacturing companies, following Gao et al. [2], this paper excludes samples from the period 2020 to 2021. As shown in column (3) of Table 5, the regression coefficient for NAIDP remains notably positive after excluding pandemic-affected years.

5.4.4. Replacing the Measurement for the EID

To eliminate potential bias introduced by the measurement, this paper follows Lv et al. [18] and Nai and Zhu [66] and aggregates scores across dimensions of enterprise environmental information disclosure, including sufficiency, significance, and reliability. Sufficiency encompasses environmental management, environmental liabilities, environmental performance, and governance, reflecting the completeness of information disclosed across core environmental domains. Significance refers to disclosure carriers, capturing whether environmental information is prominently presented through dedicated channels such as annual reports, social responsibility reports, and environmental reports. Reliability pertains to independent certification agencies and external rewards, measuring the extent to which disclosed information is verified or recognized by external parties. We selected score data from the corresponding items in the environmental disclosure database of listed companies. The scores of the sub-items for each project were summed using the content scoring method to derive the overall environmental information disclosure score. The environmental information disclosure scores range from 0 to 37, with higher scores indicating more detailed and standardized environmental information disclosure content. Column (4) shows the results, where the NAIDP coefficient is notably positive. The results indicate that the measurement approach has no discernible effect on the earlier findings, thereby supporting their robustness.

5.4.5. Placebo Test Result

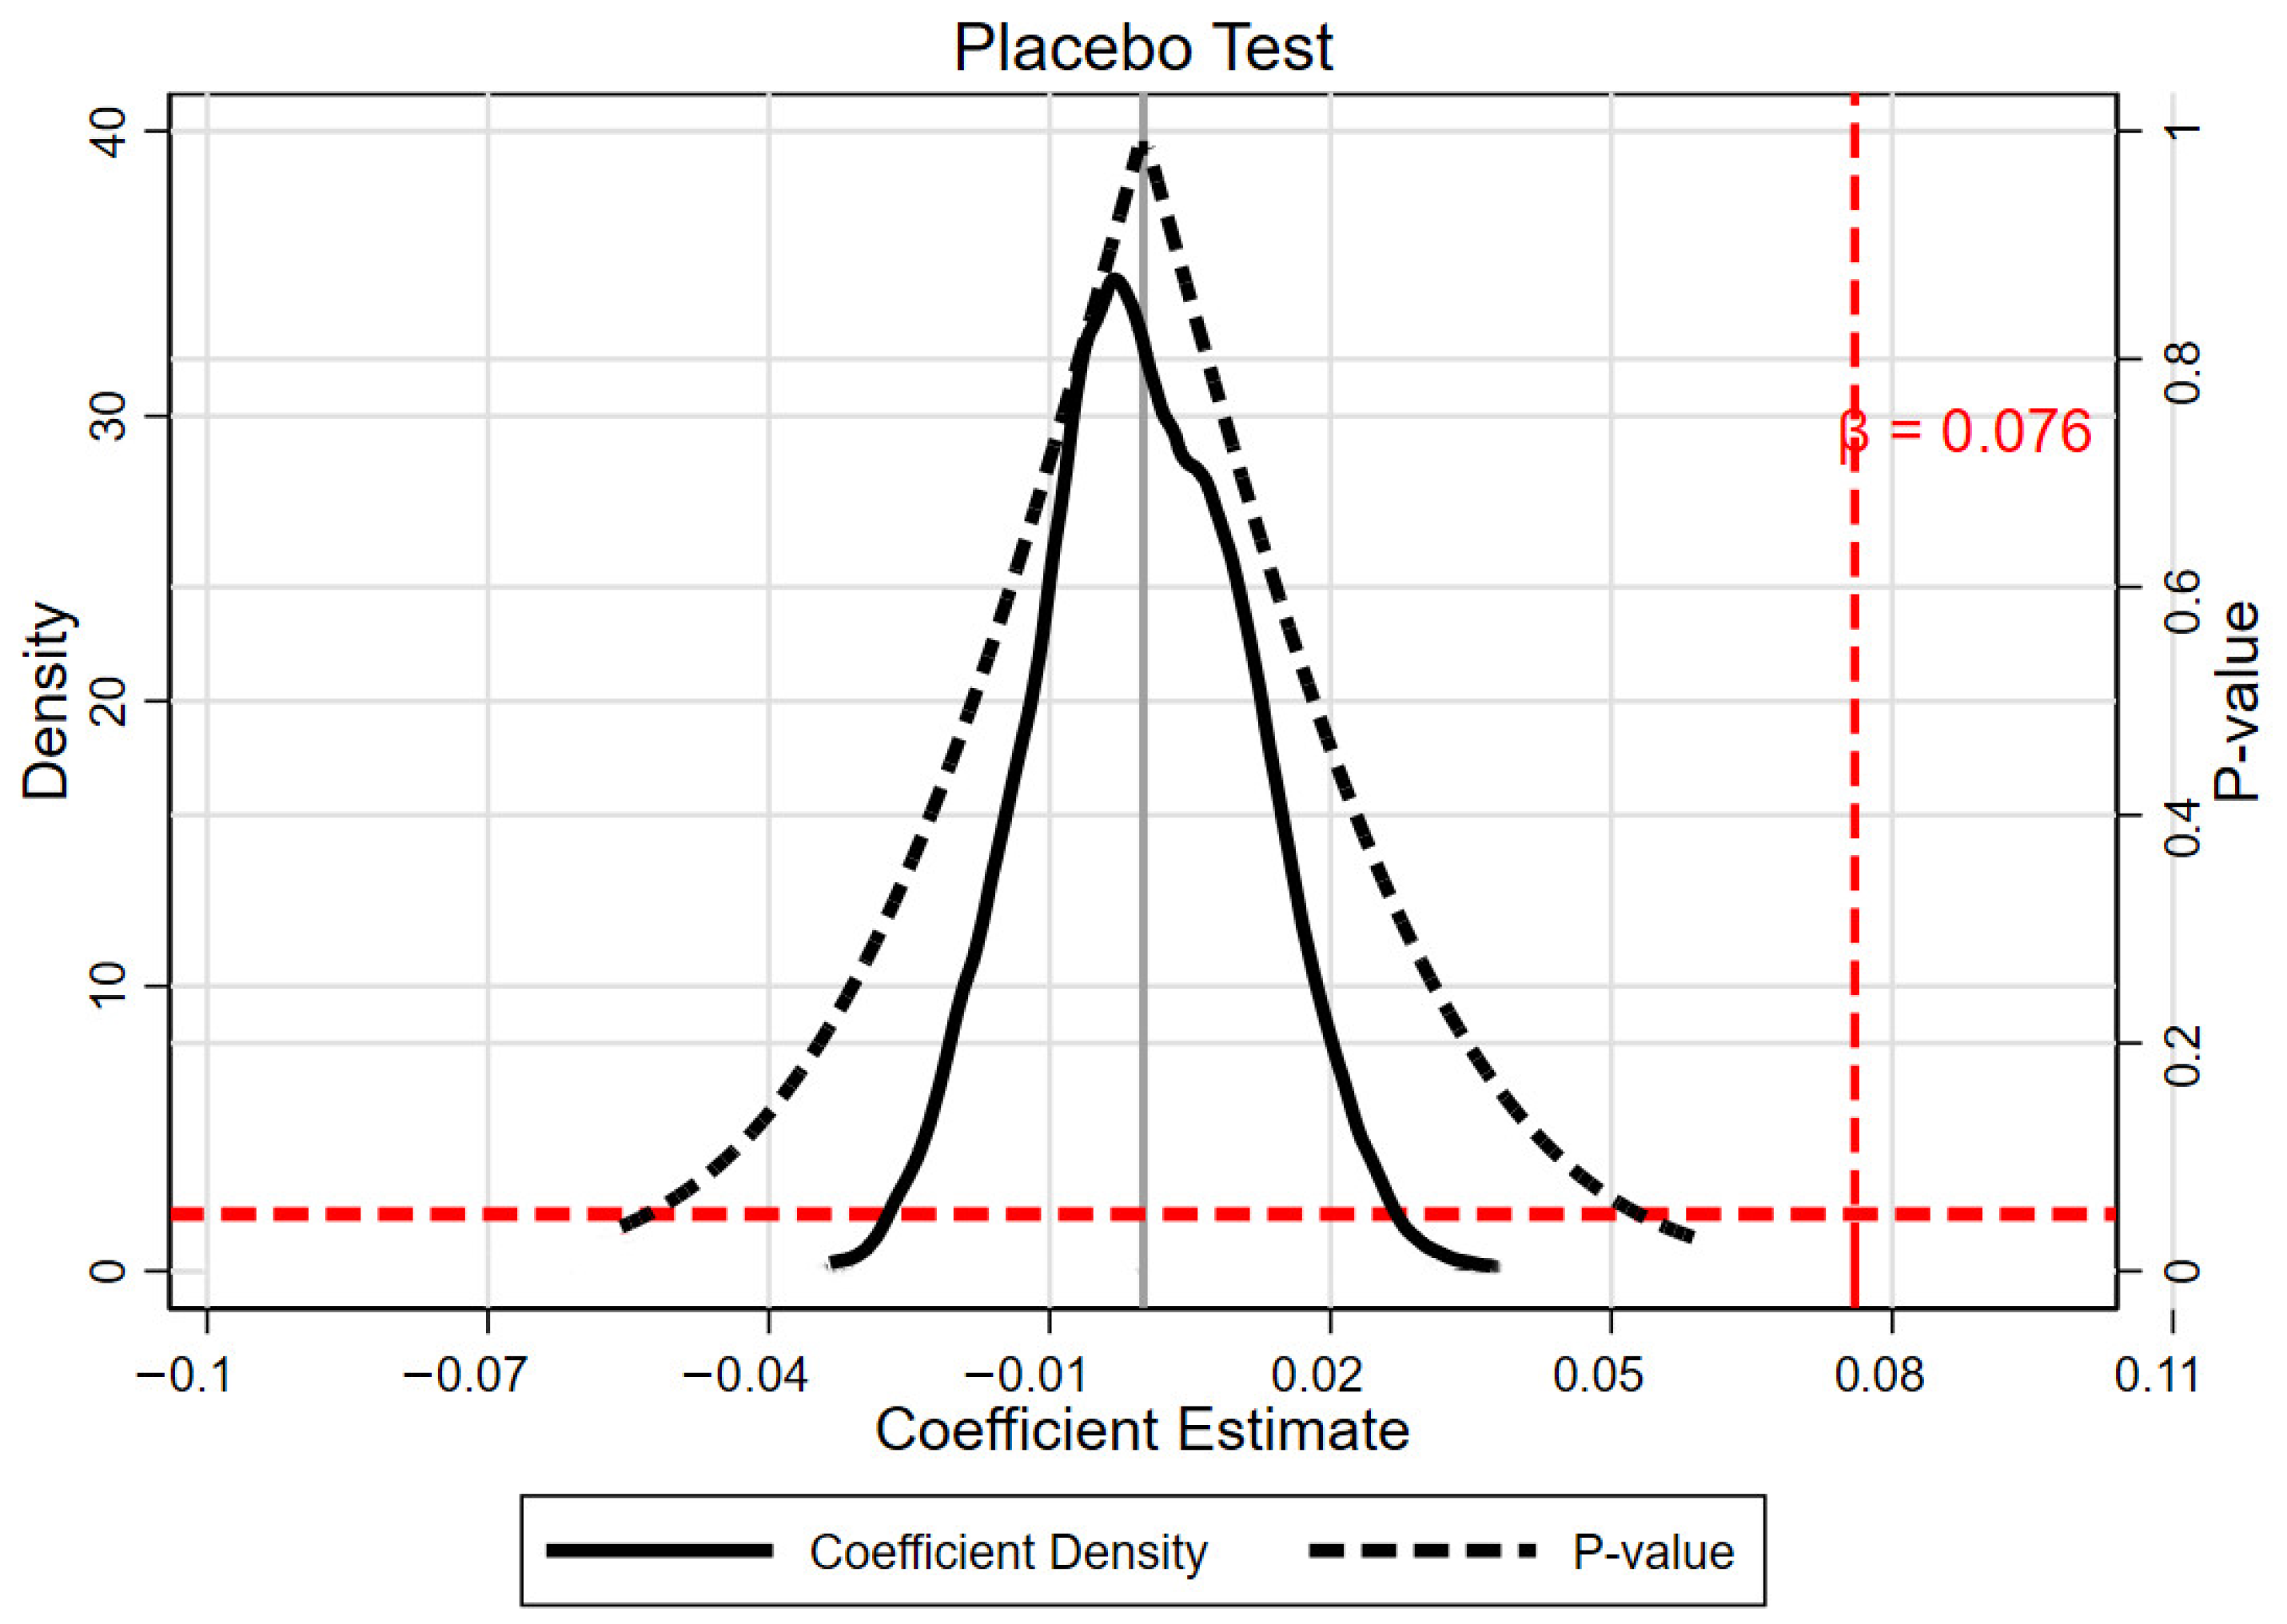
The impact of the NAIDP on environmental information disclosure by manufacturing enterprises may also be influenced by random variables and other variables not included. Thus, a placebo test is used in this paper. Firstly, manufacturing firms are randomly assigned to determine whether they are affected by the implementation of the NAIDP, with the sample size of the treatment group set equal to the actual value. Secondly, add it to the regression benchmark model. To ensure robustness, this paper repeats it 500 times. The results in Figure 5 show that, after randomly specifying whether manufacturing enterprises are affected by the policy, the NAIDP coefficients are all concentrated around 0, and the graph exhibits an inverted U shape symmetric around 0. The regression coefficient values are much smaller than the main empirical study’s estimated values. This further suggests that the NAIDP’s positive impact on environmental information disclosure quality is not coincidental.

5.4.6. Heterogeneous Treatment Effect Test

The NAIDP explored in this study is implemented in phases across different regions. According to Goodman-Bacon [67], when treatment timing varies, the staggered DID estimator may produce unreliable estimates due to heterogeneous treatment effects. To assess such heterogeneous treatment effects, this study employs the Bacon decomposition method. Table 6 reports the decomposition results. The weight assigned to the comparison between treated units and never-treated units reaches 89.6%, whereas the later treatment vs. earlier treatment comparison, which is most likely to generate bias from heterogeneous treatment effects, accounts for only 1.8%. This indicates that the estimator does not suffer from severe bias. To further address the issue of heterogeneous treatment effects, this study employs three methods for robustness checks: the weighted difference-in-differences estimator proposed by Callaway and Sant’Anna (2021) [68] (CSDID), the bunching DID estimator developed by Cengiz et al. (2019) [69], and the imputation DID estimator proposed by Borusyak et al. (2024) [70]. The results, presented in Table 7, remain significantly positive, confirming that the baseline findings are robust even when heterogeneous treatment effects are taken into account.

5.5. Endogeneity Test Result

5.5.1. Instrumental Variable Test

Following Nunn and Qian [71], we construct the instrumental variable (IV) as the interaction of surface undulation with a linear time trend. Surface undulation is measured by the standard deviation of elevation within each prefecture-level city. A higher value indicates more rugged terrain. This IV satisfies the relevance condition for the following reasons. The deployment of artificial intelligence technologies relies heavily on digital infrastructure, including fiber-optic networks, data centers, and industrial internet platforms, the construction costs of which are substantially higher in regions with greater terrain ruggedness. Therefore, regions with greater surface undulation face stronger geographical constraints on the deployment of digital infrastructure, making them more likely to be prioritized for inclusion in the NAIDP pilot zone program. Regarding the exogeneity condition, surface undulation, as a natural geographical feature formed by long-term geological evolution, is highly exogenous to contemporary economic activities. It does not directly affect firms’ environmental information disclosure decisions through any channel other than influencing the implementation of the NAIDP. Thus, the IV satisfies the exclusion restriction. The regression results of the IV test are presented in Table 8. There is a positive correlation between the IV and the NAIDP, as evidenced by the significantly positive IV coefficient in column (1). Furthermore, the NAIDP coefficient remains highly positive from the results in column (2). The IV test findings provide more evidence that the NAIDP policy can significantly enhance environmental information disclosure for manufacturing enterprises.

5.5.2. PSM-DID Test Results

To ensure the robustness of our primary findings, we further employ a PSM-DID approach. Specifically, following Zhou et al. [72], control variables are used as matching covariates. The treatment group’s control groups are chosen using the 1:4 nearest-neighbor matching method. The regression results are displayed in Table 9. The NAIDP coefficient is notably positive according to the findings, and only the explanatory variables are included in the first column. Adding control variables to the second column does not change the significance of the regression coefficient. Firm fixed and year fixed effects are included simultaneously in the third column. This indicates that after excluding potential disparities between the experimental and control groups that existed before through matching, the positive promoting effect of NAIDP on environmental information disclosure remains. The result effectively eliminates potential sample selection bias, further enhancing the conclusions.

6. Further Analysis

6.1. Impact Channel Analysis

6.1.1. Information Asymmetry

As shown in column (1) of Table 10, the coefficient on NAIDP is significantly negative. The result indicates that the NAIDP significantly mitigates information asymmetry in manufacturing firms. Moreover, the Sobel Z statistic for the indirect effect of ASY is 2.468, corresponding to a Bootstrap 95% confidence interval based on 500 replications of [0.0001, 0.0036], which does not contain zero. This further confirms the significant mediating role of information asymmetry in the NAIDP’s impact on manufacturing firms’ environmental information disclosure.
The possible economic explanations are that, firstly, by promoting the in-depth application of intelligent sensing and big data technologies, the NAIDP enhances firms’ capacity to generate and integrate environmental information. This transforms originally fragmented and difficult-to-standardize environmental data into accessible and traceable information resources, thereby narrowing the gap between firms’ true internal environmental information and the information available to external parties from the supply side [13]. Secondly, by promoting the application of digital regulatory tools and information processing technologies, the NAIDP strengthens external stakeholders’ ability to identify and cross-validate disclosed information, thereby reducing the costs of information acquisition and verification [37]. Under the combined effect of these two forces, the external verifiability of firms’ environmental information disclosure is continuously enhanced, the scope for information manipulation and selective disclosure is compressed, and the cost of concealing negative environmental information rises accordingly. The resulting external supervision reinforcement effect compels manufacturing firms to provide more truthful and complete environmental information [45], thereby validating hypothesis H2.

6.1.2. Internal Control

As shown in column (2) of Table 10, the coefficient on NAIDP is significantly positive. The result indicates that the NAIDP significantly improves the internal control of manufacturing firms. Moreover, the Sobel Z statistic for the indirect effect of Inter is 2.361, corresponding to a Bootstrap 95% confidence interval based on 500 replications of [0.0002, 0.0028], which does not contain zero. This further confirms the significant mediating role of internal control in the NAIDP’s impact on manufacturing firms’ environmental information disclosure.
The possible economic explanations are as follows. After the implementation of NAIDP, artificial intelligence technologies are embedded into firms’ internal governance processes, shifting internal control from ex-post verification to ex-ante identification, ongoing supervision, and dynamic correction. On the one hand, NAIDP enhances firms’ ability to identify and assess environmental risks, enabling environmental risks to be systematically incorporated into the internal control framework, thereby elevating the priority of EID in corporate internal governance [39,48]. On the other hand, NAIDP strengthens the capabilities of environmental data processing, process supervision, and cross-departmental coordination, effectively narrowing the scope for management to engage in selective disclosure or information manipulation by exploiting information fragmentation [49,50]. On this basis, the dynamic monitoring mechanism further strengthens the continuous constraint and self-correction functions of internal control, propelling environmental information disclosure from passive compliance toward standardized, sustained, and high-quality disclosure, thereby validating hypothesis H3.

6.2. Moderation Effects Analysis

6.2.1. The Moderation Role of Management Environmental Awareness

Column (1) in Table 11 illustrates that the coefficient of the interaction term Back × NAIDP is significantly positive. This means that in manufacturing enterprises with strong environmental awareness among managers, the promoting effect of the NAIDP on environmental information disclosure has been significantly enhanced. The potential economic reason is that management cognition and values deeply influence their strategic decisions and resource allocation. A management team with strong environmental awareness can better understand the potential value of artificial intelligence technology for environmental governance and green transformation. Therefore, when faced with the technological empowerment opportunities offered by the NAIDP, they are more inclined to actively guide enterprise resources, using digital tools in fields such as environmental monitoring to improve environmental performance [73].

6.2.2. The Moderation Role of Environmental Regulation Intensity

As presented in Column (2) of Table 11, the coefficient for the interaction term Inten × NAIDP is positive. This suggests that NAIDP has a stronger encouraging impact on manufacturing companies’ disclosure of environmental information in areas with more stringent environmental restrictions. The potential economic reason lies in that environmental regulation intensity significantly strengthens the policy effect on information disclosure by raising the expected cost of environmental violations and the benefits of compliance for enterprises. In regions with strict regulations, enterprises face stronger external compliance pressure and supervision, and therefore have greater motivation to disclose environmental information to demonstrate compliance, reduce regulatory risks, and obtain institutional legitimacy. This strategic motivation, strengthened by regulatory pressure, enables NAIDP to be more fully translated into practical actions by enterprises to improve environmental information disclosure, thereby demonstrating a significant positive moderating effect [74]. Taken together, these findings validate Hypothesis 4.

6.3. Heterogeneity Analysis

6.3.1. Enterprise Ownership Heterogeneity

Following Huang et al. [75], this study separates the sample into two groups based on the nature of the enterprise equity: state-owned manufacturing enterprises (SOEs) and non-state-owned manufacturing enterprises (NSOEs). The NAIDP coefficient in NSOEs is noticeably positive according to the results in columns (1) and (2) of Table 12, whereas in the SOEs sample, it is not significant. The potential economic reason lies in the fact that NSOEs usually face a more severe competitive environment and more urgent financing constraints, and have a stronger intrinsic motivation to improve efficiency and build a differentiated advantage. The information transparency improvement and digital empowerment brought by the NAIDP can effectively alleviate their financing difficulties, provide a powerful tool, and help them win green market share through high-level environmental information disclosure [76]. In contrast, SOEs may be less sensitive to shaping disclosure advantages through the pilot policy due to their inherent policy resource advantages and relatively weaker market survival pressure [77].

6.3.2. Enterprise Digitalization Level Heterogeneity

Following Lin et al. [73], using the median degree of enterprise digital transformation as the threshold, we split the full sample into two groups: a higher-digitalization group and a lower-digitalization group for group regression analysis. In Table 12, columns (3) and (4) demonstrate that the NAIDP coefficient is notably beneficial for companies with greater degrees of digitalization but not significant for those with lower levels. This means that for manufacturing enterprises with higher levels of digitalization, the NAIDP can more effectively improve environmental information disclosure. The potential economic reason lies in that enterprises with stronger digital foundations have inherent advantages in data integration, technology absorption, and application transformation. They can more quickly and deeply integrate the technical resources and data elements provided by the NAIDP into their own operational systems. However, enterprises with weak digitalization foundations may be constrained by their own technical capabilities and organizational inertia [78].

6.3.3. Enterprise Pollution Attributes Heterogeneity

Following Meng and Zhang [54], this study separates the sample enterprises into heavy-pollution and non-heavy-pollution industries for group regression analysis. As shown in Table 11, columns (5) and (6) demonstrate that the group of companies with lower pollution levels has a considerably positive coefficient, while among firms with higher pollution levels, the coefficient is not significant. The potential economic reason lies in the fact that heavy-pollution enterprises have long been under high-intensity environmental regulations, and their information disclosure has formed a rigid model oriented towards compliance. The space for marginal improvement is limited, and sunk costs and path dependence constrain technological transformation and the transition to an energy structure [53]. On the contrary, low-pollution firms are more likely to view the lead zone policy as a strategic opportunity to shape a differentiated green image and acquire a competitive edge in the market by actively disclosing environmental information.

7. Discussion and Implications

7.1. Discussion

This paper contributes to the literature on the NAIDP and environmental information disclosure in the following ways.
(1) This paper enriches the research on the influencing factors of environmental information disclosure from the perspective of the NAIDP. Existing studies on environmental information disclosure have mainly proceeded along two paths, namely, external environmental regulation and internal governance structure [8,10]. Although these studies have yielded fruitful findings, few have systematically examined the impact of regional industrial policy centered on artificial intelligence on firms’ environmental practices. The results show that the NAIDP significantly promotes environmental information disclosure in manufacturing firms, providing direct empirical evidence for understanding how the NAIDP drives corporate environmental governance transformation. This finding is consistent with signaling theory: by promoting the in-depth application of digital technologies in manufacturing firms, the NAIDP reduces the marginal cost of generating and disclosing environmental information, while strengthening the institutional environment and market expectations, thereby transforming EID from passive compliance into a strategic signal through which firms demonstrate their green governance capability and digital transformation progress [34]. This confirms the theoretical expectation that the NAIDP can effectively shape firms’ environmental behavior.
(2) Our findings further indicate that the promoting effect of the NAIDP is not unconditional but depends on specific contextual factors. The moderation analysis shows that the NAIDP’s effect on environmental information disclosure is significantly strengthened by both managerial environmental awareness and regional environmental regulation intensity. This result suggests that the effect of the NAIDP is linked to firms’ internal governance willingness and external institutional pressure. When management possesses stronger environmental awareness or when firms face stricter environmental regulation, the disclosure-promoting effect of the NAIDP becomes more pronounced.
(3) Based on information asymmetry theory and principal–agent theory, this paper reveals two mechanisms through which the NAIDP affects manufacturing firms’ environmental information disclosure, thereby extending the application boundaries of these theories. Although the existing literature contains scattered discussions on how NAIDP transmits to firm performance in the environmental domain [15,16], it lacks an integrated analysis of governance process reconfiguration. By identifying the two transmission paths of alleviating information asymmetry and strengthening internal control, this paper deepens the understanding of how NAIDP reshapes corporate environmental information governance.
(4) This paper reveals pronounced heterogeneity in the policy effect, providing nuanced insights for the targeted implementation of policy instruments. This heterogeneity pattern suggests that the effectiveness of the NAIDP is highly contingent on micro-level characteristics such as ownership structure, technological absorptive capacity, and initial environmental performance, and that a simplistic one-size-fits-all policy rollout may fail to achieve optimal outcomes. This underscores that the implementation of the NAIDP must be fully adapted to local enterprise structures and industrial characteristics, with supporting measures tailored to local conditions, to maximize its policy effectiveness.

7.2. Policy Implications

The above findings provide some policy implications: Firstly, for policymakers, more differentiated and targeted policy guidance should be implemented. For start-ups, the priority is to lower the initial barriers to environmental information disclosure. At this stage, state-owned enterprises should be required to incorporate disclosure into performance evaluations, thereby setting a benchmark for others. For firms with weak digital infrastructure, shared AI monitoring tools and basic digital transformation subsidies should be offered to ease technology adoption. For heavy-polluting firms, even at the start-up stage, a clear progressive disclosure pathway should be established to prevent compliance inertia. For growth-stage firms, policy design should shift from direct support to incentive creation, raising the signaling benefits of disclosure. For state-owned enterprises, the linkage between information disclosure and access to green credit and bonds should be strengthened. For firms with weak digital infrastructure, technology transfer programs and capacity-building initiatives should be provided to improve their absorption of policy benefits. For heavy-polluting firms, incentive-compatible constraints should be introduced, directly tying emission monitoring results to credit eligibility and subsidy access. For mature or transitioning firms, policy should aim to alleviate path dependence and high sunk costs. For state-owned enterprises, mandatory disclosure requirements and green transition assessments should be tightened. For firms with weak digital infrastructure, support should be directed toward upgrading their capacity to generate and integrate environmental data digitally. For heavy-polluting firms, given their high sunk costs and strong path dependence, a combination of phased mandates and transitional support is recommended. On the one hand, phased mandatory disclosure standards should be introduced, with reasonable transition periods and progressive targets calibrated to firms’ carbon lock-in levels and technological upgrading progress. This approach would help reduce one-time compliance costs and prevent strategic avoidance under excessive regulatory pressure. On the other hand, transitional support should be provided by linking real-time emission data from the pilot zone’s intelligent monitoring network directly to environmental credit ratings. Making continuous improvement in emission transparency a key criterion for accessing credit and subsidies would foster a virtuous cycle of precision monitoring, credit incentives, and proactive disclosure, thereby encouraging heavy-polluting firms to move from passive compliance toward active transparency.
Secondly, enterprises should strategically leverage policy opportunities aligned with their capabilities to enhance environmental information disclosure. Non-state-owned manufacturing firms should fully leverage the improved transparency of information and the greater financing convenience enabled by the pilot zone policies, and proactively and systematically disclose environmental information. This should be regarded as a key tool for obtaining low-cost green financing and shaping a responsible market image. Enterprises with a relatively strong digital foundation should prioritize the extensive application of artificial intelligence technologies in environmental data collection, carbon accounting, and pollution traceability. These firms can then translate their technological advantages into more substantive and accurate environmental disclosures. By taking these actions, they are better able to create a distinct competitive edge in green markets. All enterprises, especially those with stronger environmental awareness among their management teams, should recognize that senior executives’ environmental backgrounds and values are important catalysts for amplifying the policy impact.
Thirdly, for both regulatory authorities and market participants, it is essential to leverage artificial intelligence technologies to optimize the mechanisms for identifying, assessing, and providing feedback on corporate environmental information disclosure. Regulators can utilize the data resources and technological capabilities accumulated within the pilot zones to develop intelligent evaluation models that assess environmental information disclosure quality. Rather than focusing solely on disclosure quantity, these models should prioritize substantive content, data consistency, and alignment with AI-based monitoring outcomes, thereby facilitating a shift from compliance review to substantive supervision. Furthermore, dynamic feedback mechanisms enabled by AI can support real-time disclosure verification and risk alert systems, enhancing regulatory responsiveness and deterrence. For investors and analytical institutions, the richer and more reliable environmental data streams generated by firms within pilot zones offer a foundation for developing more precise ESG rating and risk assessment tools. These tools can direct capital toward enterprises that genuinely employ AI to improve environmental performance and disclosure quality. Ultimately, such alignment establishes a positive market incentive loop. Within this framework, high-quality disclosure attracts capital allocation, driving continuous improvement and strengthening the overall effectiveness of environmental governance.

8. Conclusions and Limitations

This paper examines the impact of NAIDP on environmental information disclosure among manufacturing firms by employing a staggered DID model. The research reveals the following findings: Firstly, the implementation of NAIDP significantly improves environmental disclosure, with more pronounced effects observed among NSOEs companies, companies with more robust digital foundations, and companies with lower pollution levels. Secondly, mechanism tests reveal that the NAIDP promotes manufacturing firms’ environmental information disclosure by alleviating information asymmetry and strengthening internal control. Thirdly, the moderation analysis reveals that management environmental awareness and environmental regulation intensity positively amplify the effect of NAIDP on EID in manufacturing enterprises.
This paper still has some limitations. Firstly, although we have performed multiple robustness tests and mitigated endogeneity concerns through various approaches, potential reverse causality and omitted variable bias cannot be entirely ruled out. The selection of NAIDP pilot cities was not strictly random and may be systematically correlated with factors such as the level of urban digital infrastructure and the stage of economic development. Future study could further apply approaches such as the synthetic control method to perform additional robustness tests.
Second, the sample of this study consists only of Chinese A-share listed manufacturing firms. Compared with non-listed firms and small and medium-sized manufacturing enterprises, listed firms are generally larger in scale, have more refined governance structures, and possess better digital infrastructure, making them potentially more responsive to AI policies. Therefore, the findings of this study should be extended to small and medium-sized manufacturing enterprises and non-listed firms with caution. Future research could draw on industrial enterprise databases or survey data of SMEs to further verify the environmental governance effects of the NAIDP across a broader range of firms.
Third, this study only takes information asymmetry and internal control as mechanism variables. However, the impact of the NAIDP on environmental information disclosure may also involve other potential channels, such as green technology innovation, the alleviation of financing constraints, or supply chain synergy effects, which await further exploration and testing in subsequent research.

Author Contributions

Conceptualization, Q.W.; methodology, Q.W.; software, Y.Z. (Yinwei Zhang). and Q.W.; validation, Y.Z. (Yinwei Zhang), D.G. and Q.W.; resources, Y.Z. (Yifan Zhao).; data curation, D.G. and Y.Z. (Yifan Zhao); writing—original draft preparation, Y.Z. (Yinwei Zhang) and Q.W.; writing—review and editing, Y.Z. (Yinwei Zhang) and Q.W. All authors have read and agreed to the published version of the manuscript.

Funding

This research was supported by the Scientific Research Fund of Zhejiang Provincial Education Department (Grant No. Y202455934), the Jinhua City Science and Technology Plan Proactively Designed Project (Grant No. 2025-1-002Z), and the Graduate Innovative Fund of Wuhan Institute of Technology (CX2025450).

Data Availability Statement

The original data source is from the website https://data.csmar.com/. The data and code provided in this study are available upon request from the corresponding author. The data are not publicly archived due to privacy considerations regarding participant location and travel behavior.

Conflicts of Interest

The authors declare no conflicts of interest.

References

  1. Huang, R.; Chen, D. Does Environmental Information Disclosure Benefit Waste Discharge Reduction? Evidence from China. J. Bus. Ethics 2015, 129, 535–552. [Google Scholar] [CrossRef] [Scilit]
  2. Gao, D.; Zhang, T.; Liu, X. The Urban Renewable Energy Transition: Impact Assessment and Transmission Mechanisms of Climate Policy Uncertainty. Energies 2025, 18, 2089. [Google Scholar] [CrossRef] [Scilit]
  3. García-Sánchez, I.-M.; Raimo, N.; Vitolla, F. Are Environmentally Innovative Companies Inclined towards Integrated Environmental Disclosure Policies? Adm. Sci. 2021, 11, 29. [Google Scholar] [CrossRef] [Scilit]
  4. Wang, C.; Lin, A.; Si, X.; Li, Q.; Liu, C. Establishment of Environmental Pollution Accounting and Compensation Standards for Manufacturing Enterprises. Energy 2025, 344, 139814. [Google Scholar] [CrossRef] [Scilit]
  5. Xia, D.; Wang, X.-Q. The Synergetic Impact of Environmental and Innovation Information Disclosure on Corporate Financial Performance: An Empirical Study Based on China Coal Listed Companies. Technovation 2021, 100, 102179. [Google Scholar] [CrossRef] [Scilit]
  6. Feng, Y.; Zhao, Y.; Zheng, H.; Li, Z.; Tan, J. Data-Driven Product Design toward Intelligent Manufacturing: A Review. Int. J. Adv. Robot. Syst. 2020, 17, 1729881420911257. [Google Scholar] [CrossRef] [Scilit]
  7. Zhang, Y.; Zhang, X. Top Management Team Functional Diversity and ESG Performance. Financ. Res. Lett. 2024, 63, 105362. [Google Scholar] [CrossRef] [Scilit]
  8. Alam, M.S.; Safiullah, M.; Islam, M.S. Cash-Rich Firms and Carbon Emissions. Int. Rev. Financ. Anal. 2022, 81, 102106. [Google Scholar] [CrossRef] [Scilit]
  9. Lu, J. Can the Green Merger and Acquisition Strategy Improve the Environmental Protection Investment of Listed Company? Environ. Impact Assess. Rev. 2021, 86, 106470. [Google Scholar] [CrossRef] [Scilit]
  10. Hu, B.; Xu, Q. Environmental Regulation Penalties and Corporate Environmental Information Disclosure. Int. Rev. Econ. Financ. 2025, 102, 104344. [Google Scholar] [CrossRef] [Scilit]
  11. Li, Z.; Liu, B.; Wei, Y. Impact of Official Assessment and Political Connections on Corporate Environmental Information Disclosure: Evidence from State-Owned Enterprises in China’s Heavy-Polluting Industries. Environ. Dev. Sustain. 2024, 26, 14351–14368. [Google Scholar] [CrossRef] [Scilit]
  12. Kim, H.-D.; Kim, T.; Kim, Y.; Park, K. Do Long-Term Institutional Investors Promote Corporate Social Responsibility Activities? J. Bank. Financ. 2019, 101, 256–269. [Google Scholar] [CrossRef] [Scilit]
  13. Zhao, K.; Wang, W.; Chen, X. Pilot Zones for Innovative Application of Artificial Intelligence and Enterprise Innovation. Sustainability 2026, 18, 3833. [Google Scholar] [CrossRef] [Scilit]
  14. Wang, C.; Wang, D.; Deng, X.; Wang, S. Research on the impact of enterprise digital transformation on internal control. Sustainability 2023, 15, 8392. [Google Scholar] [CrossRef] [Scilit]
  15. Zhao, X.; Tong, Y.; Lee, H.; Shahzad, U. The Role of Artificial Intelligence in Enhancing Corporate Environmental Information Disclosure: Implications for Energy Transition and Sustainable Development. Energy Econ. 2025, 148, 108680. [Google Scholar] [CrossRef] [Scilit]
  16. Cui, X.; Xu, B.; Razzaq, A. Can application of artificial intelligence in enterprises promote the corporate governance? Front. Environ. Sci. 2022, 10, 944467. [Google Scholar]
  17. Atif, M.; Hossain, M.; Alam, M.S.; Goergen, M. Does Board Gender Diversity Affect Renewable Energy Consumption? J. Corp. Financ. 2021, 66, 101665. [Google Scholar] [CrossRef] [Scilit]
  18. Lv, Y.; Wang, F.; Liu, G.; Ren, R. The impact of environmental court construction on the quality of corporate environmental information disclosure. Int. Rev. Financ. Anal. 2024, 95, 103512. [Google Scholar] [CrossRef] [Scilit]
  19. Gao, D.; Zhou, X.; Wan, J. Unlocking Sustainability Potential: The Impact of Green Finance Reform on Corporate ESG Performance. Corp. Soc. Responsib. Environ. Manag. 2024, 31, 4211–4226. [Google Scholar] [CrossRef] [Scilit]
  20. Li, G.; Wu, M.; Sun, R. Will China’s Audit of Natural Environmental Resource Promote Green Sustainable Development? Evidence from PSM-DID Analysis Based on Substantial and Strategic Pollution Reduction. PLoS ONE 2022, 17, e0278985. [Google Scholar] [CrossRef] [Scilit]
  21. Ma, J.; Shang, Y.; Liang, Z. Digital Transformation, Artificial Intelligence and Enterprise Innovation Performance. Financ. Res. Lett. 2025, 78, 107190. [Google Scholar] [CrossRef] [Scilit]
  22. Shang, Y.; Zhou, S.; Zhuang, D.; Żywiołek, J.; Dincer, H. The Impact of Artificial Intelligence Application on Enterprise Environmental Performance: Evidence from Microenterprises. Gondwana Res. 2024, 131, 181–195. [Google Scholar] [CrossRef] [Scilit]
  23. Alajmi, A.E. AI as a Tool to Enhance Corporate Governance Compliance in the Public Sector in Kuwait. Corp. Gov. Int. J. Bus. Soc. 2026. Epub ahead of printing. [Google Scholar] [CrossRef] [Scilit]
  24. Xie, H.; Luo, J.; Tan, X. Artificial Intelligence Technology Application and Corporate ESG Performance—Evidence from National Pilot Zones for Artificial Intelligence Innovation and Application. Front. Artif. Intell. 2025, 8, 1643684. [Google Scholar] [CrossRef] [Scilit]
  25. Yang, T.; Lai, S. Redefine Manufacturing Operations for Modern Production Environments with the Help of Artificial Intelligence Enterprise Information Systems. Int. J. Adv. Manuf. Technol. 2024, 1–12. [Google Scholar] [CrossRef] [Scilit]
  26. Wang, Z.; Zhang, T.; Ren, X.; Shi, Y. AI Adoption Rate and Corporate Green Innovation Efficiency: Evidence from Chinese Energy Companies. Energy Econ. 2024, 132, 107499. [Google Scholar] [CrossRef] [Scilit]
  27. Han, S.; Sun, X.; Zhong, S. Applications of Artificial Intelligence and Urban Innovation Performance: A Quasi-Natural Experiment Based on the Pilot Zones for the Innovative Application of Artificial Intelligence. PLoS ONE 2025, 20, e0329729. [Google Scholar] [CrossRef] [Scilit]
  28. Wang, L.; Zhao, Z.; Xu, X.; Wang, X.; Wang, Y. How Does the Construction of New Generation of National AI Innovative Development Pilot Zones Affect Carbon Emissions Intensity? Empirical Evidence from China. Sustainability 2025, 17, 6858. [Google Scholar] [CrossRef] [Scilit]
  29. Tu, Z.; Chen, Y.; Liao, Y. Artificial Intelligence Industrial Policy and Enterprise Digital Transformation. Financ. Res. Lett. 2025, 91, 109384. [Google Scholar] [CrossRef] [Scilit]
  30. Huang, Y.; Liu, S.; Gan, J.; Liu, B.; Wu, Y. How does the construction of new generation of national AI innovative development pilot zones drive enterprise ESG development? Empirical evidence from China. Energy Econ. 2024, 140, 108011. [Google Scholar] [CrossRef] [Scilit]
  31. Chen, S.; Dong, S.; Huang, Y. Government digital governance and urban green economic efficiency in China. J. Environ. Manag. 2025, 392, 126686. [Google Scholar] [CrossRef] [Scilit]
  32. He, H.; Zhu, S.; Li, Y. Environmental governance in the digital era: Evidence from Chinese listed firms on pollution mitigation. J. Environ. Manag. 2025, 394, 127329. [Google Scholar] [CrossRef] [Scilit] [PubMed]
  33. Yin, L.; Tan, L.; Wu, J.; Gao, D. From Risk to Sustainable Opportunity: Does Climate Risk Perception Lead Firm ESG Performance? J. Int. Financ. Manag. Account. 2025, 36, 581–597. [Google Scholar] [CrossRef] [Scilit]
  34. Friske, W.; Hoelscher, S.A.; Nikolov, A.N. The impact of voluntary sustainability reporting on firm value: Insights from signaling theory. J. Acad. Mark. Sci. 2023, 51, 372–392. [Google Scholar] [CrossRef] [Scilit]
  35. Ma, S.; Ding, W.; Liu, Y.; Zhang, Y.; Ren, S.; Kong, X.; Leng, J. Industry 4.0 and cleaner production: A comprehensive review of sustainable and intelligent manufacturing for energy-intensive manufacturing industries. J. Clean. Prod. 2024, 467, 142879. [Google Scholar] [CrossRef] [Scilit]
  36. Wang, L.; Shang, Y.; Li, S.; Li, C. Environmental information disclosure-environmental costs nexus: Evidence from heavy pollution industry in China. Sustainability 2023, 15, 2701. [Google Scholar] [CrossRef] [Scilit]
  37. Zhou, X.; Li, G.; Wang, Q.; Li, Y.; Zhou, D. Artificial intelligence, corporate information governance and ESG performance: Quasi-experimental evidence from China. Int. Rev. Financ. Anal. 2025, 102, 104087. [Google Scholar] [CrossRef] [Scilit]
  38. Liu, M.; Zhang, W.; Liang, H. Value Effect of AI Innovation Zones: Green Premium and Cost Reduction Pathways in Environmental Disclosure. Res. Int. Bus. Financ. 2026, 84, 103317. [Google Scholar] [CrossRef] [Scilit]
  39. Alshareef, M.N. Artificial intelligence-enhanced environmental, social, and governance disclosure quality and financial performance nexus in Saudi listed companies under vision 2030. Sustainability 2025, 17, 7421. [Google Scholar] [CrossRef] [Scilit]
  40. Liu, C.; Dong, S.; Gao, X. Does policy-oriented environmental disclosure increase market uncertainty? Evidence from stock price volatility in China. Res. Int. Bus. Financ. 2025, 81, 103152. [Google Scholar] [CrossRef] [Scilit]
  41. Bolognesi, E.; Burchi, A.; Goodell, J.W.; Paltrinieri, A. Stakeholders and regulatory pressure on ESG disclosure. Int. Rev. Financ. Anal. 2025, 103, 104145. [Google Scholar] [CrossRef] [Scilit]
  42. Akerlof, G.A. The market for “lemons”: Quality uncertainty and the market mechanism. In Uncertainty in Economics; Academic Press: Cambridge, MA, USA, 1978; pp. 235–251. [Google Scholar] [CrossRef] [Scilit]
  43. Hilton, J. Greenhush and greenwash: A signalling game analysis of strategic environmental disclosure. Environ. Dev. Econ. 2025, 1–22. [Google Scholar] [CrossRef] [Scilit]
  44. Jiang, Y. Comply or explain: Do firms opportunistically claim trade secrets in mandatory environmental disclosure programs? J. Account. Res. 2024, 62, 1755–1794. [Google Scholar] [CrossRef] [Scilit]
  45. Bi, R.; Kou, Z.; Zhao, C.; Zhong, Y.; Zhou, M. Information disclosure and pollution reduction: Evidence from environmental NGO monitoring in China. Econ. Anal. Policy 2024, 82, 1459–1473. [Google Scholar] [CrossRef] [Scilit]
  46. Jensen, M.C.; Meckling, W.H. Theory of the firm: Managerial behavior, agency costs and ownership structure. In Corporate Governance; Gower: Farnham, UK, 2019; pp. 77–132. [Google Scholar]
  47. Feng, M.; Li, C.; McVay, S.E.; Skaife, H. Does ineffective internal control over financial reporting affect a firm’s operations? Evidence from firms’ inventory management. Account. Rev. 2015, 90, 529–557. [Google Scholar] [CrossRef] [Scilit]
  48. Lee, C.C.; Qi, T.Y.; Lee, C.C. Reaping digital dividends: The impact of supply chain finance on corporate technological innovation in China. Emerg. Mark. Financ. Trade 2025, 61, 256–272. [Google Scholar] [CrossRef] [Scilit]
  49. Wu, L.; Ge, L. Is AI the new corporate monitor? Evidence from excessive on-the-job consumption. Econ. Lett. 2025, 254, 112424. [Google Scholar] [CrossRef] [Scilit]
  50. Chen, L.; Yang, K.; Yu, F. Intelligent governance? Evidence from the adoption of AI in Chinese A-share firms. Financ. Res. Lett. 2025, 86, 108652. [Google Scholar] [CrossRef] [Scilit]
  51. Gao, D.; Zhou, X.; Liu, X. The bright side of uncertainty: The impact of climate policy uncertainty on urban green total factor energy efficiency. Energies 2024, 17, 2899. [Google Scholar] [CrossRef] [Scilit]
  52. Tan, Y.; Zhu, Z. The Effect of ESG Rating Events on Corporate Green Innovation in China: The Mediating Role of Financial Constraints and Managers’ Environmental Awareness. Technol. Soc. 2022, 68, 101906. [Google Scholar] [CrossRef] [Scilit]
  53. Zhang, W.; Ke, J.; Sun, C. Green Innovation of Heavily Polluting Enterprises under Environmental Liability Insurance: Evidence from Chinese Listed Companies. Technol. Forecast. Soc. Change 2024, 206, 123532. [Google Scholar] [CrossRef] [Scilit]
  54. Meng, J.; Zhang, Z. Corporate Environmental Information Disclosure and Investor Response: Evidence from China’s Capital Market. Energy Econ. 2022, 108, 105886. [Google Scholar] [CrossRef] [Scilit]
  55. Yang, Q.; Gao, D.; Song, D.; Li, Y. Environmental Regulation, Pollution Reduction and Green Innovation: The Case of the Chinese Water Ecological Civilization City Pilot Policy. Econ. Syst. 2021, 45, 100911. [Google Scholar] [CrossRef] [Scilit]
  56. Gao, D.; Li, Y.; Tan, L. Can Environmental Regulation Break the Political Resource Curse: Evidence from Heavy Polluting Private Listed Companies in China. J. Environ. Plan. Manag. 2024, 67, 3190–3216. [Google Scholar] [CrossRef] [Scilit]
  57. ISO 14001; Environmental Management Systems—Requirements with Guidance for Use. International Organization for Standardization (ISO): Geneva, Switzerland, 2015.
  58. ISO 9001; Quality Management Systems—Requirements. International Organization for Standardization (ISO): Geneva, Switzerland, 2015.
  59. Guan, T.; Zheng, R.; Chen, A. Artificial intelligence and corporate energy consumption: The policy effects of the new-generation artificial intelligence innovation and development pilot zones. Econ. Anal. Policy 2025, 89, 148–164. [Google Scholar] [CrossRef] [Scilit]
  60. Zhao, S.; Zhang, L.; An, H.; Peng, L.; Zhou, H.; Hu, F. Has China’s Low-Carbon Strategy Pushed Forward the Digital Transformation of Manufacturing Enterprises? Evidence from the Low-Carbon City Pilot Policy. Environ. Impact Assess. Rev. 2023, 102, 107184. [Google Scholar] [CrossRef] [Scilit]
  61. Xu, Y.; Ji, J.; Qiao, Y.; Huang, J. How and When Does Digital Transformation Promote Technological Innovation Performance? A Study of Chinese High-Tech Firms. Technovation 2025, 146, 103294. [Google Scholar] [CrossRef] [Scilit]
  62. Cheng, Z. Internal Control Level and Enterprise Strategic Aggressiveness. Financ. Res. Lett. 2025, 75, 106829. [Google Scholar] [CrossRef] [Scilit]
  63. Wang, S.; Zhou, Z.; Tian, K. Environmental Awareness and Environmental Information Disclosure: An Empirical Study Based on Energy Industry. Front. Psychol. 2022, 13, 1038040. [Google Scholar] [CrossRef] [Scilit]
  64. Lan, F.; Hu, X.; Xu, Z. Does Public Data Accessibility Influence the Geographic Distance of Cross-Regional Capital Flows: Evidence from Inter-Regional M&As. China Ind. Econ. 2024, 9, 156–174. [Google Scholar]
  65. Jia, J.; Liang, X.; Ma, G. Political hierarchy and regional economic development: Evidence from a spatial discontinuity in China. J. Public Econ. 2021, 194, 104352. [Google Scholar] [CrossRef] [Scilit]
  66. Nai, C.; Zhu, R. Market Access Regulation, Environmental Disclosure Quality and Corporate Audit Risk. Financ. Res. Lett. 2025, 89, 109235. [Google Scholar] [CrossRef] [Scilit]
  67. Goodman-Bacon, A. Difference-in-differences with variation in treatment timing. J. Econom. 2021, 225, 254–277. [Google Scholar] [CrossRef] [Scilit]
  68. Callaway, B.; Sant’Anna, P.H.C. Difference-in-differences with multiple time periods. J. Econom. 2021, 225, 200–230. [Google Scholar] [CrossRef] [Scilit]
  69. Cengiz, D.; Dube, A.; Lindner, A.; Zipperer, B. The effect of minimum wages on low-wage jobs. Q. J. Econ. 2019, 134, 1405–1454. [Google Scholar] [CrossRef] [Scilit]
  70. Borusyak, K.; Jaravel, X.; Spiess, J. Revisiting event-study designs: Robust and efficient estimation. Rev. Econ. Stud. 2024, 91, 3253–3285. [Google Scholar] [CrossRef] [Scilit]
  71. Nunn, N.; Qian, N. US food aid and civil conflict. Am. Econ. Rev. 2014, 104, 1630–1666. [Google Scholar] [CrossRef] [Scilit]
  72. Zhou, F.; Li, L.; Wen, H. Regional Digital Infrastructure and Carbon Neutrality: A Technology–Structure–Efficiency Perspective. Energy Strategy Rev. 2024, 56, 101583. [Google Scholar] [CrossRef] [Scilit]
  73. Lin, B.; Yang, Y. Building Efficiency: How the National AI Innovation Pilot Zones Enhance Green Energy Utilization? Evidence from China. J. Environ. Manag. 2025, 387, 125945. [Google Scholar] [CrossRef] [Scilit]
  74. Tan, X.; Liu, H. Corporate Environmental Performance under the Pressure of Government Environmental Information Disclosure. Financ. Res. Lett. 2024, 69, 106152. [Google Scholar] [CrossRef] [Scilit]
  75. Liu, H.; Tan, M.; Cao, R. The role of AI in promoting urban sustainable development: Evidence from China’s new generation of national AI innovative development pilot zones. Appl. Geogr. 2026, 188, 103906. [Google Scholar] [CrossRef] [Scilit]
  76. Yang, S.; Wang, J.; Dong, K.; Dong, X.; Wang, K.; Fu, X. Is Artificial Intelligence Technology Innovation a Recipe for Low-Carbon Energy Transition? A Global Perspective. Energy 2024, 300, 131539. [Google Scholar] [CrossRef] [Scilit]
  77. Wang, J.; Ma, M.; Dong, T.; Zhang, Z. Do ESG Ratings Promote Corporate Green Innovation? A Quasi-Natural Experiment Based on SynTao Green Finance’s ESG Ratings. Int. Rev. Financ. Anal. 2023, 87, 102623. [Google Scholar] [CrossRef] [Scilit]
  78. Nie, S.; Cao, X.; Li, Z.; Liu, M.; Zhang, Y. Supply Chain Digitization in the Net-Zero Era: The Impact of Digital Technology, Renewable Energy, and Infrastructure. Energy Econ. 2025, 144, 108403. [Google Scholar] [CrossRef] [Scilit]
Figure 1. Geographical layout of NAIDP pilot cities.
Sustainability 18 06030 g001
Figure 2. Timeline of the NAIDP development.
Sustainability 18 06030 g002
Figure 3. The theoretical framework.
Sustainability 18 06030 g003
Figure 4. Parallel trend test.
Sustainability 18 06030 g004
Figure 5. Placebo test.
Sustainability 18 06030 g005
Table 1. Scoring criteria for environmental information disclosure.
TypeItemsScoring Explanation
Management
disclosure
Protection conceptDisclosure: 2 points
None: indicates 0 points
Protection goals
Protection management system
Education and training
Special protection actions
Emergency response mechanism
Honors or awards
Three simultaneities system
Certification
disclosure
ISO14001 certification [57]Yes: 2 points
No: 0 points
ISO9001 certification [58]
Environmental
information
disclosure carrier
Annual report of a listed companyDisclosed: 2 points
Not disclosed: 0 points
Social responsibility report
Environmental report
Environmental
liability
disclosure
Volume of wastewater dischargeQuantitative and qualitative
description: 2 points
Only qualitative: 1 point
Not disclosed: 0 points
COD emissions
SO2 emissions
CO2 emissions
Soot and dust emissions
Industrial solid waste discharge
Environmental
performance and
governance
disclosure
Waste emission reduction management
situation
Wastewater emission reduction and treatment
Dust, smoke control situation
Utilization and treatment of solid waste
Noise, light pollution, and radiation control
Implementation of cleaner production
Table 2. Definitions and measurement of variables.
VariableNameSymbolMeasuring Methodologies
Dependent variableEnvironmental information
disclosure
EIDThe environmental information is divided into monetized and non-monetized information, totaling 25 items. Each item is
assigned a score of 0 to 2 based on whether it is qualitative or quantitative. The scores are then summed up, and the natural logarithm is taken.
Explanatory variableNew-generation
artificial intelligence innovation and
development pilot zones
NAIDPA value of 1 is assigned to the city where the company is located if it has been authorized as a pilot zone and is within the year the policy was put into effect or in the years that follow; if not, a value of 0.
Mechanism variableInformation
asymmetry index
AsyAn index constructed through principal component analysis based on stock liquidity, illiquidity ratio, and yield reversal
indicators
Internal control
degree
InterUsing the Dibo internal control index
Moderation variableManagement’s
environmental awareness
BackUsing Python to extract keyword frequencies related to the environment from corporate social responsibility reports
Environmental
regulation intensity
ErltenThe percentage of environmental protection-related terms in each city’s phrases as a percentage of the government work
report’s word count
Control variableCompany sizeSizeLn (total assets at year-end + 1)
Fixed asset ratioFixedNet fixed assets divided by total assets
Return on total
assets
ROANet profit divided by total assets
Cash ratioCrCash and cash equivalents divided by total assets
board scaleBoardLn (total number of directors on the board)
Independent
directors’ proportion
IndepNumber of independent directors divided by the total number of Board Members
Table 3. Descriptive statistics.
Panel A: Full sample
VariableObservationMeanMedianSDMinimumMaximum
EID19,8701.8792.0790.9390.0003.611
NAIDP19,8700.1350.0000.3410.0001.000
Size19,87022.11921.9541.16819.84725.690
Fixed19,8700.0910.0680.0890.0030.540
ROA19,8700.0410.0400.061−0.2520.210
Cr19,8700.0610.0490.0520.0120.267
Board19,8702.1132.1970.1871.6092.565
Indep19,8700.3760.3330.0530.3330.571
Panel B: Treatment group
VariableObservationMeanMedianSDMinimumMaximum
EID73201.7961.9460.9400.0003.584
NAIDP73200.3650.0000.4820.0001.000
Size732022.11221.9071.22619.84725.690
Fixed73200.0940.0700.0910.0030.540
ROA73200.0420.0410.060−0.2520.210
Cr73200.0580.0460.0490.0120.267
Board73202.1042.1970.1991.6092.565
Indep73200.3780.3640.0550.3330.571
Panel C: Control group
VariableObservationMeanMedianSDMinimumMaximum
EID12,5501.9282.0790.9350.0003.611
NAIDP12,5500.0000.0000.0000.0000.000
Size12,55022.12321.9811.13219.84725.690
Fixed12,5500.0880.0660.0880.0030.540
ROA12,5500.0410.0390.062−0.2520.210
Cr12,5500.0630.0510.0530.0120.267
Board12,5502.1182.1970.1801.6092.565
Indep12,5500.3750.3330.0520.3330.571
Note: This table presents summary statistics for the main variables, all of which are defined in Table 2.
Table 4. Baseline regression.
Variables(1)(2)(3)(4)
EIDEIDEIDEID
NAIDP0.518 ***0.036 **0.084 ***0.076 ***
(0.015)(0.014)(0.027)(0.027)
Size 0.265 *** 0.172 ***
(0.005) (0.019)
ROA 0.444 ** −0.359 *
(0.183) (0.190)
Cr 1.203 *** 0.117
(0.099) (0.088)
Indep 0.052 −0.060
(0.122) (0.204)
Board 0.405 *** −0.153 **
(0.037) (0.071)
Fixed −0.130 * 0.109 *
(0.068) (0.061)
Constant1.810 ***−5.535 ***1.866 ***−1.600 ***
(0.007)(0.127)(0.004)(0.460)
Firm FE××
Year FE××
R 2 0.0350.3190.7240.728
N19,87019,87019,87019,870
Notes: Parentheses report standard errors clustered at the firm level. 1%, 5%, and 10% significance are indicated by the symbols ***, **, and *, respectively. × indicates that this item is not included, and √ indicates that this item is included.
Table 5. Robustness test.
Variables(1)(2)(3)(4)
EIDEIDEIDEID_New
NAIDP_lag0.035 *
(0.020)
NAIDP 0.081 ***0.067 **2.500 ***
(0.022)(0.027)(0.128)
Constant−1.512 ***−2.050 ***−2.285 ***−68.819 ***
(0.324)(0.290)(0.383)(1.862)
Controls
Firm FE
Year FE
R 2 0.3420.3670.3680.217
N16,06817,13413,20019,870
Notes: All the symbols are the same as those listed in Table 4.
Table 6. Test results of the Goodman–Bacon decomposition.
Comparison Group CategoryWeightEstimator
Earlier-treated groups vs. Later-treated groups0.0470.020
Later-treated groups vs. Earlier-treated groups0.0180.209
Treated groups vs. Never-treated groups0.8960.083
Treated groups vs. Always-treated groups0.0390.053
Table 7. Estimation results accounting for heterogeneous treatment effects.
Variables(1)(2)(3)
CSDIDBunching DIDImputation DID
NAIDP0.071 *0.053 **0.733 ***
(0.040)(0.027)(0.025)
Controls
Firm FE
Year FE
N17,52459,86219,305
Notes: All the symbols are the same as those listed in Table 4.
Table 8. Endogeneity test.
Variables(1)(2)
NAIDPEID
IV0.0011 ***
(0.000)
NAIDP 1.4293 **
(0.555)
Constant−0.1236−4.6765 ***
(0.091)(0.302)
Controls
Firm FE
Year FE
N16,66816,668
R 2 0.5120.270
Notes: All the symbols are the same as those listed in Table 4.
Table 9. PSM-DID test.
Variables(1)(2)(3)
EIDEIDEID
NAIDP0.241 ***0.212 ***0.072 ***
(0.033)(0.031)(0.028)
Constant1.240 ***−5.353 ***−2.268 ***
(0.037)(0.277)(0.504)
Controls×
Firm FE××
Year FE××
R 2 0.1880.3180.374
N16,95016,95016,950
Notes: All the symbols are the same as those listed in Table 4.
Table 10. Mechanism test.
Variables(1)(2)
AsyInter
NAIDP−0.035 ***0.083 ***
(0.013)(0.023)
Constant5.25 ***5.884 ***
(0.258)(0.638)
Sobel Z2.468 **2.361 **
Bootstrap[0.0001, 0.0036][0.0002, 0.0028]
Controls
Firm FE
Year FE
R 2 0.7970.274
N19,49119,564
Notes: All the symbols are the same as those listed in Table 4.
Table 11. Moderation effect test.
Variables(1)(2)
EIDEID
NAIDP0.214 ***0.178 **
(0.020)(0.080)
Back0.000
(0.023)
Back × NAIDP0.149 ***
(0.045)
Inten 0.013
(0.022)
Inten × NAIDP 0.143 *
(0.085)
Constant−9.959 ***−3.191 ***
(0.279)(0.296)
Controls
Firm FE
Year FE
R 2 0.2350.377
N18,37816,331
Notes: All the symbols are the same as those listed in Table 4.
Table 12. Heterogeneity test.
Variables(1)(2)(3)(4)(5)(6)
EIDEIDEIDEIDEIDEID
SOEsNSOEsHighLowHeavy
Pollution
Non-Heavy Pollution
NAIDP−0.0140.117 ***0.055 *0.0330.0670.081 ***
(0.050)(0.032)(0.031)(0.046)(0.064)(0.031)
Constant−1.888 **−2.457 ***−3.235 ***−1.512 **−1.495 *−2.470 ***
(0.820)(0.558)(0.569)(0.731)(0.833)(0.546)
Controls
Firm FE
Year FE
R 2 0.3640.3700.3960.3110.3290.391
N574314,12711,8058161579713,953
Notes: All the symbols are the same as those listed in Table 4.
Disclaimer/Publisher’s Note: The statements, opinions and data contained in all publications are solely those of the individual author(s) and contributor(s) and not of MDPI and/or the editor(s). MDPI and/or the editor(s) disclaim responsibility for any injury to people or property resulting from any ideas, methods, instructions or products referred to in the content.