Article

Business Continuity Management as a Pathway to Sustainable Performance in Thai Digital SMEs: An Integrated Fuzzy TOPSIS and SEM Approach


by
Akares Suktalordcheep
,
Somchai Lekcharoen
* and
Sumaman Pankham
College of Digital Innovation Technology, Rangsit University, Pathum Thani 12000, Thailand
*
Author to whom correspondence should be addressed.
Sustainability 2026, 18(12), 5949; https://doi.org/10.3390/su18125949
Submission received: 22 February 2026 / Revised: 4 April 2026 / Accepted: 22 April 2026 / Published: 10 June 2026
(This article belongs to the Section Sustainable Management)

Abstract

Digital small and medium-sized enterprises (digital SMEs) in emerging market economies operate in disruption-biased environments where interruptions can quickly deteriorate operational reliability and long-term performance. Existing studies insufficiently integrate business continuity management (BCM) into capability-based performance models in the digital SME context, especially when focusing on operational rather than strategic perspectives in emerging market economies. Moreover, empirical evidence on how multiple organisational capabilities interact under disruption remains fragmented. This study therefore aims to prioritise the most influential capability-based determinants of sustainable performance in Thai digital SMEs using expert consensuses analysed via Fuzzy TOPSIS. This study adopted the following two-stage research design. Stage 1: A three-round e-Delphi panel (n = 21) refined and prioritised the most influential determinant; the expert group included SME business owners (with more than 20 years of SME management experience) and relevant specialists. The consensuses were then analysed using Fuzzy TOPSIS to rank the determinants by relative importance. Stage 2: Structural Equation Modelling (SEM) using survey data from 817 Thai digital SMEs was utilised to validate the proposed capability transmission pathways, and a strong fit was demonstrated (χ2/df = 1.672, CFI = 0.984, RMSEA = 0.029). The study findings highlight continuity-oriented routines as a practical leverage point for SME leaders and policymakers seeking resilient and sustainable performance in digital markets, and positions BCM as an actionable strategy toward achieving these goals.

1. Introduction

Digital SMEs operate in increasingly disruption-prone environments where shocks can rapidly interrupt operations, erode customer trust, and weaken long-term performance [1,2,3]. Under these conditions, sustainable performance relies not only on innovation and market growth, but also on a firm’s ability to maintain critical functions, respond effectively, and recover quickly [4,5,6]. Thailand provides a salient context because SMEs are economically central yet often resource-constrained, while digitalisation simultaneously expands market reach and exposure to operational and cyber-related disruptions [7,8,9,10].
Previous studies link social media usage, open innovation, and leadership to performance, but they often treat sustainable performance as a direct outcome of capabilities without specifying the organisational mechanism that protects performance during disruption [11,12]. Firms can invest in branding and innovation yet still underperform during disruptions if continuity planning, response routines, and recovery capability are underdeveloped [13,14,15]. Business continuity management therefore warrants examination as a strategic pathway through which digital and innovation-oriented capabilities translate into sustainable performance [2,6,16]. In addition, studies rarely combine stakeholder-based prioritisation of key determinants with large sample causal validation, limiting both practical relevance and explanatory precision [17,18,19].
This study aims to identify and prioritise the key capability-based determinants of business continuity management and sustainable performance in Thai digital SMEs and to validate a capability based explanatory model. To achieve this, a two-stage approach is employed, integrating expert-based prioritisation with empirical model validation [20,21,22]. In Stage 1, expert judgements from 21 experts, comprising seven university professors, seven government officials, and seven SME business owners, inform prioritisation using Fuzzy TOPSIS following a three-round e-Delphi procedure [23,24,25]. In Stage 2, Structural Equation Modelling is applied to survey data from 817 digital SMEs in Thailand to validate the hypothesised pathways and the central role of business continuity management, consistent with prior Thai SME model validation research [26].
This research contributes in two ways. First, it positions business continuity management as a core mechanism in SME sustainability models. Second, it demonstrates the value of integrating expert-driven prioritisation with SEM-based causal testing [27,28]. This integrated approach strengthens both contextual relevance and explanatory validation. These contributions are expected to be most relevant to digitally active SMEs operating under resource constraints and frequent disruption exposure, where continuity capability is likely to play a more central role in sustaining performance.

2. Literature Review

2.1. Social Media Usage, Corporate Branding, and Competitive Advantage

In digital SME contexts, organisational capabilities play a critical role in enabling firms to respond to disruption and sustain performance over time. Among these capabilities, social media usage functions as a strategic digital routine enabling continuous interaction with customers and wider stakeholders 3 [29,30,31]. Among communication channels, social media supports brand creation, credibility signalling, and relationship building, which are particularly important for SMEs with limited resources for traditional marketing [6,32,33]. Such engagement can strengthen corporate branding as an intangible asset through consistent identity projection, customer dialogue, and community-based trust formation [34,35,36]. Accordingly, greater social media usage is expected to enhance corporate branding [33,37,38]. In addition, social media usage is expected to strengthen competitive advantage by enhancing market sensing, customer responsiveness, and customer–firm co-creation [39,40,41]. In turbulent digital markets, these capabilities support differentiation and speed, thereby improving an SME’s competitive position [42,43,44]. This relationship can also be understood through the lens of dynamic capabilities, where social media usage enhances firms’ sensing and responding capabilities in rapidly changing digital environments [39,40,41].

2.2. Open Innovation and Competitive Advantage

Open innovation emphasises purposeful knowledge flows across organisational boundaries, allowing SMEs to access external expertise, ideas, and complementary resources [12,45,46]. Because SMEs often face constraints in internal research and development, open innovation can accelerate problem solving and improve the novelty and feasibility of innovations [47,48,49]. These advantages support superior offerings and process improvements, which can translate into competitive advantage through differentiation, quality enhancement, and faster time to market [50,51,52].

2.3. Leadership as an Antecedent of Business Continuity Management and Innovation Capability

Leadership is central to how SMEs allocate resources, establish priorities, and build organisational capability under uncertainty [12,53,54]. From a strategic leadership perspective, leaders act as key enablers of organisational capabilities by shaping vision, directing resource allocation, and fostering adaptive learning processes within firms [53]. In disruption-prone environments, leadership influences whether continuity is treated as a strategic priority, shaping preparedness, coordination, and learning routines that enable business continuity management [55,56,57]. Leaders also play a pivotal role in building innovation capability by fostering learning, encouraging experimentation, and enabling knowledge integration [57,58,59]. These behaviours strengthen SMEs’ capacity to generate and implement innovations that enhance their adaptability and long-term performance [60,61,62].

2.4. Corporate Branding and Competitive Advantage

Corporate branding represents an organisational-level promise and reputation that shapes stakeholder perceptions [63,64,65]. From a resource-based view perspective, corporate branding can be interpreted as an intangible strategic asset that is valuable, rare, and difficult to imitate, thereby enabling firms to sustain competitive advantage over time [63,64,65,66,67,68,69]. For SMEs, a strong corporate brand can reduce perceived risk, support customer loyalty, and increase willingness to engage, thereby strengthening competitive advantage [6,37,66]. In digital markets, brand credibility can be particularly influential because information spreads rapidly and switching costs are low [37,42,67]. Stronger corporate branding is thus expected to enhance competitive advantage [37,68,69]. However, the relationship between corporate branding and competitive advantage may not always be straightforward. While corporate branding is often viewed as a strategic asset [63,64,65], in resource-constrained SMEs, excessive emphasis on branding may lead to increased costs or misalignment with core operational capabilities [6,37,66]. In such cases, branding efforts may not translate into improved competitive advantage and may even have unintended negative effects if not supported by strong underlying capabilities [37,42,67].
This boundary condition is particularly relevant for digital SMEs because corporate branding may create market visibility before the firm has developed sufficient execution capability to fulfil the expectations generated by that visibility. From an RBV perspective, corporate branding can be valuable, rare, and difficult to imitate; however, its strategic value depends on complementary capabilities such as innovation capability, customer responsiveness, reliable service delivery, and continuity routines [42,67]. When such complementary capabilities are underdeveloped, corporate branding may increase perceived expectations without necessarily strengthening actual competitive advantage [37,42]. Therefore, the branding advantage relationship should be interpreted as contingent upon capability alignment rather than as an automatic outcome of brand investment.

2.5. Innovation Capability, Competitive Advantage, and Sustainable Performance

Innovation capability reflects an SME’s ability to develop and implement new products, services, and processes [70,71,72]. This capability enables continuous renewal and adaptation, supporting competitive advantage through improved differentiation and operational efficiency [73,74,75]. Innovation capability also contributes directly to sustainable performance because it strengthens long-term viability, supports resource efficiency, and enhances the firm’s capacity to respond to shifting stakeholder expectations [12,76,77].

2.6. Competitive Advantage, Business Continuity Management, and Sustainable Performance

Competitive advantage reflects an SME’s ability to deliver superior value through distinctive resources, disciplined routines, and reliable execution [12,78,79]. From a dynamic capability perspective, firms with stronger competitive advantage are better positioned to sense environmental changes, seize opportunities, and reconfigure internal resources, which supports more effective continuity planning and organisational resilience [78]. In disruption-prone settings, competitively advantaged digital SMEs are expected to pay greater attention and allocate more resources to preparedness, continuity planning, and recovery capability, thereby institutionalising stronger business continuity management [6,80,81]. Having a stronger competitive advantage also supports sustainable performance by enabling market retention, margin protection, and operational stability over time [6,82,83]. Business continuity management, in turn, directly enhances sustainable performance by safeguarding critical activities, reducing disruption-related losses, and accelerating recovery, which stabilises service delivery and stakeholder trust under uncertainty [80,82,84]. These arguments support the proposed capability of continuity as a performance pathway [5,84].
In this study, business continuity management is not positioned as a full higher order dynamic capability equivalent to sensing, seizing, or reconfiguring capabilities [51]. Rather, BCM is conceptualised as an operational resilience capability that enables the stabilisation and execution of higher order strategic capabilities under disruption [80,82,84]. Its indicators capture preparedness, continuity routines, crisis response, recovery procedures, and the restoration of critical operations [80,84]. This positioning is consistent with the operational nature of BCM while still recognising its strategic importance in protecting sustainable performance during disruption [5,84].
Despite these advancements, prior studies have tended to examine these constructs in isolation or focus primarily on direct performance outcomes, with limited attention paid to the role of business continuity management as a capability-based mechanism linking organisational capabilities to sustainable performance. Furthermore, few studies integrate expert-based prioritisation with large-sample causal validation, leaving a gap in both contextual relevance and explanatory depth.
The definition of core theoretical foundations, as mentioned above in this section, are presented in Table 1.

3. Hypotheses Development

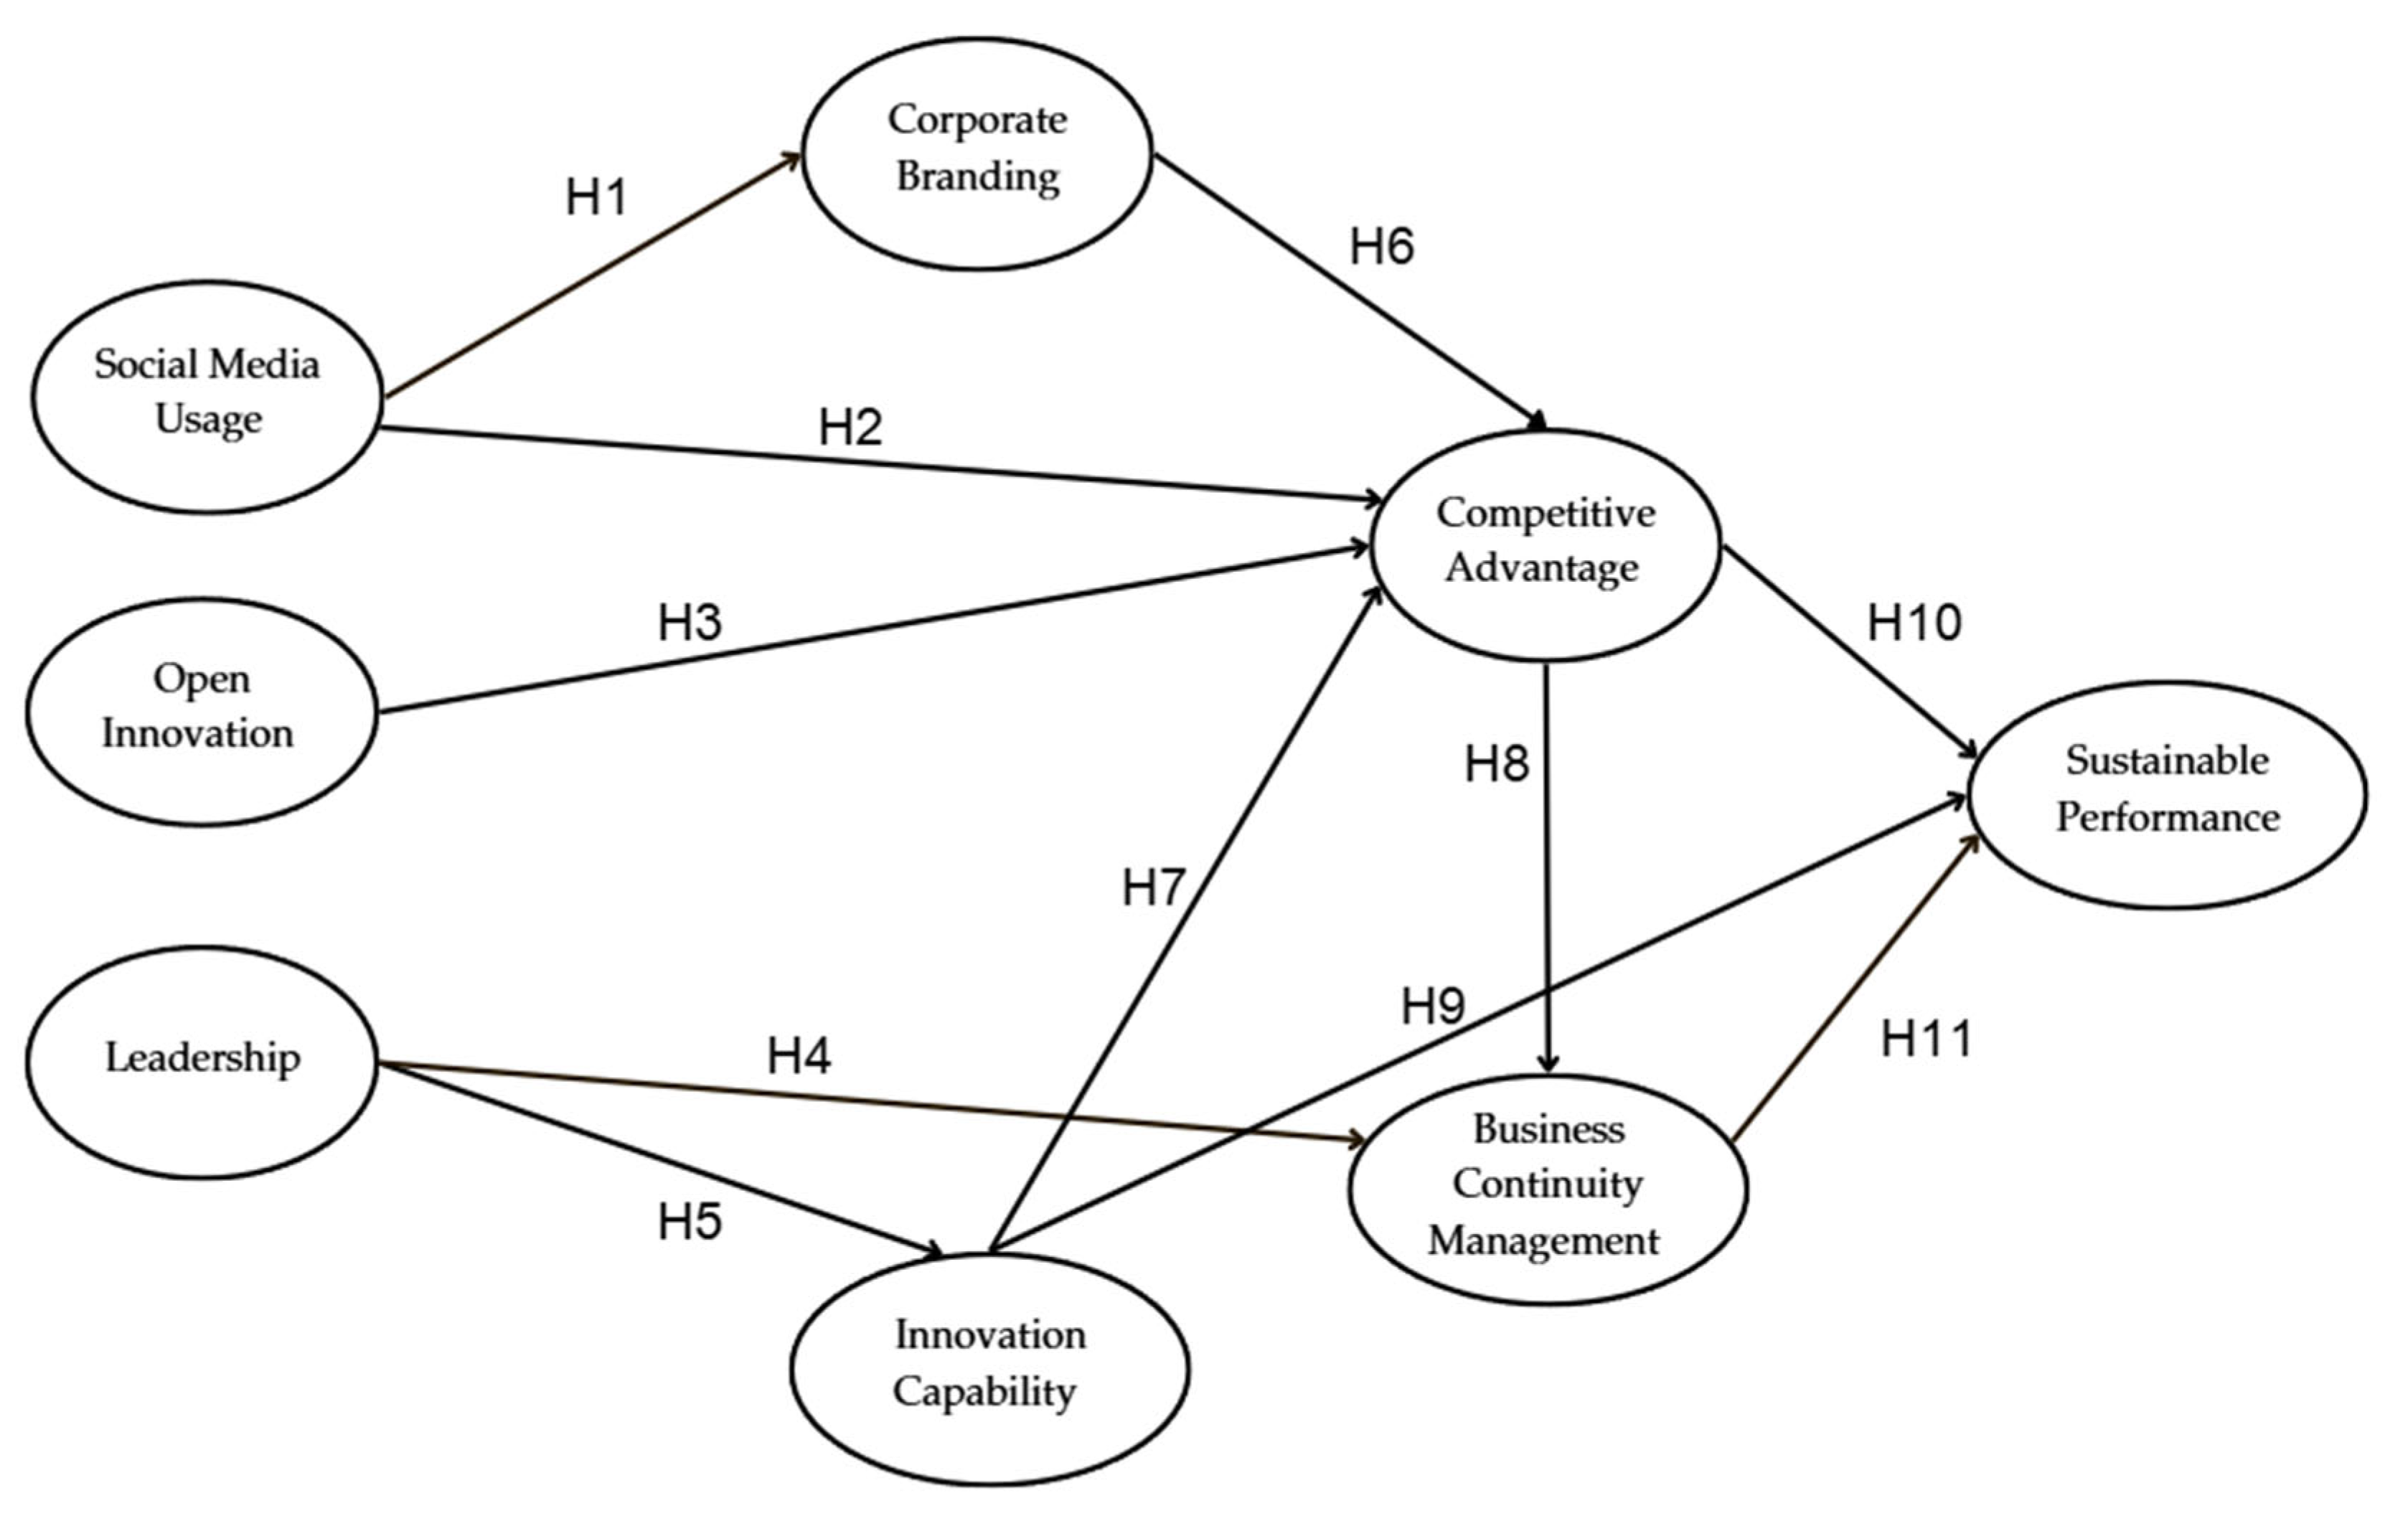
Based on the literature reviewed above, organisational capabilities in digital SMEs can be conceptualised as interconnected drivers of sustainable performance, operating through both direct and indirect pathways. In particular, prior studies suggest that digital-, innovation-, and leadership-related capabilities contribute to performance not only independently but also through intermediate organisational mechanisms, such as corporate branding, innovation capability, competitive advantage, and business continuity management. Building on this integrated perspective, the following hypotheses are proposed, as illustrated in Figure 1.

3.1. Social Media Usage

Social media usage is widely recognised as a key digital capability enabling SMEs to strengthen customer engagement and market responsiveness. As discussed in the literature, it supports both brand development and competitive positioning in dynamic environments.
H1. 
Social media usage (SMU) positively influences corporate branding (CB).
H2. 
Social media usage (SMU) positively influences competitive advantage (CA).

3.2. Open Innovation

Open innovation enables SMEs to access external knowledge and resources, enhancing their ability to develop competitive offerings and respond to market changes.
H3. 
Open innovation (OI) positively influences competitive advantage (CA).

3.3. Leadership

Leadership plays a central role in shaping organisational capabilities, particularly in fostering innovation and ensuring preparedness for disruptions.
H4. 
Leadership (LD) positively influences business continuity management (BCM).
H5. 
Leadership (LD) positively influences innovation capability (IC).

3.4. Corporate Branding

Corporate branding functions as a strategic asset that enhances stakeholder trust and market positioning, contributing to competitive advantage.
H6. 
Corporate branding (CB) positively influences competitive advantage (CA).

3.5. Innovation Capability

Innovation capability enables SMEs to continuously adapt and improve their offerings, thereby strengthening both competitive advantage and long-term performance.
H7. 
Innovation capability (IC) positively influences competitive advantage (CA).
H9. 
Innovation capability (IC) positively influences sustainable performance (SP).

3.6. Competitive Advantage and Business Continuity Management

Competitive advantage and business continuity management jointly contribute to sustaining firm performance under disruption. Competitive advantage supports organisational preparedness and resilience, while business continuity management ensures operational stability and recovery.
H8. 
Competitive advantage (CA) positively influences business continuity management (BCM).
H10. 
Competitive advantage (CA) positively influences sustainable performance (SP).
H11. 
Business continuity management (BCM) positively influences sustainable performance (SP).
The proposed hypotheses collectively reflect an integrated capability-based framework, in which organisational capabilities influence sustainable performance through both direct effects and mediated pathways involving competitive advantage and business continuity management.

4. Research Methodology

4.1. Research Design

This study adopts a two-stage research design to enhance both the relevance and robustness of the proposed model. In Stage 1, an expert-based e-Delphi process combined with Fuzzy TOPSIS is employed to identify and prioritise the most influential capability-based determinants. The outcomes of this stage are used to confirm the relative importance and relevance of the selected constructs. In Stage 2, Structural Equation Modelling (SEM) is applied to empirically validate the hypothesised relationships among these constructs using survey data from digital SMEs. This sequential design ensures that the model is both expert-informed and empirically validated.
Stage 1 used a three-round e-Delphi process to confirm construct relevance, refine measurement content, and obtain expert judgements for prioritisation. The e-Delphi method is particularly suitable in contexts where empirical evidence is fragmented or evolving, as it enables the systematic collection of expert consensus through iterative rounds. This approach enhances the reliability of construct selection by incorporating informed judgement from multiple stakeholders [85]. The experts’ evaluations were processed using the Fuzzy Technique for Order Preference by Similarity to the Ideal Solution (Fuzzy TOPSIS) to rank the determinants according to their relative importance. Fuzzy TOPSIS is employed to address uncertainty and subjectivity in expert evaluations, allowing for the prioritisation of determinants based on their relative closeness to ideal solutions. This method is particularly appropriate for multi-criteria decision-making in complex organisational contexts [86].
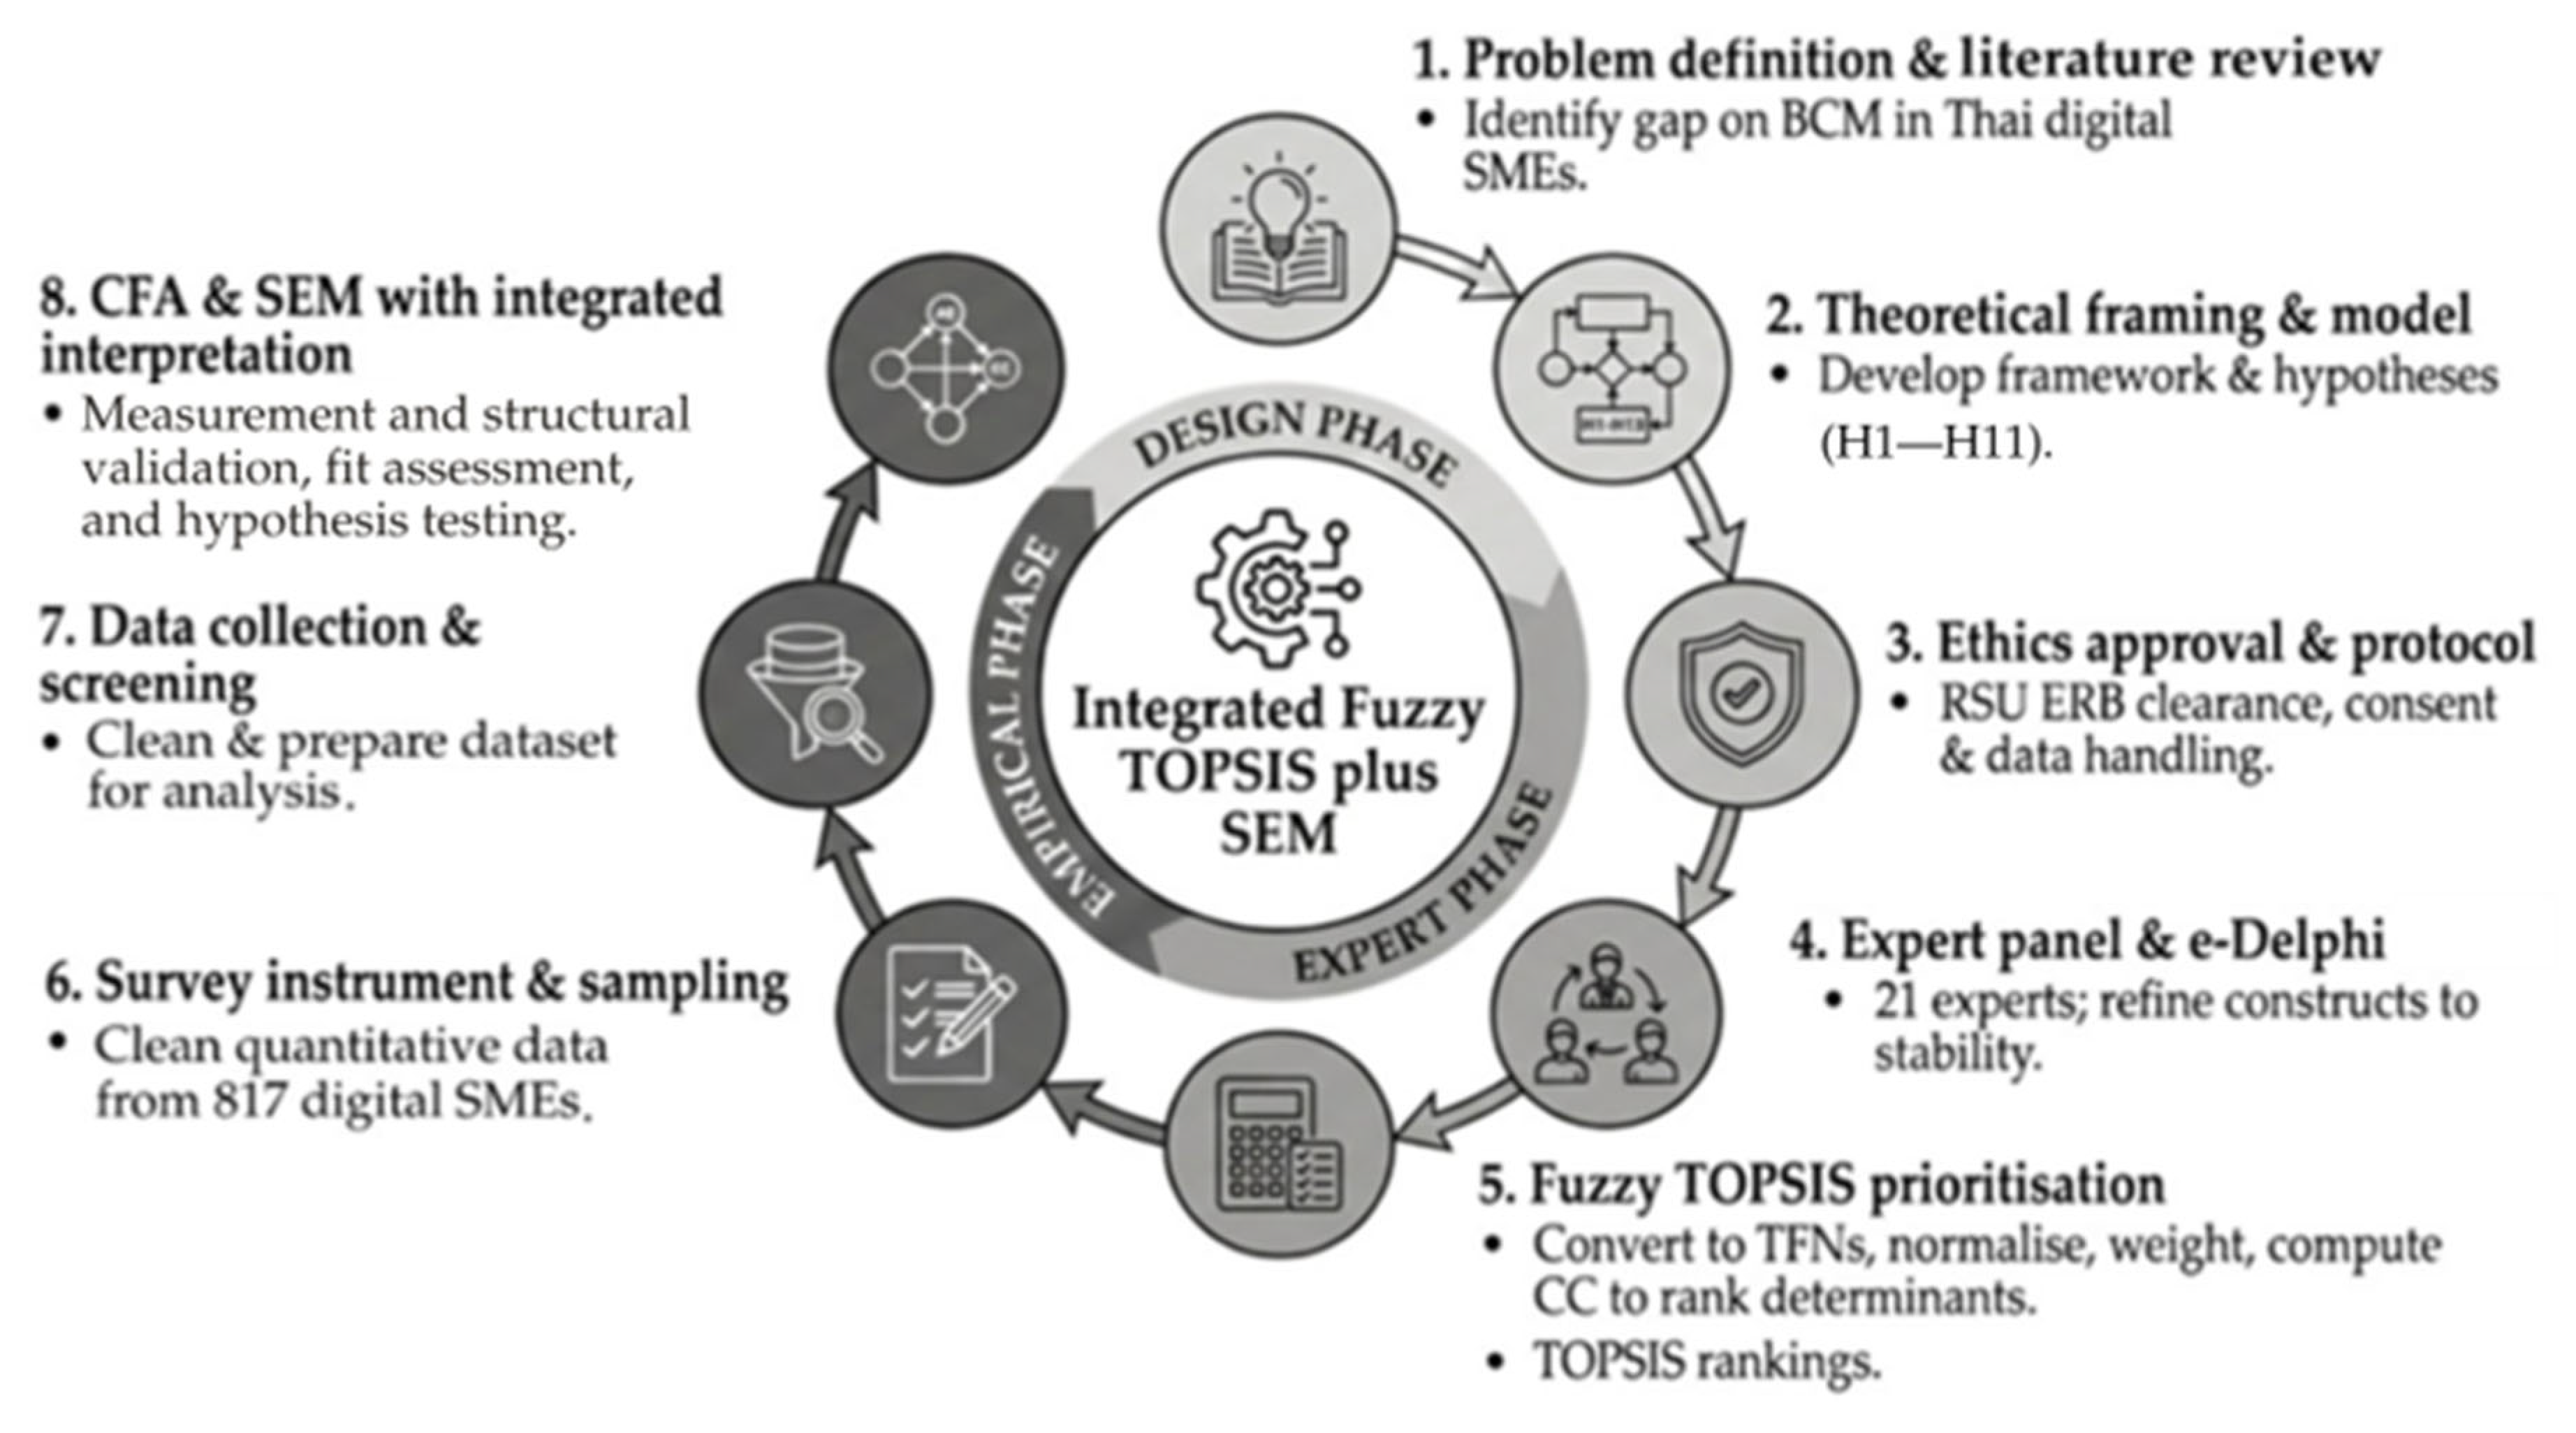
Stage 2 utilised covariance-based structural equation modelling to test the hypothesised relationships using survey data from 817 digital SMEs in Thailand. The sample size of 817 SMEs is considered adequate for SEM analysis, exceeding commonly recommended thresholds for model estimation and ensuring statistical robustness. The integration strengthens both practical relevance, through expert triangulation, and statistical robustness, through large sample modelling. The overall research design and analysis workflow are summarised in Figure 2.

4.2. Expert Panel and Eligibility Criteria

A panel of 21 specialists were assembled from three different constituencies, including academics, public sector professionals, and SME owners, each starting with a research, governance, and operational practice. The selection process considered ethical guidelines and experts were chosen based on professional relevance, experience thresholds, and verified subject matter competence.
Ethics clearance was secured through the Rangsit University Ethics Review Board (COA. No. RSUERB2025-175). All participants provided informed consent, and responses were handled anonymously.
The composition and selection criteria of the expert sample used in this study and their professional experience are presented in Table 2.

4.3. e-Delphi Procedure

A structured three-round e-Delphi procedure was conducted to establish content relevance and consensus for the prioritisation stage and the survey instrument.
Round 1: Experts reviewed the initial pool of constructs and indicators to assess relevance, clarity, and contextual appropriateness, and their qualitative feedback was used to refine wording and remove redundancy.
Round 2: The revised indicators were rated using a predefined linguistic scale, and these linguistic judgements were subsequently analysed using Fuzzy TOPSIS to prioritise constructs and indicators under uncertainty.
Round 3: The prioritised results were returned to the panel for confirmation of consensus regarding the final set of retained indicators.

4.4. Fuzzy TOPSIS Procedure

Fuzzy TOPSIS was applied to prioritise the determinants using the expert ratings. Linguistic assessments were converted into triangular fuzzy numbers using a seven-level scale [87]. The Fuzzy TOPSIS analysis was applied to the expert linguistic ratings collected in Round 2, while Round 3 was used to confirm panel consensus on the prioritised rankings and the final retained indicators. A fuzzy decision matrix was constructed and normalised, and weights were applied to compute weighted normalised values [87,88]. The fuzzy positive ideal solution and fuzzy negative ideal solution were established. Distances between each determinant and both ideal solutions were computed, and a closeness coefficient was then derived. Determinants with higher closeness coefficients were interpreted as higher priority drivers. The ranking results were subsequently used to strengthen interpretation of the SEM results by highlighting which determinants were considered most influential by experienced stakeholders [89].
Accordingly, the Fuzzy TOPSIS results were not used as statistical evidence for the causal paths in the SEM model. Rather, they served as an expert informed prioritisation layer that supported construct refinement and managerial interpretation, while the SEM results independently validated the empirical relationships among the latent constructs.
Table 3 presents the linguistic terms and their corresponding triangular fuzzy numbers (conversion via numeric scale) used in the analysis to evaluate expert consensus.
The methodological design combines complementary procedures serving different purposes. The e-Delphi process was used to refine measurement content, Fuzzy TOPSIS was applied to prioritise expert judgements, and CFA together with SEM was used to validate the measurement model and test the hypothesised causal relationships. Together, these methods were appropriate for digitally active SMEs in Thailand because the study required both contextual prioritisation of expert judgements and empirical testing of interrelated capability–performance relationships.

4.5. Survey Instrument and Data Collection

The survey instrument measured social media usage, open innovation, leadership, corporate branding, innovation capability, competitive advantage, business continuity management, and sustainable performance. Items were adapted from established scales and refined through e-Delphi process to ensure content validity and contextual suitability between August and October 2025. All items were assessed on a seven-point Likert response format, anchored from strongly disagree through to strongly agree. The survey targeted digital SMEs operating in Thailand and produced 817 usable questionnaires for subsequent analysis. Respondents participated voluntarily, and consent was secured before data capture.

4.6. Data Screening and Diagnostic Assessment

Data were screened for missing values, outliers, distributional properties, common method bias, and structural multicollinearity prior to model estimation. No missing data were identified across all 45 measurement items from the 817 valid responses.
Multivariate normality. Item level skewness values ranged from −1.13 to −0.58, while excess kurtosis values ranged from −0.78 to +0.90. These values satisfied commonly applied univariate thresholds of |skewness| < 2 and |excess kurtosis| < 7, indicating no severe univariate non-normality [90]. However, Mardia’s multivariate normality test indicated a statistically significant departure from multivariate normality, with multivariate skewness of b1p = 224.44, χ2 = 30,560.98, p < 0.001, and multivariate kurtosis of b2p = 2435.41, z = 70.41, p < 0.001. This result is not unexpected for bounded Likert-type data in a large sample. Although the assumption of strict multivariate normality was not fully satisfied, the large sample size of 817 respondents provides substantial statistical power for ML-based CB-SEM estimation, and the excellent model fit indices reported in Section 5.4 further support the adequacy of the estimation procedure [91,92].
Common method bias. Common method bias was assessed using Harman’s single-factor test. The first unrotated factor accounted for 66.46% of the total variance, indicating that common method variance may be present and should be acknowledged as a potential limitation of the single-source survey design. However, the results do not suggest that the structural findings are uniformly driven by method artefact. In particular, the presence of a directionally unexpected negative path from corporate branding to competitive advantage (H6: CB → CA, β = −0.511), alongside positive coefficients for the remaining hypothesised paths, suggests that the relationships were not inflated uniformly in the same direction. Therefore, while common method bias cannot be fully ruled out, the structural pattern indicates that the findings should not be interpreted as solely attributable to common method variance [89].
Structural multicollinearity. Structural multicollinearity was assessed using variance inflation factors for each endogenous construct predictor set [90,91]. For the competitive advantage equation, VIF values for social media usage, corporate branding, open innovation, leadership, and innovation capability ranged from 4.24 to 8.08. For the sustainable performance equation, VIF values for innovation capability, competitive advantage, and business continuity management ranged from 4.88 to 5.56. For the business continuity management equation, the VIF values for leadership and competitive advantage were both 5.49. Although several VIF values exceeded the more conservative threshold of 5.0, all values remained below the critical threshold of 10.0 [91], indicating that the model did not suffer from severe structural multicollinearity. Accordingly, the path estimates were interpreted with caution, particularly for the corporate branding to competitive advantage relationship.

4.7. Measurement Model Assessment Procedure

A confirmatory factor analysis was undertaken to test indicator loadings and to verify the adequacy of the measurement model [90]. This step was necessary before structural estimation to confirm that the latent constructs were measured reliably and validly. Establishing satisfactory measurement quality reduces the risk that subsequent structural relationships are distorted by poorly performing indicators. Reliability was examined through Cronbach’s alpha together with composite reliability. Convergent validity was determined using the average variance extracted (AVE). These measurement assessment steps were undertaken before structural testing to confirm that the latent constructs were measured adequately prior to evaluating the hypothesised relationships. Discriminant validity was checked via the Fornell–Larcker approach by contrasting the square root of each construct’s AVE against the correlations between constructs.

4.8. Structural Equation Model Estimation and Hypothesis Testing

In this study, covariance-based Structural Equation Modelling was employed to examine the relationships among multiple latent constructs within a single integrated framework. Data screening, descriptive analysis, diagnostic assessment, confirmatory factor analysis, and structural equation modelling were conducted using IBM SPSS Statistics and IBM SPSS Amos (IBM Corp., Armonk, NY, USA). SEM involves two linked stages: assessment of the measurement model and evaluation of the structural model. The measurement model was assessed first to confirm that the observed indicators adequately represented the latent constructs, and the structural model was then evaluated to test the hypothesised causal relationships. This approach was appropriate because the proposed model contains multiple interrelated direct paths linking upstream capabilities, competitive advantage, business continuity management, and sustainable performance. Accordingly, covariance-based SEM with maximum likelihood estimation was used to evaluate overall model fit and test the hypothesised relationships within the full model. Model fit was judged using commonly reported fit statistics, including the chi square/degree of freedom ratio, goodness of fit index, adjusted goodness of fit index, comparative fit index, Tucker–Lewis index, normed fit index, incremental fit index, root mean square error of approximation, and root mean square residual [91]. Explanatory power was assessed using R squared values for endogenous constructs [92]. Hypotheses were tested using standardised path coefficients and their statistical significance at p < 0.05. Given the study’s focus on the explanatory mechanism of business continuity management, indirect effects were also examined through the estimated path structure and the significance of constituent paths.
Table 4 summarises the measurement items, sources, and scales used in the questionnaire.
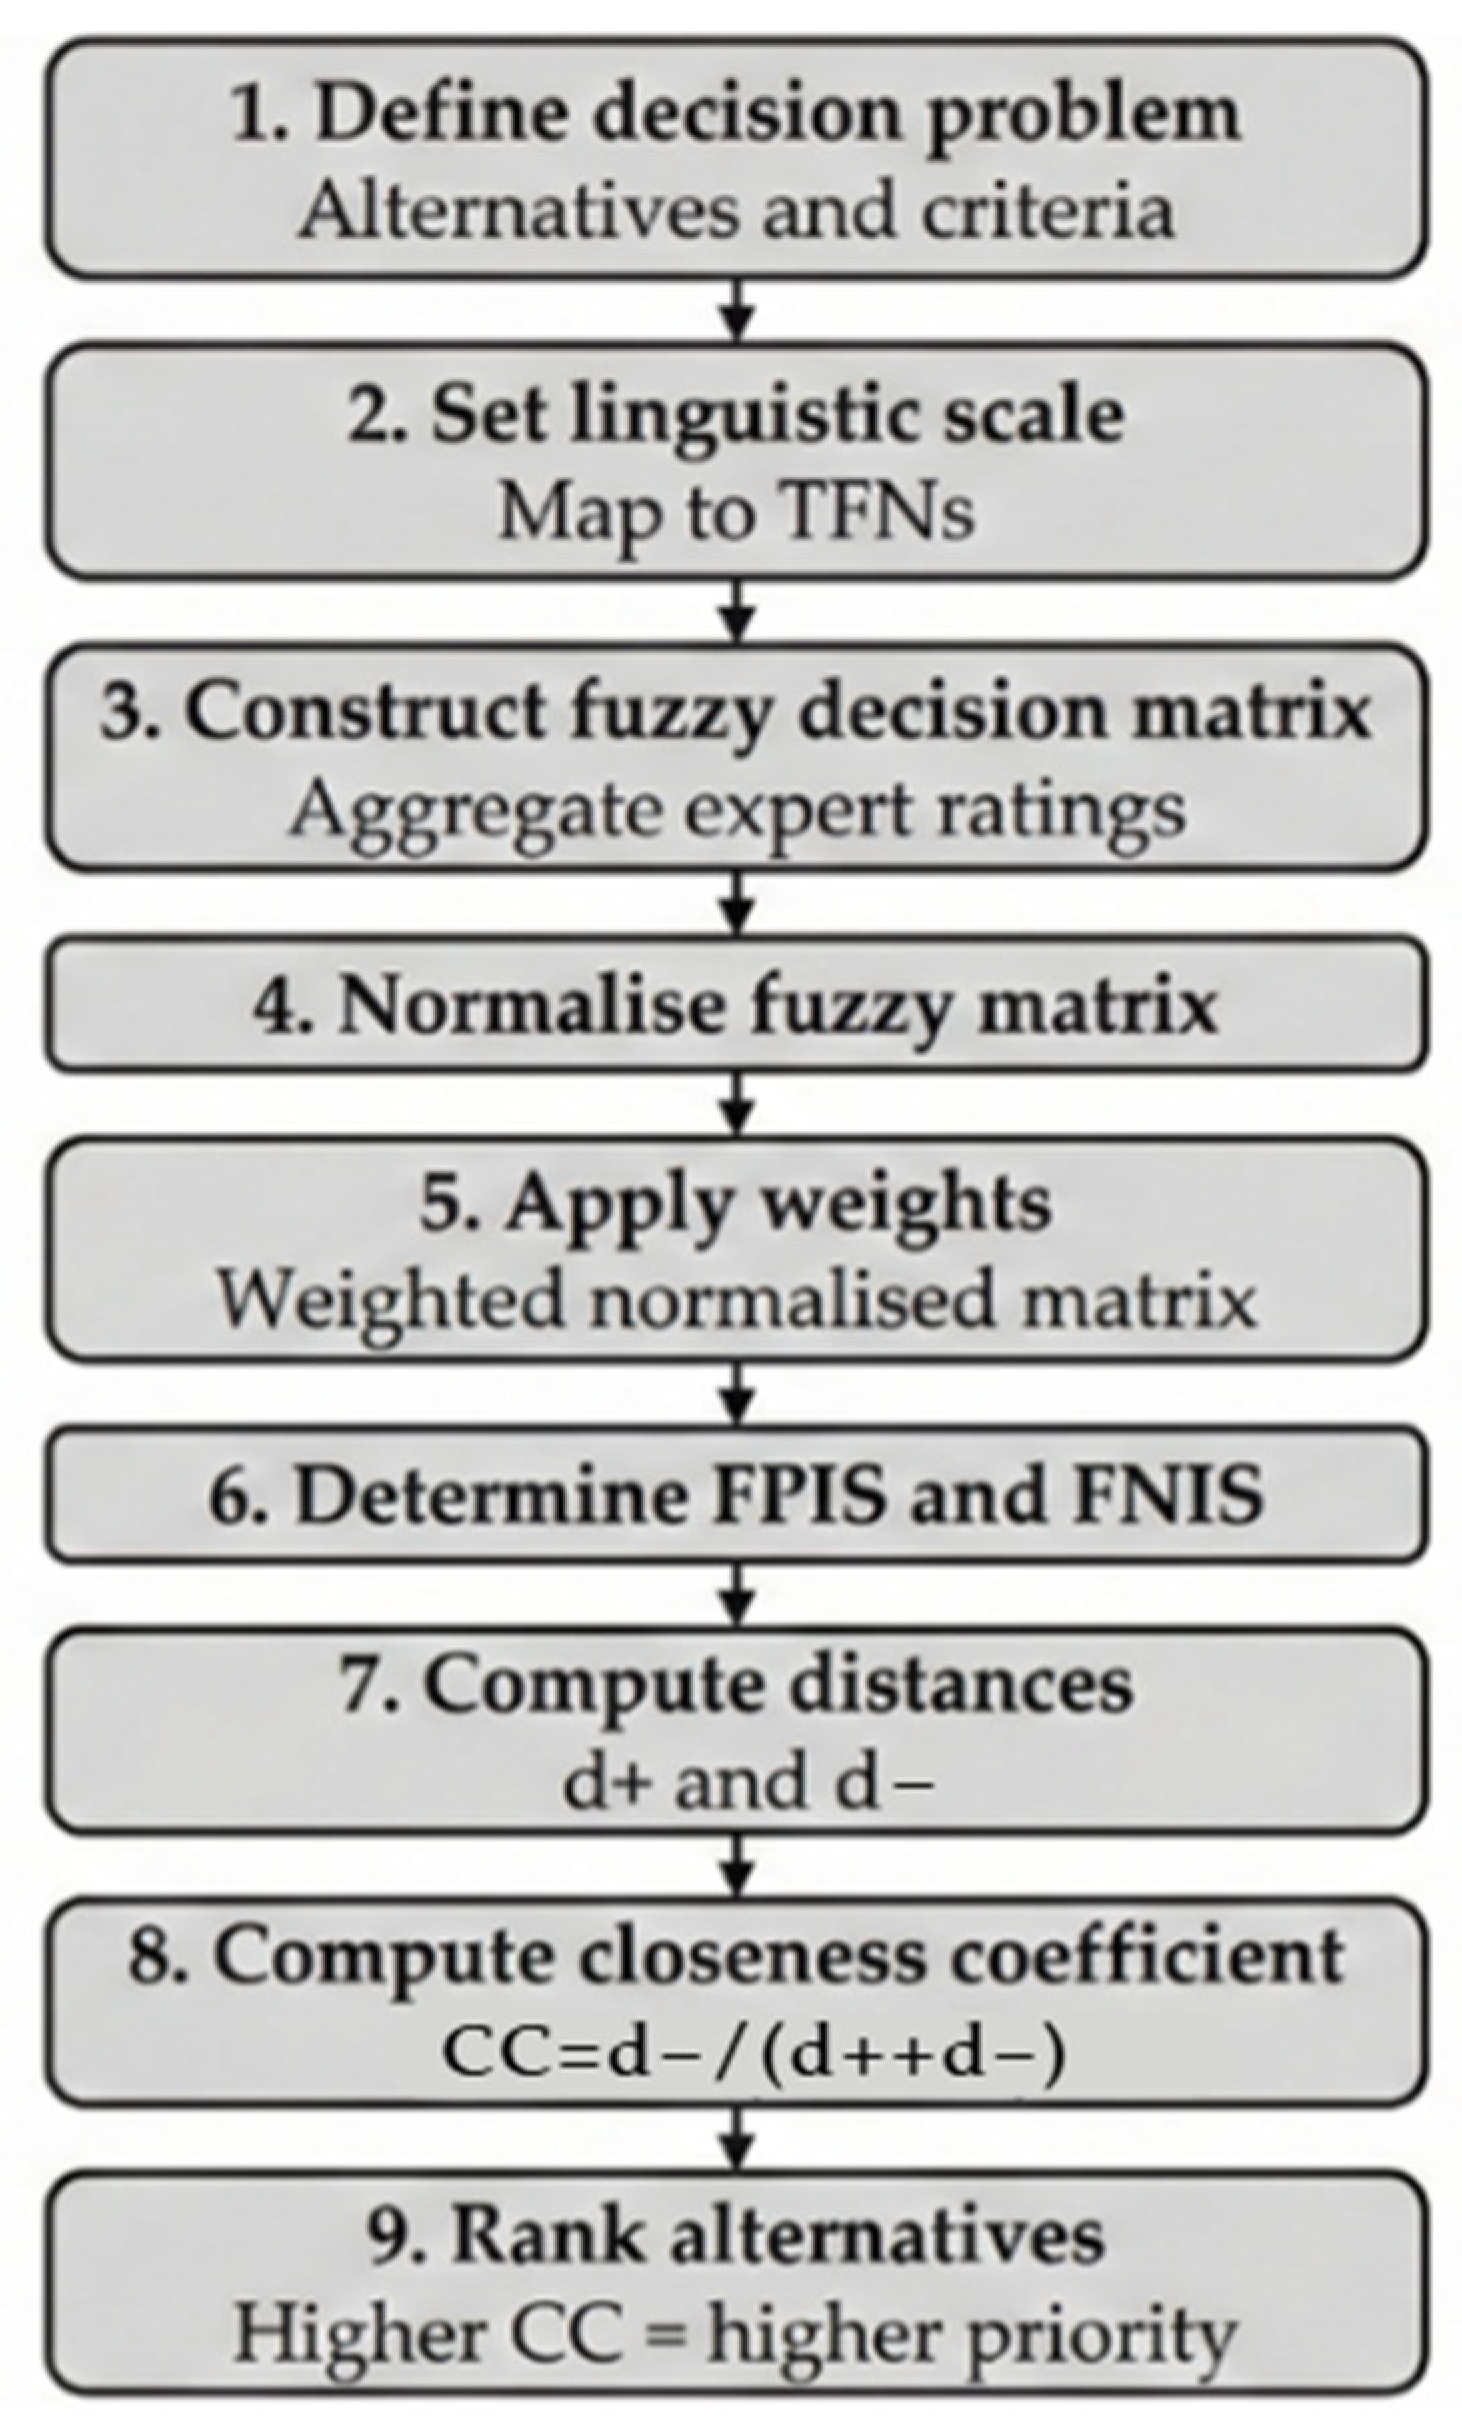
The sequential steps of the Fuzzy TOPSIS computation process used for decision-making analysis in this study presented in Figure 3.
Following the steps detailed in Figure 3, expert linguistic ratings were mapped onto triangular fuzzy numbers, x ~ = (1, m, u), to form the fuzzy decision matrix, where l, m, and u represent the lower, middle value, and upper bounds, respectively.
First, individual expert ratings were aggregated to form the group fuzzy decision matrix. Let K denote the number of experts. The aggregated fuzzy rating for alternative i under criterion j was computed as follows:
x ~ i j = 1 K k = 1 K x ~ i j k
Second, because all criteria were treated as benefit criteria, the fuzzy decision matrix was normalised to obtain the normalised fuzzy matrix r ~ i j as follows:
r ~ i j = l i j u j m a x m i j u j m a x u i j u j m a x
where u j m a x = m a x i ( u i j ) represents the maximum upper bound across alternatives for criterion j .
Third, given equal importance across criteria, the weight of each criterion was set to w j = 1 . The weighted normalised fuzzy matrix v ~ i j was then derived as follows:
v ~ i j = w j ( · ) r ~ i j
Fourth, the fuzzy ideal positive solution and the fuzzy ideal negative solution were identified as follows:
A + = { v ~ j + } , A = { v ~ j }
Finally, separation measures from the fuzzy positive ideal solution and from the fuzzy negative ideal solution were computed, and the relative closeness coefficient C C i was calculated to obtain the final ranking. Specifically, the separation measures were computed as follows:
d i + = j d ( v ~ i j , v ~ j + ) , d i = j d ( v ~ i j , v ~ j )
and the closeness coefficient was obtained as follows:
C C i = d i d i + + d i
The distances to the fuzzy positive ideal solution d i + and fuzzy negative ideal solution d i were then computed for each alternative, and the relative closeness coefficient C C i was derived to obtain the final ranking. The resulting d + , d , and C C values together with the ranked priorities are reported in Table 5 at the construct level and in Table 6 at the indicator item level, providing the basis for subsequent indicator retention and measurement model development.

5. Results

5.1. Fuzzy TOPSIS Ranking Results

Fuzzy TOPSIS produced stable prioritisation of determinants. At the construct level, the average closeness coefficients indicated the highest priority for corporate branding (mean CC = 0.880), followed by social media usage (mean CC = 0.874) and business continuity management (mean CC = 0.857) (Table 5). Leadership was ranked seventh (mean CC = 0.837), while open innovation was ranked eighth (mean CC = 0.836), indicating that experts prioritised branding-related and digital engagement constructs over leadership when judging overall importance. Using the decision threshold reported in Table 6, where item-level closeness coefficient values above 0.75 were classified as ‘Achieved’, all retained indicators exceeded the threshold, indicating strong expert consensus regarding their relevance. At the construct level, the closeness coefficient values were concentrated within a high range from 0.836 to 0.880, suggesting that all eight constructs were regarded as important, although corporate branding, social media usage, and business continuity management received comparatively stronger priority than leadership and open innovation.
At the item level, the highest ranked indicators were SMU1 (mean CC = 0.905) and SMU2 (mean CC = 0.900), followed by CB3 (mean CC = 0.894) and CB5 (mean CC = 0.894); the highest ranked leadership indicator was LD6 (mean CC = 0.872) as presented in Table 6. This ranking pattern indicates that the expert panel assigned especially high importance to customer-facing digital communication and memorable brand presentation. The strong position of business continuity management at the construct level further suggests that continuity readiness was viewed not as a peripheral operational matter, but as a practically important capability alongside branding and digital engagement.

5.2. Sample and Descriptive Statistics

A total of 817 valid responses from digital SMEs in Thailand were retained for analysis. Sample characteristics are summarised in Table 7, respondents’ demographic characteristics are reported in Table 8, and item level descriptive statistics for all measurement indicators are presented in Table 9. Item level descriptive statistics indicate generally high agreement across constructs. The construct level mean scores ranged from 5.90 for business continuity management to 6.17 for leadership on a seven-point Likert scale. Sustainable performance showed a high overall mean of 6.12, suggesting strong perceived sustainability outcomes among the sampled firms, while BCM exhibited comparatively lower mean values of 5.90, implying greater variability and potential improvement space in continuity practices. Within the BCM construct, BCM5, which reflects the ability to restore operations quickly after a crisis event, recorded the lowest mean and the largest standard deviation among the BCM items, indicating that recovery capability may be more uneven across firms than other continuity related practices. By contrast, the relatively high means observed for leadership and sustainable performance items suggest that respondents generally perceived strong managerial orientation and positive performance conditions, even though continuity execution appears comparatively less mature.

5.3. Measurement Model Assessment

Reliability and validity were satisfactory. Internal consistency was high (Cronbach’s alpha = 0.916–0.952; CR = 0.917–0.958), convergent validity was adequate (AVE = 0.669–0.790), and indicator loadings exceeded the recommended threshold.
The measurement model was first evaluated using confirmatory factor analysis. The CFA results indicated an acceptable model fit (Table 10), supporting the adequacy of the measurement structure prior to structural testing. The adequacy of the measurement model is further supported by direct comparison with the stated thresholds in Table 10. Across all constructs, χ2/df values remained below 3.00 and AGFI, CFI, GFI, IFI, NFI, and TLI all exceeded 0.90, while RMSEA values remained below 0.08 and RMR values remained below 0.05. These results indicate that the measurement structure satisfied all predefined fit criteria. Having established satisfactory measurement properties, the analysis proceeded to the Structural Equation Model to test the hypothesised relationships.
The CFA results indicate that all observed items load strongly on their respective constructs, with factor loadings from 0.706 to 0.917, exceeding the recommended criteria of 0.50. The coefficient of determination (R2) value is also acceptable, showing item reliability. CR values ranged from 0.917 to 0.958, and Cronbach’s alpha values ranged from 0.916 to 0.952, confirming high internal consistency. In addition, AVE values were in the range 0.669–0.790, demonstrating good convergent validity. Overall, the measurement model shows satisfactory reliability and validity, indicating that the constructs are well measured and suitable for further structural analysis (presented in Table 11). This conclusion is also supported by the item-level psychometric results. All factor loadings exceeded the recommended minimum criterion of 0.50, while CR values ranged from 0.917 to 0.958, Cronbach’s alpha values ranged from 0.916 to 0.952, and AVE values ranged from 0.669 to 0.790. Together, these results indicate satisfactory item reliability, internal consistency, and convergent validity for the retained measures.

5.4. Structural Model Fit

The structural model demonstrated excellent fit to the data: with χ2 = 1558.210, df = 932, χ2/df = 1.672, GFI = 0.917, AGFI = 0.907, CFI = 0.984, TLI = 0.983, NFI = 0.961, IFI = 0.984, RMSEA = 0.029, and RMR = 0.022, as shown in Table 12.

5.5. Structural Paths and Hypotheses Testing

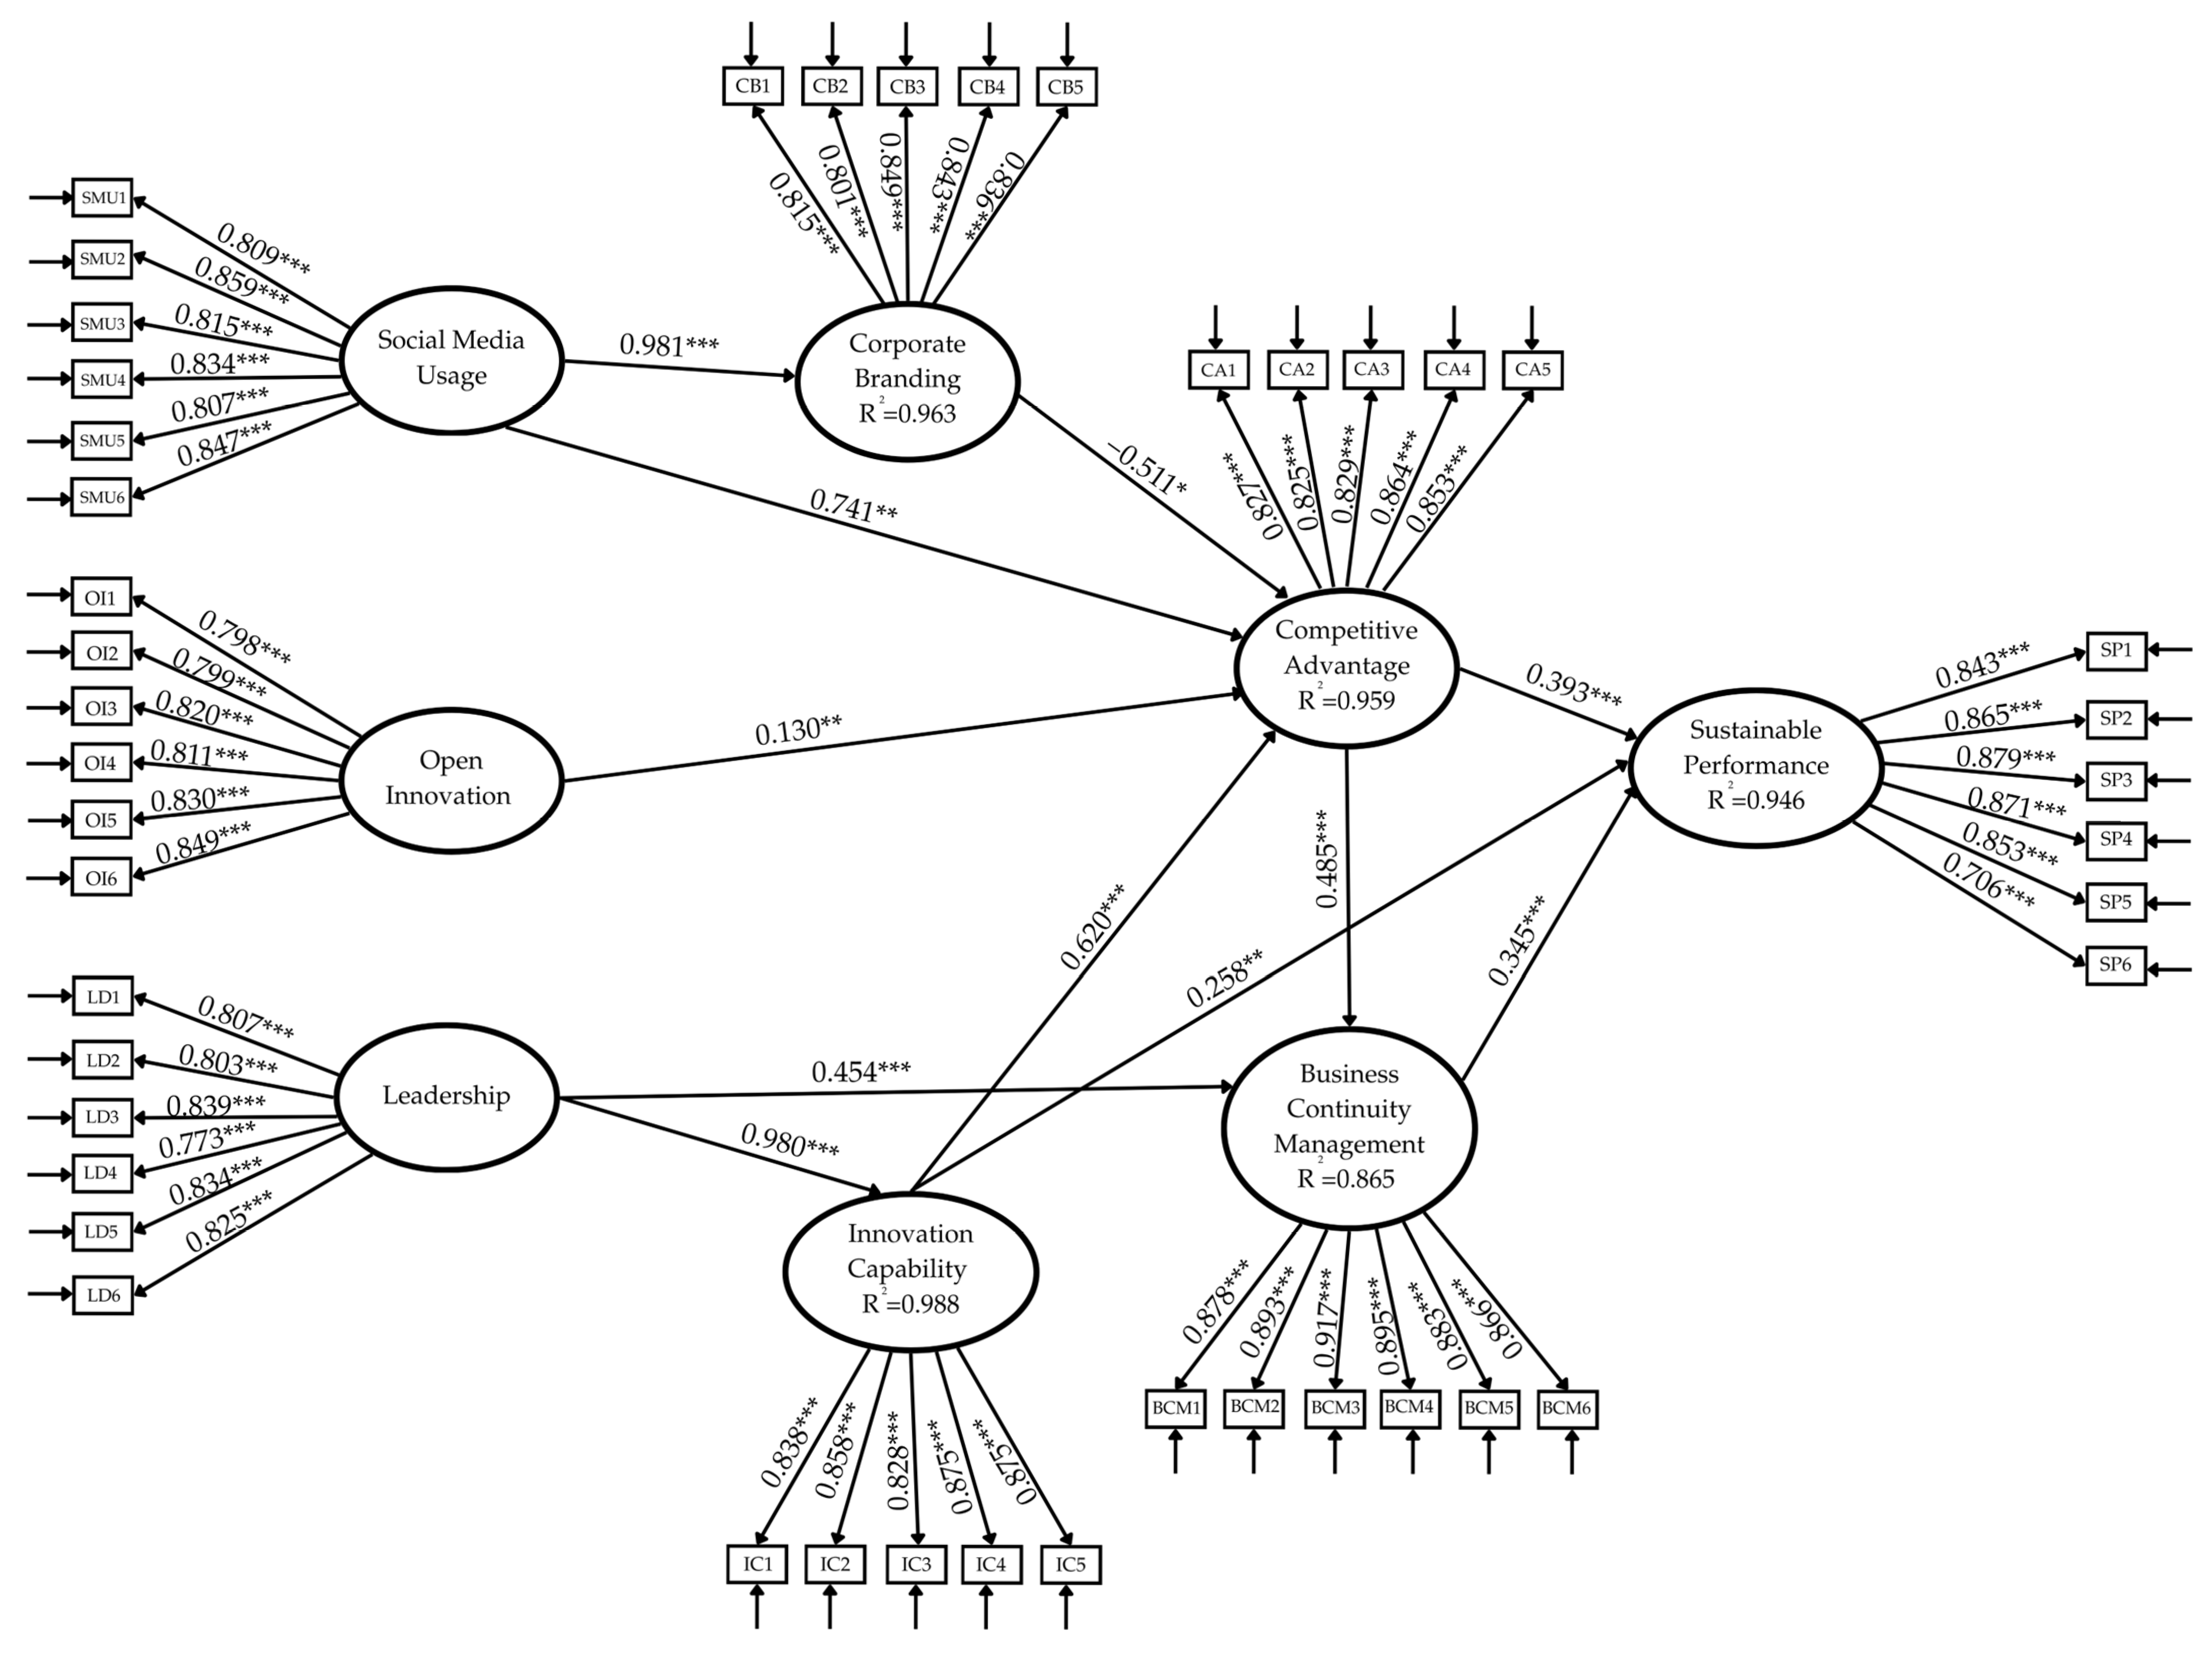
The structural paths were evaluated in accordance with the hypothesised directions in Table 13. Figure 4 illustrates the final structural model with standardised estimates. Social media usage positively influenced corporate branding (H1: β = 0.981, p < 0.001) and competitive advantage (H2: β = 0.741, p < 0.01). Open innovation also showed a positive effect on competitive advantage (H3: β = 0.130, p < 0.01). Leadership positively influenced business continuity management (H4: β = 0.454, p < 0.001) and innovation capability (H5: β = 0.980, p < 0.001). Corporate branding exhibited a negative effect on competitive advantage (H6: β = −0.511, p < 0.05), whereas innovation capability had a positive effect on competitive advantage (H7: β = 0.620, p < 0.001). Competitive advantage positively influenced business continuity management (H8: β = 0.485, p < 0.001). Regarding performance outcomes, innovation capability (H9: β = 0.258, p < 0.01), competitive advantage (H10: β = 0.393, p < 0.001), and business continuity management (H11: β = 0.345, p < 0.001) each had significant positive effects on sustainable performance. Overall, the results support ten of the eleven hypothesised paths. H6 was statistically supported; however, the relationship between corporate branding and competitive advantage was negative, contrary to the hypothesised positive direction.

6. Discussion

6.1. Key Findings

This study provides convergent evidence from expert-based prioritisation and Structural Equation Modelling that sustainable performance in Thai digital SMEs is shaped by an interplay between capability development and continuity-oriented execution. These findings are aligned with prior studies that link continuity capability, resilience-oriented routines, and performance stability under disruption [4,5,12]. At the same time, the present results add to the literature by showing a more integrated pathway in which competitive advantage and business continuity management operate as connected mechanisms through which upstream capabilities are translated into sustainable performance. The structural results indicate that innovation capability, competitive advantage, and business continuity management each exert significant positive effects on sustainable performance, with competitive advantage also strengthening business continuity management as a key execution pathway [16]. The Fuzzy TOPSIS construct-level ranking further clarifies practical priorities, with corporate branding ranked first, followed by social media usage and business continuity management, whereas leadership and open innovation were ranked seventh and eighth, respectively. Taken together, these findings suggest that experts place the highest priority on branding and digital engagement capabilities, while the SEM results highlight how capability building translates into sustained outcomes through competitive advantage and business continuity management [1,6].
Importantly, the results advance a continuity-oriented capability mechanism in which upstream digital and organisational enablers create performance benefits only when they are converted into execution reliability. Specifically, social media usage and open innovation strengthen market positioning through competitive advantage, while leadership enhances innovation capability and continuity readiness, and these intermediate capabilities, in turn, reinforce business continuity management as the routine that stabilises delivery under disruption [16]. In this mechanism, business continuity management functions not merely as an operational safeguard, but as a strategic execution capability that enables Thai digital SMEs to preserve stakeholder confidence, maintain service consistency, and sustain longer-term outcomes in disruption-biassed environments [80].

6.2. Business Continuity Management as the Execution Pathway to Sustainable Performance

The findings position business continuity management as a pivotal execution pathway through which strategic and capability-based antecedents translate into sustainable performance in Thai digital SMEs. This result is consistent with prior studies that view continuity capability and resilience-building routines as important drivers of sustained organisational outcomes under crisis conditions [5,12,80]. The present findings also add specificity by indicating that BCM is not only directly associated with sustainable performance, but is also strengthened by competitive advantage, suggesting that market strength contributes more effectively to long-term outcomes when it is embedded in preparedness and recovery routines. The structural results show that business continuity management has a significant positive effect on sustainable performance, indicating that continuity routines strengthen operational reliability and reduce performance volatility under disruption [26,80]. This supports the interpretation that sustainable outcomes in disruption-biased environments depend not only on possessing capabilities, but also on institutionalising the routines that keep operations stable when interruptions occur.
Notably, competitive advantage also strengthens business continuity management, suggesting that market-based advantages are more likely to yield sustained outcomes when they are embedded in continuity-oriented processes rather than relying on ad hoc responses. In practical terms, firms that achieve stronger positioning through responsiveness, differentiation, or cost discipline appear better able to formalise preparedness, clarify responsibilities, and standardise recovery procedures, thereby converting strategic positioning into dependable execution [58]. This pattern reinforces the central argument that business continuity management operates as an operational resilience capability and strategic execution pathway that enables digital SMEs to stabilise critical operations and execute higher order strategic capabilities under disruption.

6.3. Translating Upstream Capabilities into Sustainable Outcomes and Interpreting the Unexpected Effect

The structural results clarify how upstream capabilities translate into continuity-oriented execution and sustainable outcomes. Leadership strengthens innovation capability and business continuity management, indicating that leadership in Thai digital SME contributes to both internal capability formation and continuity-oriented behaviours. Social media usage enhances corporate branding and competitive advantage, while open innovation further contributes to competitive advantage, suggesting that digital engagement and collaborative innovation improve market sensing, stakeholder responsiveness, and strategic positioning. Competitive advantage then reinforces business continuity management and directly improves sustainable performance, clarifying a coherent conversion chain in which market positioning and innovation readiness are operationalised through continuity routines that stabilise performance under disruption [6].
The negative coefficient from corporate branding to competitive advantage should be interpreted cautiously because it may reflect context-specific trade-offs or statistical suppression. In Thai digital SMEs operating under disruption, branding investments may divert scarce managerial attention and resources toward external signalling at the expense of short-term execution capability, service consistency, or cost competitiveness, which are core elements of advantage in many SME markets [1]. A second explanation is that stronger branding raises stakeholder expectations and transparency, which can expose gaps in delivery capability and thereby reduce perceived advantage when continuity routines remain underdeveloped. Methodologically, a negative sign may also occur when corporate branding is highly correlated with other capability predictors, such that the estimated coefficient represents a residual net effect rather than the total branding contribution [64]. Accordingly, this relationship warrants careful interpretation alongside robustness checks, including latent collinearity diagnostics, heterotrait/monotrait assessment, and alternative model specifications. It is also plausible that the branding advantage relationship is contingent, such that corporate branding supports competitive advantage only when business continuity management maturity is sufficiently high to consistently fulfil brand promises [6]. From a theoretical perspective, this unexpected result suggests that corporate branding may not automatically function as a value-creating strategic asset in all SME contexts, especially when firms operate under resource constraints and disruption pressure. In such conditions, branding may increase visibility and stakeholder expectations without necessarily strengthening competitive advantage unless the firm also possesses sufficient execution capability, innovation capability, and continuity readiness to consistently deliver on the brand promise. This interpretation indicates that the competitive value of branding is contingent on whether it is effectively combined with complementary organisational capabilities; therefore, the H6 result should be interpreted as a context-specific and conditional effect in resource-constrained digital SMEs.

6.4. Implications for Managers and Policymakers

6.4.1. Managerial Implications

For Thai digital SMEs, the findings suggest four priorities. First, business continuity management should be treated as a strategic routine because it directly strengthens sustainable performance and helps convert competitive advantage into reliable execution under disruption. This requires moving beyond informal coping practices and institutionalising continuity activities, including role clarity, scenario-based preparation, recovery procedures, and continuity testing. Second, social media usage and corporate branding should be developed in tandem to strengthen stakeholder trust, market responsiveness, and reputational capital, while ensuring that brand promises are supported by consistent delivery. Third, leadership should prioritise enabling innovation capability and continuity-oriented behaviours, reinforcing learning routines and preparedness practices that allow innovation to be deployed without destabilising operations. Fourth, investments in innovation should be aligned with execution reliability, so that competitive advantage is reinforced by continuity routines rather than undermined by operational fragility.

6.4.2. Policy Implications

For policymakers and support agencies, the results suggest that SME support programmes should couple digitalisation and innovation assistance with practical business continuity management capacity building. This includes continuity standards, training, and accessible toolkits tailored to digital SMEs, enabling firms to institutionalise continuity routines alongside capability building for innovation and market responsiveness [80]. Support agencies can further strengthen SME resilience by promoting applied BCM tools and capability building programmes that emphasise continuity testing, scenario planning, and recovery readiness, thereby improving execution reliability during disruption and supporting sustainable performance outcomes. These implications are most applicable in emerging economy SME contexts characterised by similar resource constraints, digital dependence, and disruption exposure.

7. Conclusions

This study developed and validated an integrated framework explaining sustainable performance in digital SMEs through the combined use of Fuzzy TOPSIS and Structural Equation Modelling. Using expert judgements from a 21-member panel and survey evidence from 817 digital SMEs in Thailand, the results show that sustainable performance is shaped by a capability transmission logic in which leadership strengthens innovation capability, innovation capability enhances competitive advantage, and competitive advantage supports both business continuity management and performance outcomes. Most importantly, business continuity management exerts a positive direct effect on sustainable performance and operates as a critical pathway through which upstream capabilities are converted into sustained outcomes under disruption. More specifically, the results indicate that social media usage strongly improves corporate branding and competitive advantage, leadership strongly improves innovation capability and also supports business continuity management, and competitive advantage contributes both to business continuity management and to sustainable performance. Innovation capability also directly improves sustainable performance. The only hypothesised relationship that was statistically supported in the opposite direction was H6, where corporate branding showed a negative relationship with competitive advantage, contrary to the hypothesised positive direction.
For SME leaders, the findings underscore the need to institutionalise continuity-oriented routines, including preparedness planning, response coordination, and recovery procedures, alongside investments in innovation and market responsiveness. Competitive advantage should be reinforced through reliable operational delivery, particularly in digital channels where disruption can rapidly damage trust. Branding initiatives should be aligned with capability depth and continuity reliability to avoid credibility gaps in disruption-sensitive markets. For policymakers, SME development programmes should integrate digitalisation and innovation support with practical BCM capacity building through training, toolkits, and continuity standards tailored to digital SMEs.
Theoretically, the study refines the positioning of BCM by conceptualising it as an operational resilience capability rather than as a full higher order dynamic capability. This interpretation better reflects the measurement indicators used in the study, which focus on preparedness, recovery routines, crisis response, and continuity execution.

8. Limitations and Recombination for Future Research

This research is subject to several limitations. Its cross-sectional design limits the ability to draw robust causal conclusions, and future work should adopt longitudinal designs to observe continuity building and sustainability outcomes over time. The study also focuses on Thailand, and comparative multi-country research would strengthen the generalisability across emerging economy contexts. In particular, future studies should examine whether the proposed capability pathway holds under different combinations of institutional support, digital infrastructure, and continuity capability maturity in contexts such as Vietnam and Indonesia. However, the applicability of these policy implications beyond Thailand depends on contextual similarity. The conclusions are more likely to transfer to other emerging economies when SMEs face comparable resource constraints, strong dependence on digital channels, and recurrent exposure to disruption.
Further work may incorporate objective performance indicators, disruption exposure measures, and alternative model structures such as higher-order capability constructs. Finally, future studies could examine boundary conditions, including industry turbulence, digital intensity, and resource constraints, to clarify when BCM has the greatest impact on sustainable performance.

Author Contributions

Conceptualisation was undertaken by A.S. in collaboration with S.P.; the methodology was developed by A.S., S.P. and S.L.; A.S. performed the software implementation; validation was carried out by A.S., S.P. and S.L.; formal analysis and investigation were conducted by A.S. and S.P.; A.S. provided the resources and curated the data; A.S. prepared the original draft; A.S., S.P. and S.L. reviewed and edited the manuscript; visualisation was produced by A.S.; and supervision was provided by S.P. and S.L. All authors have read and agreed to the published version of the manuscript.

Funding

This research received no external funding.

Institutional Review Board Statement

The research was carried out in line with the ethical requirements of the Declaration of Helsinki, the Belmont Report, the CIOMS Guidelines, and the International Conference on Harmonisation Good Clinical Practice. Approval to undertake the study was granted by the Rangsit University Ethics Review Board (Certification No. COA. NO. RSUERB2025-175; approved on 29 July 2025).

Informed Consent Statement

Informed consent was obtained from all participants prior to their participation in the study.

Data Availability Statement

The dataset supporting the findings is provided within this article. Requests for further information may be directed to the corresponding author.

Conflicts of Interest

The authors report that they have no competing interests.

References

  1. Paweehirunkrai, T.; Pankham, S. Determinants of Superior Long-Term Business Performance in Thai Small and Medium-Sized Enterprises: An Integrated Analysis Using Fuzzy Rough Set Theory and Second Order Confirmatory Factor Analysis. Sustainability 2025, 17, 2066. [Google Scholar] [CrossRef]
  2. Rahayu, T.; Marka, M.M. The Role of Personal Branding in Increasing Generation Z Career Success. J. Ilm. Manaj. Kesatuan 2024, 12, 673. [Google Scholar] [CrossRef]
  3. Vuttichat, S.; Patchara, P. Causal relationship model of marketing innovation and competitiveness of small and medium enterprises (SMEs) with digital technologies in Thailand. F1000Research 2023, 12, 1040. [Google Scholar] [CrossRef]
  4. Li, G.; Du, K.; Liu, L.; Su, F. Digital transformation and organizational resilience: Unveiling the path to sustainable performance in adversity and crisis. Int. J. Inf. Manag. 2025, 84, 102934. [Google Scholar] [CrossRef]
  5. Tang, G.; Luo, W.; Yaping, Z.; Zhou, Q. Path Constitution: Building Organizational Resilience for Sustainable Performance. Economics 2023, 17, 20220048. [Google Scholar] [CrossRef]
  6. Wibowo, V.; So, I.G.; Kuncoro, E.A.; Bandur, A. Business continuity of culinary SMEs: Empirical study of personal branding, corporate branding, open innovation, and competitive advantage. J. East. Eur. Cent. Asian Res. (JEECAR) 2024, 11, 28. [Google Scholar] [CrossRef]
  7. Boonlua, S.; Supachaiwat, J.; Thongchua, K.; Phothong, L.; Sukprasert, A.; Mohamad, B. Supply Chain Resilience Strategies for Surviving of Industry in Thailand. Int. J. Anal. Appl. 2025, 23, 246. [Google Scholar] [CrossRef]
  8. Hassan, N.D.; Ahmad, S.M.; Hassam, S.F. Resilient by Design: The Role of Digital Transformation in Future-Proofing SMEs. Int. J. Res. Innov. Soc. Sci. 2025, 9, 9381–9392. [Google Scholar] [CrossRef]
  9. OECD. Open and Connected Government Review of Thailand. In OECD Public Governance Reviews; Organization for Economic Cooperation and Development: Paris, France, 2022. [Google Scholar] [CrossRef]
  10. Őri, D.; Szabó, I.; Kő, A.; Kovács, T. Digitalizing in crisis: The role of organizational resilience in SMEs’ digitalization. J. Enterp. Inf. Manag. 2024, 37, 1185. [Google Scholar] [CrossRef]
  11. Garrido-Moreno, A.; Martín-Rojas, R.; Morales, V.J.G. The key role of innovation and organizational resilience in improving business performance: A mixed-methods approach. Int. J. Inf. Manag. 2024, 77, 102777. [Google Scholar] [CrossRef]
  12. Kurniawan, D.; Tambunan, D.B.; Dewi, G.C. Relationships Among Crisis Leadership, Innovation Capability, Implementation of Business Continuity Management, and Sustainable Performance in The COVID-19 Pandemic. South East Asian J. Manag. 2024, 18, 130. [Google Scholar] [CrossRef]
  13. Koporčić, N.; Kukkamalla, P.K.; Marković, S.; Maran, T. Resilience of small and medium-sized enterprises in times of crisis: An umbrella review. Rev. Manag. Sci. 2025, 20, 301–329. [Google Scholar] [CrossRef]
  14. Ozanne, L.K.; Chowdhury, M.; Prayag, G.; Mollenkopf, D.A. SMEs navigating COVID-19: The influence of social capital and dynamic capabilities on organizational resilience. Ind. Mark. Manag. 2022, 104, 116. [Google Scholar] [CrossRef]
  15. Saad, M.H.; Hagelaar, G.; van der Velde, G.; Omta, S.W.F. Conceptualization of SMEs’ business resilience: A systematic literature review. Cogent Bus. Manag. 2021, 8, 1938347. [Google Scholar] [CrossRef]
  16. Corrales-Estrada, A.M.; Santos, L.G.; Torres, C.A.B.; Rodriguez-López, J.E. Sustainability and Resilience Organizational Capabilities to Enhance Business Continuity Management: A Literature Review. Sustainability 2021, 13, 8196. [Google Scholar] [CrossRef]
  17. Nasiri, M.; Saunila, M.; Ukko, J.; Rantala, T.; Rantanen, H. Shaping Digital Innovation Via Digital-related Capabilities. Inf. Syst. Front. 2020, 25, 1063. [Google Scholar] [CrossRef]
  18. Urbinati, A.; Manelli, L.; Frattini, F.; Bogers, M. The digital transformation of the innovation process: Orchestration mechanisms and future research directions. Innovation 2021, 24, 65. [Google Scholar] [CrossRef]
  19. Zomer, T.; Neely, A.; Martinez, V. Digital transforming capability and performance: A microfoundational perspective. Int. J. Oper. Prod. Manag. 2020, 40, 1095. [Google Scholar] [CrossRef]
  20. Franco-Riquelme, J.N.; Tejero, A.; Rubalcaba, L.; Ordieres-Meré, J. Measuring the Connection Between Open Innovation, Dynamic Capabilities, and LinkedIn in Tech-Based Companies. J. Knowl. Econ. 2024, 16, 15540. [Google Scholar] [CrossRef]
  21. Wang, N.; Wan, J.; Ma, Z.; Zhou, Y.; Jin, C. How digital platform capabilities improve sustainable innovation performance of firms: The mediating role of open innovation. J. Bus. Res. 2023, 167, 114080. [Google Scholar] [CrossRef]
  22. Zhang, X.; Chu, Z.; Ren, L.; Xing, J. Open innovation and sustainable competitive advantage: The role of organizational learning. Technol. Forecast. Soc. Change 2022, 186, 122114. [Google Scholar] [CrossRef]
  23. Abbasi, K.; Alam, A.; Bhuiyan, M.B.U. Audit committees, female directors and the types of female and male financial experts: Further evidence. J. Bus. Res. 2020, 114, 186. [Google Scholar] [CrossRef]
  24. Ioannou, I.; Cadena, J.; Aspinall, W.; Lange, D.; Honfí, D.; Rossetto, T. Prioritization of hazards for risk and resilience management through elicitation of expert judgement. Nat. Hazards 2022, 112, 2773. [Google Scholar] [CrossRef]
  25. Kumar, V.; Sindhwani, R.; Behl, A.; Kaur, A.; Pereira, V. Modelling and analysing the enablers of digital resilience for small and medium enterprises. J. Enterp. Inf. Manag. 2023, 37, 1677. [Google Scholar] [CrossRef]
  26. Visuthiphol, S.; Pankham, S. Assessing Digital Business Sustainability in Thai SMEs: A Study Using Rough Set-Delphi Method and Confirmatory Factor Analysis. J. Posthumanism 2025, 5, 479–500. [Google Scholar] [CrossRef]
  27. Helgeson, J.; Fung, J.F.; Henriquez, A.R.R.; Zycherman, A.; Nierenberg, C.; Butry, D.T.; Ramkissoon, D.; Zhang, Y. Longitudinal Study of Complex Event Resilience of Small- and Medium-Sized Enterprises: Natural Disaster Planning and Recovery During the COVID-19 Pandemic (Wave 2); National Institute of Standards and Technology: Gaithersburg, MD, USA, 2021. [Google Scholar] [CrossRef]
  28. Mošková, E.; Bugánová, K. Improving Business Sustainability by Connecting Business Continuity Management and Risk Management. WSB J. Bus. Financ. 2023, 57, 38. [Google Scholar] [CrossRef]
  29. Madhavan, M.; Sharafuddin, M.A.; Wangtueai, S. Factors Influencing Cross-Border E-Commerce Adoption of Thai MSMEs: A Fuzzy DEMATEL Approach. Sustainability 2025, 17, 3632. [Google Scholar] [CrossRef]
  30. Marolt, M.; Zimmermann, H.; Pucihar, A. Social Media Use and Business Performance in SMEs: The Mediating Roles of Relational Social Commerce Capability and Competitive Advantage. Sustainability 2022, 14, 15029. [Google Scholar] [CrossRef]
  31. Martín-Rojas, R.; Garrido-Moreno, A.; Morales, V.J.G. Social media use, corporate entrepreneurship and organizational resilience: A recipe for SMEs success in a post-COVID scenario. Technol. Forecast. Soc. Change 2023, 190, 122421. [Google Scholar] [CrossRef]
  32. Borah, P.S.; Iqbal, S.; Akhtar, S. Linking social media usage and SME’s sustainable performance: The role of digital leadership and innovation capabilities. Technol. Soc. 2022, 68, 101900. [Google Scholar] [CrossRef]
  33. Dubbelink, S.I.; Herrando, C.; Constantinides, E. Social Media Marketing as a Branding Strategy in Extraordinary Times: Lessons from the COVID-19 Pandemic. Sustainability 2021, 13, 10310. [Google Scholar] [CrossRef]
  34. Cartwright, S.; Davies, I.; Archer-Brown, C. Managing relationships on social media in business-to-business organisations. J. Bus. Res. 2020, 125, 120. [Google Scholar] [CrossRef]
  35. Febrian, A.; Nani, D.A.; Lina, L.F.; Husna, N. The Role of Social Media Activities to Enhance Brand Equity. J. Econ. Bus. Account. Ventur. 2022, 25, 20. [Google Scholar] [CrossRef]
  36. Risdwiyanto, A.; Sulaeman, M.M.; Rachman, A. Sustainable Digital Marketing Strategy for Long-Term Growth of MSMEs. J. Contemp. Adm. Manag. (ADMAN) 2023, 1, 180. [Google Scholar] [CrossRef]
  37. Fluhrer, P.; Brahm, T. How small businesses build their brands in a digital world: A systematic review. Rev. Manag. Sci. 2026, 20, 1965–2000. [Google Scholar] [CrossRef]
  38. Lim, J.; Pham, P.; Heinrichs, J.H. Impact of social media activity outcomes on brand equity. J. Prod. Brand Manag. 2020, 29, 927. [Google Scholar] [CrossRef]
  39. Ardley, B.; Hardwick, J. The Honeycomb and the SME: Facilitating Growth Through Social Media in a High Technology Enterprise. J. Manag. Strategy 2024, 15, 29. [Google Scholar] [CrossRef]
  40. Garrido-Moreno, A.; Morales, V.J.G.; King, S.F.; Lockett, N. Social Media use and value creation in the digital landscape: A dynamic-capabilities perspective. J. Serv. Manag. 2020, 31, 313. [Google Scholar] [CrossRef]
  41. Li, F.; Larimo, J.; Leonidou, L.C. Social media marketing strategy: Definition, conceptualization, taxonomy, validation, and future agenda. J. Acad. Mark. Sci. 2020, 49, 51. [Google Scholar] [CrossRef]
  42. Bakashaba, R.; Bindeeba, D.S. Beyond market penetration: Leveraging brand capital for competitive advantage in digitally driven SMES in resource-constrained settings. Future Bus. J. 2025, 11, 240. [Google Scholar] [CrossRef]
  43. Cao, G.; Weerawardena, J. Strategic use of social media in marketing and financial performance: The B2B SME context. Ind. Mark. Manag. 2023, 111, 41. [Google Scholar] [CrossRef]
  44. Drummond, C.; O’Toole, T.; McGrath, H. Digital engagement strategies and tactics in social media marketing. Eur. J. Mark. 2020, 54, 1247. [Google Scholar] [CrossRef]
  45. Fan, M.; Qalati, S.A.; Khan, M.A.S.; Shah, S.M.M.; Ramzan, M.; Khan, R.S. Effects of entrepreneurial orientation on social media adoption and SME performance: The moderating role of innovation capabilities. PLoS ONE 2021, 16, e0247320. [Google Scholar] [CrossRef]
  46. Jabeen, F.; Belás, J.; Santoro, G.; Alam, G.M. The role of open innovation in fostering SMEs’ business model innovation during the COVID-19 pandemic. J. Knowl. Manag. 2022, 27, 1562. [Google Scholar] [CrossRef]
  47. Albats, E.; Podmetina, D.; Vanhaverbeke, W. Open innovation in SMEs: A process view towards business model innovation. J. Small Bus. Manag. 2021, 61, 2519. [Google Scholar] [CrossRef]
  48. Annamalah, S.; Aravindan, K.L.; Ahmed, S. Driving open innovation in SMEs: The role of organizational and strategic dynamics. J. Innov. Entrep. 2025, 14, 119. [Google Scholar] [CrossRef]
  49. Bertello, A.; Ferraris, A.; Bernardi, P.D.; Bertoldi, B. Challenges to open innovation in traditional SMEs: An analysis of pre-competitive projects in university-industry-government collaboration. Int. Entrep. Manag. J. 2021, 18, 89. [Google Scholar] [CrossRef]
  50. Stoeber, T.; Kanbach, D.K. Innovating beyond boundaries: Enhancing firms’ dynamic capabilities through open innovation. Manag. Rev. Q. 2025. [Google Scholar] [CrossRef]
  51. Teece, D.J. Hand in Glove: Open Innovation and the Dynamic Capabilities Framework. Strateg. Manag. Rev. 2020, 1, 233. [Google Scholar] [CrossRef]
  52. Yao, N.; Yan, J.; Tsinopoulos, C.; Bai, J. The organizational determinants of open innovation: A literature framework and future research directions. J. Chin. Econ. Bus. Stud. 2023, 22, 1–29. [Google Scholar] [CrossRef]
  53. Hutton, S.; Demir, R.; Eldridge, S. How does open innovation contribute to the firm’s dynamic capabilities? Technovation 2021, 106, 102288. [Google Scholar] [CrossRef]
  54. Rumanti, A.A.; Rizana, A.F.; Achmad, F. Exploring the role of organizational creativity and open innovation in enhancing SMEs performance. J. Open Innov. Technol. Mark. Complex. 2023, 9, 100045. [Google Scholar] [CrossRef]
  55. Alblooshi, M.A.J.A.; Mohamed, A.M.; Yusr, M.M. Leadership, Crisis Management, and Business Continuity. South Asian J. Soc. Sci. Humanit. 2023, 4, 112. [Google Scholar] [CrossRef]
  56. Ivanova, N. People-centred business continuity: A case for inclusive design. Des. Manag. J. 2022, 17, 30. [Google Scholar] [CrossRef]
  57. Iyer, S.S. The multifaceted perspectives of future business continuity- aftermath of COVID-19. Arts Humanit. Open Access J. 2024, 6, 93. [Google Scholar] [CrossRef]
  58. Loyarte, E.; Gurrutxaga, N.; Funcia, J. Continuity Governance model: A new process stage in the BCM system that underpins organizational resilience. Cogent Bus. Manag. 2024, 11, 2434731. [Google Scholar] [CrossRef]
  59. Saka, T.N.; Hormiga, E.; Valls-Pasola, J. Crisis response strategies: A digital reluctance perspective. Rev. Manag. Sci. 2024, 19, 2569. [Google Scholar] [CrossRef]
  60. Hoa, L.T.; Hoang, P.V.H.; Nguyen, M.Q. Factors affecting innovation capacity: Empirical evidence from small and medium enterprises in Vietnam. Probl. Perspect. Manag. 2025, 23, 297. [Google Scholar] [CrossRef]
  61. Osiyevskyy, O.; Sinha, K.K.; Shirokova, G.; Shtepa, S. Innovation capabilities decoded: Risks and rewards in small and medium enterprise performance. Eur. Manag. J. 2025, 44, 245–259. [Google Scholar] [CrossRef]
  62. Soni, V.; Gnekpe, C.; Roux, M.; Anand, R.; Yaroson, E.V.; Banwet, D.K. Adaptive distributed leadership and circular economy adoption by emerging SMEs. J. Bus. Res. 2022, 156, 113488. [Google Scholar] [CrossRef]
  63. Handini, Y.D.; Pangestuti, E.; Suharyono, S.; Sunarti, S. Branding Capability, Innovation and Business Performance. In Proceedings of the 3rd Annual International Conference on Public and Business Administration (AICoBPA 2020); Advances in Economics, Business and Management Research; Atlantis Press: Dordrecht, The Netherlands, 2021. [Google Scholar] [CrossRef]
  64. Yu, Z. Mediating Role of Customer Value Co-creation and Internal Branding Between Brand Orientation and Brand Performance: Moderating Effect of Enterprise Innovative Capabilities-Evidence From Agri Product Users. Front. Psychol. 2022, 13, 938225. [Google Scholar] [CrossRef]
  65. Zeesahn, M.; Qureshi, T.W.; Bashir, S.; Ahmed, U. Transformational Leadership and Corporate Reputation: Mediation Effects of Employer Branding. J. Manag. Res. 2020, 7, 184. [Google Scholar] [CrossRef]
  66. Tolossa, A.T.; Singh, M.; Gautam, R.K. Unveiling the Nexus: The crucial role of competitive advantage in bridging entrepreneurial marketing practices and sustainable firm performance in small and medium enterprises. J. Innov. Entrep. 2024, 13, 43. [Google Scholar] [CrossRef]
  67. Suryani, T.; Fauzi, A.A.; Nurhadi, M. Enhancing Brand Image in the Digital Era: Evidence from Small and Medium-sized Enterprises (SMEs) in Indonesia. Gadjah Mada Int. J. Bus. 2021, 23, 314. [Google Scholar] [CrossRef]
  68. Barros, T.; Rodrigues, P.; Duarte, N.; Shao, X.; Martins, F.V.; Barandas-Karl, H.; Yue, X. The Impact of Brand Relationships on Corporate Brand Identity and Reputation—An Integrative Model. J. Risk Financ. Manag. 2020, 13, 133. [Google Scholar] [CrossRef]
  69. Tahir, A.H.; Adnan, M.; Saeed, Z. The impact of brand image on customer satisfaction and brand loyalty: A systematic literature review. Heliyon 2024, 10, e36254. [Google Scholar] [CrossRef] [PubMed]
  70. Ferreira, J.; Coelho, A. Dynamic capabilities, innovation and branding capabilities and their impact on competitive advantage and SME’s performance in Portugal: The moderating effects of entrepreneurial orientation. Int. J. Innov. Sci. 2020, 12, 255. [Google Scholar] [CrossRef]
  71. Heenkenda, H.M.N.M.; Xu, F.; Kulathunga, K.M.M.C.B.; Senevirathne, W.L. The Role of Innovation Capability in Enhancing Sustainability in SMEs: An Emerging Economy Perspective. Sustainability 2022, 14, 10832. [Google Scholar] [CrossRef]
  72. Nasir, M.; Arief, M.; Alamsjah, F.; Elidjen, E. Systematic Literature Review: The Role of Innovation and Competitive Advantage of Micro, Small, and Medium Enterprises as Mediation Variables. Quant. Econ. Manag. Stud. 2024, 5, 600. [Google Scholar] [CrossRef]
  73. Apidana, Y.H.; Rusvinasari, D. Social Media Usage On MSMEs’ Performance: The Moderating Role of Innovation Capability. J. Manaj. 2024, 28, 175. [Google Scholar] [CrossRef]
  74. Manshor, M.; Saad, M.N. Determinants of Sustainable Development among Malaysian Small and Medium Enterprises: A New Conceptual Framework. Inf. Manag. Bus. Rev. 2023, 15, 94. [Google Scholar] [CrossRef]
  75. Potjanajaruwit, P. Innovation and Marketing Capabilities of Small and Medium-sized Enterprises (SMEs) in Thailand. Int. J. Membr. Sci. Technol. 2023, 10, 1721. [Google Scholar] [CrossRef]
  76. Al-kalouti, J.; Kumar, V.; Kumar, N.; Garza-Reyes, J.A.; Upadhyay, A.; Zwiegelaar, J. Investigating innovation capability and organizational performance in service firms. Strateg. Change 2020, 29, 103. [Google Scholar] [CrossRef]
  77. Hermundsdottir, F.; Aspelund, A. Sustainability innovations and firm competitiveness: A review. J. Clean. Prod. 2020, 280, 124715. [Google Scholar] [CrossRef]
  78. Budiarto, D.S.; Septiani, R.D.; Yennisa; Herawan, T. Competitive Advantage as a Bridge to Increase SMEs Sustainability. Int. J. Sustain. Dev. Plan. 2024, 19, 2597. [Google Scholar] [CrossRef]
  79. Cuandra, F.; Candy, C. Strategies and Innovations for Enhancing Sustainable Performance in SMEs During The 4.0 Digital Business Era. J. Organ. Manaj. 2024, 20, 1–16. [Google Scholar] [CrossRef]
  80. Ali, Q.S.A.; Hanafiah, M.H.; Mogindol, S.H. Systematic literature review of Business Continuity Management (BCM) practices: Integrating organisational resilience and performance in Small and medium enterprises (SMEs) BCM framework. Int. J. Disaster Risk Reduct. 2023, 99, 104135. [Google Scholar] [CrossRef]
  81. Rumman, A.A.; Alsmairat, M.A.K.; Alshawabkeh, R.; Al-Abbadi, L. Digital transformation in SMEs: Assessing the impact of big data capabilities on project success, business continuity, and sustainability. Int. J. Data Netw. Sci. 2024, 8, 2701. [Google Scholar] [CrossRef]
  82. Doering, D. Leveraging business continuity management for climate-related financial reporting. J. Bus. Contin. Emerg. Plan. 2023, 17, 102. [Google Scholar] [CrossRef]
  83. Twaissi, N.M.; ALawad, A. Lesson learned from COVID-19 pandemic and its impact on business continuity management BCM in the tourism sector in Jordan. Uncertain Supply Chain Manag. 2023, 11, 1383. [Google Scholar] [CrossRef]
  84. Galaitsi, S.; Pinigina, E.; Keisler, J.M.; Pescaroli, G.; Keenan, J.M.; Linkov, I. Business Continuity Management, Operational Resilience, and Organizational Resilience: Commonalities, Distinctions, and Synthesis. Int. J. Disaster Risk Sci. 2023, 14, 713. [Google Scholar] [CrossRef]
  85. Skinner, R.; Nelson, R.R.; Chin, W.W.; Land, L.P.W. The Delphi Method Research Strategy in Studies of Information Systems. Commun. Assoc. Inf. Syst. 2015, 37, 31–63. [Google Scholar] [CrossRef]
  86. Roldán López de Hierro, A.F.; Sánchez, M.; Puente-Fernández, D.; Montoya-Juárez, R.; Roldán, C. A Fuzzy Delphi Consensus Methodology Based on a Fuzzy Ranking. Mathematics 2021, 9, 2323. [Google Scholar] [CrossRef]
  87. Chen, C.A. Extensions of the TOPSIS for group decision-making under fuzzy environment. Fuzzy Sets Syst. 2000, 114, 1–9. [Google Scholar] [CrossRef]
  88. Wang, T.-C.; Lee, H.-D. Developing a fuzzy TOPSIS approach based on subjective weights and objective weights. Expert Syst. Appl. 2008, 36, 8980. [Google Scholar] [CrossRef]
  89. Kock, N. A Note on How to Conduct a Factor-Based PLS-SEM Analysis. Int. J. E-Collab. 2015, 11, 1–9. [Google Scholar] [CrossRef]
  90. Goretzko, D.; Siemund, K.; Sterner, P. Evaluating Model Fit of Measurement Models in Confirmatory Factor Analysis. Educ. Psychol. Meas. 2023, 84, 123. [Google Scholar] [CrossRef]
  91. Hooper, D.; Coughlan, J.; Mullen, M.R. Structural Equation Modeling: Guidelines for Determining Model Fit. Electron. J. Bus. Res. Methods 2008, 6, 53–60. [Google Scholar] [CrossRef]
  92. Sathyanarayana, S.; Mohanasundaram, T. Fit Indices in Structural Equation Modeling and Confirmatory Factor Analysis: Reporting Guidelines. Asian J. Econ. Bus. Account. 2024, 24, 561. [Google Scholar] [CrossRef]
Figure 1. Conceptual framework and hypotheses (Source: Author).
Sustainability 18 05949 g001
Figure 2. Research design and analysis workflow (Source: Author).
Sustainability 18 05949 g002
Figure 3. Fuzzy TOPSIS computation steps (Source: Author). Note: All criteria were treated as benefit criteria and assigned equal weights. FPIS denotes the fuzzy positive ideal solution, FNIS the fuzzy negative ideal solution, and CC the closeness coefficient.
Sustainability 18 05949 g003
Figure 4. Final structural model with standardised estimates (Source: Author). Note: The figure presents the final structural model with standardised estimates, corresponding to the hypothesis testing results reported in the section on structural paths and in Table 13. Values on the arrows represent standardised path coefficients. Asterisks indicate statistical significance: * p < 0.05, ** p < 0.01, *** p < 0.001. R2 values are reported inside the endogenous constructs.
Sustainability 18 05949 g004
Table 1. Construct definitions and theoretical foundations (Source: Author).
ConstructDefinition
Social Media Usage (SMU)Extent to which SMEs use social media platforms for communication, engagement, and market sensing
Open Innovation (OI)Degree of inbound and outbound knowledge collaboration with external stakeholders
Leadership (LD)Leadership behaviours supporting capability building and coordination under uncertainty
Corporate Branding (CB)Organisational branding capability that shapes stakeholder perceptions and trust
Innovation Capability (IC)Capacity to design and put into practice new products, services, or processes
Competitive Advantage (CA)Perceived superiority relative to competitors in differentiation, responsiveness, or cost position
Business Continuity Management (BCM)Preparedness and recovery routines that sustain critical operations during disruptions
Sustainable Performance (SP)Long-term performance outcomes reflecting resilience, competitiveness, and sustainability orientation
Table 2. Expert profile and eligibility criteria (Source: Author).
Expert GroupNumber of ExpertsEligibility Criteria
University professors7At least 3 years’ experience in business or information technology-related fields
Government officials7At least 3 years’ experience in industries related to business
SME business owners7More than 20 years’ experience in managing SMEs
Table 3. Linguistic scale and triangular fuzzy numbers for Fuzzy TOPSIS (Source: Author).
Linguistic TermNumeric ScaleTriangular Fuzzy Number
(l, m, u)
Very low1(0.00, 0.00, 0.10)
Low2(0.00, 0.10, 0.30)
Moderately low3(0.10, 0.30, 0.50)
Medium4(0.30, 0.50, 0.70)
Moderately high5(0.50, 0.70, 0.90)
High6(0.70, 0.90, 1.00)
Very high7(0.90, 1.00, 1.00)
Note: Linguistic terms were converted to triangular fuzzy numbers (l, m, u) to operationalize expert judgements in the Fuzzy TOPSIS procedure. The numeric scale ranges from 1 (very low) to 7 (very high).
Table 4. Measurement items and sources (Source: Author).
CodeConstructNumber of ItemsIndicator Codes
SMUSocial Media Usage6SMU1 to SMU6
OIOpen Innovation6OI1 to OI6
LDLeadership6LD1 to LD6
CBCorporate Branding5CB1 to CB5
ICInnovation Capability5IC1 to IC5
CACompetitive Advantage5CA1 to CA5
BCMBusiness Continuity Management6BCM1 to BCM6
SPSustainable Performance6SP1 to SP6
Table 5. Construct-level prioritisation based on Fuzzy TOPSIS (n = 21 experts) (Source: Author).
RankConstructNumber of ItemsMean CCSD
1Corporate Branding (CB)50.8800.015
2Social Media Usage (SMU)60.8740.029
3Business Continuity Management (BCM)60.8570.006
4Innovation Capability (IC)50.8520.007
5Sustainable Performance (SP)60.8480.012
6Competitive Advantage (CA)50.8440.013
7Leadership (LD)60.8370.019
8Open Innovation (OI)60.8360.015
Note: Construct priorities were derived from average closeness coefficients (CC). Higher CC values indicate higher priority in the Fuzzy TOPSIS ranking.
Table 6. Item-level Fuzzy TOPSIS results grouped by construct (n = 21 experts) (Source: Author).
ConstructItemRank (Overall)d+dCC
>0.75
Result
SMUSMU110.0980.9340.904Achieved
SMU220.1030.9300.899Achieved
SMU350.1100.9250.893Achieved
SMU4180.1500.8940.855Achieved
SMU5260.1560.8900.850Achieved
SMU6340.1700.8810.837Achieved
OIOI2170.1470.8960.858Achieved
OI1240.1540.8920.852Achieved
OI5370.1750.8770.833Achieved
OI3390.1800.8720.828Achieved
OI6430.1860.8690.823Achieved
OI4440.1880.8680.821Achieved
LDLD670.1330.9080.871Achieved
LD3330.1630.8850.843Achieved
LD2360.1750.8770.833Achieved
LD4380.1770.8760.831Achieved
LD5420.1850.8710.824Achieved
LD1450.1910.8650.818Achieved
CBCB330.1090.9250.894Achieved
CB540.1090.9250.894Achieved
CB460.1230.9160.880Achieved
CB180.1390.9020.865Achieved
CB2100.1420.9010.863Achieved
ICIC3150.1460.8970.859Achieved
IC5160.1470.8970.858Achieved
IC2210.1530.8930.853Achieved
IC4280.1620.8860.845Achieved
IC1320.1630.8850.843Achieved
CACA4140.1450.8980.860Achieved
CA1250.1550.8920.851Achieved
CA3290.1620.8850.844Achieved
CA5350.1710.8790.836Achieved
CA2410.1820.8730.827Achieved
BCMBCM5110.1430.9000.862Achieved
BCM6120.1430.9000.862Achieved
BCM3130.1450.8990.860Achieved
BCM1190.1510.8940.855Achieved
BCM4220.1530.8930.853Achieved
BCM2270.1590.8890.847Achieved
SPSP690.1420.9010.863Achieved
SP5200.1530.8930.853Achieved
SP4230.1540.8920.852Achieved
SP2300.1620.8870.844Achieved
SP1310.1620.8870.844Achieved
SP3400.1810.8720.828Achieved
Note: CC denotes closeness coefficient, d+ denotes distance to the fuzzy positive ideal solution (FPIS), and d− denotes distance to the fuzzy negative ideal solution (FNIS). Rankings are reported in descending order of CC.
Table 7. Sample characteristics (Source: Author).
CharacteristicValue
Valid responses817
Country contextThailand
Target populationDigital SMEs
Note: The final dataset comprised 817 valid responses from digital SMEs in Thailand and was used for all subsequent analyses.
Table 8. Descriptive summary of respondents’ demographic characteristics (Source: Author).
Demographic VariableCategoryNumber of Respondents (n)Percentage (%)
Place of residence
(Region in Thailand)
Central Region13917.0
Northern Region14217.4
Eastern Region18222.3
Northeastern Region16620.3
Western Region11414.0
Southern Region749.1
GenderMale39948.8
Female35042.8
Alternative gender688.3
Age18 to 28 years647.8
29 to 45 years52964.7
46 to 60 years21826.7
61 years and above60.7
Marital statusSingle23028.2
Married56068.5
Widowed or divorced273.3
Education levelBelow bachelor’s degree587.1
Bachelor’s degree54166.2
Master’s degree19523.9
Doctoral degree232.8
Position in the businessBusiness owner56769.4
Partner25030.6
Type of operationManufacturing (production of goods)36344.4
Services33641.1
Trading (wholesale trade)11814.4
Annual sales revenueLess than 50 million baht75692.5
51 to 100 million baht566.9
100 to 200 million baht40.5
More than 200 million baht10.1
Number of employees in the businessNo more than 5 employees728.8
6 to 50 employees67682.7
51 to 100 employees658.0
More than 100 employees40.5
Total 817100.0
Note: Values are reported as respondent count (n) and proportion (percent).
Table 9. Descriptive statistics for measurement items (n = 817) (Source: Author).
ItemnMeanSD
Social Media Usage (SMU)
SMU1: Your business uses social media to promote its products or services.8176.1910.926
SMU2: Your business uses social media to run advertisements and support sales campaigns.8176.2080.998
SMU3: Your business uses social media to attract new customers.8176.0871.013
SMU4: Your business uses social media to strengthen relationships with customers.8176.0821.044
SMU5: Your business uses social media to collect feedback from customers.8176.0671.023
SMU6: Your business uses social media to analyse customer behaviour.8176.0801.043
Corporate Branding (CB)
CB1: Your business has an online branding strategy that aligns with the nature of your business.8175.9251.08
CB2: Your business designs its brand on online platforms in a way that reflects the identity of the business.8176.0661.04
CB3: Your business designs its brand on online platforms in a way that is easy for customers to remember.8176.1331.018
CB4: Your business is well recognised on online platforms.8176.1061.019
CB5: Your business has a positive image on online platforms.8176.0721.071
Open Innovation (OI)
OI1: Your business places importance on adopting open innovation from external organisations for use in the business.8175.8641.095
OI2: Your business supports open innovation knowledge sharing with external organisations.8176.0860.976
OI3: Your business uses open innovation to develop products or services.8176.0661.029
OI4: Your business applies open innovation to improve organisational operational efficiency.8176.0061.052
OI5: Your business uses open innovation to help reduce the costs of producing products or services.8176.0750.992
OI6: Your business uses open innovation through collaboration with external partners to create new products or services for the business.8176.0581.034
Leadership (LD)
LD1: You have a clear vision for managing the business.8176.1370.983
LD2: You are able to make timely and appropriate decisions in response to business changes.8176.1550.986
LD3: You consistently demonstrate creativity in developing the business.8176.1790.996
LD4: You operate the business with transparency and integrity.8176.2200.937
LD5: You motivate employees to perform to their full potential.8176.1181.031
LD6: You encourage employees to participate and express opinions openly within the organisation.8176.1960.953
Competitive Advantage (CA)
CA1: Your business is able to sustain its competitive advantage in the long term.8175.9721.063
CA2: Your business has competitive strategies that are not easily imitated by competitors.8176.1650.962
CA3: Your business offers products or services that are clearly differentiated from competitors.8176.1680.978
CA4: Your business responds to customer needs faster than competitors.8176.1311.014
CA5: Your business manages resources more effectively than competitors.8176.1101.019
Innovation Capability (IC)
IC1: Your business allows customers to engage through online platforms in creating or improving new products or services.8175.9511.147
IC2: Your business collects and analyses customer data on online platforms to support product or service development.8176.1471.024
IC3: Your business continuously monitors and evaluates customer needs on online platforms.8176.1001.017
IC4: Your business uses customer feedback from online platforms to improve products or services.8176.0711.108
IC5: Your business prioritises customer satisfaction on online platforms to support product or service development.8176.1131.09
Business Continuity Management (BCM)
BCM1: Your business has established plans for responding to crisis situations, such as COVID-19, economic downturns, natural disasters, and related events.8175.8621.261
BCM2: Your business defines the roles and responsibilities of each function during a crisis.8175.9951.213
BCM3: Your business assesses and monitors risks that may affect the business.8175.9521.261
BCM4: Your business regularly reviews and updates its crisis response plans to keep them current.8175.9021.259
BCM5: Your business can restore operations quickly after a crisis event.8175.6601.754
BCM6: Your business communicates clear information and procedures to employees and relevant stakeholders when a crisis occurs.8176.0311.106
Sustainable Performance (SP)
SP1: Your business’s sales revenue increases continuously.8175.9831.04
SP2: Your business’s profits increase continuously.8176.1521.023
SP3: Your business’s market share increases continuously.8176.0621.098
SP4: Your business’s number of new customers increases continuously.8176.0971.067
SP5: Your business consistently retains existing customers.8176.1790.966
SP6: Your business operates with consideration for social and environmental sustainability alongside business performance.8176.2640.892
Note: Descriptive statistics are presented for each measurement item based on a seven-point Likert scale. Higher scores reflect greater agreement with the positively framed statements.
Table 10. Measurement model fit indices (confirmatory factor analysis) (Source: Author).
Fit IndexCriteriaSMUOILDCBICCABCMSP
Chi Square Divided by df≤3.001.1541.6441.1472.2360.6170.6102.4461.466
Adjusted Goodness-of-Fit Index≥0.90.9900.9860.9900.9840.9960.9960.9790.987
Comparative Fit Index≥0.91.0000.9981.0000.9981.0001.0000.9970.999
Goodness-of-Fit Index≥0.90.9960.9940.9960.9960.9990.9990.9910.995
Incremental Fit Index≥0.91.0000.9981.0000.9981.0011.0010.9970.999
Normed Fit Index≥0.90.9970.9960.9970.9970.9990.9990.9960.997
Tucker–Lewis Index≥0.90.9990.9970.9990.9951.0011.0010.9960.998
Root Mean Square Error of Approximation<0.080.0140.0280.0130.0390.0000.0000.0420.024
Root Mean Square Residual<0.050.0080.0110.0080.0100.0040.0050.0120.008
Table 11. The confirmatory factor analysis (CFA) results (Source: Author).
Constructs and ItemsFactor LoadingR2CRAVECronbach’s Alpha
Social Media Usage (SMU) 0.9300.6900.930
SMU10.8110.658
SMU20.8640.747
SMU30.8140.662
SMU40.8370.701
SMU50.8090.655
SMU60.8480.719
Corporate Branding (CB) 0.9170.6870.916
CB10.8140.662
CB20.8010.642
CB30.8490.722
CB40.8430.711
CB50.8360.699
Open Innovation (OI) 0.9240.6690.924
OI10.7980.638
OI20.7990.639
OI30.8210.674
OI40.8100.656
OI50.8300.689
OI60.8490.721
Leadership (LD) 0.9270.6810.927
LD10.8130.661
LD20.8110.658
LD30.8550.731
LD40.7860.619
LD50.8450.714
LD60.8380.703
Competitive Advantage (CA) 0.9230.7050.922
CA10.8290.687
CA20.8230.677
CA30.8320.693
CA40.8620.742
CA50.8530.727
Innovation Capability (IC) 0.9340.7400.934
IC10.8400.705
IC20.8630.745
IC30.8360.699
IC40.8800.774
IC50.8810.776
Business Continuity Management (BCM) 0.9580.7900.952
BCM10.8780.77
BCM20.8930.797
BCM30.9170.841
BCM40.8960.802
BCM50.8830.78
BCM60.8660.751
Sustainable Performance (SP) 0.9340.7030.933
SP10.8430.711
SP20.8650.748
SP30.880.774
SP40.8720.76
SP50.8530.728
SP60.7060.499
Table 12. Structural model fit indices (Structural Equation Modelling) (Source: Author).
Fit IndexCriteriaValueResult
Chi Square Divided by df≤3.001.672Satisfactory
Adjusted Goodness-of-Fit Index≥0.90.907Satisfactory
Comparative Fit Index≥0.90.984Satisfactory
Goodness-of-Fit Index≥0.90.917Satisfactory
Incremental Fit Index≥0.90.984Satisfactory
Normed Fit Index≥0.90.961Satisfactory
Tucker–Lewis Index≥0.90.983Satisfactory
Root Mean Square Error of Approximation<0.080.029Satisfactory
Root Mean Square Residual<0.050.022Satisfactory
Note: The structural model shows excellent fit across multiple indices.
Table 13. Structural path estimates and significance (Source: Author).
HypothesisPathStd. EstimateSECRpResult
H1SMU → CB0.9810.03926.845***Supported
H2SMU → CA0.7410.2443.202**Supported
H3OI → CA0.1300.0462.913**Supported
H4LD → BCM0.4540.1734.201***Supported
H5LD → IC0.9800.03431.528***Supported
H6CB → CA−0.5110.209−2.448*Supported
H7IC → CA0.6200.0668.402***Supported
H8CA → BCM0.4850.1214.874***Supported
H9IC → SP0.2580.0733.214**Supported
H10CA → SP0.3930.0864.576***Supported
H11BCM → SP0.3450.0357.84***Supported
Note: Parameter estimates are reported together with the standard error (SE), critical ratio (CR), and p value. Significance is denoted as follows: * p < 0.05, ** p < 0.01, and *** p < 0.001. Hypotheses are considered supported when the corresponding structural path is statistically significant. The sign of the estimate indicates the direction of the relationship. Although H6 was statistically significant in the opposite direction to the hypothesised positive relationship, the result is retained and discussed as an unexpected negative effect, as it provides theoretically meaningful insight into the conditional role of corporate branding in resource-constrained digital SMEs.
Disclaimer/Publisher’s Note: The statements, opinions and data contained in all publications are solely those of the individual author(s) and contributor(s) and not of MDPI and/or the editor(s). MDPI and/or the editor(s) disclaim responsibility for any injury to people or property resulting from any ideas, methods, instructions or products referred to in the content.