Article

Return for Reuse Plastic Food Packaging: Simulated Wear, Scuffing, Hygiene Processes and Assessment Techniques


1
School of Design and Creative Arts, Loughborough University, Loughborough LE11 3TU, UK
2
Wolfson School of Mechanical, Electrical and Manufacturing Engineering, Loughborough University, Loughborough LE11 3TU, UK
3
Department of Materials, Loughborough University, Loughborough LE11 3TU, UK
*
Author to whom correspondence should be addressed.
Current address: School of Design, Royal College of Art, London SW7 2EU, UK.
Current address: School of Engineering and Built Environment, College of Business, Technology and Engineering, Sheffield Hallam University, Sheffield S1 1WB, UK.
§
Current address: Aston Institute for Membrane Excellence, Aston University, Birmingham B4 7ET, UK.
Sustainability 2026, 18(11), 5657; https://doi.org/10.3390/su18115657
Submission received: 19 March 2026 / Revised: 21 May 2026 / Accepted: 25 May 2026 / Published: 3 June 2026
(This article belongs to the Section Sustainable Products and Services)

Abstract

There is a need for research to support the transition away from single-use plastic packaging towards a circular economy. This research developed simulated wear processes and assessment techniques that emulate aspects of a reuse system in order to evaluate different plastic food packaging types that are typically used for single-use applications. Two thermoformed polyethylene terephthalate materials (rPET and heat-resistant PET) for food packaging trays were tested. Researchers subjected both thermoformed packs to a range of simulated wear processes including wash cycles, simulated damage, surface scratching, and artificial fouling. Assessment techniques included using adenosine triphosphate (ATP) swabs to indicate cleanliness of the pack surface and 3D scan data to measure physical change. The findings show that scratch damage applied to packs, following fouling and wash cycles, produced promising readings under 30 relative light units (RLUs) on ATP swabs. The heat-resistant PET packs exhibited minimal deformation throughout repeated wash cycles. The assessment techniques developed to evaluate plastic materials have provided valuable insight into the cleaning, damage, and deformation of plastic packaging. These insights can support more complex decision making in the design and production of circular food-to-go plastic packaging solutions.

1. Introduction

Current modes of plastic production and disposal create global issues of both significance and urgency [1], among which the UK food-to-go industry is a large contributor to the problematic single-use plastics [2,3]. UK food-to-go purchases are typically made from takeaways, coffee shops, and supermarkets and predominantly consist of relatively cheap convenience foods such as sandwiches and salads. Due to the food often being prepacked off-site, they are housed within multi-material boards, plastic film wraps, and/or rigid film PET solutions, providing protective properties for the safe movement and delivery of food products throughout the supply chain and ending with the consumer. Whilst there are notable movements towards improving the sustainability of plastic packing, including sorting and mechanical recycling at end of life [4], chemical recycling methods [5], and advances in biopolymers specifically for packaging [6], a high proportion of the material’s value is ultimately lost after what is a very short use cycle. In 2016, the Ellen MacArthur Foundation estimated that approximately 95% of this value is lost [7]. More recently, the citizen science approach of Greenpeace and Everyday Plastic estimated that UK households throw away 90 bn pieces of plastic per year [8]. In the context of UK food to go specifically, Hubbub estimate that annually this industry generates 10.7 bn items of packaging waste [9]. Despite recent technological advancements, these figures suggest that more radical approaches are needed if these pressing global issues are to be addressed.
To help address these issues, the adoption of return-for-reuse packaging, or ‘return-on-the-go’ packaging systems [10], could extend the lifetime of plastic packaging products. In its simplest conception for food-to-go, the consumer purchases the food product in reusable packaging from the service provider; the consumer consumes the food product within the reusable packaging; the consumer returns the reusable packaging to the service provider (such as in store or at a drop-off point); the service provider cleans and refills the reusable packaging with the food product; then the cycle continues. Moving towards such a circular approach could prevent the premature obsolescence of plastic packaging, reducing both the burden of increased manufacture to meet demand and plastic packaging’s proliferation in the environment from incorrect disposal (or ‘correct’ disposal with reverse logistic leakage, [11]). The significant lost value of plastic could be mitigated and recovered.
Return-for-reuse plastic containers have been explored in other areas where their contents are filled at the point of consumption, such as coffee cups [12,13], food containers in fast food Burger King restaurants [14], and salad bowls at Morrisons’ cafes [15]. These plastic containers are usually made of polypropylene (PP) and often have a heavier-weight, thicker material than single-use equivalents; existing reuse cleaning protocols and performance requirements are not disclosed [16]. However, the majority of the food-to-go supply chain is still dependent on thinner thermoformed film plastics such as recycled polyethylene terephthalate (rPET) for their single-use packaging (for example salad and fruit pots and trays) [17]. One direction proposed by the Perpetual Plastic for Food To Go (PPFTG) project [18,19] is the consideration of rPET for reuse applications. Reusable PET bottles are already established in the beverage packaging industry, some of which “can be refilled and reused up to 25 times” [20]. Currently in practice, other than PET bottles, PET containers are not reused; in food-to-go applications, PET containers are single-use plastics that are disposed of or recycled after their contents have been consumed. The potential material advantages of rPET over PP and other alternatives include its current availability to the market, unlike recycled PP (rPP); moreover, its processing does not require extensive changes to existing manufacturing processes and equipment, therefore reducing the need for capital expenditure and the costly upskilling of the existing trained manufacturing workforce. As rPET is a commonly used material throughout the supply chain, there are also established recycling technologies in place, increasing ease and improving the confidence of the supply chain in working with this material. The authors selected rPET over other plastics as it is typically used for single-use applications; this experimental fundamental research subjecting rPET to emulated aspects of a reuse system could help to extend the life of these plastics, as it offers exploratory and methodological contributions that could inspire future developments toward reuse applications.
Realisation of a fully circular return-for-reuse system for food-to-go plastic packaging, whereby packaging products are filled and sealed on the production line using thinner thermoformed rPET, presents several challenges. Unlike current return-for-reuse PP packaging, where its contents are filled on site just before the customer consumes it, contents may be stored for several days prior to consumption, providing the opportunity for bacterial growth or food spoilage. Thin rPET material also presents a challenge at end of use, as the material will look and feel similar to current single-use food-to-go products; consumers will therefore need to be made aware of its need for return rather than disposal or recycling. This presents challenges around the need for behaviour change from consumers, moving from single-use to reuse [21].
Due to the constant cycling system of purchase, consumption, return, and refill of reusable packaging, the packaging is highly likely to experience a variety of damage and deformation within its lifetime, which can lead to obsolescence. Absolute obsolescence, when the packaging can no longer function (i.e., it cannot hold its contents or be resealed), and aesthetic obsolescence, when the surface of the packaging exhibits undesirable properties (such as showing ‘wear and tear’ beyond expectations) [22], can both occur through excessive use or misuse. In either scenario, the damage and deformation that creates obsolescence can shorten the plastic packaging products’ lifespan. Therefore, understanding how packs physically change throughout the emulated aspects of a reuse system is important for assessing at what point the pack needs to be removed from reuse and placed on an appropriate end-of-life pathway, for example, recycling.
Increased visible signs of previous use influence how willing a consumer is to take part in the reuse scheme, as it influences the perceived cleanliness of the reuse containers [23]. Hygiene concerns and ‘contaminated interaction’ have time and again been considered a barrier for systems with continuous human–object interaction [24]. In a previous study [16], rPET packs were washed 30 times, and a cleaning protocol was developed; the packs showed visible physical deformation, increasing throughout the wash cycles, caused by the 70 °C temperature during the rinsing stage of the wash cycle temporarily reaching the 60–76 °C glass transition temperature (Tg) of PET [25]. This previous study confirmed that repeated washing of the rPET packs led to no significant thermal degradation and no noticeable change in the chemical bonding (chemical degradation) of the rPET material, and tensile testing indicated a slight increase in tensile strength and in stiffness (Young’s modulus) [16]. Severe deformation of the packaging, such as that shown to happen during the repeated wash cycles, can affect factors such as the volume of food that can be contained within the pack, and whether it can be resealed on a production line. Apart from the aforementioned previous study [16], this type of pack (single-use plastic food trays) in this application (food-to-go, containing cheaper convenience foods such as sandwiches and salads) has not been tested before, and this research tests the packs in new ways to further this previous work, to both damaging and foul the packs, followed by the previously established cleaning protocol.
In transit, there are two main hazards packaging is likely to encounter in its journey to the consumer: mechanical and climatic. There are various ways to simulate these hazards through transport packaging testing, such as through shock, drop, vibration, and compression testing [26]. Methods for road vehicle vibration simulation for packaging testing purposes have been studied for decades, but it is challenging to reproduce the three modes present in vehicle vibration: non-stationary random, transient, and harmonic components [27]. Abrasion of printed packaging has been previously tested, with a close likeness to damage caused by truck transportation being simulated in a laboratory by using an accelerated random vibration model [28]; this highlights the complexity and challenges of simulating transportation damage in a laboratory. Scuffing damage has been explored to further simulate improved techniques for packaging vibration testing [29]. Packaging damage can occur from food filling, to transport, to handling and is often introduced at different speeds; scratch testing has previously been conducted on packaging film to test mechanical integrity, using clamp and vacuum fixtures to create scratches at different speeds [30]. Whilst the previous work of Hare [30] created a controlled and repeatable experiment within a laboratory setting where the sample is always flat, this does not account for variation of scratch damage that is caused by a human. In this research, researchers are investigating damage that could be caused by consumers through carrying and transporting the packaging themselves and consuming the food packaging contents.
Currently, there are no guidelines or standard tests in place that can be used to assess how suitable plastic packaging is for reuse in food applications. This research focuses on developing simulated wear processes and assessment techniques that can help in understanding whether a pack design, forming process, and material selection choice has the potential to be appropriate for a reusable application. This research contribution is methodological and exploratory and used to test different types of polymer materials that are not typically used in reuse applications, such as thinner thermoformed PET, by subjecting them to a variety of simulated wear conditions that are likely to occur within its lifetime if they were introduced into a reuse system. This includes damage such as compression, scratches, food fouling applied to the inside of the pack, and putting the packs through numerous wash cycles. Combining tests (compression, scratching, and fouling) with washing the packaging is essential to discovering whether materials would withstand a return-for-reuse system when subjected to the compound forms of damage that can occur in real-world use [31]. This method can also be used to identify at what point it would be considered no longer appropriate or safe to use; damage, such as scratches, on materials such as rPET is likely to have a larger impact on the appearance of the packaging when compared to thicker reusable PP containers. It can also pose increased risk from a hygiene perspective. As the food will be stored in this type of packaging for a longer duration prior to consumption, this could cause packs to split if the scratch is deep.
The aim of this work was to develop simulated wear processes and assessment techniques to evaluate the if plastic food packaging types (different polymer materials), such as thermoformed PET packaging, could withstand emulated aspects of a reuse system. This is addressed in the following studies.
  • Packaging was subjected to compressive stress followed by washing. The process was repeated ten times, with changes in appearance captured.
  • Packaging was subjected to scratch damage using two different implements (sharp and blunt objects) to simulate possible damage during use. Damaged packaging was then subsequently fouled and washed, capturing changes in appearance and testing the hygiene standard of damaged areas via ATP swabs.
  • Changes in physical appearance in the packaging across all studies were collated and compared.
In each study, standard rPET materials are compared to a proprietary PET formulation designed to have higher heat resistance.

2. Materials

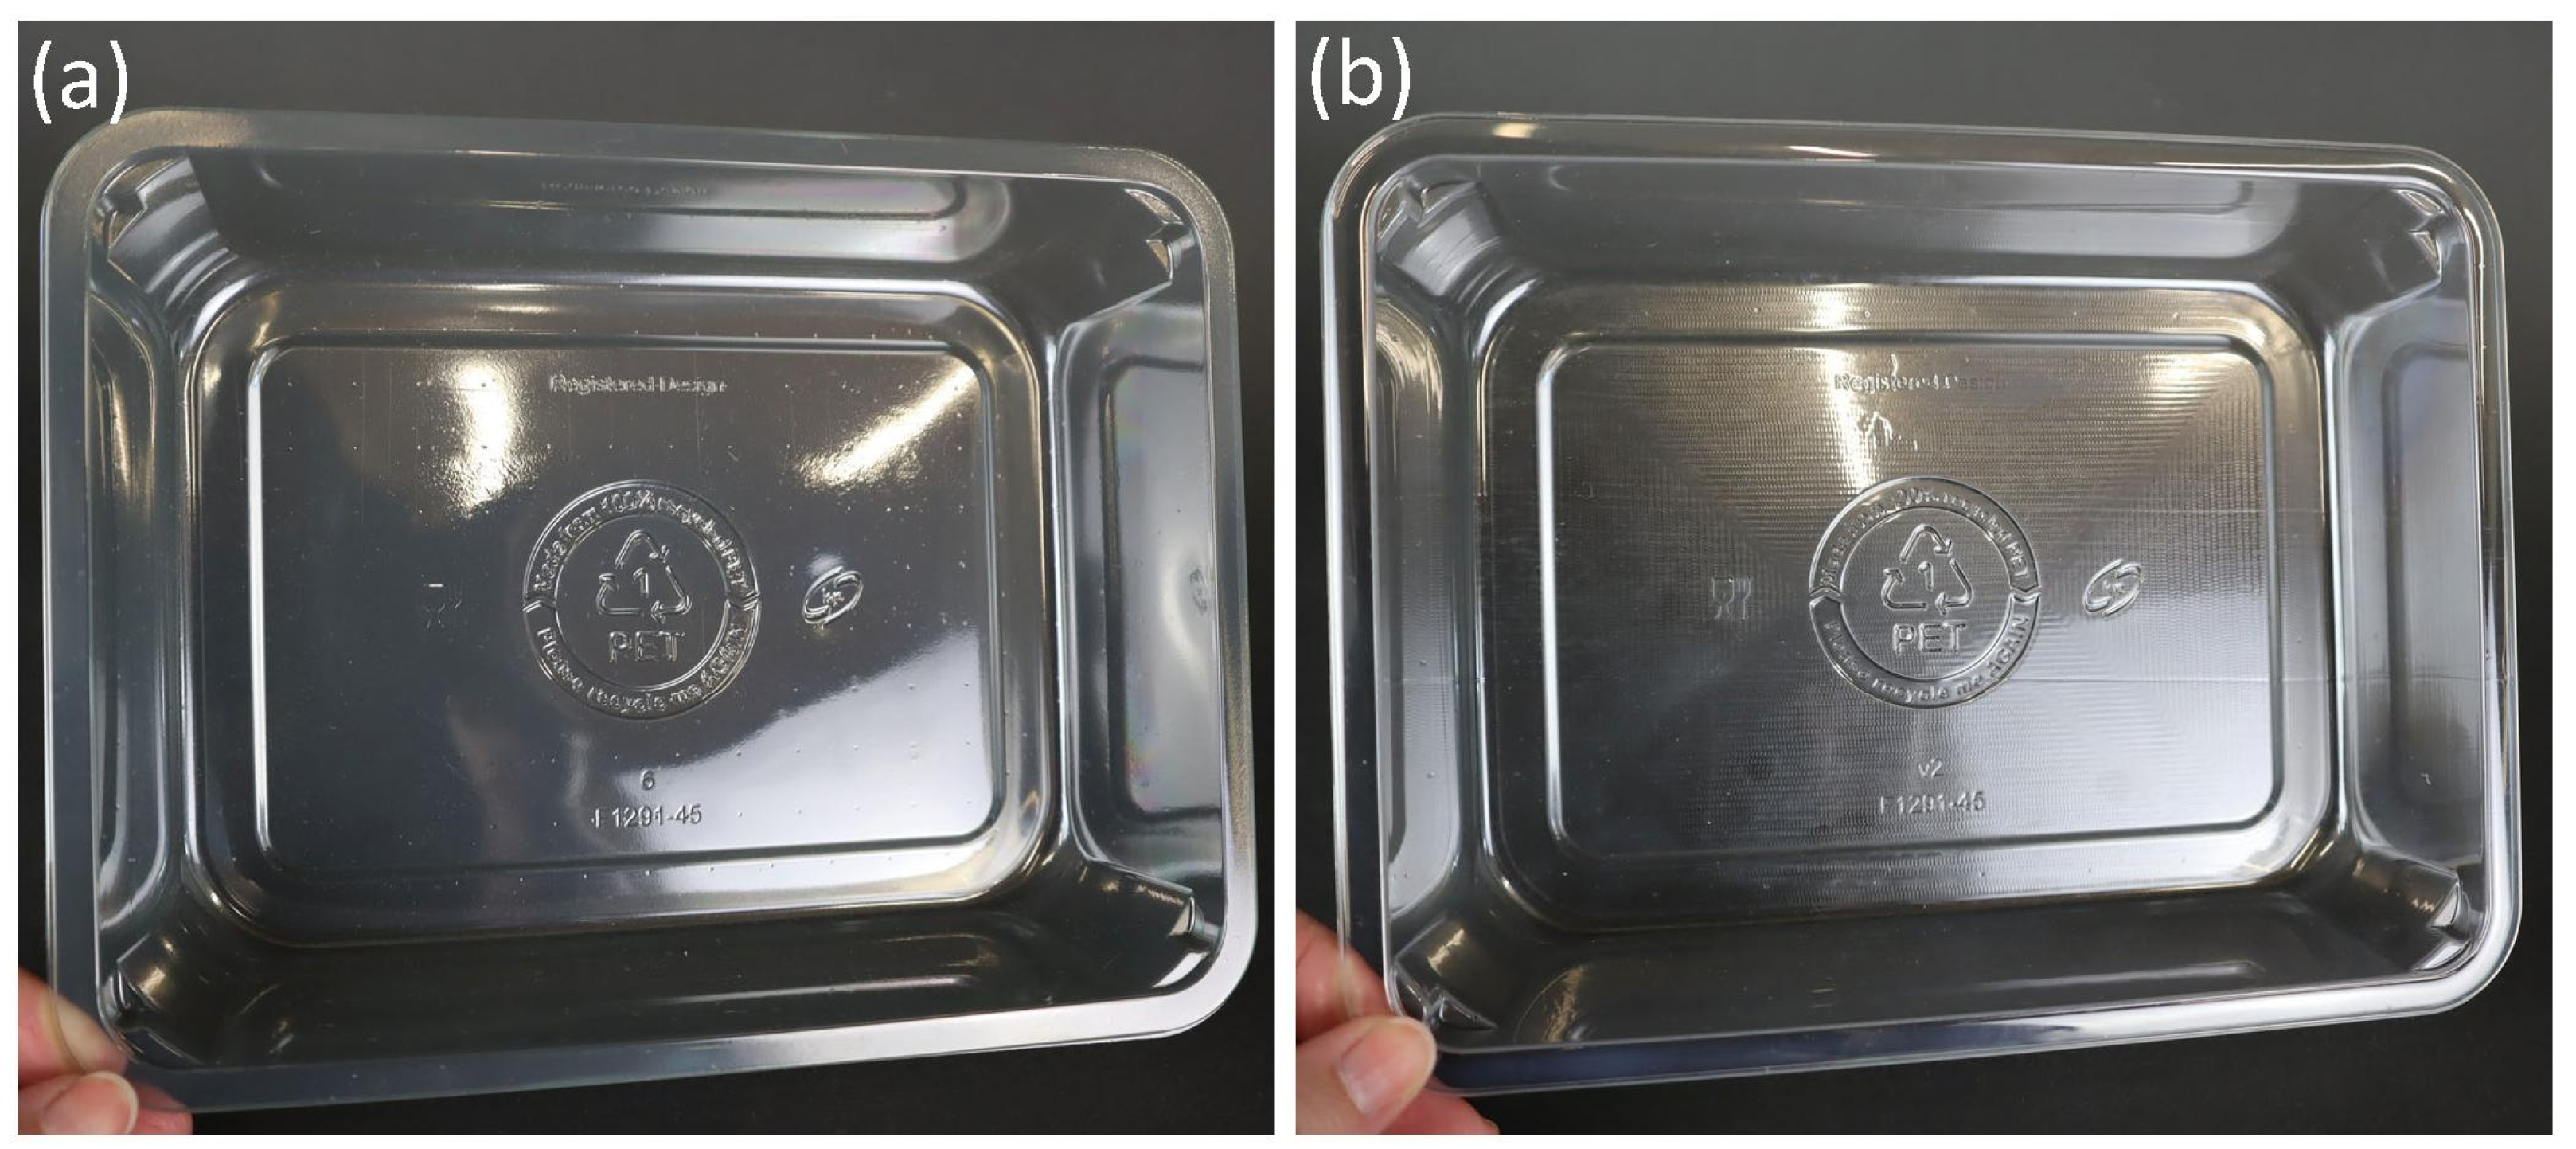
All thermoformed packaging was provided by Klöckner Pentaplast (Featherstone, West Yorkshire, UK). Two types of rectangular thermoformed trays were provided (Appendix A, Figure A1). The first material type is rPET produced from a 100% recycled PET (rPET) feedstock. The second material type is heat-resistant PET from the Klöckner Pentaplast’s ‘kp Hotfill®’ product line [32], with thermal resistance to heated liquids up to 90 °C. The heat-resistant PET packs are a PET material structure comprising multilayers of PET, containing a mixture of high-Tg polyester copolymers combined with amorphous PET (APET). The exact additive formulation for the heat-resistant PET material is proprietary but represents a model premium PET material that is industrially accessible in today’s market.
The length and width dimensions of the packs are nominally the same for both materials and are as follows: length 200 mm × width 155 mm. The height is slightly different for each material type, with rPET height being 45 mm and heat-resistant PET height being 46 mm. Both pack formats are produced to the same mould tool design, ‘F1291-45’. The industry partner provided packs, with ease of supply; they are off-the-shelf, commercially available products with typical dimensions.
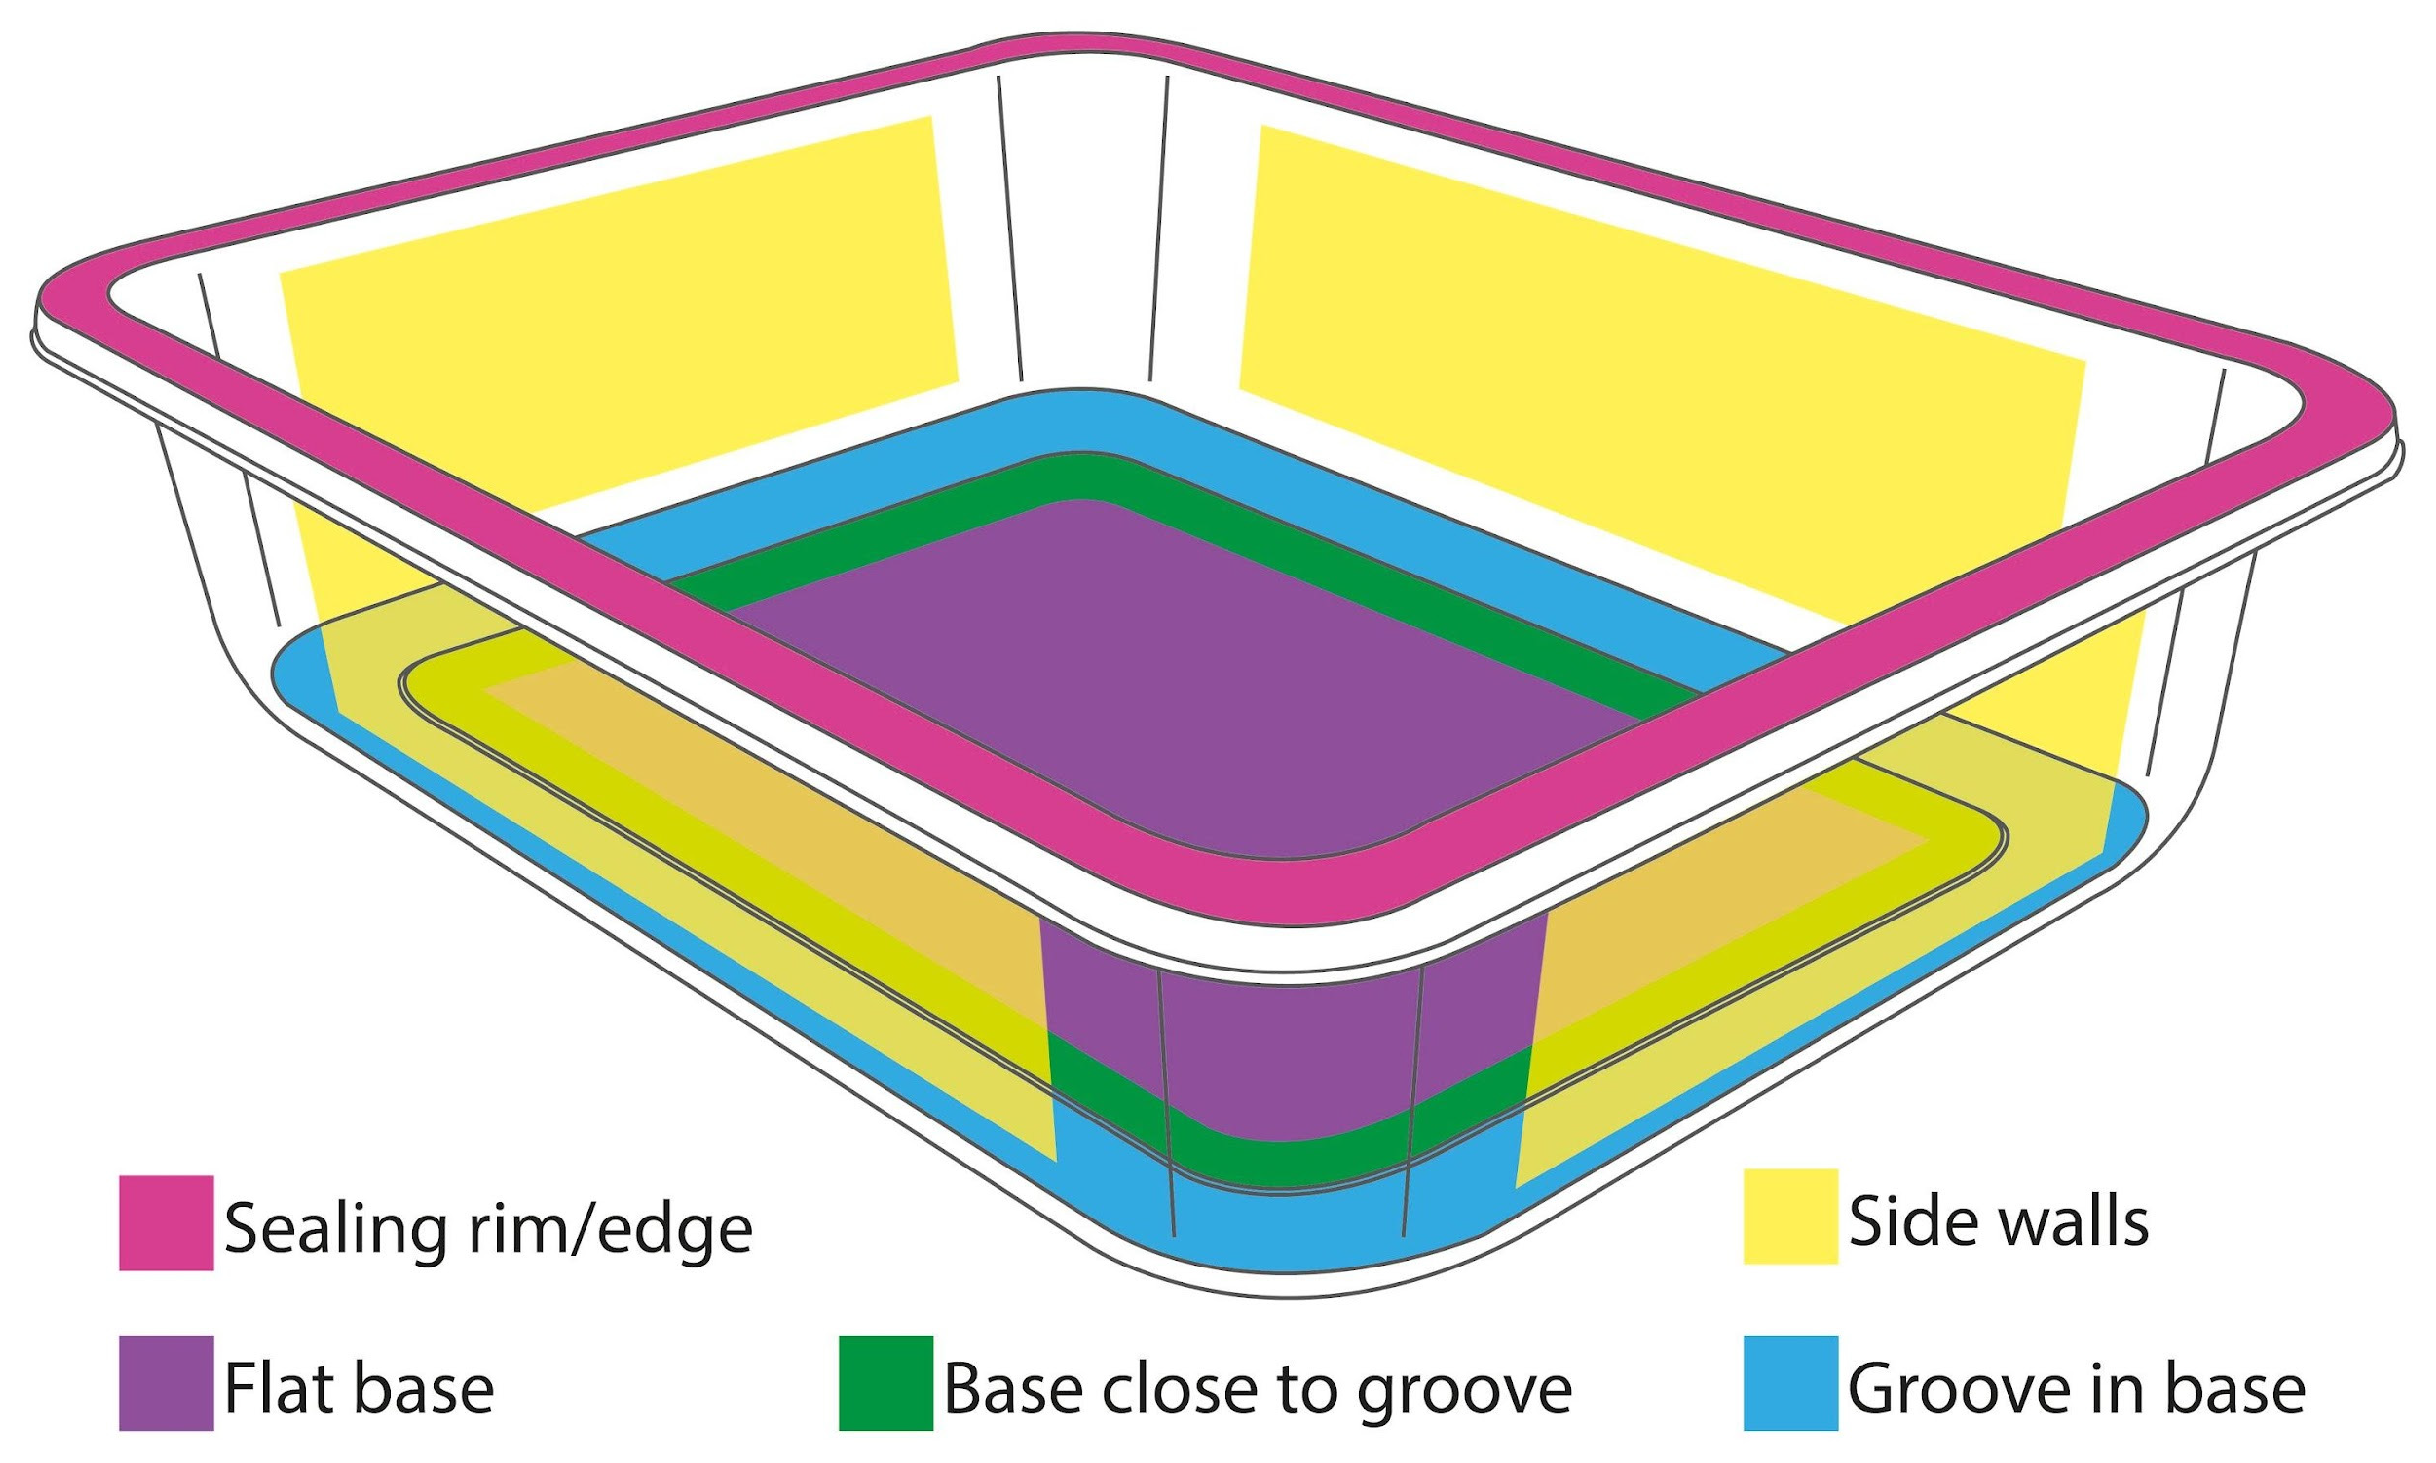
Material thickness was measured using an analogue micrometer, digital caliper (Mitutoyo 150 mm, 6 inches digital caliper, 0.01 mm resolution, from Mitutoyo, Andover, Hampshire, UK), and a mounted digital contact sensor at several locations on each pack type to better understand the variation in thickness across the thermoformed packs (Figure 1).
The thickest areas of the packs, and hence the most rigid, were the sealing rim/edge, followed by the flat base area. The thinnest and more flexible areas were the groove in the base, followed by the side walls and the base close to the groove. This inconsistency is as expected given the inherent characteristics of the thermoforming process and the depth of draw. Minor variations between rPET and heat-resistant PET packs were observed, with the heat-resistant PET packs slightly thicker than the rPET packs (Table 1).

3. Study 1: Compressive Stress Testing with Wash Cycles

Study 1 subjected unused rPET and heat-resistant PET packs to a compressive weight being applied followed by a wash cycle. This was repeated ten times, capturing changes to corner measurements and observations to changes in appearance for each cycle. The motivation of this study was to simulate the typical weight damage that a consumer may apply to the packaging during purchase, use, and return phases, followed by a wash cycle prior to refilling. The number of wash cycles was set to ten to make the results compatible and comparative with the On-Pack Recycling Label (OPRL) minimum requirement for ‘Refill at Home’, ‘Refill in Store’, and ‘Return to Refill’ standards [33]. In Study 1, the packs were not in contact with food products or resealed.

3.1. Method

3.1.1. Weight and Duration

A static 5 kg weight (to simulate a likely weight of items in a typical backpack, such as laptop, charger, notebooks, and other small items) was applied to the pack (tray only, not sealed) for ten minutes (duration informed by service design study with participants). This was to simulate the typical compressive damage that a consumer may apply to the pack (if they stored it in their backpack with other items) when transporting the food-to-go pack from the point of purchase, to where they consume the food, to where they would return the pack. The weight was based on the contents of a backpack, not to simulate a backpack condition (uncontrolled dynamic loading).

3.1.2. Washing Packs

To wash the packs, the industrial ware washer (Classeq® Glasswasher G400 Duo, purchased from Nisbets Plc. Catering Equipment Supplies, Bristol, UK) was set to a ‘standard wash’ cycle, this is a 102 s 55 °C caustic wash (wash cycle with detergent) followed by a 10 s 70 °C rinse. This cleaning protocol was informed by Nahar [16] in a previous study to remove all food traces and confirmed by ATP swab tests. This ensured effective sanitation against transferrable viruses and bacteria, as advised by the Food Standards Agency [34]. However, in this study (Study 1), no detergent was used in the wash cycles when washing the packs throughout this study, as cleanliness was not being assessed. In a previous study, Nahar [16] found that no chemical degradation occurred in the PET polymer throughout 30 wash cycles; however, the rPET pack did experience larger degrees of warping with successive wash cycles, resulting in its storage volume being reduced. This physical deformation of the packs was thought to be caused by the temperature of the wash cycle rinse (70 °C) with it temporarily reaching close to the packs glass transition temperature, Tg for PET is 60–76 °C [25].

3.1.3. Test Rig to Measure Corner Deformation

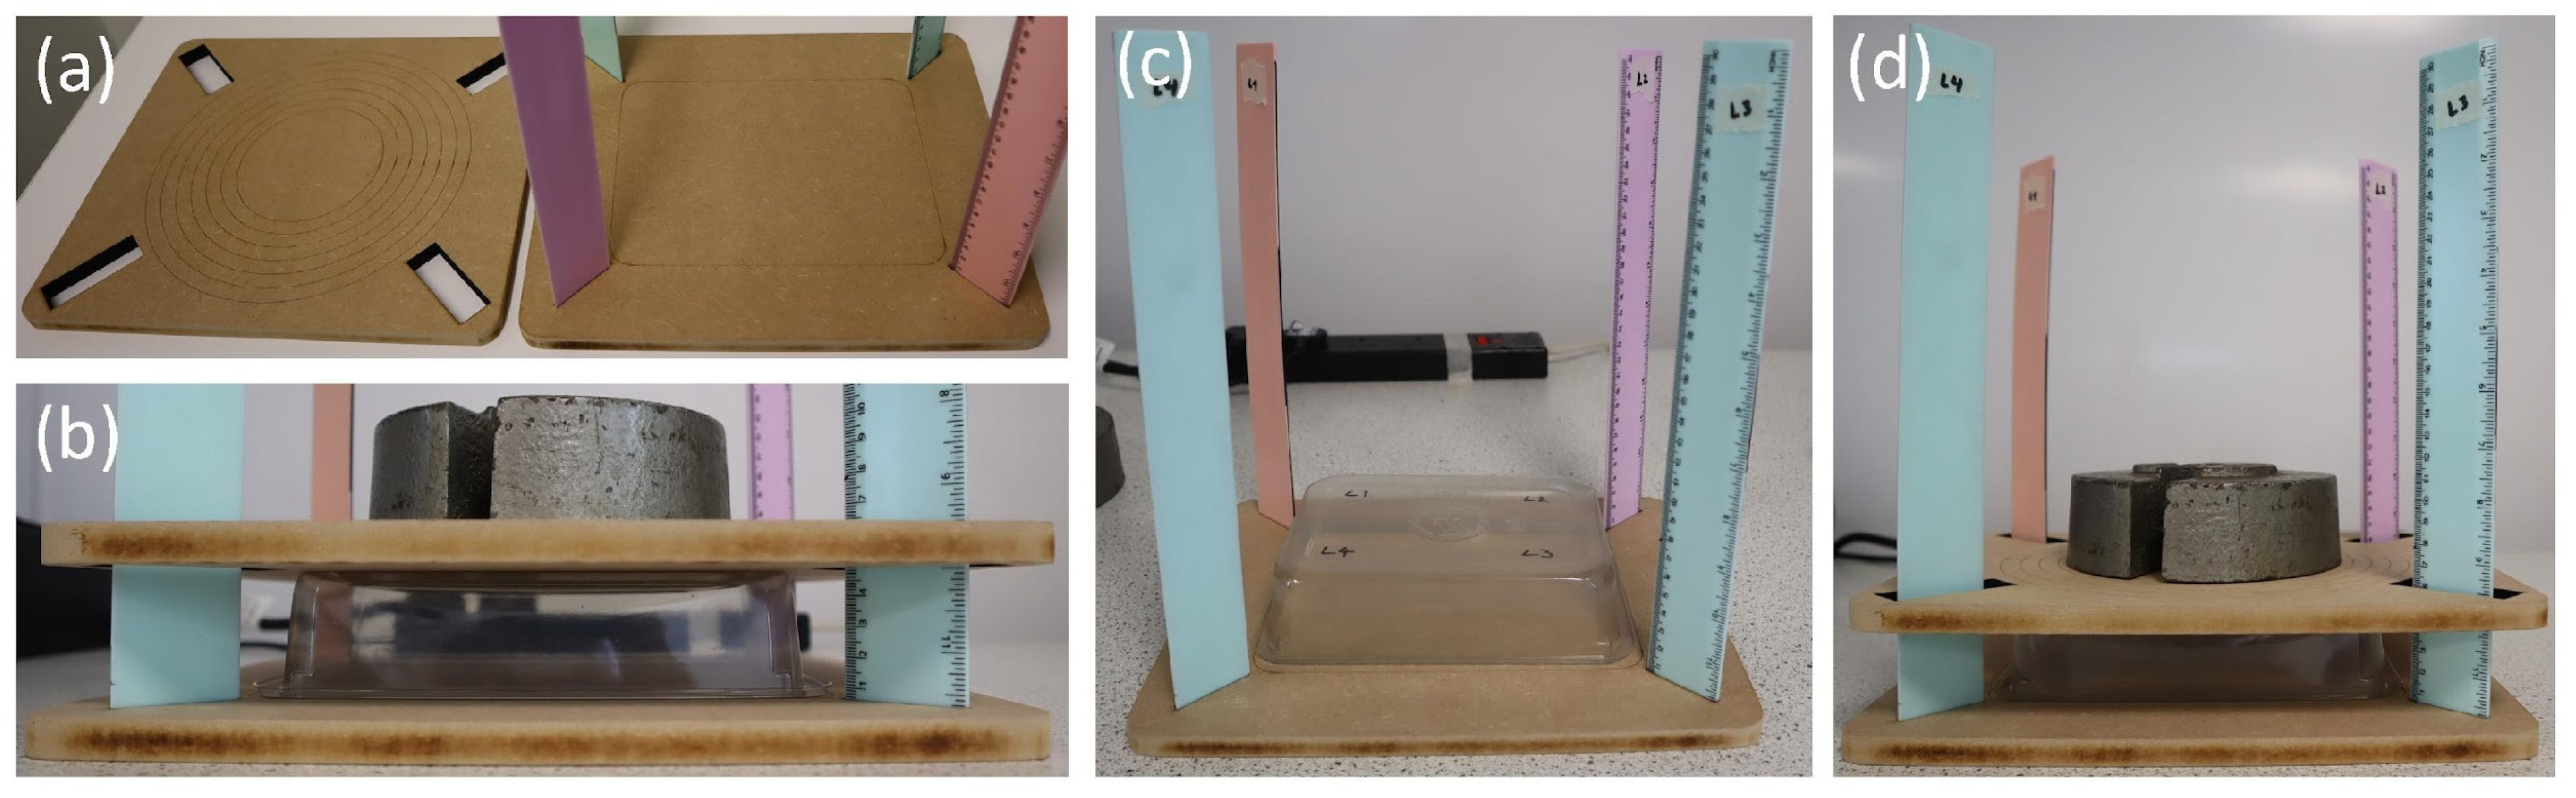
A test rig was built (Figure 2) to ensure the 5 kg weight was evenly distributed when applied to the pack with a location marker as a visual reference when applying the weight, ensuring the pack was in the same position each time, with the pack sealing edge in contact with the base of the test rig. The visual location markers were engraved on the test rig itself; this included a rectangle with rounded corners on the base of the test rig to position the sealing edge of packs within it (matching the size of the sealing edge) and circles engraved on the top floating part of the rig (mimicking a target) to help position the circular weights centrally each time. The test rig was also used as a tool to measure the deformation of each pack corner in millimetres by incorporating four rulers into the design with enough space allowance for the corners of the pack to deform naturally at different rates whilst still accurately measuring the deformation that occurred. Due to the nature of its build, the rulers were inserted into the test rig base, meaning the 6 mm mark on the ruler equated to zero for the measurements. With the top floating part of the rig, care was taken to position the rectangular holes (for the rulers) centrally with the rulers themselves, to ensure the floating part of the rig stayed in a central alignment and did not touch the rulers throughout testing; this allowed the floating part to move freely and accurately with the changes in the packs 3D form, ensuring the fixed position of the rulers did not interfere with this movement.
Care was taken to ensure consistency throughout the testing, with the weight being applied manually by the same person each time; moreover, the same person captured the change in measurements each time. This test rig was designed to have room to move in a dynamic way, enabling the researchers to capture the independent deformation variations that occurred for each of the four corners of the base of the pack throughout the testing. These are important features for understanding the continuous dimensional changes that occur when testing a pack throughout weight and wash cycles that other compressive strength testing equipment does not feature. This custom-made analogue approach enabled researchers to both apply weight to the packs and capture changes in dimensions in real time as the deformation occurred throughout the cycles within the same laboratory as the industrial ware washer. This timeliness of capturing these measurements was key in understanding how frequently dimensional changes were occurring throughout the process, and what caused deformation to occur. Whereas, if the packs were frequently moved back and forth throughout the process between the laboratory with the industrial ware washer to a different location where measurement equipment is situated, it could interfere with the dimensional changes of the packs caused by changes in temperature from being in transit (moving from one location to another), damage caused in transit, and time elapsing (limited availability of measurement equipment). It was not possible to have the industrial ware washer and the measurement equipment in the same laboratory location for this study.

3.2. Results

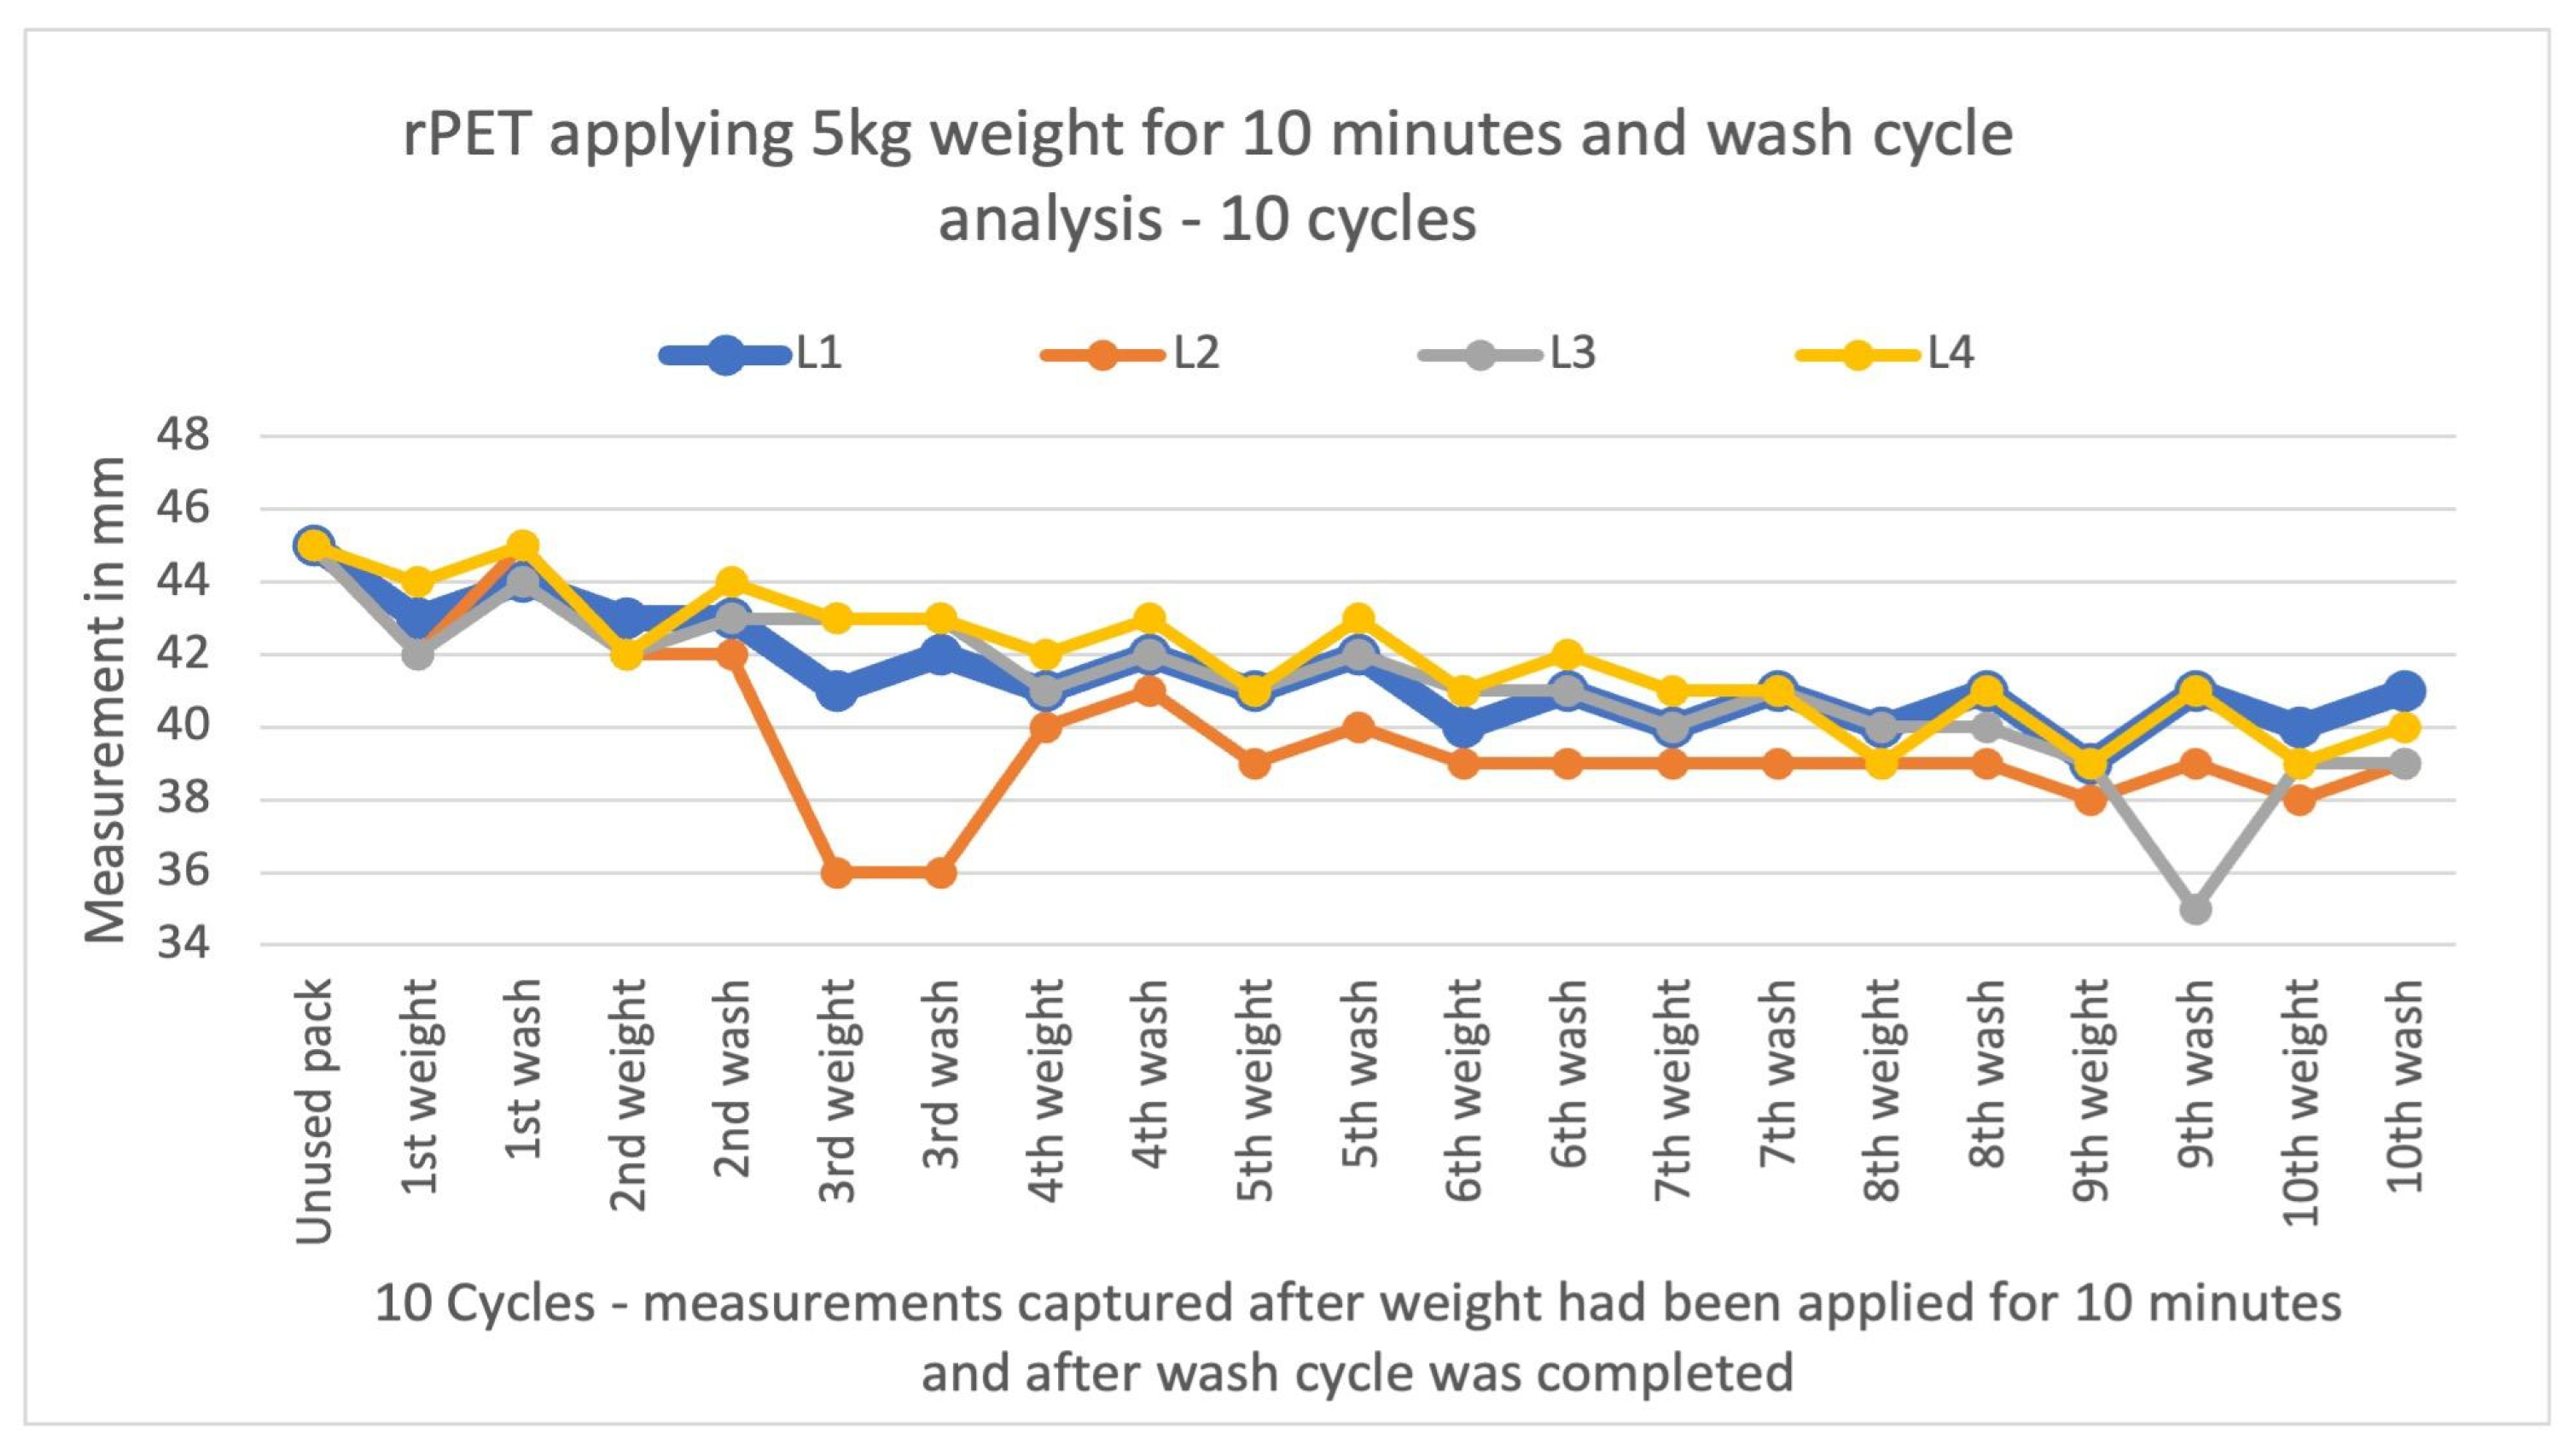
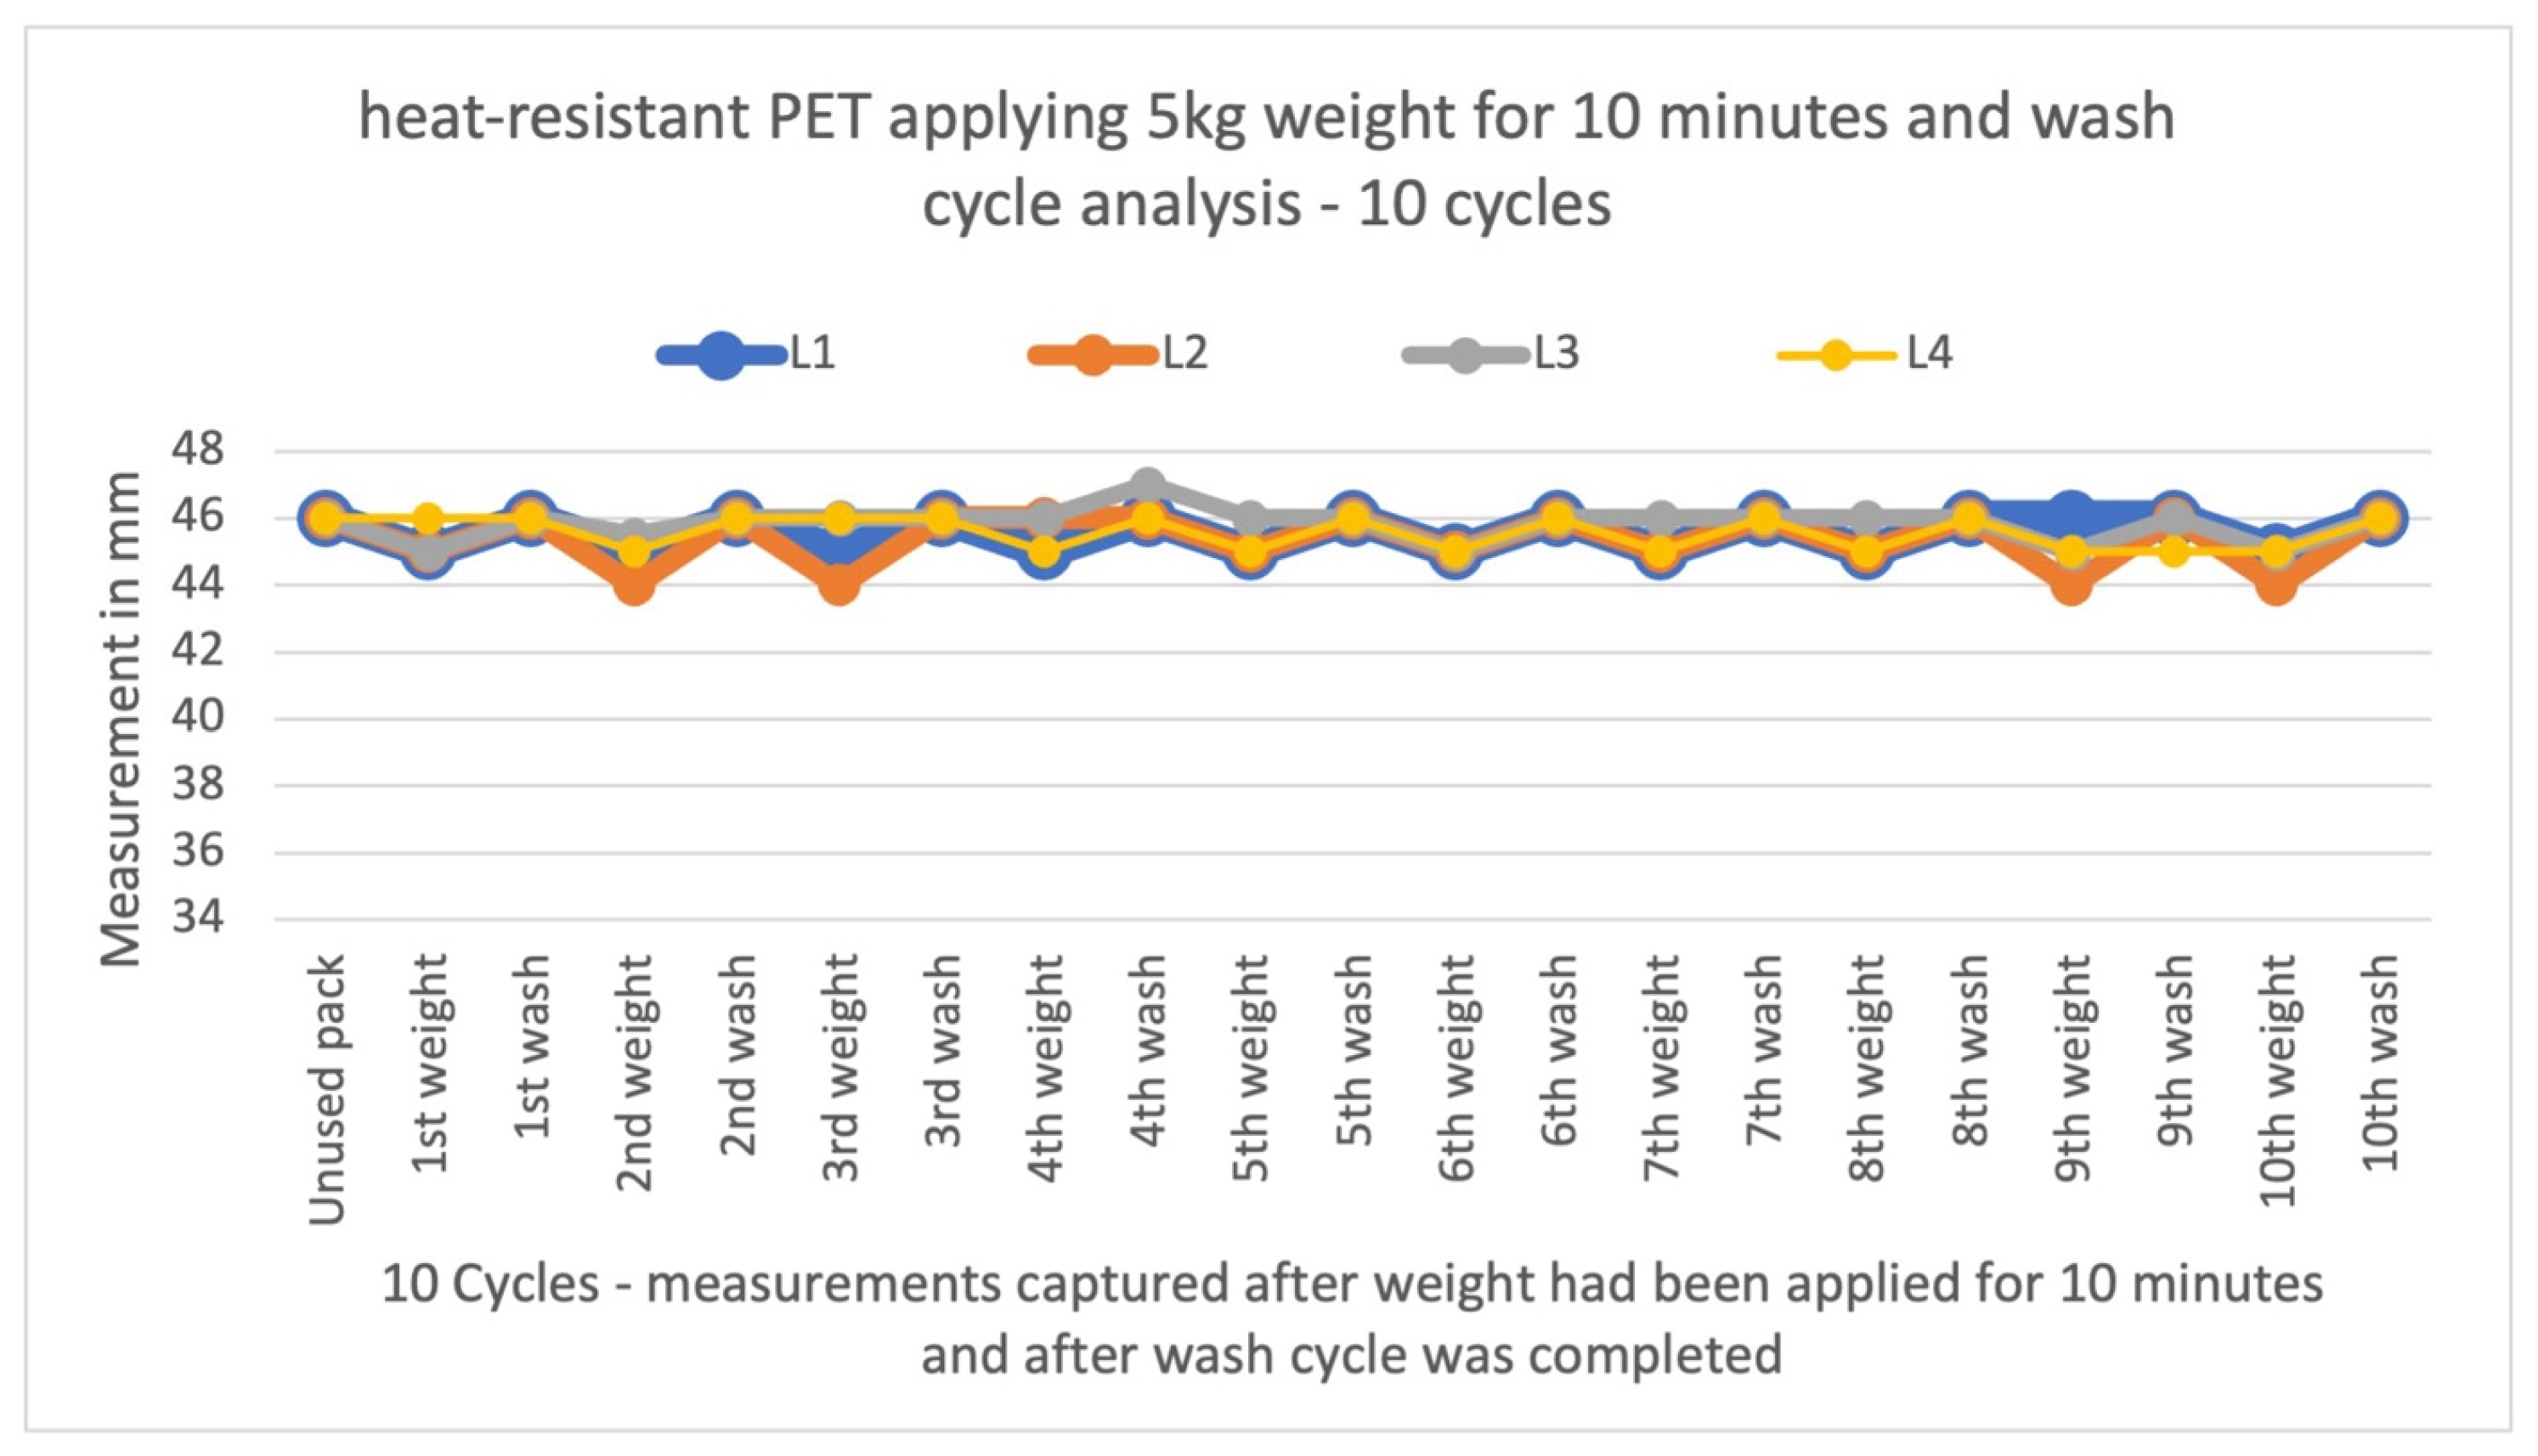
Measurements of the packs were taken using the test rig both after the 5 kg weight was applied for ten minutes and also after the pack had completed a wash cycle. This was repeated ten times (ten cycles). The maximum compressive deformation on the pack corners (corners named to match those on the test rig: L1, L2, L3, L4) was 2 mm for the heat-resistant PET pack and 10 mm for the rPET pack (Figure 3 and Figure 4). An interesting observation made during this experiment was that both pack types would reform slightly to their original shape after the wash cycle, which could be caused by the heat of the wash cycle, helping it to return more closely to its original form. PET has ‘shape memory’ properties in which heat treatment can help the polymer to return to its original form after deformation, also referred to as ‘shape recovery’ [35]. Elevated temperature, specifically temperatures above Tg of the polymer, causes the polymer chains to relax and increase their molecular mobility [16]. This softens the plastic, allowing it to relieve areas of high mechanical stress concentration where polymer chains have been aligned and stretched, such as those caused by mechanical deformation at the pack corners. The mechanical force of the water may have also contributed to this reforming of the pack when combined with the increased temperature, making the material more pliable for it to return to the original shape by relieving the pressure on the sharp bends (corners) in the material. Findings from a previous study revealed that rPET packaging dimensions reduce over successive cycles as the density of polymer chains increases when washed at 70 °C [16], which is also evident in this study (Figure 3). Throughout the testing, there were a few anomalous results, such as the results for L2 in the third cycle when testing rPET (Figure 3); this could be due to the weight possibly being applied slightly off-centre (not in the exact centre of the platform) as it was applied manually each time by the same person, or it could be due to a variation in material thickness at one corner as the thermoforming process used to create the packs can result in uneven material distribution. Areas with thinner walls such as corners may be more susceptible to deformation during washing. Another possibility is that the shape or design of the pack might inherently make one corner more prone to deformation, especially if there is a stress concentration or weak point in that area.

4. Study 2: Scratch Damage and Hygiene Testing

Study 2 subjected unused rPET and heat-resistant PET packs to both one fork and one needle scratch, followed by fouling, washing, drying, and ATP swab of the scratches; this was repeated 10 times, capturing ATP results and observing changes in appearance. Changes to corner measurements at key milestones (at 5 and 10 wash cycles) were captured. The motivation of this study was to test if scratch damage on the packaging would impede the wash process and to test if these scratches would cause deformation to the packs throughout the wash cycles.

4.1. Method

4.1.1. Scratching Packs

Depending on the implement used, varying degrees of pressure were applied to the surface of the plastic materials, resulting in different amounts of displacement of material to create narrow channels, i.e., scratches. These channels have the potential to act as pockets that retain fouling material during washing and reduce the cleanliness of the packs for future use.
The nature of the pack material and its 3D form made it challenging to create scratches on the inside surface without destroying the pack; therefore, a manual approach was taken. New scratches were applied to the washed packs throughout the study after each wash cycle. The packs deform each time they are washed, so creating scratches via machinery would not allow for this three-dimensional variation. The packs were scratched manually by the same person each time using both a fork and a needle. When scratching the packs manually, care was taken to create consistency and reproducibility of the scratches by applying the same amount of pressure each time when creating each scratch. The force applied was not measured as it was manually scratched.
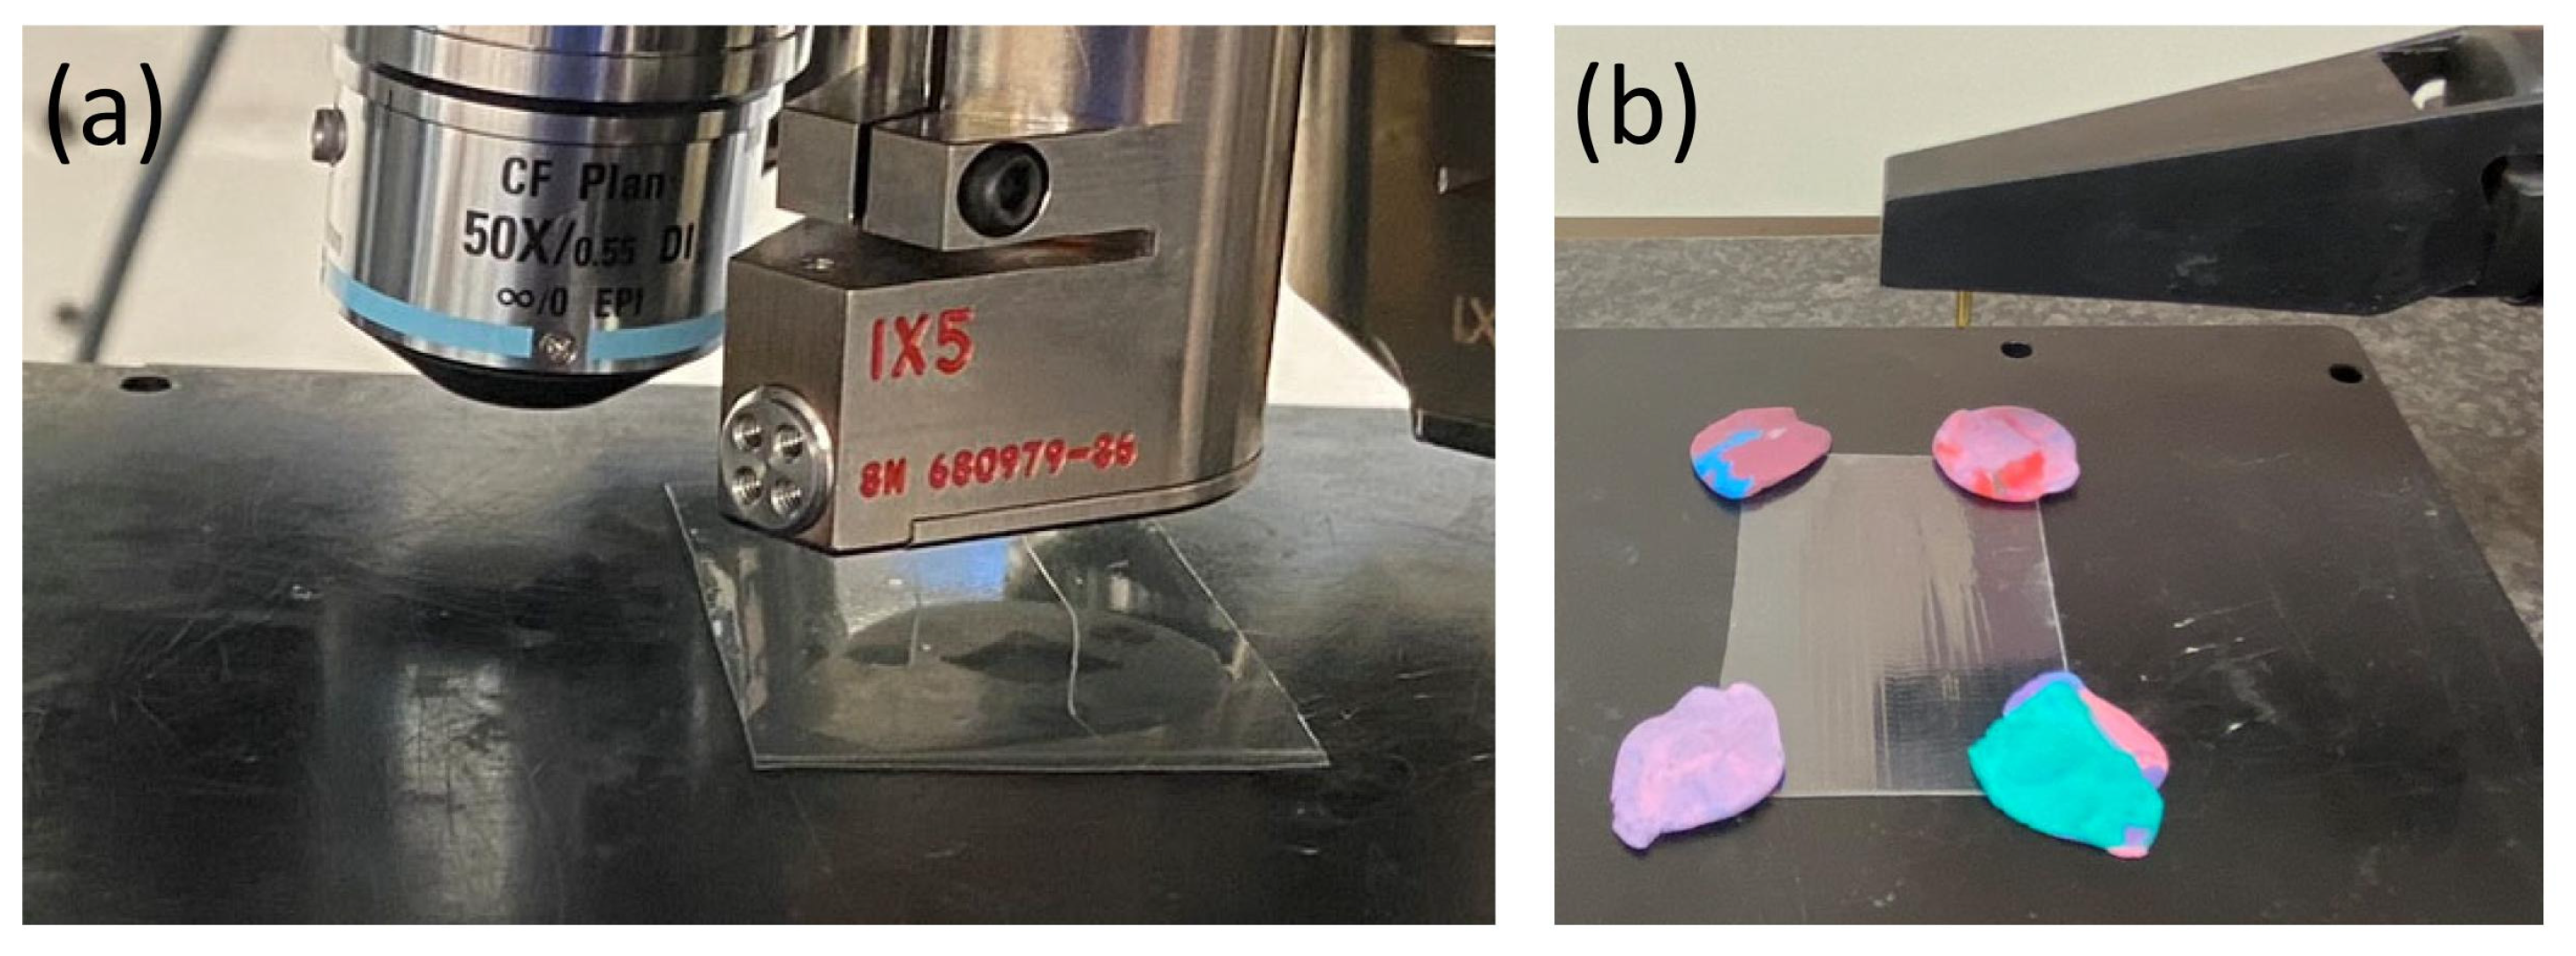
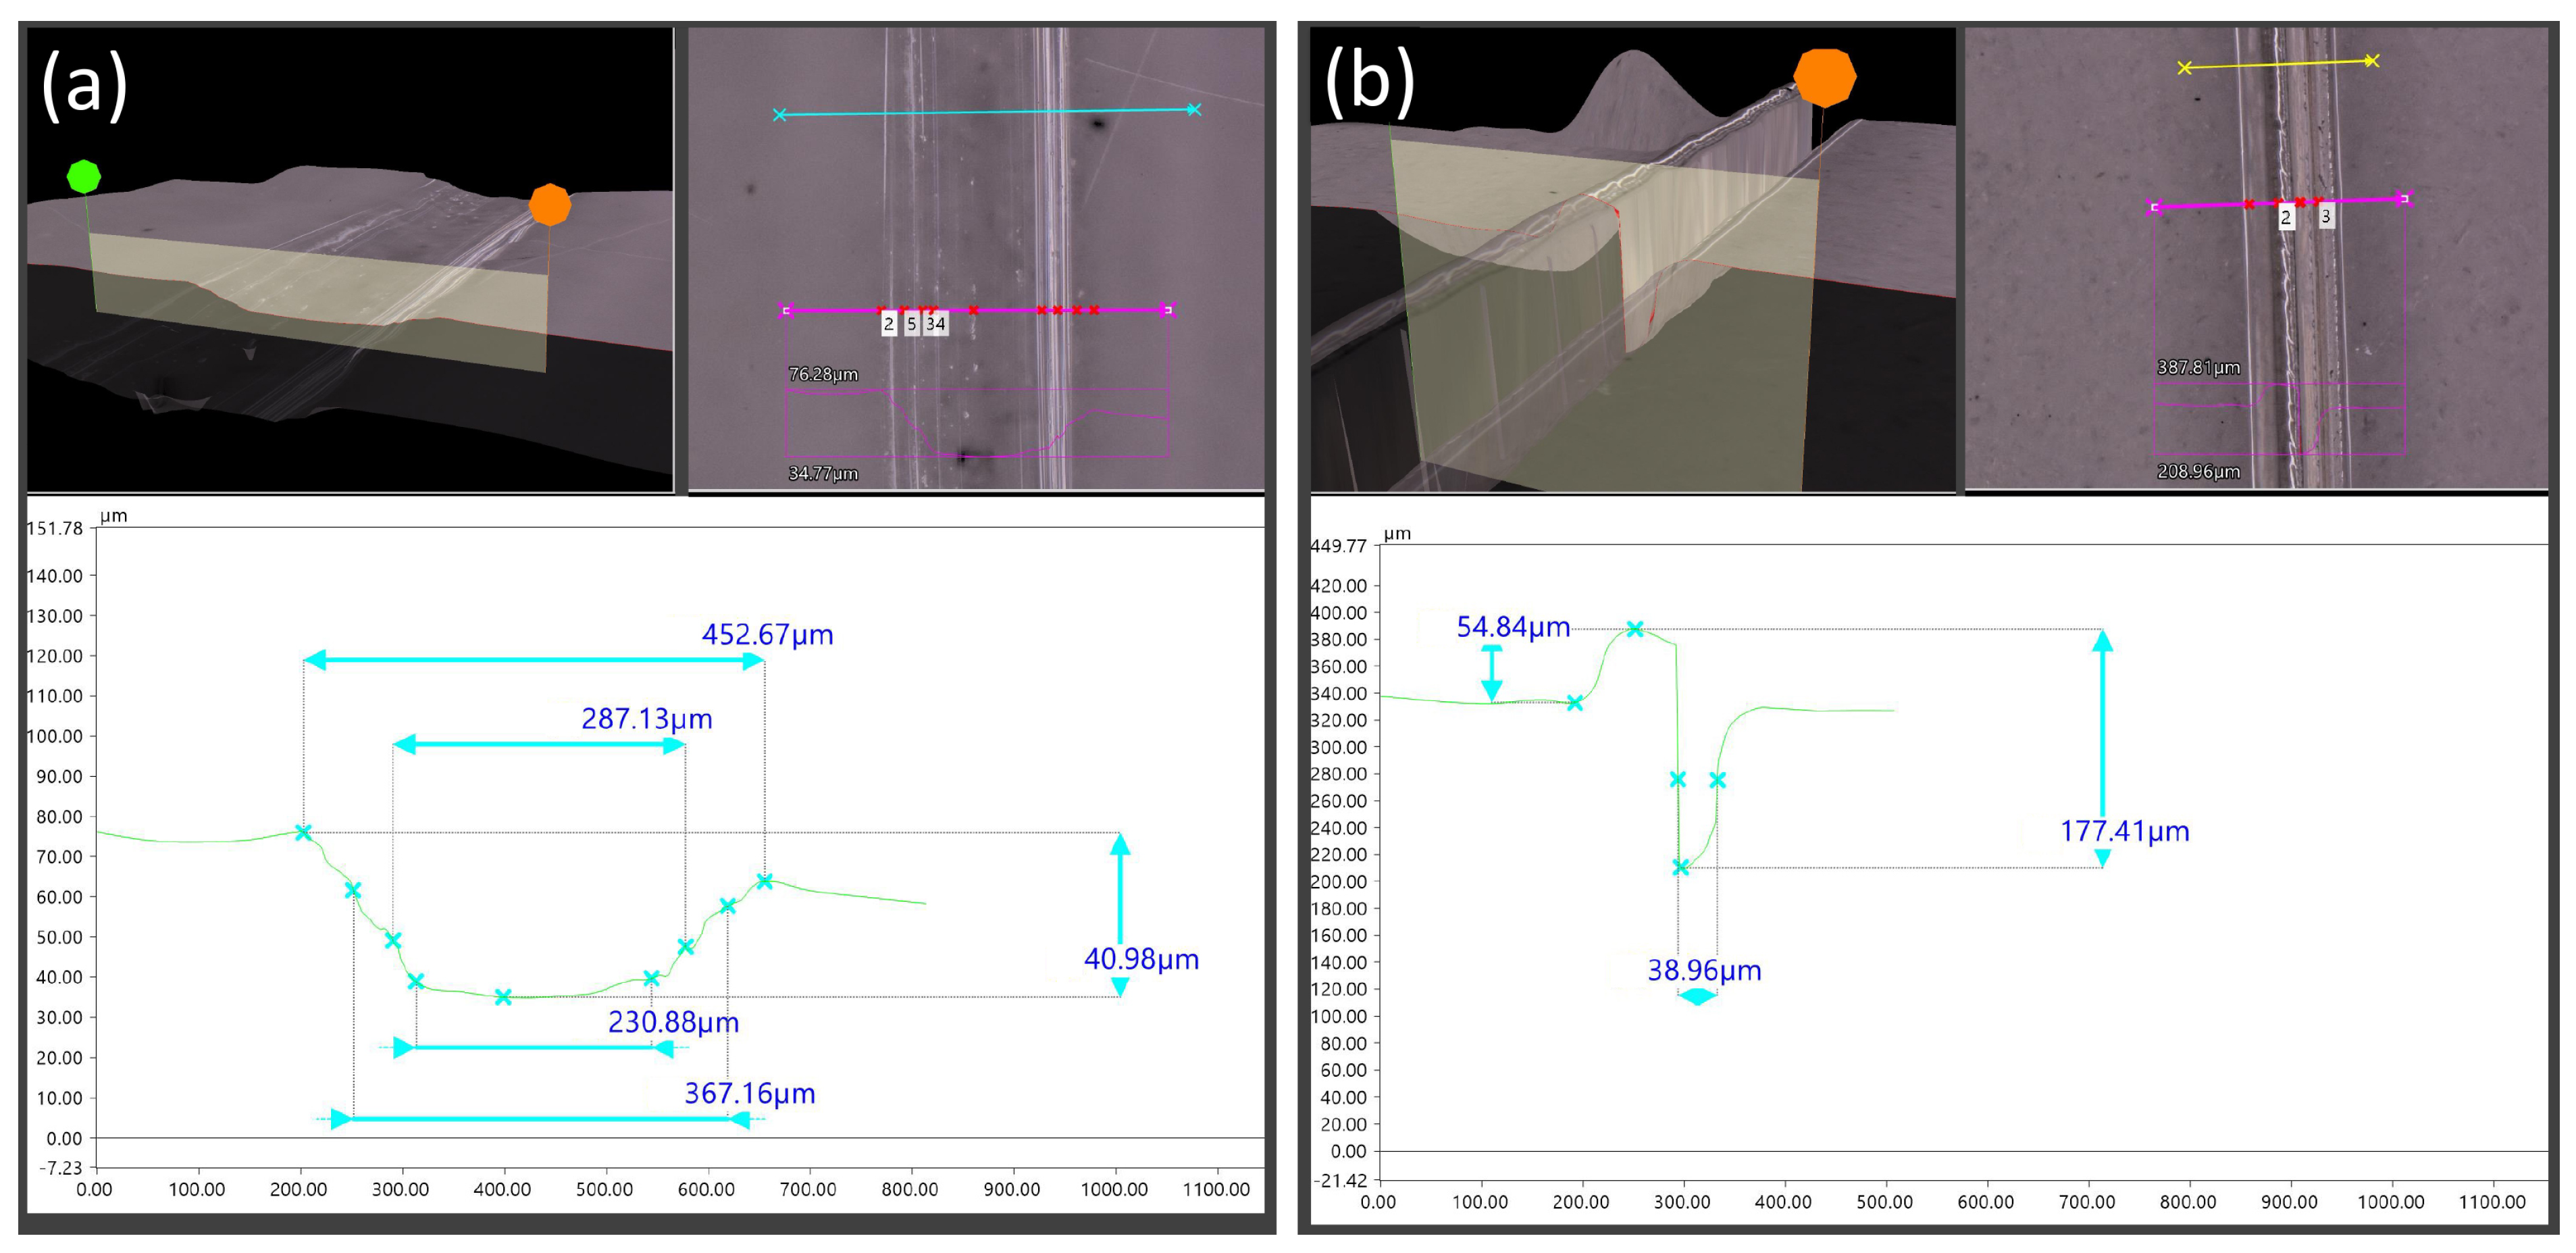
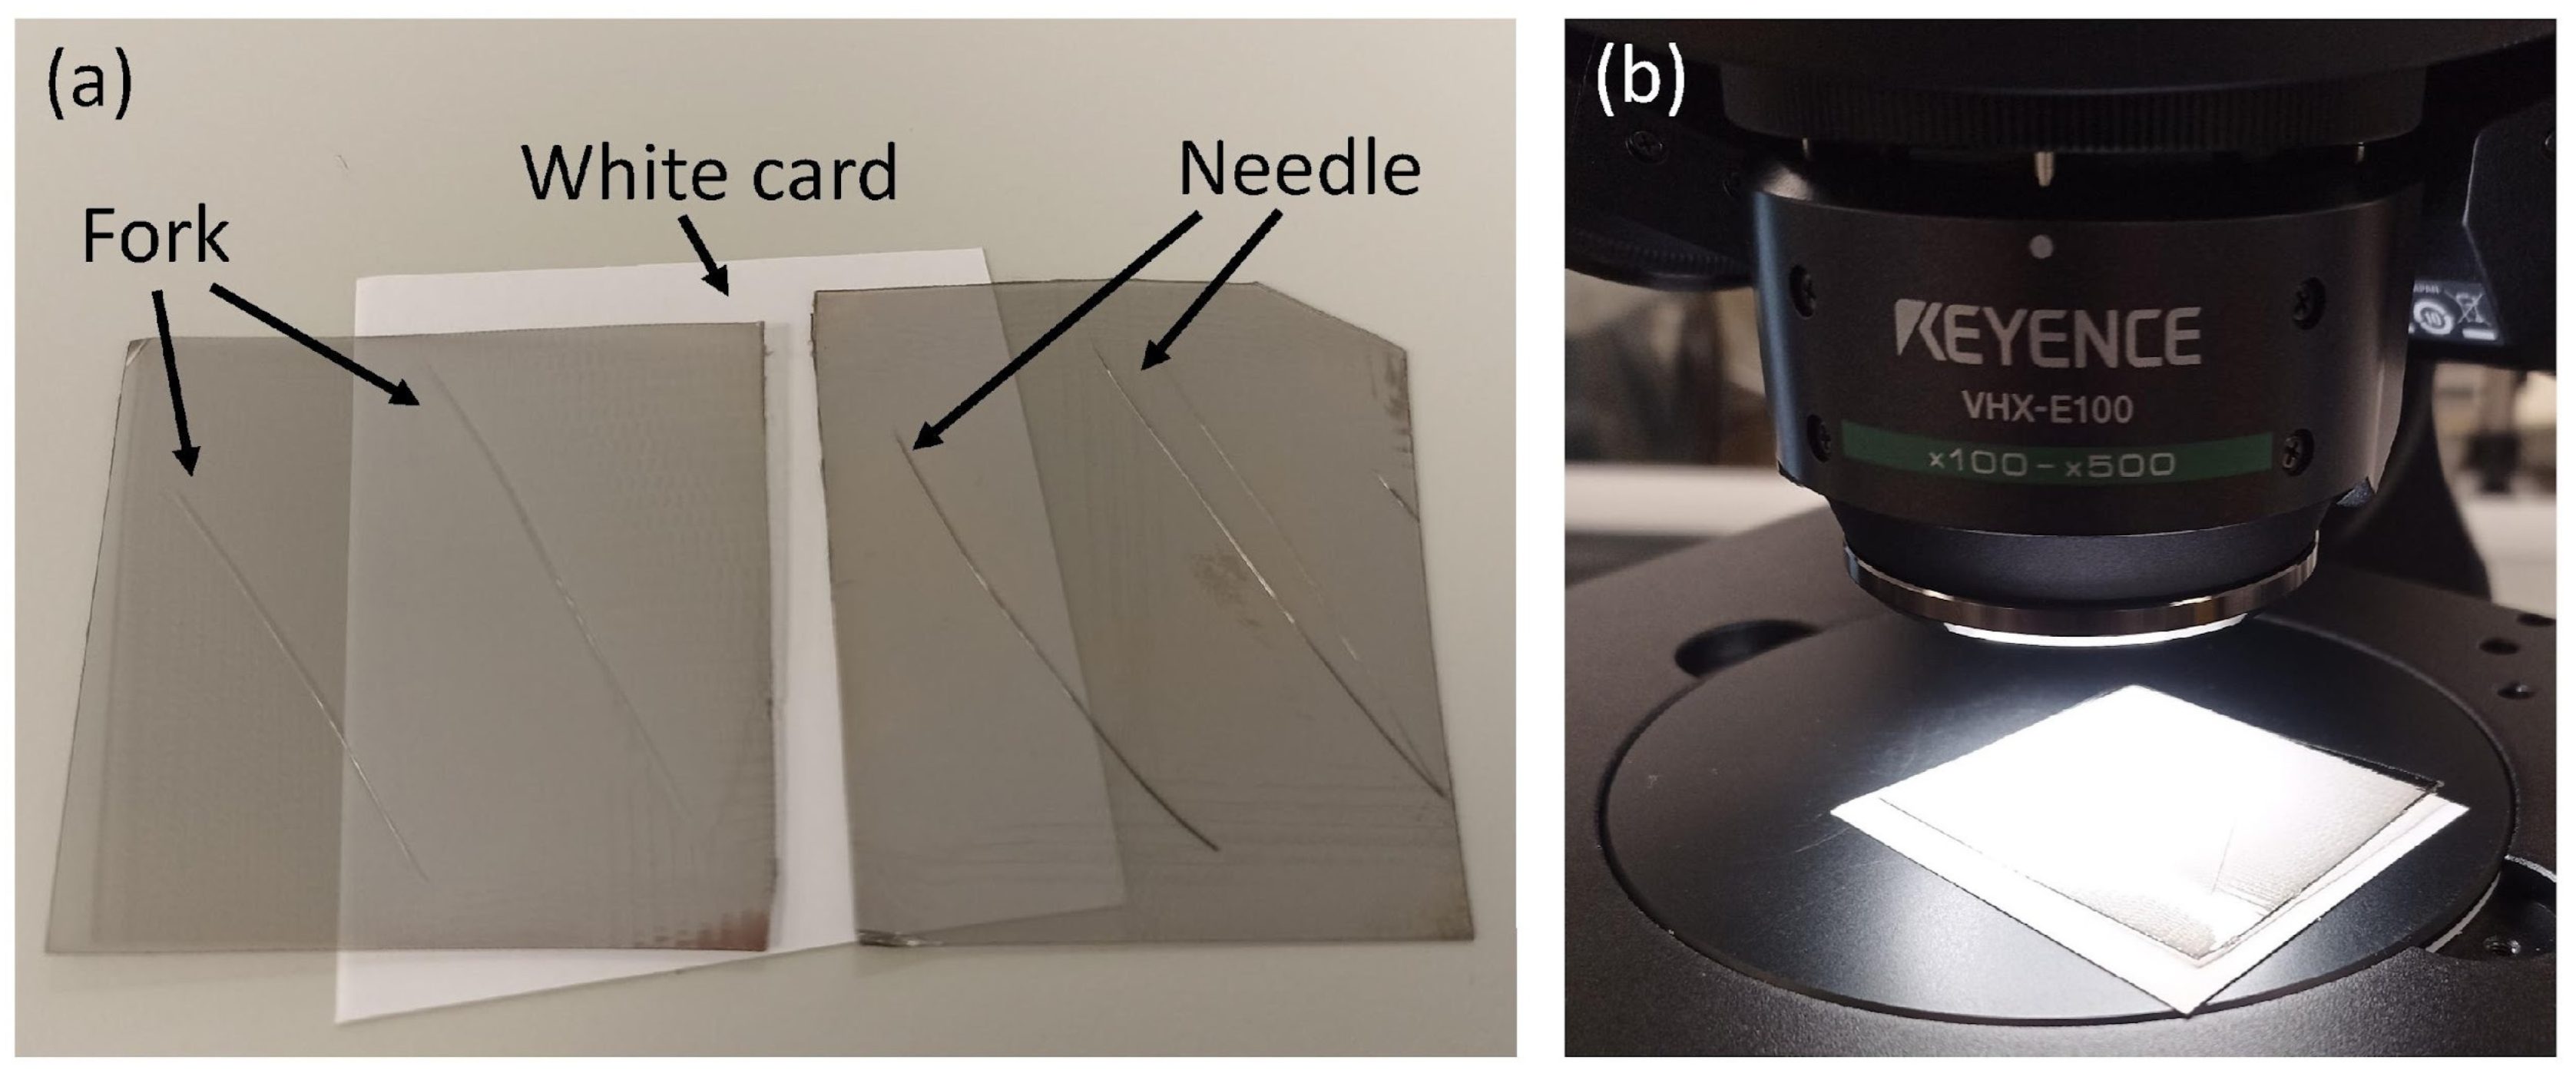
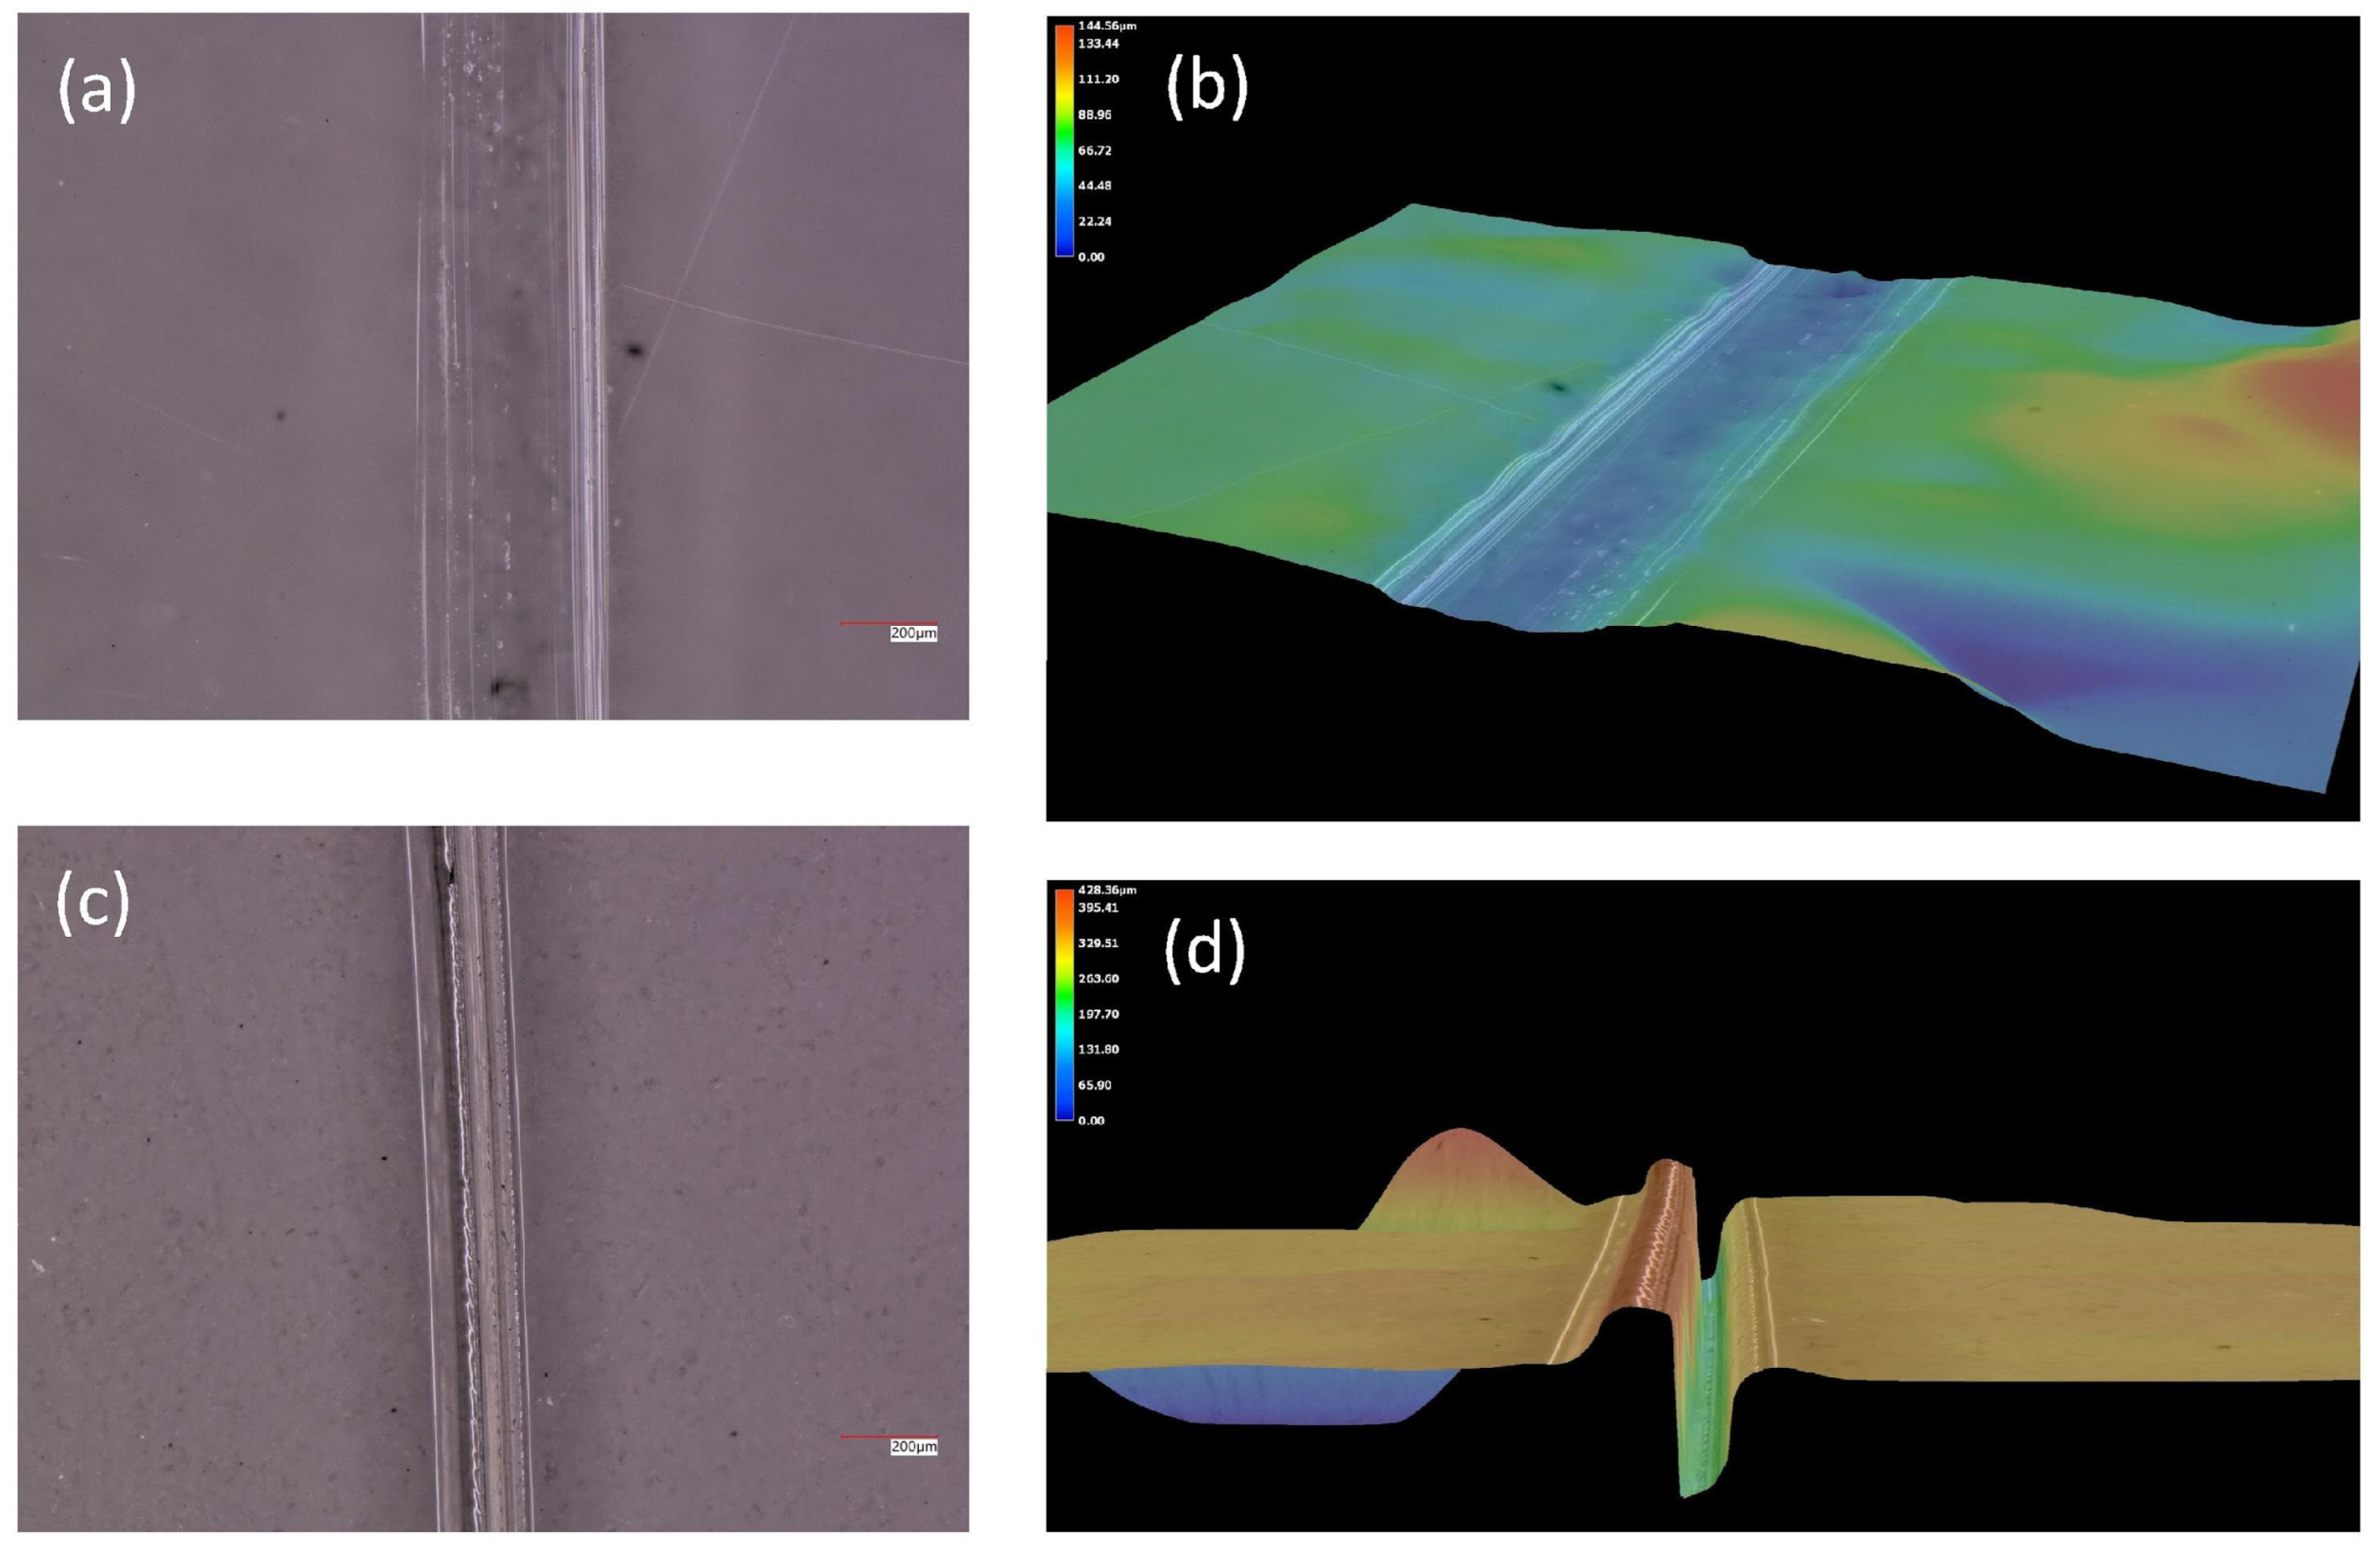
The scratch samples were examined to understand the material displacement occurring from the different scratch types (fork and needle). A Keyence VHX digital microscope VHX-7000 (with VHX-7100 fully-integrated head) from Keyence, Osaka, Japan, was used to examine the scratches. With the packaging being transparent, in order to correctly detect the scratch samples on this digital microscope, the samples were coated with a thin layer (<20 nm) of gold and palladium (Au/Pd) mix using the Quorum Q150R S Sputter Coater. After the coating was applied, white card was placed behind/under the sample to provide a contrasting background for the sample (Appendix A, Figure A2), allowing the sample to be visualised under the microscope. The scratch images (Figure 5 and Appendix A, Figure A3) were captured using the VHX-E100 lens (×100–×500) (Appendix A, Figure A2), selecting a focus setting of ×150. This approach was chosen over other methods such as atomic force microscopy (AFM), as industries are unlikely to have access to equipment such as AFM, whereas they could use a microscope.
In the Keyence digital microscope software (VHX7000N Ver 3.0.34.332, System Ver 1.01, VHX Control System Ver 21.02.24.0A(1.18) Ver 01.00.00.04 Copyright © 2022 Keyence Corporation), the images can be visualised as a three-dimensional (3D) map to further understand material displacement and how far the material is being displaced or deformed by the scratches, through the colour-coded 3D map (Appendix A, Figure A3) and cross-section analysis (Figure 5).
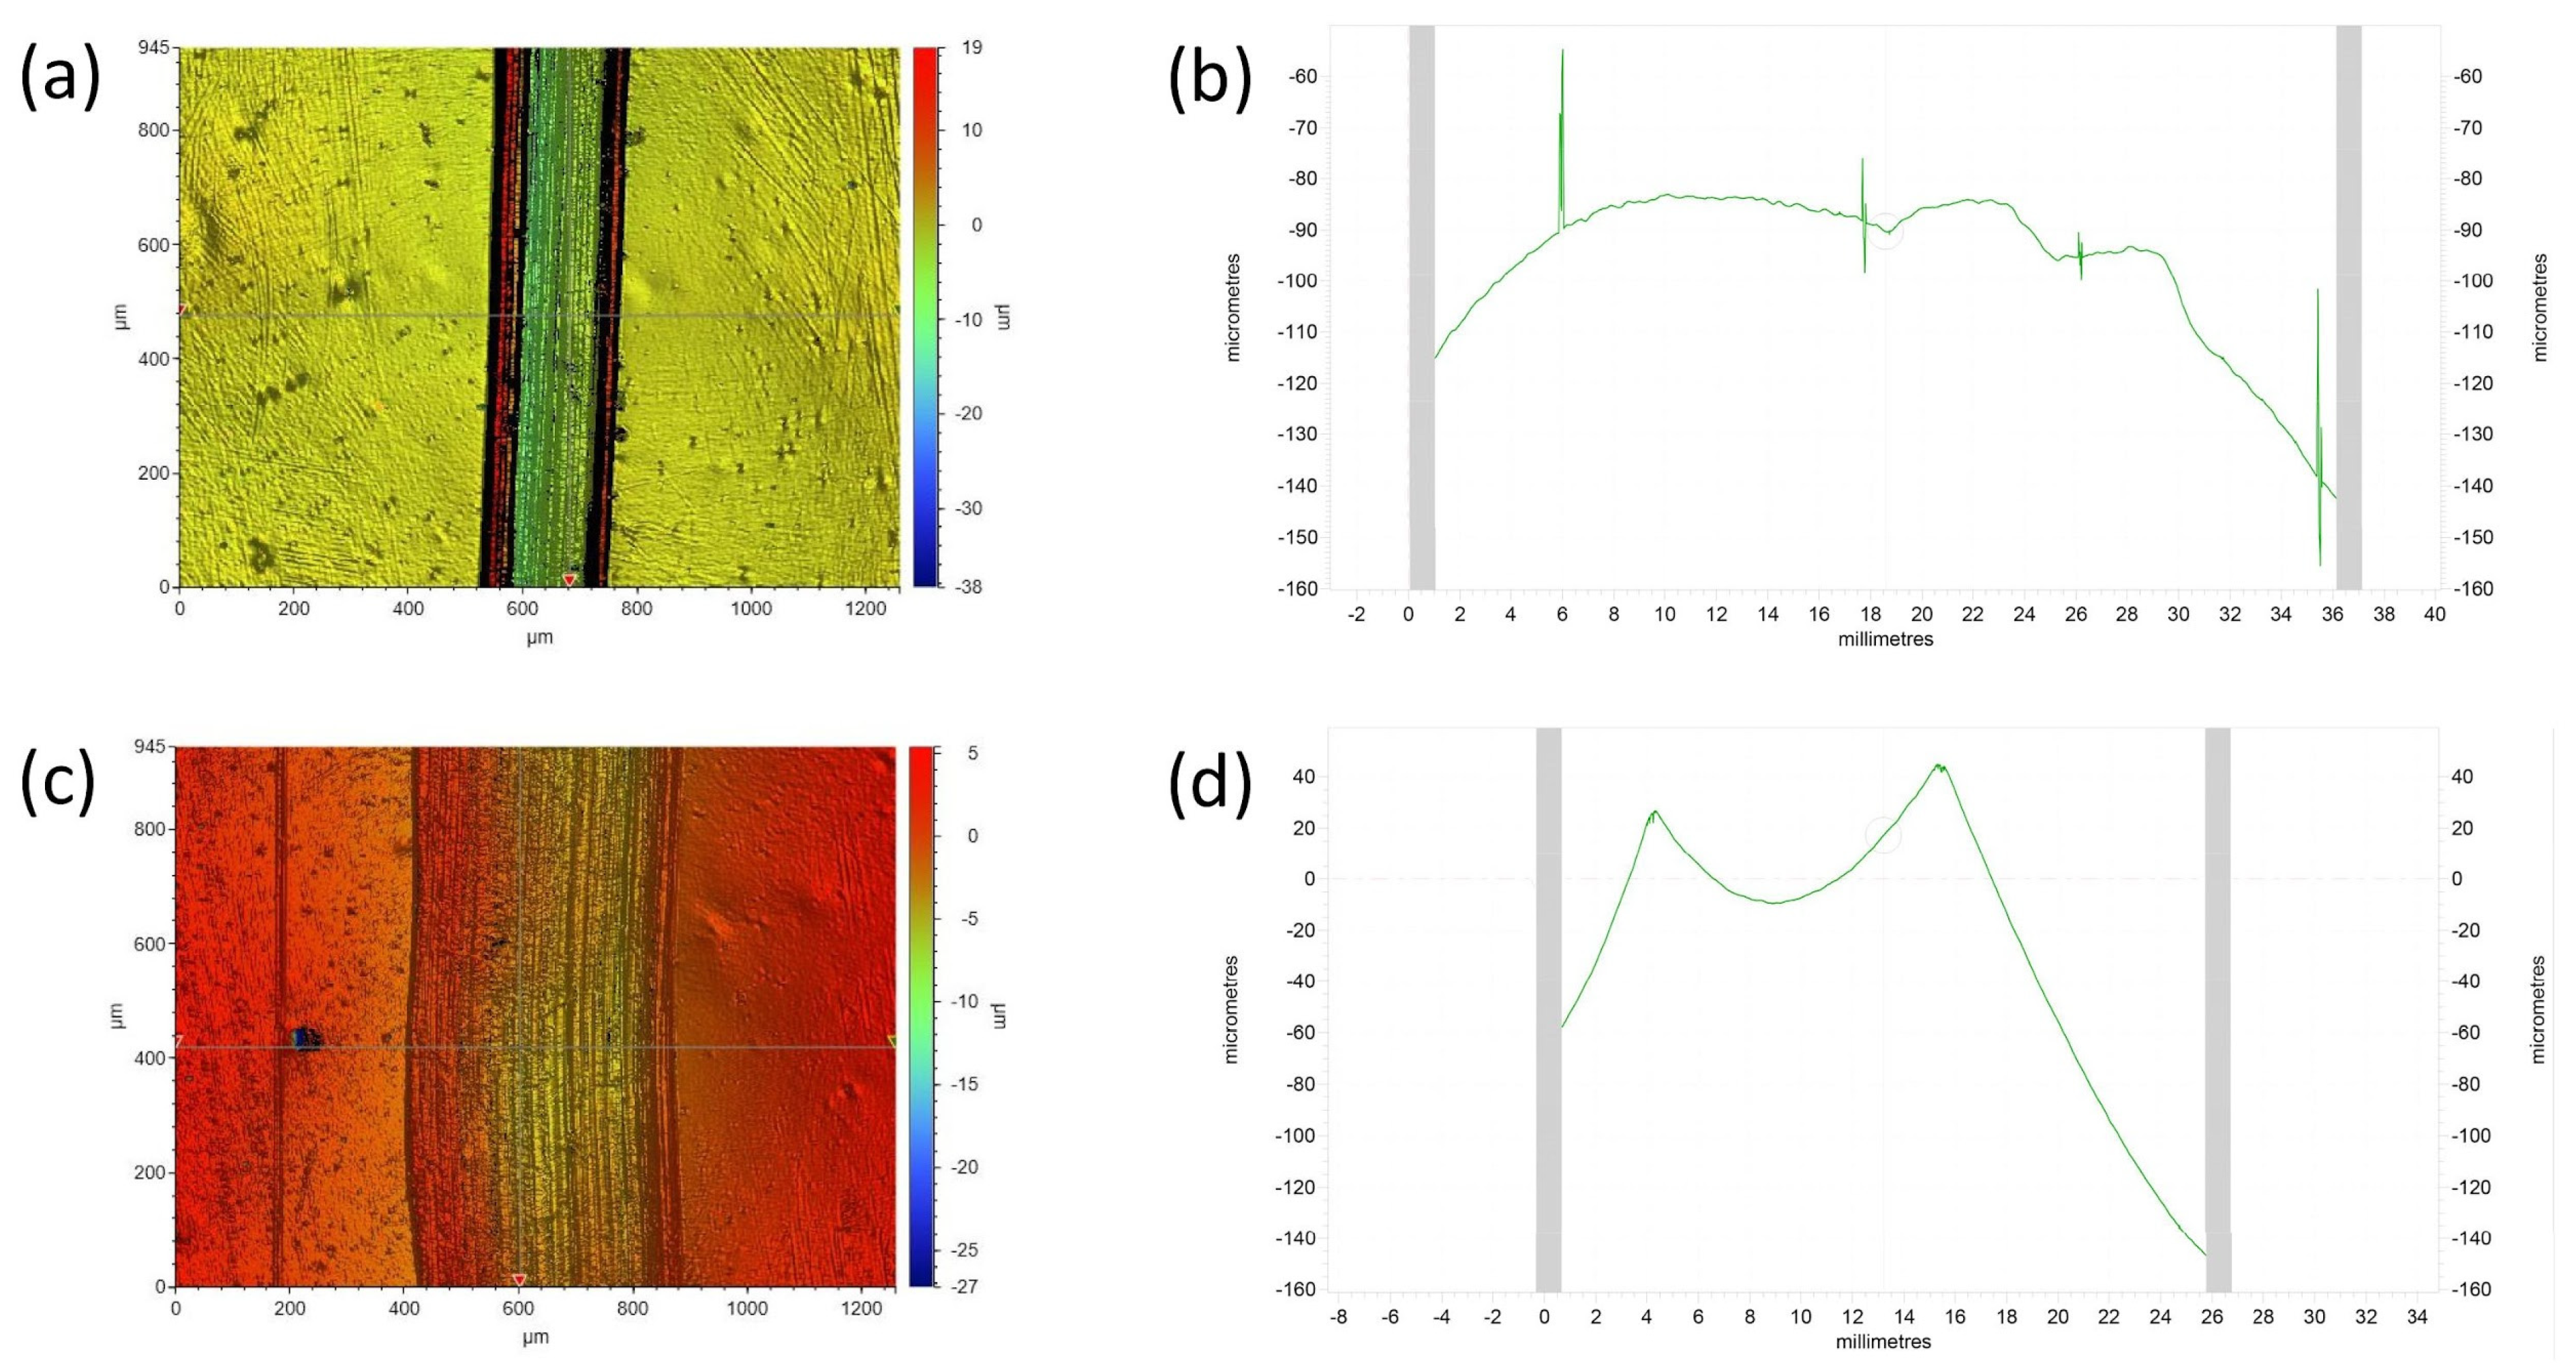
As the method of scratching the packs was a manual process, an averaging approach was deemed best to determine the scratch profiles. The scratch profiles were captured in the metrology laboratory to capture the mean width and depth of scratches (Talysurf, Taylor Hobson, Leicester, UK); optical measurements (Bruker, Billerica, MA, USA) also allow for a further understanding of the x and y profiles of the scratches and enable us to study the amount of material displacement caused by creating the scratches (Appendix A, Figure A4; Figure 6; and Table 2).
The Talysurf (Taylor Hobson) had a resolution of 0.4 nm [36], and at the time of capturing the measurements, a tip diameter of 2 μm was used. The width measurements show a smaller standard deviation, indicating consistent and less variable results. In contrast, depth measurements have a higher standard deviation due to greater variability. This is due to the Talysurf stylus tip geometry: when measuring width, the stylus moves over the smooth scratch shoulders, while depth readings depend on reaching the groove bottom, which can be uneven or obstructed. Additionally, plastic rebound after scratching affects depth more than width, as the groove bottom can spring back and cause depth variations.
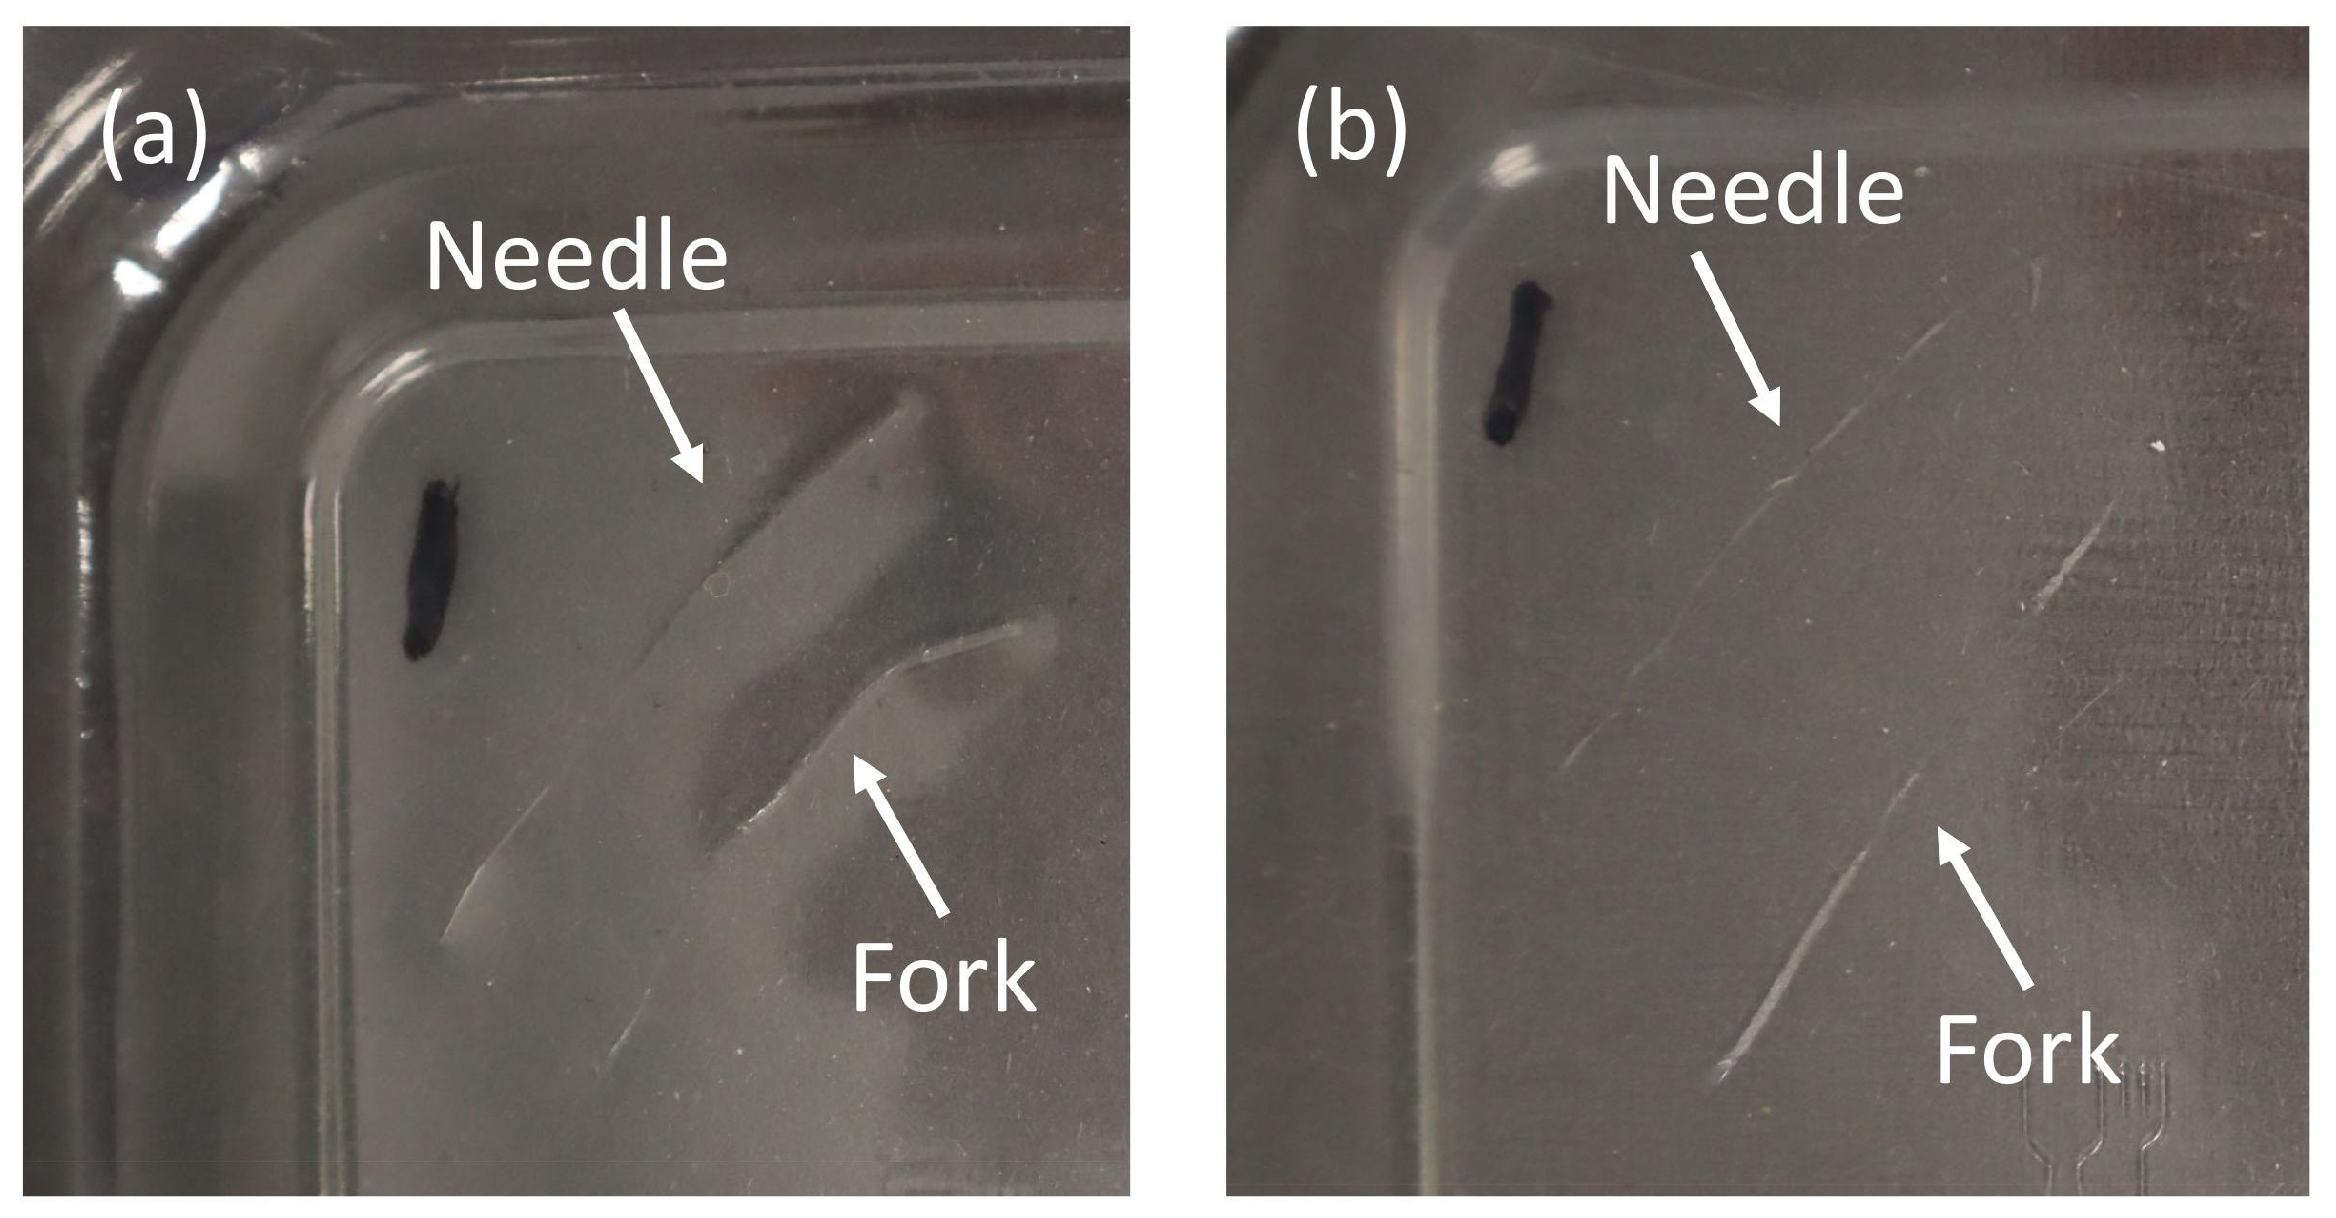
Two scratches were applied to each area of the unused packs prior to fouling, consisting of one needle scratch and one fork scratch (Appendix A, Figure A5). A new pair of scratches were applied to the next new area of the pack to simulate consumer scratch damage that may occur at the point of consumption; this also allowed for testing scratches over time throughout the different wash cycles in order to examine any changes that may occur with regards to both cleanliness and appearance.

4.1.2. Fouling Packs

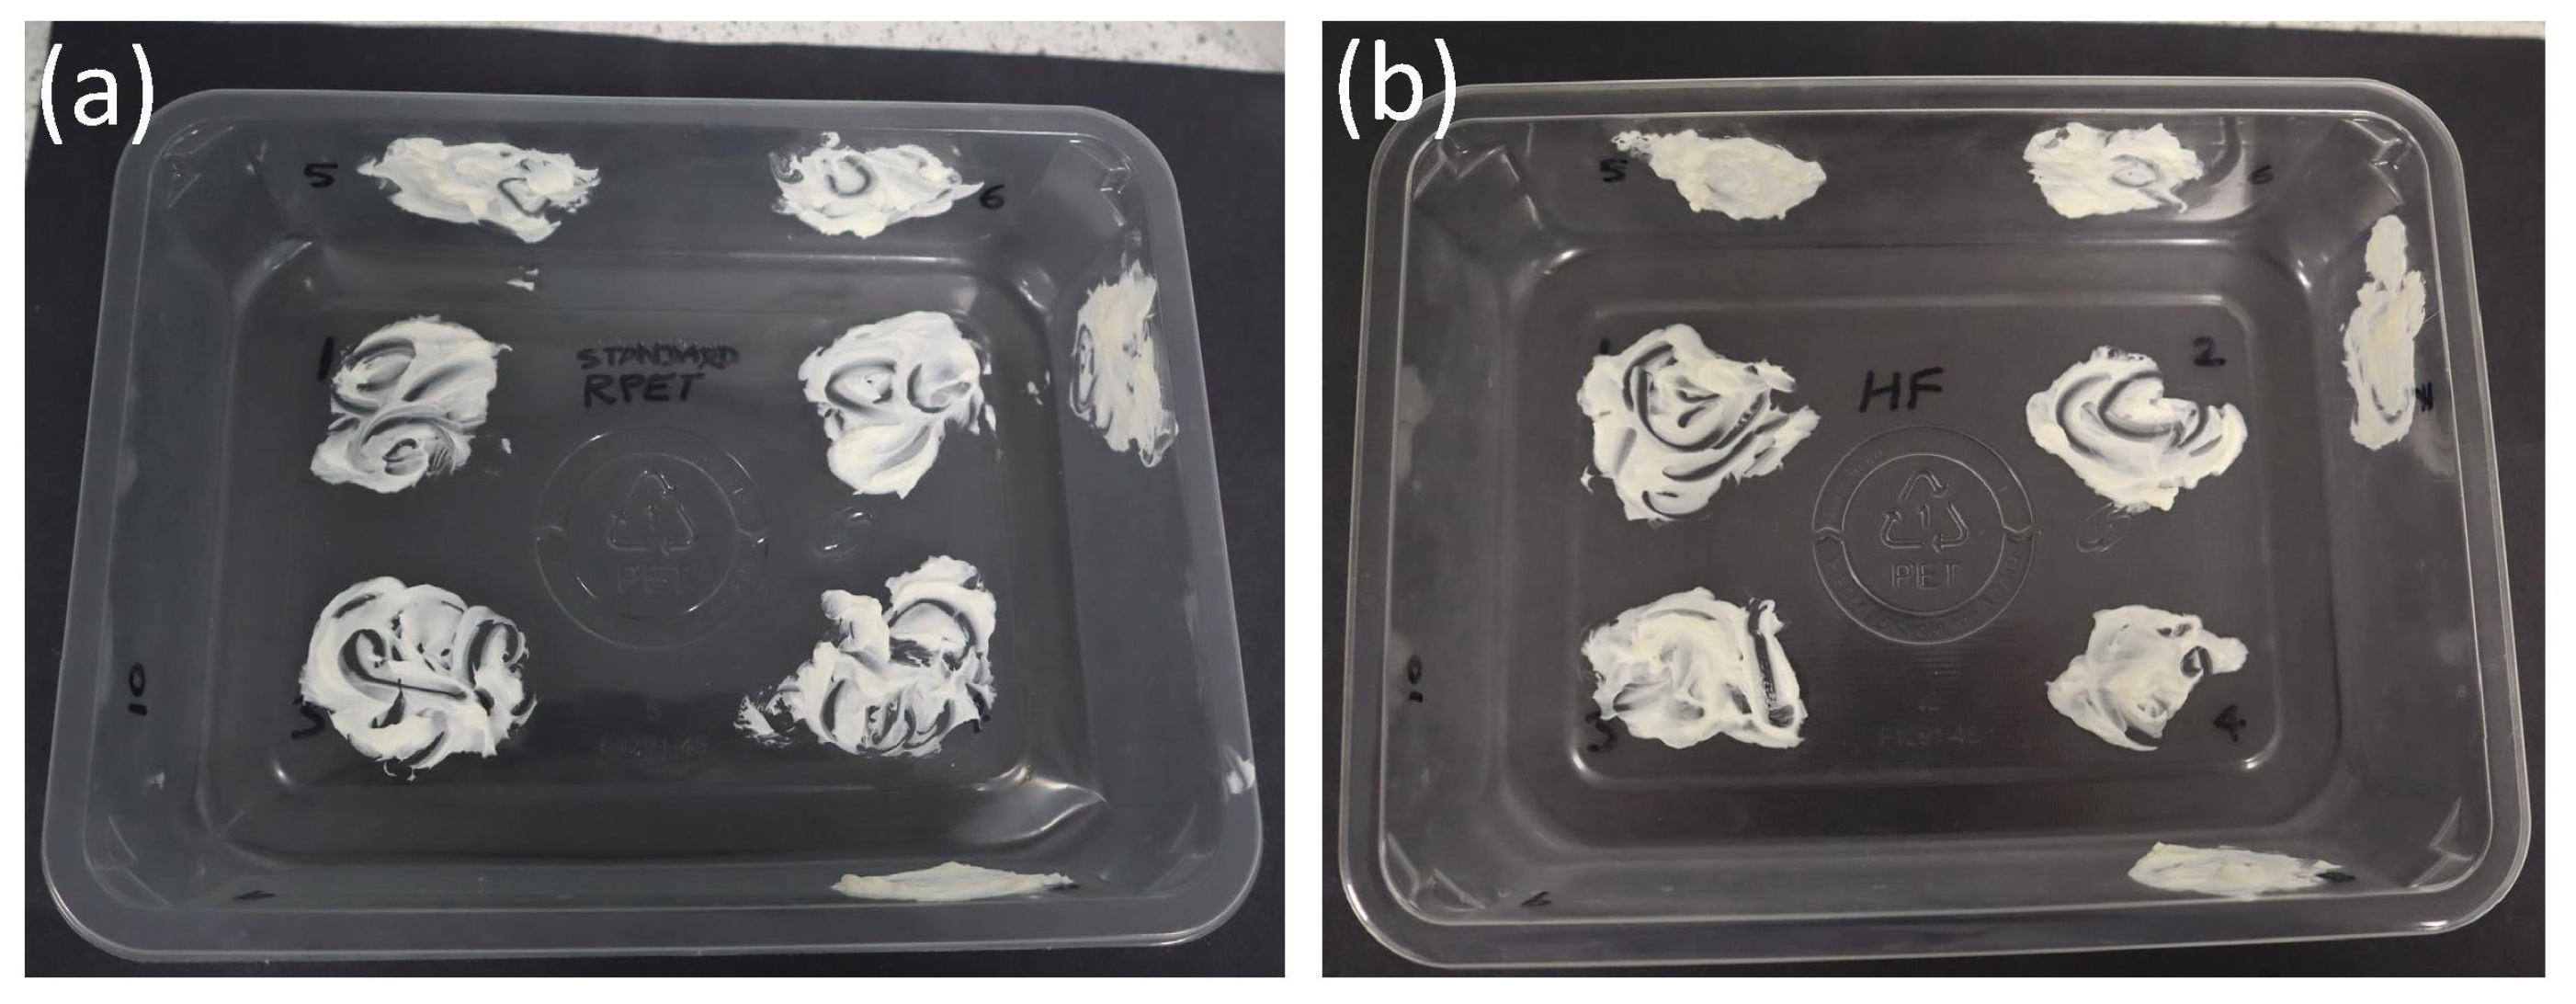
To foul the packs, 0.5 g of cream cheese was applied in small circular motions to each area of scratches (needle and fork scratch) (Figure 7). Informed by a previous study [16], cream cheese (Philadelphia®) was chosen to foul the packs as it is easy to apply and is easy to see but is not easy to wash as it is fat-based. This heavy fouling of the scratches was to maximise the likeliness of food getting trapped in the scratches and to rigorously test the cleanliness of the scratches on the packs. This fouling method was selected due to the current lack of standardised protocols in the field [16]. The researchers acknowledge that more extensive fouling, such as that containing decomposed organic matter, will also be required in the future for complete validation of the suitability for reuse.

4.1.3. Washing and Drying Packs

The industrial ware washer (CLASSEQ: G400DU0) was set to a ‘standard wash’ cycle, as defined in Study 1. No detergent was used in the wash cycles when washing the packs throughout this study (Study 2); this was to put the cleanliness of the individual scratches to the test to detect if any food was trapped in the scratches. In the scratching and fouling testing, both fouled packs (one heat-resistant PET and one rPET) were washed together, side by side. This approach was taken for repeatability to ensure that each pack would experience the same pressure and amount of water.
Following a wash and rinse cycle, a drying chamber (VWR: INCU-Line 68R) was set to 55 °C with both scratched and fouled packs dried at the same time, side by side, with the sealing edge facing down on the internal drying racks (allowing for better air and heat circulation to increase drying time) for a duration of 3 min.

4.1.4. Fast Method of Analysing Change in Scratches’ Cleanliness

To assess the cleanliness of the scratches themselves, ATP swabs were used along the length of each scratch, moving the swab back and forth along the length of the scratch, whilst rolling the swab to ensure the swab was sufficiently exposed to any fouling or dirt that may have accumulated in the scratch. ATP is an enzyme found in all organic matter [16]. Informed by a previous study [37], ATP swabs were chosen over other cleanliness of food contact surface assessment approaches that exist in the food industry (e.g., chromogenic culture media, colorimetric detection of CO2, and impedance microbiology) due to its ease of use, fast response, and low cost; it is the most common analytical method used.

4.1.5. Visual Observations and Corner Deformation at Key Milestones

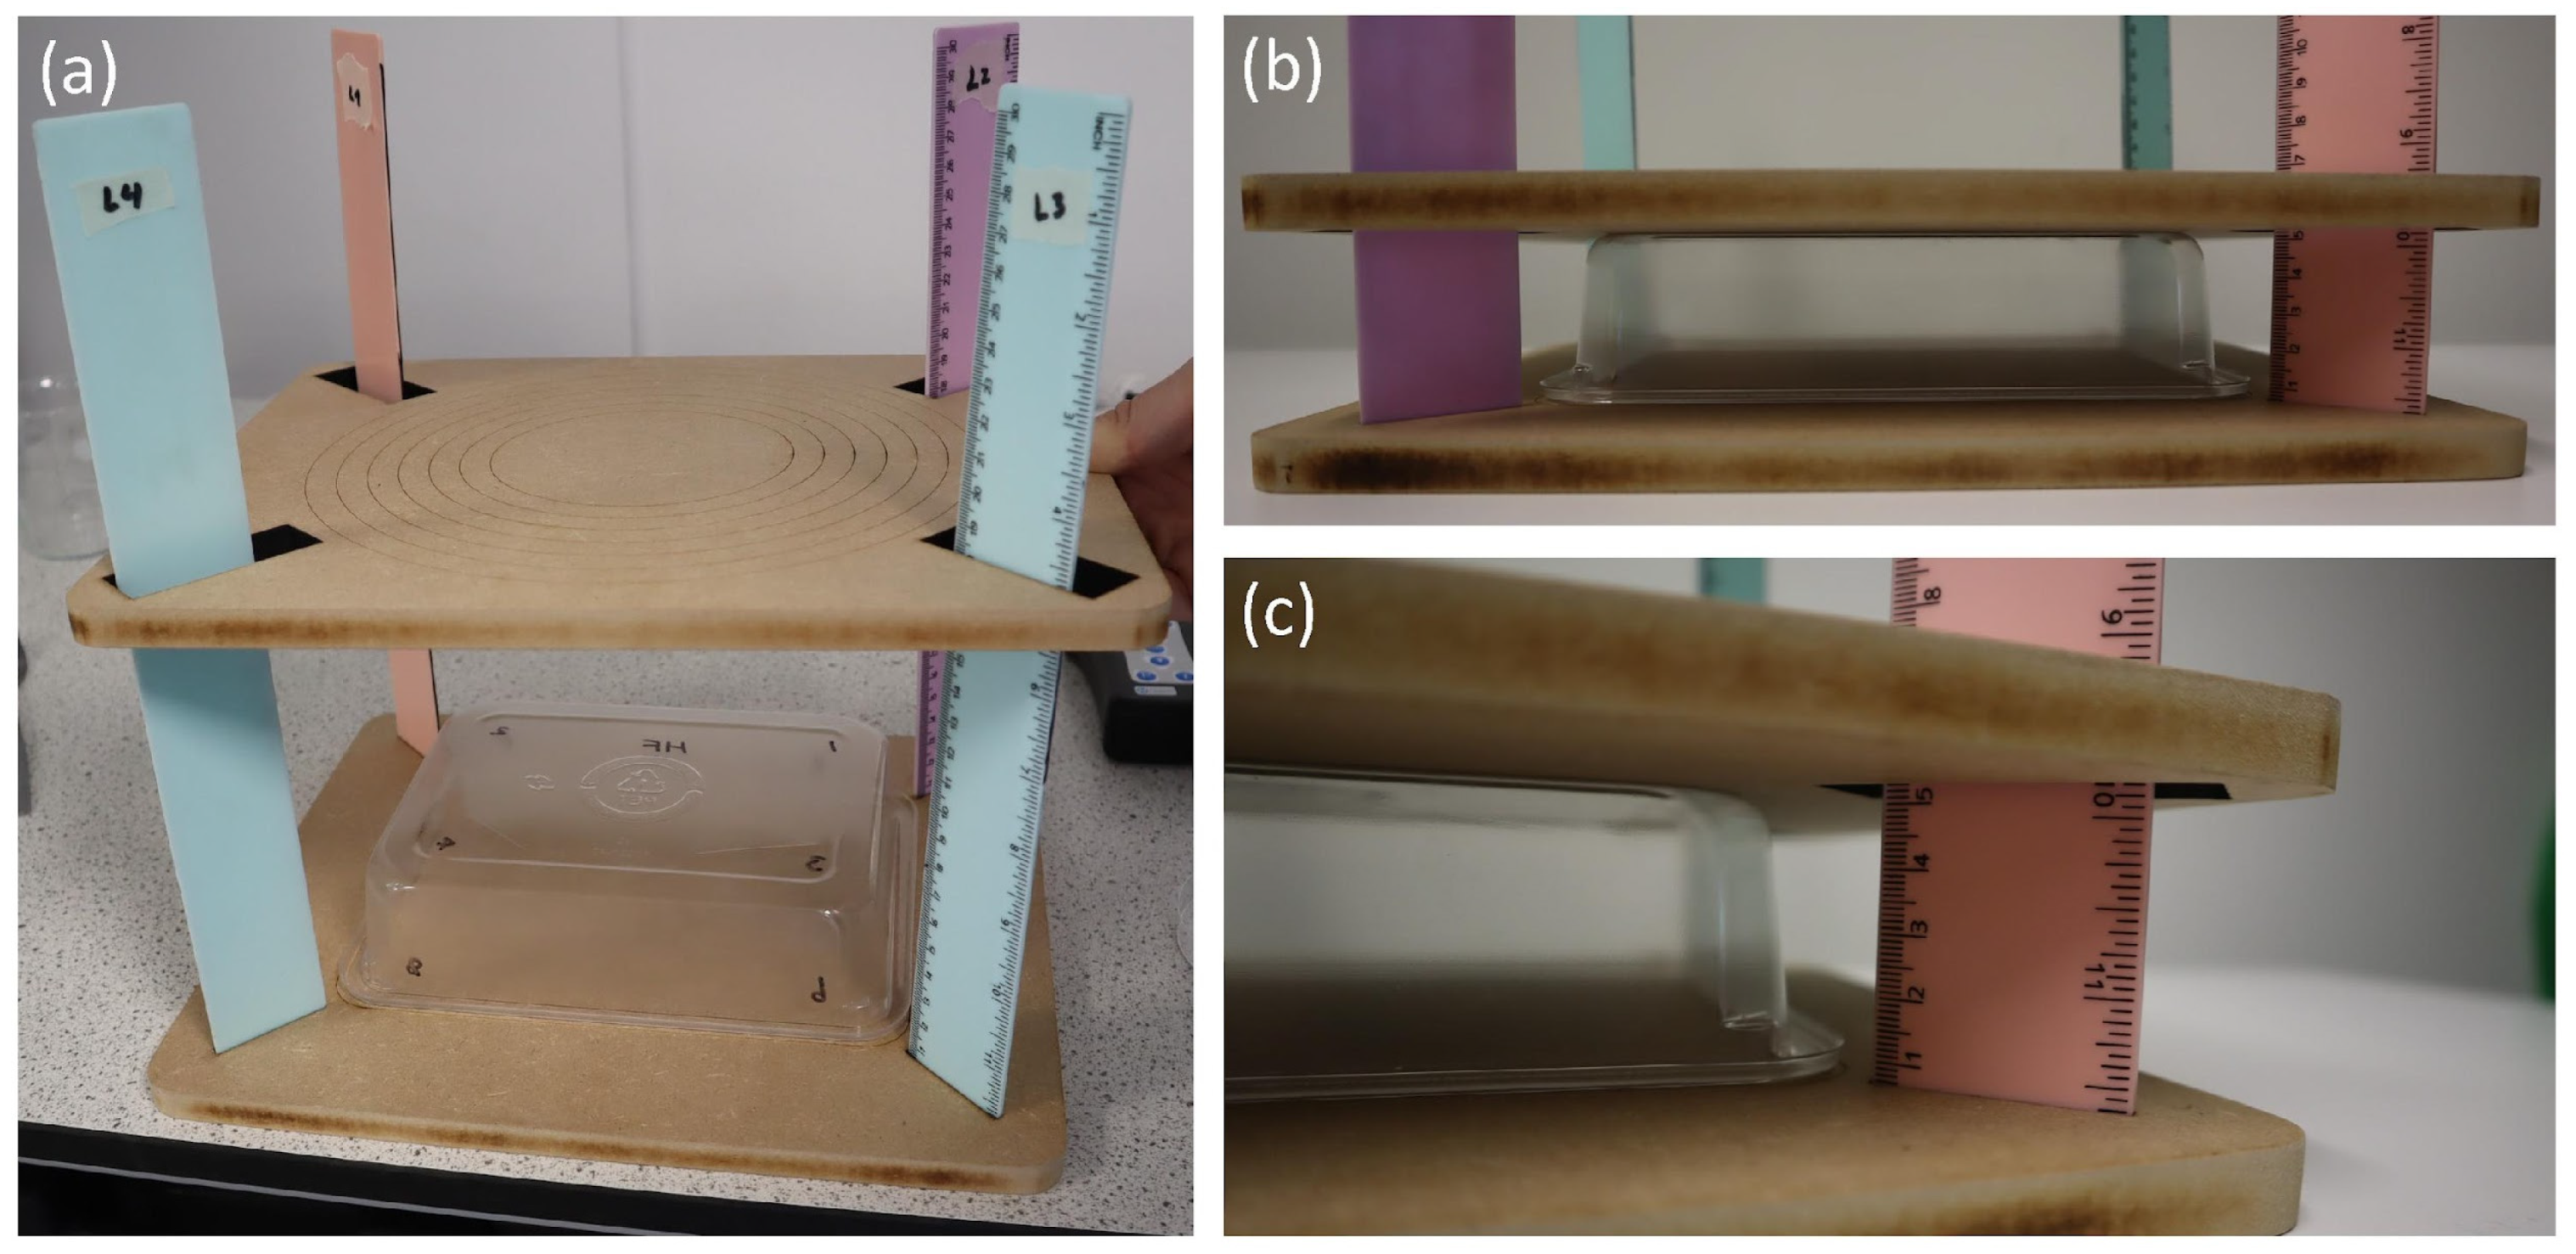
Visual observations were captured and photos taken when significant changes occurred. The corner deformation of the packs in millimetres was captured using the same test rig that was used for Study 1 in order to capture the corner deformation at two key milestones after 5 and 10 cycles. This was achieved by applying the top part of the test rig to the pack with no additional weight in order to capture corner deformation of the four corners, following the fifth and tenth wash cycle (Appendix A, Figure A6).

4.2. Results

A total of 146 ATP swab readings were taken throughout the 10 wash cycles of this study. Out of these, only two readings taken from two scratched areas on one pack on the sixth cycle read higher than 30 relative light units (RLUs) when swabbed. This was unusual and was likely caused by manually swabbing a much larger area than the scratches themselves, all other scratched areas on the same pack on the same cycle had the readings of 0 RLUs. As such, these two results appear to be anomalous, but due to the nature of ATP swabbing interfering with the sample, a repeat measurement could not be taken. All the other 144 ATP swab results taken across all ten scratched areas throughout 10 cycles were all under 30 RLUs, meaning that the scratches were within the ‘food-safe’ RLU readings category (according to this one method of testing) without using any detergent in the wash cycles. However, the researchers acknowledge that more extensive methods of cleanliness/hygiene testing would be required in the future for complete validation of the suitability for reuse.
With increasing numbers of wash cycles, the visual appearance of the packs did change slightly, with the packs becoming more cloudy or opaque, with an increasing number of watermarks (residue on the surface of the packs from hard water) and, as seen in a previous study, visible fouling and greasiness were observed for longer wash durations while using 2 g cream cheese on plastic packaging [16]. This was to be expected as no detergent was used.
The amount of corner deformation captured at key milestones (unused pack/0 cycles, 5 cycles, and 10 cycles) of the scratched and fouled packs varied between the material type of the packs. The heat-resistant PET experienced no corner deformation, whilst rPET had a maximum corner deformation of 2 mm (Table 3). The measurements were captured on an unused pack (no scratches, fouling or washing), after the fifth wash cycle, and after the tenth wash cycle.

5. Study 3: Comparing Changes in Physical Appearance Across All Studies

Study 3 sought to collate and compare all 10 wash cycles’ deformation data against unused packs. The motivation of this study was to compare how each type of damage affects the 3D form of the packs, which in future can help to identify areas of weakness within designs of packaging for reuse applications in order to then help in the redesign of packaging that is suitable for reuse.

5.1. Method

5.1.1. Three-Dimensional Scanning Packs and Processing Scan Data

The Artec Leo 3D scanner was used to capture the 3D form data of unused packs and deformed packs for comparison. The scanner has a 3D point accuracy of up to 0.1 mm, a 3D resolution of up to 0.2 mm [38], and a 3D accuracy over distance of up to 0.1 mm + 0.3 mm/m [39]. Artec Studio 16 software was used to process the scan data. When converted into a 3D mesh, the 3D resolution is changed to 0.2 mm accuracy; it is then exported as an OBJ file (with MTL and JPEG files) so that it can be opened and analysed in 3D modelling software, including the 3D mesh and texture files for increased visual understanding when analysing the 3D scan data. When processing the 3D scan data from points to mesh, a standard wizard approach was used on Artec Studio 16 called ‘Autopilot’ in order to minimise any changes made to the data.
Processing the 3D scan data requires higher-specification computers [39,40,41]; throughout the studies, two different high-specification laptop computers were used to process the 3D scan data, and their specifications are displayed in Appendix B (Table A1).

5.1.2. Analysis and Comparison of Scan Data in 3D Modelling Software

Rhinoceros 3D (version 7) 3D modelling CAD software was used to analyse and compare all the 3D scan data from the unused and deformed packs. The computer device specifications used for analysis are outlined in Appendix B (Table A2). When comparing the 3D scan data, the sealing edge of each pack was aligned as closely as possible when overlapping/stacking the 3D meshes (OBJ files) in the software as a common point of reference when comparing the amount of deformation that occurred. Due to the complexity of the 3D form of the mesh (created from 3D scan data) captured from the natural deformation of the packs, the sealing edges were all aligned as closely as possible to the ground plane in the software. This was a manual process in the virtual environment, so it is subject to human error but is still the best approach for aligning all of the meshes due to the complexity of the 3D mesh geometry.
Individual Point Analysis Comparison
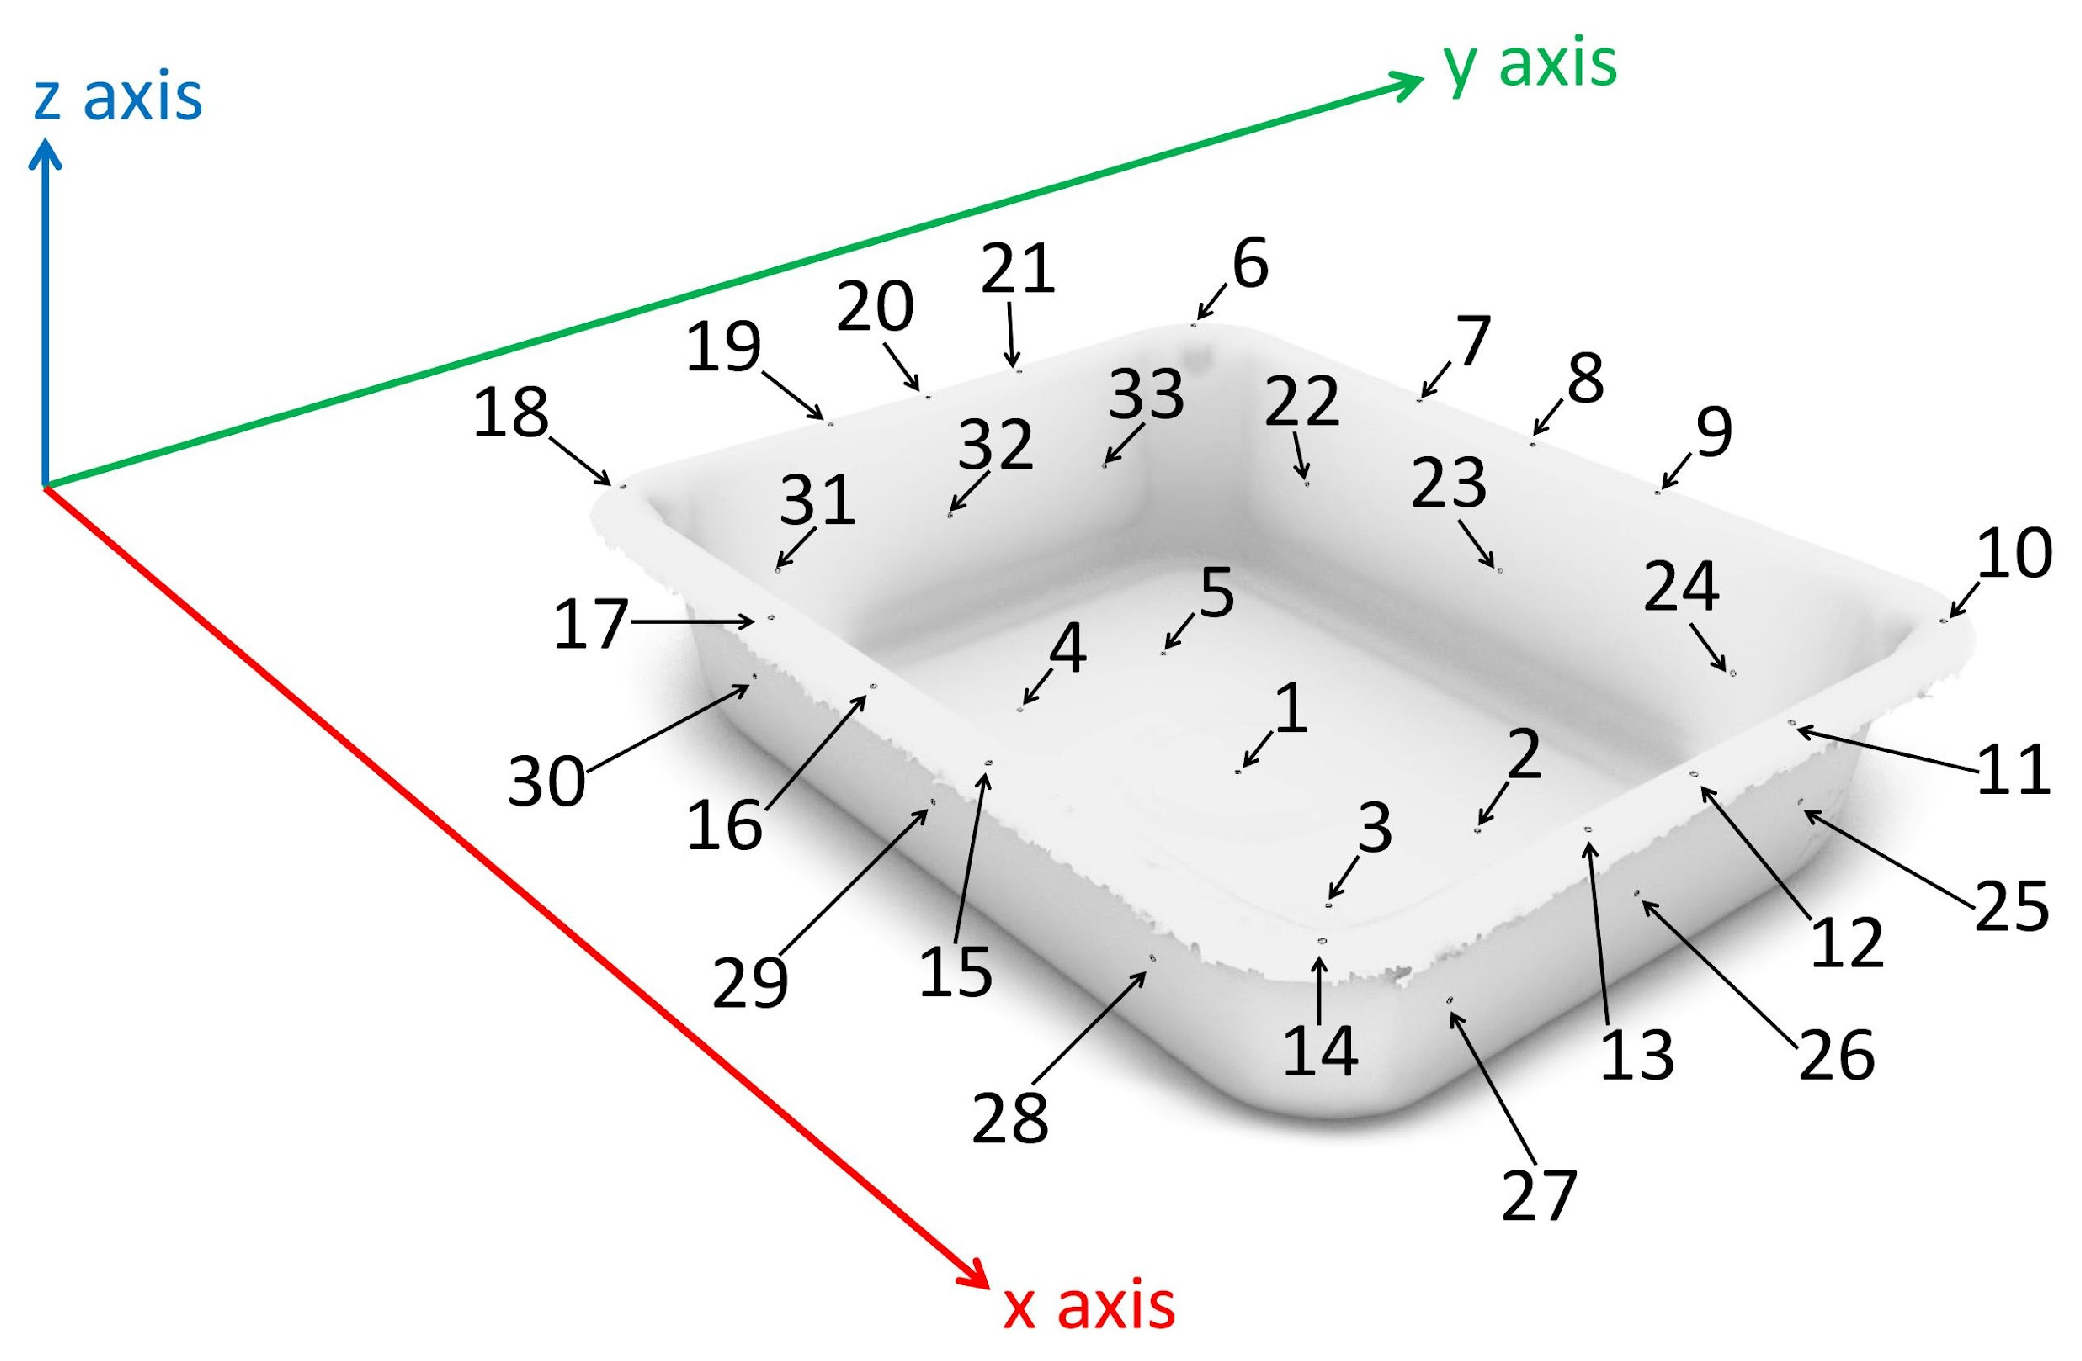
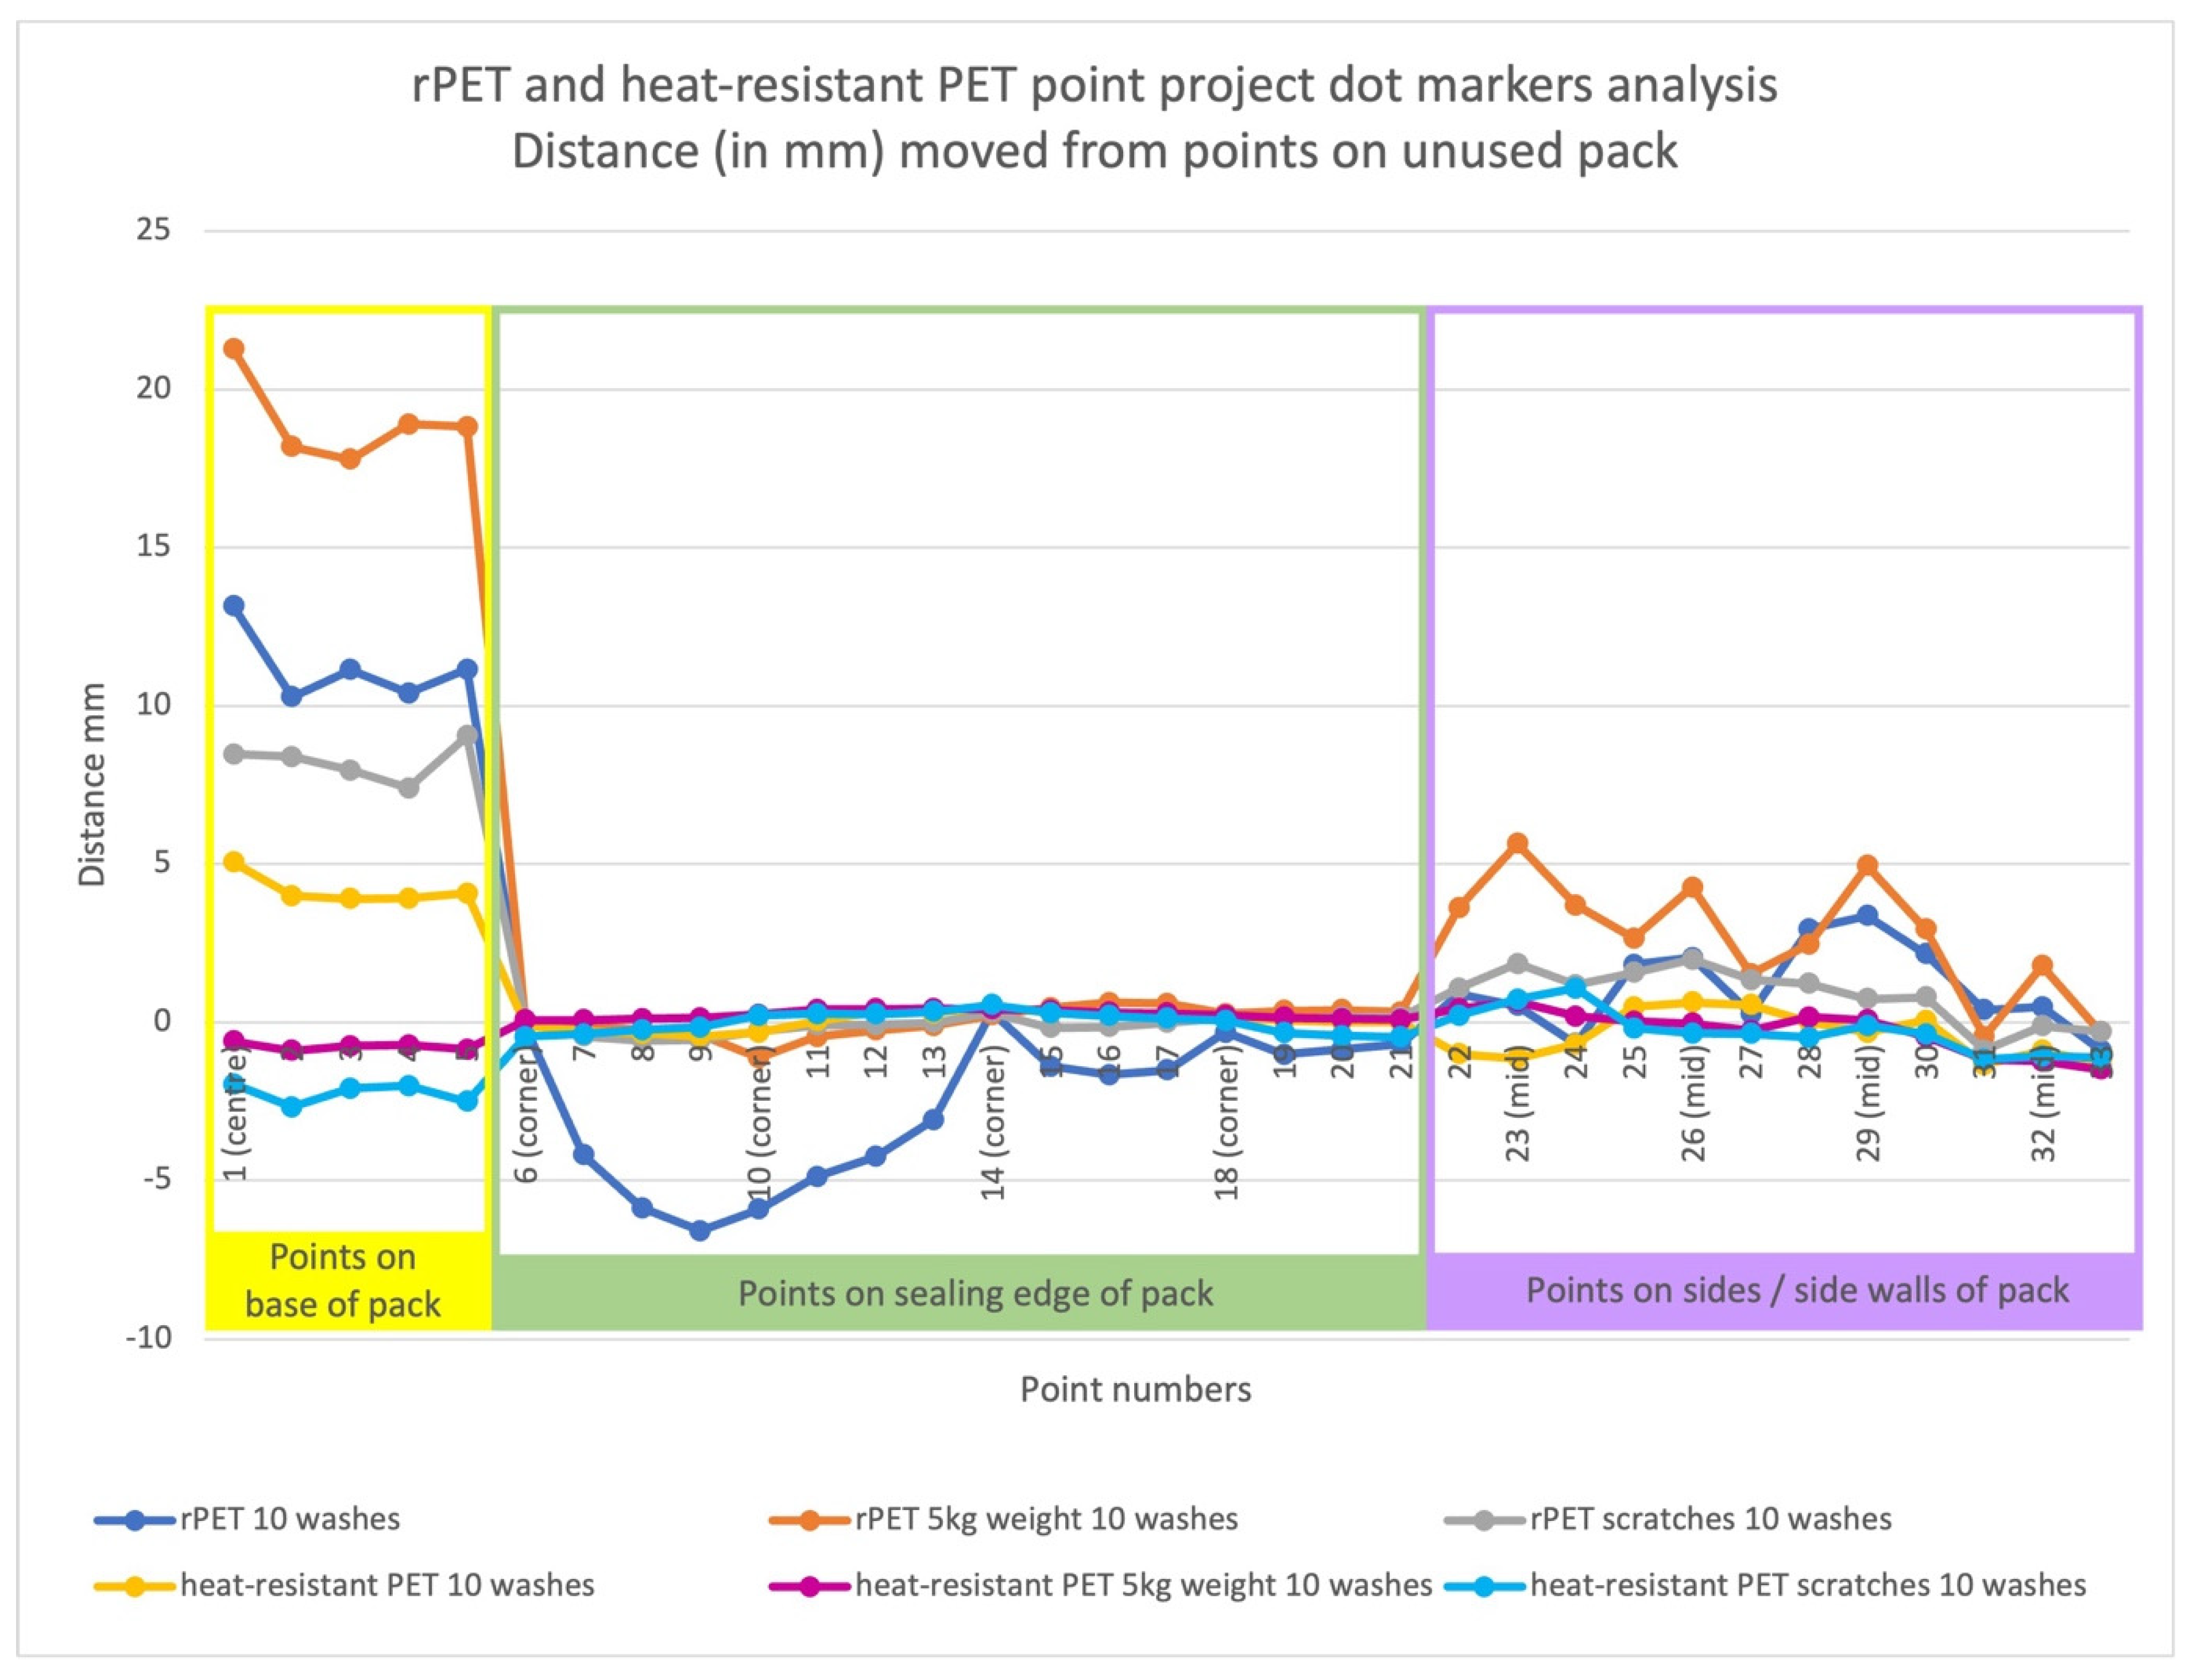
Digital dot marker artwork was projected onto both overlapping meshes (one unused pack mesh and one deformed pack mesh at a time) to create digital dot marker points on the surface of the meshes to measure the amount of deformation occurring on different parts of the pack. This was captured by drawing a straight line between the digital dot markers on one mesh to the other mesh to capture the distance it has changed by in a linear measurement. Digital markers were also projected onto the sides of the pack (numbered 22-33) as well as on the sealing edge (numbered 6-21) and base of the pack (numbered 1-5) to measure how much deformation occurred horizontally as well as vertically, the dot markers were numbered to identify the location of the markers for comparison (Figure 8).
Cross-Section Profile Analysis Comparison
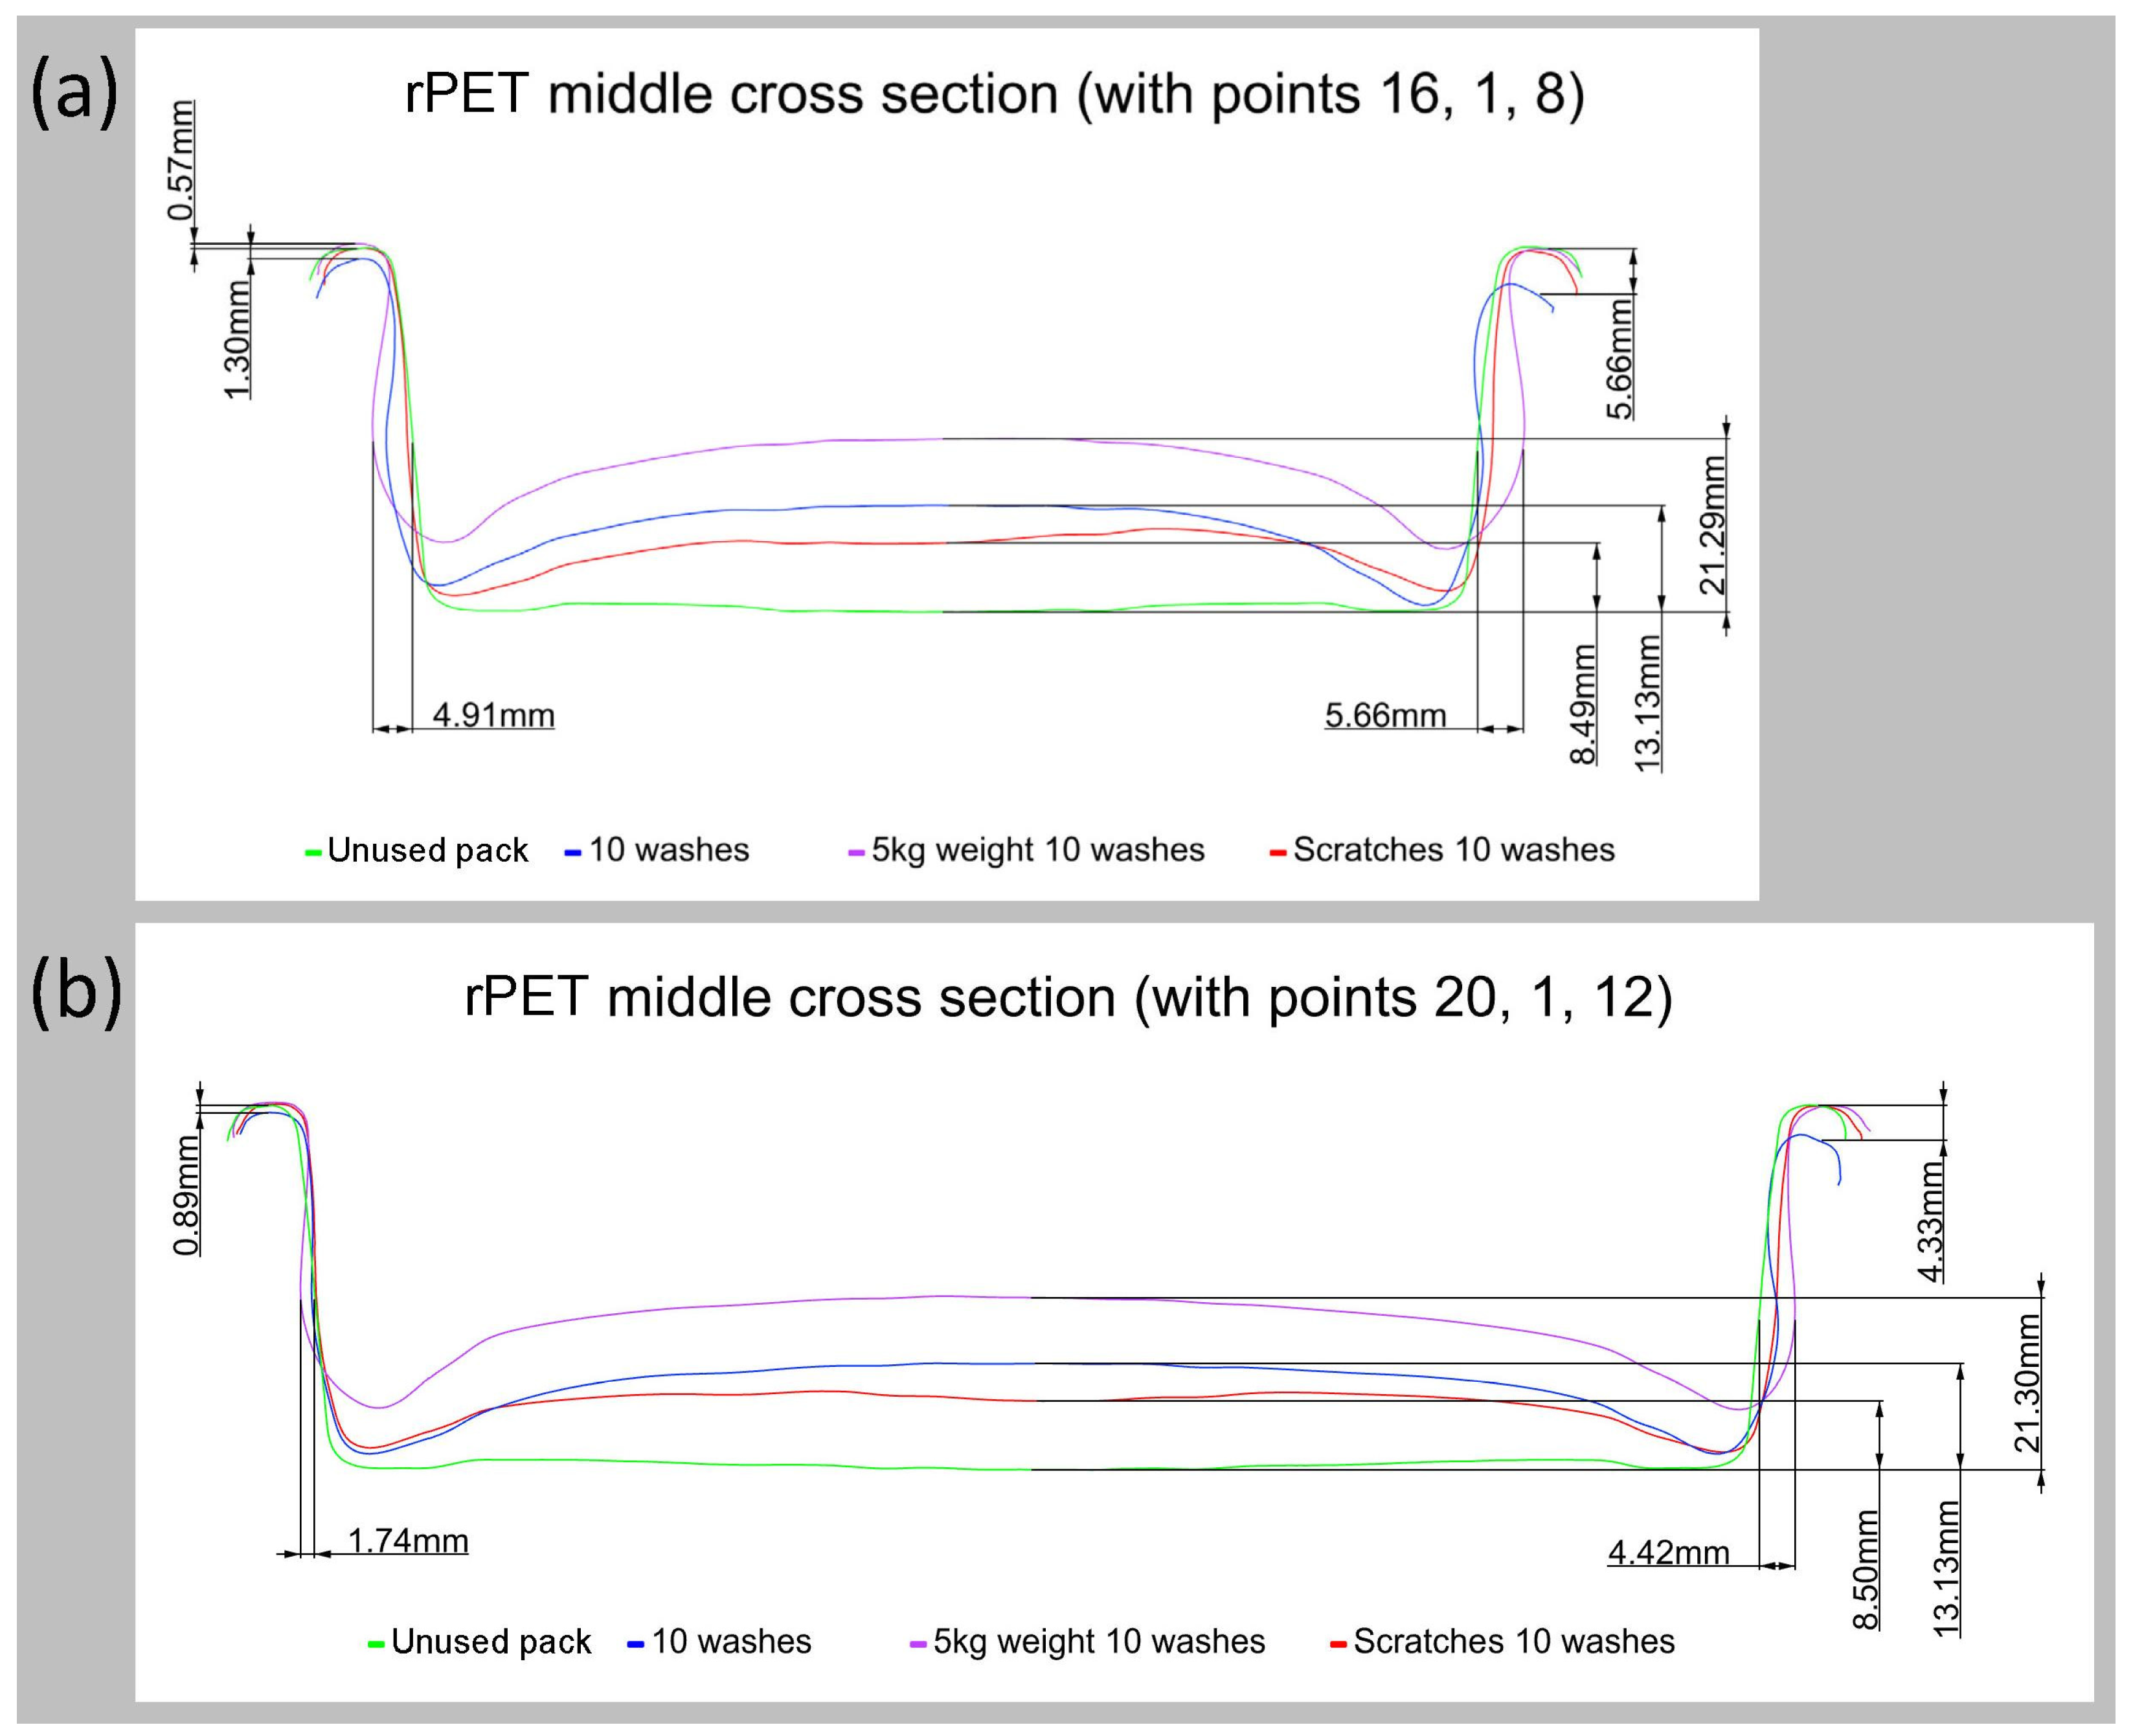
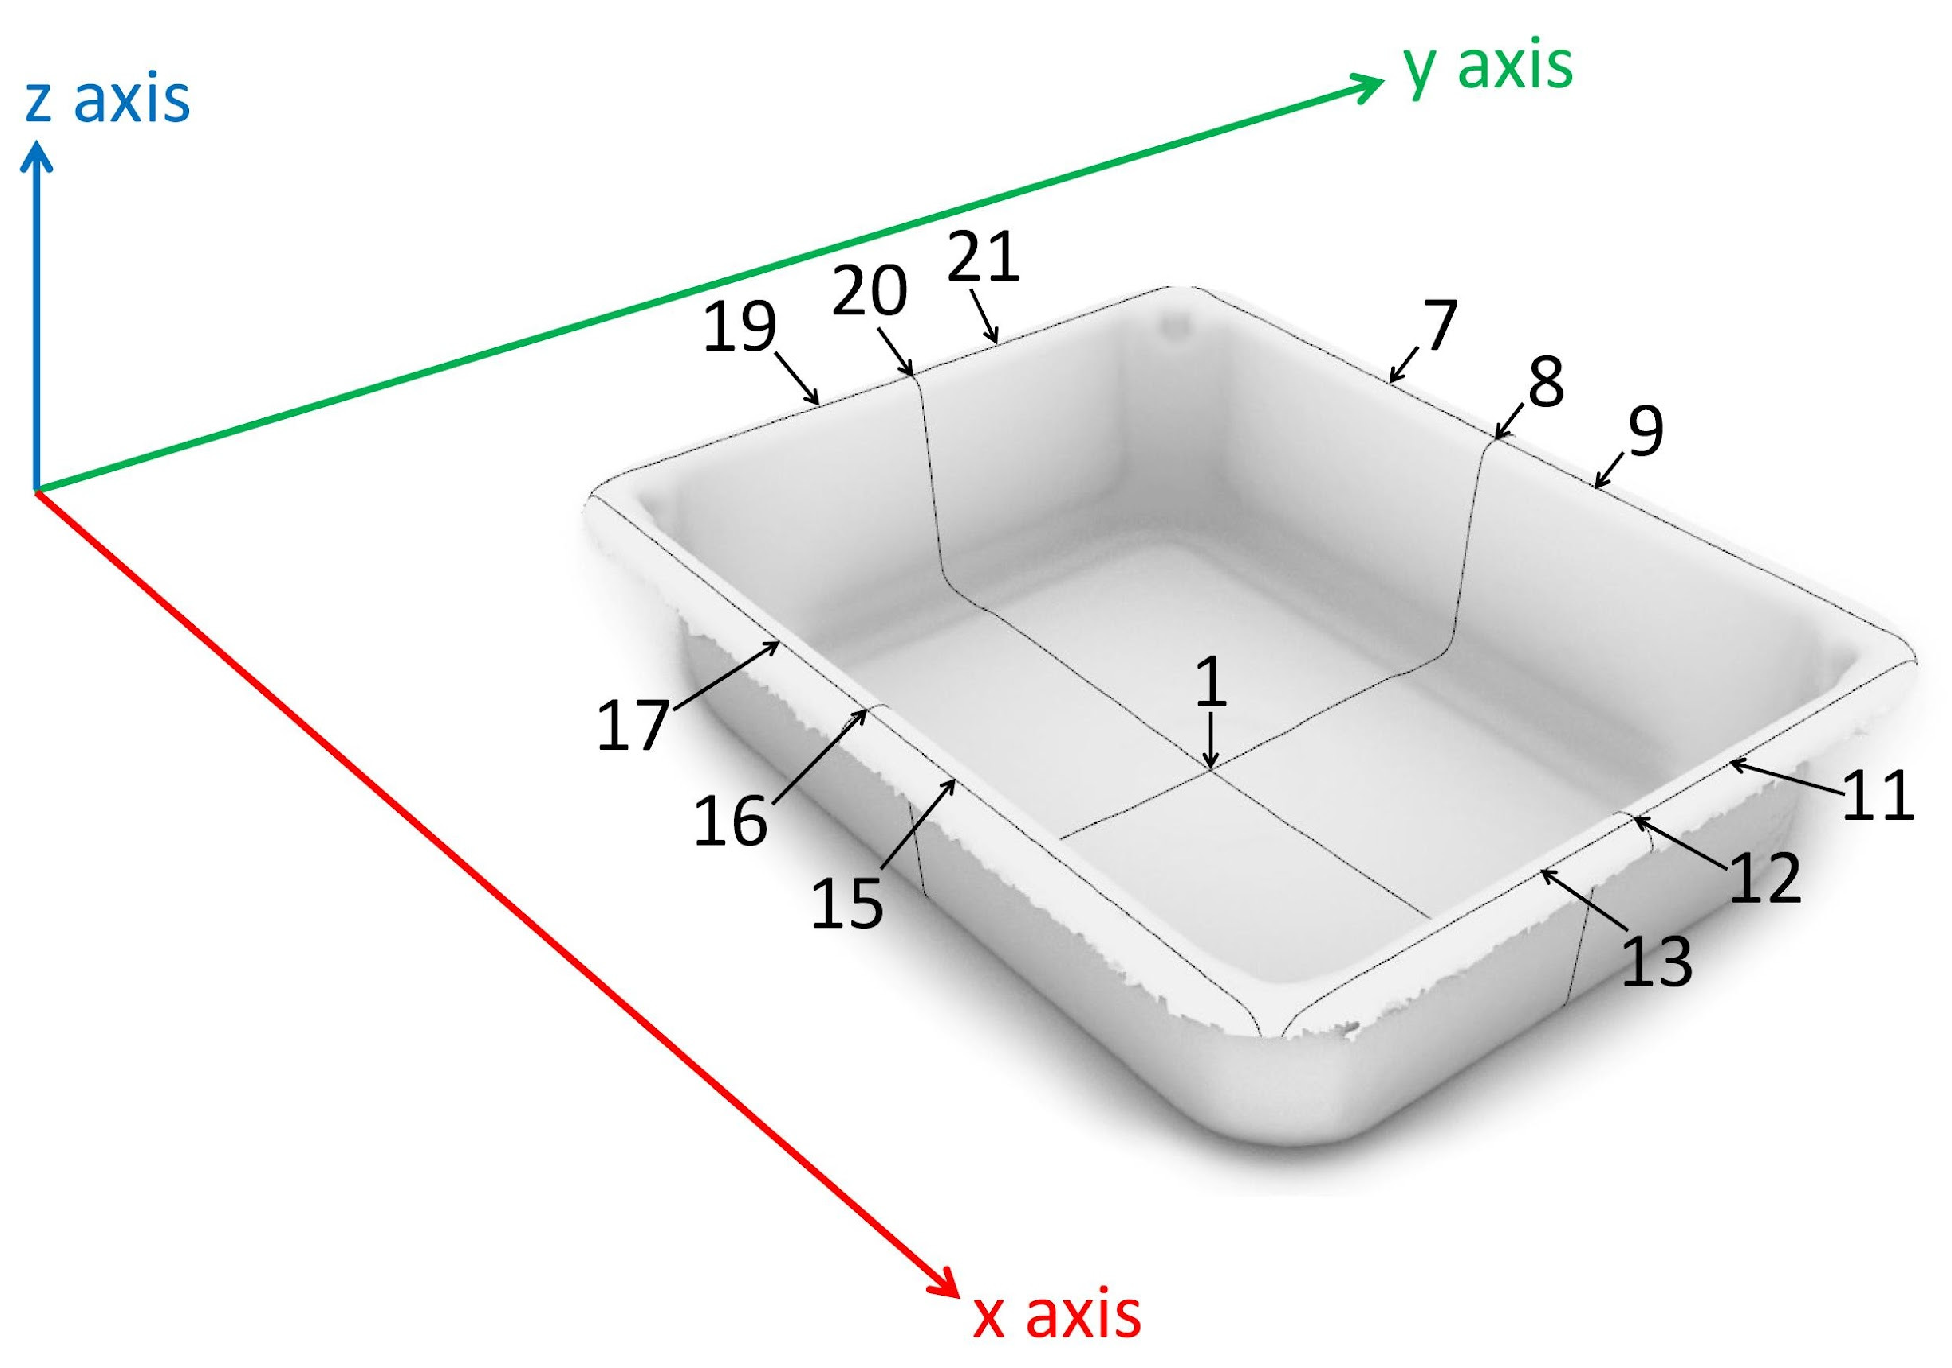
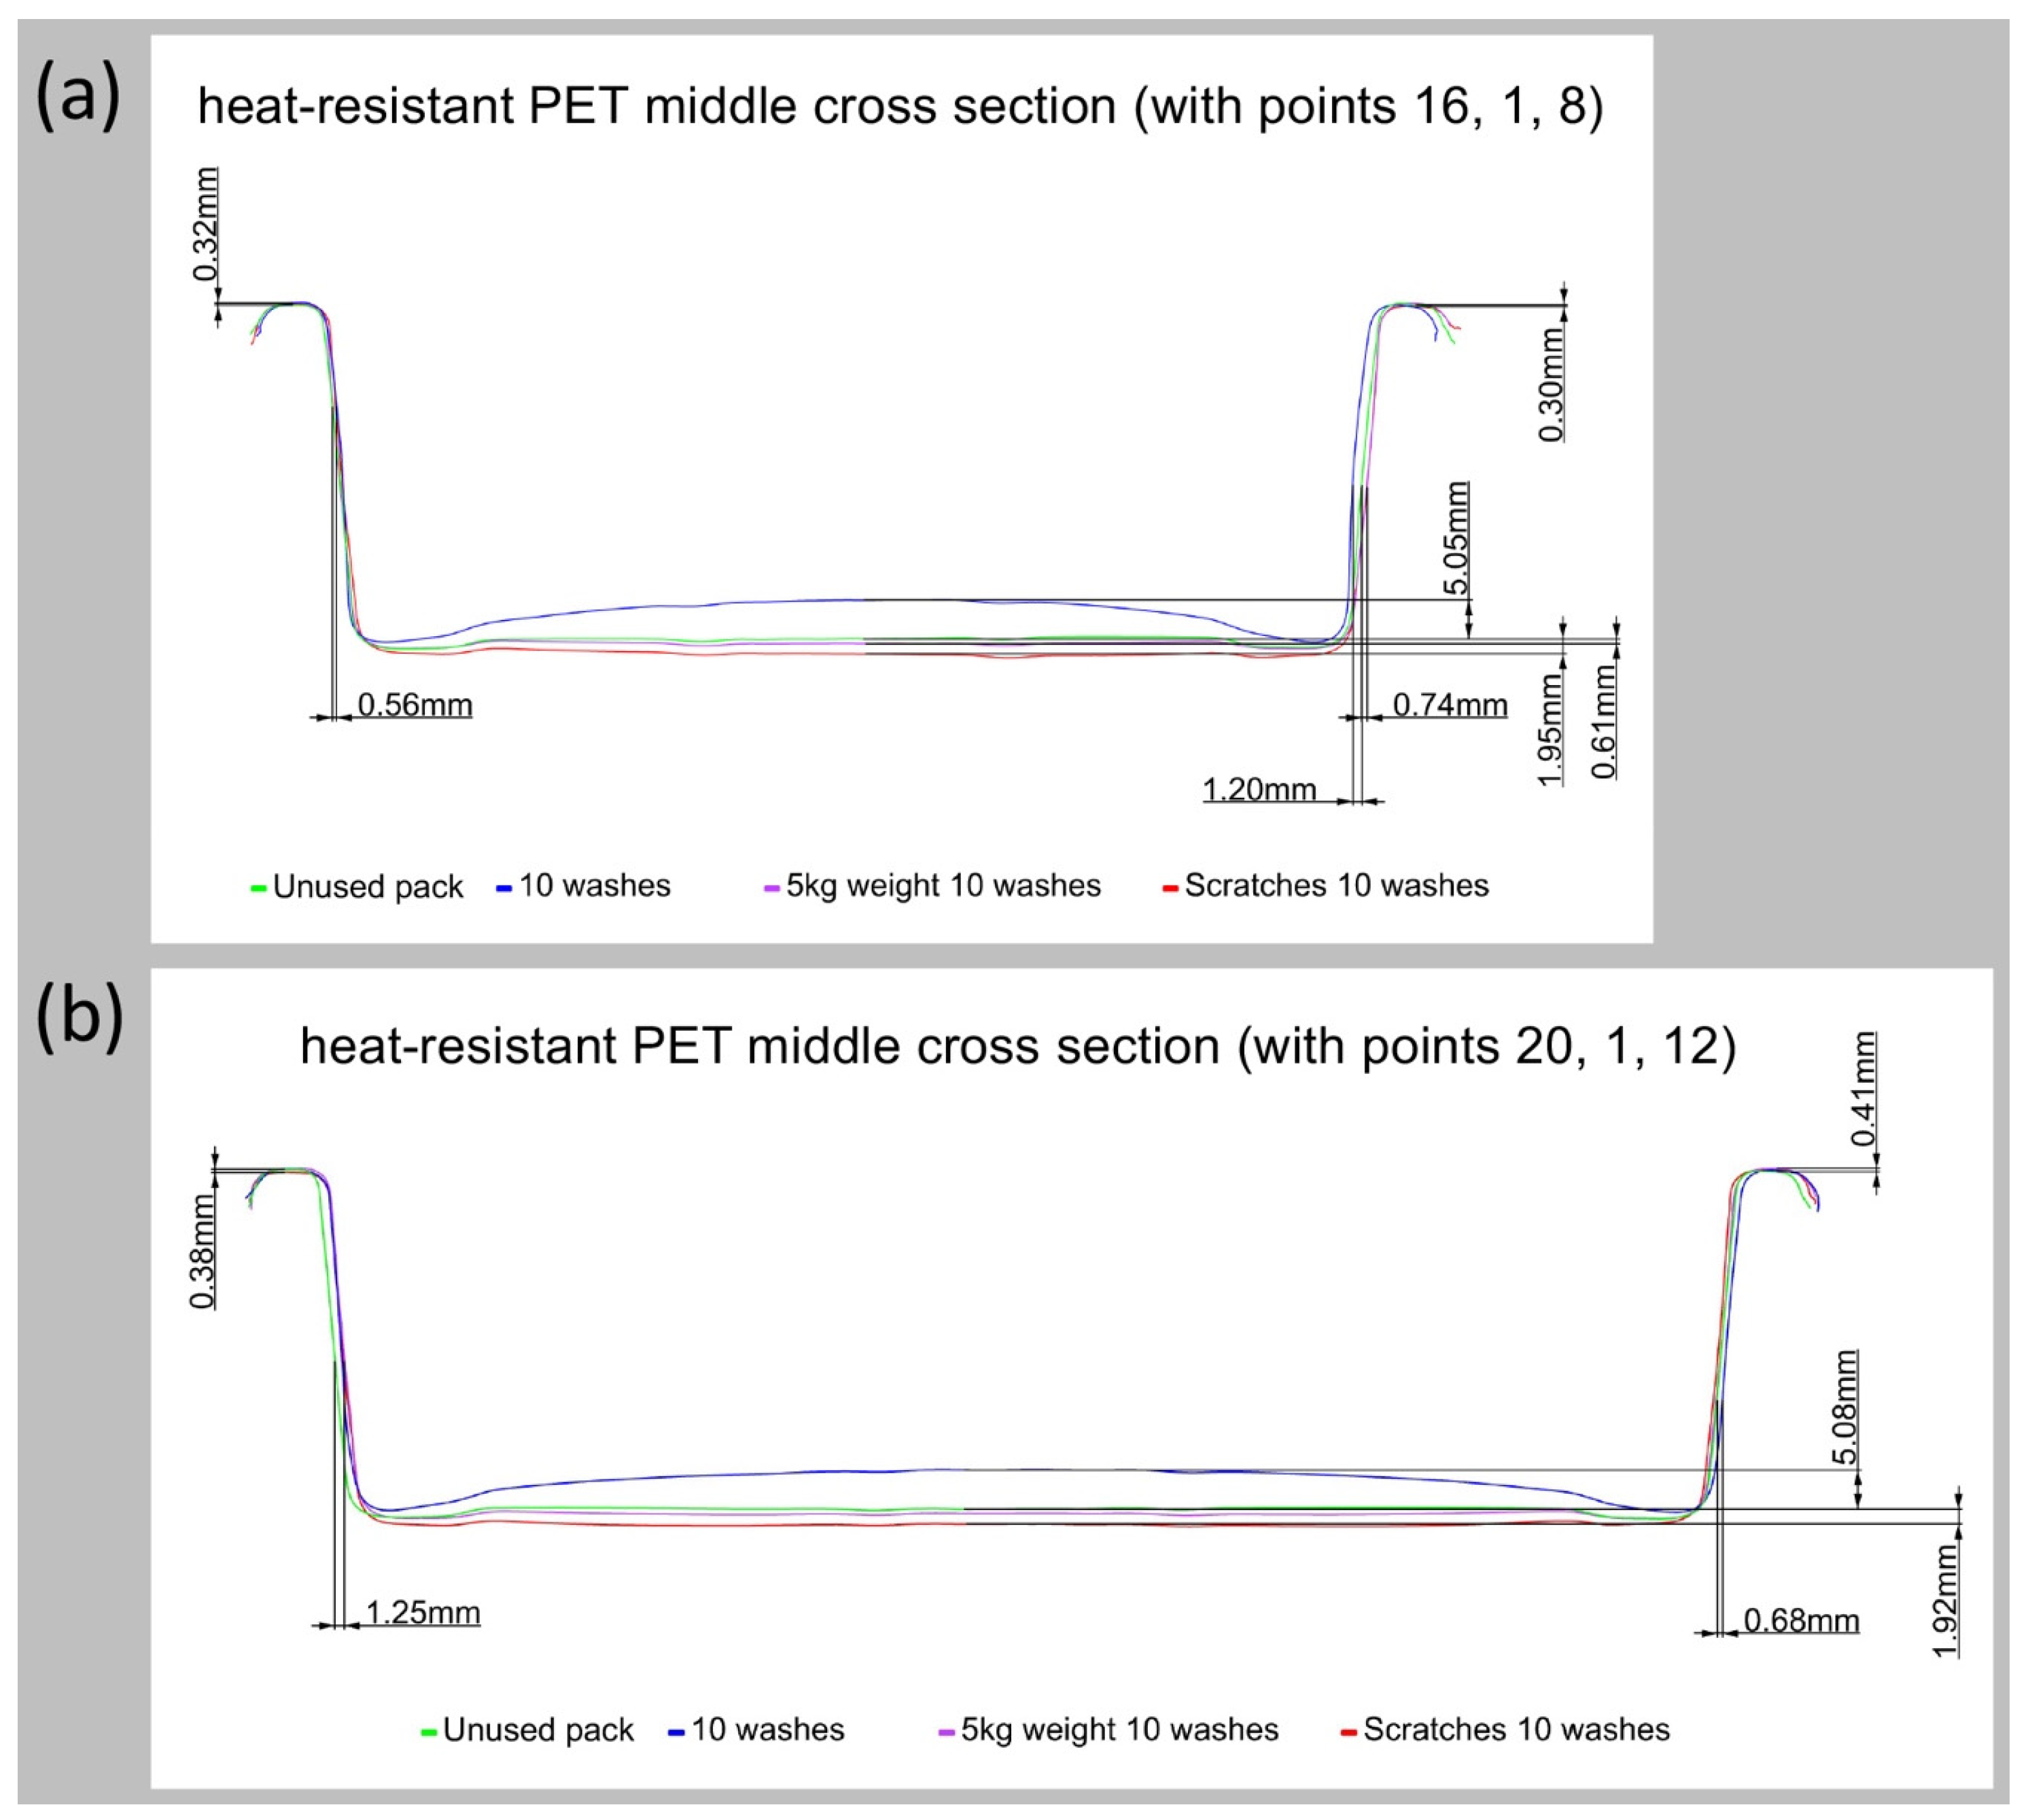
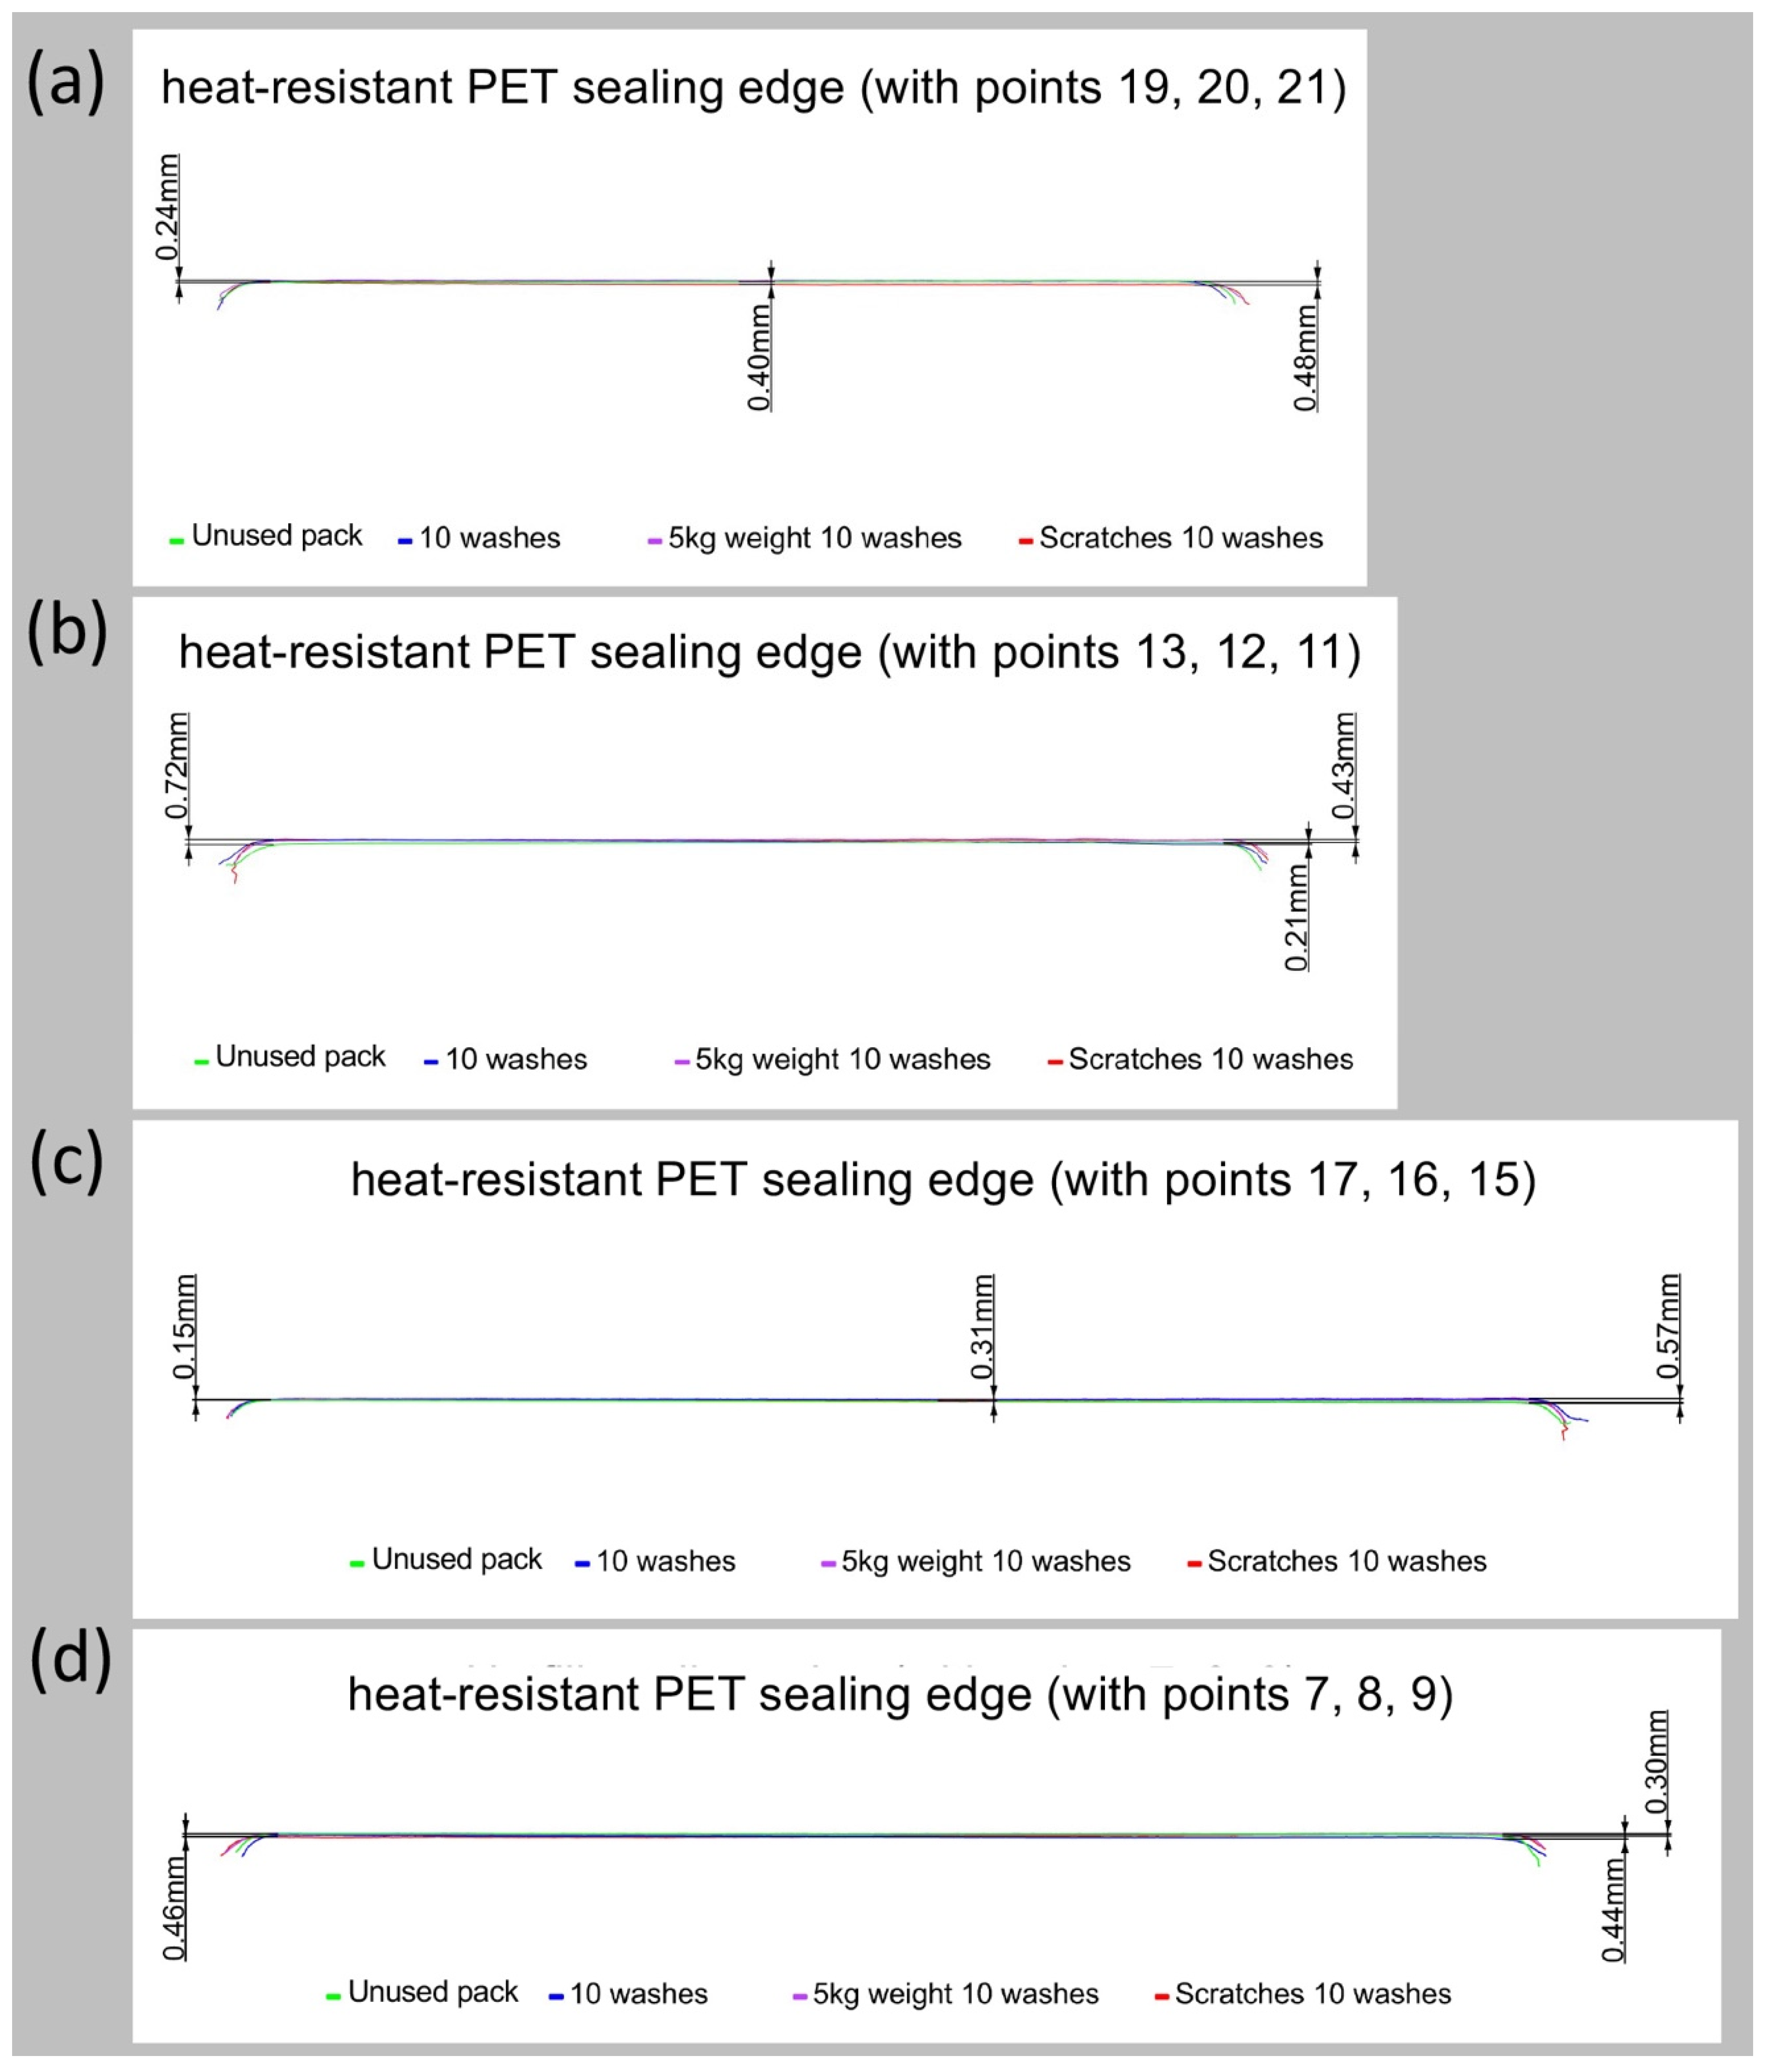
Straight line artwork was projected onto the meshes of unused packs (virgin packs) and deformed packs (10 washes, 5 kg weight 10 washes, and scratches 10 washes) to compare how the cross-sections of the packs 3D forms have changed. The same dot marker numbers were used to identify the location on the pack of the different cross-sections (Figure 9) and are named, for example, ‘middle cross-section (with points 16, 1, 8)’ referring to the middle cross section of the pack along the y axis or ‘sealing edge (with points 7, 8, 9)’ referring to the cross section of one part of the packs sealing edge along the x axis.
Point Set Deviation Analysis Comparison
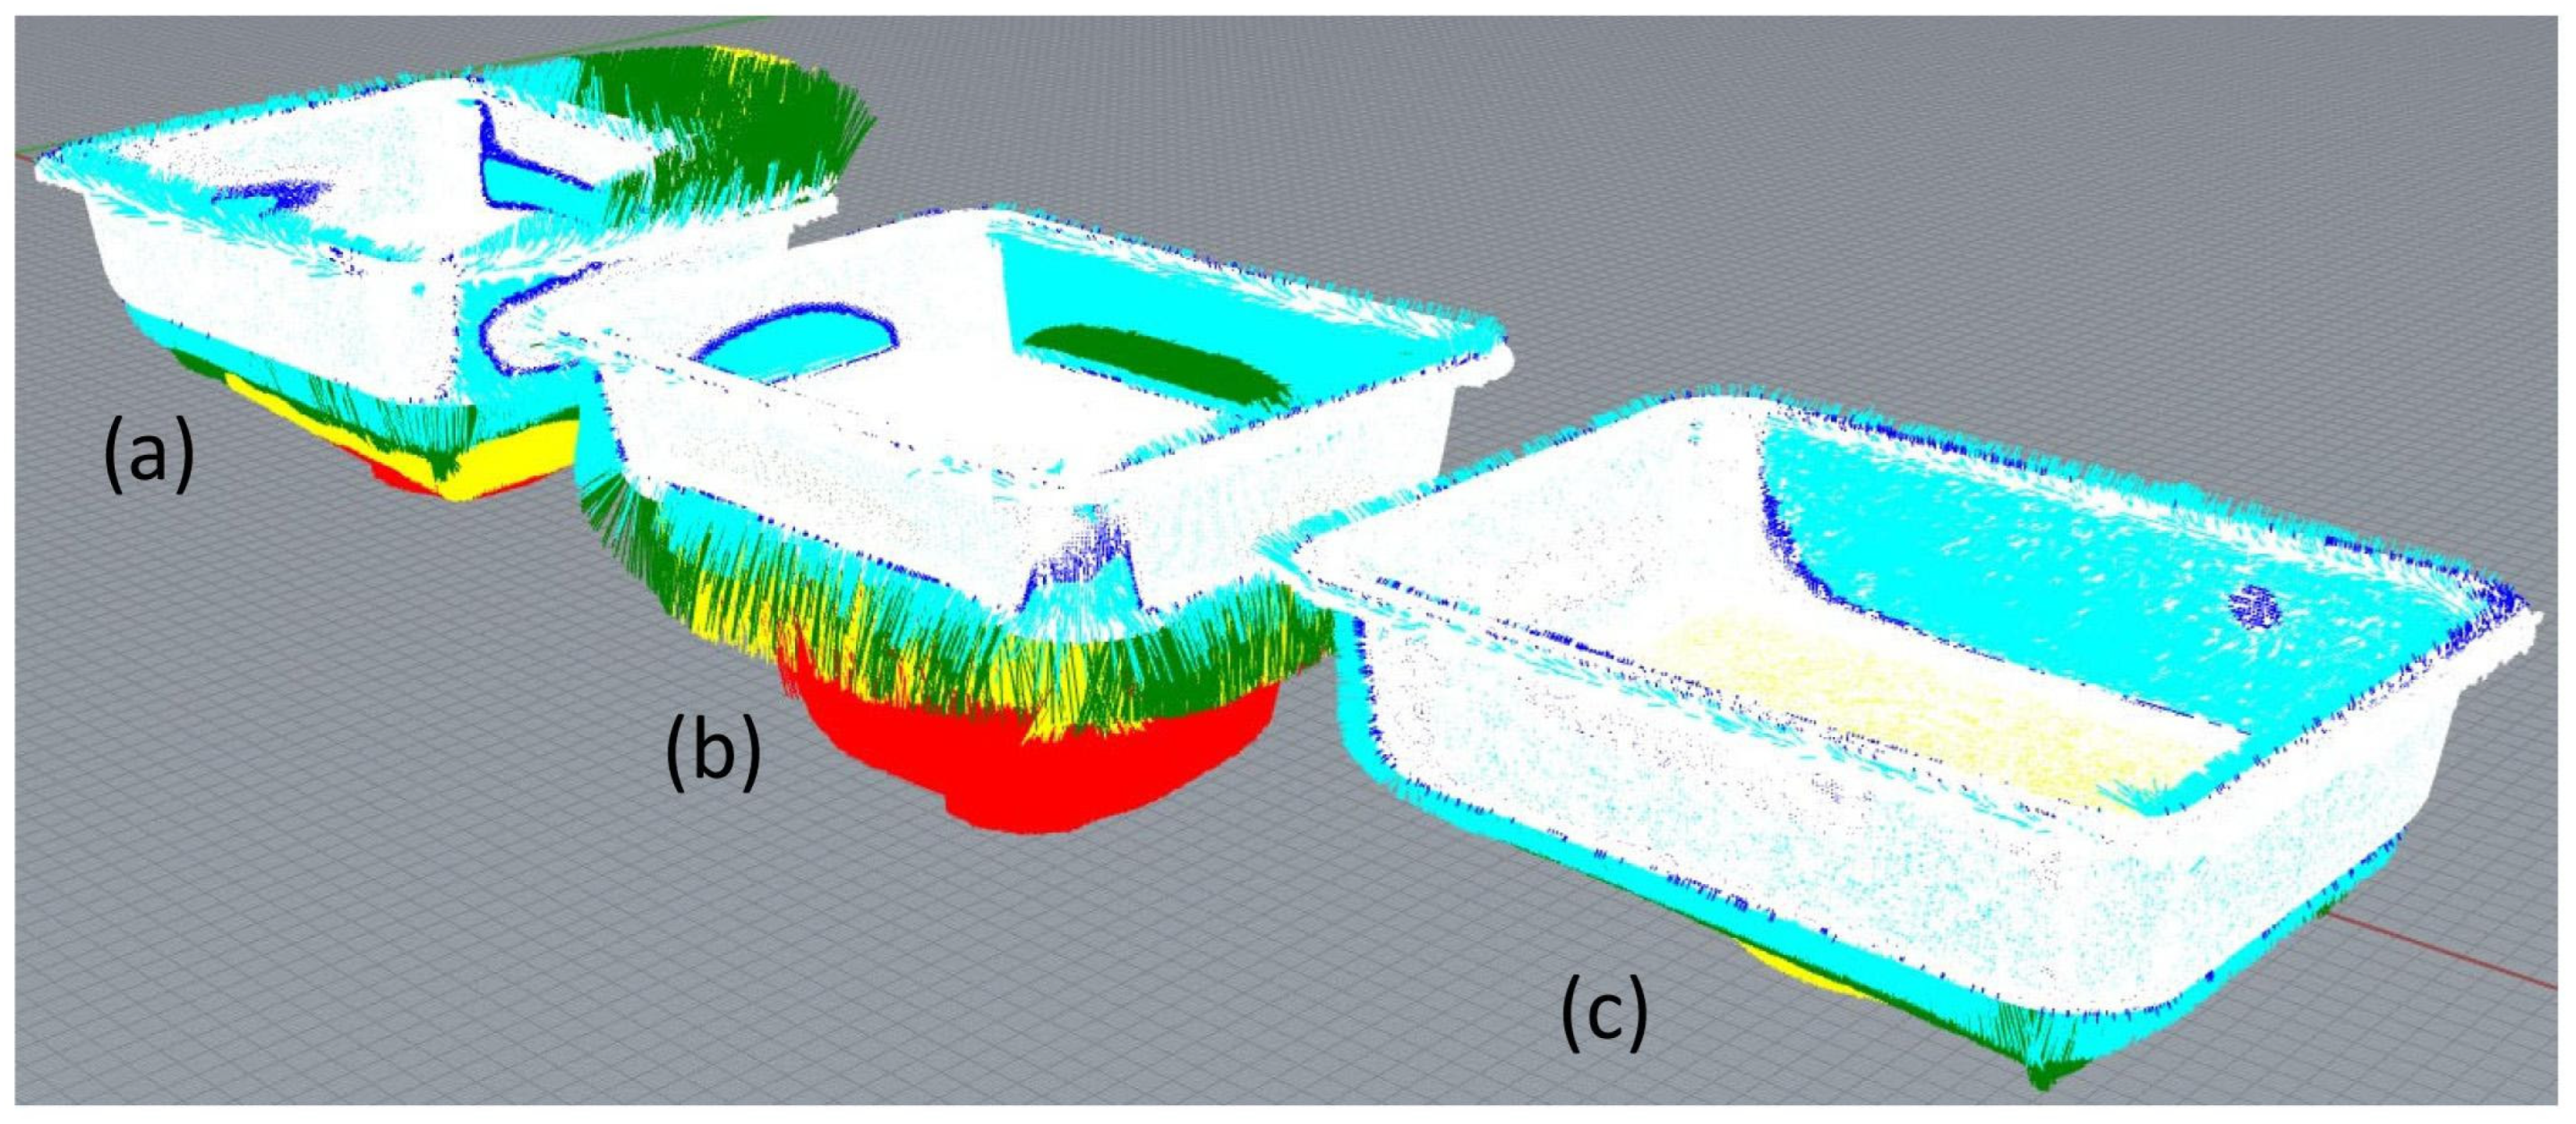
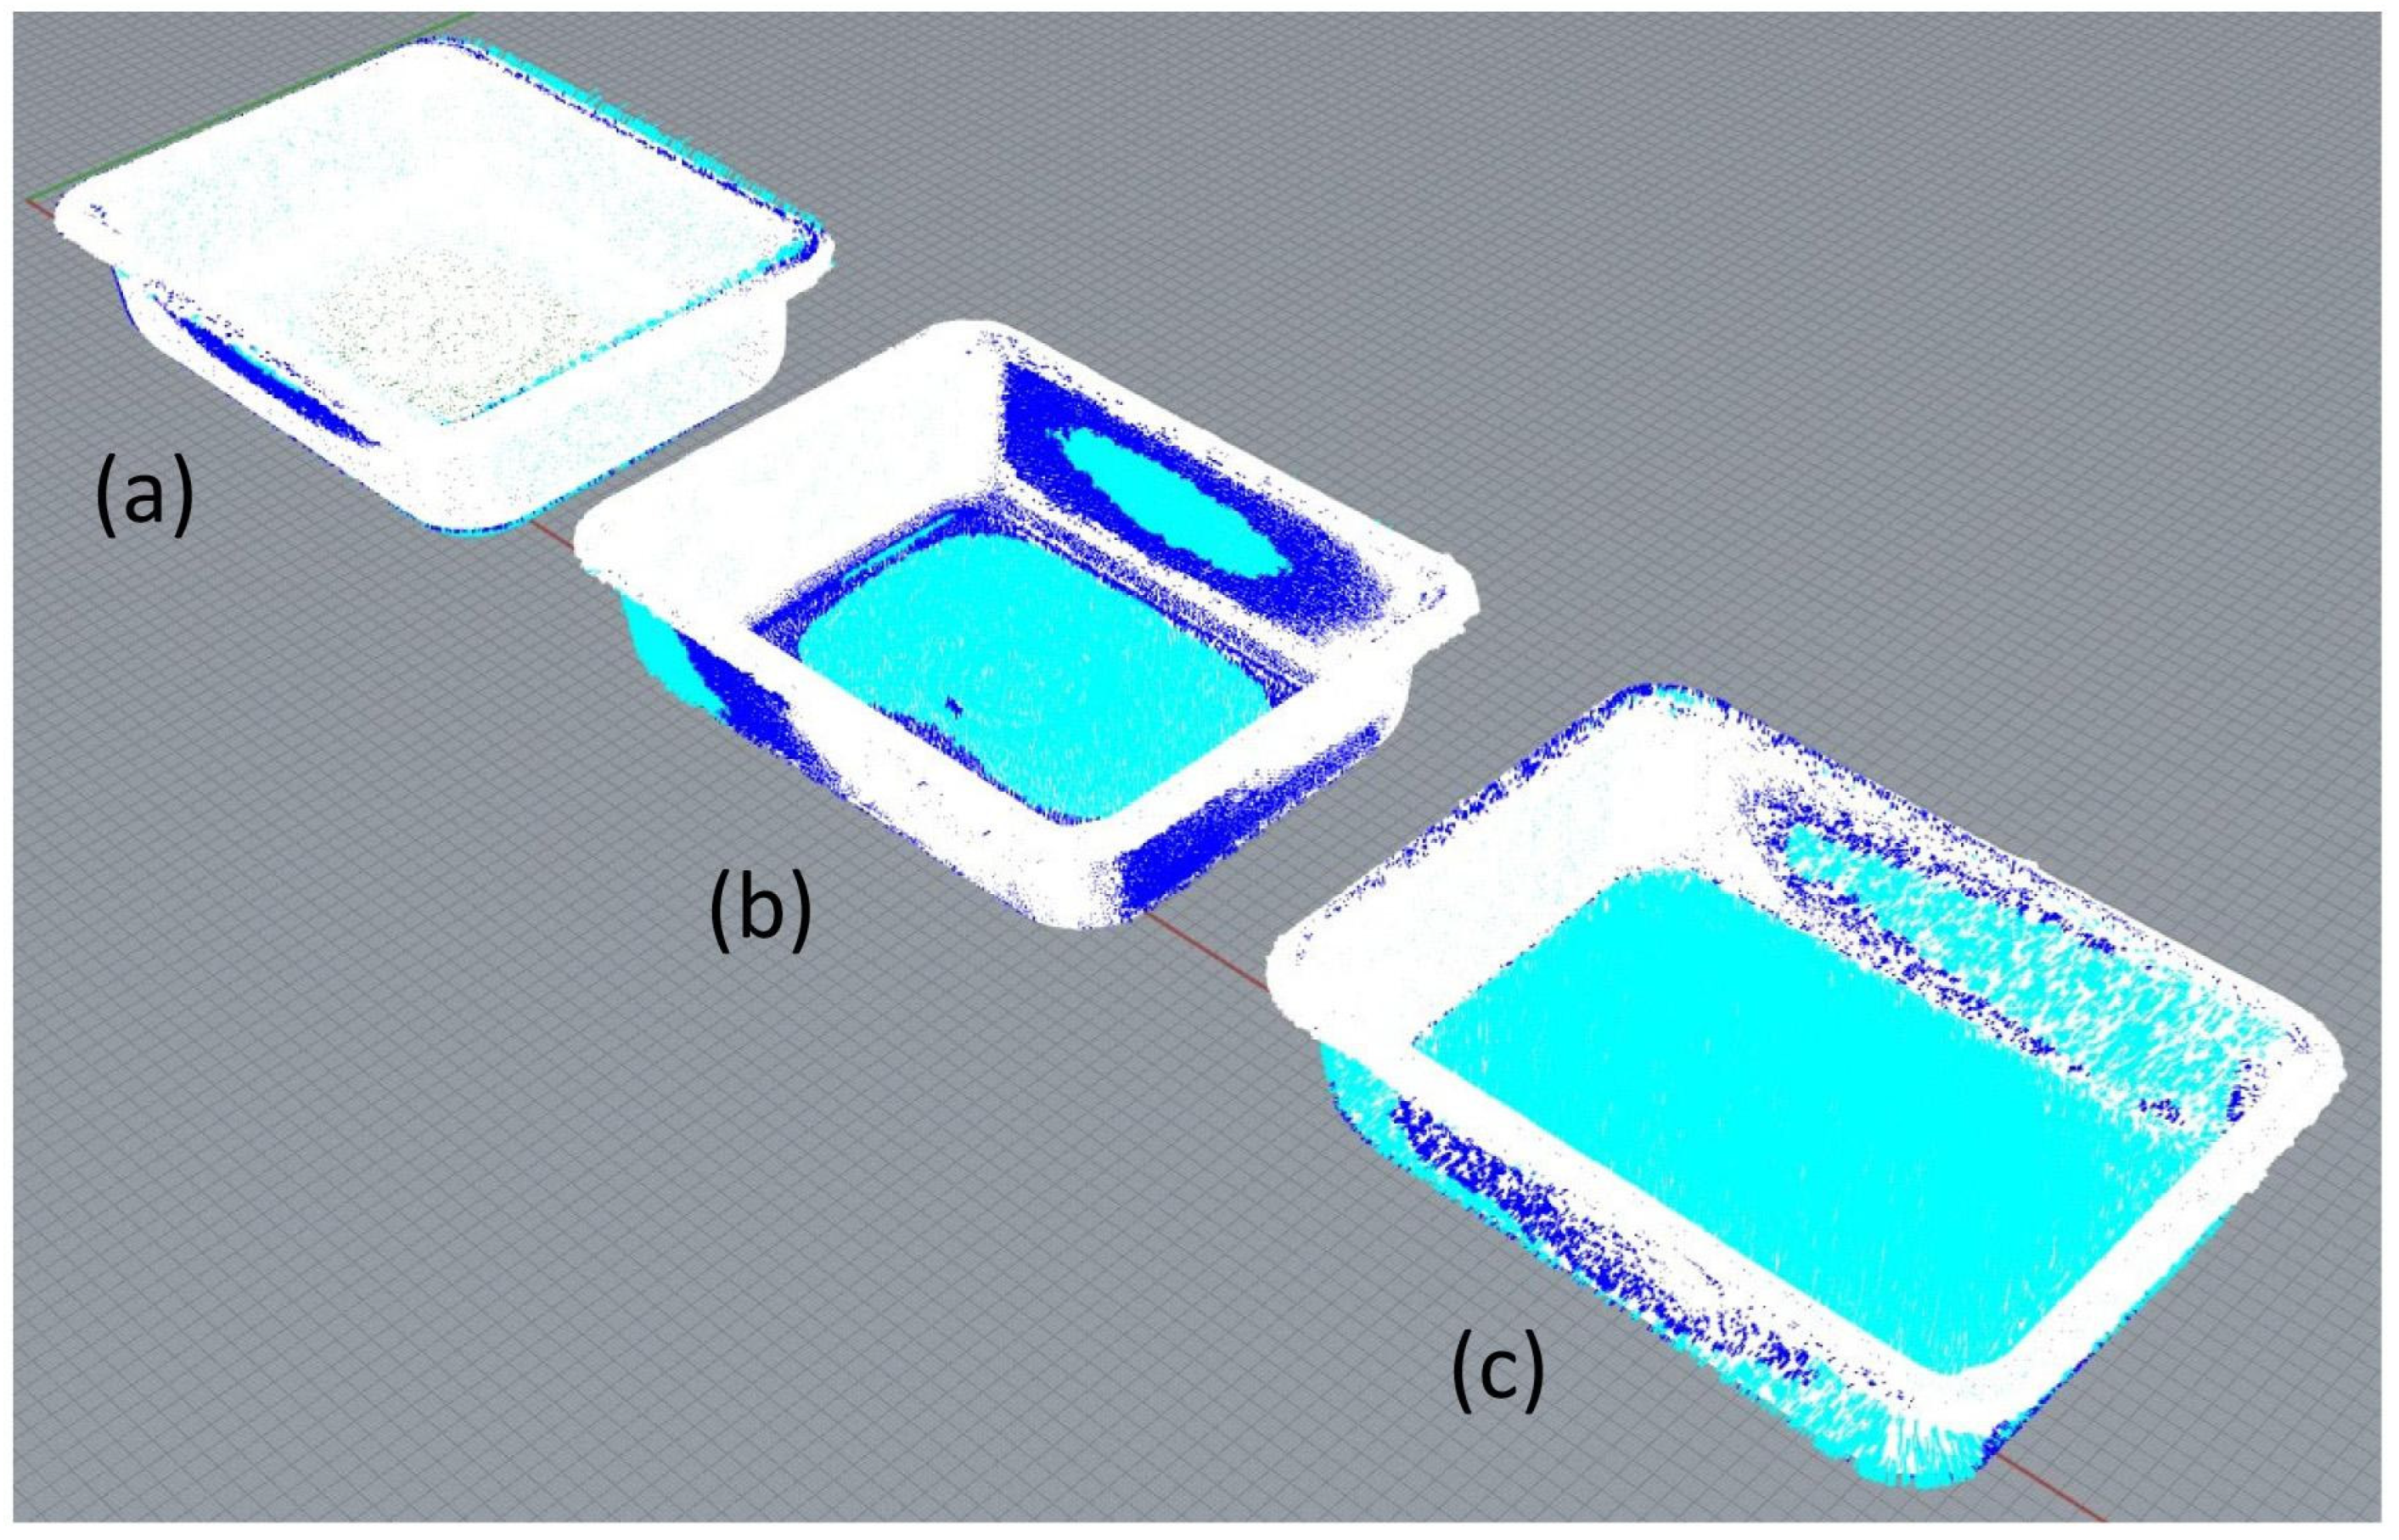
The analysis command ‘point set deviation analysis’ in the Rhino 3D modelling software was used to compare meshes to visually understand how the 3D form changed from an unused pack (virgin pack) to a deformed pack (10 washes; 5 kg weight 10 washes; and scratches 10 washes). Running this command in the software both measures and visualises the distance between two meshes; therefore, two overlapping 3D scan meshes were compared at a time, this always being an unused pack with a deformed pack. The command settings used for the point set deviation analysis of all the packs were set as follows: ignore 50 mm (in red), bad point 10 mm (in yellow), good point 0.5 mm (in light blue), between good point and bad point (in green), and on-surface (in dark blue). These settings were used to analyse both rPET (Figure 10) and heat-resistant PET (Figure 11) material types. This approach offers quick visual insights into which areas of the pack have deviated the most from its original unused pack form.
Volume Analysis Comparison
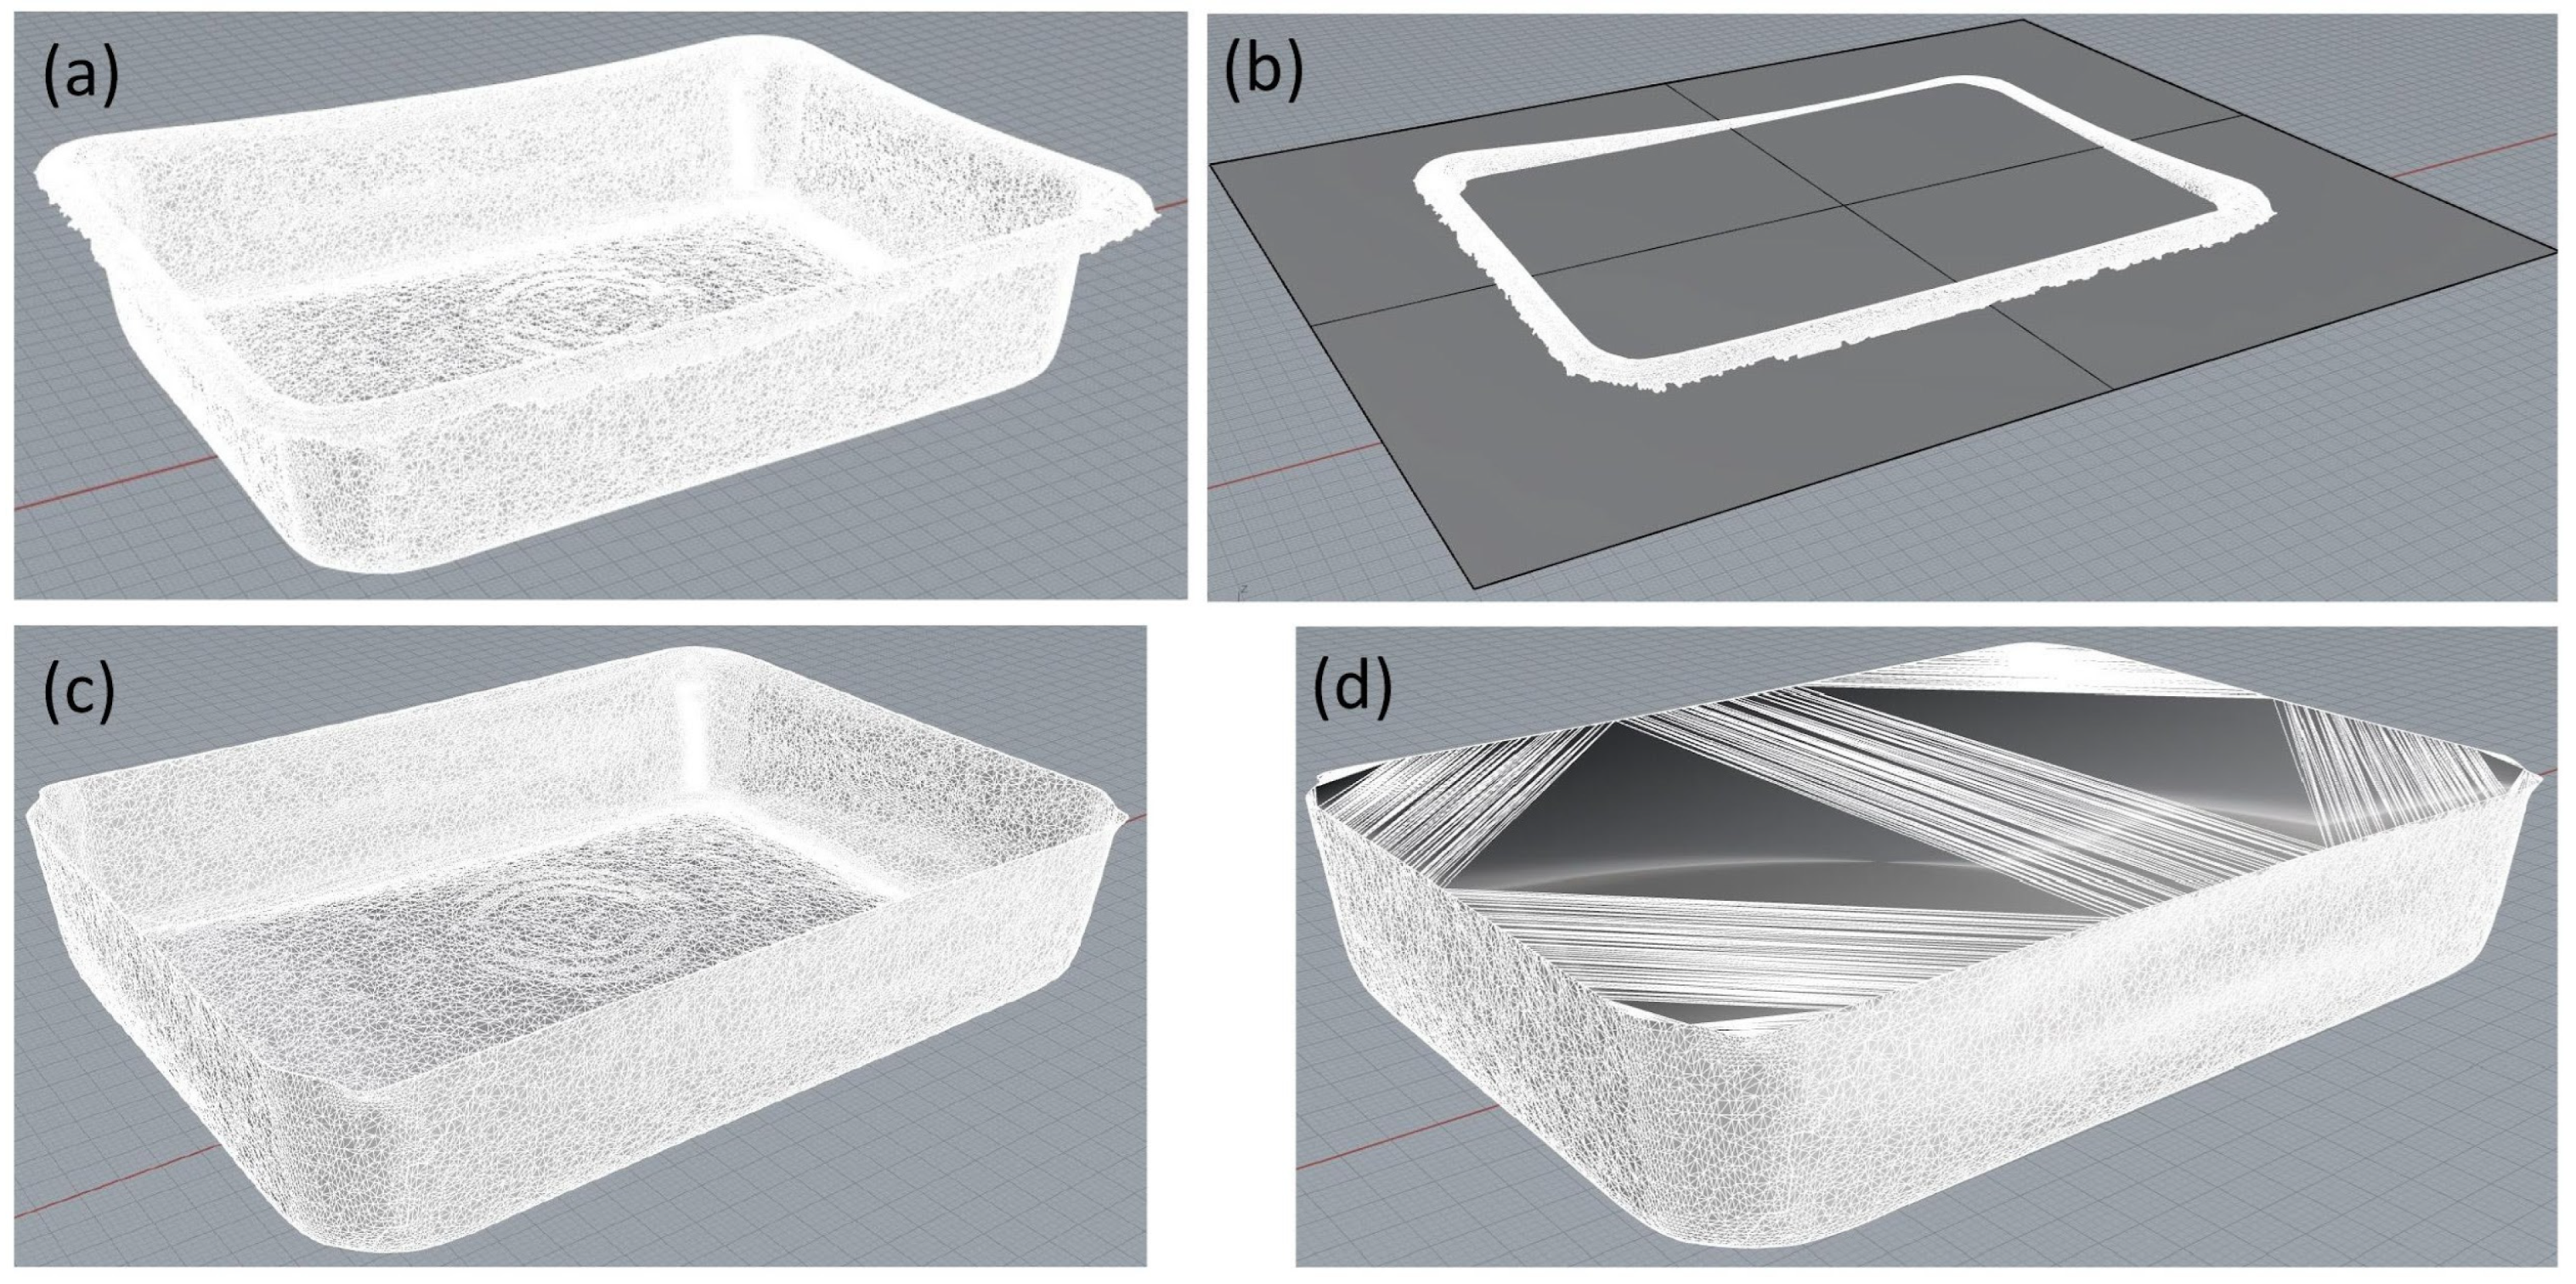
Calculating the volume of the packs is important for evaluating at what point the pack is considered absolute obsolete (can no longer hold adequate contents). The 3D scan mesh needed to be a closed object to calculate volume (Figure 12). Once the 3D scan mesh has been converted into a closed object, the volume measurement was calculated in cubic millimetres; the volume results for both rPET and heat-resistant PET packs were then analysed to compare the volume of unused packs (virgin packs) to deformed packs (10 washes, 5 kg weight 10 washes, and scratches 10 washes) (in Section 5.2).

5.2. Results

Comparing the 3D meshes (scan data) in the 3D modelling software to software commonly used as part of the design process for computer-aided design (CAD) and computer-aided manufacture (CAM) allows the viewer to compare the meshes visually with a good degree of accuracy. Comparing the 3D meshes directly with each other enables a better understanding of how the wash cycles, application of weight to the packs, and scratches can affect the 3D form of the pack.
The results for the pack named ‘10 wash cycles’ appear to be slightly unexpected and not in keeping with the rest of the results; this could be due to this pack being from a previous wash testing study. The material could have moved slightly due to accidental damage or environmental factors in storage as this was washed and then stored for 6 months prior to it being 3D-scanned, which may explain the measurement differences in the data.
The figure below (Figure 13) shows the results of the projected digital dot marker analysis (Section Individual Point Analysis Comparison), showing the distance the markers have moved in millimetres from the markers on the unused packs for both the rPET and heat-resistant PET materials.
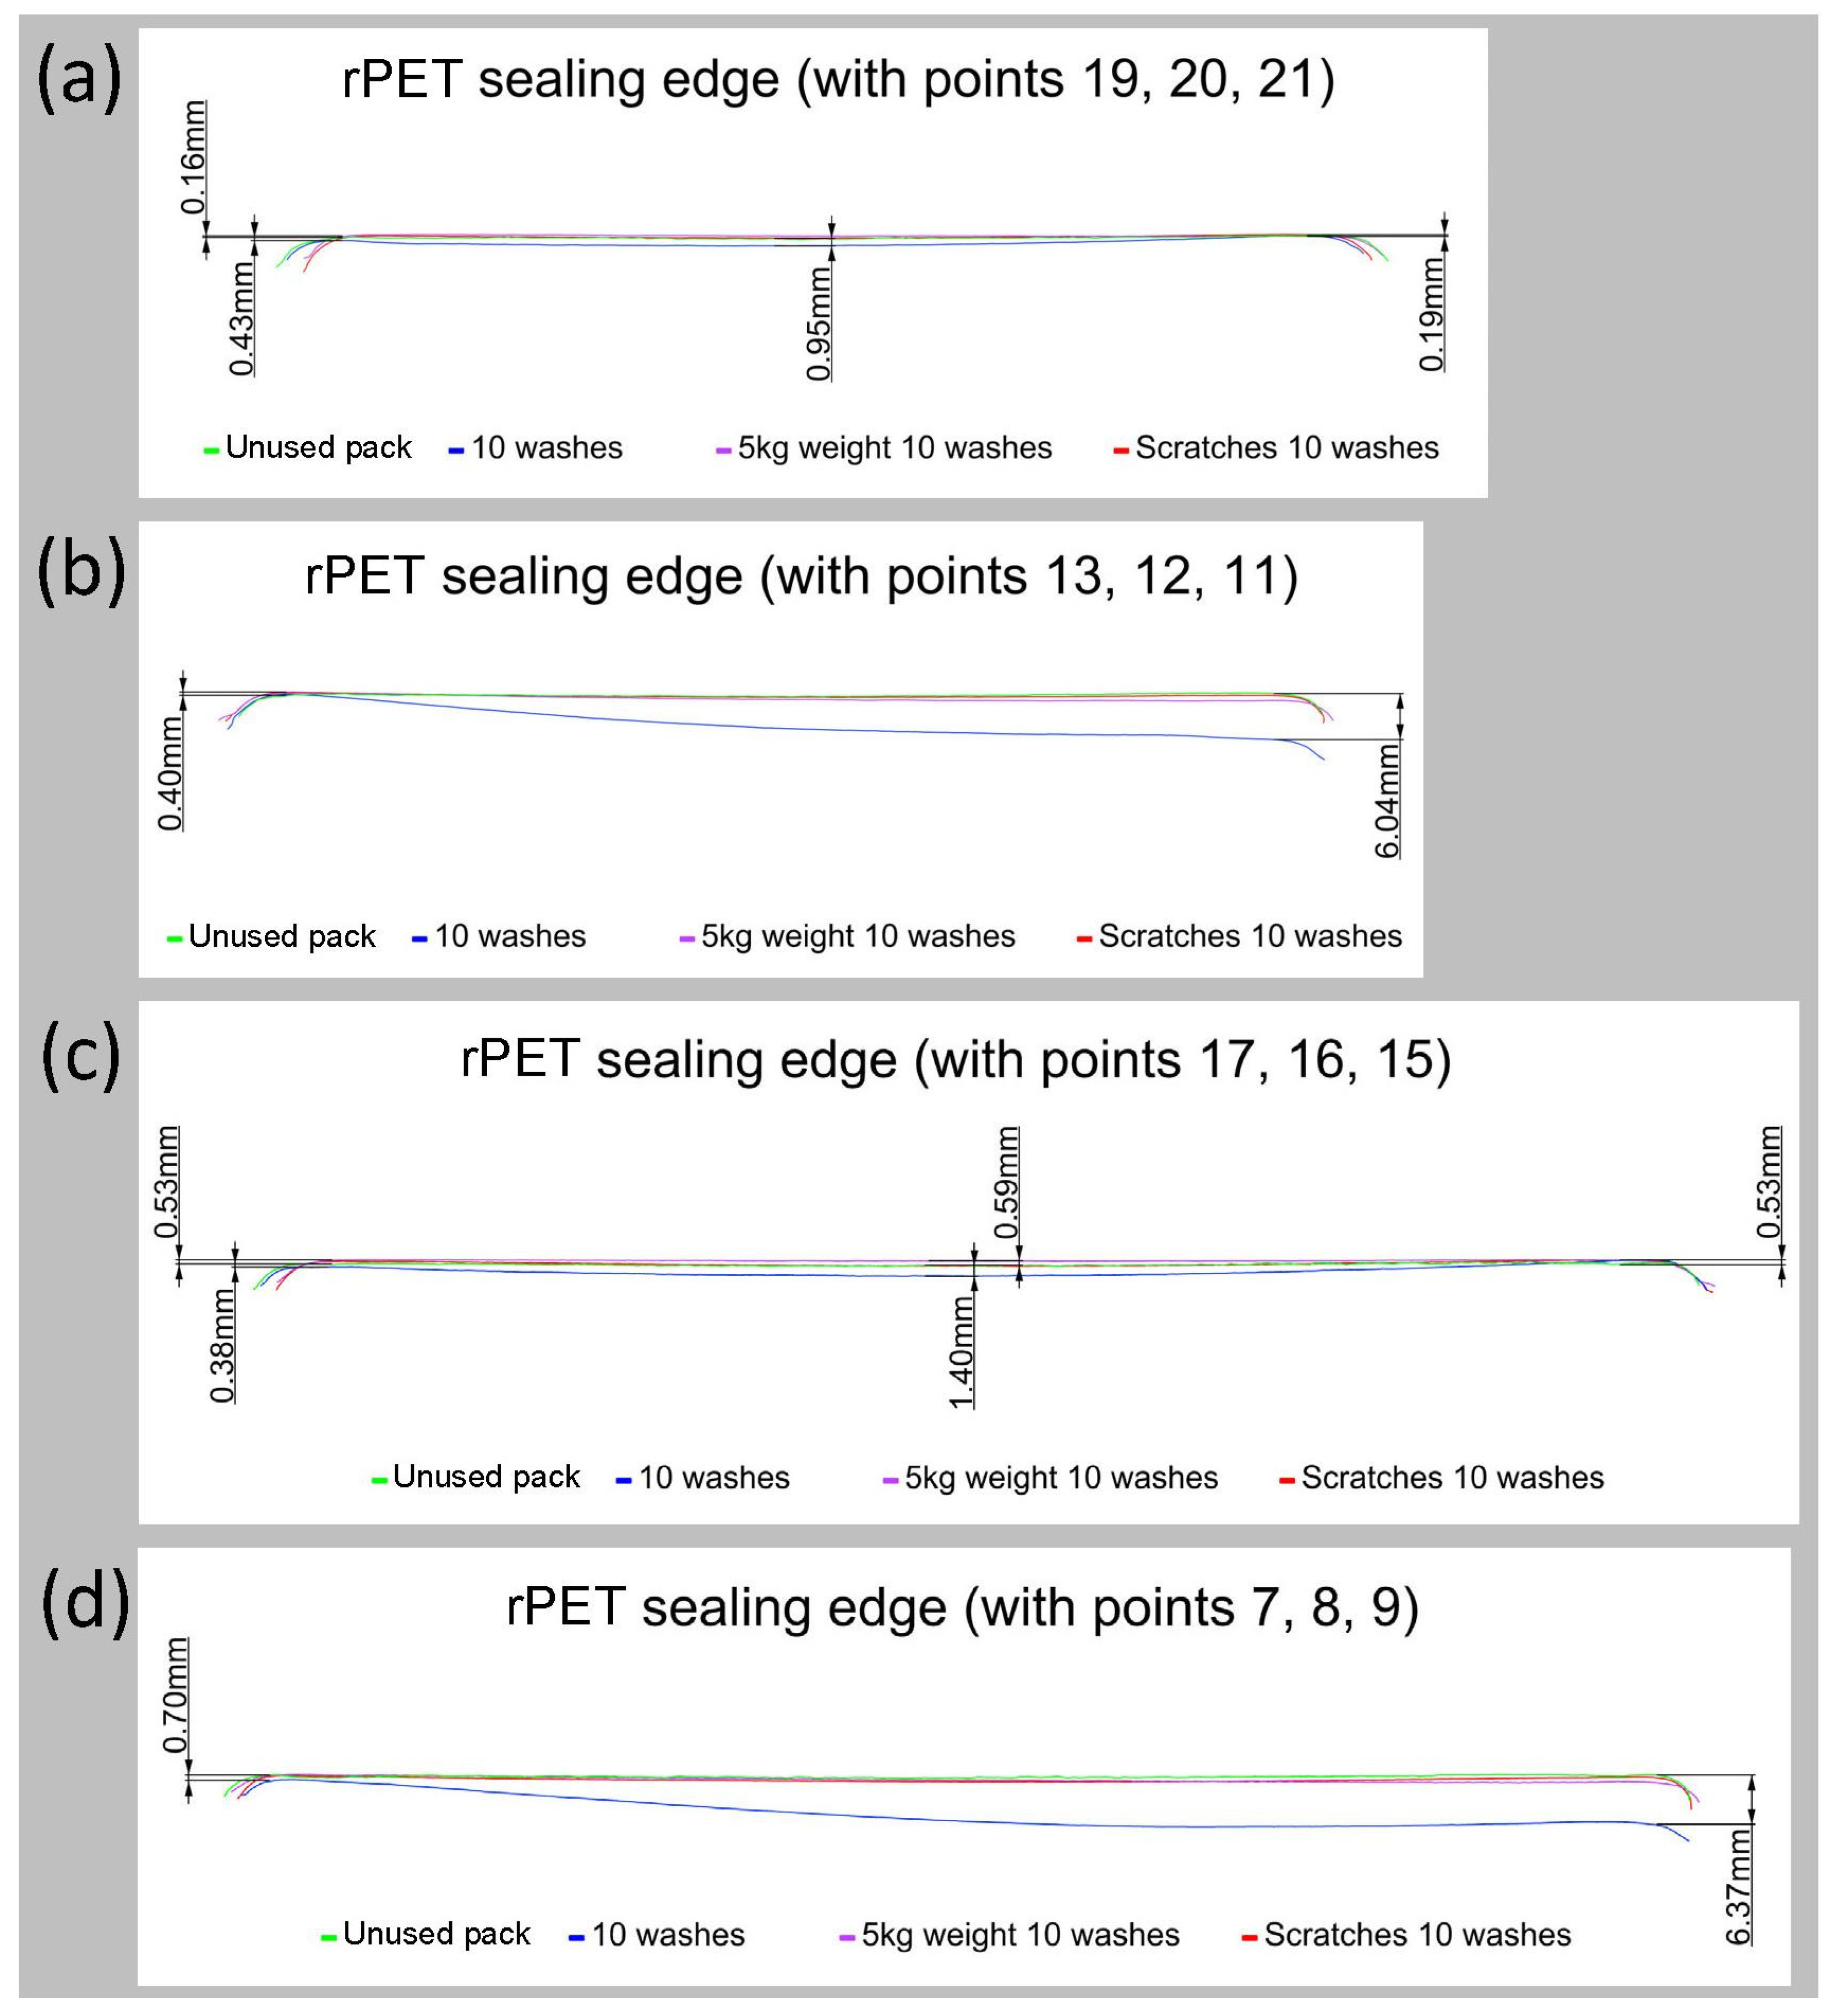
Below are the results from the cross-section analysis (Section Cross-section Profile Analysis Comparison), middle cross-sections, and sealing edge cross-sections for the two different material types of rPET (Figure 14 and Appendix A, Figure A7) and heat-resistant PET (Figure 15 and Appendix A, Figure A8), providing a view of the overall changes to the packs. The two middle cross-sections span across the width (with points 16, 1, 8) and length (with points 20, 1, 12) of each pack. The four sealing edge cross-sections are captured from the top sealing edge of the pack, where a film would be applied to seal the food within the container; these also span across the width of the pack (with points 19, 20, 21, and points 13, 12, 11) and length of the pack (with points 17, 16, 15, and points 7, 8, 9).
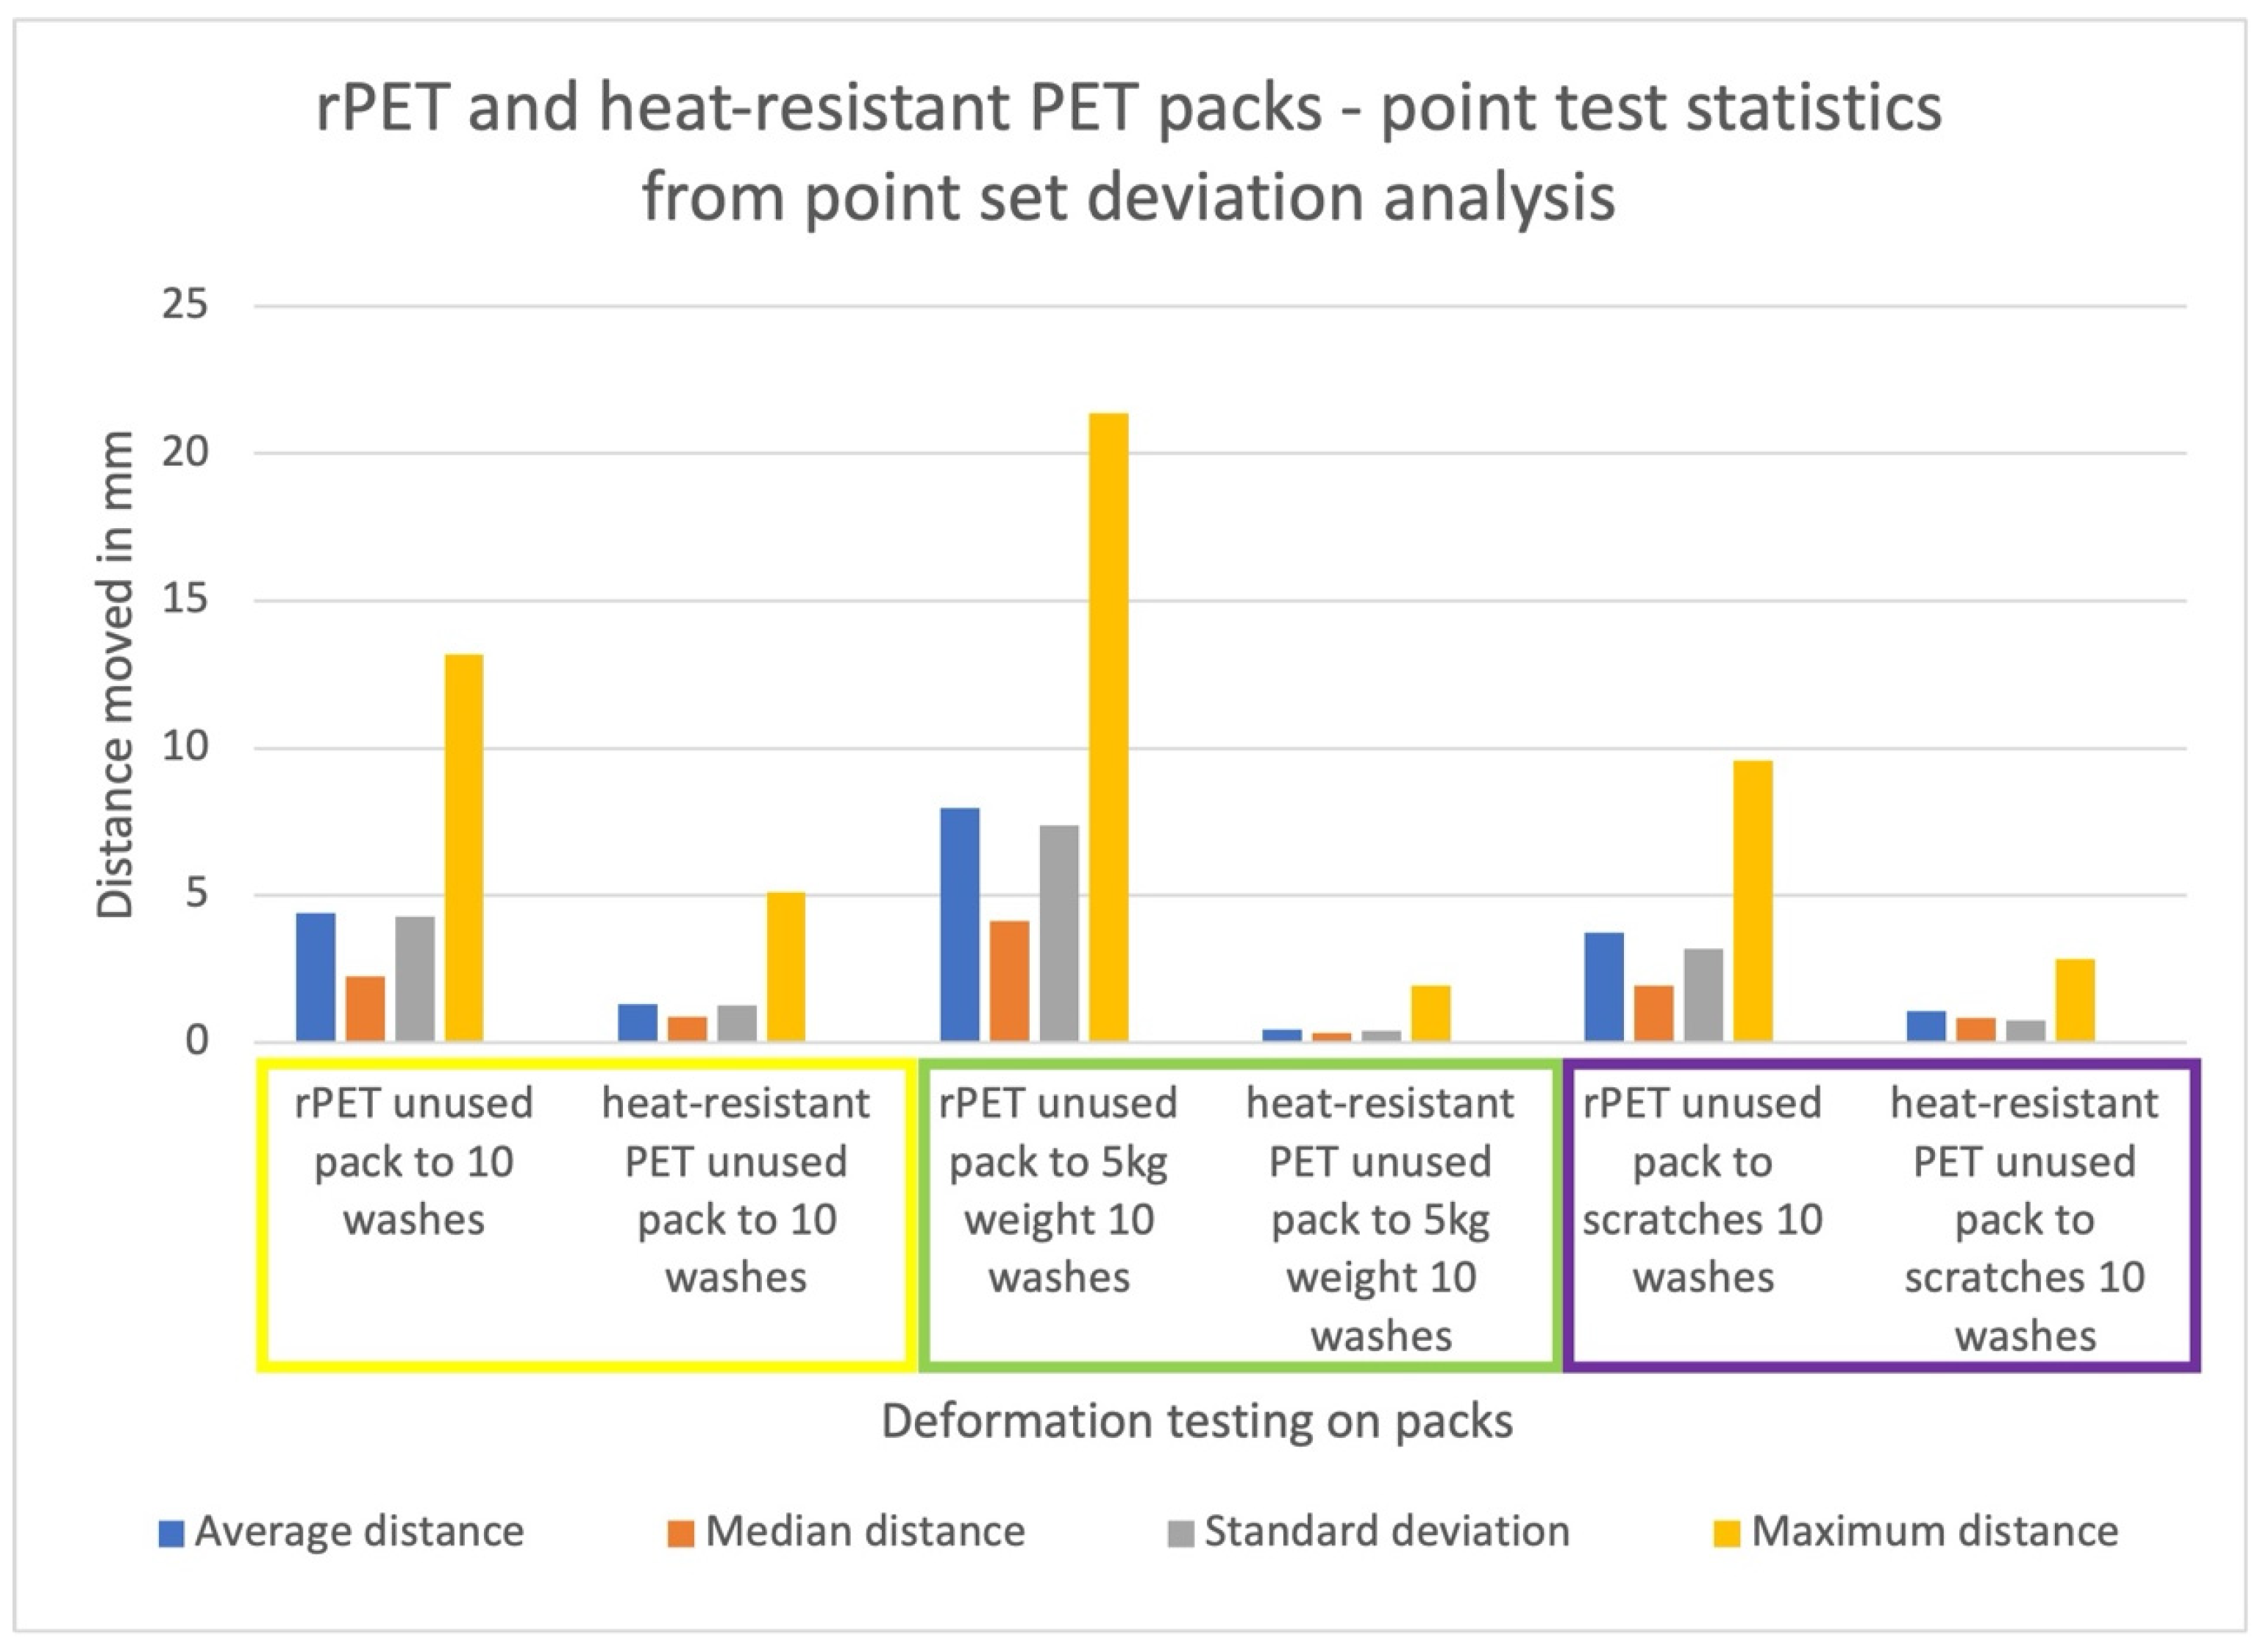
The point test statistics from the point set deviation analysis (Section Point Set Deviation Analysis Comparison) are compared below (Figure 16); this data offers quick insights into information such as maximum deviation distance. However, it does not offer insights with regards to where exactly on the pack these distances occur. Other factors such as average distance are not as useful for this application, as it is too vague.
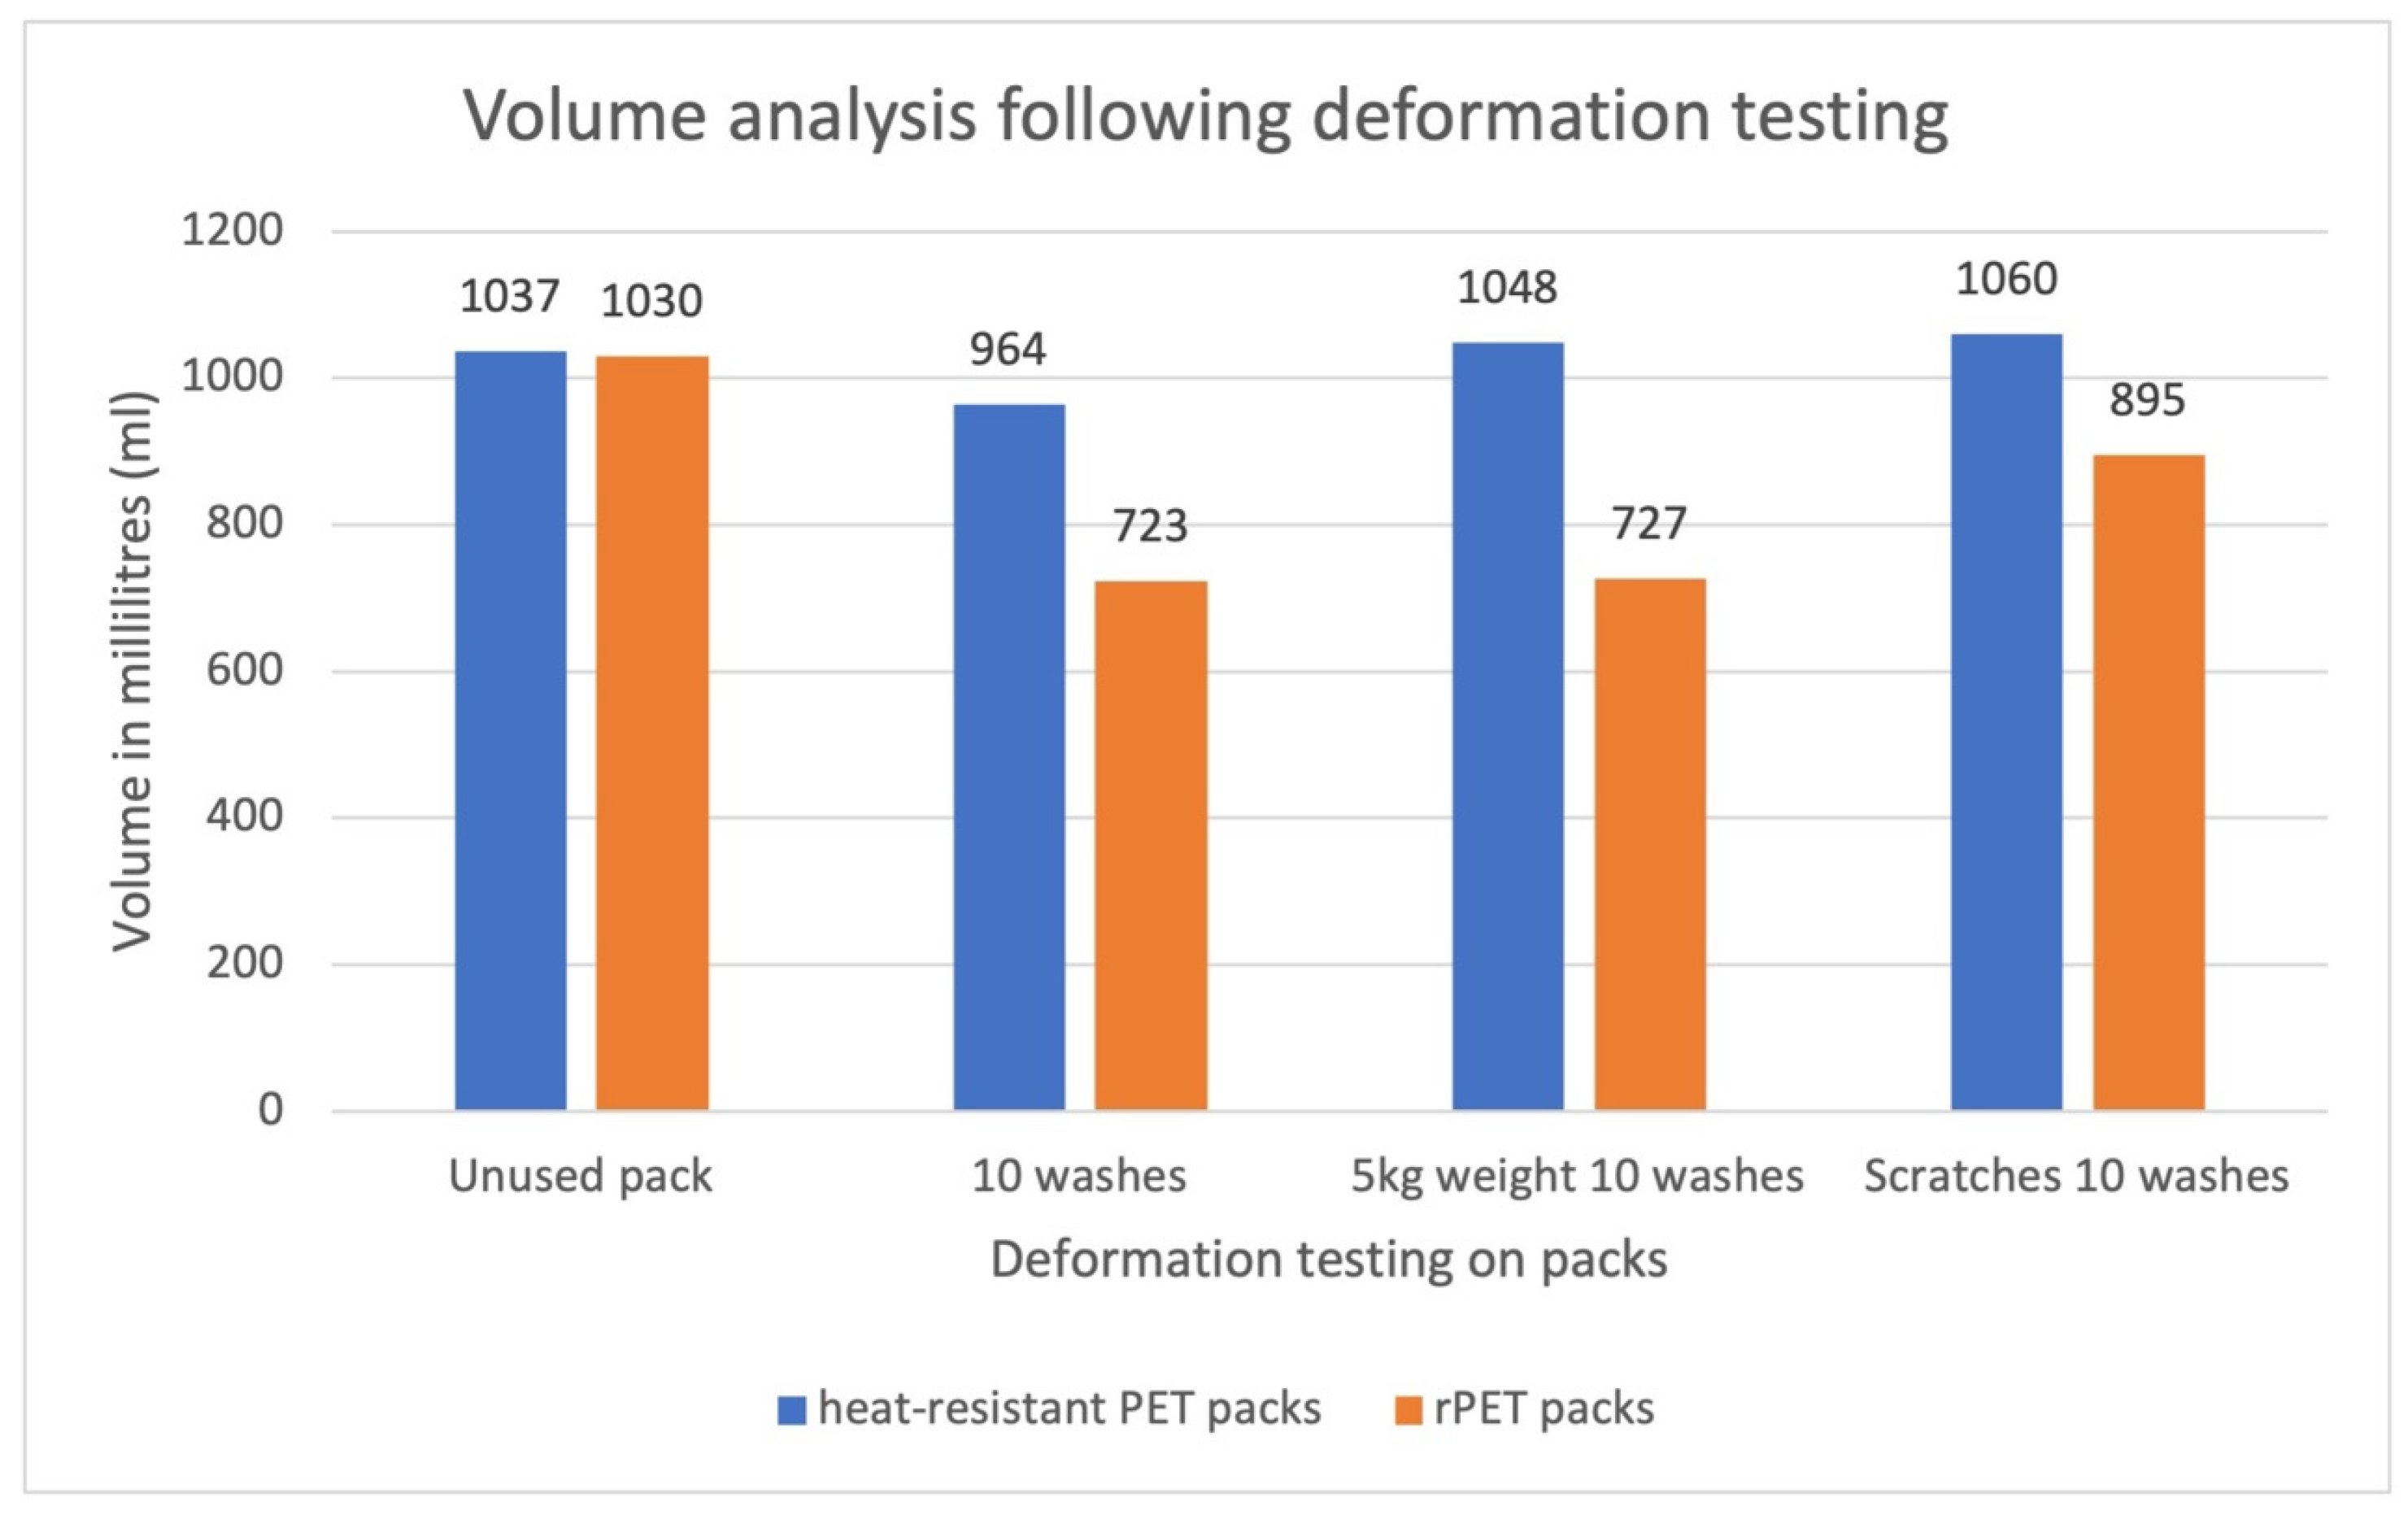
The volume analysis (Section Volume Analysis Comparison) results in the figure below (Figure 17) show the changes in volume of the two material pack types following the deformation testing. To aid understanding, the results were converted from the original units of cubic millimetres to millilitres.
Each of these methods of analysis for comparison of the 3D scan data being ‘individual point’, ‘cross-section profile’, ‘point set deviation’, and ‘volume’ offer limited insights individually but when combined offer rich data that can help us to fully understand what is happening to the 3D form of the packs following a variety of deformation testing. Together, they offer insights such as the heat-resistant PET packs increasing in volume when they have undergone 5 kg weight, 10 washes, and 10 washes and scratch deformation testing when compared to the original volume of an unused pack. Volume analysis on its own may highlight this area of change, but the cross-section profiles, individual point analysis, and point set deviation offer insights into where exactly on the pack that this change in volume is occurring. When looking at the combined data, this increase in volume is possible due to the base of the pack flattening slightly.
This deformation testing reveals that the rPET material experiences higher amounts of deformation than the heat-resistant PET material.

6. Discussion and Conclusions

The circular economy is a recognised and responsible option for addressing the complex issues associated with the production, consumption, and disposal of plastic products [7], within which there has been a proposed move towards ending single-use plastics within the food-to-go sector [19]. However, to achieve the scale of changes required, there is a need for the development of appropriate supporting processes and techniques to evaluate the suitability of plastic food packaging types for reuse systems. Different materials, material thickness, and 3D forms can all be designed, selected, and manipulated to affect the viability and robustness of plastic packaging within a reuse system; however, there are gaps in knowledge with regards to the specific processes and techniques required for evaluation and benchmarking to inform decision making.
Addressing these gaps is needed for not only validating off-tool production but also for auditing and sorting returned packs, defining areas of failure within the packs, and therefore being able to identify failure of packs within the reuse system. This ability to examine and quality-control packs in the reuse system impacts its likeliness of success and ability to move towards a circular economy. Having the correct tools in place is part of the challenge in transitioning to a circular economy; such tools also need to be suitable for the scale and speed of the supply chain. An example of an existing tool that would not be suitable on its own for a circular economy is the ATP swabbing of occasionally selected sample packs for quality control, as there is high-volume throughput and variation in reverse logistics. Study 2 incidentally highlighted the issues of manual swabbing and the potential for false positives. A circular economy presents different challenges to simply validating what should already be controlled and correct.
Simulated wear processes and assessment techniques were developed in this research to assess whether polymer materials that are typically used for single-use applications could withstand emulated aspects of a reuse system. Two exemplary polymer material types, rPET and heat-resistant PET, were thermoformed into food packaging and tested to see how the packaging survives throughout the wash cycles and various forms of damage that it may experience if it was introduced into a reuse system, such as applying weight (Study 1), scratching the packs and the cleanliness of this scratch damage (Study 2), and how its visual and 3D form changes throughout these tests (Study 3).
The simulated wear processes and assessment techniques developed provided valuable insights. In Study 1, tests showed that it is possible to measure different plastic materials’ ability to withstand emulated aspects of a reuse system. The findings showed that heat-resistant PET, in its tested thickness and form, could better withstand the emulated aspects of a reuse system than rPET due to lack of deformation throughout the compressive stress testing and wash cycling. Study 2 showed that scratch damage does not impact hygiene, which validated the specific materials and manufacturing methods’ appropriateness for food contact when assessed using ATP swabs and producing RLU readings and how they are categorised (with readings under 30 RLUs being categorised as ‘food safe’). However, this is only one method of testing the cleanliness/hygiene of packaging, and the researchers acknowledge that more extensive testing methods would be required in the future for complete validation of suitability for reuse, including the use of detergent throughout wash cycles, to align it closer with existing reuse systems. The 3D scanning measurement techniques of Study 3 offered further analysis of how the whole 3D form of the packaging changes in its deformation when subjected to different types of damage and wash cycles. The creation of 3D pack renderings also allowed for clearer visualisation of areas of significant deformation, enabling problematic areas of the packaging, such as their change in base curvature and sealing edge (flange) geometry, to be more easily identified and addressed through iterative redesign or adjusted manufacturing processes. In future, this technique could help in the design and development of packs for reusable applications. An area that was not the focus of this research but would be important in future research and would need further analysis is testing of the sealing edge (flange) of packs to ensure they can be resealed multiple times with a top-film on a production line. This would involve extensive testing on industry-based machinery and disclosure of confidential information on sealing temperatures and tolerances of packs and machinery; it would also be necessary to carry out repeated sealing and removing of top-films and assessment of the impacts that non-removed top-film fragments may have on this process. The 10 cycles used for testing the packs throughout these studies, informed by OPRL as being the minimum requirement standards for a packaging product to be considered reusable [33], were selected to test if the PET materials could survive these minimum requirements and to ensure the results are compatible and comparative with these requirements. This number of cycles is not an indicator of the packaging’s end of life. The packs studied in this research were not designed for reuse.
This research contribution was methodological and exploratory, but with these benchmarks and insights, future research could focus on experimenting further with materials and new packaging designs that are developed for specific food-to-go reuse applications. The simulated wear processes and assessment techniques developed in this research provide insights and opportunities for others to explore plastic materials and manufacturing methods that are typically used for single-use applications, from a new perspective of reuse applications, facilitating the development of designs that can withstand a reuse system in a move toward consumption reduction. This research highlights a need for further exploration and testing of reuse models and provides a starting point for the possible parameters that will be important in defining appropriate reuse packaging, such as changes to plastic surface chemistry or barrier properties. Further work should aim to define additional protocols for these as well.

Author Contributions

N.Y.—Conceptualization, Formal analysis, Investigation, Methodology, Resources, Validation, Visualization, Writing—original draft, Writing—review and editing. S.N.—Conceptualization, Formal analysis, Investigation, Methodology, Resources, Validation, Visualization, Writing—original draft, Writing—review and editing. E.W.—Funding acquisition, Investigation Supervision, Writing—original draft, Writing—review and editing. R.L.—Conceptualization, Formal analysis, Investigation, Methodology, Resources, Validation, Visualization, Writing—original draft, Writing—review and editing. A.E.—Data curation, Methodology, Resources. J.W.—Data curation, Resources. G.T.W.—Funding acquisition, Project administration, Supervision, Writing—original draft, Writing—review and editing. All authors have read and agreed to the published version of the manuscript.

Funding

This work was supported by the UK Research and Industry’s Smart Sustainable Plastic Packaging Challenge, delivered by Innovate UK and managed by the Natural Environment Research Council (NERC) [grant number NE/V01076X/1].

Data Availability Statement

The data that support the findings of this study are openly available in figshare at https://doi.org/10.17028/rd.lboro.29085977, reference number 10.17028/rd.lboro.29085977.

Acknowledgments

The authors would like to thank Klöckner Pentaplast (kp—based in Featherstone, West Yorkshire, UK) for providing the packaging samples for testing and all members of the PPFTG project for their contributions to the PPFTG project. The following individuals from the School of Design and Creative Arts, Loughborough University, UK, are acknowledged: Drew Mason for building the test rig for applying weight to packs, Stacey Prentice for helping to measure the material thickness of the packs, and Abby Paterson for providing access to the 3D scanner and software. The authors also thank Sam Davis (from the Loughborough Materials Characterisation Centre (LMCC), Department of Materials, Loughborough University, UK) for help and guidance with the sputter coater and digital microscope imaging and David Thompson (from the Wolfson School of Mechanical, Electrical and Manufacturing Engineering, Loughborough University, UK) for help and guidance with the metrology laboratory equipment.

Conflicts of Interest

The authors declare no conflicts of interest.

Appendix A

Figure A1. Thermoformed packs’ visible differences in the mould used for rPET (a) and heat-resistant PET (b).
Sustainability 18 05657 g0a1
Figure A2. Plated cut scratch samples (fork and needle scratches) with the white card used behind sample (a), and a plated cut scratch sample with white card backing on a digital microscope (b).
Sustainability 18 05657 g0a2
Figure A3. Digital microscope images of fork scratches (a,b) and needle scratches (c,d). The images captured on the digital microscope (a,c) were converted within the software on the digital microscope into 3D maps using the image data, allowing for the data to be visualised in 3D (b,d).
Sustainability 18 05657 g0a3
Figure A4. Cut scratch samples setup on the Bruker NPFlex Elite for optical measurement (a) and on the Talysurf-series2 Taylor Hobson for surface texture measurement (b).
Sustainability 18 05657 g0a4
Figure A5. Needle and fork scratches on area 1 of the rPET pack (a) and the heat-resistant PET pack (b).
Sustainability 18 05657 g0a5
Figure A6. Using a test rig to measure the corner deformation of scratched and fouled packs after the fifth and tenth wash cycles; (a) rig construction and top floating part of the rig, (b) rig with pack and floating part of the rig applied, and (c) ruler details of rig to measure corner deformation.
Sustainability 18 05657 g0a6
Figure A7. rPET sealing edge cross-sections: along the y axis of packs (a) including points 19, 20, 21, and (b) including points 13, 12, 11; and along the x axis of packs (c) including points 17, 16, 15, and (d) including points 7, 8, 9.
Sustainability 18 05657 g0a7
Figure A8. Heat-resistant PET sealing edge cross-sections: along the y axis of packs (a) including points 19, 20, 21, and (b) including points 13, 12, 11; and along the x axis of packs (c) including points 17, 16, 15, and (d) including points 7, 8, 9.
Sustainability 18 05657 g0a8

Appendix B

Table A1. Laptop device specifications for processing 3D scan data.
Laptop Device Specifications for Processing 3D Scan Data
Laptop 1Laptop 2
Laptop modelDell Precision 7560Dell Precision 7730
Processor11th Gen Intel(R) Core(TM) i9-11950H @2.60 GHz, 2611 MHz, 8 Core(s), 16 Logical Processor(s)Intel(R) Core(TM) i9-8950HK CPU @2.90 GHz
Installed RAMInstalled Physical Memory (RAM) 32.0 GB64.0 GB (63.8 GB usable)
System typex64-based PC64-bit operating system, x64-based processor
Graphics processorNVIDIA RTX A3000 Laptop GPUIntel(R) UHD Graphics 630/NVIDIA Quadro P4200
Windows specifications: Edition10 ProWindows 10 Enterprise
Windows specifications: Version10.0.19042 Build 1904221H2
Table A2. Computer device specifications for analysis of 3D scan data.
Computer Device Specifications for Analysis of 3D Scan Data
ProcessorIntel(R) Core(TM) i7-9700 CPU @3.00 GHz
Installed RAM16.0 GB
System type64-bit operating system, x64-based processor
Graphics processorNVIDIA Quadro P1000
Windows specifications: EditionWindows 10 Enterprise
Windows specifications: VersionVersion 22H2

References

  1. WWF; Dalberg. Plastics: The Cost to Society, the Environment and the Economy; WWF—World Wide Fund for Nature: Gland, Switzerland, 2021. [Google Scholar]
  2. HUBBUB. Reuse Systems Unpacked. 2022. Available online: https://hubbub.org.uk/reuse-systems-unpacked (accessed on 20 November 2023).
  3. WRAP. From Words to Action: The Global Treaty to End Plastic Pollution. 2023. Available online: https://wrap.org.uk/taking-action/plastic-packaging/initiatives/global-treaty-end-plastic-pollution/words-action-global-treaty-end-plastic-pollution (accessed on 20 November 2023).
  4. Schyns, Z.O.G.; Shaver, M.P. Mechanical Recycling of Packaging Plastics: A Review. Macromol. Rapid Commun. 2021, 42, e2000415. [Google Scholar] [CrossRef] [Scilit] [PubMed]
  5. Shojaei, B.; Abtahi, M.; Najafi, M. Chemical recycling of PET: A stepping-stone toward sustainability. Polym. Adv. Technol. 2020, 31, 2912–2938. [Google Scholar] [CrossRef] [Scilit]
  6. Stark, N.M.; Matuana, L.M. Trends in sustainable biobased packaging materials: A mini review. Mater. Today Sustain. 2021, 15, 100084. [Google Scholar] [CrossRef] [Scilit]
  7. Ellen MacArthur Foundation. The New Plastics Economy: Rethinking the Future of Plastics; Ellen MacArthur Foundation: Isle of Wight, UK, 2016. [Google Scholar]
  8. The Big Plastic Count. The Big Plastic Count Results Are In. 2024. Available online: https://thebigplasticcount.com/results (accessed on 17 May 2024).
  9. Smithers, R. “Lunch on the Go” Habit Generates 11bn Items of Packaging Waste a Year; The Guardian: London, UK, 2019. [Google Scholar]
  10. Ellen MacArthur Foundation. Reusable Packaging Business Models. 2024. Available online: https://www.ellenmacarthurfoundation.org/reusable-packaging-business-models (accessed on 17 May 2024).
  11. PISCES. Home—PISCES. 2023. Available online: https://www.piscespartnership.org/ (accessed on 17 May 2024).
  12. Shrewsbury Cup. Choose to Reuse Shrewsbury Cup. 2019. Available online: http://www.shrewsburycup.co.uk/ (accessed on 18 September 2023).
  13. Starbucks Corporation. Starbucks Trials New Returnable Cup Programs. 2022. Available online: https://stories.starbucks.com/emea/stories/2022/starbucks-emea-cups-share-pilot-phase/ (accessed on 18 September 2023).
  14. Loop. Loop at Burger King, Available in the UK. Loop. 2023. Available online: https://exploreloop.com/BurgerKing/ (accessed on 18 September 2023).
  15. Wm Morrison Supermarkets Limited. Community. Introducing Greener Salad Bars with Our Refill a Box Trial. 2022. Available online: https://my.morrisons.com/blog/community/introducing-rentable-salad-bar-boxes/ (accessed on 18 September 2023).
  16. Nahar, S.; Sian, M.; Larder, R.; Hatton, F.; Woolley, E. Challenges Associated with Cleaning Plastic Food Packaging for Reuse. Waste 2023, 1, 21–39. [Google Scholar] [CrossRef] [Scilit]
  17. Clark, N.; Trimingham, R.; Wilson, G.T. Understanding consumer disposal behaviour with food to go packaging in a move to circular, zero waste packaging solutions. In PLATE—Product Lifetimes and the Environment; Universitätsverlag der TU Berlin: Berlin, Germany, 2019. [Google Scholar]
  18. UKRI. GTR. 2024. Available online: https://gtr.ukri.org/projects?ref=NE%2FV01076X%2F1 (accessed on 17 May 2024).
  19. Wilson, G.; Clark, N.; Hatton, F.; Trimingham, R.; Woolley, E. Perpetual plastic for food to go: A design-led approach to polymer research. Polym. Int. 2022, 71, 1370–1375. [Google Scholar] [CrossRef] [Scilit]
  20. ALPLA. Reusable PET Bottles. 2025. Available online: https://www.alpla.com/en/products-innovations/case-studies/reusable-pet-bottles (accessed on 16 January 2025).
  21. WRAP. Single-Use to Reuse—Changing the Habits of a Lifetime. 2023. Available online: https://wrap.org.uk/blog/2023/09/single-use-reuse-changing-habits-lifetime (accessed on 20 November 2023).
  22. Wilson, G.T.; Smalley, G.; Suckling, J.R.R.; Lilley, D.; Lee, J.; Mawle, R. The hibernating mobile phone: Dead storage as a barrier to efficient electronic waste recovery. Waste Manag. 2017, 60, 521–533. [Google Scholar] [CrossRef] [Scilit] [PubMed]
  23. Baird, H.; Meade, K.; Webb, T. This has already been used! A paradigm to measure the point at which people become unwilling to use reusable containers. J. Clean. Prod. 2022, 363, 132321. [Google Scholar] [CrossRef] [Scilit]
  24. Baxter, W.; Aurisicchio, M.; Childs, P. Contaminated interaction: Another barrier to circular material flows. J. Ind. Ecol. 2017, 21, 507–516. [Google Scholar] [CrossRef] [Scilit]
  25. Wypych, G. Handbook of Polymers, 2nd ed.; ChemTec Publishing: Scarborough, ON, Canada, 2016; pp. 398–403. ISBN 978-1-895198-92-8. [Google Scholar]
  26. Veaux, M.; André, P. The transport packaging testing engineer—A superman??? Packag. Technol. Sci. 1992, 5, 69. [Google Scholar] [CrossRef] [Scilit]
  27. Lepine, J.; Rouillard, V.; Sek, M. Review Paper on Road Vehicle Vibration Simulation for Packaging Testing Purposes. Packag. Technol. Sci. 2015, 28, 672–682. [Google Scholar] [CrossRef] [Scilit]
  28. Ge, C.; Pan, L. Vibration damage rate curves for quantifying abrasion of printed packaging in accelerated random vibration test. Packag. Technol. Sci. 2018, 31, 71–81. [Google Scholar] [CrossRef] [Scilit]
  29. Griffiths, K.; Shires, D.; White, W.; Keogh, P.S.; Hicks, B.J. Correlation Study Using Scuffing Damage to Investigate Improved Simulation Techniques for Packaging Vibration Testing. Packag. Technol. Sci. 2013, 26, 373–383. [Google Scholar] [CrossRef] [Scilit]
  30. Hare, B.A.; Moyse, A.; Sue, H.-J. Evaluation of Packaging Film Mechanical Integrity Using a Standardized Scratch Test Instrument. Packag. Technol. Sci. 2012, 25, 85–96. [Google Scholar] [CrossRef] [Scilit]
  31. Lilley, D.; Smalley, G.; Bridgens, B.; Wilson, G.T.; Balasundaram, K. Cosmetic obsolescence? User perceptions of new and artificially aged materials. Mater. Des. 2016, 101, 355–365. [Google Scholar] [CrossRef] [Scilit]
  32. Klöckner Pentaplast. Hotfill. 2024. Available online: https://www.kpfilms.com/en/food-packaging/dairy-packaging/hotfill (accessed on 17 May 2024).
  33. OPRL. New OPRL Refill Labels Offer Consumer Reassurance on Reusable Packaging. 2021. Available online: https://oprl.org.uk/press-releases/new-oprl-refill-labels-offer-consumer-reassurance-on-reusable-packaging/ (accessed on 30 August 2024).
  34. Food Standards Agency. Cleaning. Food Standards Agency. 2020. Available online: https://www.food.gov.uk/safety-hygiene/cleaning (accessed on 15 September 2023).
  35. Ermolai, V.; Sover, A.; Lang, A. Characterisation of the shape memory effect of PET polymer by FFF 3D printing. Mater. Res. Proc. 2023, 28, 93–100. [Google Scholar] [CrossRef] [Scilit]
  36. AMETEK Inc. Form Talysurf® CNC Series. 2018. Available online: https://www.taylor-hobson.com/-/media/ametektaylorhobson/files/product-downloads/form-talysurf-cnc-series/talysurf-cnc-series-surface-finish-instrument-en.pdf?la=en&revision=9ccdf3cc-7d72-4fc1-a396-f88e3559a681 (accessed on 24 May 2026).
  37. Woolley, E.; Nahar, S.; Simeone, A.; Lee, K.; Wilson, G.T. A Circular economy for reusable plastic packaging: Digital assessment for cleaning assurance. Procedia CIRP 2024, 122, 348–353. [Google Scholar] [CrossRef] [Scilit]
  38. Artec Europe. Artec Leo. 2023. Available online: https://www.artec3d.com/portable-3d-scanners/artec-leo?utm_source=bing&utm_medium=cpc&utm_campaign=Artec3d-ps-brand.scanner-eng-high.cost&utm_term=artec%20leo%203d%20scanner||kwd-83701491176414:loc-188&utm_content=1339206164248344||&keyword=artec%20leo%203d%20scanner&msclkid=ac0de03f243b15190ffa84c86a189348&utm_source=bing&utm_medium=cpc&utm_campaign=Artec3d-ps-brand.scanner-eng-high.cost&utm_term=artec%20leo%203d%20scanner&utm_content=scanners_leo (accessed on 15 September 2023).
  39. Artec Europe. Technical Specifications. 2023. Available online: https://www.artec3d.com/portable-3d-scanners/artec-leo#tech-specs (accessed on 15 September 2023).
  40. Artec 3D. Installation System Requirements. 2021. Available online: http://docs.artec-group.com/as/16/en/install.html#system-requirements (accessed on 15 September 2023).
  41. Artec Europe. Artec Studio 16: System Requirements. 2020. Available online: https://support.artec-group.com/hc/en-us/articles/4415921435154-Artec-Studio-16-System-Requirements (accessed on 15 September 2023).
Figure 1. Colour-coded diagram of the areas on the pack where material thickness was measured.
Sustainability 18 05657 g001
Figure 2. Test rig for applying weight to packs. The test rig consists of laser-cut and engraved 12 mm MDF sheet and four rulers, with engraved visual markers to align the pack and weight in the same location each time (a). The pack corners were marked L1, L2, L3, L4 to match the test rig for maintaining orientation consistency during testing (c). A 5 kg weight was applied to packs on the top part of test rig (d) and measurements in mm recorded at each corner via four rulers (b).
Sustainability 18 05657 g002
Figure 3. Change in measurements of rPET across 10 cycles of applying 5 kg weight for 10 min and after a wash cycle was completed.
Sustainability 18 05657 g003
Figure 4. Change in measurements of heat-resistant PET across 10 cycles of applying 5 kg weight for 10 min and after a wash cycle was completed.
Sustainability 18 05657 g004
Figure 5. Cross-sections of the fork (a) and needle (b) scratches, with three views displayed on each: 3D map of the image (top left), the original image captured (top right), and the plotted graph of the cross-section allowing for dimensions to be extracted (bottom).
Sustainability 18 05657 g005
Figure 6. Measuring cut scratch samples of needle scratches (a,b) and fork scratches (c,d) on the Bruker NPFlex Elite (Billerica, MA, USA) for optical measurement of x and y profiles (a,c) and on the Talysurf-series2 Taylor Hobson (Leicester, UK) for surface texture measurement (b,d).
Sustainability 18 05657 g006
Figure 7. Fouling rPET pack (a) and heat-resistant PET pack (b) with cream cheese applied in small circular motions to each area of scratches during cycle 8 of testing.
Sustainability 18 05657 g007
Figure 8. Numbered digital dot markers projected onto 3D scan meshes.
Sustainability 18 05657 g008
Figure 9. Cross-sections with numbered points projected onto 3D scan meshes.
Sustainability 18 05657 g009
Figure 10. Deviation analysis of 3D scan meshes of rPET packs, comparing the unused pack to 10 washes (a), 5 kg weight and 10 washes (b), and scratches and 10 washes (c).
Sustainability 18 05657 g010
Figure 11. Deviation analysis of 3D scan meshes of heat-resistant PET packs, comparing the unused pack to 10 washes (a), 5 kg weight and 10 washes (b), and scratches and 10 washes (c).
Sustainability 18 05657 g011
Figure 12. Converting 3D scan meshes into closed objects to calculate volume. The original 3D scan mesh is imported and sealing edge on pack is positioned as level as possible, aligning it to the ground plane; (a), a planar, flat surface is positioned above the pack and then lowered until the entire sealing edge can be seen (b); the planar surface is then used as a cutting object to split the mesh and remove all excess 3D mesh geometry, leaving the main body of the pack behind (c); this main body of the pack is then capped, creating a closed object to calculate its volume (d).
Sustainability 18 05657 g012
Figure 13. rPET and heat-resistant PET projected digital dot markers analysis of distance (in mm) moved from the points on the unused pack.
Sustainability 18 05657 g013
Figure 14. rPET middle cross-sections: (a) along the y axis of packs including points 16, 1, 8, and (b) along the x axis of packs including points 20, 1, 12.
Sustainability 18 05657 g014
Figure 15. Heat-resistant PET middle cross-sections: (a) along the y axis of packs including points 16, 1, 8, and (b) along the x axis of packs including points 20, 1, 12.
Sustainability 18 05657 g015
Figure 16. Point test statistics of rPET and heat-resistant PET packs from the point set deviation analysis. The data for both rPET and heat-resistant packs is grouped by damage type indicated by the different colour boxes: yellow box is 10 washes, green box is 5kg weight 10 washes, and purple box is scratches 10 washes.
Sustainability 18 05657 g016
Figure 17. Volume analysis of heat-resistant PET and rPET packs following deformation testing.
Sustainability 18 05657 g017
Table 1. Material thicknesses of packs.
Material Thickness of Packs
Area of PackrPET Pack Material Thickness (mm)Heat-Resistant PET Pack Material Thickness (mm)
Sealing rim/edge0.36 ± 0.010.51 ± 0.01
Side walls0.24 ± 0.040.30 ± 0.08
Flat base (away from groove)0.33 ± 0.040.33 ± 0.03
Base close to groove0.27 ± 0.010.28 ± 0.01
Groove in base0.21 ± 0.010.25 ± 0.01
Table 2. Metrology analysis of scratches on Talysurf.
Metrology Analysis of Scratches on Talysurf
Scratch Type/NameMean Width of Scratch (mm)
from 3 Measurements
Mean Depth of Scratch (µm)
from 3 Measurements
Heat-Resistant PETrPETHeat-Resistant PETrPET
Needle scratch 10.19 ± 0.010.82 ± 1.0295.70 ± 18.6140.19 ± 16.79
Needle scratch 20.17 ± 0.010.19 ± 0.0588.57 ± 17.5913.56 ± 4.16
Needle scratch 30.18 ± 0.050.48 ± 0.4941.88 ± 6.3618.40 ± 24.65
Needle scratch 40.17 ± 0.010.18 ± 0.0246.28 ± 34.8916.26 ± 18.11
Fork scratch 13.64 ± 0.414.17 ± 3.0629.47 ± 5.9625.15 ± 14.55
Fork scratch 26.30 ± 1.255.97 ± 3.2849.79 ± 10.0841.39 ± 20.80
Table 3. Corner deformation of scratched and fouled packs at key milestones.
Corner Deformation of Scratched and Fouled Packs at Key Milestones
Corners of PacksrPET PackHeat-Resistant PET Pack
Unused5 Cycles10 CyclesUnused5 Cycles10 Cycles
Corner near Area 151 mm50 mm50 mm52 mm52 mm52 mm
Corner near Area 251 mm50 mm50 mm52 mm52 mm52 mm
Corner near Area 351 mm50 mm49 mm52 mm52 mm52 mm
Corner near Area 451 mm50 mm49 mm52 mm52 mm52 mm
Disclaimer/Publisher’s Note: The statements, opinions and data contained in all publications are solely those of the individual author(s) and contributor(s) and not of MDPI and/or the editor(s). MDPI and/or the editor(s) disclaim responsibility for any injury to people or property resulting from any ideas, methods, instructions or products referred to in the content.