Article

Assessing Yellow Mealworm (Tenebrio molitor) Larvae Meal as a Partial Replacement of Fishmeal in Fish Feeds: Growth, Antioxidant, Immune, and Histological Responses of Nile Tilapia, Oreochromis niloticus


by
Asmaa S. Abd El-Naby
1,
Reham M. Fawzy
1,
Amel M. El Asely
2,
Mohamed A. Al-Zahaby
3,
Fatma Samir
1,
Fatma M. Hashem
4,
Youssif Shehata Grana
5 and
Mohsen Abdel-Tawwab
6,*
1
Department of Fish Nutrition and Feed Technology, Central Laboratory for Aquaculture Research, Agricultural Research Center, Abbassa, Abo-Hammad 44662, Egypt
2
Department of Aquatic Animal Medicine, Faculty of Veterinary Medicine, Benha University, Benha 13736, Egypt
3
Department of Hatchery and Fish Physiology, Central Laboratory for Aquaculture Research, Agriculture Research Center, Abbassa, Abo-Hammad 44662, Egypt
4
Zoology Department, Faculty of Science, Zagazig University, Zagazig 44519, Egypt
5
Limnology Department, Central Laboratory for Aquaculture Research, Agricultural Research Center, Abbassa, Abo-Hammad 44662, Egypt
6
Department of Fish Biology and Ecology, Central Laboratory for Aquaculture Research, Agricultural Research Center, Abbassa, Abo-Hammad 44662, Egypt
*
Author to whom correspondence should be addressed.
Sustainability 2026, 18(11), 5661; https://doi.org/10.3390/su18115661
Submission received: 13 April 2026 / Revised: 23 May 2026 / Accepted: 30 May 2026 / Published: 3 June 2026
(This article belongs to the Section Sustainable Agriculture)

Abstract

The goal of this study was to replace the costly fishmeal (FM) with Tenebrio molitor larvae meal (TMLM) in diets for Nile tilapia (Oreochromis niloticus) juveniles. Six isonitrogenous diets were created in order to examine the viability of substituting FM protein with stepwise inclusion levels of TMLM protein, i.e., 0%, 15%, 30%, 45%, 60%, and 75% represented by TMLM0, TMLM15, TMLM30, TMLM45, TMLM60, and TMLM75, respectively. For 90 days, Nile tilapia juvenile (8.8–10.5 g) were fed on TMLM diets three times a day until apparent satiation. Nile tilapia fed on TMLM levels were found to significantly (p < 0.05) boosted their growth and feed efficiency indices by up to 45%, after which their performance declined. In comparison to other treatments, larger villi length/width and increased digestive enzymes activity were observed at this level (TMLM45). At TMLM45, there were no signs of inflammation in the liver tissues but feeding the fish on TMLM60 and TMLM75 showed more vacuolated hepatocytes and fewer hepatic sinusoids. Total protein, albumin, and globulin contents showed significant (p < 0.05) increases in response to TMLM levels in fish feeds; meanwhile no significant (p > 0.05) changes in blood glucose were observed compared to the control one (TMLM0). The values of alanine and aspartate aminotransferase, total cholesterol, and triglycerides decreased significantly (p < 0.05) as TMLM levels increased in fish feeds. In addition, significant (p < 0.05) increases in antioxidant and immunological variables were observed in fish fed with TMLM diets, in particular TMLM45. The current study concluded that the substitution of FM protein by 45% TMLM protein in diets administered to Nile tilapia juveniles significantly improved (p < 0.05) their growth, antioxidant, and immune response compared to the control diet (FM-based diet).

1. Introduction

The global demand for aquafeeds is predicted to increase from 53 million tons in 2022 to more than 100 million tons by 2050 [1]. However, given sustainability concerns regarding fish production, it is still unclear whether current raw feed commodities can meet the growing demand [2]. Fishmeal (FM) is an essential source of protein used in aquafeeds production because of its high protein content, unique amino acid profile, and superior digestibility [3,4]. The need for FM as a source of protein in fish diets has grown due to the quick growth of fish farms, which has raised costs and rendered FM unaffordable [4,5]. Hence, finding sustainable substitutes for protein supply is essential. Insect meals are a good substitute for FM due to their relative availability, acceptable nutritional value, and costless mass production [6,7,8,9,10]. Additionally, insect meals have many benefits, such as rich nutritional content, short life cycles, low carbon footprints, and effective nutrient sources, which makes them a sustainable remedy for the environmental problems caused by conventional feed components.
Among various insect species investigated for aquafeed production, yellow mealworm, Tenebrio molitor (TM) larvae (family: Tenebrionidae) are recognized for their nutritional value. T. molitor larvae meal (TMLM) has considerable amounts of proteins (44–69%), lipids (23–47%), vitamins, and bioactive substances; this makes it sustainable substitute for FM protein in diets for different aquaculture species [7,8,10]. Depending on the fish species and type of TMLM (defatted or full-fat meal), it appears to be able to replace a significant portion of FM in aquafeeds [7]. However, the inclusion of high amounts of TMLM to aquafeeds may harm intestinal health, resulting in decreased feed efficiency, erratic metabolic activity, and poor growth performance causing oxidative stress and disturbed redox homeostasis [11,12,13]. This could have a number of detrimental effects on fish, such as destruction, cell wall disruption, and DNA damage [14].
Because of its high growth performance, commercial relevance, and high economic value, among other factors, Nile tilapia (Oreochromis niloticus L.) is regarded as the most widely cultivated freshwater fish species and is economically significant on a global scale [15,16,17]. In natural aquatic environments, this omnivorous fish may consume insect larvae and zooplankton [18,19,20]. Previous studies have shown that Nile tilapia could use TMLM in place of FM or soybean meal (SBM), with varying outcomes based on TMLM quality, feeding schedule, and fish size, among others [21,22,23,24]. Thus, the current study was done to evaluate the use of TMLM protein instead of FM protein in diets for Nile tilapia and its effects on growth performance, digestive enzymes, antioxidant, and immunological assays. The histopathological investigations of the intestine and liver were also performed to provide an accurate evaluation.

2. Materials and Methods

2.1. Diets Preparation

Yellow mealworm (T. molitor) larvae were acquired from a local supplier in Cairo, Egypt, in a small plastic container (45 cm × 25 cm × 15 cm), equipped with a perforated plastic lid. T. molitor larvae were raised in the insect-rearing facility at the Faculty of Science, Zagazig University, Zagazig, Egypt. In polyethylene containers (45 cm × 19 cm × 10 cm), the larvae received meals either fresh cabbage leaves or broccoli, which were laid on a bed of bran from rice and wheat. A temperature of 25 °C and a humidity of 60–70% were maintained throughout their raising. Following metamorphosis into their adult form, the larvae began reproducing consistently and were collected before entering the prepupal stage. T. molitor larvae meal (TMLM) used in this investigation was dried at 65 °C for 24 h or more until complete drying with constant weight. Afterwards, TMLM was ground using pulse grinding technique with electrical home grinder, using short pulses of 3 to 5 s, pausing briefly between pulses [25]. Then, the TMLM powder was sieved manually through a standard laboratory wire sieve with a mesh size of 0.5 mm to 1.0 mm. The TMLM powder was kept at −20 °C until its use in diet formulation. The proximate chemical composition of TMLM used in this study was done according to AOAC [26]. It comprised 4.9% moisture, 47.8% protein, 23.9% lipids, 4.8% ash, and 8.8% fiber.
The protein composition of the trial diets was adjusted at 30%, a concentration previously determined for Nile tilapia fingerlings [27]. All the ingredients included in the experimental diets were obtained from a local market, well grounded, and sieved. Six isonitrogenous experimental diets (30% crude protein) were formulated in which FM protein was substituted with TMLM protein at levels of 0.0%, 15%, 30%, 45%, 60%, and 75% represented by TMLM0, TMLM15, TMLM30, TMLM45, TMLM60, and TMLM75, respectively (Table 1). The feed ingredients were well mixed for 30 min, during which an appropriate volume of water was added into the ingredients to achieve the required uniformity. Finally, the tested diets were pelletized, cut into 3.0 mm die tip mill, and dried in air at 25 °C to reduce its moisture content to less than 10%, after which diets were kept at −4 °C in a fridge for subsequent use.
The proximate analyses of FM, TMLM, and the experimental feeds were carried out according to AOAC [26]. NRC guidelines [28] were followed in calculating the gross energy. The amino acid profile of the trial feeds was analyzed consistent with the method of Vázquez-Ortiz et al. [29], utilizing an automated amino acid analysis by HPLC (Varian 9050/9012; Varian, Walnut Creek, CA, USA). This analysis was preceded by hydrolysis of acids with 6 N HCl, refluxed for 23 h at 110 °C. Tryptophan was determined colorimetrically after hydrolyzing triplicate samples in 4.2 N NaOH [30]. The amino acids composition of the experimental feeds as well as the amino acids requirement of Nile tilapia after Santiago and Lovell (1988) [31] are shown in Table 2.

2.2. Fish Husbandry

Nile tilapia, O. niloticus, juveniles were obtained from the breeding fishponds located at the Central Laboratory for Aquaculture Research in Abbassa, Abo-Hammad, Egypt. Following a two-week period, fish were acclimatized in a 1.5 m3 fiberglass tank equipped with aeration, maintained under laboratory circumstances, and nourished with a control feed (30% CP). Following acclimatization, 270 healthy juveniles (8.8–10.5 g) were randomly allocated into 18 aquaria (130 L each; n = 15 per aquarium) to represent six treatments, with three replicates. The aquaria were provided with dechlorinated potable water and aerated via air-stones connected to an air compressor. For 90 days, fish fed on the experimental feeds up to apparent satisfaction thrice a day at 9:00 h, 13:00 h, and 17:00 h. The photoperiod was 14 h light: 10 h dark. Throughout the trial running, approximately 50% of the water in each aquarium, along with fish feces, was replaced daily with fresh dechlorinated water sourced from a storage tank. Fish from all treatments were gathered, and their collective weight was measured biweekly to assess the progression of fish growth. Every day, water temperature, dissolved oxygen (DO), and pH values were monitored in sites. Temperature and DO levels of water were determined using a DO meter (Jenway, London, UK). A digital mini-pH meter (model 55, Fisher Scientific, Denver, CO, USA) was utilized to determine the pH level. Concentrations of unionized ammonia were determined weekly with a HACH kit (HACH Co., Ltd., Loveland, CO, USA). The values of water quality indices fell inside the established parameters: water temperature fluctuated between 28.1 °C and 31.2 °C, DO concentrations fluctuated between 5.3 and 6.8 mg/L, and unionized ammonia levels varied between 0.21 and 0.33 mg/L. As stated by Boyd and Tucker [32], these water variables levels are suitable for fish rearing.
After the feeding trial, fish in each aquarium were fasted for 24 h and then anesthetized with 100 mg/L of tricaine methane sulfonate (MS222; Sigma-Aldrich, St. Louis, MO, USA) prior to taking samples. Afterwards, fish were gathered, enumerated, and collectively weighed to assess their performance indices as follows:
Weight gain (WG, g) = W2 (g) − W1 (g);
Weight gain (WG, %) = 100 × WG (g)/W1 (g);
Specific growth rate (SGR; %/day) = 100 × (Ln W2 − Ln W1)/90;
Feed conversion ratio (FCR) = Feed intake (g)/WG (g);
Fish survival (%) = 100 (N2/N1).
where W1: initial weight (g); W2: final weight (g); N1: number of fish at the start of the experiment; and N2: number of fish at the end of the experiment.

2.3. The Chemical Composition of Feeds and Fish Body

Following the guidelines of AOAC [26], the approximate composition of the diets and the whole-fish body was measured in triplicates at the start and the end of the feeding trial. The specimens underwent drying in the oven (GCA, model 18EM, Precision Scientific group, Chicago, IL, USA) at 85 °C until they attained constant weights in order to assess their moisture content (AOAC 930.15). In addition, a micro-Kjeldahl device (Labconco, Labconco company, Kansas, MO, USA) was used to ascertain the nitrogen concentration (AOAC 984.13). The nitrogen concentration was multiplied by 6.25 to get the quantity of crude protein. A multi-unit Soxhlet extraction machine (Lab-Line Instruments, Inc., Melrose Park, IL, USA) was used to execute the ether extraction procedure for 16 h in order to quantify the total lipid contents (AOAC 920.39). To determine the ash content (AOAC 942.05), dry samples were subjected to a six-hour burning in a muffle furnace (Thermolyne Corporation, Dubuque, IA, USA) set at 550 °C. The gross energy of every ingredient was determined according to NRC [28].

2.4. Blood and Tissues Sampling

Subsequent to the completion of the 90-day feeding experiment, following a 24 h period of fasting, the fish were anaesthetized utilizing 100 mg/L MS222. Using sterile syringes, blood samples were taken from the caudal blood vessels of three fish from every aquarium (nine fish/treatment). The blood specimens were moved into dry, sterile vessels destitute of anticoagulants, permitted to remain at chamber temperature for one hour, and subsequently subjected to centrifugation at 5000× g for 15 min at chamber temperature to obtain plasma utilized in biochemical and immunity assessments. In order to measure the activity of intestinal digestive enzymes and hepatic antioxidant biomarkers, fish underwent dissection after their blood sampling. Then, liver and mid-intestine tissues were taken out, cleaned, and frozen at −20 °C. Additional liver and mid-intestinal tissues were kept in 4% formaldehyde for histological analyses.

2.5. Digestive Enzyme Activities

The specimens from mid-intestine tissues were subjected to homogenization in a solution of physiological saline at a ratio of 1:10, then subjected to centrifugation at 5000× g for 15 min at 4 °C. The supernatants were gathered aseptically and preserved at −20 °C. Diagnostic kits (Egyptian Co for Biotechnology—Spectrum Diagnostics, Cairo, Egypt) were utilized to assess the values of digestive enzymes, following the guidelines of the producer. The α-amylase concentration (Cat No: ZL-219 00) was determined by Bernfeld [33] utilizing a solution of 1% starch in a Tris-HCl buffer (0.1 M, pH 7.0) serving as the substrate. The total proteases activity was investigated via the casein digestion procedure developed by Kunitz [34]. This was accomplished by incubating 0.1 mL of crude enzyme extract with 2.0 mL of casein buffer substrate at 28 °C for 15 min and then measuring the supernatant at 280 nm. The lipase activity (Cat No: 281 001) was measured in accordance with the procedure of Shihabi and Bishop [35] via the hydrolysis of triglycerides employing olive oil as the substrate. The Bradford procedure [36] was used to measure the total protein (TP) content (Cat No: 310 001) in crude enzyme extracts and enzyme activities are represented as U/mg protein.

2.6. Hematological Analyses

Blood analyses were done subsequent to the approaches of Dacie and Lewis [37]. A Neubauer hemocytometer was used to determine the different hematological indices including counts of red blood cells (RBCs) as well as hemoglobin (Hb) and hematocrit (Hct) concentrations. The mean corpuscular hemoglobin level (MCHC), mean corpuscular volume (MCV), and mean corpuscular hemoglobin (MCH) were computed using these values, as stated by Dacie and Lewis [37].

2.7. Serum Biochemical Analyses

Serum biochemical investigations were estimated via analytical kits based on the manufacturer’s guides (Egyptian Co for Biotechnology—Spectrum Diagnostics, Cairo, Egypt). Plasma total protein (TP; Cat No: 310 001) was detected following Bradford [35], while albumin (ALB; Cat No.: 211 001) was measured using the approach of Doumas et al. [38]. Globulin (GLOB) value was determined following the subsequent formula: GLOB = TP − ALB. To determine blood glucose (Cat No.: 250 001), the technique of Trinder [39] was followed, and to determine levels of aspartate aminotransferase (AST; Cat No.: 260 001) and alanine aminotransferase (ALT; Cat No.: 264 001), the procedures of Reitman and Franke [40] were followed. Following the procedures of Allain et al. [41] and Bucolo and David [42], total cholesterol (T-CHO; Cat No.: 230 002) and triglycerides (TG; Cat No.: 314 001) values were determined, respectively.

2.8. MDA and Antioxidation Biomarkers Assays

The investigation was followed by the collection and homogenization of hepatic tissue specimens in a 1:10 ratio of cold phosphate buffer saline (0.1 M, pH 7.4) via a Potter-Elvehjem glass/Teflon homogenizer (DWK Life Sciences, Beijing, China). The homogenate was subjected to filtration and centrifuged at 4000× g for a duration of 10 min at 4 °C, with the resultant supernatant preserved at −20 °C until subsequent investigation using Bio-Diagnostics Kits, Egyptian Co for Biotechnology—Spectrum Diagnostics, Cairo, Egypt. Using the protocol of Ohkawa et al. [43], the MDA was assessed (Cat. No.: MD 25 29) in the supernatant. Following McCord and Fridovich [44], the superoxide dismutase (SOD) activity (Cat. No.: SD 25 21) was measured at 550 nm. The catalase (CAT) activity (Cat. No.: CA 25 17) was quantified via its reaction with H2O2 at 240 nm, following the method described by Aebi [45], while the glutathione peroxidase (GPx) activity (Cat. No.: GP 25 24) was assessed using methyl catechol as a substrate at 340 nm, in accordance with the procedure of Paglia and Valentine [46].

2.9. Immunological Analyses

Following the turbidimetric method of Ellis [47], the lysozyme (LYZ) activity was assessed using an ELIZA kit (MyBioSource, San Diego, CA, USA; Cat No.: MBS7253706). However, Micrococcus luteus, lyophilized at a concentration of 0.2 mg/mL, served as the substrate in a phosphate buffer with a pH of 5.75. Fifty microliters of serum samples were mixed with three milliliters of bacterial solution. The LYZ activity was determined spectrophotometrically at a wavelength of 540 nm directly after mixing (Ao) and following a 30 min incubation at 37 °C (A). One unit of the LYZ activity was defined as a reduction in absorbance of 0.001 min−1 mL−1 of serum.
An ELISA kit (MyBioSource, San Diego, CA, USA; Cat No.: MBS702163) was used to quantify the quantity of immunoglobulin M (IgM) as described in Barta [48]. The competitive inhibition enzyme immunoassay technique is applied in this assessment. This kit comes with a microtiter plate that has been precoated with goat-anti-rabbit antibodies. Along with an IgM-specific antibody and HRP-conjugated IgM, standards or samples are supplemented to the appropriate microtiter plate wells. When the antibody is present, the competitive inhibition response between unlabeled IgM and HRP-labeled is initiated. The color shift that occurs when the wells are supplied with a substrate solution is inversely correlated with the sample’s IgM content. Color intensity is measured, and the color generation process is halted.

2.10. The Plasma Bactericidal Activity

The plasma bactericidal activity was determined using the Miles–Misra approach as outlined by Okada et al. [49]. The bacterial strain chosen for the present assay was Aeromonas sobria. This bacterium was preserved at −80 °C in a solution of glycerol. After inoculation into tryptic soy broth (TSB), the isolated bacteria were left incubating at 30 °C for one day. Following centrifugation, the bouillon was rinsed with a saline bath and subsequently resuspended in gelatin veronal buffer (GVB). Utilizing a spectrophotometer, counts of bacteria were set to 1 × 10⁵ cells/mL. The viability count was determined by inoculating tryptic soy agar (TSA) medium with GVB at successive dilutions. After combining serum samples with GVB in a 1:4 volume ratio, they were combined with an equivalent amount of the produced bacterial isolate suspensions. The mixture was then maintained at 30 °C for 24 h. Viable cell numbers were determined employing the agar plate-spread technique on TSA subsequently an incubation duration of 24 h.

2.11. Histopathological Analyses

For histological examinations, three fish from each aquarium (nine fish per treatment) were randomly taken and dissected. Intestinal and liver samples were rinsed with distilled water and directly placed in 10% buffered formalin solution for two days. Using the procedures outlined in Bancroft and Gamble [50], tissue specimens were preserved using the paraffin embedding approach immediately following fixation. Following a standard protocol, the tissue samples underwent dehydration through a graded series of ethyl alcohol solutions, were purified in xylene, and subsequently embedded in paraffin wax. Sections, with a 5 μm thickness, were then obtained and stained with eosin and hematoxylin (E & H). Implementing a Leica digital camera model D-LUX and a light microscope (LEICA, Leica Microsystems AG, Wetzlar, Germany), histopathological investigations were conducted. The images were digitally taken at a magnification of 40× and then manipulated via ImageJ software (version 1.54).

2.12. Statistical Analyses

Data obtained were analyzed using the statistical package SPSS, version 26 (SPSS, Richmond, VA, USA), as stated by Dytham [51]. The collected data were assessed for normality via Kolmogorov–Smirnov’s test and for homogeneity of variances via Bartlett’s test. One-way ANOVA was used to analyze the effects of dietary TMLM, subsequently using Tukey’s HSD as a post-hoc test to confirm the significant variation among means at p < 0.05.

3. Results

3.1. Amino Acids Composition of Diets

All experimental diets were comparable in terms of DM and other main chemical composition. The essential amino acid (EAA) profile of the experimental diets showed that arginine, isoleucine, leucine, lysine, phenylalanine, threonine, and valine were the most abundant (Table 2). Concerning the EAA profile in diets, drastic declines in arginine, isoleucine, lysine, methionine, phenylalanine, and valine were noted in TMLM60 and TMLM75 where their values did not meet the amino acid requirement by Nile tilapia (Table 2). The amino acid profile of other diets with low amounts of TMLM meets the requirement of Nile tilapia.

3.2. Growth Efficiency and Proximate Composition

The growth and zootechnical indices of O. niloticus juveniles are displayed in Table 3. FW, WG%, and SGR values indicated a significant (p < 0.05) rising trend when the TMLM contents increased gradually up to TMLM45; beyond that, the fish growth declined (Table 3). The growth indices in TMLM45 were significantly (p < 0.05) elevated in comparison to other treatments; meanwhile, the minimum fish growth was noted in the control group. Nile tilapia in this treatment (TMLM45) consumed more feed (48.9 g feed/fish) than other fish groups, but no significant (p > 0.05) difference was noted in FCR values (1.50–1.52) among various TMLM treatments (Table 3).
Table 4 exhibits the whole-body chemical structure of O. niloticus juveniles. In the whole-fish body, the amounts of crude protein, total lipids, total ash, and moisture were not significantly (p > 0.05) changed among the various TMLM treatments.

3.3. Activities of Digestive Enzymes

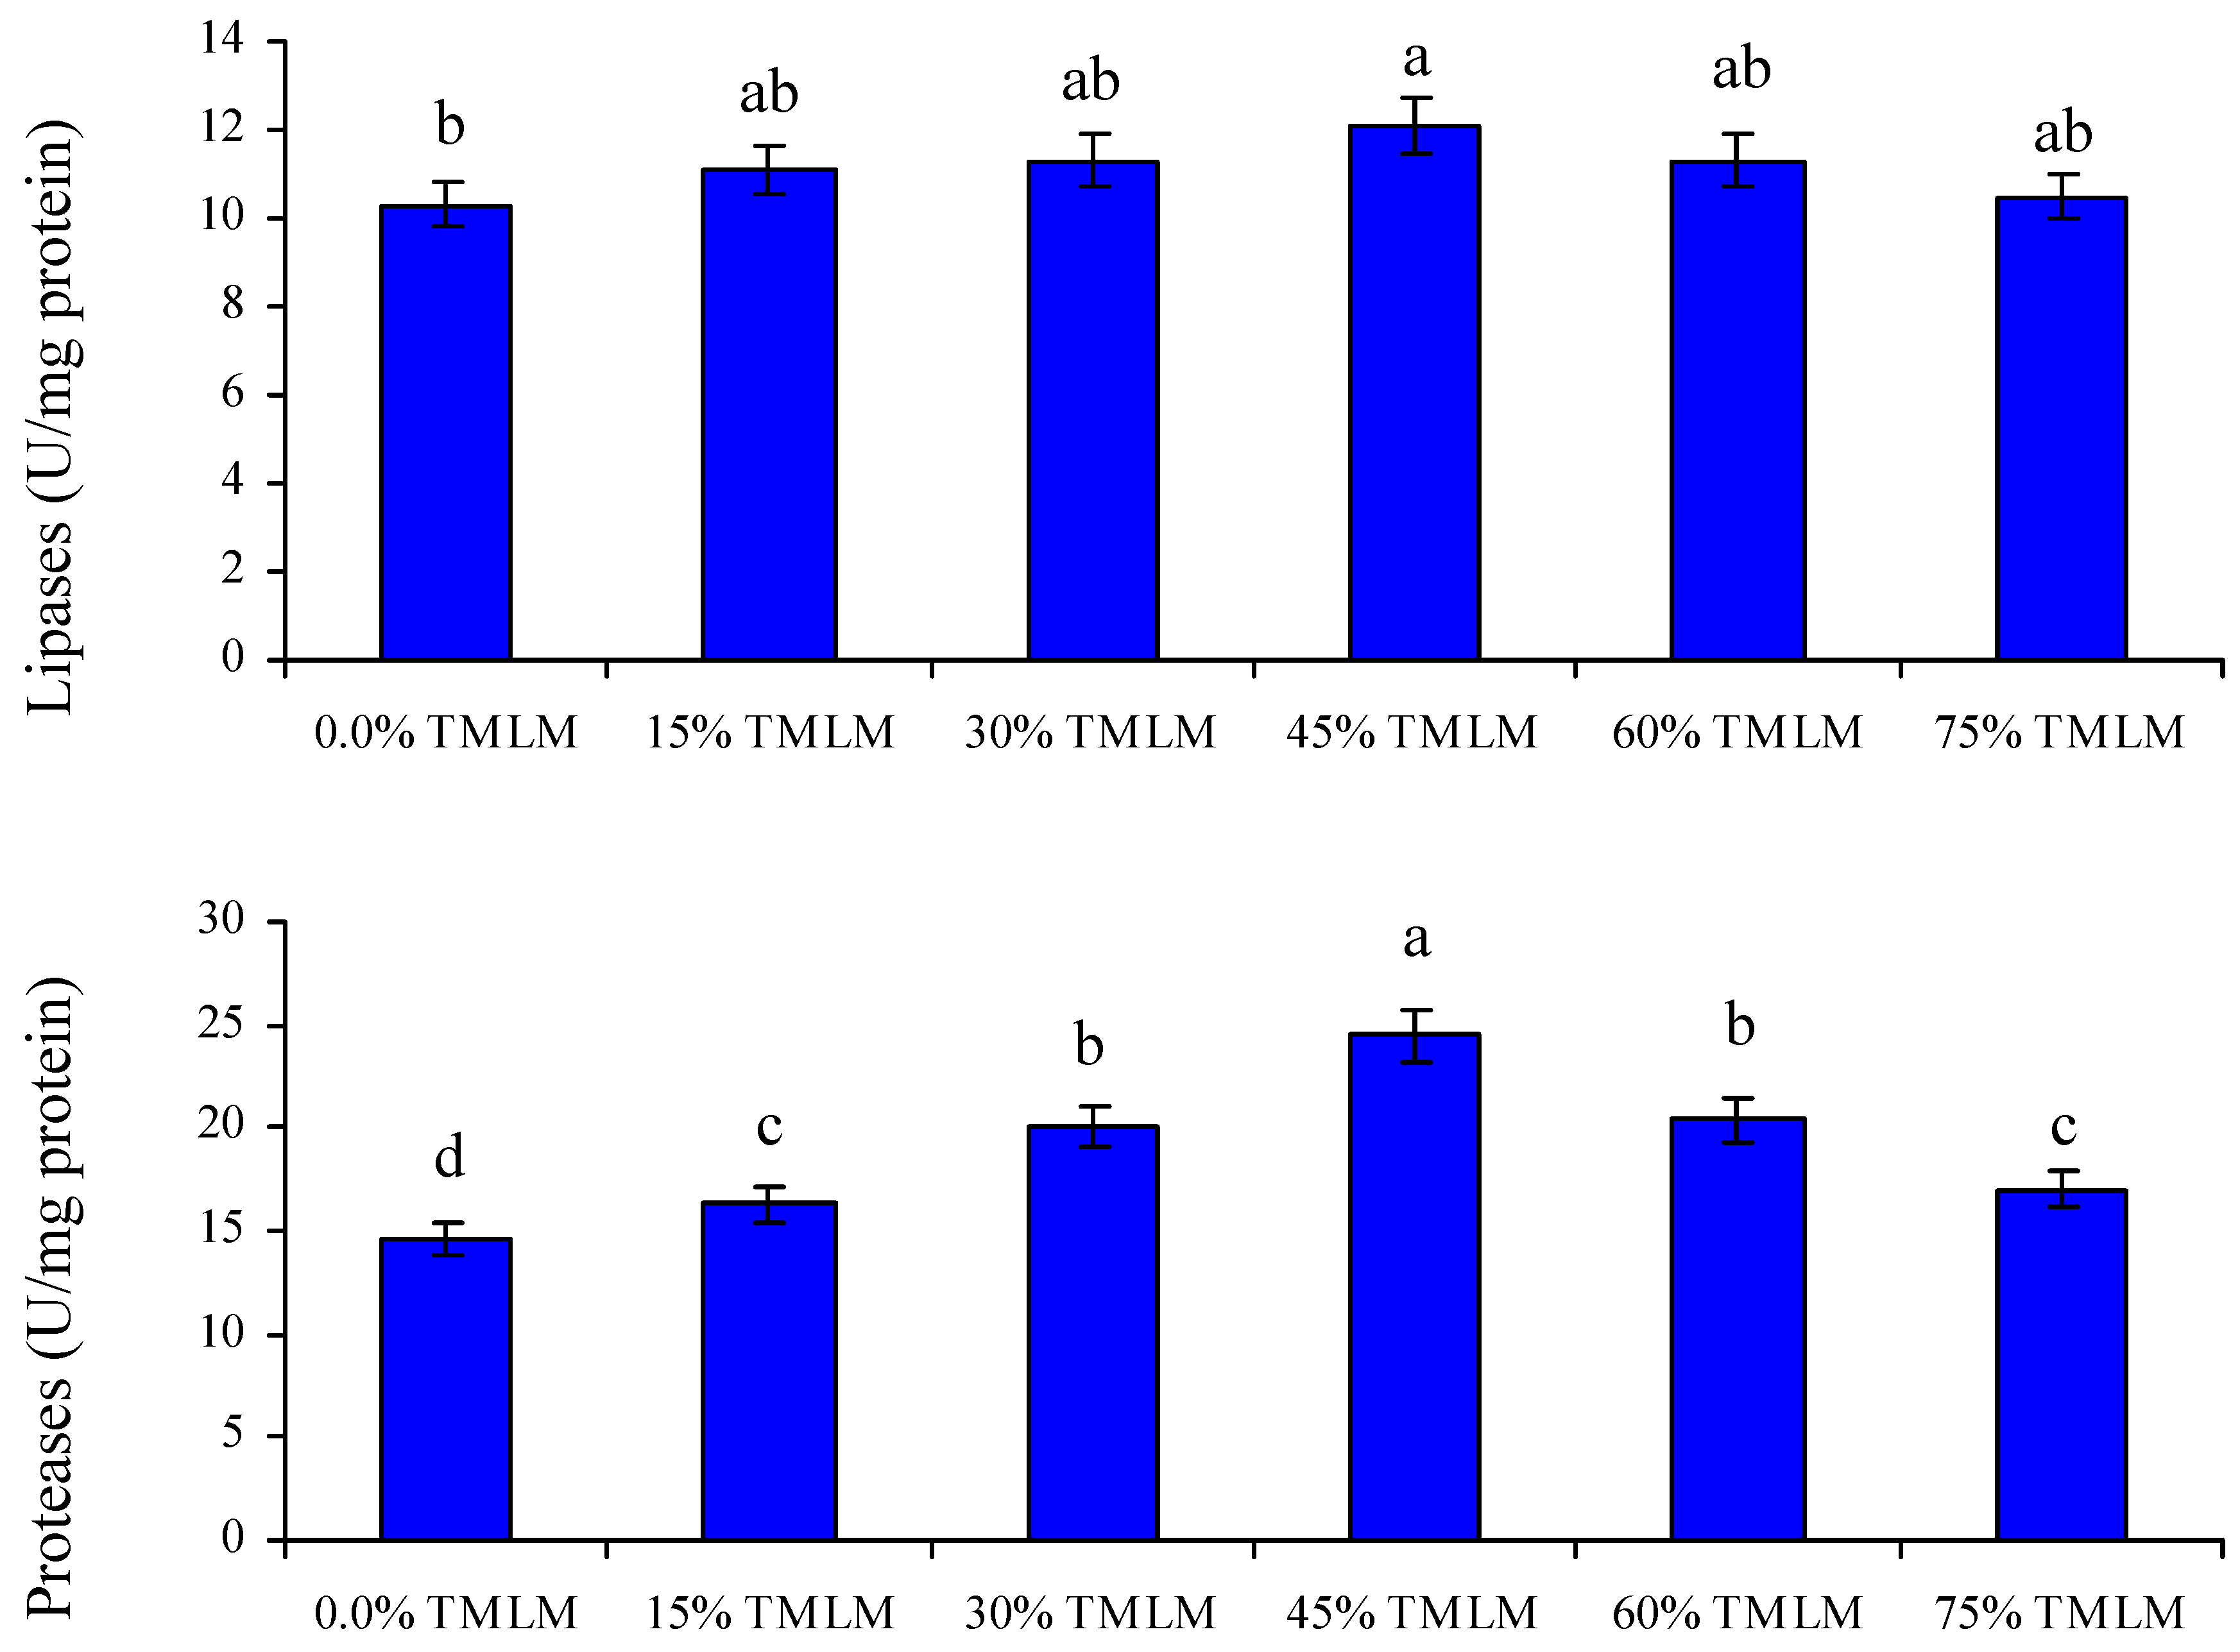
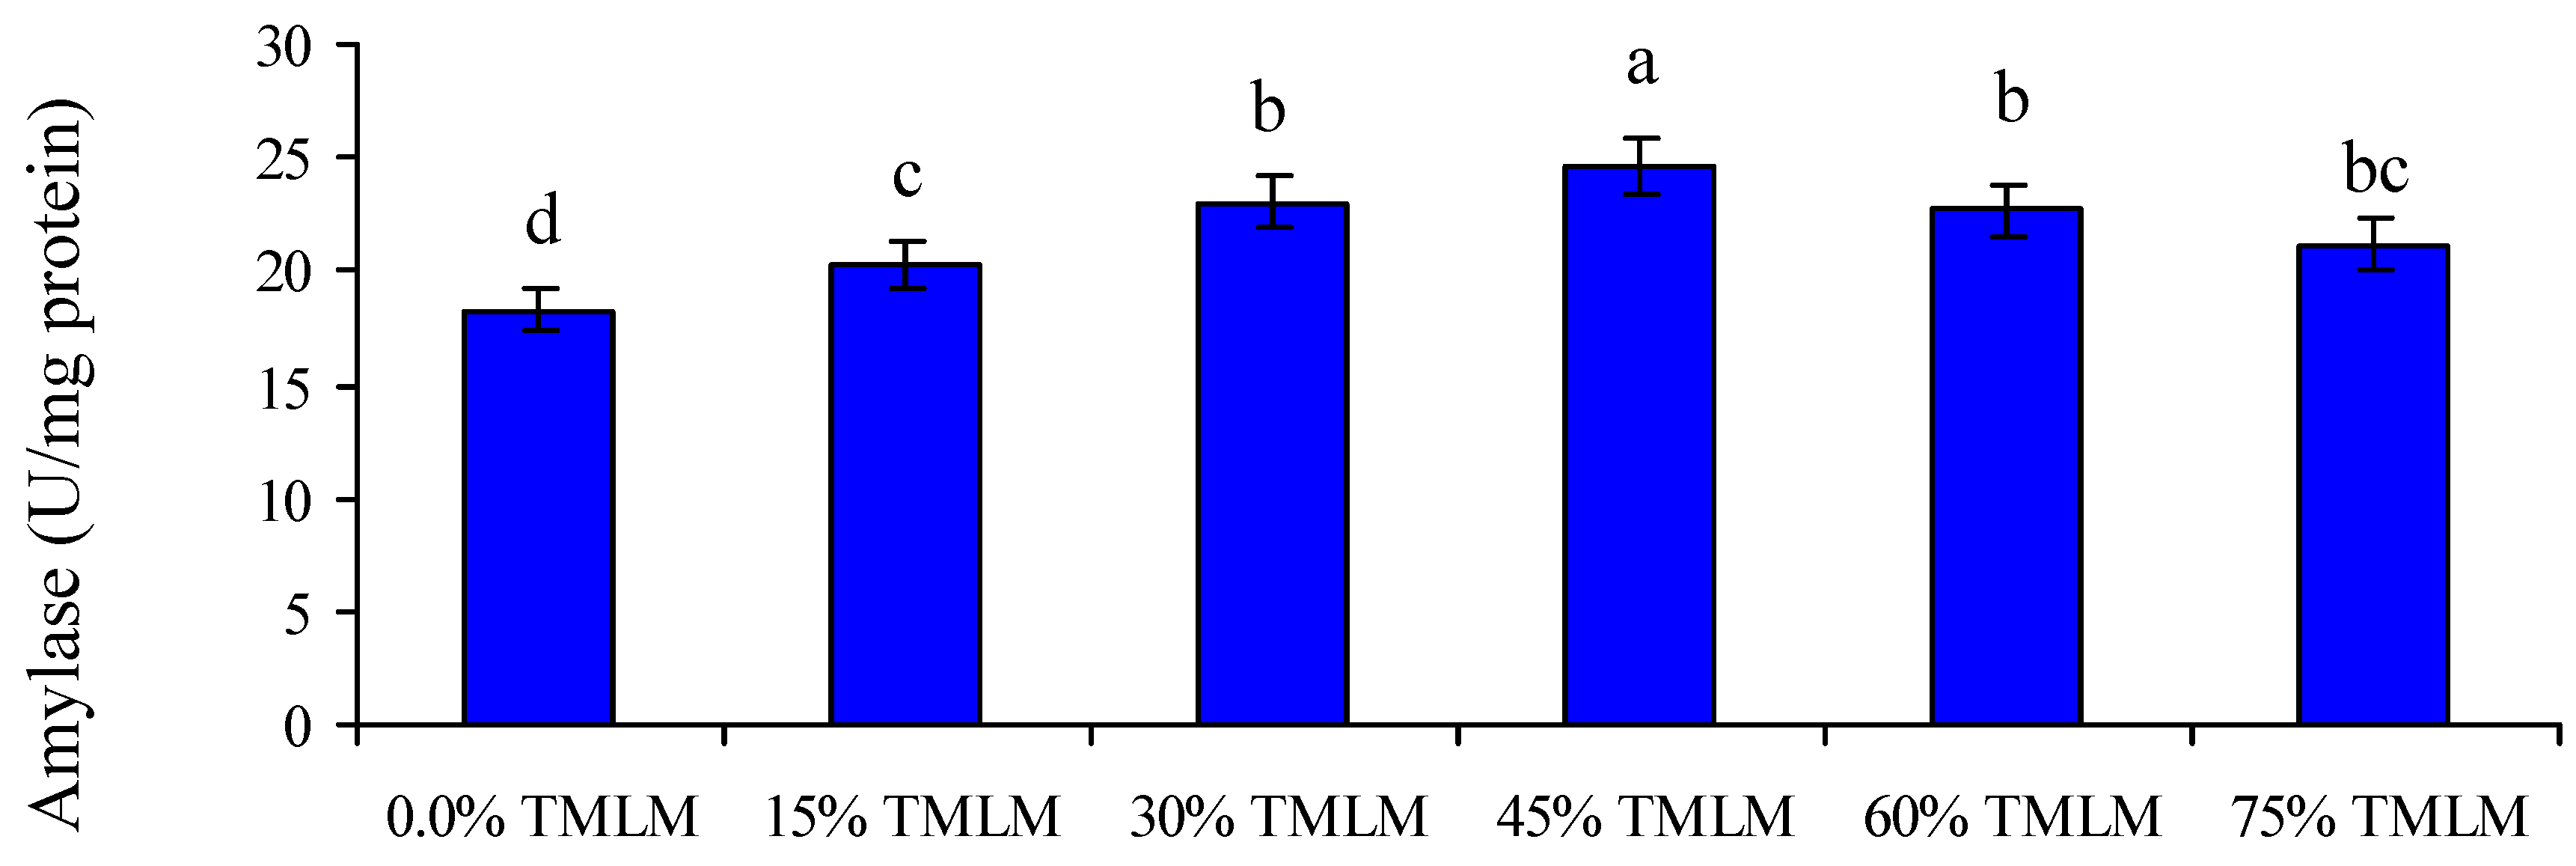
In contrast with the control group (TMLM0), the intestinal lipase, alpha-amylase, and proteases values were significantly (p < 0.05) elevated with further inclusion of TMLM up to 45%, after which enzyme activities were decreased (Figure 1). The minimum enzyme values were recorded in the control group (TMLM0).

3.4. Hematological Parameters

The inclusion of TMLM instead of FM up to 45% significantly enhanced RBC, Hb, and Hct levels by up to 45%, making them the highest over other TMLM treatments; meanwhile, their minimum levels were in the control group (Table 5). There were no marked alterations in MCV, MCH, and MCHC indices due to the inclusion of TMLM instead of FM (Table 5).

3.5. Blood Biochemical Parameters

The concentration of total protein, albumin, and globulins were significantly (p < 0.05) increased with further inclusion of TMLM up to 45% (6.02, 3.42, and 2.60 mg/dL, respectively), which showed their highest values compared with other TMLM groups (Table 6). Contrarily, no changes (p > 0.05) were noted in glucose values among TMLM treatments. T-CHOL, TG, ALT, and AST concentrations considerably (p < 0.05) declined as TMLM levels increased in fish feeds up to 45%; afterward, their values declined in TMLM60 and TMLM75 with no substantial (p > 0.05) changes among both of them (Table 6).

3.6. Antioxidant and Immune Indices

In contrast with the control (TMLM0) treatment, MDA contents in the TMLM-fed fish treatments were significantly (p < 0.05) reduced up to TMLM60 and TMLM75 with no substantial (p > 0.05) changes amongst them (Table 7). The significantly (p < 0.05) highest MDA level was in the control (TMLM0) group. Conversely, SOD, CAT, and GPx values in the TMLM45 treatment were markedly (p < 0.05) improved over the control (TMLM0), which exhibited their lowest values (Table 7).
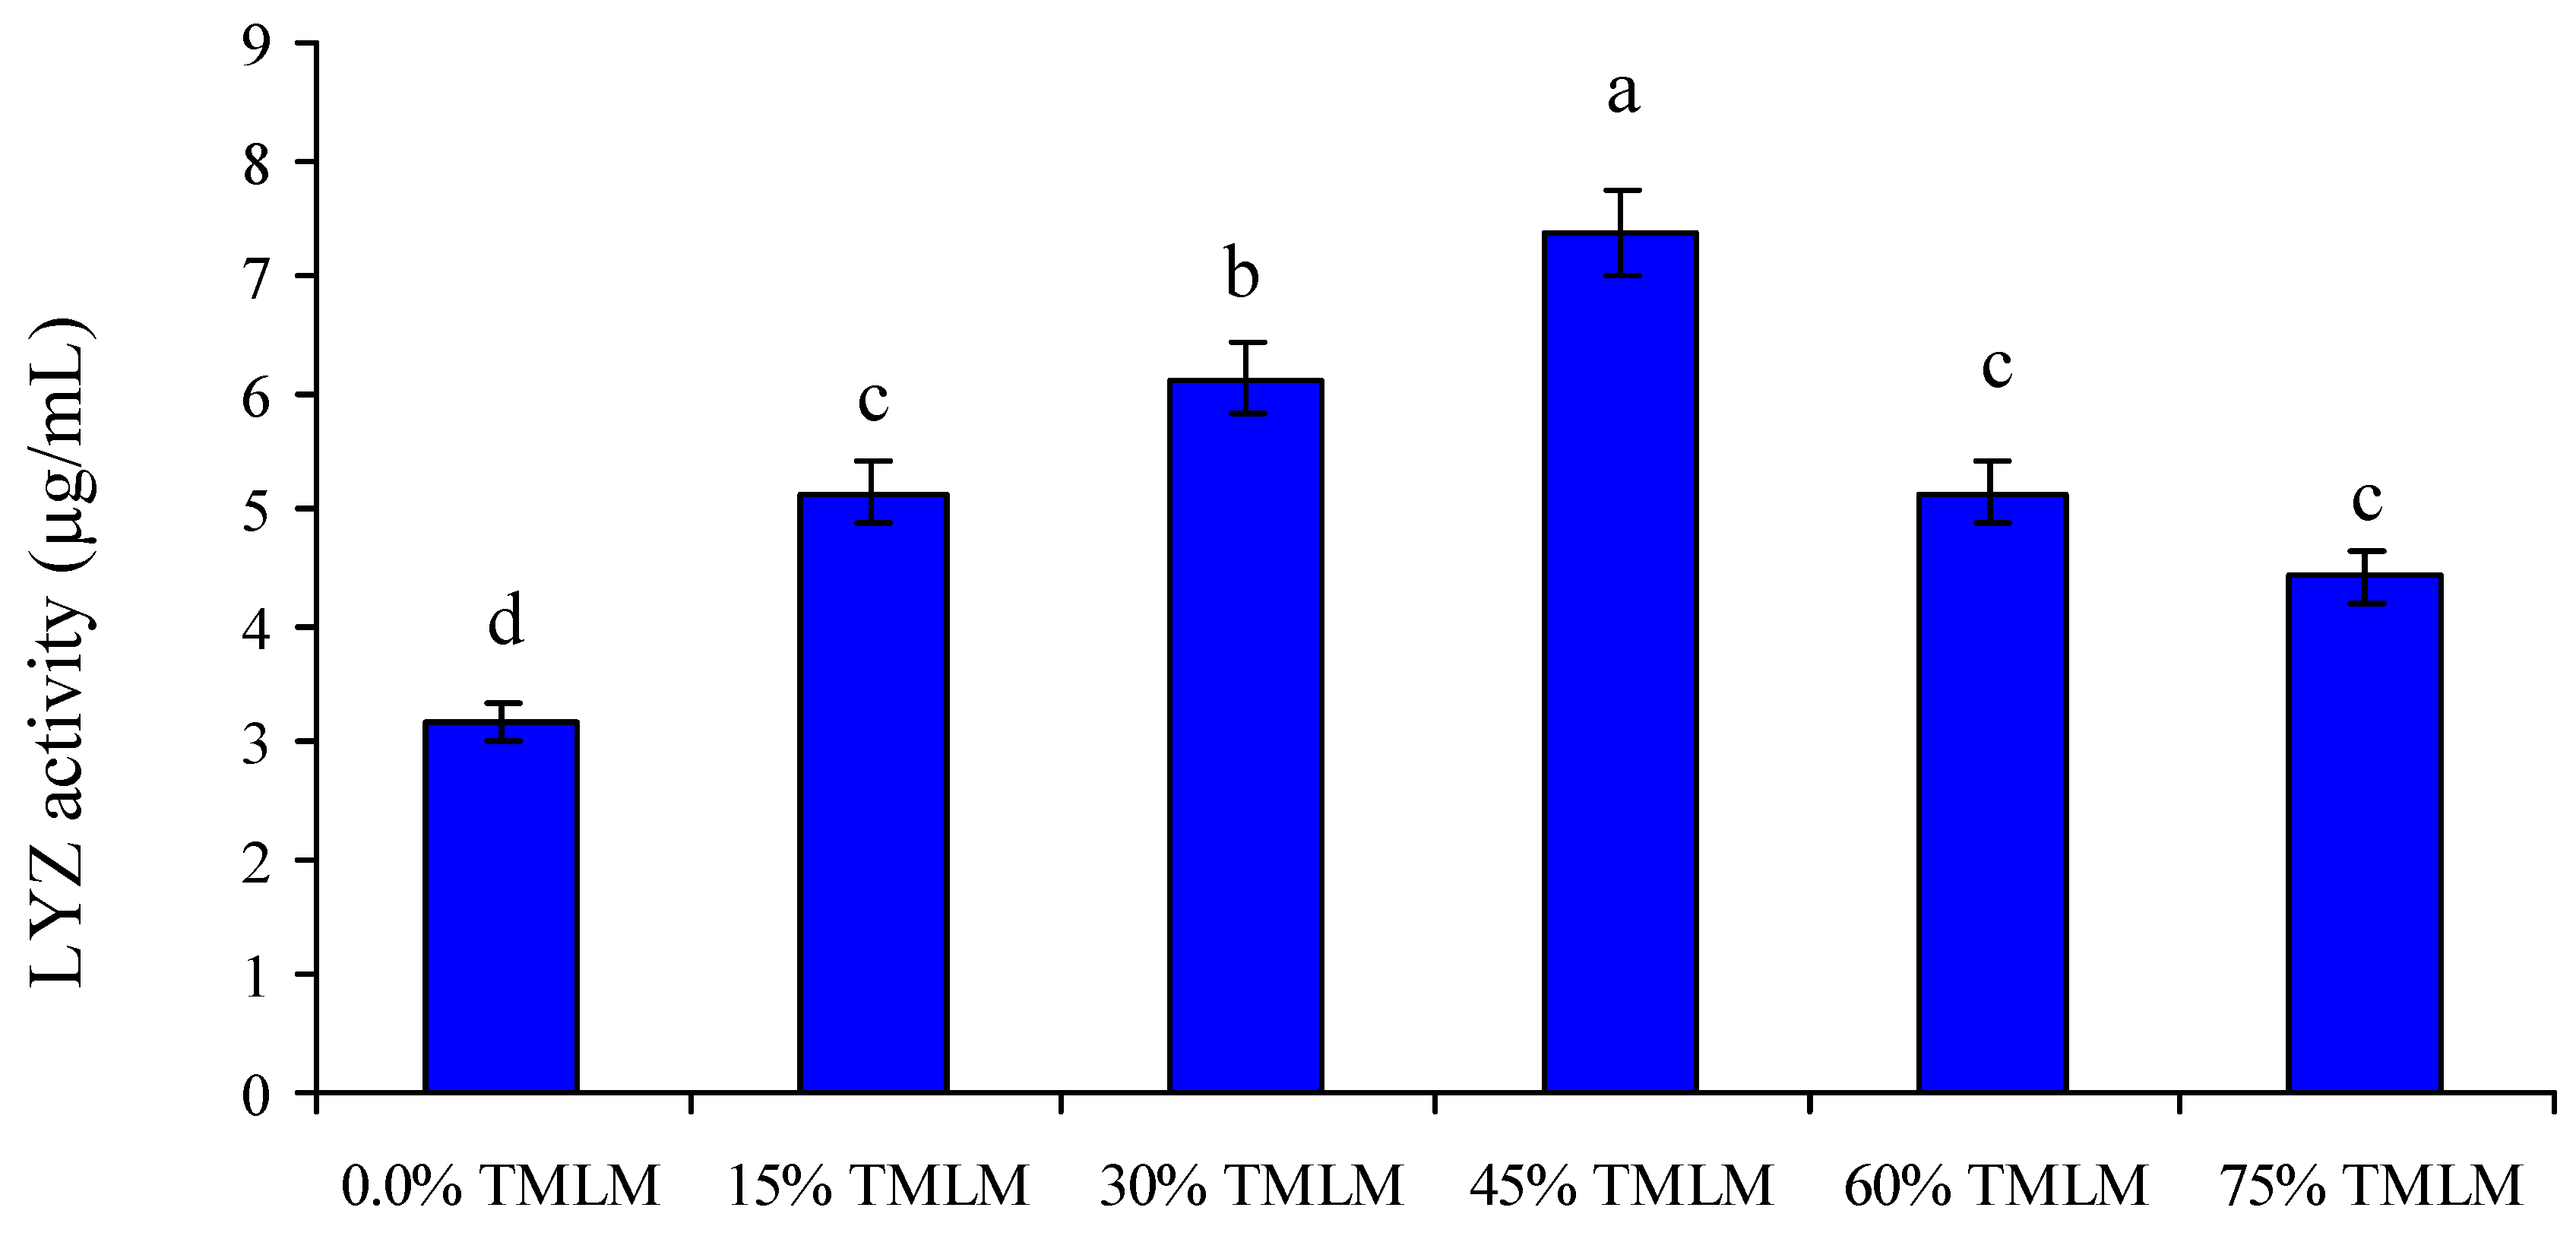
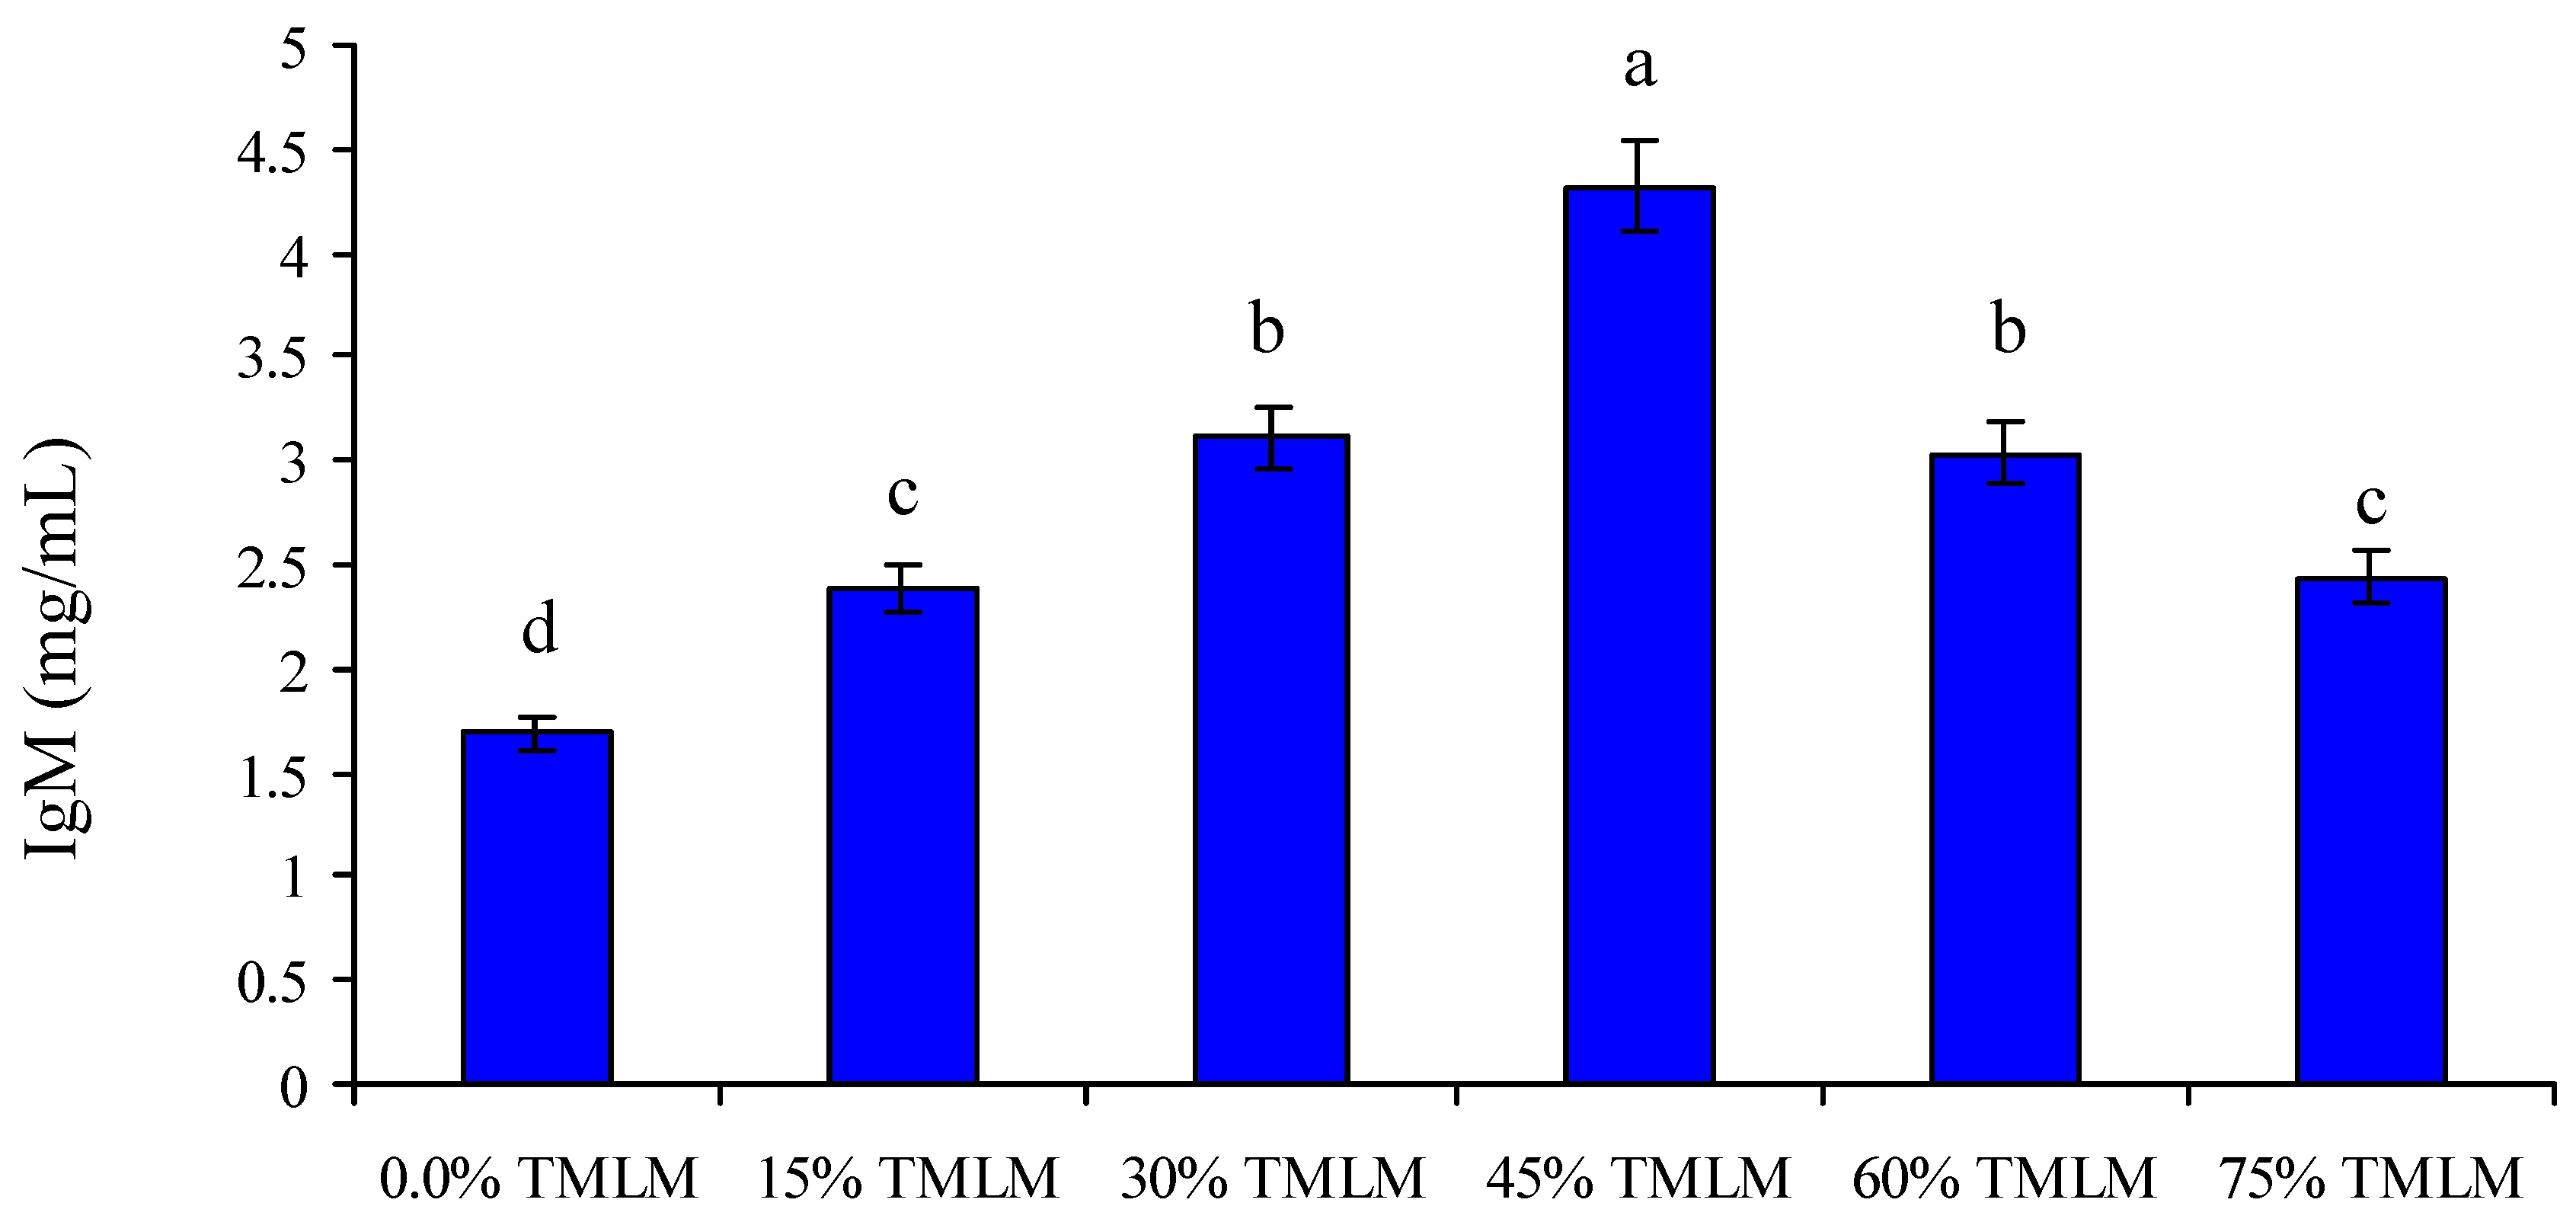
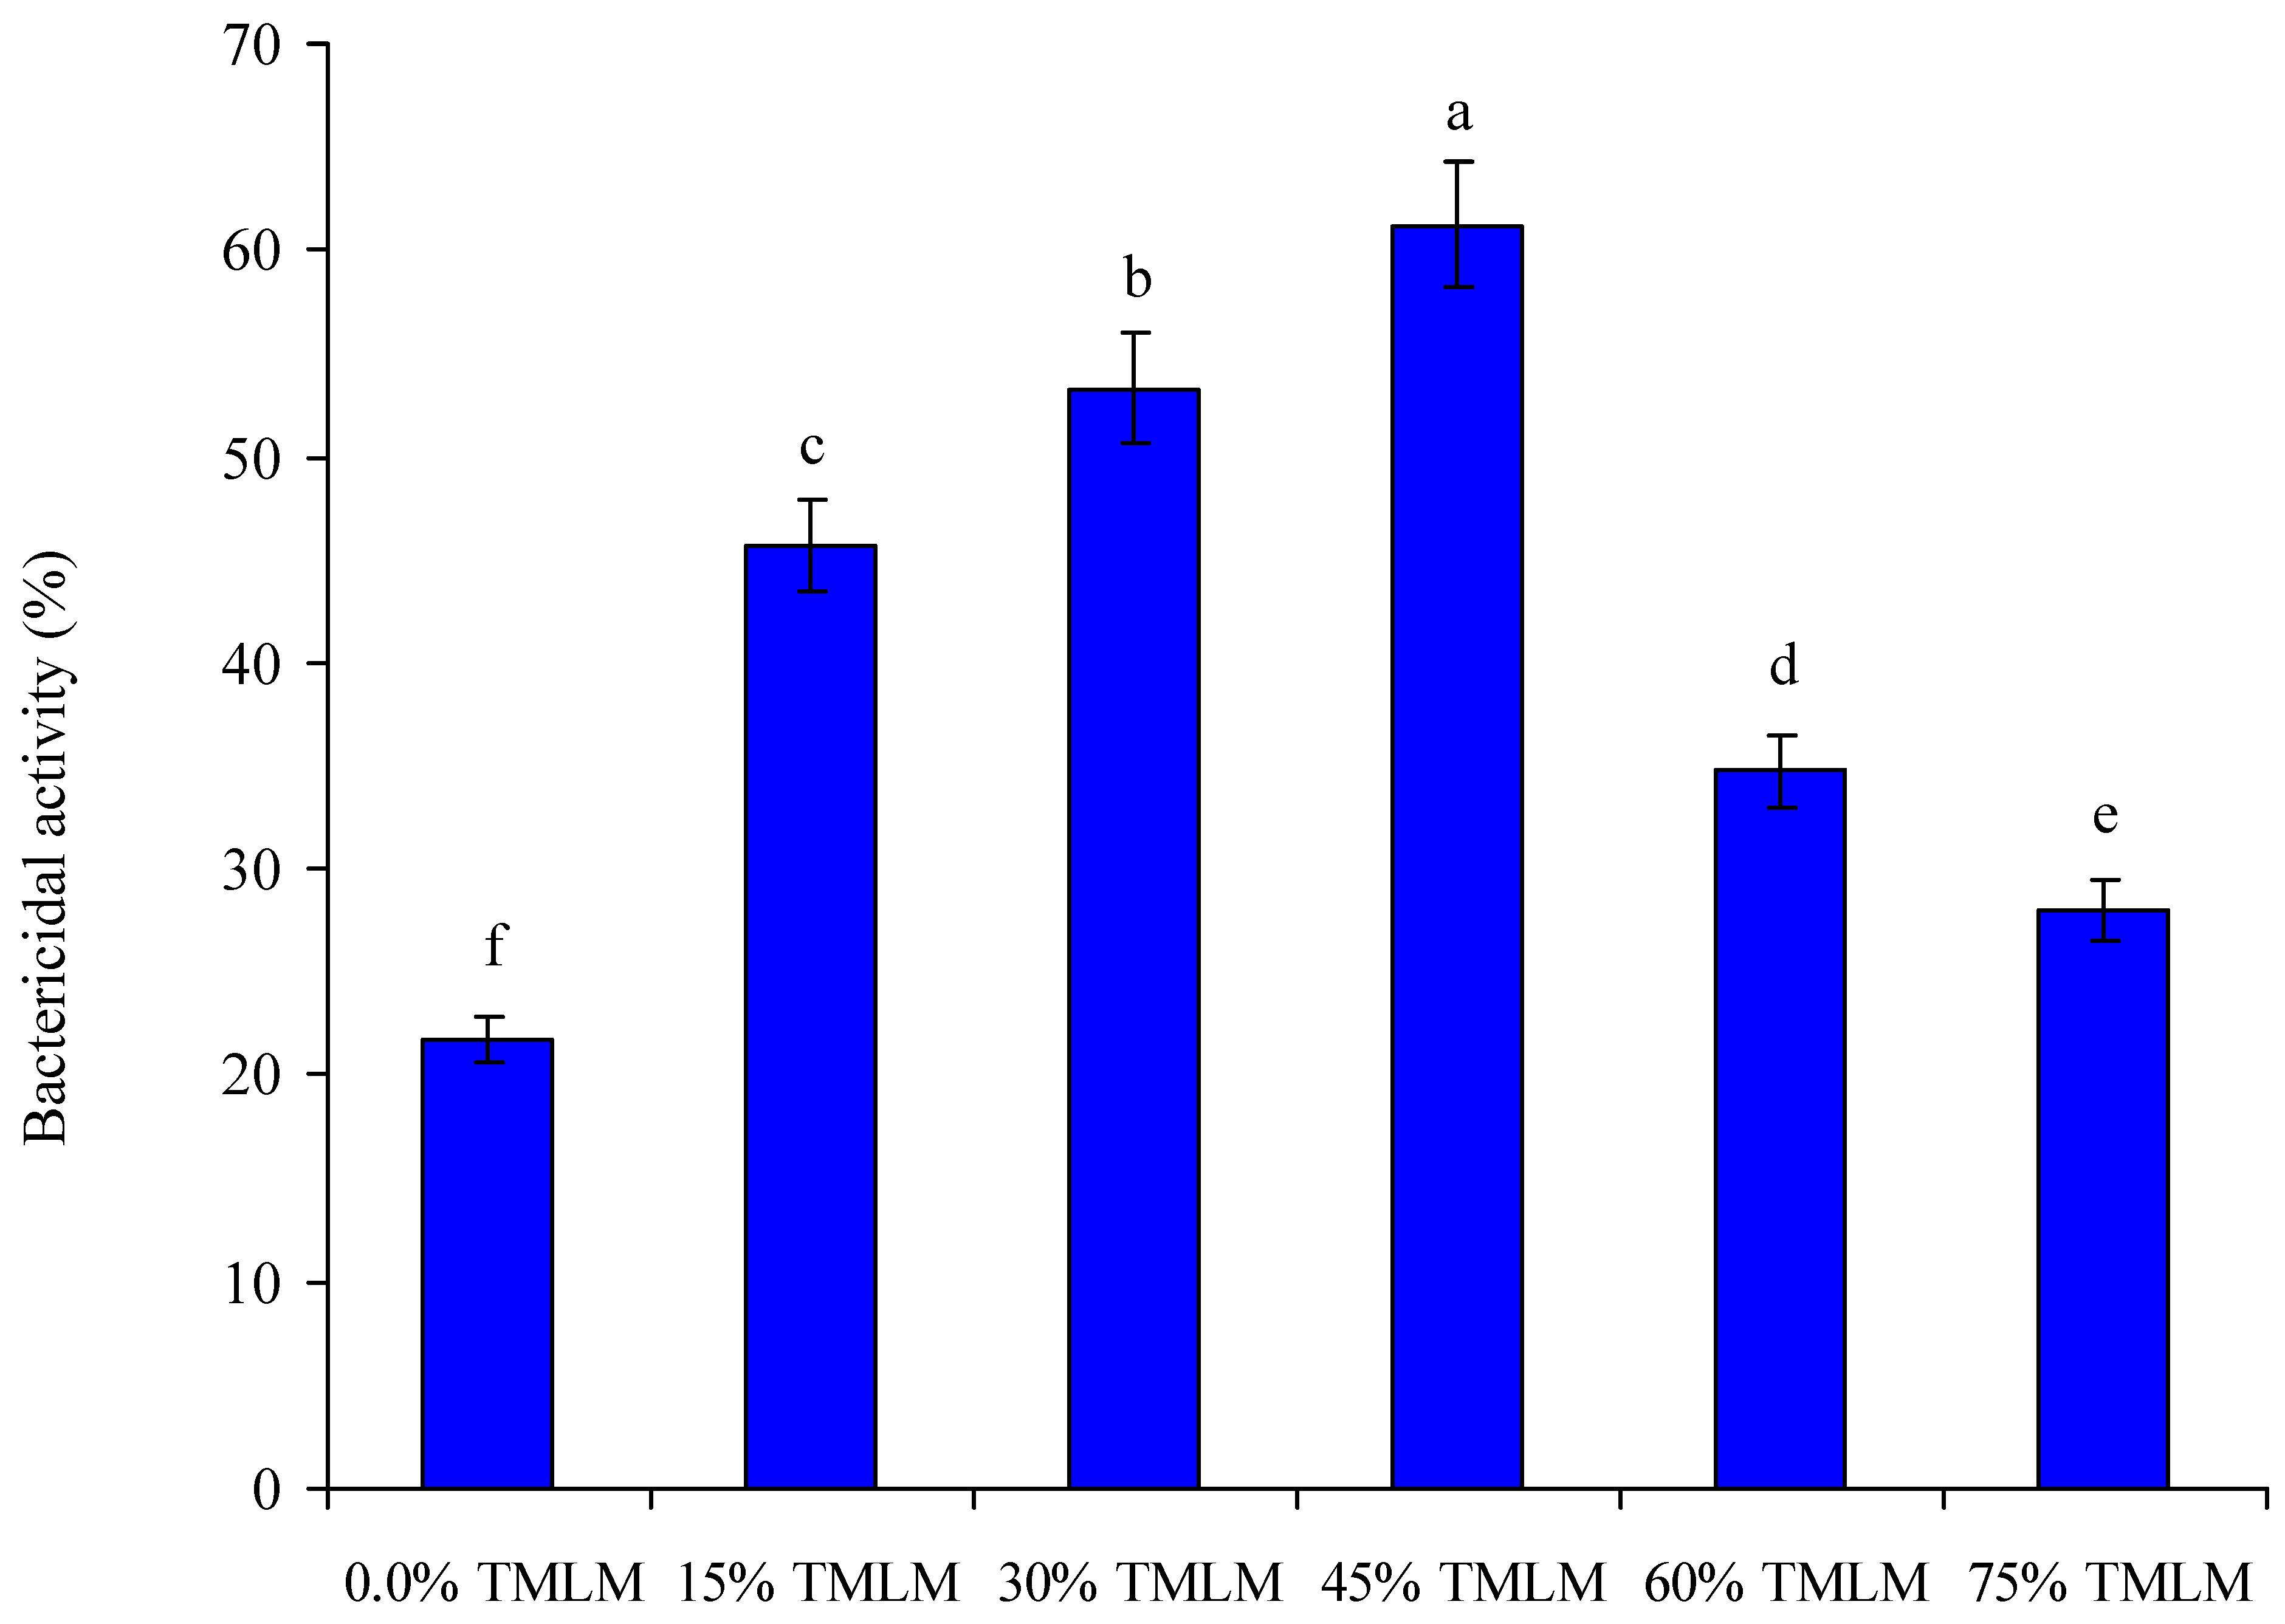
In comparison with the TMLM0 (control), the LYZ activity and IgM levels of the TMLM45 group were significantly (p < 0.05) the highest. Conversely, Nile tilapia fed on TMLM60 and TMLM75 exhibited the lowest LYZ and IgM levels with no marked (p > 0.05) changes between either of them (Figure 2 and Figure 3). In a similar trend, feeding Nile tilapia juveniles on gradual increases in TMLM levels up to 45% significantly (p < 0.05) enhanced the serum bactericidal activity against A. sorbia (Figure 4). The fish fed on the TMLM0 (control) group displayed the worst bactericidal activity (Figure 4).

3.7. Intestine Histology

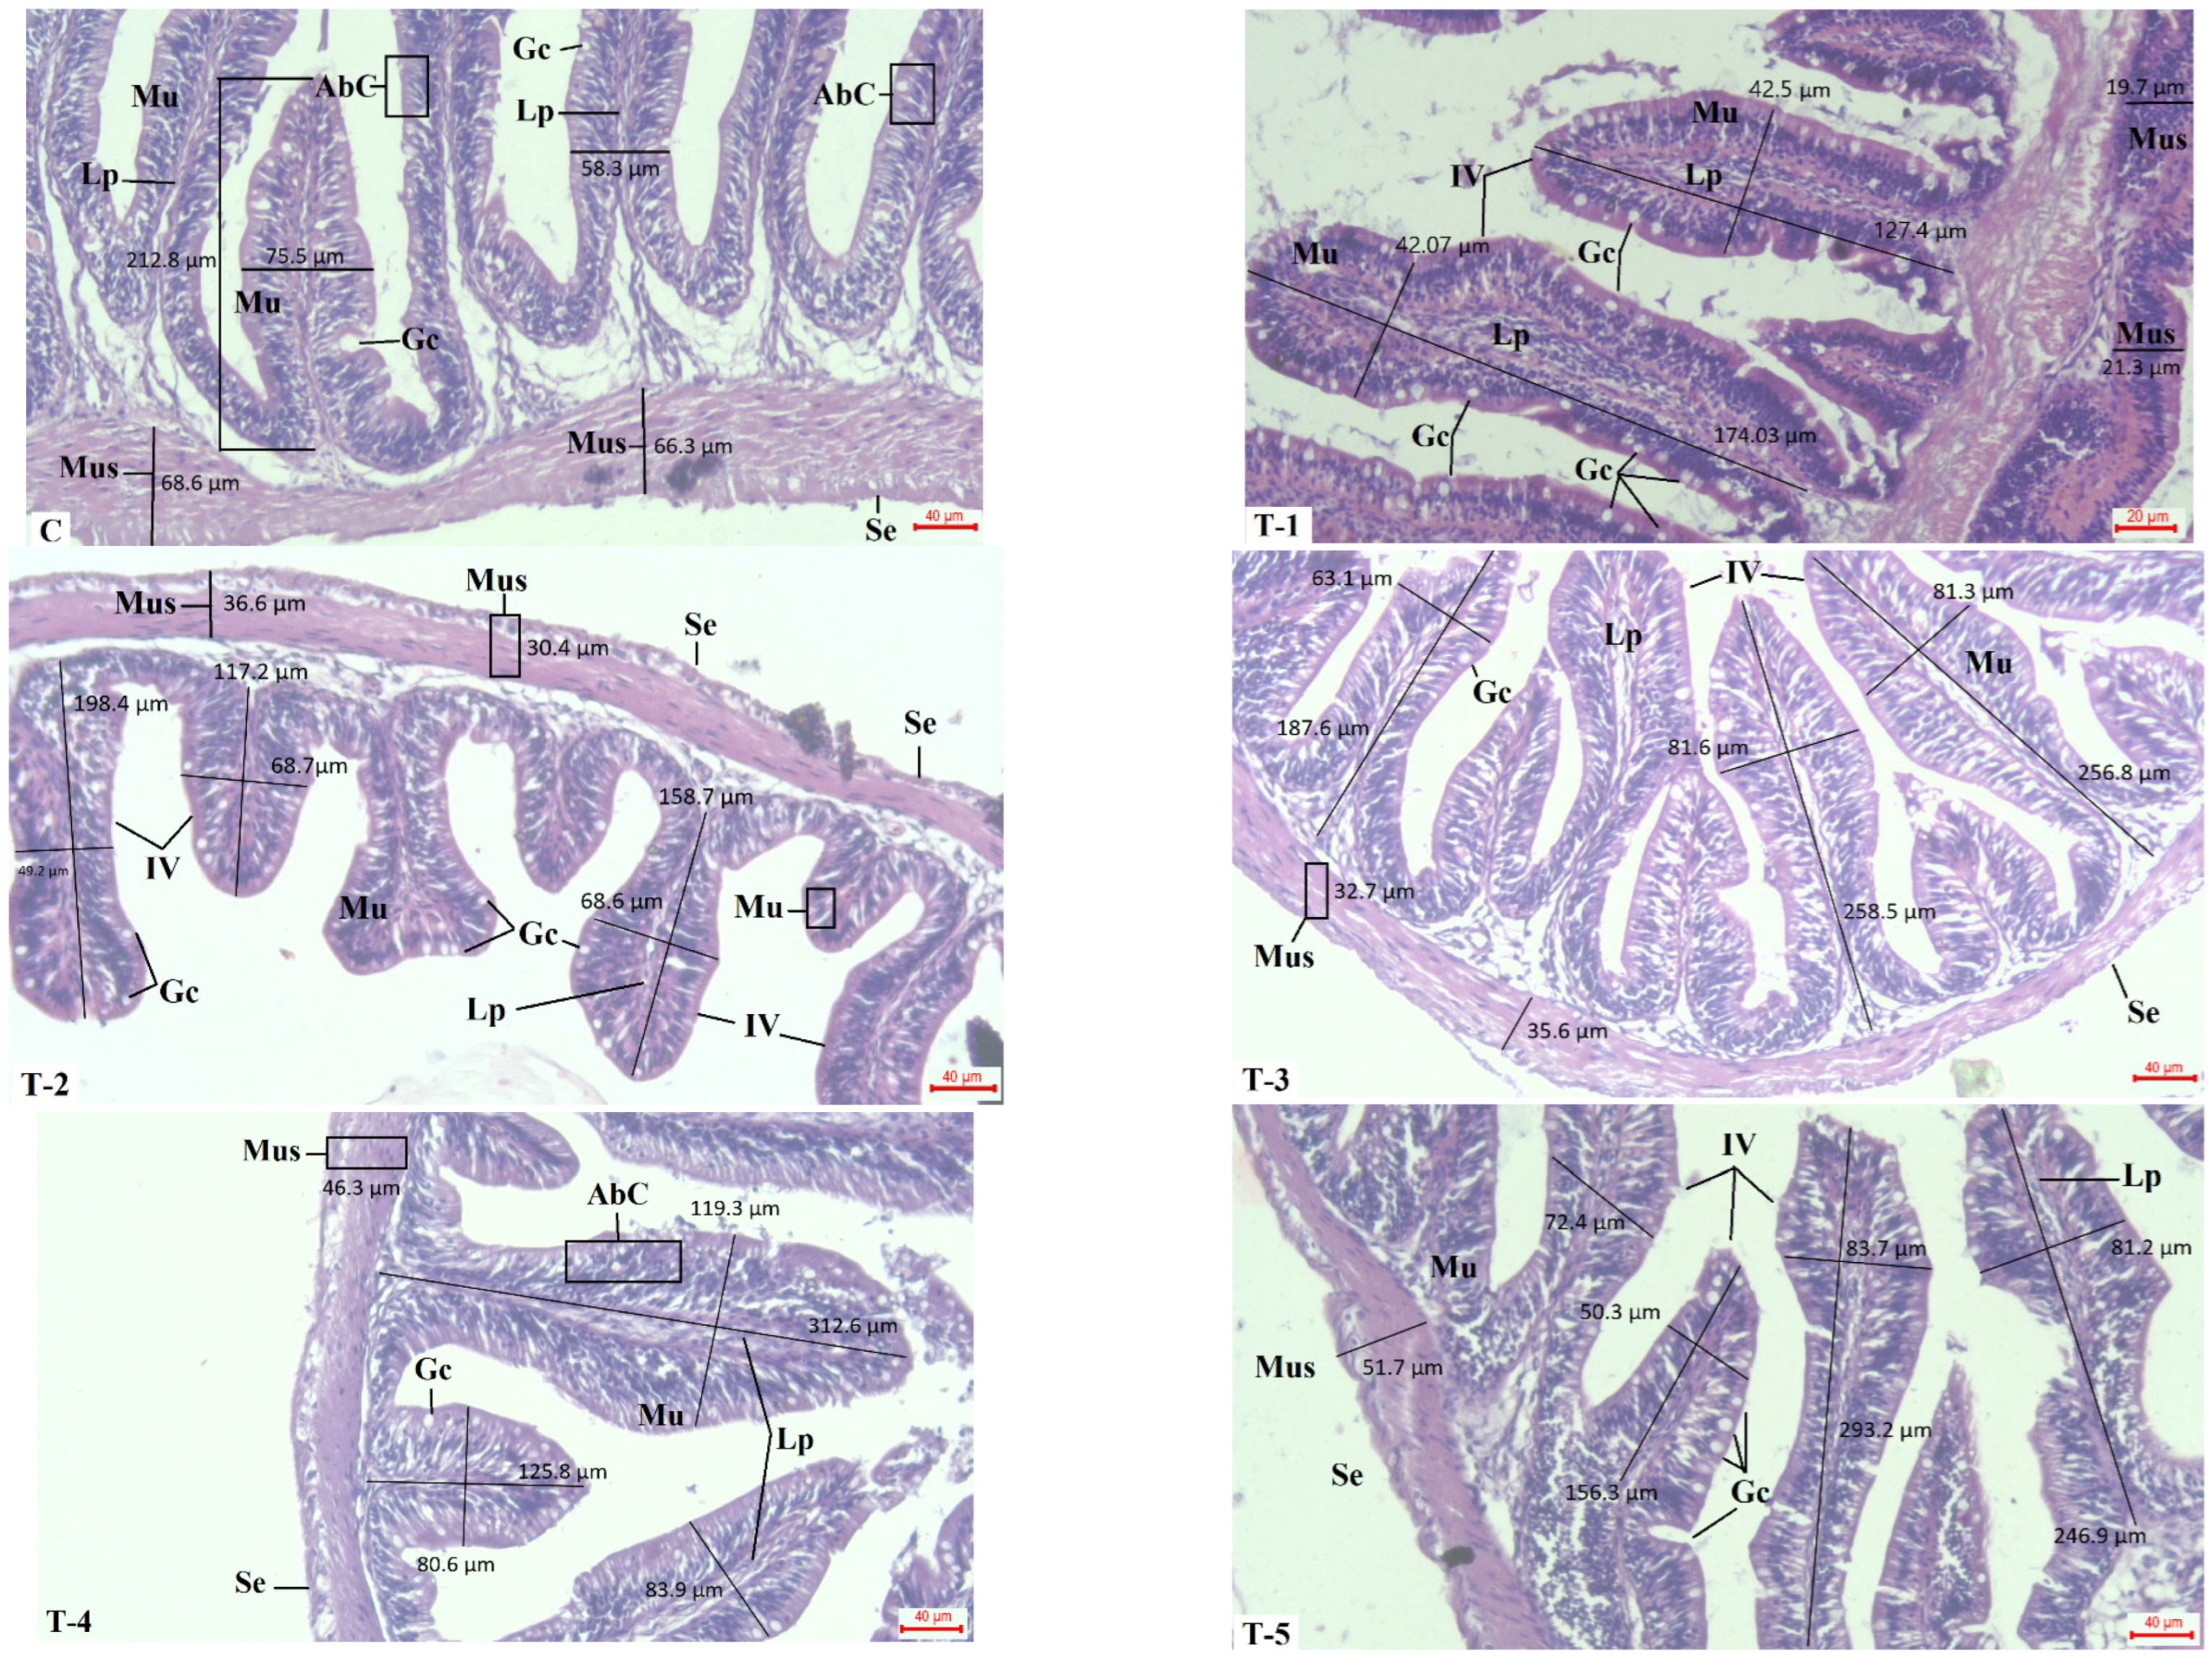
Figure 5 shows that in the midgut of fish fed on TMLM15, TMLM30, and TMLM45 diets had significantly (p < 0.05) higher intestinal fold lengths than the TMLM60 and TMLM75 groups, which had much thinner muscles. Goblet cell counts were positively affected by TMLM levels in diets, and this effect was reversed when the replacement level of TMLM exceeded 45% (Figure 5).

3.8. Liver Histology

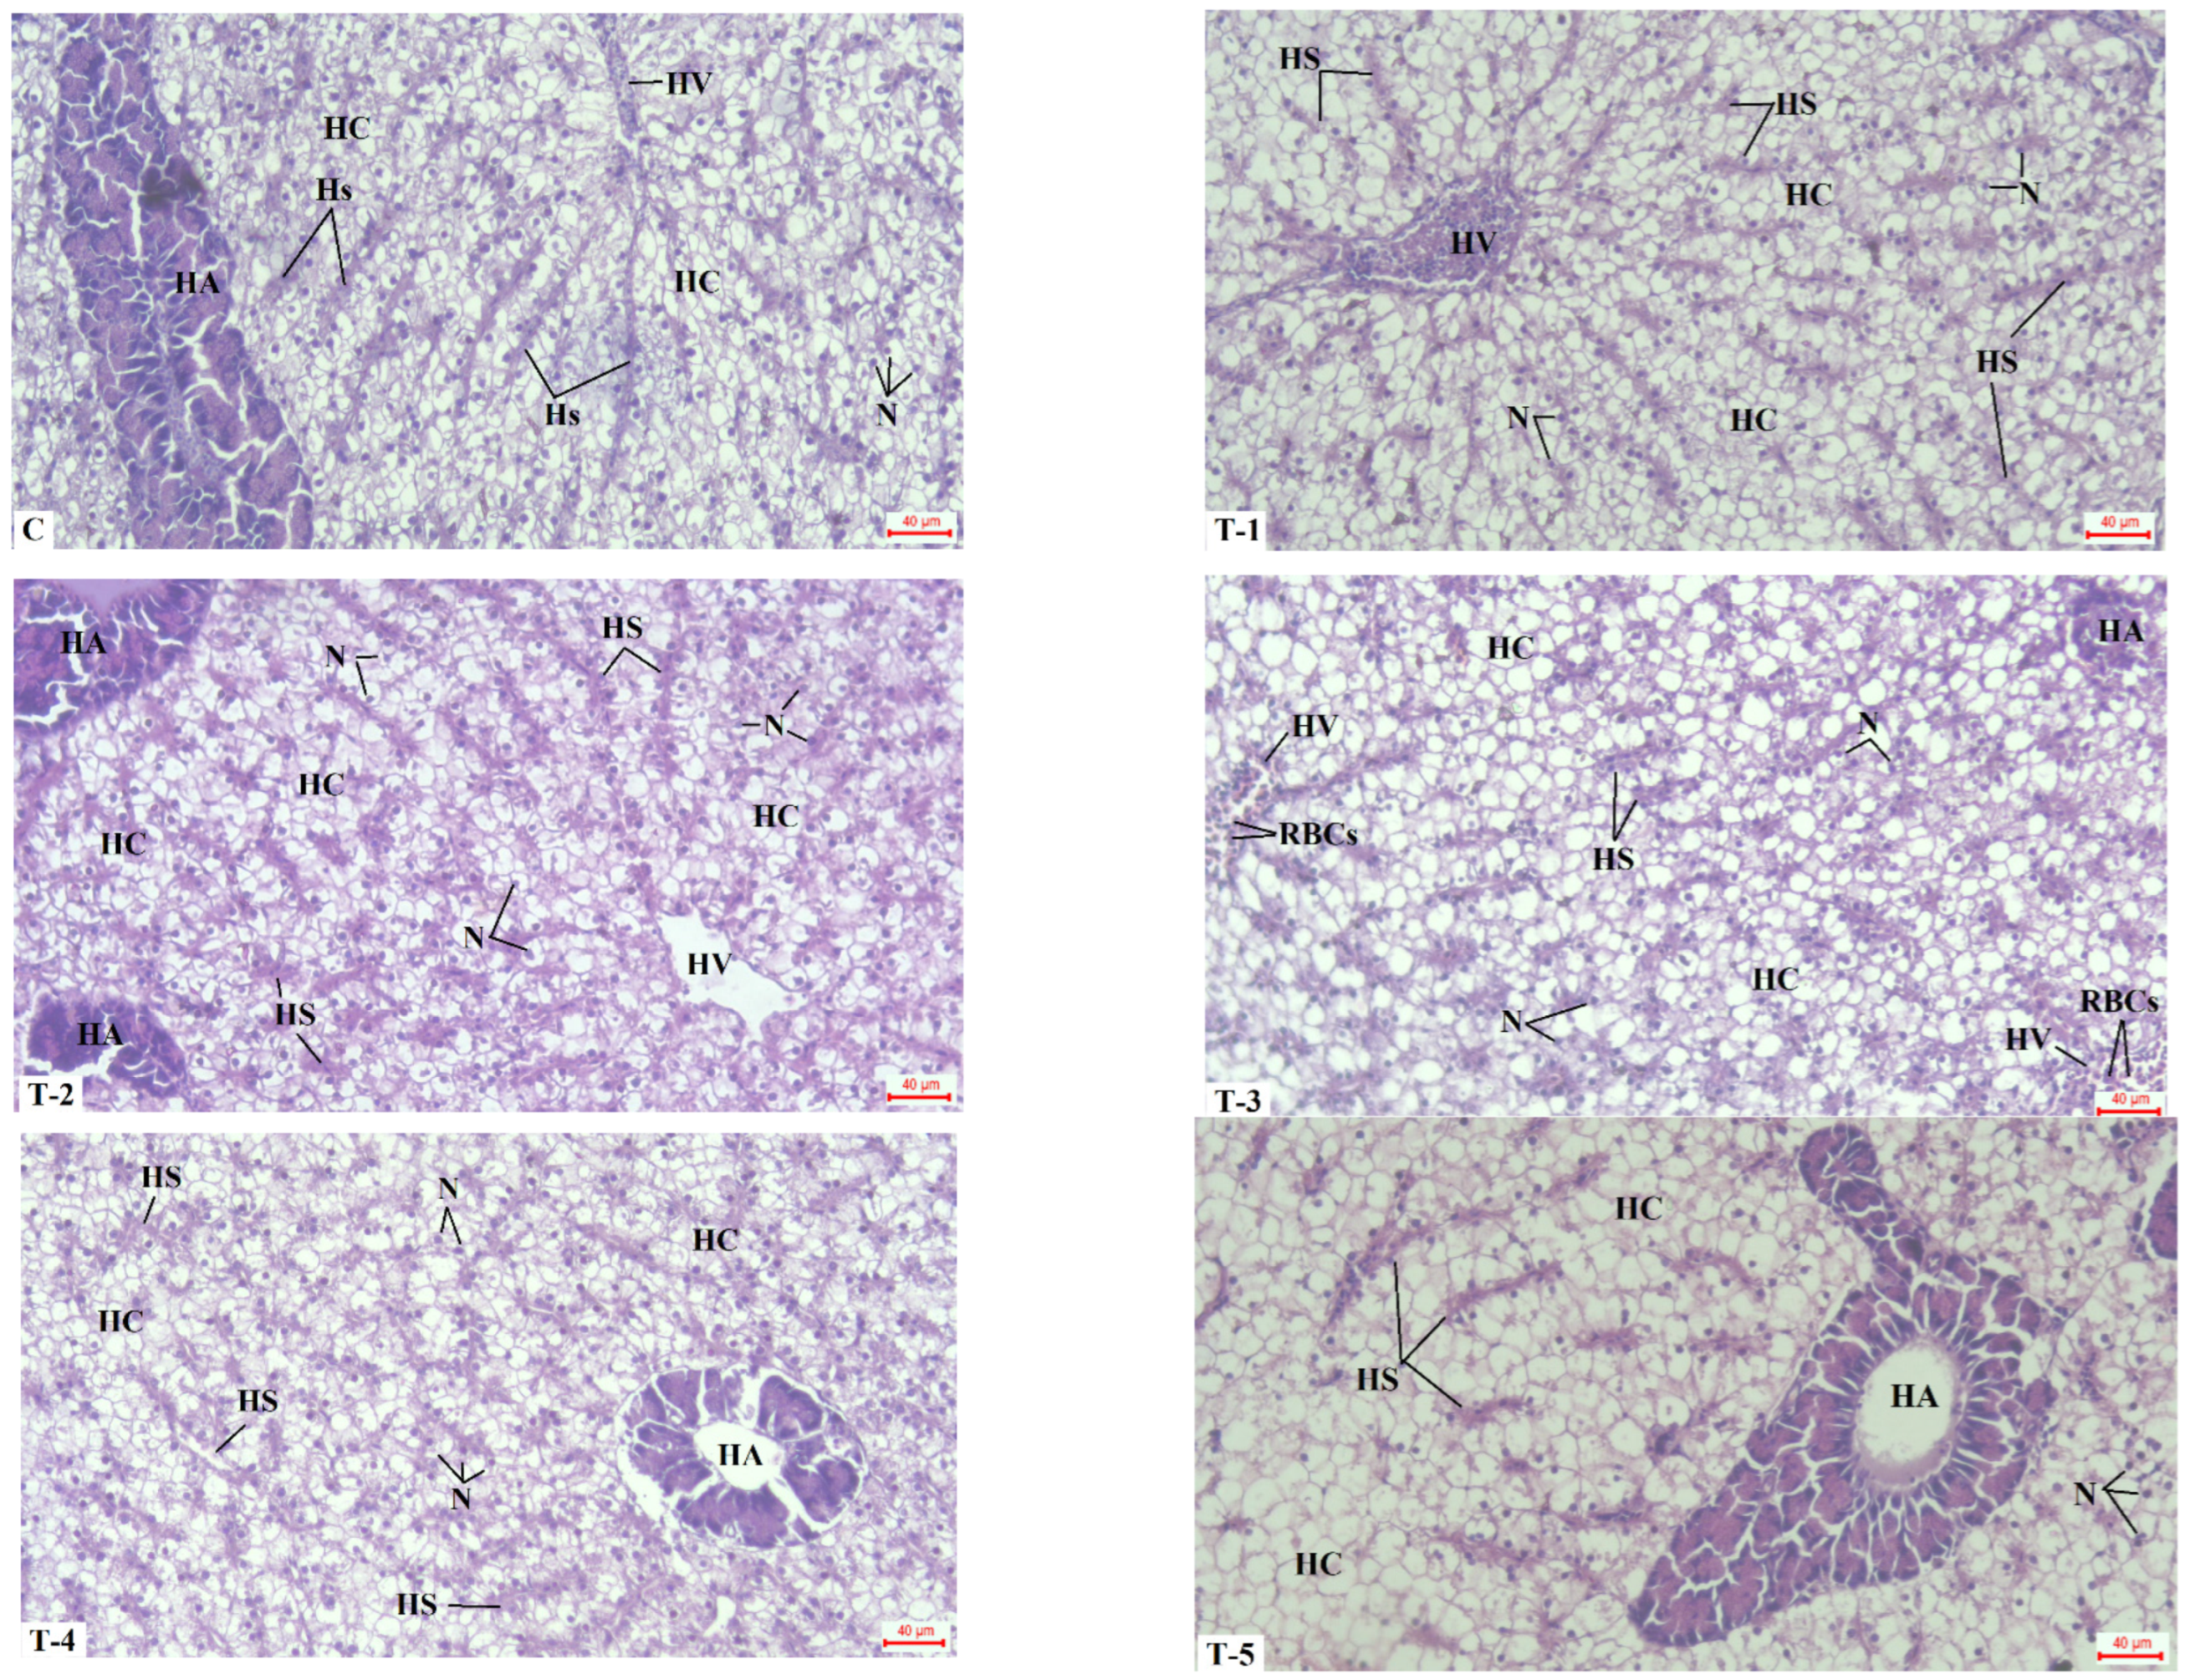
According to the findings shown in Figure 6, a typical liver biopsy would reveal typical polyhydric hepatocytes (HCs) structured into a cord-like form, with the hepatic sinusoid (HS) branching off bigger blood vessels to create a hepatic vein (HV), and proper distributing hepatopancreatic acini (HA) as well. Hepatocytes of fish fed on TMLM60 and TMLM75 showed vacillations due to high accumulation of fat (dissolved by the lipid solvents used in histology processing) within their cytoplasm and displacement of nuclei (Figure 6). This illustrates more vacuolated hepatocytes and fewer hepatic sinusoids.

4. Discussion

The current study revealed that TMLM protein could replace FM protein by up to 45%, which improved the growth indices of Nile tilapia juvenile in comparison to other TMLM-fed fish groups. These findings may be related to the significant improvements in feed consumption, digestive enzyme secretion, and intestinal structure and morphometry, especially in fish fed on TMLM45. Fish growth is generally closely related to the digestive system’s ability to break down and assimilate nutrients, which is influenced by the activities of digestive enzymes, the absorption area of the gut, and the structural integrity of the digestive tract [52,53,54,55]. In a related study, Dernekbaşi and Karayücel [19] fed Nile tilapia fry (0.12 ± 0.001 g) on feeds where FM was substituted with 0.0 (the control diet), 50%, and 100% of TMLM for 46 days. They reported that the control group exhibited the peak growth rates and protein efficiency. Soares et al. [23] fed O. niloticus juveniles on 0%, 6.5%, 13%, 19.5%, and 26% TMLM. They discovered that adding TMLM to fish diets up to 26% did not negatively affect fish growth. Costa et al. [56] carried out a 75-day study in which European seabass (Dicentrarchus labrax L.) were fed with diets that included an insect meal (IM) mixture of yellow mealworm meal (YMM) and black soldier fly larvae (BSFL) in place of 3%, 25%, and 50% of the FM protein. In contrast to the control group, fish fed IM50 showed longer villi, which they attributed to the anterior intestine’s integrity remaining intact. Hossain et al. [57] fed rainbow trout, Oncorhynchus mykiss, on diets where FM was substituted with defatted TMLM at a rate of 0 (the control), 25%, 50%, 75%, and 100%. They observed no significant (p > 0.05) changes in fish performance and feed efficiency among TMLM groups. These conflicting results could be linked to the nutritive value of yellow mealworm meal, fish species, fish size, feeding habits, and feeding period, among others.
Fish fed with TMLM60 and TMLM75, on the other hand, displayed retarded growth. This may be linked to their deficiencies in certain essential amino acids, particularly arginine, isoleucine, lysine, methionine, phenylalanine, and valine, which did not satisfy the requirements of Nile tilapia causing this growth retardation. Fish in both treatments also secreted fewer digestive enzymes and consumed less feed than fish in other TMLM treatments. The fish fed with TMLM60 and TMLM75 also showed noticeable reduction in intestinal folds, muscle thickness, and goblet cell count. These outcomes are in line with those found in fish fed on diets containing 60–75% YMM substitution levels [58]. Yang et al. [59] discovered that alpha-amylase and lipase activities were reduced when 100% FM was substituted by YMM.
The body composition of Nile tilapia juveniles, including moisture, crude protein, ether extract, and ash levels, did not significantly (p > 0.05) change when TMLM was added to fish diets. These outcomes align with those of Gasco et al. [60], who also found that body composition of European sea bass was unaffected by TMLM feeds. On the other hand, feeding rainbow trout with the highest level of defatted TMLM had significantly (p < 0.05) higher body energy and lipid concentrations than the control group [57]. Yang et al. [59] found that while total lipid contents dropped in YMM-fed grass carp compared to the control group, crude protein and moisture contents were significantly (p < 0.05) higher. The observed changes in lipid and protein composition in fish bodies is generally caused by changes in muscle growth rate, fish growth rate, and protein and lipid synthesis/catabolism [61].
The findings of the current study demonstrated that Nile tilapia fed on TMLM had significantly (p < 0.05) higher levels of Hb, Hct, and RBC compared to the control treatment. These findings are associated with the promotion of erythropoiesis and hemosynthesis, suggesting an improvement in fish health. On the other hand, notable (p < 0.05) declines in T-CHOL and TG concentrations were observed in fish that were given TMLM feeds compared to the control treatment. These outcomes indicate that TMLM may have a regulatory influence on the activity of enzymes associated with lipid homeostasis, resulting in a decrease in T-CHOL and TG concentrations. Blood glucose is the primary energy source for fish, and it is utilized alongside cortisol as a bioindicator of stress. In the present investigation, it was detected that the blood glucose levels across all TMLM-fed groups exhibited no significant (p > 0.05) differences. This suggests that fish were fed TMLM diets experience normal feeding conditions without any stress. In similar research, Sharifinia et al. [62] reported that the concentrations of T-CHOL, TG, and glucose exhibited a declining pattern as the substitution of FM with MTLM increased as compared with the control groups.
The liver is the primary producer of total protein (TP), which is made up of ALB and GLOB and is a useful measure of the health of the vascular system [63]. In the current study, the concentrations of TP, ALB, and GLOB showed slow increases up to TMLM45, followed by sharp declines at TMLM60 and TMLM75 treatments with no appreciable differences between the two treatments. The results could be the consequence of ribosome formation, protein synthesis, and DNA stimulation in hepatic tissues [64]. Moreover, elevated TP, ALB, and GLO levels suggest better immune function [52,65].
Blood ALT and AST are important non-specific enzymes that can be used in clinical settings to detect nitrogen metabolism, protein assimilation, and liver dysfunction [63]. Blood ALT and AST levels significantly decreased, in the current study, when FM protein was substituted with TMLM meal, especially at TMLM60 and TMLM75. This suggests that liver conditions were negatively impacted by elevated TMLM levels. Furthermore, the histopathological examination of the liver tissues in the current research revealed vacuolization as a result of the high fat accumulation in the liver tissues when fish were fed on TMLM60 and TMLM75 because of the high lipid contents of TMLM. Prior research by Xu et al. [66] found that when common carp, Cyprinus carpio var. communis, fingerlings were fed on defatted silkworm pupa (Bombyx mori L.) used as an FM substitute, blood ALT levels were found to be significantly (p < 0.05) lower than those of the control treatment. Conversely, Abdel-Tawwab et al. [52] found no discernible (p > 0.05) variations in the serum levels of AST and ALT in European sea bass fed on BSFLM. Zhou et al. [67] replaced the FM in diets for a Jian carp (C. carpio var. Jian) by 0, 35, 70, 105, and 140 g/kg diet of BSFLM for eight weeks and found that serum ALT and AST levels had no significant (p > 0.05) changes.
Since both enzymatic and non-enzymatic antioxidants have developed to protect organisms from reactive oxygen species (ROS), antioxidative and immune indices are essential techniques for evaluating fish health [68,69]. This study verified significant enhancements in antioxidant and immune biomarkers in fish fed on TMLM feeds and the control group. These findings suggest that dietary TMLM increases the antioxidant system’s capacity, protecting Nile tilapia from oxidative damage. The flavonoid and chitin components of TMLM, which are acknowledged as potential antioxidants, may be associated with the enhanced antioxidant capacity [70]. Chitin and other bioactive molecules found in insect meals may be responsible for their antioxidant-enhancing properties, as shown by Ngo and Kim [71]. Among these bioactive components is chitin [72,73], dipterose, and silkrose [74,75,76], which might have immune-stimulating properties. Similar findings from earlier researches showed that adding TMLM to fish diets increases antioxidant activity. In this regard, Sharifinia et al. [77] showed that the hepatopancreas of white-leg shrimp, L. vannamei, juveniles had significant (p < 0.05) increases in SOD, CAT, GPX, and TAC values as well as a notable decrease in MDA levels when they were fed on TMLM-enriched diets. Compared to the control group, yellow catfish fed on TMLM-enriched diets showed significantly (p < 0.05) higher plasma SOD activities and lower plasma MDA levels [78]. In European sea bass given BSFL diets, SOD, CAT, and GPx values increased along with a decrease in MDA concentration [79]. Black carp fed on maggot meal had higher levels of SOD and CAT compared with the control [80]. The serum CAT activity of Jian carp fed on diets containing defatted BSFLM showed the same pattern [81] as well as in the liver of African catfish given cricket meal [82].
According to the results of the current study, peak values of immune biomarkers (LYZ and IgM) as well as the highest serum bactericidal activity against A. soberia were seen in O. niloticus juveniles fed on the TMLM45 diet in contrast to other TMLM treatments. This may be connected to the role of chitin as well as bioactive substances such as fibrinolytic proteins and antimicrobial peptides in TMLM in the immunity regulation [8]. These findings align with those of Sharifinia et al. [62], who observed significant (p < 0.05) impacts on the immune activity of white-leg shrimp (L. vannamei) demonstrated by activities of phenol oxidase, LYZ, acid phosphatase, alkaline phosphatase, and the total quantity of hemocytes. Yang et al. [59] found that replacing 25% to 75% of SBM with YMM increased the levels of IgM and C3 in grass carp. Similar results were noted with large yellow croakers, Larimichthys crocea [83]. Yellow catfish, Pelteobagrus fulvidraco, showed improved immunity and tolerance to Edwardsiella ictaluri infection when fed on 18% TMLM, without negatively impacting its growth [78]. The inclusion of 25% TMLM into the diets of European sea bass showed anti-inflammatory and immune-stimulating effects, which may be related to the similarities between insect and parasite exoskeletons [84]. A similar study by Abdel-Latif et al. [79] found that European sea bass fed on BSFLM diets showed significantly (p < 0.05) higher respiratory burst activities, serum lysozyme levels, and phagocytic activity and index when compared to the control treatment. They also discovered that fish fed on BSFLM diets exhibited greater defense against Vibrio alginolyticus infection in comparison to the control treatment.

5. Conclusions

This study assessed the application of yellow mealworm (T. molitor) larval meal (TMLM) in aquafeeds rather than FM protein. Nile tilapia (O. niloticus) juveniles were given experimental diets containing 0%, 15%, 30%, 45%, 60%, and 75% TMLM for 90 days. Fish fed on TMLM60 and TMLM75 showed delayed growth, but fish growth was improved by replacing FM protein with up to 45% TMLM protein. In comparison to the control (FM-based) diet, the intestinal structure, histomorphometry, and digestive enzyme activities were considerably higher at this substitution rate (TMLM45). Furthermore, feeding the fish on the TMLM45 diet enhanced their immunological and antioxidant capacities. This led to the conclusion that 45% is the ideal TMLM substitution level. However, further research is required to determine how TMLM affects intestinal inflammation, gut microbiome, immune-related gene expression, and disease resistance in different fish species. Also, further research is needed to improve the utilization of TMLM up to 100% in fish diets via using defatted insect meals.

Author Contributions

Conceptualization, A.S.A.E.-N. and M.A.-T.; methodology, R.M.F., M.A.A.-Z., F.S., F.M.H. and Y.S.G.; software, M.A.-T.; validation, A.S.A.E.-N., R.M.F. and F.S.; formal analysis, M.A.-T.; investigation, A.S.A.E.-N. and A.M.E.A.; resources, Y.S.G.; data curation, M.A.-T.; writing—original draft preparation, M.A.-T.; writing—review and editing, M.A.-T.; visualization, A.M.E.A.; supervision, A.S.A.E.-N.; project administration, R.M.F.; funding acquisition, Y.S.G. All authors have read and agreed to the published version of the manuscript.

Funding

This research received no external funding.

Institutional Review Board Statement

The experimental protocol was approved by the Ethics Committee of Institutional Animal Ethics Committee (IAEC) of the Agricultural Research Centre, Giza, Egypt (ARC-CLAR-32-25). All animal experiments were performed according with the Directive 2010/63/EU. Written consent for inclusion in the study was obtained from the owners.

Data Availability Statement

All data are available inside the manuscript.

Conflicts of Interest

The authors declare no conflicts of interest.

References

  1. Glencross, B.; Ling, X.; Gatlin, D.; Kaushik, S.; Øverland, M.; Newton, R.; Valente, L.M.P. A SWOT analysis of the use of marine, grain, terrestrial-animal and novel protein ingredients in aquaculture feeds. Rev. Fish. Sci. Aquac. 2024, 32, 396–434. [Google Scholar] [CrossRef]
  2. FAO. The State of World Fisheries and Aquaculture 2024—Blue Transformation in Action; FAO: Rome, Italy, 2024. [CrossRef]
  3. Turchini, G.M.; Trushenski, J.T.; Glencross, B.D. Thoughts for the future of aquaculture nutrition: Realigning perspectives to reflect contemporary issues related to judicious use of marine resources in aquafeeds. N. Am. J. Aquac. 2019, 81, 13–39. [Google Scholar] [CrossRef]
  4. Tacon, A.G.J.; Metian, M.; McNevin, A.A. Future feeds: Suggested guidelines for sustainable development. Rev. Fish. Sci. Aquac. 2022, 30, 135–142. [Google Scholar] [CrossRef]
  5. Tacon, A.G.J.; Metian, M. Food matters: Fish, income, and food supply a comparative analysis. Rev. Fish. Sci. Aquac. 2018, 26, 15–28. [Google Scholar] [CrossRef]
  6. Henry, M.; Gasco, L.; Piccolo, G.; Fountoulaki, E. Review on the use of insects in the diet of farmed fish: Past and future. Anim. Feed Sci. Technol. 2015, 203, 1–22. [Google Scholar] [CrossRef]
  7. Nogales-Mérida, S.; Gobbi, P.; Józefiak, D.; Mazurkiewicz, J.; Dudek, K.; Rawski, M.; Kierończyk, B.; Józefiak, A. Insect meals in fish nutrition. Rev. Aquac. 2019, 11, 1080–1103. [Google Scholar] [CrossRef]
  8. Shafique, L.; Abdel-Latif, H.M.R.; Hassan, F.-u.; Alagawany, M.; Naiel, M.A.E.; Dawood, M.A.O.; Yilmaz, S.; Liu, Q. The feasibility of using yellow mealworms (Tenebrio molitor): Towards a sustainable aquafeed industry. Animals 2021, 11, 811. [Google Scholar] [CrossRef] [PubMed]
  9. Boonthong, S.; Nuntapong, N.; Hahor, W.; Waeowannajit, S.; Thongprajukaew, K. Mealworm (Tenebrio molitor) feed substrate waste: An alternative protein source for aquafeed production. J. Insects Food Feed 2025, 11, 2159–2173. [Google Scholar] [CrossRef]
  10. Khan, M.S.; Parveen, M.; Saleem, A.; Bibi, A.; Sadaf, N.; Yousaf, H.K.; Kabir, M. Mealworms (Tenebrio molitor L.) as a substituent of protein source for fisheries and aquaculture: A mini review: Mealworms as a substituent of protein source. MARKHOR (J. Zool.) 2025, 6, 19–25. [Google Scholar] [CrossRef]
  11. Song, S.-G.; Chi, S.-Y.; Tan, B.-P.; Liang, G.-L.; Lu, B.-Q.; Dong, X.-H.; Yang, Q.-H.; Liu, H.-Y.; Zhang, S. Effects of fishmeal replacement by Tenebrio molitor meal on growth performance, antioxidant enzyme activities and disease resistance of the juvenile pearl gentian grouper (Epinephelus lanceolatus male × Epinephelus fuscoguttatus female). Aquac. Res. 2018, 49, 2210–2217. [Google Scholar] [CrossRef]
  12. Fawole, F.J.; Adeoye, A.A.; Tiamiyu, L.O.; Ajala, K.I.; Obadara, S.O.; Ganiyu, I.O. Substituting fishmeal with Hermetia illucens in the diets of African catfish (Clarias gariepinus): Effects on growth, nutrient utilization, haemat-physiological response, and oxidative stress biomarker. Aquaculture 2020, 518, 734849. [Google Scholar] [CrossRef]
  13. Qu, P.; Zhang, Z.; Wu, Y.; Tian, S.; Yuan, J.; Wu, Z.; Chen, P.; Huang, D.; Pan, M.; Mai, K.; et al. Effects of dietary yellow mealworm Tenebrio molitor meal and selenium on the growth performance, digestive and absorptive enzyme activity, immune response, skin color, and muscle quality of large yellow croaker Larimichthys crocea. Aquac. Rep. 2025, 41, 102696. [Google Scholar] [CrossRef]
  14. Aliko, V.; Qirjo, M.; Sula, E.; Morina, V.; Faggio, C. Antioxidant defense system, immune response and erythron profile modulation in gold fish, Carassius auratus, after acute manganese treatment. Fish Shellfish Immunol. 2018, 76, 101–109. [Google Scholar] [CrossRef] [PubMed]
  15. El-Sayed, A.-F.M. Tilapia Culture, 2nd ed.; Academic Press: Cambridge, MA, USA, 2020. [Google Scholar] [CrossRef]
  16. El-Sayed, A.-F.M.; Fitzsimmons, K. From Africa to the world—The journey of Nile tilapia. Rev. Aquac. 2023, 15, 6–21. [Google Scholar] [CrossRef]
  17. Emam, W.; Lambert, H.; Brown, C. The welfare of farmed Nile tilapia: A review. Front. Vet. Sci. 2025, 12, 1567984. [Google Scholar] [CrossRef]
  18. Abdel-Tawwab, M. Natural food selectivity changes with weights of Nile tilapia, Oreochromis niloticus (Linnaeus), reared in fertilized earthen ponds. J. Appl. Aquac. 2011, 23, 58–66. [Google Scholar] [CrossRef]
  19. Tesfaye, A.; Fetahi, T.; Getahun, A. Food and feeding habits of juvenile and adult Nile tilapia, Oreochromis niloticus (L.) (Pisces: Cichlidae) in Lake Ziway, Ethiopia. Ethiop. J. Sci. 2020, 43, 88–96. [Google Scholar]
  20. Tesfahun, A.; Alebachew, S. Food and feeding habits of the Nile tilapia Oreochromis niloticus (Linnaeus, 1758) from Ribb reservoir, Lake Tana sub-basin, Ethiopia. Cogent Food Agric. 2023, 9, 2212457. [Google Scholar] [CrossRef]
  21. Sánchez-Muros, M.J.; de Haro, C.; Sanz, A.; Trenzado, C.E.; Villareces, S.; Barroso, F.G. Nutritional evaluation of Tenebrio molitor meal as fishmeal substitute for tilapia (Oreochromis niloticus) diet. Aquac. Nutr. 2016, 22, 943–955. [Google Scholar] [CrossRef]
  22. Dernekbaşı, S.; Karayücel, İ. The effect of Tenebrio molitor larva meal instead of fish meal on growth performance and feed efficiency in juvenile Nile tilapia (Oreochromis niloticus) diets. Turk. J. Marit. Mar. Sci. 2023, 9, 110–118. [Google Scholar] [CrossRef]
  23. Soares, L.J.F.; Ribeiro, G.O.; Freitas, D.F.; Madureira, E.R.; Aiura, F.S.; Maciel, M.P.; Nascimento, J.C.D.S.; Santos, S.H.S.; da Costa, D.V. Performance, blood and histological parameters and gene expression of lipogenic markers in tilapia (Oreochromis niloticus) fed Tenebrio molitor larvae meal. J. Insects Food Feed 2023, 10, 159–169. [Google Scholar] [CrossRef]
  24. Zhang, L.; Wu, H.-X.; Li, W.-J.; Qiao, F.; Zhang, W.-B.; Du, Z.-Y.; Zhang, M.-L. Partial replacement of soybean meal by yellow mealworm (Tenebrio molitor) meal influences the flesh quality of Nile tilapia (Oreochromis niloticus). Anim. Nutr. 2023, 12, 108–115. [Google Scholar] [CrossRef] [PubMed]
  25. Krzyżaniak, M.; Aljewicz, M.; Bordiean, A.; Stolarski, M.J. Yellow mealworm composition after convective and freeze drying—Preliminary results. Agriculture 2022, 12, 149. [Google Scholar] [CrossRef]
  26. AOAC. Official Methods of Analysis of AOAC International, 19th ed.; AOAC: Gaithersburg, MD, USA, 2012. [Google Scholar]
  27. Abdel-Tawwab, M.; Ahmad, M.H.; Khattab, Y.A.E.; Shalaby, A.M.E. Effect of dietary protein level, initial body weight, and their interaction on the growth, feed utilization, and physiological alterations of Nile tilapia, Oreochromis niloticus (L.). Aquaculture 2010, 298, 267–274. [Google Scholar] [CrossRef]
  28. NRC. National Research Council, Nutrient Requirements of Fish and Shrimp; National Academies Press: Washington, DC, USA, 2011.
  29. Vázquez-Ortiz, F.A.; Caire, G.; Higuera-Ciapara, I.; Hernández, G. High performance liquid chromatographic determination of free amino acids in shrimp. J. Liq. Chromatogr. 1995, 18, 2059–2068. [Google Scholar] [CrossRef]
  30. Basha, S.M.M.; Roberts, R.M. A simple colorimetric method for the determination of tryptophan. Anal. Biochem. 1977, 77, 378–386. [Google Scholar] [CrossRef]
  31. Santiago, C.B.; Lovell, R.T. Amino acid requirements for growth of Nile tilapia. J. Nutr. 1988, 188, 1540–1546. [Google Scholar] [CrossRef]
  32. Boyd, C.E.; Tucker, C.S. Pond Aquaculture Water Quality Management; Kluwer Academic Publishers: Boston, MA, USA, 2012. [Google Scholar]
  33. Bernfeld, P. Amylases α and β. In Methods in Enzymology; Colowick, P., Kaplan, N.O., Eds.; Academic Press: New York, NY, USA, 1951; Volume 1. [Google Scholar]
  34. Kunitz, M. Crystalline soybean trypsin inhibitor: II. General properties. J. Gen. Physiol. 1947, 30, 291–310. [Google Scholar] [CrossRef]
  35. Shihabi, Z.K.; Bishop, C. Simplified turbidimetric assay for lipase activity. Clin. Chem. 1971, 17, 1150–1153. [Google Scholar] [CrossRef]
  36. Bradford, M.M. A rapid and sensitive method for the quantitation of microgram quantities of protein utilizing the principle of protein-dye binding. Anal. Biochem. 1976, 7, 248–254. [Google Scholar] [CrossRef] [PubMed]
  37. Dacie, J.V.; Lewis, S.M. Practical Haematology, 6th ed.; Churchill Livingstone: London, UK, 1984. [Google Scholar]
  38. Doumas, B.T.; Watson, W.; Biggs, H.G. Albumin standards and the measurement of serum albumin with bromcresol green. Clin. Chim. Acta 1971, 31, 87–96. [Google Scholar] [CrossRef]
  39. Trinder, P. Determination of blood glucose using 4-amino phenazone as oxygen acceptor. J. Clin. Pathol. 1969, 22, 246. [Google Scholar] [CrossRef]
  40. Reitman, S.; Franke, L.S. A colorimetric method for the determination of serum glutamic oxaloaceitic and glutamic pyruvic transaminases. Am. J. Clin. Pathol. 1957, 28, 56–63. [Google Scholar] [CrossRef] [PubMed]
  41. Allain, C.C.; Poon, L.S.; Chan, C.S.G.; Richmond, W.; Fu, P.C. Enzymatic determination of total serum cholesterol. Clin. Chem. 1974, 20, 470–475. [Google Scholar] [CrossRef]
  42. Bucolo, G.; David, H. Quantitative determination of serum triglycerides by the use of enzymes. Clin. Chem. 1973, 19, 476–482. [Google Scholar] [CrossRef]
  43. Ohkawa, H.; Ohishi, N.; Yagi, K. Assay for lipid peroxides in animal tissue by thiobarbituric acid reaction. Anal. Biochem. 1979, 95, 351–358. [Google Scholar]
  44. McCord, J.M.; Fridovich, I. Superoxide dismutase an enzymic function for erythrocuprein (hemocuprein). J. Biol. Chem. 1969, 244, 6049–6055. [Google Scholar] [CrossRef]
  45. Aebi, H. Catalase in vitro. Methods Enzymol. 1984, 105, 121–126. [Google Scholar] [PubMed]
  46. Paglia, D.E.; Valentine, W.N. Studies on the quantitative and qualitative characterization of erythrocyte glutathione peroxidase. J. Lab. Clin. Med. 1967, 70, 158–169. [Google Scholar]
  47. Ellis, A.E. Lysozyme assays. Tech. Fish Immunol. 1990, 1, 101–103. [Google Scholar]
  48. Barta, O. Laboratory Techniques of Veterinary Clinical Immunology; Charles C Thomas Pub Ltd.: Springfield, IL, USA, 1984. [Google Scholar]
  49. Okada, Y.; Klein, N.J.; Pierro, J. Neutrophil dysfunction: The cellular mechanisms of impaired immunity during total parenteral nutrition in infancy. J. Pediatr. Surg. 1999, 34, 242–245. [Google Scholar] [CrossRef]
  50. Bancroft, J.D.; Gamble, M. The Hematoxylin and eosin. In Theory and Practice of Histological Techniques, 7th ed.; Suvarna, S.K., Layton, C., Bancroft, J.D., Eds.; Churchill Livingstone: Edinburgh, UK; New York, NY, USA, 2013. [Google Scholar]
  51. Dytham, C. Choosing and Using Statistics: A Biologist’s Guide; Blackwell Science Ltd.: London, UK, 2011. [Google Scholar]
  52. Abdel-Tawwab, M.; Khalil, R.H.; Metwally, A.A.; Shakweer, M.S.; Khallaf, M.A.; Abdel-Latif, H.M.R. Effects of black soldier fly (Hermetia illucens L.) larvae meal on growth performance, organs-somatic indices, body composition, and hemato-biochemical variables of European sea bass, Dicentrarchus labrax. Aquaculture 2020, 522, 735136. [Google Scholar] [CrossRef]
  53. Abd El-Naby, A.S.; El Asely, A.M.; Hussein, M.N.; Fawzy, R.M.; Abdel-Tawwab, M. Stimulatory effects of dietary chia (Salvia hispanica) seeds on performance, antioxidant-immune indices, histopathological architecture, and disease resistance of Nile tilapia. Aquaculture 2023, 563, 738889. [Google Scholar] [CrossRef]
  54. Abdel-Tawwab, M.; Khalil, R.H.; Abo Selema, T.A.M.; Abdelsalam, M.; Abdelhakim, T.M.; Sabry, E.A.; El-Ghaffar, H.A.A.; Saad, A.H. Evaluating the inclusion of Clostridium autoethanogenum protein instead of fishmeal protein in diets for European seabass (Dicentrarchus labrax): Growth performance, digestive enzymes, health status, and tissues investigations. Anim. Feed Sci. Technol. 2025, 324, 116318. [Google Scholar] [CrossRef]
  55. El-Werwary, S.O.M.; Ali, A.Y.M.; Sabry, E.A.; Monier, M.N.; Abdel-Tawwab, M. Partial replacements of fishmeal by autoclaved shrimp processing by-product modulates the growth, digestive enzymes, immune-antioxidant, and economic performances for Nile tilapia (Oreochromis niloticus) juveniles. Aquac. Int. 2025, 33, 573. [Google Scholar] [CrossRef]
  56. Costa, R.S.; Basto, A.; Monteiro, M.; Pinho, B.; Sa, T.; Santos, M.V.; Murta, D.; Schrama, J.W.; Valente, L.M. Combining Hermetia illucens and Tenebrio molitor meals in diets for European seabass: Effects on growth, nutrient utilisation, intestinal morphology and muscle quality. Aquaculture 2026, 610, 742899. [Google Scholar] [CrossRef]
  57. Hossain, M.S.; Hamidoghli, A.; Hong, J.; Sealey, W.; Small, B.C. Effects of high dietary inclusion of defatted mealworm (Tenebrio molitor) meal as a fish meal substitute on growth, histological traits, and health performances of rainbow trout (Oncorhynchus mykiss). Aquac. Nutr. 2025, 2025, 5568058. [Google Scholar] [CrossRef]
  58. Bai, N.; Li, Q.; Pan, S.; Qi, Z.; Deng, W.; Gu, M. Effects of defatted yellow mealworm (Tenebrio molitor) on growth performance, intestine, and liver health of turbot (Scophthalmus maximus). Anim. Feed Sci. Technol. 2023, 302, 115672. [Google Scholar] [CrossRef]
  59. Yang, L.; Cai, M.; Zhong, L.; Yin, Y.; Xie, Y.; Xie, S.; Hu, Y.; Zhang, J. Yellow mealworm (Tenebrio molitor) meal in diets of grass carp (Ctenopharyngodon idellus): Effects on growth performance, antioxidant capacity, immunity, intestinal morphology, and intestinal microbiota. Anim. Nutr. 2025, 21, 70–83. [Google Scholar] [CrossRef] [PubMed]
  60. Gasco, L.; Henry, M.; Piccolo, G.; Marono, S.; Gai, F.; Renna, M.; Lussiana, C.; Antonopoulou, E.; Mola, P.; Chatzifotis, S. Tenebrio molitor meal in diets for European sea bass (Dicentrarchus labrax L.) juveniles: Growth performance, whole body composition and in vivo apparent digestibility. Anim. Feed Sci. Technol. 2016, 220, 34–45. [Google Scholar] [CrossRef]
  61. Abdel-Tawwab, M.; Khattab, Y.A.E.; Ahmad, M.H.; Shalaby, A.M.E. Compensatory growth, feed utilization, whole body composition and hematological changes in starved juvenile Nile tilapia, Oreochromis niloticus (L.). J. Appl. Aquac. 2006, 18, 17–36. [Google Scholar] [CrossRef]
  62. Sharifinia, M.; Bahmanbeigloo, Z.A.; Keshavarzifard, M.; Khanjani, M.H.; Daliri, M.; Koochaknejad, E.; Jasour, M.S. Fishmeal replacement by mealworm (Tenebrio molitor) in diet of farmed Pacific white shrimp (Litopenaeus vannamei): Effects on growth performance, serum biochemistry, and immune response. Aquat. Living Resour. 2023, 36, 19. [Google Scholar] [CrossRef]
  63. Murray, R.K.; Granner, D.K.; Mayes, P.A.; Rodwell, V.W. Harper’s Illustrated Biochemistry, 26th ed.; McGraw-Hill, Medical Publishing Division: New York, NY, USA, 2003. [Google Scholar]
  64. Abdelhamid, A.F.; Ayoub, H.F.; Abd El-Gawad, E.A.; Abdelghany, M.F.; Abdel-Tawwab, M. Potential effects of dietary seaweeds mixture on the growth performance, antioxidant status, immunity response, and resistance of striped catfish (Pangasianodon hypophthalmus) against Aeromonas hydrophila infection. Fish Shellfish Immunol. 2021, 119, 76–83. [Google Scholar] [CrossRef]
  65. Harikrishnan, R.; Devi, G.; Van Doan, H.; Balasundaram, C.; Esteban, M.A.; Abdel-Tawwab, M. Impact of grape pomace flour (GPF) on immunity and immuneantioxidant-anti-inflammatory genes expression in Labeo rohita against Flavobacterium columnaris. Fish Shellfish Immunol. 2021, 111, 69–82. [Google Scholar] [CrossRef]
  66. Xu, X.; Ji, H.; Yu, H.; Zhou, J. Influence of replacing fishmeal with enzymatic hydrolysates of defatted silkworm pupa (Bombyx mori L.) on growth performance, body composition and non-specific immunity of juvenile mirror carp (Cyprinus carpio var. specularis). Aquac. Res. 2018, 49, 1480–1490. [Google Scholar] [CrossRef]
  67. Zhou, J.; Liu, S.; Ji, H.; Yu, H. Effect of replacing dietary fish meal with black soldier fly larvae meal on growth and fatty acid composition of Jian carp (Cyprinus carpio var. Jian). Aquac. Nutr. 2018, 24, 424–433. [Google Scholar] [CrossRef]
  68. Lesser, M.P. Oxidative stress in marine environments: Biochemistry and physiological ecology. Ann. Rev. Physiol. 2006, 68, 253–278. [Google Scholar] [CrossRef]
  69. Hoseinifar, S.H.; Yousef, S.; Van Doan, H.; Ashouri, G.; Gioacchini, G.; Maradonna, F.; Carnevali, O. Oxidative stress and antioxidant defense in fish: The implications of probiotic, prebiotic, and synbiotics. Rev. Fish. Sci. Aquac. 2021, 29, 198–217. [Google Scholar] [CrossRef]
  70. Akbary, R.; Golkar, P. Elicitation of medicinally-valuable secondary metabolites, enzymatic, and antioxidant activity using chitin and yeast extract in callus cultures of Ammi visnaga L. Plant Cell Tissue Organ Cult. 2023, 154, 689–702. [Google Scholar] [CrossRef]
  71. Ngo, S.D.H.; Kim, K. Antioxidant effects of chitin, chitosan and their derivatives. Adv. Food Nutr. Res. 2014, 73, 15–31. [Google Scholar]
  72. Esteban, M.A.; Mulero, V.; Cuesta, A.; Ortuño, J.; Meseguer, J. Effects of injecting chitin particles on the innate immune response of gilthead seabream (Sparus aurata L.). Fish Shellfish Immunol. 2000, 10, 543–554. [Google Scholar] [CrossRef]
  73. Esteban, M.A.; Cuesta, A.; Ortuño, J.; Meseguer, J. Immunomodulatory effects of dietary intake of chitin on gilthead seabream (Sparus aurata L.) innate immune system. Fish Shellfish Immunol. 2001, 11, 303–315. [Google Scholar] [CrossRef]
  74. Ohta, T.; Ido, A.; Kusano, K.; Miura, C.; Miura, T. A novel polysaccharide in insects activates the innate immune system in mouse macrophage RAW264 cells. PLoS ONE 2014, 9, e114823. [Google Scholar] [CrossRef]
  75. Ohta, T.; Kusano, K.; Ido, A.; Miura, C.; Miura, T. Silkrose: A novel acidic polysaccharide from the silkmoth that can stimulate the innate immune response. Carbohydr. Polym. 2016, 136, 995–1001. [Google Scholar] [CrossRef]
  76. Ido, A.; Hashizume, A.; Ohta, T.; Takahashi, T.; Miura, C.; Miura, T. Replacement of fish meal by defatted yellow mealworm (Tenebrio molitor) larvae in diet improves growth performance and disease resistance in red seabream (Pargus major). Animals 2019, 9, 100. [Google Scholar] [CrossRef]
  77. Sharifinia, M.; Bahmanbeigloo, Z.A.; Keshavarzifard, M.; Khanjani, M.H.; Daliri, M.; Koochaknejad, E.; Jasour, M.S. The effects of replacing fishmeal by mealworm (Tenebrio molitor) on digestive enzymes activity and hepatopancreatic biochemical indices of Litopenaeus vannamei. Ann. Anim. Sci. 2023, 23, 519–528. [Google Scholar] [CrossRef]
  78. Su, J.; Gong, Y.; Cao, S.; Lu, F.; Han, D.; Liu, H.; Jin, J.; Yang, Y.; Zhu, X.; Xie, S. Effects of dietary Tenebrio molitor meal on the growth performance, immune response and disease resistance of yellow catfish (Pelteobagrus fulvidraco). Fish Shellfish Immunol. 2017, 69, 59–66. [Google Scholar] [CrossRef]
  79. Abdel-Latif, H.M.R.; Abdel-Tawwab, M.; Khalil, R.H.; Metwally, A.A.; Shakweer, M.S.; Ghetas, H.A.; Khallaf, M.A. Black soldier fly (Hermetia illucens) larvae meal in diets of European seabass: Effects on antioxidative capacity, non-specific immunity, transcriptomic responses, and resistance to the challenge with Vibrio alginolyticus. Fish Shellfish Immunol. 2021, 111, 111–118. [Google Scholar] [CrossRef]
  80. Ming, J.; Ye, J.; Zhang, Y.; Yang, X.; Wu, C.; Shao, X.; Liu, P. The influence of maggot meal and L-carnitine on growth, immunity, antioxidant indices and disease resistance of black carp (Mylopharyngodon piceus). J. Chin. Cereals Oils Assoc. 2013, 28, 80–86. [Google Scholar]
  81. Li, S.; Ji, H.; Zhang, B.; Zhou, J.; Yu, H. Defatted black soldier fly (Hermetia illucens) larvae meal in diets for juvenile Jian carp (Cyprinus carpio var. Jian): Growth performance, antioxidant enzyme activities, digestive enzyme activities, intestine and hepatopancreas histological structure. Aquaculture 2017, 477, 62–70. [Google Scholar] [CrossRef]
  82. Taufek, N.M.; Aspani, F.; Muin, H.; Raji, A.A.; Razak, S.A.; Alias, Z. The effect of dietary cricket meal (Gryllus bimaculatus) on growth performance, antioxidant enzyme activities, and haematological response of African catfish (Clarias gariepinus). Fish Physiol. Biochem. 2016, 42, 1143–1155. [Google Scholar] [CrossRef]
  83. Zhang, J.; Dong, Y.; Song, K.; Wang, L.; Li, X.; Tan, B.; Lu, K.; Zhang, C. Effects of the replacement of dietary fish meal with defatted yellow mealworm (Tenebrio molitor) on juvenile large yellow croakers (Larimichthys crocea) growth and gut health. Animals 2022, 12, 2659. [Google Scholar] [CrossRef] [PubMed]
  84. Henry, M.A.; Gasco, L.; Chatzifotis, S.; Piccolo, G. Does dietary insect meal affect the fish immune system? The case of mealworm, Tenebrio molitor on European sea bass, Dicentrarchus labrax. Dev. Comp. Immunol. 2018, 81, 204–209. [Google Scholar] [CrossRef] [PubMed]
Figure 1. Activities of mid-intestinal digestive enzymes (U/mg protein) of Nile tilapia (O. niloticus) juveniles fed on diets containing different levels of yellow mealworm (T. molitor) larvae meal (TMLM) protein instead of fishmeal protein for 90 days. Bars of each enzyme assigned with different letters are significantly different at p < 0.05 (n = 3).
Sustainability 18 05661 g001aSustainability 18 05661 g001b
Figure 2. Changes in the lysozyme (LYZ) activity (µg/mL) in Nile tilapia (O. niloticus) juveniles fed on diets containing different levels of yellow mealworm (T. molitor) larvae meal (TMLM) protein instead of fishmeal (FM) protein for 90 days. Bars of each enzyme assigned with different letters are significantly different at p < 0.05 (n = 3).
Sustainability 18 05661 g002
Figure 3. Changes in the immunoglobulin M (IgM; mg/mL) in Nile tilapia (O. niloticus) juveniles fed on diets containing different levels of yellow mealworm (T. molitor) larvae meal (TMLM) protein instead of fishmeal (FM) protein for 90 days. Bars of each enzyme assigned with different letters are significantly different at p < 0.05 (n = 3).
Sustainability 18 05661 g003
Figure 4. The bactericidal activity against A. sobria of blood of Nile tilapia, O. niloticus, juveniles fed on diets containing different levels of yellow mealworm (T. molitor) larvae meal (TMLM) protein instead of fishmeal (FM) protein for 90 days. Bars with different letters are significantly different at p < 0.05 (n = 3).
Sustainability 18 05661 g004
Figure 5. Photomicrograph of transverse sections (H&E stained) of intestine tract of Nile tilapia (O. niloticus) juveniles fed on diets containing different levels of yellow mealworm (T. molitor) larvae meal (TMLM) protein instead of fishmeal (FM) protein for 90 days. C: control; T-1: 15% TMLM; T-2: 30% TMLM; T-3: 45% TMLM; T-4: 60% TMLM; T-5: 75% TMLM. Mu, mucosa; SubM, submucosa; Mus, muscularis; Se, serosa; IV, intestinal villi; GC, goblet cells; AbC, absorptive cells; Lp, lamina propria.
Sustainability 18 05661 g005
Figure 6. Photomicrograph transverse sections (H&E stained) of liver of Nile tilapia (O. niloticus) juveniles fed on diets containing different levels of yellow mealworm (T. molitor) larvae meal (TMLM) protein instead of fishmeal (FM) protein for 90 days. C: control; T-1: 15% TMLM; T-2: 30% TMLM; T-3: 45% TMLM; T-4: 60% TMLM; T-5: 75% TMLM. HC, hepatocytes; HS, hepatic sinusoid; HV, hepatic vein; HA, hepatopancreatic acini; RBCs, red blood cells; N, nucleus.
Sustainability 18 05661 g006
Table 1. Ingredients and chemical proximate composition (% on dry matter basis) of diets containing different levels of yellow mealworm (T. molitor) larvae meal (TMLM) used instead of fish meal (FM) protein in diets for Nile tilapia.
IngredientsTMLM Levels (%)
0.0 (Control)1530456075
Fish meal (62% CP—Vietnam)11093.57760.54427.5
Soybean meal (48% CP)400400400400400400
TM larvae meal (47.8% CP)016.53349.56682.5
Ground wheat (14% CP)130190190190190190
Ground corn (7.5% CP)78709496100100
Wheat bran200150130130130130
Cod liver oil222016141010
Sunflower oil101010101010
Dicalcium Phosphate101010101010
Vitamins premix a101010101010
Minerals premix b101010101010
Corn starch202020202020
Total100010001000100010001000
Chemical composition (%)
Dry mater89.3189.3489.3089.3189.2989.35
Crude protein30.9530.9330.6630.4430.2430.01
Total lipids6.096.156.106.216.326.42
Total ash7.547.036.696.426.155.88
Crude fiber3.273.093.163.343.523.69
Nitrogen free extract c52.1552.8153.3953.6053.9754.00
Available P1.050.960.880.800.730.65
GE (MJ/kg) d19.1519.2519.2819.3419.3519.45
a Vitamin premix (per kg of premix): thiamine, 2.5 g; riboflavin, 2.5 g; pyridoxine, 2.0 g; inositol, 100.0 g; biotin, 0.3 g; pantothenic acid, 100.0 g; folic acid, 0.75 g; paraaminobenzoic acid, 2.5 g; choline, 200.0 g; nicotinic acid, 10.0 g; cyanocobalamine, 0.005 g; a-tocopherol acetate, 20.1 g; menadione, 2.0 g; retinol palmitate, 100,000 IU; cholecalciferol, 500,000 IU. b Minerals premix (g/kg of premix): CaHPO4.2H2O, 727.2; MgCO4.7H2O, 127.5; KCl 50.0; NaCl, 60.0; FeC6H5O7.3H2O, 25.0; ZnCO3, 5.5; MnCl2.4H2O, 2.5; Cu(OAc)2·H2O, 0.785; CoCl3.6H2O, 0.477; CaIO3.6H2O, 0.295; CrCl3.6H2O, 0.128; AlCl3.6H2O, 0.54; Na2SeO3, 0.03. c Nitrogen-Free Extract (calculated by difference) = 100 − (protein% + lipid% + ash% + fiber%). d Gross energy (GE) was calculated from NRC [28] as 16.7 kJ/g, 37.4 kJ/g, and 16.7 kJ/g for protein, lipid, and carbohydrates, respectively.
Table 2. Amino acids (AA) composition (% on dry matter basis) of diets containing different levels of yellow mealworm (T. molitor) larvae meal (TMLM) used instead of fish meal (FM) protein in diets and AA requirement of Nile tilapia after Santiago and Lovell [31].
Amino Acids (%)TMLM Levels (%)AA Requirement of Nile Tilapia
0.0 (Control)1530456075
Essential AA
Arginine5.885.264.834.353.122.574.2
Histidine3.733.353.072.952.442.171.72
Isoleucine4.233.813.473.322.642.253.11
Leucine6.565.875.154.853.713.123.39
Lysine6.215.845.174.953.792.965.12
Methionine3.613.192.982.721.871.352.68
Phenylalanine4.393.8363.223.042.081.623.75
Threonine4.624.363.953.742.842.153.75
Tryptophan1.831.751.631.581.441.321.0
Valine3.773.332.942.651.911.452.8
Table 3. Growth performance indices of Nile tilapia (O. niloticus) juveniles fed on diets containing different levels of yellow mealworm (T. molitor) larvae meal (TMLM) protein instead of fishmeal (FM) protein for 90 days.
TMLM Levels
(%)
Initial Weight
(g)
Final Weight
(g)
Weight Gain %SGR
(%/Day)
Feed Intake
(g Feed/Fish)
FCRFish Survival
(%)
0.0 (control)9.631.1 d224.0 d1.399 d32.7 e1.52100
159.733.3 c243.3 cd1.468 cd35.4 d1.50100
309.737.7 b288.7 b1.616 b42.2 b1.51100
459.642.0 a337.5 a1.757 a48.9 a1.51100
609.735.2 c262.9 bc1.534 bc38.4 c1.51100
759.634.5 c259.4 c1.523 c37.6 cd1.51100
Pooled SEM0.050.879.260.0291.310.0130.0
p values0.991<0.0001<0.0001<0.0001<0.00011.000-
Mean values in the same column followed by different letters are significantly different at p < 0.05.
Table 4. Changes in proximate chemical composition (% on fresh weight basis) of the whole-body of Nile tilapia (O. niloticus) juveniles fed on diets containing different levels of yellow mealworm (T. molitor) larvae meal (TMLM) protein instead of fishmeal (FM) protein for 90 days.
TMLM Levels
(%)
MoistureCrude ProteinTotal LipidsAsh
0.0 (control)71.020.14.93.7
1570.920.24.73.9
3071.120.54.83.5
4570.720.44.83.3
6071.120.74.53.2
7571.020.74.43.4
Pooled SEM0.1310.1470.0910.088
p values0.9820.8650.7490.186
Table 5. Changes in hematological profile of Nile tilapia (O. niloticus) juveniles fed on diets containing different levels of yellow mealworm (T. molitor) larvae meal (TMLM) protein instead of fishmeal (FM) protein for 90 days.
TMLM Levels
(%)
RBCs
(×106 uL)
Hb
(g/dL)
Hct
(%)
MCV
(fl)
MCH
(Pg)
MCHC
(g/dL)
0.0 (control)138.6 d4.23 d15.3 c1.100.3127.65
15157.7 c5.56 c20.3 ab1.290.3527.39
30177.0 b6.44 b20.6 ab1.160.3631.26
45214.7 a7.59 a22.7 a1.060.3533.44
60176.6 b5.46 c18.6 b1.050.3129.35
75167.6 bc5.09 c18.3 b1.090.3027.81
Pooled SEM6.7660.3170.6210.0410.0151.345
p value0.0090.0140.0030.7430.8380.273
Mean values in the same column followed by different letters are significantly different at p < 0.05. RBCs: red blood cells; Hb: hemoglobin; Hct: hematocrit; MCV: mean corpuscular volume; MCH: mean corpuscular hemoglobin; MCHC: mean corpuscular hemoglobin concentration.
Table 6. Changes in serum biochemical indices of Nile tilapia (O. niloticus) juveniles fed on diets containing different levels of yellow mealworm (T. molitor) larvae meal (TMLM) protein instead of fishmeal (FM) protein for 90 days.
TMLM Levels
(%)
Total Protein
(g/dL)
Albumin
(g/dL)
Globulin
(g/dL)
Glucose
(mg/dL)
T-CHOL
(mg/dL)
TG
(mg/dL)
ALT
(IU/L)
AST
(IU/L)
0.0 (control)3.69 c2.25 c1.44 d51.1202.6 a104.2 a15.2 a19.9 a
154.96 b2.73 b2.23 b51.5118.0 b76.2 b13.3 b18.3 ab
305.09 b2.71 b2.38 ab50.993.2 c65.7 c13.2 b17.7 b
456.02 a3.42 a2.60 a51.574.6 d58.3 d11.3 c16.3 b
604.98 b2.81 b2.17 b51.758.7 e37.0 e9.1 d13.4 c
754.33 bc2.56 bc1.77 c50.654.9 e34.2 e8.1 d12.9 c
Pooled SEM0.1910.0960.1310.68412.5475.8120.6230.764
p value<0.00010.0010.0010.995<0.0001<0.0001<0.00010.001
Mean values in the same column followed by different letters are significantly different at p < 0.05. T-CHOL: total cholesterol; TG: triglycerides; ALT: alanine aminotransferase; AST: aspartate aminotransferase.
Table 7. Changes in hepatic antioxidant indices of Nile tilapia (O. niloticus) juveniles fed on diets containing different levels of yellow mealworm (T. molitor) larvae meal (TMLM) protein instead of fishmeal (FM) protein for 90 days.
TM Levels
(%)
Hepatic MDA
(nmol/mg Protein)
Hepatic SOD
(U/mg Protein)
Hepatic CAT
(U/mg Protein)
Hepatic GPx
(U/mg Protein)
0.0 (control)15.9 a11.7 d23.7 d5.4 d
1512.7 b16.3 c28.1 bc6.5 cd
3011.8 bc21.3 b31.5 b8.4 ab
4510.7 c24.7 a35.2 a9.4 a
609.4 d19.6 b29.5 b7.5 bc
758.8 d16.5 c26.3 c6.8 c
Pooled SEM0.4410.8310.8230.299
p value<0.0001<0.0001<0.0001<0.0001
Mean values in the same column followed by different letters are significantly different at p < 0.05. MDA: malondialdehyde; SOD: superoxide dismutase; CAT: catalase; GPx: glutathione peroxidase.
Disclaimer/Publisher’s Note: The statements, opinions and data contained in all publications are solely those of the individual author(s) and contributor(s) and not of MDPI and/or the editor(s). MDPI and/or the editor(s) disclaim responsibility for any injury to people or property resulting from any ideas, methods, instructions or products referred to in the content.