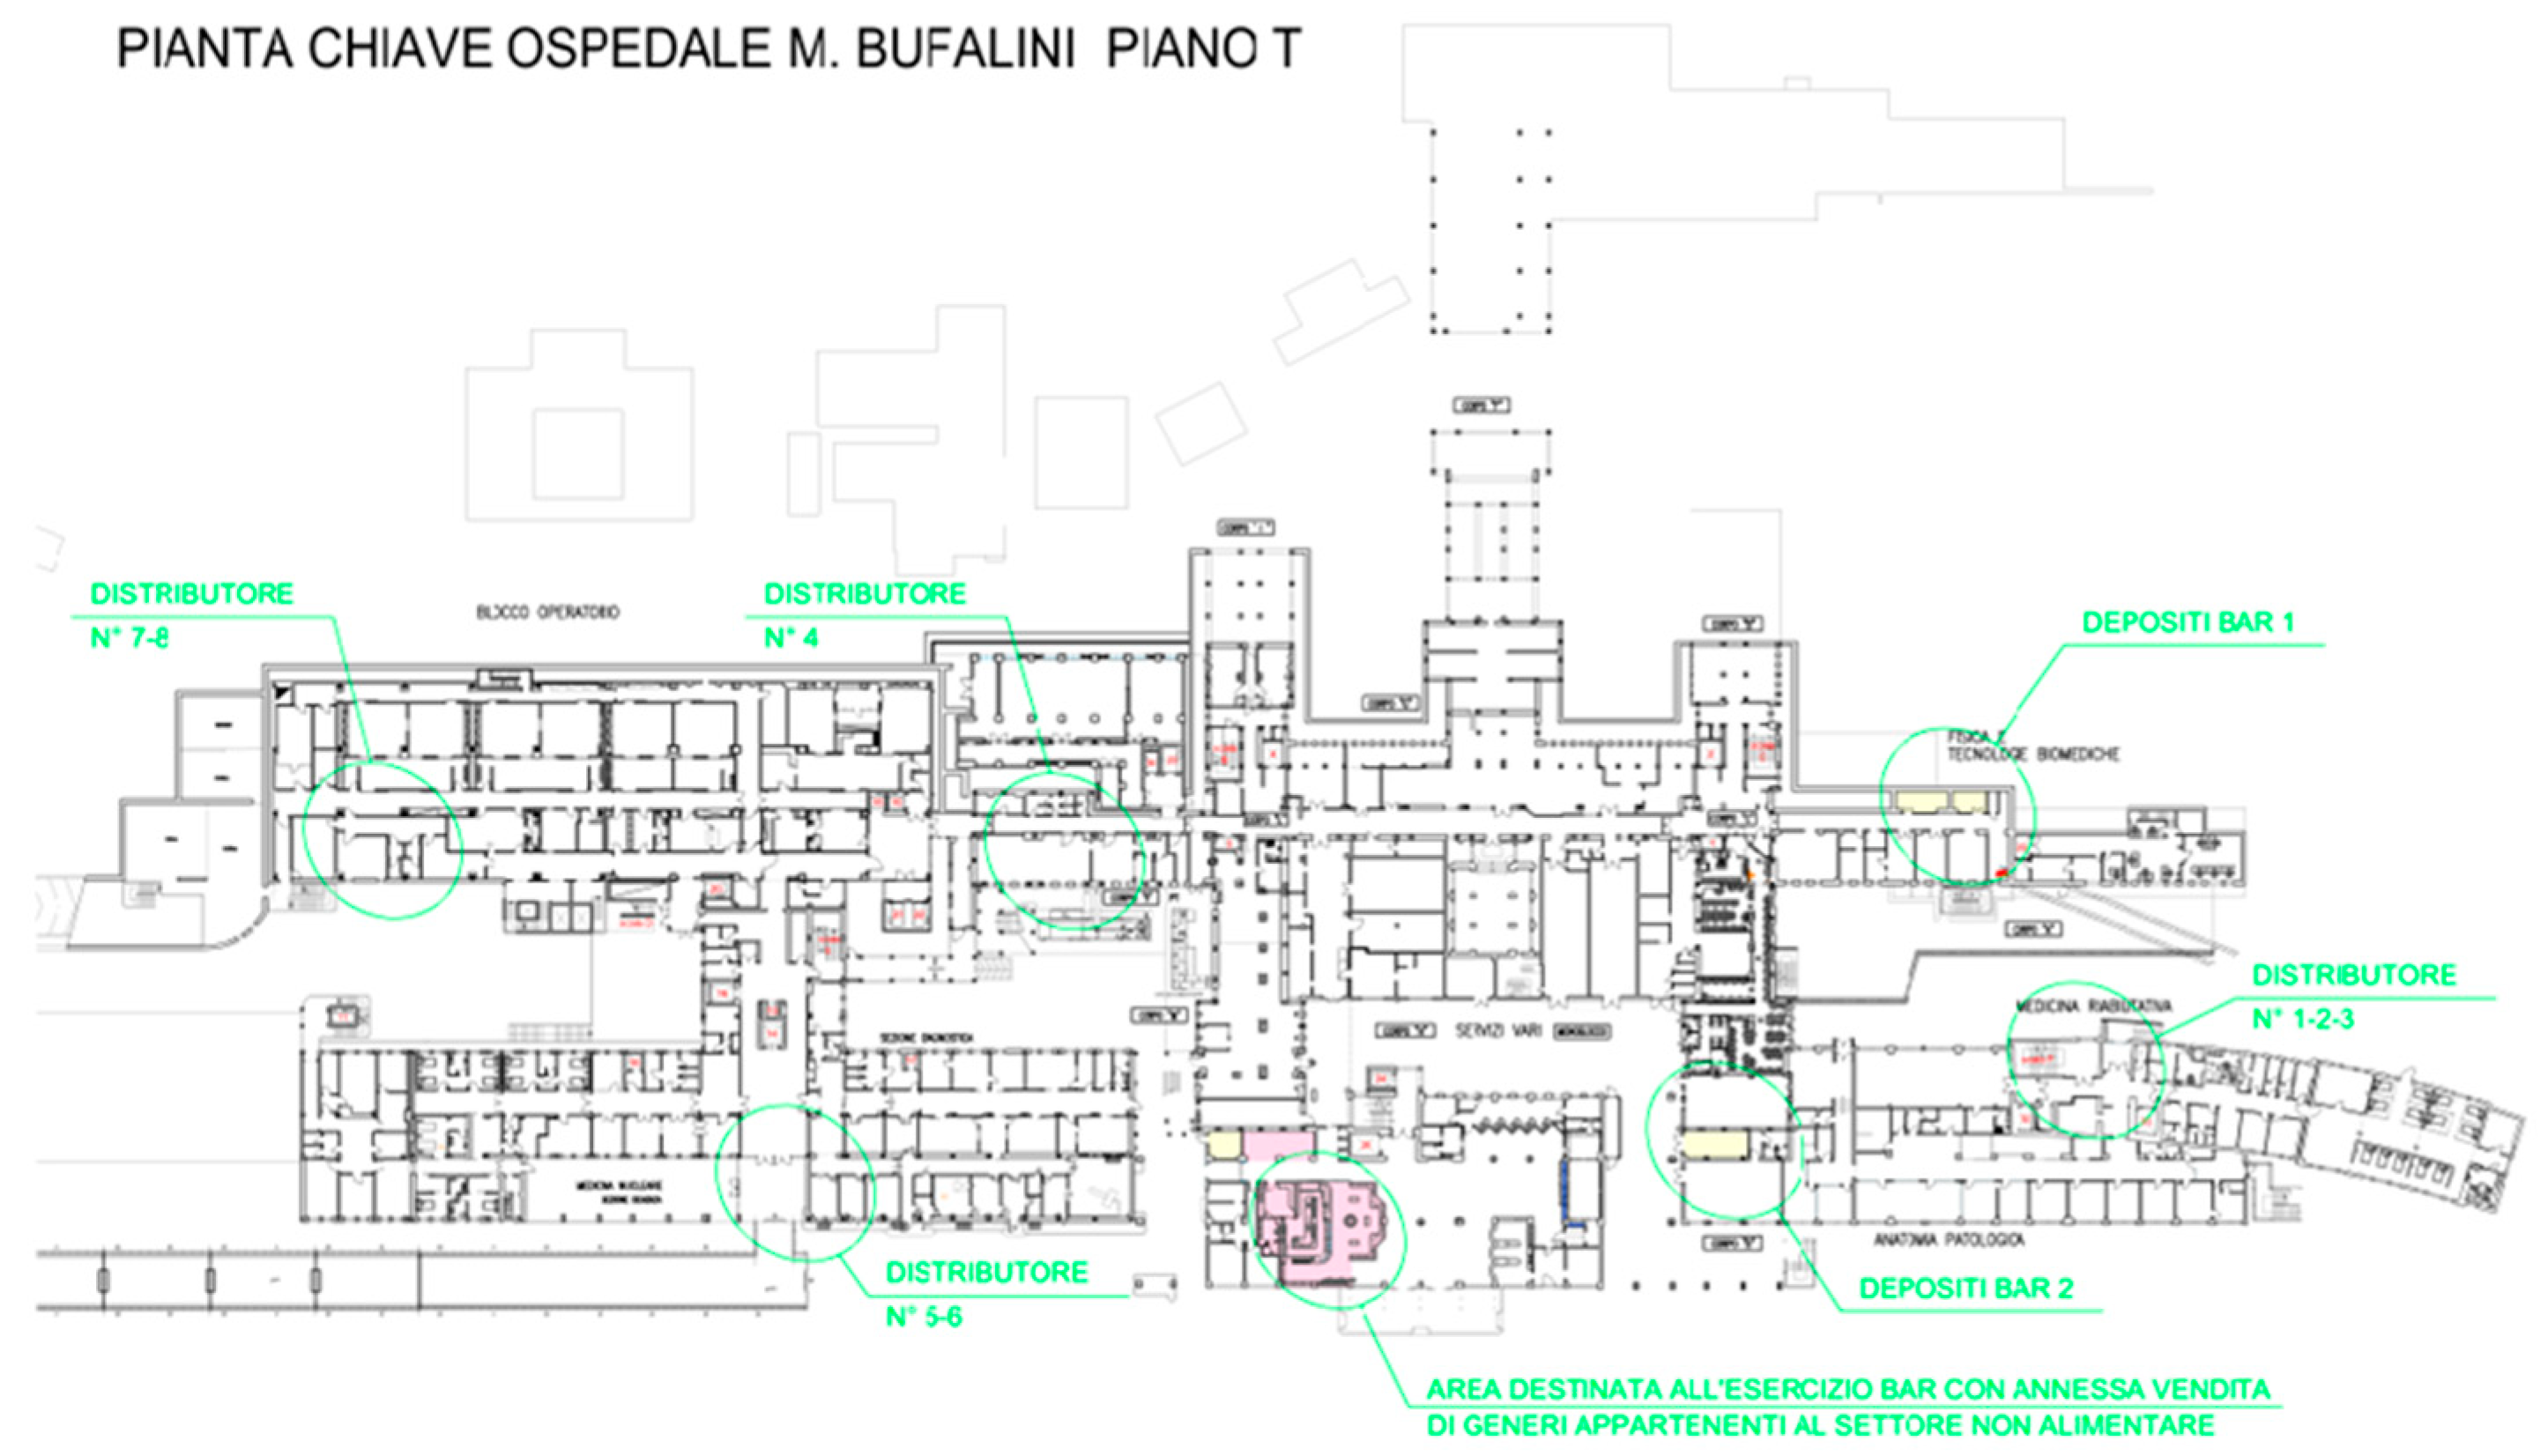
1. Introduction
Healthcare facilities are among the most resource-intensive buildings in the public sector due to continuous operation, strict hygiene requirements, and complex logistics. In addition to energy use and medical waste, environmental hygiene services contribute significantly to the overall environmental footprint of hospitals, particularly through the consumption of chemicals, water, and energy. At the same time, environmental surfaces play a well-established role in the transmission of healthcare-associated infections (HAIs), making cleaning and disinfection essential components of infection prevention and control (IPC) programs.
The COVID-19 pandemic further emphasized the importance of environmental hygiene, while also highlighting the environmental burden associated with intensified cleaning practices. Conventional protocols typically rely on the frequent application of chemical disinfectants, high concentrations of active substances, and energy-intensive laundering processes. Although effective in reducing microbial contamination, these approaches raise concerns regarding environmental impact, occupational exposure, and the potential contribution to antimicrobial resistance (AMR) [
1,
2,
3].
In response, increasing attention is being given to strategies that integrate infection control with environmental sustainability. The concept of sustainable healthcare promotes reducing environmental impacts without compromising patient safety, aligning with key Sustainable Development Goals (SDGs), including SDG 3 (health), SDG 12 (responsible consumption), and SDG 13 (climate action) [
1,
4,
5].
Life Cycle Assessment (LCA) has emerged as a key tool for quantifying environmental impacts across the entire life cycle of products and services, from raw material extraction to end-of-life [
6]. Its application in healthcare has expanded in recent years, revealing that support services such as cleaning and laundry can significantly contribute to institutional carbon footprints [
7,
8]. However, despite their relevance, professional cleaning services remain relatively underexplored, particularly in studies combining environmental and microbiological performance.
In Italy, the introduction of Minimum Environmental Criteria (Criteri Ambientali Minimi, CAM) partially addresses this gap by requiring public procurement processes to demonstrate both a reduced environmental impact and maintained hygienic performance [
9]. This dual requirement highlights the need for integrated approaches capable of simultaneously evaluating environmental sustainability and microbiological effectiveness.
Microbiological surface monitoring remains a fundamental tool for assessing the cleaning performance in healthcare settings. Standardized methods provide quantitative evidence of contamination levels, especially in high-risk and high-touch areas. Recent studies increasingly support combining microbiological indicators with environmental metrics to enable more comprehensive, evidence-based decision-making in healthcare facility management [
10,
11,
12,
13].
Despite this growing interest, most available studies address microbiological effectiveness and environmental performance separately, and integrated microbiological–LCA assessments conducted under real hospital operating conditions remain limited. To address this gap, the present study investigates a case study conducted at the “Maurizio Bufalini” Hospital in Cesena (Italy), a large acute-care facility representative of contemporary healthcare infrastructure. The study compares a traditional cleaning protocol with a CAM-compliant GREEN protocol, using a combined approach that integrates microbiological monitoring with Life Cycle Assessment, in accordance with ISO 14040, ISO 14044 and ISO 14067 standards [
14,
15,
16].
The objective of this work is to evaluate whether a sustainability-oriented cleaning protocol can ensure microbiological safety equivalent to conventional practices while achieving a measurable reduction in environmental impact, with a particular focus on the carbon footprint. By integrating infection control metrics with life-cycle environmental analysis, this study aims to provide an applied framework to support sustainable decision-making in healthcare cleaning services. This integrated approach is proposed to overcome the limitations of single-domain assessments and to provide a more comprehensive basis for decision-making in healthcare cleaning services. Beyond a comparative assessment, this study contributes to bridging the gap between environmental sustainability and infection control in real-world healthcare operations.
This study addresses the following research questions:
- (i)
Can a CAM-compliant GREEN cleaning protocol ensure microbiological performance equivalent to or better than a traditional protocol?
- (ii)
What is the magnitude of environmental impact reduction associated with its implementation?
- (iii)
Can an integrated microbiological–LCA framework support decision-making in healthcare cleaning services?
3. Results
The results are presented in three sequential blocks: (i) the microbiological performance before and after cleaning, stratified by risk area; (ii) the qualitative assessment of residual microbiota; and (iii) the environmental performance based on Life Cycle Assessment indicators. This structure allows for a direct comparison between hygienic effectiveness and environmental outcomes.
3.1. Baseline Microbiological Contamination of Hospital Surfaces
Baseline microbiological contamination levels, assessed on untreated surfaces (NT), varied according to area risk classification, surface typology, and frequency of contact. As expected, higher microbial loads were observed in medium- and medium–high-risk areas, particularly on sanitary fixtures, patient-related furnishings, and frequently touched surfaces such as desks, seats, and workstations.
Across all sampled locations, total aerobic microbial counts remained within ranges commonly reported for occupied hospital environments under routine operational conditions. These baseline values provided a robust reference point for evaluating the effectiveness of the two cleaning protocols and ensured that post-treatment reductions could be interpreted under realistic contamination scenarios.
3.2. Effect of Cleaning Protocols on Total Microbial Load
The main finding was that both protocols significantly reduced surface microbial contamination compared with untreated conditions, while maintaining values below the applicable hygienic thresholds.
Before analyzing the results by risk category, the overall effect of the two cleaning protocols on the total surface microbial load was evaluated across all sampled hospital areas. This global comparison allows an immediate visualization of the magnitude of microbial reduction achieved under real operational conditions.
Both protocols resulted in a statistically significant reduction in surface-associated microbial loads compared to untreated conditions (
p < 0.05). In all risk categories, post-cleaning values fell below the acceptability thresholds defined by INAIL and ANMDO guidelines [
19,
26,
27].
Notably, the GREEN protocol consistently achieved residual microbial counts that were equal to or lower than those of the traditional protocol. This trend was observed across multiple surface types, suggesting a stable and reproducible hygienic performance rather than isolated improvements. This finding demonstrates that reduced chemical intensity and lower laundering temperatures do not inherently compromise hygienic performance when mechanical removal and procedural optimization are enhanced.
3.3. Microbiological Results by Risk Area Classification
3.3.1. Low-Risk Areas (Green Zone)
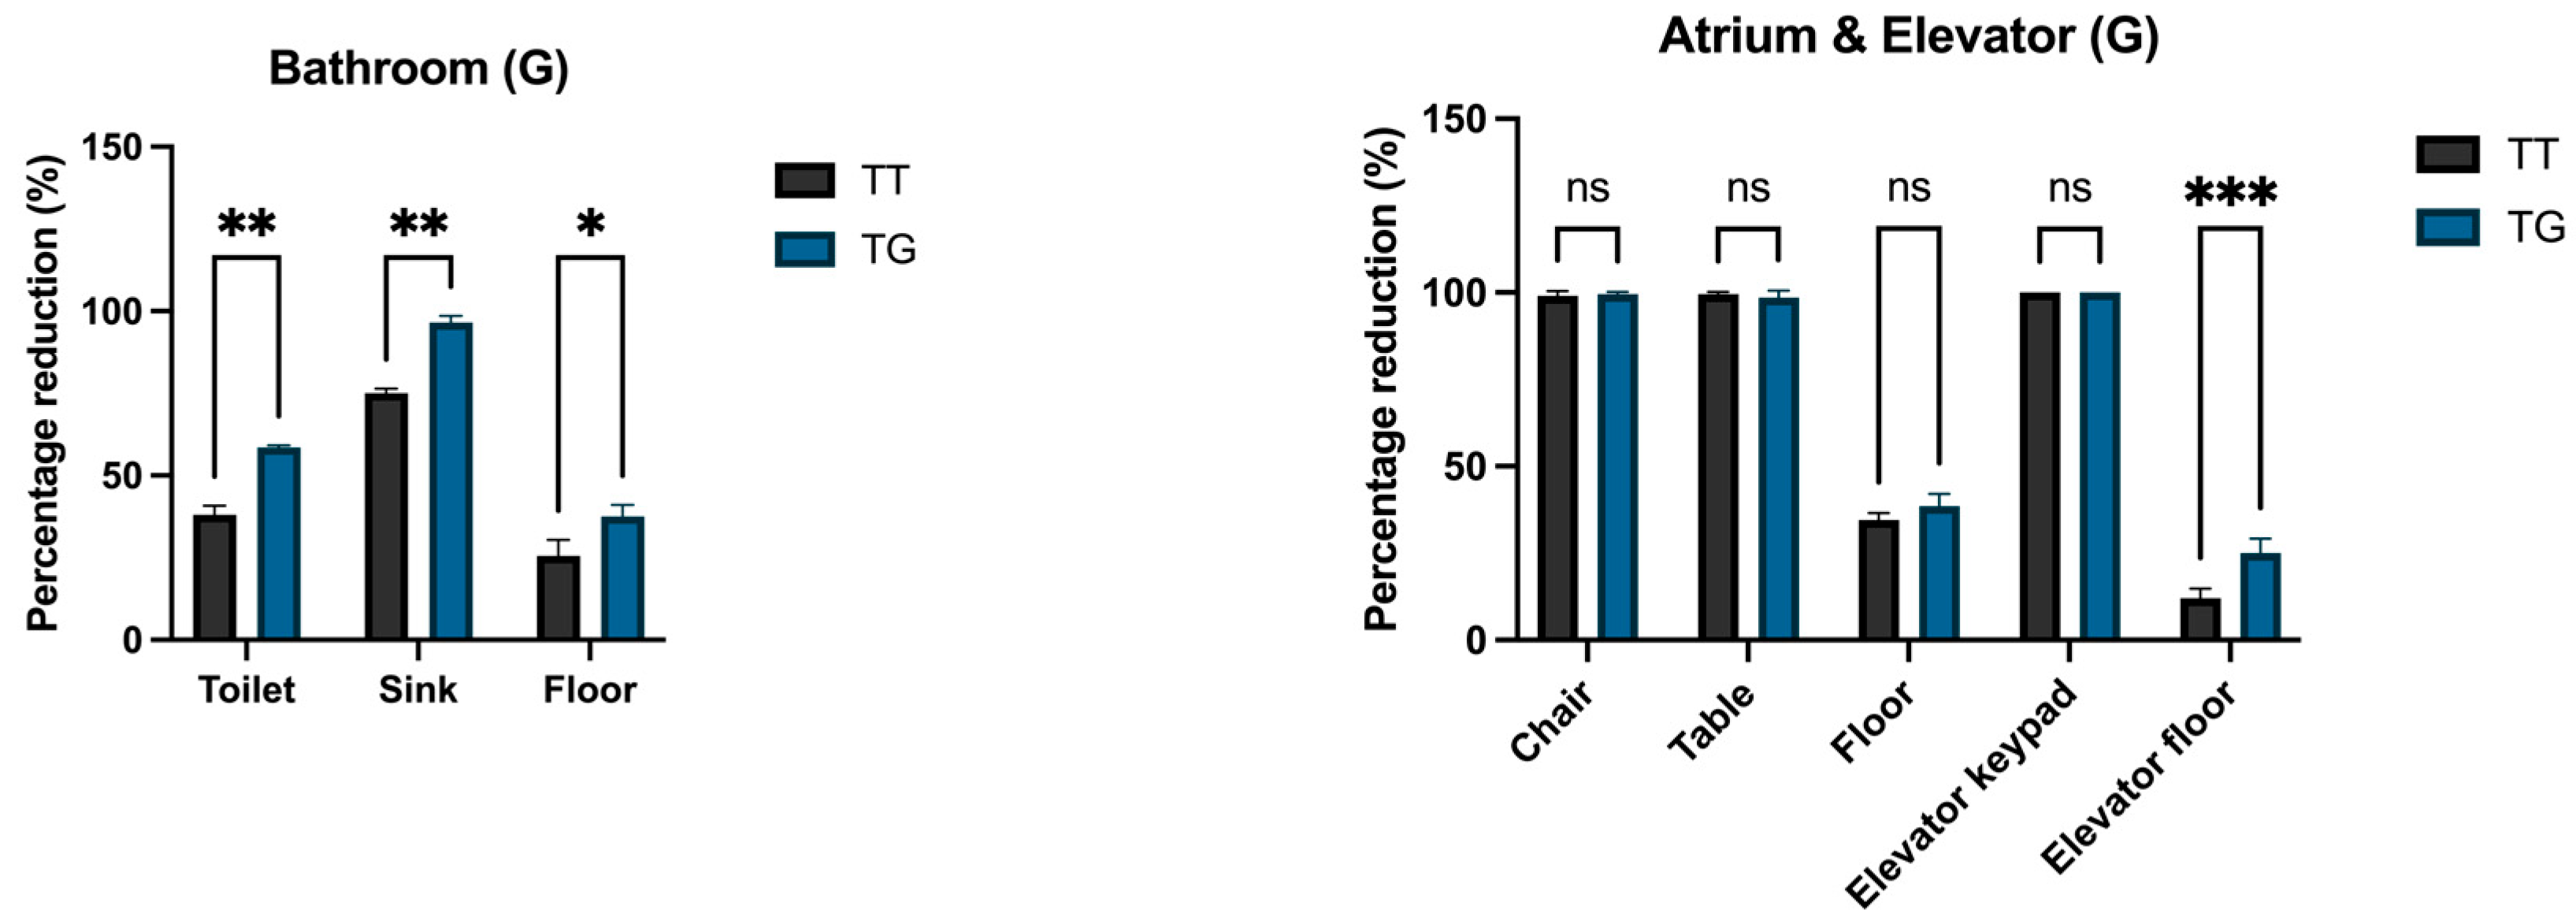
To better understand protocol performance under different hygienic pressures, the results were stratified according to area risk classification. Low-risk areas are common spaces with lower expected contamination levels but a large surface area.
The results for low-risk areas are presented in
Figure 2. Both TT and TG protocols reduced total microbial counts to values well below the reference limit of 5 CFU/cm
2.
The GREEN protocol showed a more homogeneous reduction pattern, with a lower variability between sampling points. This suggests an improved consistency in cleaning performance, particularly on large horizontal surfaces such as floors and seating areas. No statistically significant differences were observed between protocols in terms of final acceptability, confirming the equivalence in hygienic outcomes for low-risk settings.
3.3.2. Medium-Risk Areas (Yellow Zone)
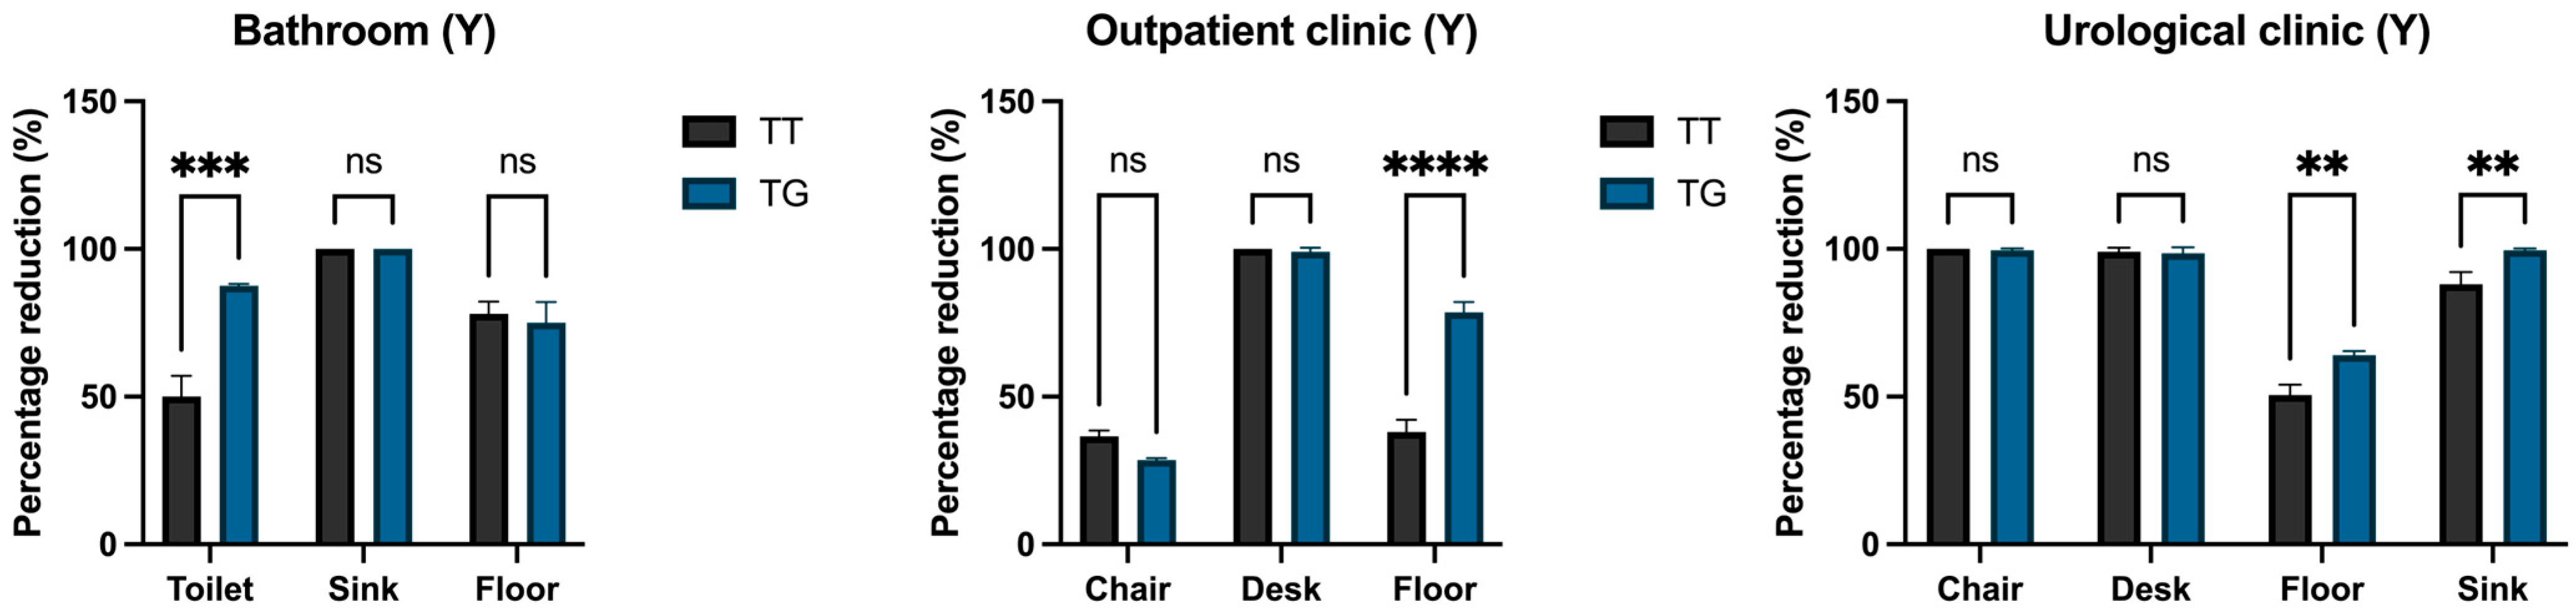
Medium-risk areas are characterized by greater patient interaction and a higher probability of microbial recontamination. For this reason, protocol robustness in these environments is particularly relevant for infection prevention policies.
Figure 3 reports microbial reductions observed in medium-risk areas, including outpatient clinics, patient rooms, and sanitary facilities.
In these environments, both protocols achieved a high percentage of reductions relative to untreated conditions, with post-cleaning values consistently below 2.5 CFU/cm2, the threshold defined for medium-risk healthcare areas. The GREEN protocol demonstrated slightly lower residual contamination on sanitary surfaces and frequently handled fixtures, although the differences did not reach statistical significance for all sampling points.
The results confirm that CAM-compliant cleaning systems can maintain stringent hygienic standards even in environments characterized by an increased microbial pressure and frequent recontamination.
3.3.3. Medium–High-Risk Areas (Orange Zone)
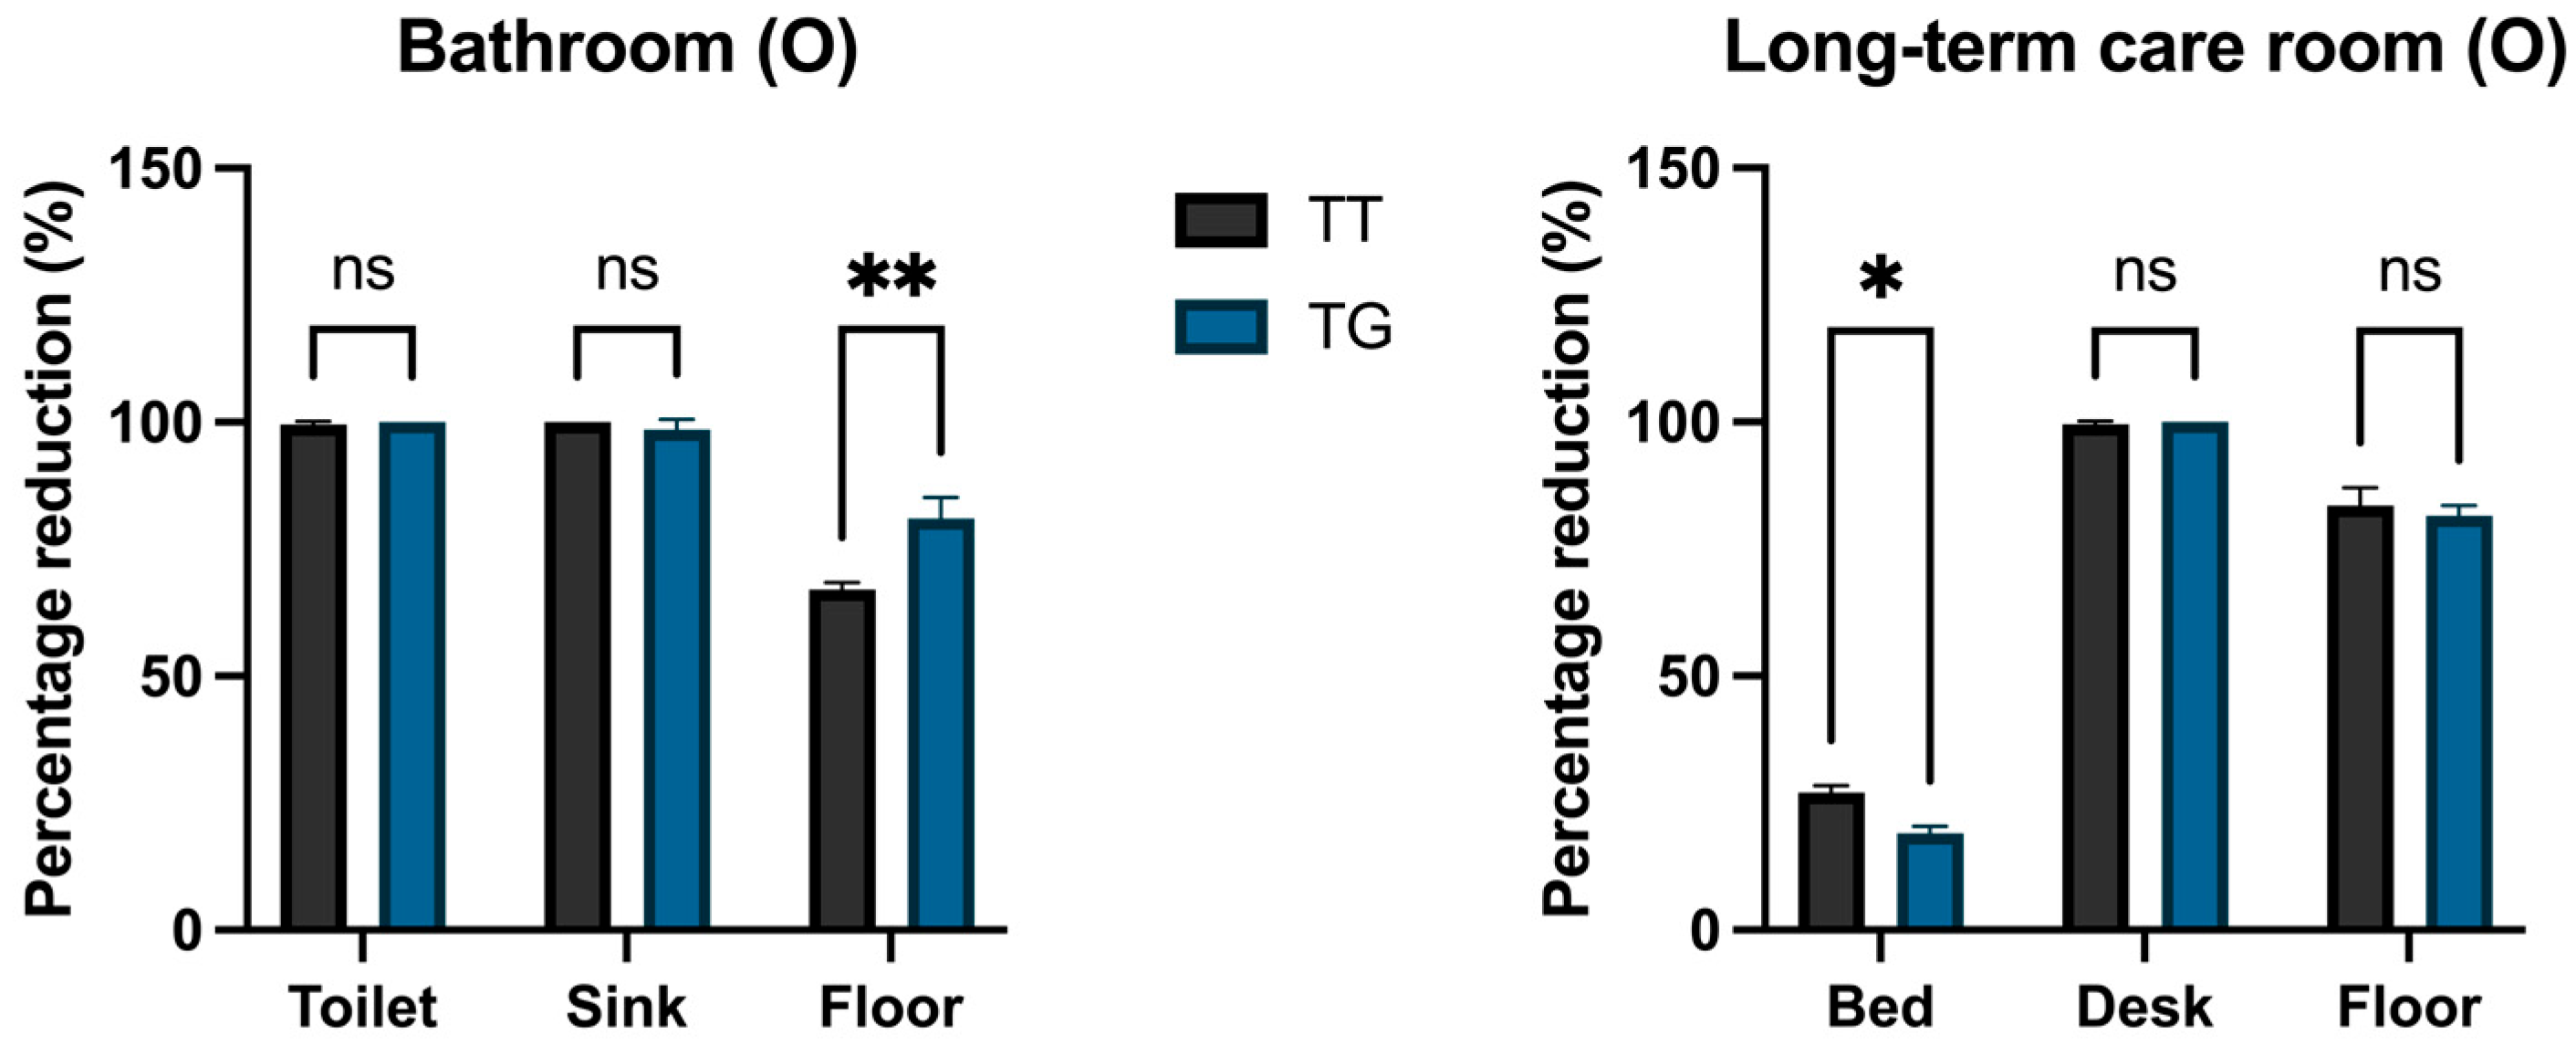
The most critical evaluation concerns medium–high-risk areas, where surfaces are frequently touched and potentially associated with transmission dynamics of healthcare-associated infections. The performance in this category is therefore decisive for clinical safety.
The results for medium–high-risk areas are shown in
Figure 4, focusing on high-touch clinical surfaces such as patient beds, keyboards, and medical furnishings.
Both cleaning protocols achieved residual microbial loads below 2 CFU/cm
2, with a complete absence of
Staphylococcus aureus detected after cleaning. This outcome is particularly relevant, as
S. aureus is widely recognized as an indicator organism for hygiene criticality in healthcare settings [
28].
The GREEN protocol displayed a level of performance fully comparable to the traditional protocol, confirming that the reduced chemical intensity did not lead to residual hygienic risks in critical hospital areas.
3.4. Qualitative Analysis of Residual Microbiota
Beyond the quantitative reduction, a qualitative analysis of the residual microbiota was performed to assess the potential presence of pathogenic indicator organisms.
The selective and differential media analyses revealed that the post-cleaning residual microflora consisted predominantly of environmental and commensal microorganisms, including coagulase-negative staphylococci and ubiquitous Gram-positive bacteria.
No pathogenic indicator organisms (
Escherichia coli,
Pseudomonas aeruginosa,
Candida albicans, and
Aspergillus niger) were detected following either protocol. The absence of these organisms across all sampled areas confirms that both systems ensured adequate microbiological safety under real operational conditions [
29].
The biochemical identification of representative isolates further supported the non-pathogenic nature of the residual microbiota.
3.5. Comparative Life Cycle Assessment Results
3.5.1. Carbon Footprint per Functional Unit
Following a microbiological evaluation, the environmental performance was assessed through Life Cycle Assessment in order to quantify climate-related impacts associated with each cleaning protocol.
Table 1 summarizes the overall climate benefit of the GREEN protocol at the functional-unit, annual site, and five-year contract scales.
The comparative LCA results are presented in
Table 1, which reports the Global Warming Potential (GWP100) per functional unit (1 m
2 cleaned for 1 year).
The GREEN protocol resulted in a 43.7% reduction in carbon footprint compared to the traditional protocol, corresponding to an avoided emission of 273 g CO2e per m2·year. This difference reflects cumulative savings across upstream, core, and downstream processes.
3.5.2. Carbon Footprint at Facility Scale
To contextualize these unit-based results within a real healthcare infrastructure, the impacts were scaled to the total cleaned surface area of the hospital.
When the results were scaled to the entire Bufalini Hospital cleaning area (48,867.17 m2), the GREEN protocol enabled an annual reduction of 13,328.9 kg CO2e.
Over the duration of a standard five-year service contract, this corresponds to an avoided emission of 66.6 t CO2e, highlighting the strategic relevance of cleaning services in hospital decarbonization pathways.
All reported environmental results are derived from the defined functional unit and system boundaries described in the methodology section, ensuring consistency between the inventory data, impact assessment, and final indicators. This direct linkage allows for a transparent interpretation of the results and supports the reproducibility of the analytical approach in comparable operational contexts.
3.6. Contribution Analysis by Process Category
To identify the main drivers of environmental impact and the origin of emission reductions, a contribution analysis by life-cycle stage was performed.
Table 2 identifies the process categories responsible for the observed reduction in GWP.
Table 2 shows a comparison between the emissions due to individual aspects of the cleaning service for the two protocols. The largest reductions were associated with energy consumption, laundry chemicals, and cleaning chemicals, whereas textile equipment showed a limited increase.
For the GREEN protocol, the dominant contributors to total GWP were thermal energy and electricity consumption for textile laundering, and the production of laundry chemicals. Compared with the traditional protocol, substantial reductions were observed in laundry chemical production (−60.4%), cleaning chemical production (−71.2%), and overall energy consumption (−34.9%). An increase was instead observed for textile production and end-of-life (+47.1%), attributable to the higher number of reusable microfiber textiles employed. However, this contribution remained marginal relative to the total system impacts and did not offset the overall environmental benefits.
3.7. Integrated Environmental Performance Indicators
In addition to the carbon footprint, complementary environmental indicators were analyzed to provide a broader sustainability profile of the two protocols.
Table 3 provides complementary environmental indicators to support the interpretation beyond the carbon footprint alone.
Table 3 summarizes additional environmental indicators, including water consumption, waste generation, and CAM compliance.
The GREEN protocol demonstrated a reduction in chemical consumption (−74.6%), lower water use (−31.4%), and a substantial decrease in differentiated waste generation (−78.6%), together with an increased compliance with CAM requirements. The only unfavorable indicator was the increase in undifferentiated textile waste, consistent with the higher number of reusable textiles; however, its contribution to the total environmental impact remained limited.
3.8. Summary of Key Results
Overall, the results show that the GREEN protocol (i) achieved microbiological performance comparable to the traditional protocol across all risk areas; (ii) maintained post-cleaning values below reference hygienic thresholds; (iii) showed no detection of selected pathogenic indicator organisms after cleaning; and (iv) reduced GWP by 43.7%, mainly through lower chemical use and energy savings. These findings support the feasibility of integrating microbiological safety and environmental sustainability in hospital cleaning services under real operational conditions.
4. Discussion
4.1. Principal Findings—Integrative Overview
This study provides an integrated, site-specific comparison of a CAM-compliant GREEN cleaning protocol and a conventional Traditional protocol, combining standardized microbiological monitoring with a cradle-to-grave Life Cycle Assessment (LCA).
In short, (i) the GREEN protocol delivered microbiological outcomes equivalent or superior to the traditional system across low-, medium- and medium–high-risk areas (with the absence of pathogenic indicators such as S. aureus after cleaning); and (ii) the GREEN protocol produced a substantial environmental benefit, with a 43.7% reduction in GWP (−273 g CO2e per m2·yr; −13,328.9 kg CO2e/yr for the Bufalini Hospital pilot area) compared to the conventional protocol.
Taken together, these findings demonstrate that environmental optimization and infection prevention objectives are not mutually exclusive and can be achieved simultaneously through process redesign and life-cycle-informed decision-making. It should be noted that this study adopts an applied Life Cycle Assessment approach integrated with microbiological monitoring, with the objective of supporting real-world decision-making rather than developing a new LCA methodology. Within this framework, emphasis is placed on the consistency, comparability, and operational relevance of the results. This conclusion is supported by site-specific microbiological monitoring and a cradle-to-grave LCA framework applied to a real hospital setting.
4.2. Microbiological Assessment—What the Data Say and Why It Matters
The microbiological results are central to evaluating whether sustainability-oriented cleaning can maintain clinical safety standards.
The microbiological monitoring protocol, RODAC plates for flat surfaces, swabs with neutralizers for complex geometries, and the use of TSA/MSA/MCA/SDA media follow national/international practice for surface hygiene assessment and aligns with the laboratory plan used in the study. The post-treatment counts for both TT and TG were consistently below the acceptability thresholds defined by INAIL/ANMDO for the three risk classes, and no pathogenic indicators were recovered after cleaning operations. These findings indicate that, under real operational conditions, a protocol designed for an reduced environmental impact can maintain the hygienic safety required in healthcare contexts [
19,
21,
22].
Mechanistically, the equivalence (or modest superiority) of the GREEN protocol can be explained by a combination of factors documented in the field data: optimized dosing, the use of high-performance microfiber textiles (increasing mechanical removal efficiency), and standardized application procedures. These elements reduce the reliance on high concentrations of chemical actives while still achieving the effective physical removal and disruption of surface microbial communities, consistent with other recent empirical studies that highlight the role of microfiber systems and optimized protocols in reducing microbial loads without escalating chemical use [
10,
30].
Importantly, the qualitative composition of residual flora (mainly environmental/commensal species) and the absence of critical pathogens after cleaning reduce the immediate infection risk and support the safety of reduced-intensity chemical approaches in routine hospital cleaning. These results should not be interpreted as a simple reduction effect, but rather as the outcome of a combination of optimized operational parameters, including improved mechanical removal efficiency, standardized procedures, and controlled dosing strategies. This highlights that cleaning effectiveness depends on process design rather than solely on chemical intensity.
From an Infection Prevention and Control (IPC) perspective, this suggests that sustainability-driven reductions in chemical intensity do not inherently translate into increased microbiological risk, provided that mechanical efficacy and procedural standardization are ensured.
This is relevant for IPC teams because substituting aggressive, high-dose disinfection with optimized procedures can lower occupational exposure for staff and reduce the selective pressure potentially linked to AMR emergence on surfaces.
4.3. Life Cycle Assessment and CO2 Emission Findings—Drivers and Interpretation
Beyond microbiological safety, the environmental dimension provides quantitative evidence of the decarbonization potential embedded in routine cleaning services.
The LCA, implemented in accordance with ISO 14040, ISO 14044 and ISO 14067 principles and the applicable PCR for professional cleaning services, shows that the GREEN protocol reduces the carbon footprint primarily through two levers: (1) the lower consumption of cleaning chemicals, through the use of concentrated formulations and dosing systems, which, together, decrease the upstream production impacts and in-service energy demand [
8]; (2) the lower energy consumption, through a reduction in laundering temperature from 60 °C to 40 °C. These methodological choices and data sources are described in the LCA report and the protocol inventory.
Quantitatively, the avoidance of ~273 g CO2e·m−2·yr−1 (13.3 t CO2e·yr−1 at facility scale) is significant when aggregated across hospital portfolios and multi-year contracts.
Because cleaning activities are recurrent and structurally embedded in hospital operations, even moderate per-unit emission reductions generate a substantial cumulative mitigation potential at the institutional and regional healthcare system level [
7].
Energy savings in laundry operations emerge as a dominant single contributor to avoided emissions (the change from 60 °C to 40 °C has outsized effects because thermal energy for water heating is carbon-intensive). This is consistent with recent life cycle assessments of hospital laundry services, which identify thermal energy use as a primary carbon hotspot in healthcare support operations [
8].
Similarly, reductions in the production phase of laundry and cleaning chemicals explained a large share of the GWP savings, consistent with other LCAs of cleaning services, which identify chemical production and thermal laundry energy as key contributors to overall impacts [
8].
An observed trade-off is the increase in textile-related impacts under the GREEN protocol (a greater contribution from the production and end-of-life stages of reusable textiles). In our study, this was driven by the higher rate of reconditioning/turnover of microfiber elements in the GREEN workflow during the monitoring window; however, at a system level, this increase was small relative to the avoided emissions from energy and chemicals.
This shift illustrates a classic life-cycle burden redistribution effect, emphasizing the importance of a whole-system assessment rather than single-stage optimization. Process-based LCAs of hospital inpatient care likewise highlight the need to evaluate environmental impacts across multiple life-cycle stages when designing mitigation strategies in healthcare systems [
31]. This result highlights that sustainability cannot be interpreted solely as a reduction in resource consumption, but must be evaluated within a system-wide perspective, where improvements in one stage may lead to compensatory increases in another. Therefore, the overall environmental benefit observed for the GREEN protocol reflects a net balance of multiple interacting processes rather than a single reduction mechanism.
4.4. Comparison with the Literature and Previous LCA Studies
Environmental assessments of healthcare support services consistently identify energy use and chemical production as primary drivers of environmental impact, with interventions targeting laundering conditions and product optimization yielding the most significant reductions [
7,
8]. The present results are in line with this evidence, confirming that process-level optimization strategies can deliver substantial GWP reductions even in complex operational settings such as hospitals.
Similarly, empirical studies of microbiological performance indicate that optimized application procedures and high-performance microfiber systems can maintain or improve surface cleanliness while reducing chemical intensity. Our data confirm the comparable microbiological safety for the GREEN system in a high-demand hospital setting [
32,
33].
Whereas prior research has often relied on laboratory-based or simulated scenarios, the present study provides operational, site-specific evidence integrating microbiological monitoring with a life cycle assessment, thereby reinforcing the practical relevance of sustainability-oriented cleaning strategies for healthcare procurement and facility management. It should be noted that LCA studies specifically focused on professional cleaning services in healthcare environments remain limited, which constrains a direct comparison; however, the consistency of the identified impact drivers supports the robustness and generalizability of the observed trends.
4.5. Relevance to CAM, SDGs, and Procurement Policy
The policy implications of these findings are particularly relevant in the context of mandatory environmental criteria in public procurement.
The Italian Minimum Environmental Criteria (CAM) explicitly require demonstrable environmental advantages and equivalent (or superior) service quality for green cleaning services in public procurement. The integrated microbiological + LCA evidence presented here directly satisfies that dual requirement: the GREEN protocol met microbiological acceptability thresholds (safety) while achieving measurable life-cycle environmental benefits (lower GWP, and reduced chemical and water consumption). Accordingly, the results provide a robust, evidence-based case for awarding CAM-compliant cleaning services in healthcare tenders.
At the policy level, translating these operational improvements into procurement criteria contributes to multiple SDGs: SDG 3 (by maintaining patient safety and reducing occupational exposure), SDG 12 (by improving resource efficiency and responsible consumption), and SDG 13 (by reducing GHG emissions). Quantifying avoided CO2 emissions at the facility scale facilitates reporting and target setting in hospital sustainability programs and helps public authorities evaluate the climate co-benefits of CAM adoption.
4.6. Limitations and Uncertainties
Despite the robustness of the integrated study design, several limitations should be acknowledged to appropriately contextualize the interpretation of the results. First, the temporal scope of field sampling was limited to two five-week monitoring windows per protocol. Although representative of routine operational conditions, these periods provide only finite snapshots of performance, and seasonal variability or outbreak situations could influence both baseline contamination and recontamination dynamics.
Second, the LCA included primary, site-specific data for core processes but relied on secondary CFP and EPD datasets for certain upstream stages, in accordance with the PCR guidance. Assumptions regarding the transport distances, packaging composition, and electricity mix may therefore affect quantitative outcomes; sensitivity analyses would further strengthen decision-making in different geographic contexts.
Third, textile life-cycle modelling proved sensitive to assumptions about the textile lifetime, reconditioning frequency, and end-of-life scenarios. The more detailed long-term monitoring of textile durability under real operational conditions would reduce associated uncertainty.
Finally, the microbiological assessment relied on culture-based surface sampling methods (RODAC and swabs), which detect only culturable organisms and may not fully capture viable but non-culturable populations or biofilm-associated communities. The integration of molecular or biofilm-targeted approaches would provide a more comprehensive understanding of microbiota dynamics under different cleaning protocols.
Notwithstanding these limitations, the study applied best-practice methodologies in both microbiological monitoring and the life cycle assessment and transparently reported underlying assumptions in accordance with ISO standards and PCR requirements.
4.7. Practical Recommendations for Hospital Managers and Procurers
From an operational standpoint, the findings translate into actionable implications for healthcare facility management and public procurement. Based on the integrated evidence from the Bufalini case study, the adoption of CAM-compliant GREEN protocols should be prioritized where feasible, as they can substantially reduce GWP without compromising microbiological performance. Particular attention should be given to laundry optimization strategies, including lower washing temperatures and efficient equipment, which emerged as high-impact interventions for emission reduction.
Furthermore, standardized dosing systems and high-performance microfiber textiles should be implemented to maintain hygienic effectiveness while minimizing chemical use. Life-cycle indicators should also be incorporated into tender evaluation criteria, beyond simple product-based certifications, in order to capture the upstream and operational environmental impacts. Finally, the continuous monitoring of both microbiological indicators and environmental key performance indicators (KPIs) during contract execution is recommended to ensure sustained compliance with health protection and sustainability objectives.
4.8. Future Research Avenues
Further research should aim to expand the methodological scope and temporal robustness of integrated microbiology–LCA assessments.
To strengthen the evidence base, future studies should (i) expand temporal coverage (seasonal and multi-year monitoring); (ii) perform sensitivity and scenario analyses on electricity mixes, textile lifetimes, and transport assumptions; (iii) include additional impact categories (freshwater ecotoxicity, human toxicity, and water scarcity) to provide a multi-criteria environmental profile; and (iv) combine culture-based sampling with molecular (e.g., qPCR, 16S/shotgun metagenomics) and biofilm assays to capture non-culturable and community-level changes. These steps will refine both operational guidance and policy design.
4.9. Concluding Remarks
In conclusion, the integrated evidence from the Bufalini Hospital case study demonstrates the feasibility of aligning infection prevention practices with climate mitigation objectives.
The integrated Bufalini Hospital study demonstrates that a carefully designed, CAM-compliant GREEN cleaning protocol can deliver robust microbiological safety while substantially reducing life-cycle greenhouse gas emissions. The combined microbiological and LCA evidence supports the inclusion of life-cycle criteria in public procurement and provides actionable levers for laundry temperature, chemical dosing, and textile choice for immediate environmental gains without sacrificing infection-control objectives. These outcomes are directly relevant to hospitals pursuing decarbonization and to policymakers seeking to align health protection with sustainability goals.




 ,
,