Article

Spatial Differentiation Characteristics and Influencing Factors of the Cultural Heritage Activation Level in the Henan Section of the Yellow River Basin


1
School of Human Settlements, North China University of Water Resources and Electric Power, Zhengzhou 450046, China
2
College of Geosciences and Engineering, North China University of Water Resources and Electric Power, Zhengzhou 450046, China
3
Henan Zhixinyingzao Planning and Design Co., Ltd., Zhengzhou 450001, China
4
School of Architecture, Zhengzhou University, Zhengzhou 450001, China
*
Author to whom correspondence should be addressed.
Sustainability 2026, 18(11), 5347; https://doi.org/10.3390/su18115347 (registering DOI)
Submission received: 10 May 2026 / Revised: 21 May 2026 / Accepted: 21 May 2026 / Published: 26 May 2026
(This article belongs to the Special Issue Cultural Heritage Conservation and Sustainable Development)

Abstract

Cultural heritage in major river basins serves as an important spatial carrier of historical civilization evolution, and the spatial differentiation characteristics and influencing factors of its activation level are closely related to heritage conservation, utilization, and sustainable development. This study focuses on the Henan section of the Yellow River Basin and selects 344 cultural heritage sites as the research objects. A comprehensive evaluation system for cultural heritage activation was constructed from three dimensions—culture, society, and economy. By integrating GIS-based spatial analysis with the GWR model, the study reveals the spatial differentiation characteristics of cultural heritage activation levels and their influencing factors. The results indicate that the activation level of cultural heritage exhibits a dual-core-dominated and multi-level spatial agglomeration pattern. Zhengzhou and Luoyang function as dual high-density core clusters with elevated heritage activation levels, while a continuous cultural heritage corridor has gradually formed along Sanmenxia, Luoyang, Zhengzhou, Jiaozuo, Hebi, and Puyang. Furthermore, heritage agglomeration, heritage spatial radiosity, per capita GDP, transportation accessibility, terrain relief, and NDVI on the activation level of cultural heritage demonstrate significant spatial heterogeneity. Based on the identification of spatial heterogeneity, this study proposes a core–corridor–node spatial pattern and a factor-adaptive targeted strategy for cultural heritage activation. These findings provide a scientific basis for differentiated conservation and precise activation of cultural heritage under the national strategy of ecological protection and high-quality development in the Yellow River Basin, while also offering valuable insights for the collaborative governance of cultural heritage in major river basins worldwide.

1. Introduction

Cultural heritage is an important cultural carrier formed throughout the course of human history, embodying social memory, value identity, and the continuity of civilization [1]. The UNESCO has noted that cultural heritage is not only a legacy inherited from the past, but also an integral part of contemporary social life that should be transmitted to future generations [2]. The ICOMOS further emphasizes that cultural heritage reflects the ways of life, as well as the material and spiritual expressions, that communities have passed down across generations [3]. Accordingly, cultural heritage is no longer regarded merely as a static object of preservation; rather, it has gradually evolved into a dynamic space integrating historical, social, and developmental functions, whose conservation and utilization exert profound influences on regional sustainable development [4].
Against the backdrop of increasing emphasis on the activation, adaptive utilization, and sustainable development of cultural heritage, the realization of heritage value has gradually shifted from passive preservation toward living inheritance and dynamic utilization. Through adaptive reuse and functional renewal, cultural heritage can stimulate public activities, promote cultural production, and strengthen community cohesion, thereby facilitating the synergy between cultural continuity and social development through dynamic use [5,6]. As one of the core cradles of Chinese civilization, the Henan section of the Yellow River Basin possesses abundant and densely distributed cultural heritage resources. The conservation and activation of these cultural heritage resources are of irreplaceable strategic significance for preserving the cultural roots of Chinese civilization and strengthening national cultural identity [7]. In recent years, with the ecological protection and high-quality development of the Yellow River Basin being elevated to a major national strategy, together with the continuous advancement of the National Cultural Park initiative, the cultural heritage sector has experienced a conceptual transition from passive preservation to proactive activation. Cultural heritage is no longer regarded merely as a historical relic to be sealed and preserved; rather, it is increasingly recognized as an active resource that should be integrated into contemporary life and contribute to regional development [8,9]. Within this context, how to scientifically evaluate the activation level of cultural heritage, reveal its spatial differentiation characteristics, and identify its key driving factors has become a critical issue that urgently needs to be addressed in studies of cultural heritage activation and regional development.
Activation, as a core concept in heritage studies, refers to a comprehensive process that promotes the transformation of heritage from static preservation toward functional regeneration, value transformation, and community integration. It is widely regarded as a key pathway through which cultural heritage achieves contemporary value conversion and sustainable development [10,11,12]. The quantitative evaluation of cultural heritage activation has gradually evolved from assessing physical preservation conditions to measuring the effectiveness of functional transformation, and from evaluating individual heritage utilization to examining regional collaborative development [13]. Early studies primarily focused on the integrity of heritage conservation and the quality of restoration interventions [14]. In recent years, however, scholarly attention has progressively shifted toward functional dimensions such as economic vitality, cultural influence, and social integration of heritage sites [15], thereby promoting a paradigm transition in evaluation systems from stock-oriented assessment to performance-oriented assessment [16]. With the rapid development of geographic information technologies and multi-source spatial big data, methods for measuring cultural heritage activation levels based on Points of Interest [17], nighttime light data [18], and mobile communication data [19] have become increasingly diversified. These advances have enabled more refined analyses of the spatiotemporal characteristics and spatial structures of cultural heritage activation, while also providing technical support for cross-regional and multi-scalar comparative studies [20].
With regard to influencing factors, existing studies have demonstrated that the distribution and enhancement of cultural heritage activation levels are jointly affected by multiple factors, including locational conditions, socioeconomic development, ecological environment, and heritage resource endowment [21,22,23]. Transportation accessibility, the degree of heritage agglomeration, and the spatial relationship between heritage sites and urban centers play fundamental roles in shaping visitor flows and functional allocation within heritage areas [11,24]. Regional economic development and urbanization processes can, to some extent, promote the activation of cultural heritage; however, excessive commercialization and rapid urban expansion may weaken the expression of cultural connotations, leading to homogenized and superficial patterns of heritage activation and utilization [25,26]. In addition, differences in heritage types and cultural resource endowments are also important determinants of cultural heritage activation levels. Different categories of heritage, such as World Cultural Heritage sites, general protected cultural relic units, traditional villages, and cultural landscapes, exhibit significant differences in both the forms and driving mechanisms of activation and utilization [27,28].
In terms of research methods, spatial analysis and spatial econometric models have become the dominant analytical approaches in studies of cultural heritage activation. Through kernel density analysis [29], spatial autocorrelation analysis [30], and GWR models [31,32], scholars are able to identify the spatial agglomeration characteristics of cultural heritage activation levels and their driving factors. Meanwhile, methods such as geographic detectors have demonstrated strong advantages in revealing the interactive effects of multiple factors, providing new analytical perspectives for understanding the complex mechanisms underlying the spatial differentiation of cultural heritage activation levels [33,34].
Although substantial progress has been made in heritage value assessment, influencing factor analysis, and spatial measurement methods, existing studies have primarily focused on the spatial distribution patterns and value evaluation of heritage resources, mainly addressing where cultural heritage is located and how valuable it is, rather than systematically examining how effectively cultural heritage has been activated and utilized [35,36]. Although some studies have incorporated indicators such as economic vitality and social attention, these indicators are often limited to single dimensions or temporary combinations, and a comprehensive multidimensional evaluation framework integrating cultural dissemination effectiveness, social functional capacity, and economic vitality has yet to be fully established [37]. Moreover, current analyses of the spatial agglomeration patterns of cultural heritage mainly characterize the distribution density of heritage resources themselves, rather than the spatial differentiation characteristics of heritage activation levels [38]. Even in studies that have employed the GWR model to investigate the spatial heterogeneity of influencing factors, the dependent variables have generally been limited to heritage density or distribution probability, rather than indicators reflecting activation effectiveness [39]. Overall, although previous studies have established a solid foundation in the areas of cultural heritage spatial distribution, value assessment, and regional tourism development, a systematic research gap remains regarding the critical issue of cultural heritage activation and utilization.
Accordingly, this study takes the Henan section of the Yellow River Basin as the research area and focuses on 344 cultural heritage sites distributed across 10 prefecture-level cities. A comprehensive quantitative evaluation framework for cultural heritage activation was constructed from three dimensions—culture, society, and economy. By integrating GIS-based spatial analysis methods with the GWR model, this study systematically examines the spatial distribution characteristics and agglomeration patterns of cultural heritage and its activation levels. Furthermore, the study explores the differentiated coupling relationships between cultural heritage activation levels and factors including heritage agglomeration, heritage spatial radiation, transportation accessibility, per capita GDP, terrain relief, and NDVI, thereby providing an in-depth interpretation of their spatially heterogeneous mechanisms. Based on the analytical results of spatial differentiation and driving mechanisms, differentiated strategies for cultural heritage conservation and activation are proposed. This study aims to fill the gap in the quantitative evaluation of cultural heritage activation levels, reveal the spatial differentiation characteristics and driving mechanisms underlying heritage activation, and provide a scientific basis and decision-making reference for the differentiated conservation, targeted activation, and sustainable development of cultural heritage in the Yellow River Basin.

2. Materials and Methods

2.1. Study Area

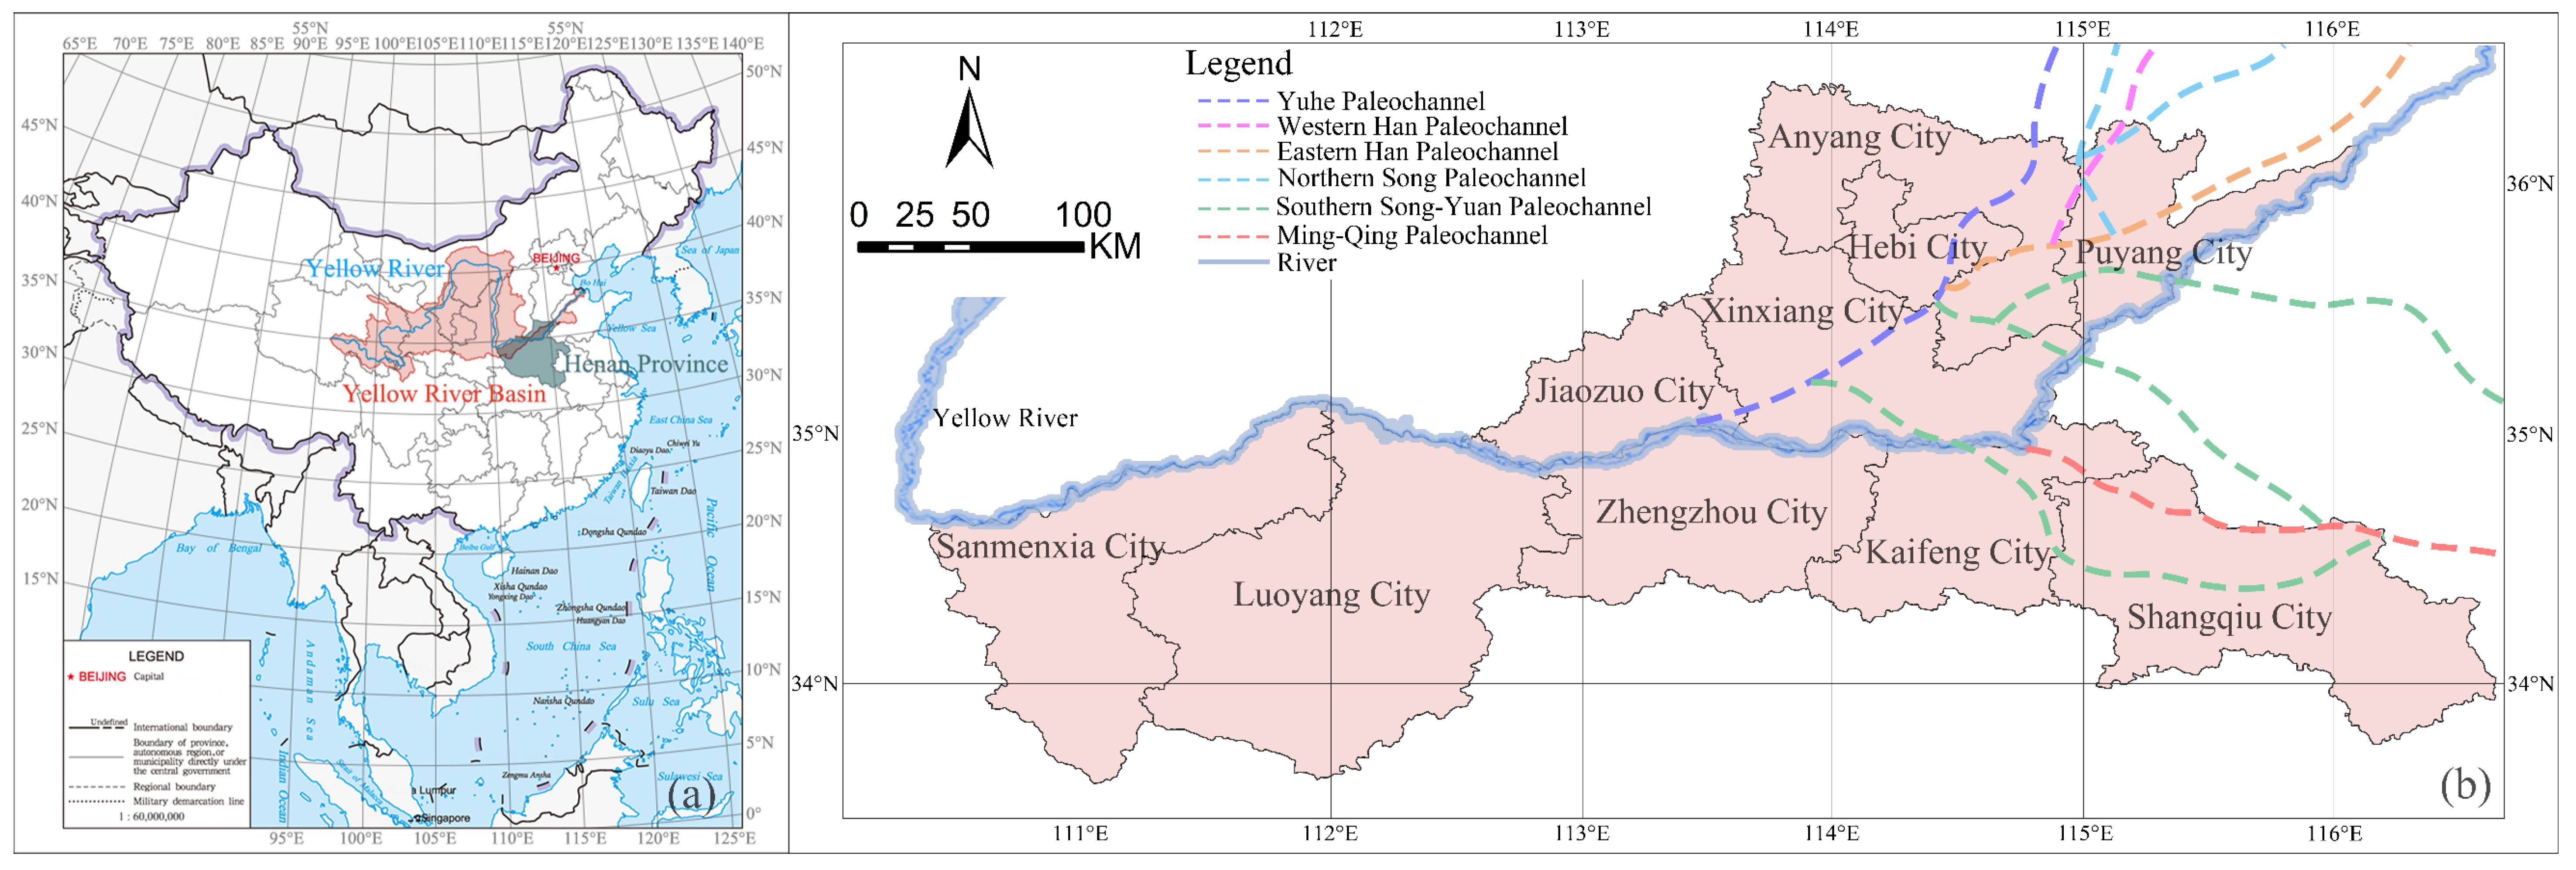
The Henan section of the Yellow River Basin (Figure 1a), as one of the important cradles of Chinese civilization, possesses dense and diverse cultural heritage resources, providing a representative case for investigating the spatial distribution characteristics and influencing factors of cultural heritage activation levels. This study focuses on the Henan section of the Yellow River Basin, covering ten prefecture-level cities, namely Sanmenxia, Luoyang, Zhengzhou, Kaifeng, Shangqiu, Jiaozuo, Xinxiang, Hebi, Anyang, and Puyang (Figure 1b). These cities are located within the transitional zone between the mountainous areas of western Henan and the alluvial plains of the middle and lower reaches of the Yellow River. Distributed along the main stream of the Yellow River and its major tributaries, they constitute one of the core regions nourished by the Yellow River system. Historically, this area served for a long period as a political, economic, and cultural center of China, accumulating profound cultural heritage from the Neolithic period to the Ming and Qing dynasties (1368–1912).

2.2. Data Sources and Indicator Description

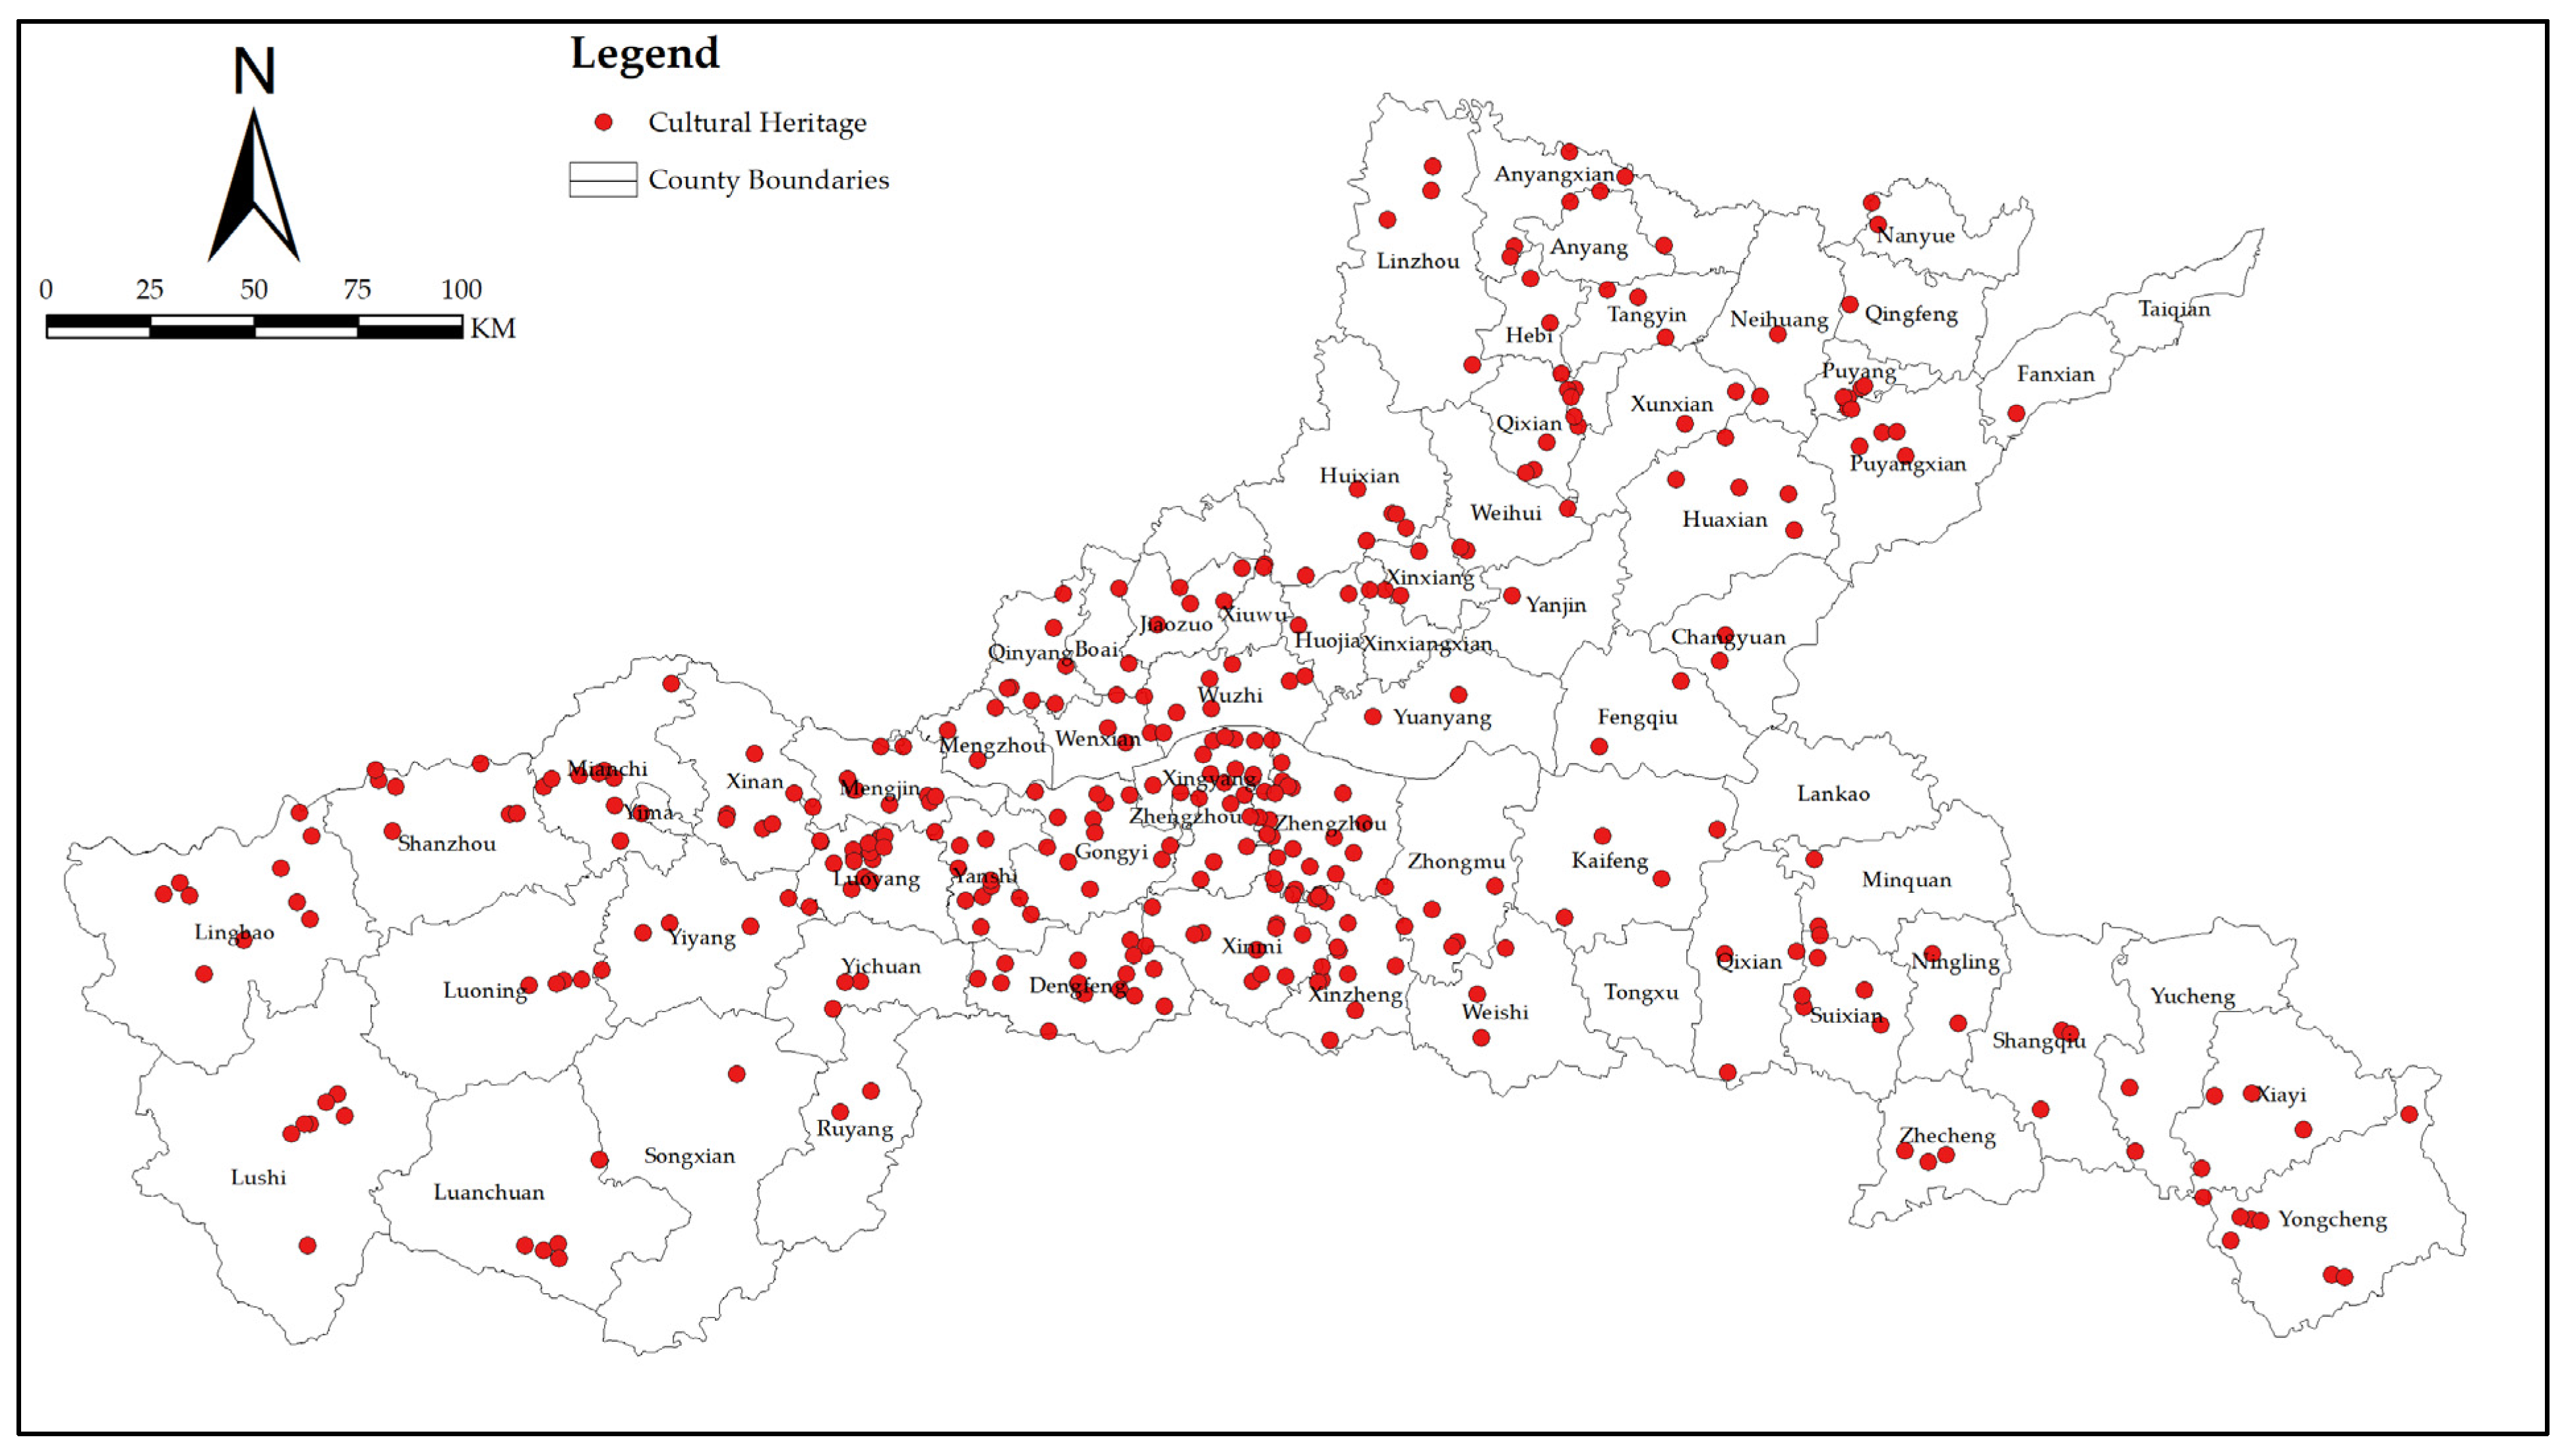
The cultural heritage data used in this study were obtained from the List of Immovable Cultural Relics of the Third National Cultural Relics Census of Henan Province. A total of 344 heritage sites were selected, including National Key Cultural Relics Protection Units and Henan Provincial Cultural Relics Protection Units belonging to the category of archeological and historical sites (Figure 2). The dataset includes information on the historical period, site area, geographic coordinates, and location attributes.
Cultural heritage activation level is a comprehensive concept used to evaluate the continuity of heritage value, functional transformation, and the degree of public participation in contemporary society [11,12]. To establish a scientific and quantifiable evaluation framework, this study constructs an indicator system from three dimensions—cultural, social, and economic—and selects seven specific indicators to characterize the activation level of cultural heritage.
The cultural dimension focuses on the expression of intrinsic cultural value and the capacity for cultural dissemination. Academic influence reflects the degree of scholarly attention devoted to a specific heritage site and measures the recognition and continuity of its cultural value within the field of knowledge production through bibliometric analysis. The density of cultural exhibition facilities evaluates the abundance of surrounding facilities such as museums, exhibition halls, and cultural centers. As important carriers of cultural interpretation and public education, a higher density of such facilities indicates a stronger capacity for cultural presentation and dissemination. The social dimension emphasizes public awareness, participation, and experiential engagement with cultural heritage. Three indicators were selected: online attention, visit activity, and the density of supporting public service facilities. Online attention, based on search data such as the Baidu Index, reflects the level of public interest in cultural heritage on digital platforms and serves as a direct representation of public attention within digital footprints. Visit activity is derived from user comment data on social media platforms, such as Xiaohongshu, Weibo, and is comprehensively estimated using the number of comments, the number of unique users, and interaction volume, thereby reflecting the offline attractiveness of heritage sites and the intensity of visitor engagement. The density of supporting public service facilities—including stations, toilets, visitor centers, and parking lots—measures the level of supporting services provided to satisfy visitors’ basic needs. More comprehensive facilities generally indicate a higher level of heritage activation. The economic dimension evaluates cultural heritage activation from the perspectives of economic vitality and commercial transformation. Two indicators were selected: the nighttime light index and the density of cultural tourism commercial service facilities. As an objective remote sensing proxy for regional economic activity, the nighttime light index reflects the consumption intensity and nighttime prosperity surrounding heritage sites, thereby indirectly representing the economic effects generated by heritage activation. The density of cultural tourism commercial service facilities focuses on the concentration of tourism-oriented commercial activities, such as travel agencies, souvenir shops, homestays, and cultural and creative stores, and directly measures the economic transformation capacity and market responsiveness of heritage activation.
After standardizing the above indicators using the min–max normalization method, the Analytic Hierarchy Process was employed to assign weights to each indicator. A comprehensive cultural heritage activation index was then constructed through weighted aggregation, with higher values indicating higher levels of cultural heritage activation. The specific definitions, original data sources, and processing methods of the above indicators are presented in Table 1.
To systematically investigate the driving mechanisms underlying the activation level of cultural heritage in the Henan section of the Yellow River Basin, this study constructs a comprehensive influencing factor framework encompassing heritage resource endowment, socioeconomic conditions, and the natural geographical foundation, based on the human–land relationship coupling theory and the sustainable development framework of cultural heritage. At the level of heritage resource endowment, heritage agglomeration and heritage spatial radiation were introduced to characterize the spatial clustering effects of heritage resources and their service radiation capacity. At the socioeconomic level, transportation accessibility measures the convenience of external connections to heritage sites, which directly affects visitor willingness and development potential, while per capita GDP represents the regional economic development level and reflects the supporting role of local consumption capacity in heritage activation. At the natural geographical level, terrain relief characterizes the degree of surface elevation variation, thereby constraining the accessibility of cultural heritage sites and the difficulty of development and construction activities. NDVI reflects vegetation coverage and ecological environmental conditions and can indirectly represent the intensity of ecological protection and environmental constraints surrounding heritage sites. The specific definitions, original data sources, and processing methods of the above indicators are presented in Table 2.

2.3. Research Framework

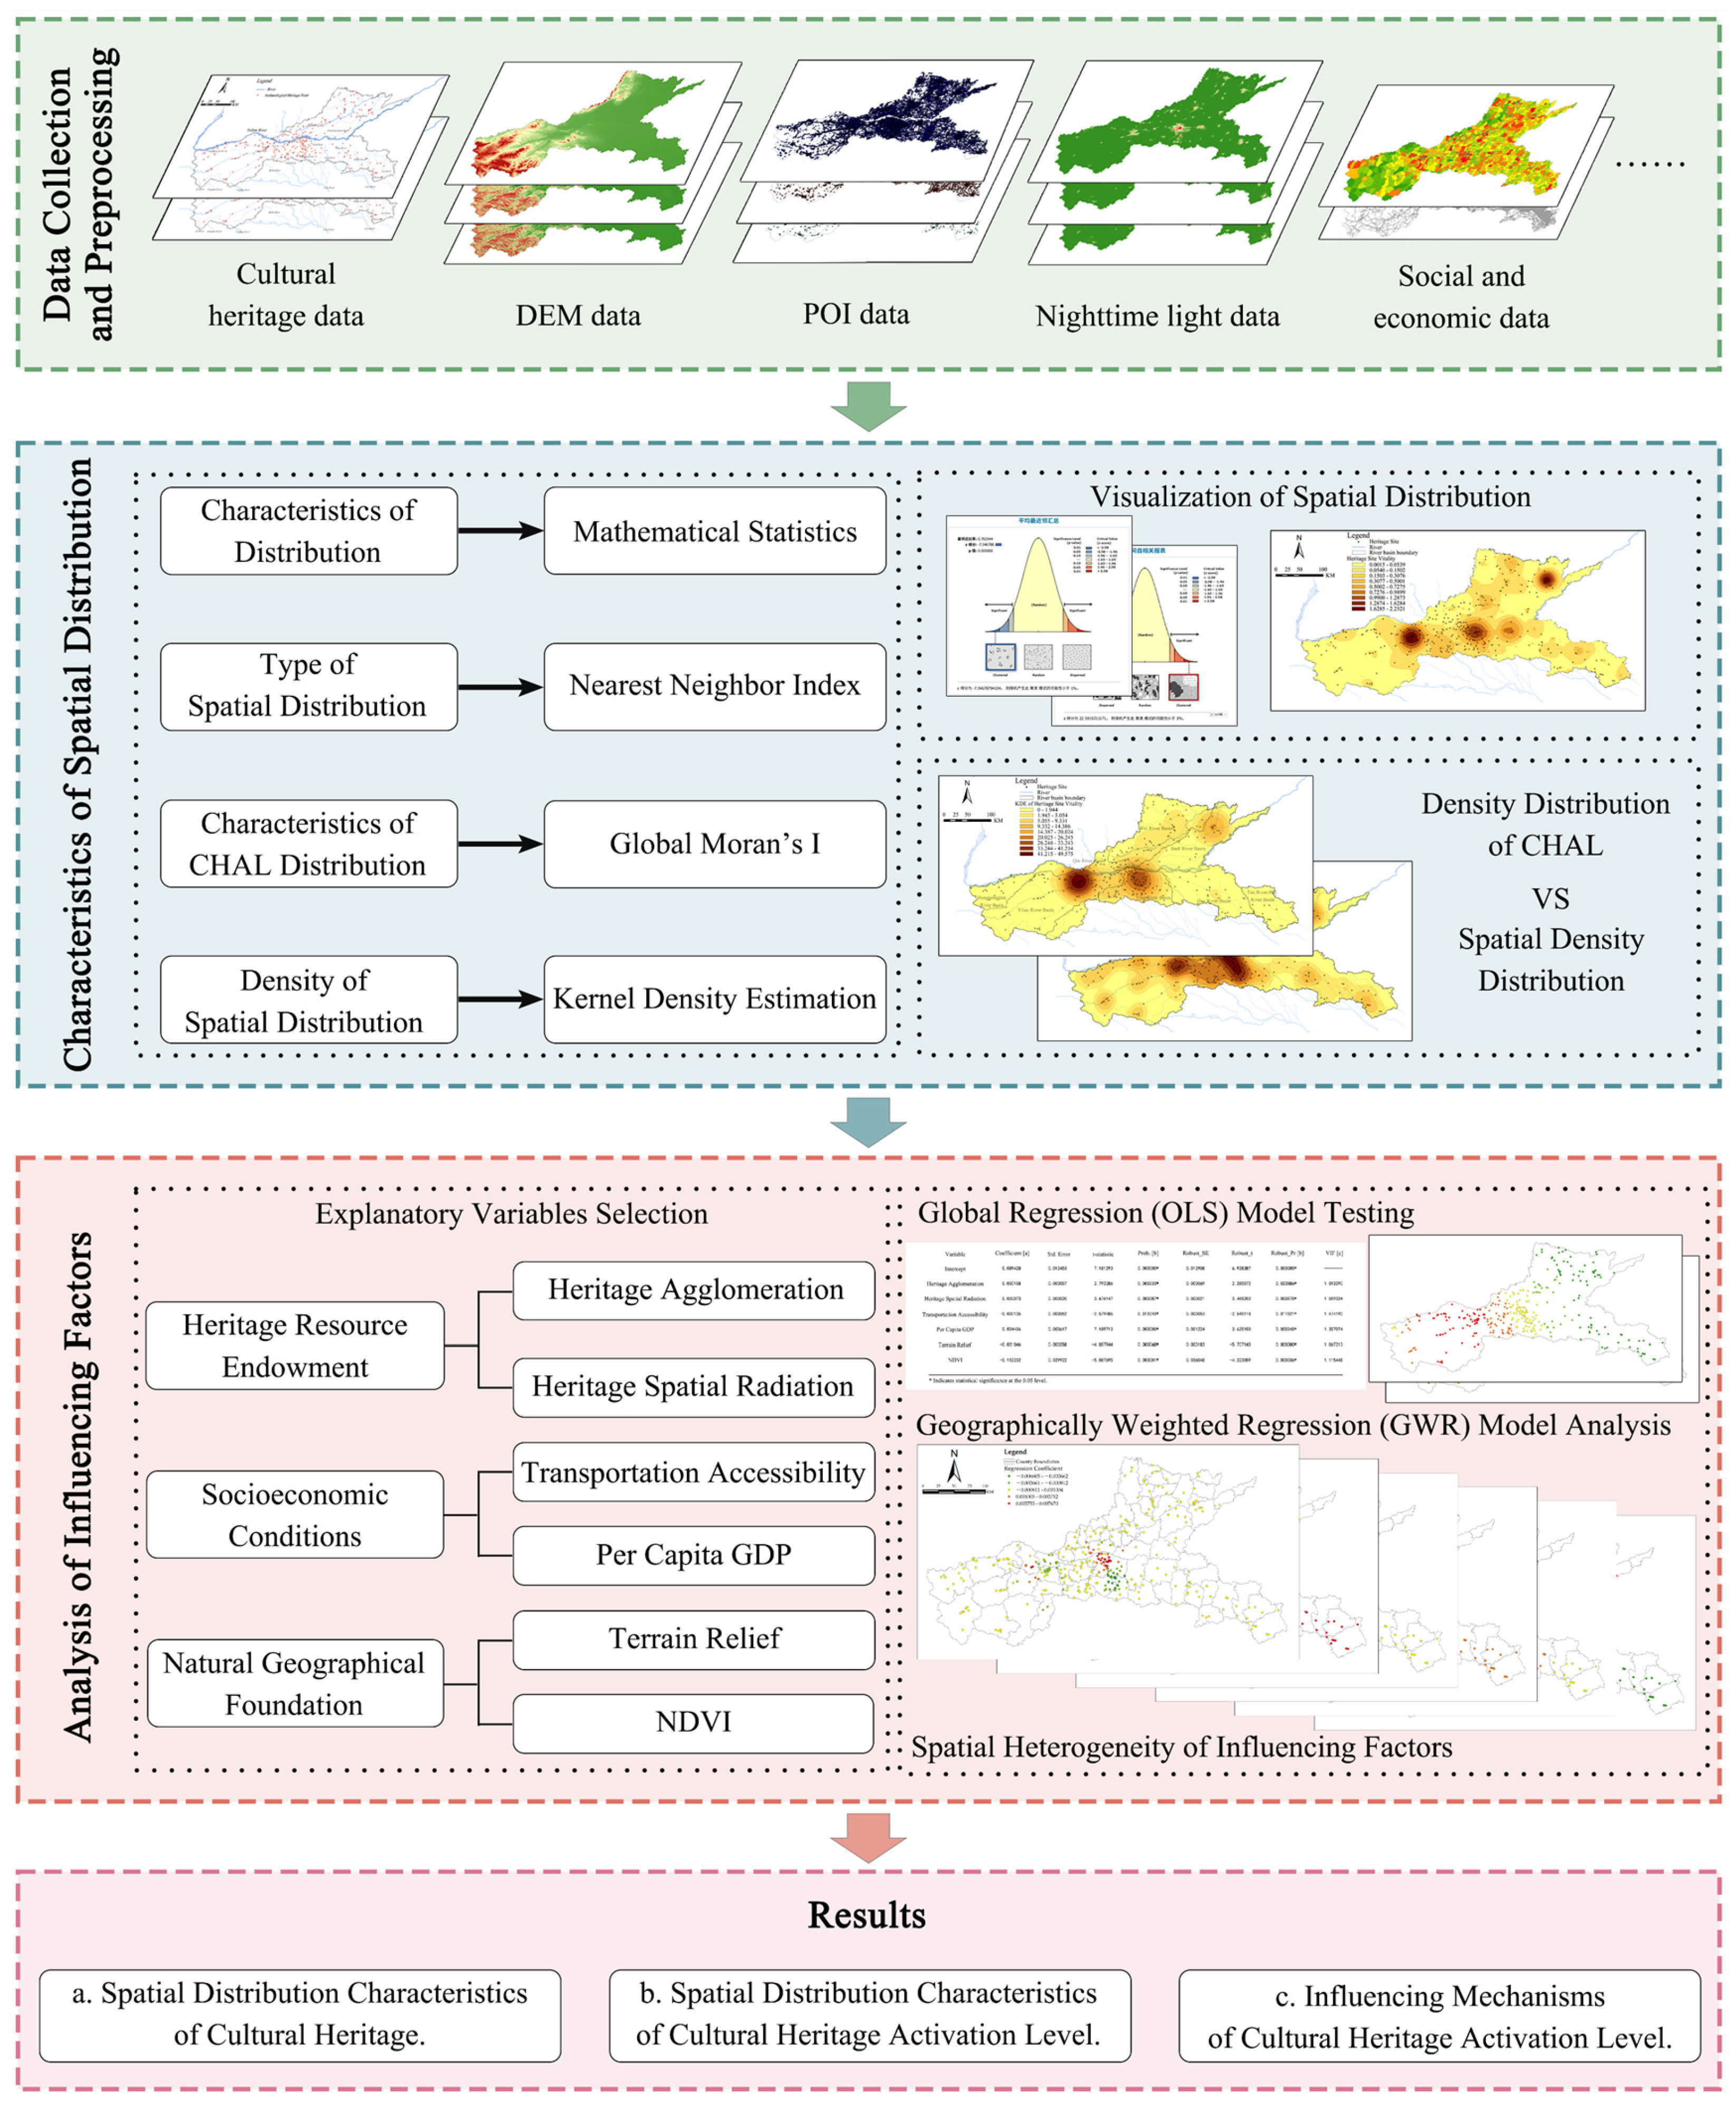
The research process consists of four main stages: (a) data collection and processing; (b) analysis of the spatial distribution characteristics of cultural heritage and its activation levels; (c) analysis of the influencing factors of cultural heritage activation levels; and (d) presentation of the research findings. The detailed research framework is illustrated in Figure 3.

2.4. Research Methods

2.4.1. Average Nearest Neighbor

The ANN is a distance-based spatial point pattern statistical technique that determines the overall spatial distribution type of point features—whether clustered, random, or dispersed—by comparing the observed distances between all points and their nearest neighbors with the expected distances under a random distribution [53]. This study employs the ANN method to identify the overall spatial distribution pattern of cultural heritage sites, thereby providing a comparative basis for subsequent spatial autocorrelation analysis [54]. The calculation formula is as follows:
D ¯ O = i = 1 n d i n
D ¯ E = 0.5 n / S
A N N = D ¯ O D ¯ E
where ANN is the Average Nearest Neighbor index, D ¯ O is the observed mean distance, d i is the distance from the i -th site to its nearest neighboring site, n is the total number of sites, D ¯ E is the expected mean distance, S is the total area of the study region.
Z = D ¯ O D ¯ E S E
S E = 0.26136 n 2 / S
To ensure the scientific validity of the analysis results, a statistical significance test must be conducted. The Z-score represents the number of standard deviations by which the observed value differs from the expected value. When Z < −1.96 (corresponding to a 95% confidence level), the distribution is considered significantly clustered; when Z > 1.96, it is considered significantly dispersed; and when −1.96 ≤ Z ≤ 1.96, the distribution is regarded as random.

2.4.2. Spatial Autocorrelation Analysis

Spatial autocorrelation analysis is used to quantify the degree of spatial dependence among attribute values of geographic features. The global Moran’s I index effectively determines whether observed values exhibit a clustered, dispersed, or random pattern across the entire study area [55]. This study employs the Global Moran’s I index to examine whether the activation level of cultural heritage in the Henan section of the Yellow River Basin exhibits significant spatial agglomeration characteristics. The calculation formula is as follows:
I = n i = 1 n j = 1 n ω i j × i = 1 n j = 1 n ω i j ( x i x ¯ ) ( x j x ¯ ) i = 1 n ( x i x ¯ ) 2
where n represents the number of cultural heritage sites; x i and x j represent the activation levels of cultural heritage sites i and j, respectively; x ¯ denotes the mean activation level of all cultural heritage sites; and ω i j represents the element of the spatial weight matrix used to define the spatial adjacency relationship between cultural heritage sites i and j. The value of Moran’s I generally ranges from –1 to 1, where positive values indicate positive spatial correlation (clustering), negative values indicate negative spatial correlation (dispersion), and values near 0 suggest a random spatial distribution.

2.4.3. Kernel Density Estimation

KDE is a typical non-parametric spatial smoothing technique that can visually reveal the degree of clustering and dispersion of cultural heritage sites in space through a continuous probability density surface [56]. This study employs the Kernel Density Estimation (KDE) method to further investigate the spatial distribution characteristics of cultural heritage and its activation levels, with the aim of identifying high-density agglomeration areas and revealing the structural characteristics of cultural heritage activation levels [57]. The calculation formula is as follows:
f ( x ) = 1 n h 2 i = 1 n K ( d i h )
where n is the total number of cultural heritage sites in the study area; h is the bandwidth, a key parameter that determines the smoothness of the kernel density surface; K is the quadratic kernel function; and d i is the Euclidean distance from the i-th cultural heritage site to the geometric center.

2.4.4. Ordinary Least Squares

OLS is a classical global regression technique that assumes the relationship between explanatory variables and the dependent variable is constant across the entire study area (i.e., spatial stationarity) and estimates model parameters by minimizing the sum of squared residuals [58]. In this study, OLS is first employed to construct a global linear regression model to examine whether severe multicollinearity exists among variables and to assess the spatial autocorrelation characteristics of residuals. This helps determine the presence of significant spatial non-stationarity and evaluate whether the model is suitable for GWR [59]. The calculation formula is as follows:
Y i = β 0 + β 1 X i 1 + β 2 X i 2 + + β k X i k + ε i
m i n i = 1 n ( Y i Y ^ i ) 2 = m i n i = 1 n ε i 2
where Y i represents the observed activation level of cultural heritage sites in the i-th spatial unit; β 0 is the global intercept, indicating the baseline level of the dependent variable when all explanatory variables are zero; β 1 ,   β 2 , ,   β k are the coefficients corresponding to the k explanatory variables; X i 1 ,   X i 2 , …,   X i k are the observed values of the explanatory variables in the i-th spatial unit; ε i is the random error term, assumed to have a mean of zero and constant variance; and Y ^ i denotes the predicted value from the model.

2.4.5. Geographically Weighted Regression

GWR is an advanced local spatial regression technique that acknowledges that the relationships between variables may vary across geographic locations (i.e., spatial non-stationarity) and models this complexity by estimating separate regression equations for each observation point [60]. In this study, the GWR model is employed to reveal the spatial heterogeneity in the driving mechanisms of cultural heritage activation level, providing precise spatial decision support for formulating differentiated heritage conservation and sustainable use strategies [61]. The calculation formula is as follows:
Y i = β 0 ( μ i , ν i ) + k = 1 n β k ( μ i , ν i ) X i k + ε i
where Y i represents the observed activation level of cultural heritage sites in the i-th spatial unit; ( μ i , ν i ) are the geographic coordinates of the i-th spatial unit; β 0 ( μ i , ν i ) is the local intercept at the i-th unit; β k ( μ i , ν i ) is the local regression coefficient of the k-th explanatory variable at the location of the i-th unit; and ε i is the random error term.

3. Results

3.1. Spatial Distribution Characteristics of Cultural Heritage

3.1.1. Distribution Characteristics

The 344 cultural heritage sites selected for this study are distributed across 10 prefecture-level cities in the study area. Table 3 presents the site counts for each city and reveals pronounced spatial differences.
Zhengzhou has the largest number, with 103 sites, accounting for 29.94% of the total. Luoyang follows with 65 sites (18.90%). Together, these two cities account for nearly half of all sites, forming the core agglomeration of cultural heritage in the study region. Sanmenxia and Jiaozuo each have 33 sites (9.59%), ranking third. The remaining six cities contain relatively small numbers.

3.1.2. Spatial Distribution Patterns

This study applied the Average Nearest Neighbor (ANN) analysis to the 344 sites. The results are shown in Table 4.
The observed mean nearest neighbor distance is 5868.62 m. The expected distance under a random distribution is 7401.05 m. The nearest neighbor index is 0.79, indicating that the actual mean distance is considerably smaller than expected. The z-score is −7.347, and the p-value is <0.01, meaning the probability of such a clustered pattern occurring by chance is less than 1%. This demonstrates an extremely significant clustered distribution of cultural heritage in the Henan section.
To further examine within-city patterns, ANN analysis was performed for each city. The results are summarized in Table 5.
The results show marked regional differentiation. The distributions in Zhengzhou, Luoyang, and Sanmenxia all exhibit significant clustering at the p < 0.01 level. In contrast, the results for Jiaozuo, Shangqiu, Xinxiang, Anyang, Puyang, and Hebi do not pass the significance test (p > 0.10). This indicates that their distributions do not differ significantly from a random pattern, showing neither clear clustering nor dispersion. Notably, Kaifeng displays a significant dispersed distribution (z = 3.65, >0), which is also highly significant at the p < 0.01 level.

3.1.3. Spatial Distribution Density of Cultural Heritage

To accurately identify agglomeration areas of cultural heritage in the Henan section of the Yellow River Basin, kernel density estimation was performed using ArcMap 10.8. The results are shown in Figure 4.
The results reveal an uneven, multi-level agglomeration pattern with pronounced clustering and corridor features. Zhengzhou and Luoyang form two high-density heritage agglomeration areas, with the Zhengzhou cluster exhibiting a high-density, large-scale distribution. Surrounding these two cores, heritage density displays a hierarchical structure that progressively declines toward the periphery. Meanwhile, high-density areas clearly align along Sanmenxia, Luoyang, Zhengzhou, Jiaozuo, Hebi, and Puyang, forming a distinct high-density cultural heritage corridor.

3.2. Spatial Distribution Characteristics of Cultural Heritage Activation Level

3.2.1. Characteristics of Activation Level

The statistical summary of activation levels by city is presented in Table 6.
Regarding the mean activation level, Luoyang ranks the highest, with an average of 0.0965 and a maximum value reaching 0.3997. This indicates not only a high overall activation level but also the presence of multiple exceptionally well-revitalized heritage sites. Zhengzhou and Puyang follow, with mean values of 0.0792 and 0.0789, respectively, showing relatively good activation levels. The remaining cities all have mean values below the overall average of 0.0671, with Kaifeng recording the lowest average (0.0354), indicating that the overall activation in these cities is relatively low.
The degree of internal variation also differs markedly among cities. Although Zhengzhou has a high average value, the gap between its maximum and minimum activation levels is extremely wide, revealing the coexistence of highly revitalized core heritage sites and a large number of low-activation sites within the city—a sign of pronounced internal heterogeneity. In cities such as Kaifeng, Jiaozuo, and Shangqiu, the maximum values are themselves relatively low, and the minimum values remain generally low. The overall distribution is more homogeneous but at a low level. Notably, although Hebi’s activation performance is not outstanding, its minimum value (0.0239) is significantly higher than those of other cities. This suggests a relatively high lower bound and that the city maintains a certain baseline activation level overall.

3.2.2. Spatial Autocorrelation of Activation Level

Global Moran’s I was calculated using ArcMap 10.8 for the activation levels of the 344 cultural heritage sites. The results are shown in Table 7.
The Moran’s I for the activation level distribution is 0.375350, far exceeding the theoretical expected value under the assumption of random distribution (−0.002915). This indicates strong spatial autocorrelation in the activation levels of cultural heritage within the study area. The z-score is 12.204, and the p-value is < 0.01, meaning the probability of such a highly clustered pattern arising randomly is less than 1%. These results confirm that the activation levels of cultural heritage in the Henan section are not randomly distributed but exhibit highly significant spatial dependence and agglomeration.
To examine within-city patterns, Moran’s I was further computed for each city. The results are summarized in Table 8.
The results demonstrate clear differences in the spatial distribution of activation levels across cities. The Moran’s I values for Zhengzhou, Luoyang, Sanmenxia, and Puyang are all positive, with p-values < 0.05 and significant z-scores. This indicates significant positive spatial autocorrelation and clustered distribution patterns within these cities. The higher Moran’s I values in Zhengzhou and Luoyang suggest stronger spatial dependence and more pronounced agglomeration of activation levels. In Jiaozuo, the Moran’s I is positive (0.270) and the p-value is 0.067, passing the significance test at the 0.10 level, which makes its clustering pattern statistically significant.
For Shangqiu, Xinxiang, Anyang, Hebi, and Kaifeng, the absolute z-scores are all below 1.96 and the p-values exceed 0.10. This means the spatial distribution of activation levels in these cities does not differ significantly from a random pattern. High-value and low-value sites are interspersed without forming clear spatial clusters or dispersed features.

3.2.3. Spatial Distribution Density of Activation Level

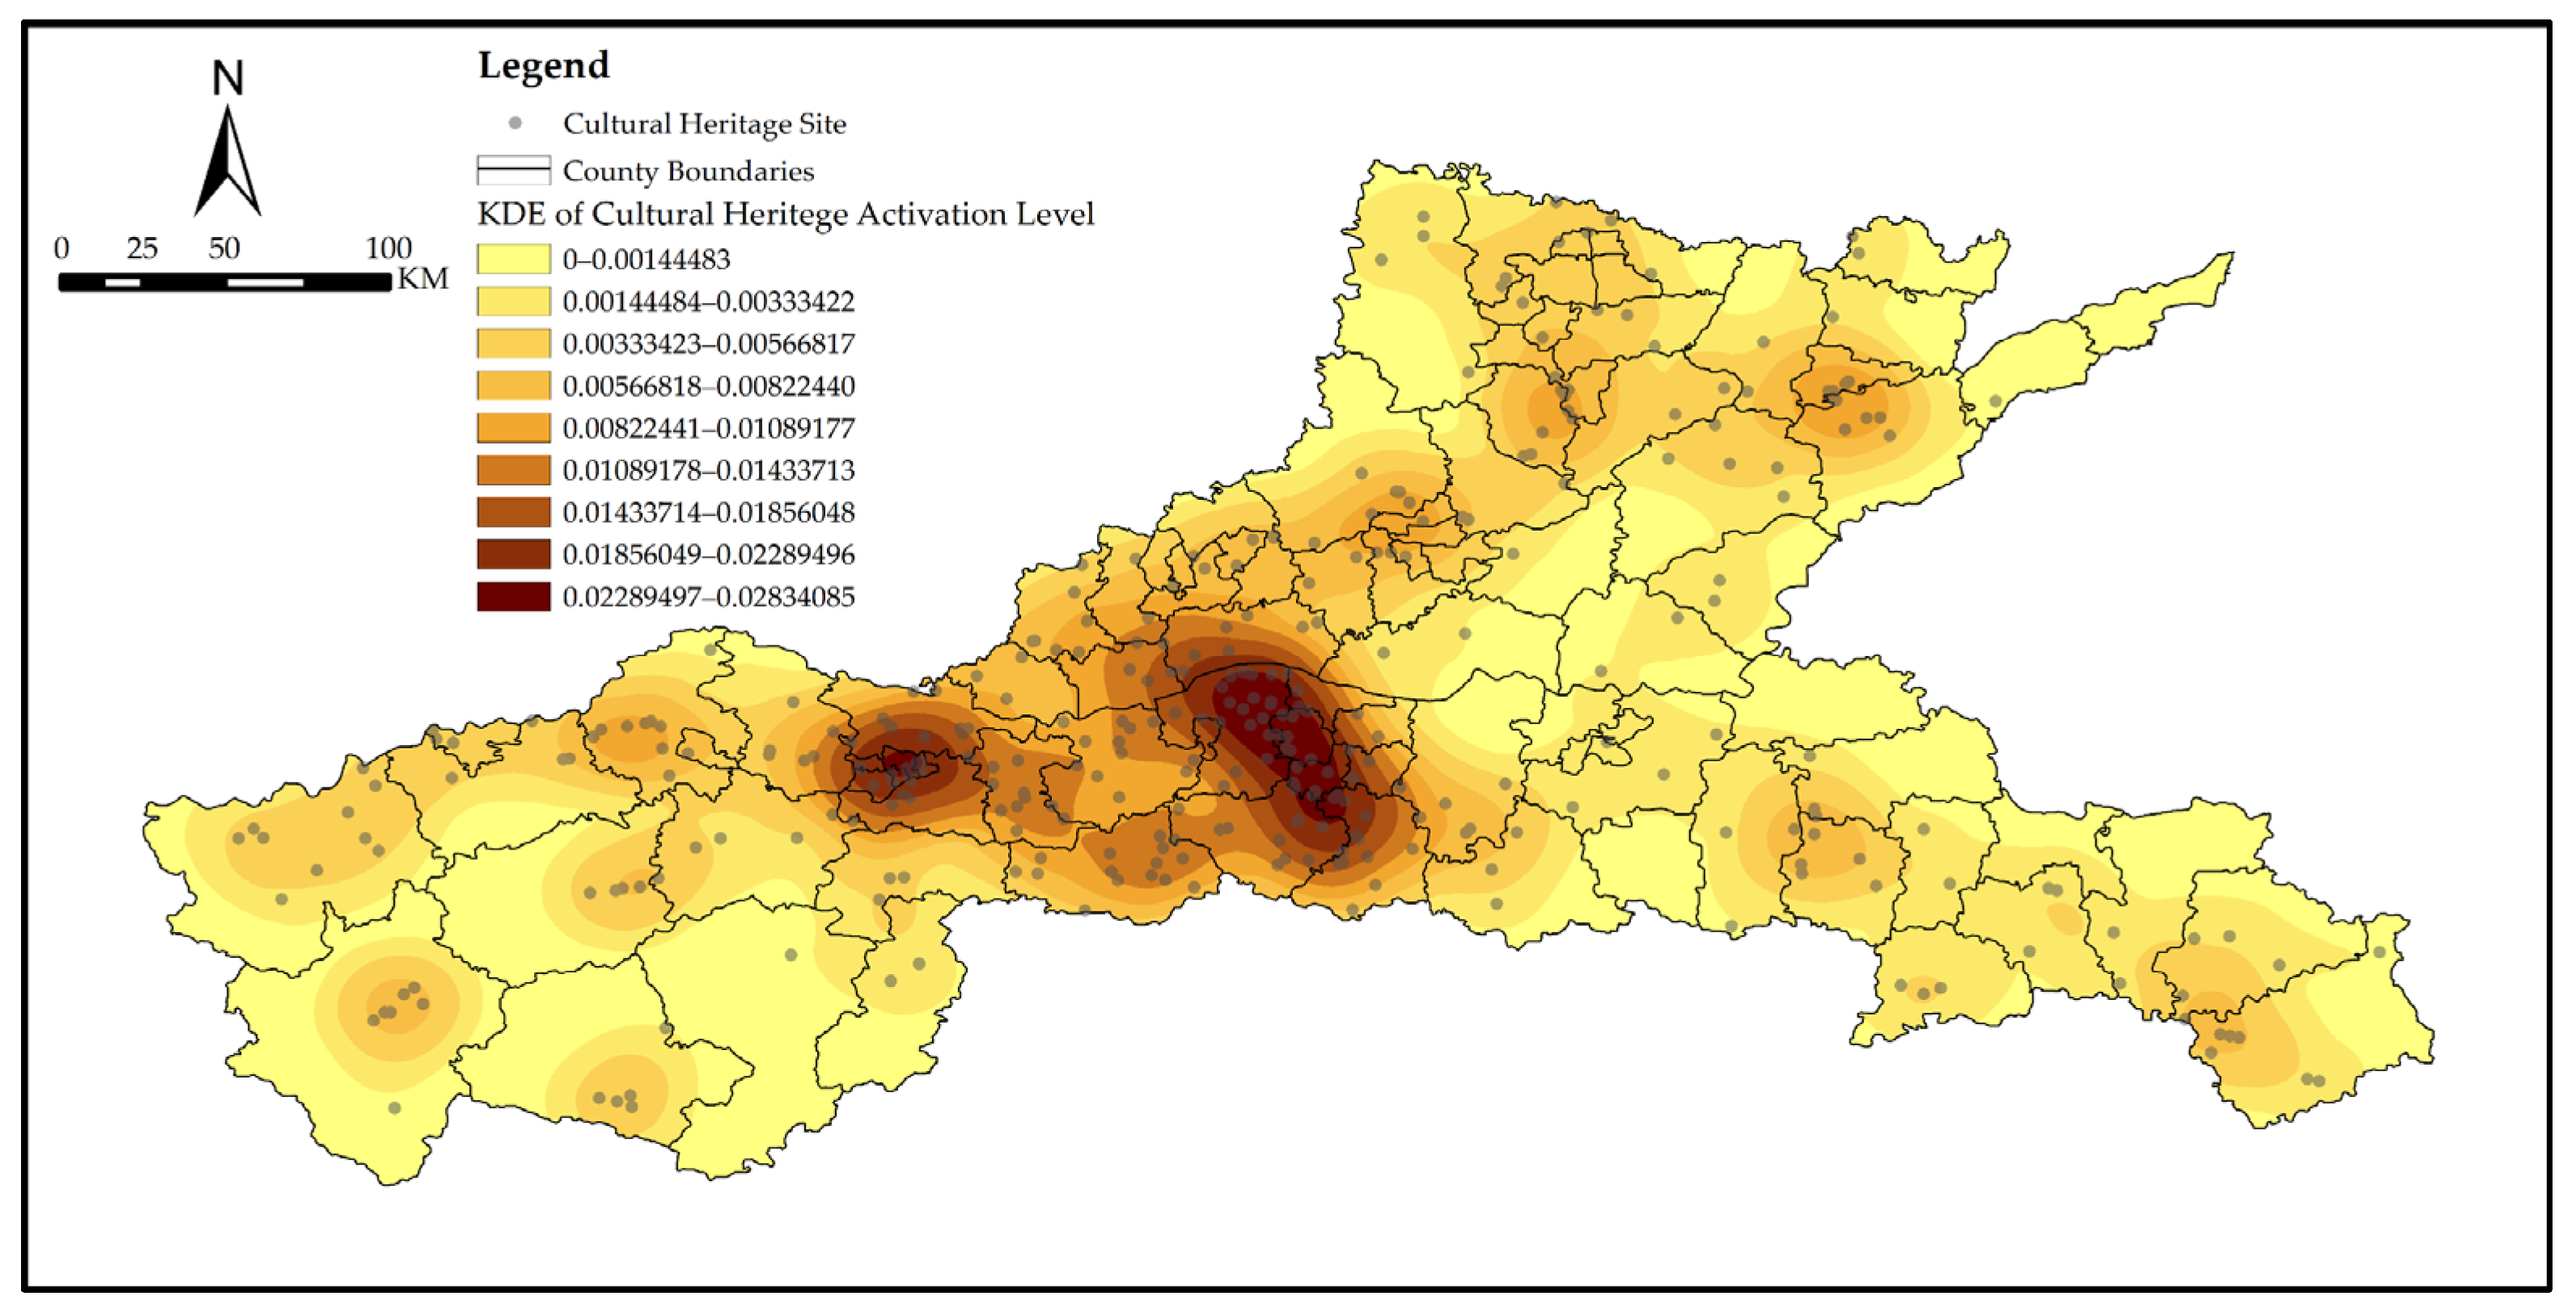
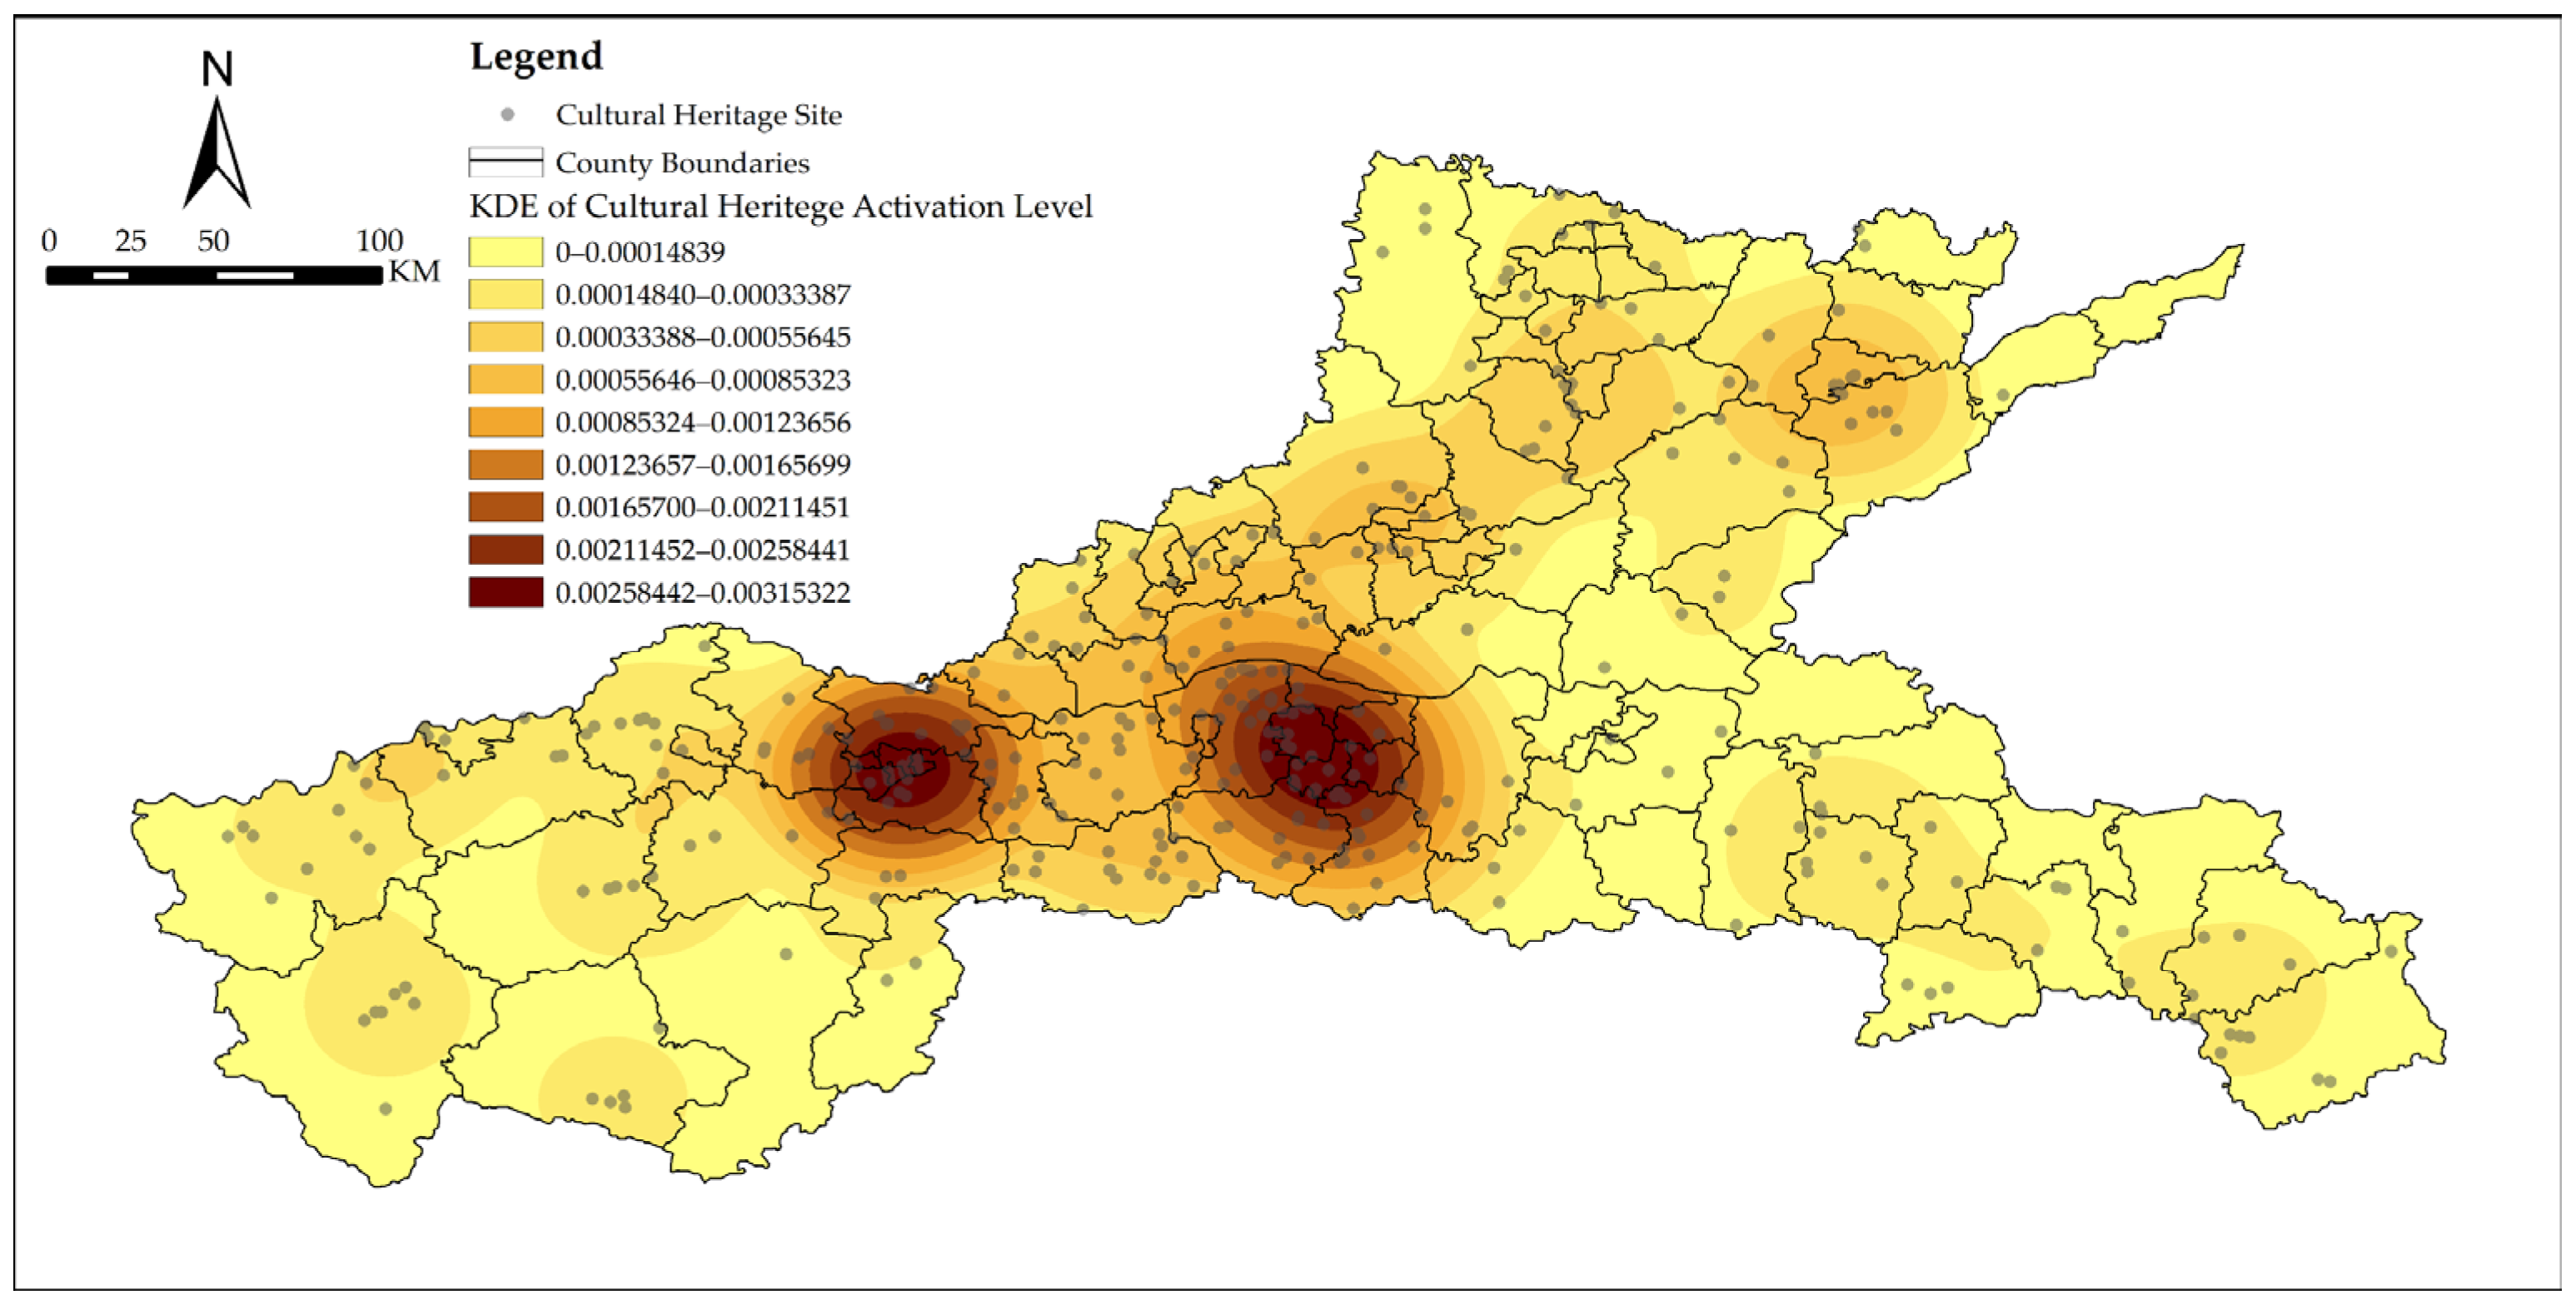
To precisely delineate the density gradient of activation levels, kernel density estimation was performed using ArcMap 10.8. The results are presented in Figure 5.
The results reveal a pronounced dual-core-dominated, multi-level spatial agglomeration pattern. Specifically, Zhengzhou and Luoyang stand out as the two prominent high-density cores of activation. Surrounding these two cores, the spatial distribution of activation levels exhibits a multi-level structure that progressively declines toward the periphery. From a continuous spatial perspective, this density gradient pattern further verifies and deepens the findings derived from the city-level statistics and the global Moran’s I analysis. Additionally, a secondary high-density zone emerges in the Puyang area, exhibiting local agglomeration but at a smaller scale and weaker intensity.

3.3. Factors Influencing the Spatial Distribution of Heritage Activation Levels

3.3.1. Global Regression Model Diagnostics

This study adopted the heritage activation level as the dependent variable. Heritage agglomeration degree, spatial radiation degree, transportation accessibility, per capita GDP, topographic relief, and NDVI served as explanatory variables. An OLS global regression model was constructed to test the overall validity of the hypothesized variable system and to justify the use of a GWR model. The results are presented in Table 9 and Table 10.
The global model passed the overall significance test, with p-values for both the joint F-statistic and the chi-square statistic below 0.01. However, the adjusted R2 was only 0.360, indicating that the selected variables explained merely about 36.0% of the spatial variation in heritage activation levels across the Henan section of the Yellow River Basin. This suggests considerable room for improvement in model fit. Both the Koenker (BP) statistic (p = 0.000) and the Jarque–Bera statistic (p = 0.000) were significant, pointing to potential heteroscedasticity and non-normal residuals. Therefore, evaluating coefficient significance based on robust standard errors (Robust_SE) and robust probabilities (Robust_Pr) is more reliable.
According to the robust results, all six variables were statistically significant, confirming their roles as effective influencing factors. Heritage agglomeration degree, spatial radiation degree, and per capita GDP exerted significant positive effects (p < 0.05) on activation levels. Transportation accessibility, topographic relief, and NDVI exhibited significant negative effects (p < 0.05). The negative influence of transportation accessibility may stem from the fact that areas with dense road networks are often highly urbanized zones where heritage sites face spatial encroachment or protective neglect. It may also indicate spatial non-stationarity, with the global model obscuring local differences.
In summary, the global OLS model preliminarily identified the overall effects of heritage agglomeration degree, spatial radiation degree, transportation accessibility, per capita GDP, topographic relief, and NDVI on heritage activation levels. Yet the model’s low explanatory power (R2 = 0.360) and pronounced heteroscedasticity (Koenker BP test p < 0.01) strongly suggest that the relationships between these factors and activation levels may vary with geographic location—that is, spatial non-stationarity exists.

3.3.2. Spatial Heterogeneity in Influencing Factors

A GWR model was employed for further analysis. In the model specification, an adaptive bisquare kernel was selected. The bandwidth was determined by minimizing the AICc using the golden search method, and the optimal number of neighboring features was 40. To check the reliability of local estimates, the condition index was calculated at each regression location. The maximum value across all locations was below 30. Meanwhile, the VIF for the OLS explanatory variables ranged from 1.059 to 1.593 (all below 7.5), indicating no significant multicollinearity was detected. Global spatial autocorrelation analysis of the standardized residuals from the GWR model yielded a Moran’s I of 0.155 (z = 0.341, p = 0.733). The non-significant result indicates that the residuals are randomly distributed and that the model has effectively extracted the spatial structure of the influencing factors. The GWR model diagnostics (Table 11) show an improved adjusted R2 of 0.716. The AICc value dropped considerably from −950.79 in the OLS model to −1095.32, confirming the superior fit and explanatory power of the GWR model. This clearly reveals significant spatial heterogeneity in the relationships between influencing factors and heritage activation levels.
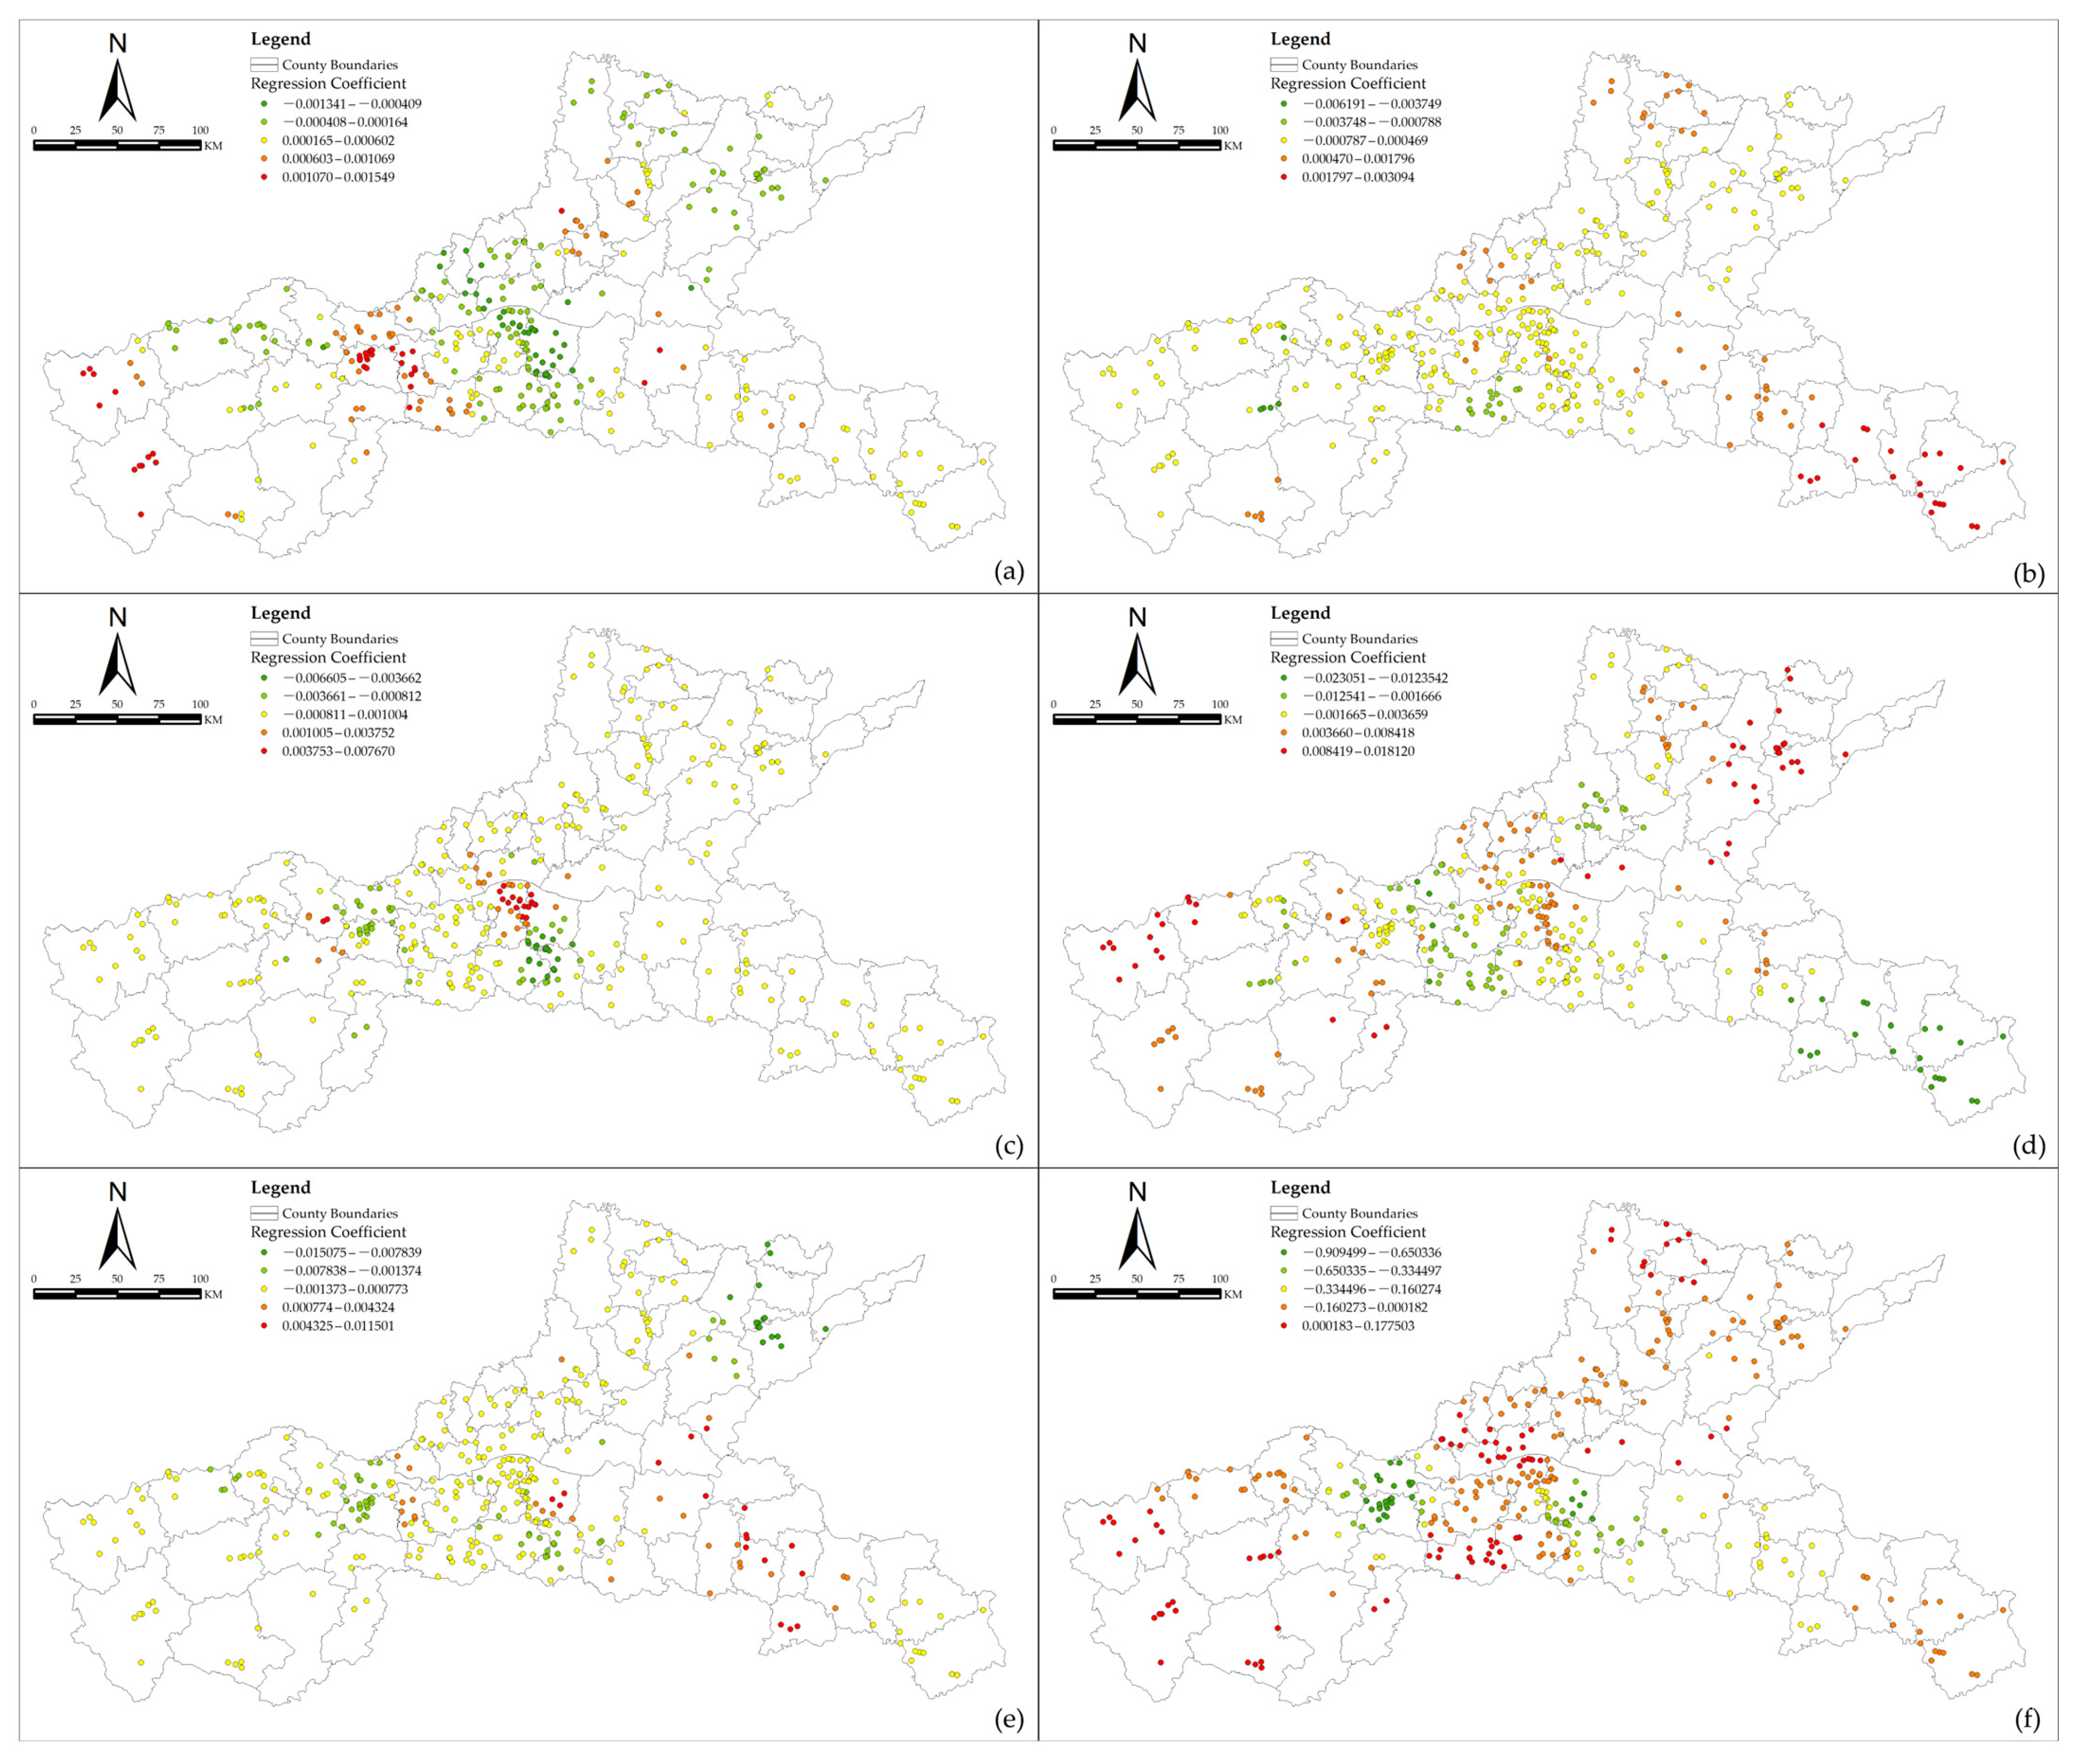
The spatial distribution patterns of the regression coefficients (Figure 6) reveal the following regularities:
  • Heritage agglomeration
As shown in Figure 6a, a positive correlation emerges in eastern and western areas such as Luoyang, Lingbao, Kaifeng, Shangqiu, Hebi, and Xinxiang. This indicates that the spatial agglomeration of heritage resources can generate linkage effects and scale advantages, significantly boosting activation levels. In central and northern areas like Zhengzhou, Jiaozuo, Shanzhou, Anyang, and Puyang, however, the coefficient turns negative. There, high-density heritage distribution fails to effectively promote activation and instead produces suppressive effects due to resource competition, developmental overload, and functional conflicts.
Figure 6. Spatial distribution of regression coefficients for influencing factors. (a) Heritage agglomeration; (b) heritage spatial radiation; (c) transportation accessibility; (d) per capita GDP; (e) terrain relief; (f) NDVI.
Sustainability 18 05347 g006
b.
Heritage spatial radiation
Results (Figure 6b) show a positive relationship across most of the Henan section, with negative values only in Luoning, Dengfeng, Xinmi, and Mianchi. The prevailing positive effect suggests that a stronger spatial radiation capacity can expand the coverage of cultural services and reinforce regional cultural linkages, thereby significantly elevating activation levels. In localized areas such as Luoning, Dengfeng, Xinmi, and Mianchi, a marked mismatch exists between the potential radiation range and the actual service provision capacity or resource allocation efficiency. Limited investment in cultural service facilities is diluted, hampering effective activation support and even constraining improvements.
c.
Transportation accessibility
Results (Figure 6c) indicate a positive correlation in most parts of the Henan section, with negative correlations only in Zhengzhou, Xinzheng, Luoyang, and Mengjin. Over most of the region, improved transportation conditions significantly raise activation levels. In Zhengzhou, Xinzheng, Luoyang, and Mengjin, however, the dense road network does not effectively promote activation and instead exhibits a suppressive effect. This may be linked to traffic saturation: excessive accessibility leads to tourist overcrowding and landscape degradation, which in turn diminishes the experiential value and activation quality of cultural heritage.
d.
Per capita GDP
Results (Figure 6d) show that per capita GDP is positively associated with activation in most areas, including Sanmenxia, Luoyang, Zhengzhou, Kaifeng, Anyang, and Puyang. In contrast, the relationship turns negative in Xinxiang, Shangqiu, Gongyi, Yanshi, and Dengfeng. The positive effects in the former areas indicate that a higher level of economic development can provide stable funding and resource support for heritage conservation, restoration, and facility construction, thereby effectively advancing activation. In the latter areas, however, GDP growth has not translated into a driving force for activation and instead appears suppressive. This may stem from insufficient coordination between economic development and heritage protection, with issues such as excessive commercial exploitation arising during economic growth.
e.
Terrain relief
Results (Figure 6e) reveal a negative correlation across most of the Henan section, especially in its western and northern parts, whereas a positive correlation appears in Kaifeng, Shangqiu, Zhengzhou, Yanshi, and Gongyi. The negative effects in the western and northern areas indicate that greater topographic relief significantly constrains the improvement of activation levels. In plains and piedmont transitional zones such as Kaifeng, Shangqiu, Zhengzhou, Yanshi, and Gongyi, topographic relief remains generally low. Here, moderate terrain variation is not an absolute obstacle to heritage activation and even exerts a positive effect.
f.
NDVI
Results (Figure 6f) show a positive correlation across most of the Henan section, with negative correlations only in Zhengzhou, Xinzheng, Luoyang, Mengjin, and Kaifeng. The prevailing positive effect indicates that higher vegetation coverage not only creates a favorable ecological setting and landscape for cultural heritage but also significantly promotes activation levels. In urban built-up areas and peri-urban zones such as Zhengzhou, Xinzheng, Luoyang, Mengjin, and Kaifeng, the relationship turns negative. There, the ecological and landscape benefits of vegetation have not effectively converted into a driving force for heritage activation.

4. Discussion

4.1. Quantitative Characterization Framework of Cultural Heritage Activation Level

This study constructs a quantitative system for the cultural heritage activation level across cultural, social, and economic dimensions, which aligns with the essential nature of cultural heritage as a complex system. It identifies the differentiated characteristics of the cultural heritage activation level in the Henan section of the Yellow River Basin and clarifies the pathways for the sustainable development of cultural heritage. In the cultural dimension, academic influence and the density of cultural display facilities gauge the capacity for heritage value dissemination. These indicators objectively reflect cultural interpretation and transmission efficacy in terms of both knowledge production and public cultural services [40,41]. The social dimension integrates online attention, visitation activity, and the density of supporting public service facilities. By combining digital footprints and on-site experiences, it comprehensively captures public participation, social recognition, and service provision [42,43]. The economic dimension adopts the nighttime light index and the density of cultural tourism commercial facilities. Using remote sensing data and actual business formats, it reflects the market conversion and economic driving effects of heritage activation, effectively avoiding the one-sidedness of single-indicator evaluation [45,46]. The indicators complement one another and are logically coherent. They cover the three core dimensions of value inheritance, public use, and market conversion, thereby fully addressing the scientific connotations of heritage activation. The study integrated heterogeneous multi-source data, including CNKI publications, POIs, social media reviews, nighttime light imagery, and remote sensing images. It employed standard methods such as kernel density estimation, the analytic hierarchy process, normalization, and weighted synthesis to compute the indicators, substantially enhancing the reliability and comparability of the evaluation results [62]. This quantitative framework achieves a shift from qualitative description to quantitative measurement for heritage activation levels. It offers a generalizable and verifiable scientific paradigm for assessing heritage activation and sustainable use.

4.2. Spatial Distribution Characteristics of Activation Level

Spatial analysis reveals significant spatial agglomeration and regional differentiation in heritage activation levels across the Henan section of the Yellow River Basin. The overall spatial pattern is characterized by a dual-core structure dominated by Zhengzhou and Luoyang, which form high-value clusters that gradually decline toward the periphery, with a secondary high-value zone emerging in Puyang. This pattern is highly coupled with heritage resource density, historical and cultural accumulation, and regional socioeconomic development. Zhengzhou and Luoyang benefit from abundant, high-grade, and concentrated heritage resources, as well as well-developed infrastructure and strong consumption capacity. These advantages jointly drive the formation of high-value activation clusters. Spatial autocorrelation tests confirm a highly significant positive spatial correlation in activation levels. This indicates clear spatial spillover and linkage effects among neighboring heritage sites [63]. In addition, marked internal differences exist among cities. Zhengzhou exhibits the coexistence of high-value and low-value sites, whereas Kaifeng, Jiaozuo, and Shangqiu remain at an overall low level. This reflects the uneven development of heritage activation under different resource endowments and development models. It suggests that heritage resource stock is not the sole determinant of vitality. Instead, vitality levels are also shaped by multiple variables such as geographical context, cultural resource allocation, and the degree of regional development [64].

4.3. Driving Mechanisms of Heritage Activation Level

Based on the GWR results, the effects of heritage agglomeration degree, spatial radiation degree, transportation accessibility, per capita GDP, topographic relief, and NDVI on heritage activation in the Henan section show significant spatial heterogeneity. This indicates that activation levels are driven by the interactions and synergy among multiple factors—cultural resource allocation efficiency, regional development, and geographical conditions—aligning with the core framework in which natural and anthropogenic drivers jointly shape heritage activation [10,11,12,13,14].
Allocation efficiency of cultural resources: Heritage agglomeration degree exerts a positive driving effect in eastern and western areas such as Luoyang, Kaifeng, Shangqiu, Hebi, and Xinxiang. This suggests that spatial agglomeration can integrate cultural branding, connect tourist routes, share service facilities, and reduce operating costs, generating notable scale and linkage effects. In central and northern areas like Zhengzhou, Jiaozuo, Shanzhou, Anyang, and Puyang, however, the effect becomes negative. This reflects that in areas with high-density but low-development-level heritage sites, limited funding, land, and service resources lead to homogenized competition and functional conflicts, making it difficult to form synergies and instead suppressing activation [65]. Heritage spatial radiation degree shows a positive effect across most of the study area. This implies that the match between heritage site scale and service catchment is generally good, and that expanding radiation capacity can effectively enhance cultural influence and service coverage. Nevertheless, negative effects appear in areas such as Luoning, Dengfeng, Xinmi, and Mianchi, mainly stemming from resource mismatch. Some large-scale heritage sites are constrained within narrow service areas, resulting in service oversupply and inefficient use. Conversely, some small-scale sites are assigned excessively large theoretical service areas, diluting limited facility investments. Ultimately, this prevents radiation capacity from being converted into activation momentum.
The two-sided effects of regional development: Transportation accessibility is significantly positive in relatively balanced development zones such as the eastern Henan plain, southern Henan, and the northern Henan periphery. An improved road network can markedly enhance heritage accessibility and reduce travel costs, serving as a key instrument for raising activation levels. However, a negative correlation emerges in highly urbanized areas such as Zhengzhou, Xinzheng, Luoyang, and Mengjin. There, dense road networks and high-intensity development bring traffic congestion, visitor overload, and landscape degradation. Excessive construction encroaches on heritage protection space and erodes site authenticity and visitor experience, thereby inhibiting activation. Per capita GDP acts as a strong positive driver in areas with better economic foundations, including Sanmenxia, Luoyang, Zhengzhou, Kaifeng, Anyang, and Puyang. A prosperous regional economy can provide stable funding for heritage restoration, facility construction, and brand marketing, steadily raising activation levels [66]. In contrast, the effect turns negative in Xinxiang, Shangqiu, Gongyi, Yanshi, and Dengfeng. This is attributable to insufficient coordination between economic growth and heritage conservation. Excessive commercialization, extensive development, and resource-depleting exploitation squeeze heritage protection space, preventing economic dividends from being effectively translated into activation benefits.
Constraints and suitability of geographical conditions: Topographic relief generally exhibits a negative driving effect in the mountainous areas of western Henan and the hilly areas of southwestern Henan. High relief increases transportation construction costs, reduces land-use suitability, and constrains infrastructure layout and large-scale tourism development, posing a clear restriction on heritage activation. Yet in plains and piedmont transitional zones such as Kaifeng, Shangqiu, Zhengzhou, Yanshi, and Gongyi, where relief is low and gently undulating, moderate terrain variation can enrich landscape layers and enhance ecological distinctiveness, thereby producing a positive effect on activation. NDVI is significantly positive in regions with excellent ecological baselines, such as western and southern Henan. High vegetation coverage improves the environmental quality of heritage sites, reduces natural erosion risks, and enhances recreational experience, serving as ecological support for activation [52]. In the urban built-up areas and peri-urban high-intensity development zones of Zhengzhou, Luoyang, Kaifeng, Xinzheng, and Mengjin, however, NDVI turns negative. This is mainly because urban construction land, tourism development space, and ecological space come into sharp conflict. The ecological benefits are weak, and vegetation coverage cannot be converted into an effective driving force for heritage activation.

4.4. Conservation and Sustainable Development Strategies

Drawing on the spatial distribution patterns and driving mechanisms of heritage activation levels in the Henan section, and aligned with the strategic requirements of ecological protection and high-quality development in the Yellow River Basin, the following differentiated and targeted strategies are proposed:
(1)
Construct a core–corridor–node spatial development pattern. In response to the dual-core-dominated, multi-level spatial features of activation, strengthen the demonstrative and radiating role of the two core areas, Zhengzhou and Luoyang. Link the heritage corridor extending along Sanmenxia, Luoyang, Zhengzhou, Jiaozuo, Hebi, and Puyang to create the Yellow River Cultural Heritage Corridor. Cultivate secondary node cities such as Puyang, Sanmenxia, and Shangqiu to address the weaknesses in areas with low activation levels. This will form a cross-county and cross-basin collaborative development network, achieving the integrated planning of heritage conservation, cultural inheritance, and spatial utilization.
(2)
Implement precision adjustment strategies geared to factor suitability. Based on the spatial heterogeneity mechanisms of influencing factors, optimize resource allocation by subregion. In areas where heritage agglomeration has a positive effect (e.g., Luoyang, Kaifeng, Shangqiu), strengthen resource integration, route connection, and brand building to release agglomeration dividends. In areas with a negative agglomeration effect (e.g., Zhengzhou, Jiaozuo, Anyang), guide differentiated positioning and develop themed and distinctive utilization models to alleviate homogenized competition and resource overload. In regions with efficient spatial radiation, expand the coverage of public cultural services. In areas with a radiation mismatch (e.g., Luoning, Dengfeng, Xinmi), reasonably adjust service boundaries and facility layouts to avoid resource dilution. In zones where transportation imposes a negative constraint (e.g., the urban areas of Zhengzhou and Luoyang), prioritize slow-traffic systems, heritage trails, and public transit to reduce motorized disturbance. In areas where economic driving forces are ineffective, strictly control excessive commercialization and redirect cultural tourism investment toward heritage conservation and quality enhancement.
(3)
Strengthen an eco-cultural-economic synergistic sustainable development model. Anchored in the Yellow River Basin ecological protection strategy, create eco-friendly heritage experience settings in zones with high NDVI and good ecological baselines. Develop products such as ecological study tours, cultural discovery trips, and slow travel experiences. In urban built-up areas and high-intensity development zones, balance ecological, construction, and heritage protection spaces, and promote the integration and symbiosis of ecological landscapes and heritage features. Fully leverage digital technologies to build heritage exhibitions and communication platforms, expanding cultural radiation while reducing the intensity of physical development. Encourage community participation in heritage conservation, operation, and service provision. Facilitate the orderly conversion of cultural resources into development resources, and achieve the sustainable goal of conservation priority, appropriate activation, and multi-stakeholder benefit.

4.5. Limitations and Future Research

This study has several limitations. First, concerning data timeliness and dimensional completeness, the nighttime light data, POI data, and remote sensing data used here cannot fully capture the long-term dynamic evolution of heritage activation levels. In the social dimension assessment of the current cultural heritage activation level evaluation framework, the evaluation mainly relies on search and review data from Internet platforms such as Baidu Index and Xiaohongshu. This inevitably omits data from non-Internet users and the elderly population, leading to sample selection bias in the portrayal of the social dimension. Moreover, subjective and governance-related indicators such as policy support intensity, community willingness to participate, tourist satisfaction, and place attachment have not been incorporated into the evaluation framework, which may result in an incomplete depiction of the connotation of activation. Future research will extend the time series of multi-source data to analyze long-term dynamic changes in heritage activation levels. It will also supplement indicators covering policy, community, and tourist perceptions, and incorporate methods such as questionnaires and field interviews to cover a broader population, thereby constructing a more systematic and comprehensive quantitative system for measuring activation levels. Second, the interactive driving effects among influencing factors have not been thoroughly examined. For instance, the synergistic and constraining relationships between heritage agglomeration degree and transportation accessibility, between NDVI and topographic relief, and between per capita GDP and heritage spatial radiation degree remain unexplored. Global and local regression models can only identify single-factor effects and cannot easily reveal multi-factor compound driving mechanisms. Future studies will introduce methods such as geographical detectors and multiscale geographically weighted regression to quantitatively measure the interaction intensity, nonlinear relationships, and spatial differentiation characteristics of influencing factors, thereby revealing the activation driving mechanisms more precisely. Finally, research on micro-scale driving mechanisms and implementation pathways is insufficient. This study was primarily conducted at the county scale and did not deeply analyze the micro-scale spatial differentiation within high-density agglomeration areas like Zhengzhou and Luoyang, the interaction mechanisms among individual heritage sites, or the characteristics of human-environment relationships at small scales. Future research will focus on high-density core areas and representative cultural districts (e.g., the Yiluo River Basin, the ancient Zhengzhou-Kaifeng corridor) to investigate the mechanisms of heritage agglomeration, spatial interaction, and activation enhancement at the micro scale. It will further explore coupling pathways linking heritage with tourism, intangible cultural heritage inheritance, cultural creative industries, and ecological products, and propose more detailed and implementable conservation and activation strategies.

5. Conclusions

Taking 344 cultural heritage sites in the Henan section of the Yellow River Basin as the research objects, this study constructed a quantitative evaluation system for heritage activation covering the three dimensions of culture, society, and economy. By integrating GIS spatial analysis and regression methods, it systematically revealed the spatial distribution pattern, differentiation characteristics, and driving mechanisms of activation levels in this region.
The findings are as follows: The activation levels exhibit a dual-core-dominated, multi-level agglomeration pattern. Zhengzhou and Luoyang serve as the two high-density agglomeration cores, and a continuous cultural heritage corridor extends along Sanmenxia, Luoyang, Zhengzhou, Jiaozuo, Hebi, and Puyang. The GWR model confirms that the effects of heritage agglomeration degree, spatial radiation degree, per capita GDP, transportation accessibility, topographic relief, and NDVI on activation levels display significant spatial heterogeneity. This reveals that heritage activation levels result from the interactions and synergistic effects among multiple factors, including cultural resource allocation efficiency, regional development, and geographical conditions.
This study provides a scientific analytical paradigm and a decision-making basis for the sustainable development of cultural heritage. The constructed multidimensional, multi-source data fusion quantitative system for activation is objective and scalable, and can be applied to identify and manage the activation levels of cultural heritage at the county scale. Based on the identified spatial heterogeneity, differentiated development strategies are proposed—such as constructing a core–corridor–node synergistic pattern, implementing precision resource allocation suited to site-specific factors, and strengthening an eco-cultural-economic synergistic model. These strategies can help overcome the management challenges of sustainable heritage development. They offer empirical support and a pathway reference for achieving the goals of cultural heritage conservation and high-quality development in the Yellow River Basin.
The current study focuses on the Henan section. Future research can extend to the entire Yellow River Basin and to other major river basins worldwide. Cross-regional comparative analyses can identify common patterns and distinctive features in the spatial distribution and driving mechanisms of heritage activation across different regions. This will provide more comprehensive empirical support for advancing heritage conservation, raising activation levels, and promoting regional sustainable development in major river basins.

Author Contributions

Conceptualization, Y.S. and Q.B.; methodology, Y.S. and Q.B.; software, H.S.; validation, Y.S., J.L. and Q.B.; formal analysis, J.L. and Q.B.; investigation, C.L.; resources, C.L.; data curation, H.S. and C.L.; writing—original draft preparation, Y.S., H.S. and Q.B.; writing—review and editing, Y.S., J.L. and Q.B.; visualization, H.S.; supervision, Y.S. and J.L.; project administration, J.L.; funding acquisition, Y.S. and J.L. All authors have read and agreed to the published version of the manuscript.

Funding

This study was funded by the Henan Province Philosophy and Social Science Education Strong Province Research Program (No. 2025JYQS1228); Henan Province Soft Science Research Program of the Science and Technology Department (No. 252400410263); Henan Provincial Cultural Relics Protection Research Project (Project No. 25HNWWJ-KJ14; Project No. 25HNWWJ-KJ20); the Open Fund of Henan Provincial Joint Laboratory of Philosophy and Social Sciences on Water Culture and Water Security (Grant No. SZSSYS-2614); Henan Provincial Cultural Relics Protection Research Project (Document No. Yu Cultural Relics Science [2025] 25); and the Major Project of Basic Research on Philosophy and Social Sciences in the Universities of Henan Province (No. 2023-JCZD-30).

Institutional Review Board Statement

Not applicable.

Informed Consent Statement

Not applicable.

Data Availability Statement

The data presented in this study are available on request from the corresponding author.

Conflicts of Interest

Authors Hongfei Shi and Cuiping Liu were employed by the company Henan Zhixinyingzao Planning and Design Co., Ltd. The remaining authors declare that the research was conducted in the absence of any commercial or financial relationships that could be construed as a potential conflict of interest.

Abbreviations

The following abbreviations are used in this manuscript:
GWRGeographically Weighted Regression
CHALCultural Heritage Activation Level
UNESCOUnited Nations Educational, Scientific and Cultural Organization
ICOMOSInternational Council on Monuments and Sites
POIPoint of Interest
DEMDigital Elevation Model
GDPGross Domestic Product
NDVINormalized Difference Vegetation Index
ANNAverage Nearest Neighbor
KDEKernel Density Estimation
OLSOrdinary Least Squares

References

  1. Raevskikh, E.; Di Mauro, G.; Jaffré, M. From living heritage values to value-based policymaking: Exploring new indicators for Abu Dhabi’s sustainable development. Humanit. Soc. Sci. Commun. 2024, 11, 1311. [Google Scholar] [CrossRef]
  2. UNESCO. Convention concerning the protection of the world cultural and natural heritage. Mus. Int. 1973, 25, 120. [Google Scholar] [CrossRef]
  3. ICOMOS. ICOMOS World Report on Monuments and Sites in Heritage at Risk 2002/2003; Petzet, M., Ed.; ICOMOS: London, UK, 2022. [Google Scholar]
  4. Giliberto, F.; Labadi, S. Harnessing cultural heritage for sustainable development: An analysis of three internationally funded projects in MENA Countries. Int. J. Herit. Stud. 2022, 28, 133–146. [Google Scholar] [CrossRef]
  5. Hu, B.; He, F.; Hu, L. Community empowerment under powerful government: A sustainable tourism development path for cultural heritage sites. Front. Psychol. 2022, 13, 752051. [Google Scholar] [CrossRef]
  6. Nikolić, M.; Drobnjak, B.; Kuletin Ćulafić, I. The Possibilities of Preservation, Regeneration and Presentation of Industrial Heritage: The Case of Old Mint “A.D.” on Belgrade Riverfront. Sustainability 2020, 12, 5264. [Google Scholar] [CrossRef]
  7. Ge, J. Yellow River and Chinese Civilization; Zhonghua Book Company: Beijing, China, 2021; pp. 25–30. [Google Scholar]
  8. Accordino, J.; Adhikari, S. Balancing act: Preserving historic fabric and enhancing economic vitality in towns in the metropolitan periphery. Plan. Pract. Res. 2022, 37, 95–110. [Google Scholar] [CrossRef]
  9. Wu, J.; Lu, Y.; Gao, H. Cultivating historical heritage area vitality using urban morphology approach based on big data and machine learning. Comput. Environ. Urban Syst. 2022, 91, 101716. [Google Scholar] [CrossRef]
  10. Zhang, F.; Liu, Q.; Zhou, X. Vitality evaluation of public spaces in historical and cultural blocks based on multi-source data, a case study of Suzhou Changmen. Sustainability 2022, 14, 14040. [Google Scholar] [CrossRef]
  11. Yang, C.; Hu, Y.; Su, Q.; Li, X.; Zhu, M. Empirical methods for recognizing and evaluating cultural heritage value of Timber-Arched Lounge Bridge from the perspective of cultural memory. J. Asian Archit. Build. Eng. 2024, 24, 3575–3592. [Google Scholar] [CrossRef]
  12. Sheng, G.; Liao, L.; Xiong, L.; Zhu, B.-W.; Cheung, S.M. Revitalization and Development Strategies of Fostering Urban Cultural Heritage Villages: A Quantitative Analysis Integrating Expert and Local Resident Opinions. Systems 2022, 10, 202. [Google Scholar] [CrossRef]
  13. Wang, Q.; Yang, C.; Wang, J.; Tan, L. Tourism in Historic Urban Areas: Construction of Cultural Heritage Corridor Based on Minimum Cumulative Resistance and Gravity Model—A Case Study of Tianjin, China. Buildings 2024, 14, 2144. [Google Scholar] [CrossRef]
  14. Wei, Z.; Xiong, Y.; Chen, Y. Value Positioning and Spatial Activation Path of Modern Chinese Industrial Heritage: Social Media Data-Based Perception Analysis of Huaxin Cement Plant via the Four-Quadrant Model. Buildings 2026, 16, 519. [Google Scholar] [CrossRef]
  15. Huang, X.; Gong, P.; Wang, S.; White, M.; Zhang, B. Machine learning modeling of vitality characteristics in historical preservation zones with multi-source data. Buildings 2022, 12, 1978. [Google Scholar] [CrossRef]
  16. Niu, X.; Wang, X.; Bi, X. Mapping the nexus of sustainability and cultural heritage: A systematic review and empirical analysis. npj Herit. Sci. 2025, 13, 471. [Google Scholar] [CrossRef]
  17. Liu, S.; Ge, J.; Bai, M.; Yao, M.; Zhu, Z. Uncovering the factors influencing the vitality of traditional villages using POI (point of interest) data: A study of 148 villages in Lishui, China. Herit. Sci. 2023, 11, 123. [Google Scholar] [CrossRef]
  18. Li, S.; Sun, T. Spatial distribution of cities and towns in the Late Qing Dynasty and Early Republic of China and evaluation of modern economic vitality based on multi-source data: Taking the Yellow River Basin as an example. Digit. Humanit. Res. 2022, 2, 39–51. [Google Scholar]
  19. Liu, S.; Zhu, Z.; Gao, Y.; Wang, S. Assessing the dynamic vitality of public spaces in tourism-oriented traditional villages: A collaborative active perception method. Herit. Sci. 2024, 12, 346. [Google Scholar] [CrossRef]
  20. Chen, S.; Zhang, Y. The combination of historical and cultural heritage of traditional villages with vitality space: A case study of Butou Village, Xianju County, Taizhou City, Zhejiang Province. Huazhong Archit. 2023, 41, 115–118. [Google Scholar] [CrossRef]
  21. Jia, X.; Xu, Y.; Zhao, B. Sustainable tourism at nature-based cultural heritage sites: Visitor density and its influencing factors. npj Herit. Sci. 2025, 13, 175. [Google Scholar] [CrossRef]
  22. Tian, L. Functional and Spatial Revival in Historic Area from the Perspective of Raising Vitality. Master’s Thesis, Southeast University, Nanjing, China, 2016. [Google Scholar]
  23. Li, J. Research for the Historic Area Conservation Based on Development Vitality. Master’s Thesis, Southeast University, Nanjing, China, 2015. [Google Scholar]
  24. Ming, L.; Chen, Z. Vitality upgrade for historical and cultural blocks based on inhabitant spatial integration. Planners 2017, 33, 17–23. [Google Scholar]
  25. Liao, H.; Feng, W.; Zhao, J. Quantitative evaluation and improvement strategies exploration of the vigor of residential historical and cultural streets and communities. Shanghai Urban Manag. 2017, 26, 75–78. [Google Scholar]
  26. Wang, X. Research on Heritage Conservation Based on Local Community in the Context of Inner-City Redevelopment: Case Study of Tianjin. Ph.D. Thesis, Tianjin University, Tianjin, China, 2020. [Google Scholar]
  27. Liu, S.; Ge, J.; Bai, M. Toward classification-based sustainable revitalization: Assessing the vitality of traditional villages. Land Use Policy 2022, 116, 106060. [Google Scholar] [CrossRef]
  28. Yang, X.; Shen, J. Integrating historic landscape characterization for historic district assessment through multi-source data: A case study from Hangzhou, China. npj Herit. Sci. 2025, 13, 33. [Google Scholar] [CrossRef]
  29. Lv, Z.; Li, C.; Du, Y. Study on the distribution and evolution of prehistoric settlements in Shandong Province based on GIS. Geogr. Sci. Res. 2021, 10, 39–45. [Google Scholar] [CrossRef]
  30. Zou, H.; Chen, C.; Xiao, W.; Shi, L. Spatial-temporal evolution relationship between water systems and historical settlement sites based on quantitative analysis: A case study of Hankou in Wuhan, China (1635–1949). Sustainability 2022, 14, 14614. [Google Scholar] [CrossRef]
  31. Song, M.; Kim, J.-E. Spatial Distribution characteristics and driving factors of traditional villages in Henan Province: A multi-method comprehensive analysis. Sustainability 2025, 17, 10825. [Google Scholar] [CrossRef]
  32. Wang, F.; Zhang, T.; Zhang, S. MGWR reveals scale heterogeneity shaping intangible cultural heritage distribution in China. npj Herit. Sci. 2025, 13, 367. [Google Scholar] [CrossRef]
  33. Du, J.; Bi, S.; Zhang, Y. Landscape ecological risk assessment and driving factors in Guyi Basin cultural heritage sites: A multi-scenario simulation perspective. npj Herit. Sci. 2026, 14, 36. [Google Scholar] [CrossRef]
  34. Gu, Y.; Zhang, Y.; Hou, Y.; Yu, S.; Li, G.; Huang, H.; Su, D. The spatio-temporal characteristics and influencing factors of intangible cultural heritage in Jiang-Zhe-Hu region, China. Sustainability 2026, 18, 35. [Google Scholar] [CrossRef]
  35. Zou, L.; Tai, P.; Wang, X.; Jiao, J.; Wang, Y. Study on the spatial and temporal differentiation of intangible cultural heritage and its influencing factors in Shandong province. Sci. Rep. 2025, 15, 24792. [Google Scholar] [CrossRef]
  36. Li, S.; Song, Y.; Xu, H.; Li, Y.; Zhou, S. Spatial Distribution Characteristics and Driving Factors for Traditional Villages in Areas of China Based on GWR Modeling and Geodetector: A Case Study of the Awa Mountain Area. Sustainability 2023, 15, 3443. [Google Scholar] [CrossRef]
  37. Salehipour, M.; Kazemi, N.; Jokar Arsanjani, J.; Karimi Firozjaei, M. Developing a multi-criteria decision model to unlock sustainable heritage tourism potential. Sustainability 2025, 17, 3703. [Google Scholar] [CrossRef]
  38. Qian, X.; Yu, Y.; Liu, R. The Spatial Relationship Characteristics and Differentiation Causes Between Traditional Villages and Intangible Cultural Heritage in China. Buildings 2025, 15, 2094. [Google Scholar] [CrossRef]
  39. Yuan, X.; Li, Y.; Song, Y.; Lu, H.; Wang, Y.; Ge, B.; Wang, J. Spatial Distribution Characteristics and Driving Factors of 777 Traditional Villages in Yunnan Province: A Study Based on GWR Model and Geodetector. Land 2024, 13, 2004. [Google Scholar] [CrossRef]
  40. Li, H.; Miao, L. A Study of the Non-Linear Relationship Between Urban Morphology and Vitality in Heritage Areas Based on Multi-Source Data and Machine Learning: A Case Study of Dalian. ISPRS Int. J. Geo-Inf. 2025, 14, 177. [Google Scholar] [CrossRef]
  41. Huang, D.; Gong, W.; Wang, X.; Liu, S.; Zhang, J.; Li, Y. A Cognition–Affect–Behavior Framework for Assessing Street Space Quality in Historic Cultural Districts and Its Impact on Tourist Experience. Buildings 2025, 15, 2739. [Google Scholar] [CrossRef]
  42. Zhang, Q.; Cheng, T.; Xu, P.; Jiang, X. Balancing Heritage Conservation and Urban Vitality Through a Multi-Tiered Governance Strategy: A Case Study of Nanjing’s Yihe Road Historic District, China. Land 2025, 14, 1894. [Google Scholar] [CrossRef]
  43. Zheng, G.; Ding, L.; Zheng, J. A Multi-Dimensional Evaluation of Street Vitality in a Historic Neighborhood Using Multi-Source Geo-Data: A Case Study of Shuitingmen, Quzhou. ISPRS Int. J. Geo-Inf. 2025, 14, 240. [Google Scholar] [CrossRef]
  44. Fang, K.; Wu, Y. The importance of integrating historic context and activities into heritage district: Enhancing attraction and vitality. npj Herit. Sci. 2025, 13, 434. [Google Scholar] [CrossRef]
  45. Heng, X.; Zhang, Y.; Liu, W.; Shen, Y. Comprehensive vitality evaluation and spatio-temporal characteristics of nighttime tourism in Shenzhen: An empirical analysis based on multi-source data integration. Curr. Issues Tour. 2026, 29, 449–476. [Google Scholar] [CrossRef]
  46. Della Spina, L. Multidimensional Assessment for “Culture-Led” and “Community-Driven” Urban Regeneration as Driver for Trigger Economic Vitality in Urban Historic Centers. Sustainability 2019, 11, 7237. [Google Scholar] [CrossRef]
  47. Hu, H. Distribution patterns and environmental influences on China’s cultural heritage: A climate and geographical analysis. Environ. Dev. 2025, 58, 101419. [Google Scholar] [CrossRef]
  48. Zhou, M.; Yang, J. Geospatial spatiotemporal analysis of tourism facility attractiveness and tourism vitality in historic districts: A case study of Suzhou Old City. Land 2025, 14, 922. [Google Scholar] [CrossRef]
  49. Huang, J.; Hu, X.; Wang, J.; Lu, A. How diversity and accessibility affect street vitality in historic districts? Land 2023, 12, 219. [Google Scholar] [CrossRef]
  50. Fan, Y.; Tian, J.; Sun, D.; Li, S.; Liu, M.; Ji, Q.; Yin, W. Spatial pattern and driving mechanisms of ICH soundscape in Jilin: A GeoAI framework for cultural sustainability. npj Herit. Sci. 2026, 14, 281. [Google Scholar] [CrossRef]
  51. Gao, W.; Zhuo, X.; Xiao, D. Spatial patterns, factors, and ethnic differences: A study on ethnic minority villages in Yunnan, China. Heliyon 2024, 10, e27677. [Google Scholar] [CrossRef]
  52. Yuan, M.; Yang, Z.; Han, F. Grassland phenology dynamics and tourism dependence in Narat Shan of the Tianshan World Natural Heritage Site, China. npj Herit. Sci. 2026, 14, 22. [Google Scholar] [CrossRef]
  53. Zhang, Z.; Li, Q.; Hu, S. Intangible cultural heritage in the Yellow River Basin: Its spatial–temporal distribution characteristics and differentiation causes. Sustainability 2022, 14, 11073. [Google Scholar] [CrossRef]
  54. Sun, H.; Zhang, S.; Wang, J. Spatial distribution patterns of urban historic building groups combined with algebraic geometry and their planning and design strategies research. J. Comb. Math. 2025, 127b, 1035–1052. [Google Scholar] [CrossRef]
  55. Niu, Y.; Wang, Y. Regeneration or degeneration? Living heritage evaluation for traditional villages by GWPCA model: Evidence from 60 cases in southeast Shanxi, China. Front. Archit. Res. 2026, 2095–2635, in press. [Google Scholar] [CrossRef]
  56. Ge, B.; Song, Y.; Wang, J.; Wang, Y.; Yuan, X. Spatio-temporal pattern and entropy variation of agricultural heritage in China. Herit. Sci. 2024, 12, 415. [Google Scholar] [CrossRef]
  57. Zhu, J.; Xu, W.; Xiao, Y.; Shi, J.; Hu, X.; Yan, B. Temporal and spatial patterns of traditional village distribution evolution in Xiangxi, China: Identifying multidimensional influential factors and conservation significance. Herit. Sci. 2023, 11, 261. [Google Scholar] [CrossRef]
  58. Fahmy, A. Landscape change detection and its impact on ancient egyptian UNESCO built heritage in Abu Ghurab, Abusir, and Saqqara World Heritage Sites, Badrashin, Giza, Egypt. Heritage 2026, 9, 5. [Google Scholar] [CrossRef]
  59. Liu, Y.; Du, X.; Bai, Y.; Chen, Q.; Liu, S. Bridging heritage systems: Multi-scale spatial coupling between tangible and intangible cultural heritage in China using hierarchical Bayesian model and causal inference. Land 2025, 14, 2386. [Google Scholar] [CrossRef]
  60. Min, T.; Zhang, T. Resilience mechanisms in local residential landscapes: Spatial distribution patterns and driving factors of Ganlan architectural heritage in the Wuling Corridor. Heritage 2025, 8, 458. [Google Scholar] [CrossRef]
  61. Shen, W.; Li, Y.; Qin, Y.; Cheng, J. Influencing mechanism of climate and human activities on ecosystem health in the middle reaches of the Yellow River of China. Ecol. Indic. 2023, 150, 110191. [Google Scholar] [CrossRef]
  62. Yu, J.; Safarov, B.; Wang, C.; Buzrukova, M.; Janzakov, B. The effect of transportation networks on heritage tourism and new urbanization—Empirical research based on rich heritage sites in a Chinese province. Heritage 2023, 6, 7293–7315. [Google Scholar] [CrossRef]
  63. Bitaraf, A.; Zarabadi, Z.S.S.; Zabihi, H. Rereading the criteria of vitality in historical places with emphasis on the approach of heritage tourism. Islam. Art Stud. 2021, 18, 103–123. [Google Scholar] [CrossRef]
  64. Sun, J.; Chen, S.; Huang, Y.; Rong, H.; Li, Q. Harnessing GPS spatiotemporal big data to enhance visitor experience and sustainable management of UNESCO heritage sites: A case study of mount Huangshan, China. ISPRS Int. J. Geo-Inf. 2025, 14, 396. [Google Scholar] [CrossRef]
  65. Nocca, F. The role of cultural heritage in sustainable development: Multidimensional indicators as decision-making tool. Sustainability 2017, 9, 1882. [Google Scholar] [CrossRef]
  66. Liu, J.; Li, Y.; Xu, Y.; Zhuang, C.C.; Hu, Y.; Yu, Y. Impacts of built environment on urban vitality in cultural districts: A case study of Haikou and Suzhou. Land 2024, 13, 840. [Google Scholar] [CrossRef]
Figure 1. Study area. (a) The Yellow River Basin in China (base map sourced from the China Na-tional Geographic Information Public Service Platform—Tianditu; reviewed under map approval number: GS (2019) 1652; https://www.tianditu.gov.cn/ (accessed on 4 November 2025); (b) the Henan section of the Yellow River Basin.
Sustainability 18 05347 g001
Figure 2. Study subjects.
Sustainability 18 05347 g002
Figure 3. Study framework.
Sustainability 18 05347 g003
Figure 4. Kernel density analysis of cultural heritage in the Henan section of the Yellow River Basin.
Sustainability 18 05347 g004
Figure 5. Kernel density analysis of cultural heritage activation levels in the Henan section of the Yellow River Basin.
Sustainability 18 05347 g005
Table 1. Quantitative Indicator System for Evaluating the Cultural Heritage Activation Level.
DimensionIndicator/WeightsDescriptionData/SourceProcessing Method/Formula
Cultural
Dimension
(0.3)
Academic Influence
(0.15) [40]
Reflects the level of scholarly attention and knowledge output related to cultural heritage in the academic research field, indicating the dissemination of heritage academic value and the vitality of cultural research.Number of academic publications over the past five years using the names of cultural heritage sites as keywords in databases such as CNKI, Wanfang, and VIP, as well as journal impact factors.
Source: https://www.cnki.net/ (accessed on 1 May 2026)
The total number of publications related to each cultural heritage site was calculated and weighted according to journal category (core journals = 2.0; general journals = 1.0). The values were then logarithmically transformed using ln(x + 1) and normalized.
Density of Cultural Exhibition Facilities
(0.15) [41]
Reflects the abundance of cultural service facilities surrounding cultural heritage sites, including museums, exhibition halls, cultural centers, and memorial halls, indicating the supporting capacity for cultural dissemination and exhibition.POI data of cultural exhibition facilities from Amap Open Platform in 2025.
Source: https://lbs.amap.com/ (accessed on 1 May 2026)
H = 1 n h 2 i = 1 n K ( d i h )
where n denotes the total number of facilities within the study area; h represents the bandwidth; K is the quadratic kernel function; and di denotes the Euclidean distance between facility i and the geometric center.
Social
Dimension
(0.45)
Online Attention
(0.125) [42]
Reflects the degree of public attention received by cultural heritage sites on internet platforms, indicating public awareness and online influence.Search volume data in 2025 using cultural heritage site names as keywords from Baidu Index.
Source: https://index.baidu.com/v2/index.html#/ (accessed on 1 May 2026)
Search index values for each cultural heritage site were collected and standardized using min–max normalization.
Visit Activity
(0.175) [43]
Reflects the actual attractiveness of cultural heritage sites to tourists and visitors. User comment behaviors on social media platforms—including the number of comments, number of unique users, and interaction volume—were used to characterize offline visitation popularity and social participation intensity.User comment data from platforms such as Xiaohongshu, Weibo in 2025.
Source: https://www.xiaohongshu.com/explore (accessed on 1 May 2026)
The total number of comments, number of unique users, and total number of likes associated with each cultural heritage site were calculated and normalized separately. Indicator weights were determined using the entropy weight method, and a composite visit activity index was subsequently calculated.
Density of Supporting Public Service Facilities (0.15) [44]Reflects the completeness of public service facilities surrounding cultural heritage sites, including stations, toilets, parking lots, and tourist service centers, which affect visitor convenience and willingness to stay.POI data of supporting public service facilities from Amap Open Platform in 2025.
Source: https://lbs.amap.com/ (accessed on 1 May 2026)
H = 1 n h 2 i = 1 n K ( d i h )
where n denotes the total number of facilities within the study area; h represents the bandwidth; K is the quadratic kernel function; and di denotes the Euclidean distance between facility i and the geometric center.
Economic
Dimension
(0.25)
Nighttime Light
Index (0.12) [45]
Reflects regional economic activity and urbanization level, indicating the economic prosperity and consumption potential surrounding cultural heritage sites.Monthly nighttime light data in 2025 from Earth Observation Group (EOG).
Source: https://eogdata.mines.edu/products/vnl/ (accessed on 1 May 2026)
V = 1 12 i = 1 12 N T L i
where NTLi represents the nighttime light brightness value for month i.
Density of Cultural Tourism Commercial Service Facilities (0.13) [46]Reflects the degree of tourism commercialization surrounding cultural heritage sites, including souvenir shops, homestays, cultural and creative stores, and specialty restaurants, indicating the economic transformation capacity of heritage activationPOI data of cultural tourism commercial facilities from Amap Open Platform in 2025.
Source: https://lbs.amap.com/ (accessed on 1 May 2026)
H = 1 n h 2 i = 1 n K ( d i h )
where n denotes the total number of facilities within the study area; h represents the bandwidth; K is the quadratic kernel function; and di denotes the Euclidean distance between facility point i and the geometric center.
Table 2. Indicator System of Influencing Factors for the Cultural Heritage Activation Level.
DimensionIndicatorDescriptionData/SourceProcessing Method/Formula
Heritage
Resource Endowment
Heritage
Agglomeration [47]
Reflects the clustering effect of cultural heritage and represents the competitiveness of regional cultural heritage resources.Vector data of cultural heritage sites; sourced from the Third National Cultural Relics Census of Henan Province and lists of cultural heritage protection units.
H = 1 n h 2 i = 1 n K ( d i h )
where n denotes the total number of cultural heritage sites within the study area; h represents the bandwidth; K is the quadratic kernel function; and di denotes the Euclidean distance between heritage site i and the geometric center.
Heritage Spatial
Radiation [48]
Quantifies the adaptability between the scale of cultural heritage and its potential regional sphere of influence. By delineating the influence area of each heritage site using Thiessen polygons and integrating the heritage scale, this indicator evaluates service coverage capacity and resource carrying efficiencyArea data of cultural heritage sites and generated Thiessen polygons; sourced from the Third National Cultural Relics Census of Henan Province and lists of cultural heritage protection units.
S = S h i S v i
where Shi represents the area of cultural heritage site i, and Svi denotes the area of the corresponding Thiessen polygon.
Socioeconomic ConditionsTransportation
Accessibility [49]
Measures the convenience of access to heritage sites based on the distribution of the transportation network. A denser road network indicates higher accessibility.Vector road network data from OpenStreetMap in 2025.
https://www.openstreetmap.org/ (accessed on 1 May 2026)
A = k = 1 m L k S h
where Lk denotes the length of road k; m represents the number of roads within the unit area; and Sh denotes the unit area.
Per Capita GDP [50]Reflects the regional economic development level and represents the supporting role of residents’ consumption capacity in cultural heritage activation.County-level per capita GDP data in 2025; sourced from the Henan Statistical Yearbook, municipal statistical yearbooks, and county statistical bulletins. The per capita GDP value of the county where each cultural heritage site is located was assigned to the corresponding heritage site.
Natural Geographical FoundationTerrain Relief [51]Characterizes the degree of surface elevation variation and reflects terrain complexity and construction suitability. Terrain relief affects infrastructure layout and land-use patterns, thereby influencing the utilization potential of cultural heritage.Digital elevation data publicly available from the Geospatial Data Cloud of the Chinese Academy of Sciences.
https://www.gscloud.cn/home (accessed on 1 May 2026)
R = E m a x E m i n
Representing the difference between the maximum and minimum elevations within a specified neighborhood range.
NDVI [52]Reflects vegetation coverage and ecological environmental conditions, indicating the influence of the surrounding natural ecological environment on heritage activation and utilization.NDVI data publicly available from the Geospatial Data Cloud of the Chinese Academy of Sciences.
https://www.gscloud.cn/home (accessed on 1 May 2026)
The NDVI value of the raster cell in which each cultural heritage site is located was calculated.
Table 3. Cultural heritage counts by city.
CityArea (km2)CountProportion (%)
Zhengzhou7594.6010329.94
Luoyang15,301.486518.90
Sanmenxia9996.97339.59
Jiaozuo3982.49339.59
Shangqiu10,694.98298.43
Xinxiang8284.61226.40
Anyang7350.12216.10
Puyang4267.87144.07
Hebi2140.54133.78
Kaifeng6244.75113.20
Table 4. Average Nearest Neighbor analysis for the Henan section of the Yellow River Basin.
Average Observation
Distance/m
Theoretical Average
Distance/m
Adjacent Index Rz-Scorep-ValueDistribution Pattern
5868.62187401.05270.792944−7.3467880.000000Clustered
Table 5. Average Nearest Neighbor analysis by city.
CityAverage Observation
Distance/m
Theoretical Average
Distance/m
Adjacent Index Rz-Scorep-ValueDistribution Pattern
Zhengzhou3973.82824615.66210.860944−2.7259270.006412Clustered
Luoyang4543.77316805.27010.667684−5.0058450.000001Clustered
Sanmenxia6410.39729656.95470.663811−3.7501900.000177Clustered
Jiaozuo5284.03394983.82781.0602360.6619790.507984Random
Shangqiu8289.39138575.28190.966661−0.3493360.726837Random
Xinxiang8645.84867696.20751.1233911.0817410.279368Random
Anyang10,368.49269139.54091.1344651.1788290.238466Random
Puyang6042.61506253.03830.966349−0.2408780.809649Random
Hebi6070.23036713.07590.904240−0.6605230.508919Random
Kaifeng16,596.765210,352.39341.6031813.6490420.000263Dispersed
Table 6. Statistics of cultural heritage activation levels by city.
CityCountCHAL-AverageCHAL-MaxCHAL-Min
-3440.06710.59000.0009
Zhengzhou1030.07920.59000.0050
Luoyang650.09650.39970.0046
Sanmenxia330.04240.15090.0009
Jiaozuo330.04150.16210.0071
Shangqiu290.04160.17350.0040
Xinxiang220.06500.14360.0036
Anyang210.04610.29290.0038
Puyang140.07890.22730.0099
Hebi130.06090.15630.0239
Kaifeng110.03540.15940.0039
Table 7. Spatial autocorrelation analysis for the Henan section of the Yellow River Basin.
Expected IndexVarianceMoran’ s I Indexz-Scorep-ValueDistribution Pattern
−0.0029150.0009610.37535012.2044080.000000Clustered
Table 8. Spatial autocorrelation analysis by city.
CityExpected IndexVarianceMoran’ s I Indexz-Scorep-ValueDistribution Pattern
Zhengzhou−0.0096150.0030840.5144149.4366370.000000Clustered
Luoyang−0.0163930.0050830.4933627.1501240.000000Clustered
Sanmenxia−0.0303030.0109170.2569992.7496840.005965Clustered
Jiaozuo−0.0312500.0270920.2704851.8331740.066777Clustered
Shangqiu−0.0344830.016983−0.093091−0.4497310.652905Random
Xinxiang−0.0500000.0280330.0883461.4235630.154573Random
Anyang−0.0500000.009919−0.120826−0.7111440.476995Random
Puyang−0.0769230.0289660.3483652.4988350.012460Clustered
Hebi−0.0833330.0535230.0907190.7523310.451852Random
Kaifeng−0.1111110.032421−0.260454−0.8294190.406867Random
Table 9. Diagnostic results of the OLS global regression model.
Number of ObservationsAICcR2Adjusted R2Joint F-StatisticJoint Chi-Square StatisticKoenker (BP) StatisticJarque–Bera Statistic
344−950.7902030.3598840.34848731.577811
(p = 0.0000)
97.610655
(p = 0.0000)
67.117593
(p = 0.0000)
521.067333
(p = 0.0000)
Table 10. Variable results of the OLS global regression model for factors influencing cultural heritage activation level.
Explanatory VariableCoefficientStd. ErroRobust_SERobust_PrVIF
Heritage Agglomeration0.0001580.0000570.0000690.022886 **1.593290
Heritage Spatial Radiation0.0000730.0000200.0000210.000570 **1.059324
Transportation Accessibility−0.0001350.0000520.0000530.011521 **1.474190
Per Capita GDP0.0044360.0006170.0012240.000345 **1.357074
Terrain Relief−0.0010460.0002580.0001830.000000 **1.067213
NDVI−0.1522320.0299220.0360480.000036 **1.115448
Note ** reveal statistical significance at 1% levels, respectively.
Table 11. Diagnostic results of the GWR model.
R2R2 AdjustedAICcσ2Sigma
Squared MLE
Effective DFPseudo t Critical Value (Adjusted)
0.8230.716−1095.32220.00160.0010214.63062.9608
Disclaimer/Publisher’s Note: The statements, opinions and data contained in all publications are solely those of the individual author(s) and contributor(s) and not of MDPI and/or the editor(s). MDPI and/or the editor(s) disclaim responsibility for any injury to people or property resulting from any ideas, methods, instructions or products referred to in the content.