Article

Beyond Connectivity: Keys to Technology Adoption in Rural Amazonian Livestock Farming
by
Polito Michael Huayama Sopla
1,
Daily Rocío La Torre Camán
1,
Jhunniors Puscan Visalot
2 and
Angelica María Carrasco Rituay
1,*
1
Instituto de Investigación en Negocios Agropecuarios, Universidad Nacional Toribio Rodríguez de Mendoza de Amazonas (UNTRM), Chachapoyas 01001, Peru
2
Instituto de Investigación en Economía y Desarrollo Económico, Universidad Nacional Toribio Rodríguez de Mendoza de Amazonas (UNTRM), Chachapoyas 01001, Peru
*
Author to whom correspondence should be addressed.
Sustainability 2026, 18(11), 5346; https://doi.org/10.3390/su18115346
Submission received: 30 March 2026 / Revised: 30 April 2026 / Accepted: 13 May 2026 / Published: 26 May 2026
(This article belongs to the Section Sustainable Urban and Rural Development)

Abstract

Digital technologies are increasingly recognized as key tools for improving productivity and supporting rural development in agricultural systems. However, their effective adoption by small-scale producers remains limited in many developing regions. This study analyses the determinants of mobile application adoption among livestock farmers in Amazonas, Peru. Using a structural equation model (PLS-SEM) based on survey data from 160 producers in rural areas, the results show that perceived ease of use is the main driver of adoption, directly influencing farmers’ intention to use mobile applications and significantly determining perceived usefulness, which acts as a key mediating factor. Despite widespread smartphone ownership, their use is largely limited to communication and social media rather than production management, mainly due to barriers such as mistrust, limited rural connectivity, and insufficient digital knowledge. The findings suggest that effective adoption requires integrated strategies that combine the development of user-friendly applications, the demonstration of their economic benefits for producers, and public policies aimed at improving digital infrastructure and strengthening digital skills. By identifying the key determinants of adoption, this study contributes to understanding how mobile technologies can support productivity improvements and promote rural development in livestock systems in the Peruvian Amazon.

1. Introduction

The digitization of the agricultural sector has emerged as a powerful driver of transformation, enhancing productivity, sustainability, and decision-making across value chains. For example, ref. [1] emphasizes that the integration of digital technologies enables “precision in agriculture and livestock farming, smart monitoring, and automation,” contributing to higher productivity, resource efficiency, and environmental sustainability. In line with this, recent empirical studies show that digitization exerts a positive effect on productive performance throughout agricultural value chains [2,3].
Moreover, this digital revolution is not limited to production processes but is reshaping the ways in which producers access, generate, and disseminate agronomic knowledge. As ref. [4] note, agricultural information was traditionally disseminated through mass media such as newspapers, television, and radio. However, the rapid expansion of mobile platforms has reconfigured communication channels: ref. [5] observe that the growth of digital technologies, “especially mobile platforms,” has opened new pathways for alternative knowledge flows and empowered farmers and ranchers by enabling more immediate, interactive, and decentralized access to information.
This shift has transformed livestock farming practices, enabling producers to improve their decision-making processes and expand their sources of technical knowledge. Digital livestock farming represents a substantial evolution in production systems, grounded in the integration of advanced information technologies into livestock management [6]. Through tools such as big data analytics, computer vision, artificial intelligence, machine learning, and deep learning, livestock operations can optimize efficiency, monitor activities in real time, and implement more informed and strategic management decisions.
Despite these advancements, the adoption of digital technologies among small-scale rural livestock farmers remains notably limited [7]. Persistent gaps in remote regions—such as low internet penetration, weak digital infrastructure, and insufficient technology training—continue to hinder the effective implementation of digital tools [1].
Beyond their technological potential, information technologies (IT) play a critical role in fostering economic, social, and human development in rural territories [8]. Digital tools facilitate access to technical knowledge, reduce information asymmetries, and strengthen farmers’ capacity to make evidence-based production decisions. In this sense, the adoption of mobile applications in agriculture is increasingly recognized as a mechanism for promoting inclusive rural development, improving productivity, and enhancing the resilience of smallholder farming systems [9]. Consequently, understanding the determinants of digital technology adoption among rural producers is not only a technological issue but also a key factor for advancing sustainable rural development and reducing structural inequalities in marginalized regions [10].
Although prior studies have documented the benefits of digital technologies for livestock productivity and management, little is known about the specific mechanisms through which rural livestock farmers, particularly in Amazonian, contexts evaluate, internalize, and decide to adopt mobile applications. Existing research has not sufficiently examined how perceived ease of use, perceived usefulness, and contextual constraints jointly shape technology adoption in environments characterized by low connectivity and limited digital literacy. This is especially relevant given that most empirical evidence on digital livestock technologies has focused on industrialized or peri-urban contexts, leaving a gap regarding small-scale producers in remote rural territories.
The adoption of digital technologies in rural and agricultural sectors is highly context-dependent, requiring tailored solutions rather than one-size-fits-all approaches [11]. Recent studies using structural equation modeling have successfully identified the key factors driving adoption, but they focus predominantly on socio-demographically or structurally distinct populations. Research on agricultural cooperatives highlights the critical mediating role of government support, organizational competence, and formal training [12], while studies in rural Asia emphasize demographic dividends such as youth and higher education levels as key enablers of digital inclusion.
Furthermore, although the existing literature acknowledges exogenous barriers such as internet connectivity [13] and psychological factors such as technology anxiety, these variables are rarely analyzed together in the context of small-scale livestock farming [14].
Across South America, empirical evidence exposes a deep regional divide. Nations with large-scale agribusinesses, such as Brazil and Argentina, lead the adoption of tools like GPS, mapping, and mobile applications [5]; conversely, the broader Latin American and Caribbean (LAC) region lags significantly, with small-scale farmers hindered by limited funding, low digital literacy and severe infrastructural deficits [15].
This “infrastructure and literacy trap” is particularly severe for marginalized smallholder farmers, given that only about 45% of rural households in Latin America have internet access; digital initiatives risk exacerbating existing inequalities due to high costs and the concentration of technology in resource-rich companies [16], in comparable contexts such as Ecuador, where smallholder farms predominate 80% of producers report lacking sufficient information to make the transition to digitalization [16], although systematic reviews emphasize the need for context-specific tools, ongoing training and robust public policies to support smallholder farmers [17], the theoretical frameworks used to assess technology acceptance have not been fully adapted to these realities.
Most studies using the Technology Acceptance Model (TAM) typically assume a basic level of digital literacy, social infrastructure or institutional support that is largely absent in remote agricultural areas. Current technocentric approaches often fail to account for how severe infrastructure deficits and psychological barriers such as technology anxiety [13], fundamentally alter the basic cognitive constructs of perceived ease of use and perceived usefulness; therefore, this study addresses this critical gap by testing the TAM in the Peruvian Amazon, examining how geographic isolation and limited digital ecosystems explicitly redefine the farmer’s practical interaction with mobile management tools.
Models such as the Theory of Planned Behavior (TPB) and the Theory of Reasoned Action (TRA) have been identified; these models provide a general framework for behavior. In contrast, the TAM adapts these principles specifically to technology, replacing “general attitude” with utility and ease of use—concepts that are more directly applicable in information technology contexts [18,19].
The Technology Acceptance Model (TAM) has become one of the most widely used frameworks for studying technology adoption across multiple sectors. Reviews in software, energy, construction, banking, healthcare, IoT, education, AI, and other fields show that TAM or its extensions are the most widely used framework for understanding adoption behavior [19,20,21], as it is based on just two highly intuitive core constructs: perceived usefulness (PU) and perceived ease of use (PEOU), which explain both the intention to use and actual use [22,23].
Therefore, this study contributes to existing literature in two main ways. First, it extends the application of the Technology Acceptance Model (TAM) to the context of small-scale livestock farmers in the Amazon region, a setting that has received limited empirical attention in studies of digital agriculture. Second, it provides empirical evidence on how perceived ease of use and perceived usefulness interact to influence farmers’ intentions to adopt mobile applications under structural constraints such as limited connectivity and digital skills. By addressing these dimensions simultaneously, the study offers new insights into the socio-technological factors that shape digital transformation in rural contexts.
Accordingly, the present study addresses the following research question: How do perceived ease of use and perceived usefulness influence rural livestock producers’ intention to adopt mobile applications for management in contexts characterized by limited digital infrastructure and connectivity?
Based on this premise, the present study analyzes the determinants of mobile application adoption for livestock management among rural livestock farmers in the Amazonas region of Peru. Specifically, it evaluates the extent to which ease of use and perceived usefulness mediate the intention to use digital applications, considering the structural constraints and socio-productive characteristics of remote rural environments.

2. Literature Review

2.1. Digitalization and Livestock Management Technologies

The integration of digital technologies into livestock systems has expanded rapidly over the past decade, with the aim of optimizing real-time production decision-making [24]. Ref. [1] notes that the digital economy acts as a transformative force in the agricultural sector, enabling technological innovations with far-reaching effects that extend throughout value chains. Within this framework, technologies such as big data analytics, computer vision, artificial intelligence, and machine learning enable livestock operators to optimize efficiency, monitor production activities, and make more strategic management decisions [6].
Technological tools have a significant influence on the management of production systems due to their positive impact on livestock productivity [25]. New technologies make it possible to forecast and predict economically significant events based on comprehensive databases [26], while sensors, big data, and artificial intelligence algorithms help minimize costs, maximize production, and increase operational efficiency [1]. The adaptability of these technologies has enabled management decisions based on real-time data flows, generating positive impacts in economic, health, agricultural, and environmental dimensions.
However, despite this potential, the adoption of digital technologies among small-scale rural producers remains limited; this is because persistent structural gaps in remote regions—such as a lack of internet access, weak digital infrastructure, and insufficient technological training—hinder the implementation of digital tools [1]. This situation is particularly relevant in contexts such as the Peruvian Amazon, where small-scale livestock systems operate under constraints related to connectivity and digital literacy that limit the feasibility of technological transformation [3].
In the specific context of mobile applications for livestock farming. Ref. [7] demonstrate that ease of use and perceived usefulness are primary determinants of adoption intent, even among producers with limited technological experience. Furthermore, mobile applications that are most sustainable over time are those whose value is based on efficiency, security, design, and the ability to integrate additional features that are useful to the user [27]. Based on this, the following hypothesis is proposed:
Hypothesis 1 (H1).
The use of mobile apps has a positive and significant influence on the perceived ease of use among livestock farmers.

2.2. Socioeconomic and Contextual Factors in Rural Technology Adoption

The adoption of digital technologies in rural settings is not driven by the intrinsic characteristics of the tools themselves but is instead influenced by the socioeconomic profile of producers and the structural conditions of the environment in which they operate. Ref. [28] identify socioeconomic factors such as age, education, gender, and income as the primary determinants of adoption. This finding is consistent with those reported by studies in Latin America, where similar dynamics linked to the producer’s profile have been documented [29].
Producers’ resources, knowledge, and skills influence their perception of how easy it is to use these technologies; additionally, variables such as gender, age, marital status, and membership in organizations affect their intentions to adopt them [4]. The review in [30] of 109 studies consistently indicates that digital literacy promotes earlier and more efficient use of digital tools, thereby strengthening the digital transformation process in rural areas.
Similarly, younger farmers are more willing to adopt digital technologies than older farmers [28]. However, ref. [31] note that when the perceived economic and productive value is high, generational differences tend to diminish. In terms of production scale. Ref. [28] indicate that in low- and middle-income countries, farmers with higher incomes and educational levels are more likely to use technologies related to production and market access.
In remote rural areas, limited internet connectivity is a key barrier to digitalization [1], a situation closely linked to the achievement of Target 9c of the Sustainable Development Goals, which promotes universal and affordable access to ICTs in developing countries [10]. In Latin America, the analysis in [29] identifies limited digital literacy, financial constraints, a shortage of skilled labor, and infrastructure inadequacies as central barriers, with producer education and training serving as the primary drivers of adoption.
Previous technological experience is a factor that influences the perception of ease of use [32]; researchers incorporated this into the TAM and found that prior exposure to digital technologies increases the willingness to adopt them. Daily interaction with social media applications can serve as a learning pathway that gradually strengthens the user’s confidence and familiarity with technology. Therefore, the following hypothesis is proposed:
Hypothesis 2 (H2).
Previous use of technology has a positive and significant influence on the perceived ease of use among livestock farmers.

2.3. ICT as a Tool for Rural Development

Beyond their immediate productive potential, information and communication technologies play an important role in promoting economic, social, and human development in rural areas [33],. From the perspective of ICT for Development, these tools serve as mechanisms that can strengthen the productive capacities of rural farmers and enhance their participation in broader economic ecosystems [10]. The analysis in [31] in Ghana documents that agricultural digitization has positive effects on the livelihoods of smallholder farmers, improving access to information, decision-making, and integration into value chains.
ICTs facilitate access to technical knowledge, reduce information asymmetries, and strengthen farmers’ ability to make evidence-based production decisions [34]. In African and Latin American contexts, where traditional agricultural extension systems face constraints in terms of human resources and geographic coverage, digital platforms are emerging as viable alternatives for democratizing access to specialized knowledge [35]. These effects are particularly relevant for producers located in geographically isolated areas, where access to in-person technical assistance is limited.
The systematic review of technology adoption conducted by [28] confirms that ICTs linked to extension services have the highest adoption rates compared to other types of agricultural technologies, suggesting that rural producers particularly value tools that allow them to access information and technical advice directly and in a timely manner. This perspective is consistent with [10], who demonstrate that the digital economy strengthens the adoption of green technologies in agriculture, with implications for the productivity and sustainability of agricultural systems.
In this regard, the adoption of mobile applications in agriculture serves as a mechanism to promote inclusive rural development, improve productivity, and strengthen the resilience of small-scale production systems [9]. Therefore, understanding the determinants of digital technology adoption among rural producers is not merely a technological issue but a key factor in advancing toward sustainable rural development and reducing structural inequalities in marginalized regions [10].

2.4. The Technology Acceptance Model in Agricultural Contexts

The Technology Acceptance Model (TAM), proposed by [36], posits that the intention to use a technology is determined by two constructs: perceived usefulness and perceived ease of use. This model has demonstrated its explanatory power in technology adoption settings and has been expanded in successive versions to incorporate contextual, social, and organizational variables that enhance its predictive power [37].
In the agricultural sector, the TAM has been successfully applied to explain the adoption of digital innovations, particularly in agricultural management. Ref. [38] in Sub-Saharan Africa, based on 14 empirical studies, conclude that perceived utility is the most influential factor in the adoption of agricultural mobile applications, with tangible benefits being the main motivators for producers. Meanwhile, perceived ease of use is determined by the user-friendliness of the interface, the simplicity of the platform, and the availability of support infrastructure.
TAM has also been studied in the context of small-scale producers in developing economies. Ref. [39] among Colombian livestock farmers found that both perceived ease of use and perceived usefulness have significant effects on attitudes and adoption intention. Similarly, ref. [40] in Nepal confirm that perceived ease of use does not operate independently, but rather its effect on usage intention is mediated by perceived usefulness, a pattern that recurs in various contexts across the Global South. Ref. [32] identified that low perceived complexity is a critical condition for adoption among German livestock producers, while ref. [7] demonstrated that in contexts of low digital exposure, intuitive design becomes a key enabling condition for the initial acceptance of technological innovations. In small-scale production systems where resource constraints are significant, technological innovations tend to be evaluated primarily based on their immediate contribution to productivity and income stability [31].
Based on the revised conceptual framework, the TAM provides a solid, empirically validated foundation for analyzing technology adoption in rural agricultural contexts. However, the available evidence focuses primarily on Asian, African, and European contexts, with little representation of Latin American Amazonian regions characterized by simultaneous limitations in connectivity, digital literacy, and technical capacity. This gap justifies the application of the TAM in the specific context of this study and supports the three central hypotheses of the proposed model:
Hypothesis 3 (H3).
The ease of use of mobile applications has a positive and significant influence on farmers’ intention to use them.
Hypothesis 4 (H4).
The ease of use of mobile applications has a positive and significant influence on farmers’ perceived usefulness.
Hypothesis 5 (H5).
The perceived usefulness of mobile applications has a positive and significant influence on farmers’ intention to use them.

3. Materials and Methods

This study adopts a quantitative, non-experimental, cross-sectional approach aimed at identifying the determinants that influence the adoption of mobile applications among livestock producers in rural areas of the Amazon region of Peru. A structural equation model based on partial least squares (PLS-SEM) was applied using SmartPLS 4 (SmartPLS GmbH, Bönningstedt, Germany), due to its ability to handle small samples, non-normal data, and models with reflective and formative constructs [41].
The methodological design directly supports the objective of identifying the determinants that influence the adoption of mobile applications among livestock producers in rural Amazonian contexts. The use of PLS-SEM enables simultaneous analysis of relationships between latent constructs such as perceived ease of use, perceived usefulness, and intention to use, allowing a more comprehensive understanding of the cognitive and contextual factors that shape technology adoption decisions.

3.1. Participants

The target population consisted of 160 livestock producers from rural areas in the districts of Leymebamba, Pomacochas, Santo Tomás, and Molinopampa, selected for having the highest level of livestock activity in the Amazon region.
The information was collected between June and September 2025. Although the sample size consists of 160 producers, it is sufficient for PLS-SEM according to the criterion of the “10-times rule” and Cohen’s power analysis, given that the maximum number of arrows pointing to a construct is small. Nevertheless, it is acknowledged that convenience sampling in areas of high activity introduces a bias that limits generalizability to subsistence producers

3.2. Data Collection

The data were obtained through a structured survey, designed based on the instruments proposed by [7,42]. Following a contextualization process to the rural livestock sector in the Amazon, the items were reworded to reflect local production practices, technological access conditions, and sociocultural characteristics of farmers. A content validity assessment was conducted through expert judgment involving specialists in agricultural extension and information systems, ensuring the relevance, clarity, and cultural appropriateness of the items.
The questionnaire included sociodemographic, socioeconomic, and mobile digital technology usage variables, as well as items related to the intention to use, perceived ease of use, and perceived usefulness of a mobile application for cattle management, based on the theoretical model of Technology Acceptance [36].
Each item was evaluated using a 5-point Likert scale (1 = strongly disagree; 5 = strongly agree). The application functions evaluated are related to the management of information on reproduction, animal health, feeding, production, and livestock marketing (Table 1).

3.3. Data Analysis

The analysis was performed using partial least squares structural equation modeling (PLS-SEM), following the methodology of [42]. This approach allows for the evaluation of the causal relationship between latent constructs and observed indicators, as well as the estimation of predictive models in contexts with sample constraints or the absence of multivariate normality [43].
For the construction of the conceptual model, the framework proposed by [32] was used as a reference, which addresses on-site and remote livestock digitization, integrating the individual and collective factors that influence technology adoption.
This approach was structured around two components: the measurement model and the structural model. The first defines the relationship between the observed indicators and the latent variables. For reflective constructs, the indicators are manifestations of the latent variable, expressed as
x i = λ i ξ j + ϵ i
where xi corresponds to the observable indicator, i to the factor loading, j to the latent variable, and i to the error term. On the other hand, formative constructs define the latent variable as a weighted linear combination of its indicators:
ξ j = i = 1 p w i j x i + ζ j
where wij corresponds to the weights assigned to each indicator and ζj to the unexplained variance [44]. This approach allows complex theoretical dimensions to be represented in which the indicators contribute complementarily to the construct.
The structural model, on the other hand, describes the causal relationships between latent variables using the equation, where η denotes endogenous variables, ξ denotes exogenous variables, B denotes the matrix of internal relationships, Γ denotes the matrix of external relationships, and ζ denotes the vector of structural errors.
η = B η + Γ ξ + ζ
The PLS model estimation process was performed using an iterative partial least squares algorithm, aimed at maximizing the explained variance ( R 2 ) of the dependent variables. This procedure involved three main stages: estimation of the external weights, which define the linear combinations of the indicators; calculation of the structural relationships between the constructs using partial regressions; and iterative re-estimation of the loadings until convergence and stability of the model parameters were achieved. To ensure model stability and reduce multicollinearity, the indicator with the highest loading contributing to the elevated VIF was removed, thereby achieving VIF values below the conservative threshold of 3.0 for all indicators.
Although contextual factors such as connectivity, digital literacy, and trust were identified as relevant barriers in the descriptive analysis, these variables were not incorporated as exogenous constructs in the PLS-SEM model. This decision was based on the parsimonious nature of the proposed TAM framework, which prioritizes core cognitive determinants such as perceived ease of use and perceived usefulness. Additionally, given the sample size and model complexity constraints, the inclusion of multiple contextual variables could have reduced the stability and predictive power of the model. Therefore, these factors were considered as contextual conditions influencing the interpretation of the results rather than as directly modeled constructs.

3.4. Ethics

The study complied with the ethical principles of confidentiality, informed consent, and respect for the autonomy of participants. All producers participated voluntarily, after being informed about the objectives of the study and the use of the data for exclusively academic and scientific purposes.

4. Results

4.1. Perception of Technology Adoption

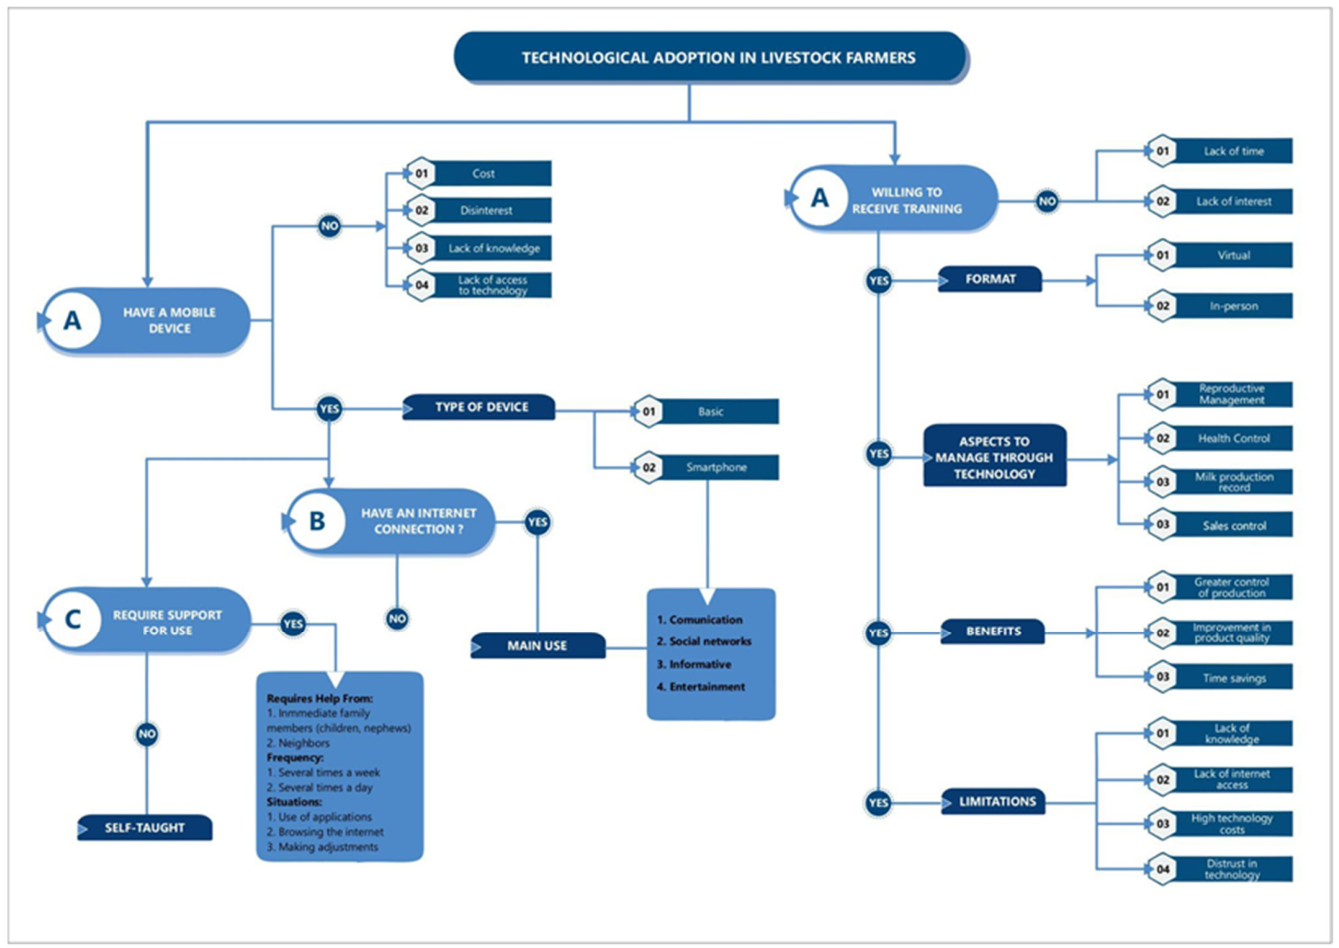
Based on the results of the survey administered to livestock farmers, a flowchart (Figure 1) was developed that summarizes the main factors influencing technology adoption in livestock management. Although the data comes from structured instruments, graphical representation allows for the visualization of the logical relationships between perceptions, limitations, and benefits associated with the use of digital technologies, facilitating an understanding of the decision-making process observed in the analyzed sample.
The flowchart shows that the most influential factors revolve around willingness to participate in training, expected benefits, and perceived barriers. Among the former, a preference for in-person training (70%) prevailed over virtual (8%) and hybrid (22%) formats, with particular interest in topics such as livestock management, health control, and production record-keeping. Regarding benefits, respondents identified improved production control (43%), time savings (34%), and optimization of product quality (18%) as the main motivators for adopting technology.
On the other hand, the most frequently cited limitations were a lack of knowledge regarding the use of digital tools (55%), poor internet connectivity in rural areas (24%), and the high cost of devices (18%). Likewise, it was evident that a group of livestock producers requires frequent assistance from third parties to use their phones or apps (41%), reflecting a dependency that limits technological autonomy. Finally, producers who do not use mobile devices cited reasons such as unfamiliarity with how they work, lack of access to devices, and perceived lack of interest, underscoring the need to strengthen rural digital training and local technological infrastructure.
The sociodemographic and livestock ownership data (Table 2) reveal a producer profile that is markedly young, with some diversity in production scale. 55.8% of respondents are under 25 years of age; however, the high standard deviation (s = 1.29) and a coefficient of variation of 62.4% indicate that the age distribution is heterogeneous, with a quarter of the sample consisting of producers over 50 years of age. Positive skewness (g1 = 0.57) and negative kurtosis (g2 = −1.47) confirm a distribution skewed toward younger ages but with heavy tails, meaning no pronounced concentration in any age bracket. Regarding gender, 59.4% identify as male, with low relative dispersion (CV = 36.4%) and a slightly asymmetric distribution, suggesting a moderate but not dominant representation of a single gender. With respect to the number of livestock heads, the four strata are distributed almost uniformly (between 21.7% and 27.5%); this fact corroborates the platykurtic kurtosis (g2 = −1.44) and a coefficient of variation of 45.9%, evidencing that the sample captures small—, medium—, and large—scale producers without a single ownership profile prevailing.
In the infrastructure and technological access block, a paradox relevant to the research is observed: although mobile phone ownership is nearly universal (96.7%, CV = 17.4%) and smartphone usage reaches 93.1%, the effective adoption of digital technology for livestock management is notably low, with only 15.6% declaring its use (CV = 26.8%, kurtosis = 6.75, indicating a distribution highly concentrated in the “No” category). This gap between device availability and productive use of technology constitutes the most significant finding of the study. Internet connectivity shows greater fragility: only 64.2% report a stable connection, with high dispersion (CV = 64.7%) reflecting very heterogeneous conditions depending on the area. Even so, 51.7% of respondents use the internet daily, albeit with high variability (CV = 67.2%, g1 = 1.05), suggesting concentrated use among an active subgroup. Finally, the mobile phone consolidates as the preferred device for management (63.3%), compared to 22.5% who use none; this finding, articulated with the low adoption of livestock software, points to a strategic opportunity: producers already possess the ideal device, but still lack digital tools adapted to their context.

4.2. Reliability and Validity

To gain a deeper understanding of the causal relationships between individual, productive, and perceptual variables, it was necessary to move toward an inferential analysis using the partial least squares structural equation modeling (PLS-SEM) approach. Therefore, following the recommendations of [45,46] the evaluation of latent constructs was carried out using internal consistency and convergent validity indicators to ensure the reliability of the proposed model. Composite reliability (CR) values greater than 0.70 and average variance extracted (AVE) values greater than 0.50 were considered acceptable.
The results (Table 3) showed that Cronbach’s alpha coefficients (CA) exceeded 0.90 in all constructs, demonstrating high internal consistency among the items that comprise them. Complementarily, the CR and AVE values were within the recommended ranges, confirming the reliability and convergent validity of the measurement model. Likewise, the variance inflation factor (VIF) values remained below the critical thresholds, suggesting the absence of multicollinearity among the indicators [47].

4.3. Model Goodness of Fit

The quality of the overall fit of the model was examined using the Standardized Root Mean Square Residual (SRMR), a metric that allows us to estimate the degree to which the model adequately reproduces the matrix of observed correlations. According to [48], SRMR values below 0.08 are considered indicative of an acceptable fit.
The results in Table 4 indicate that the standardized mean residual fit index (SRMR) is 0.048 and the d_ULS and d_G values are 4.355 and 4.728, demonstrating that the model has a good fit considering that it is not being compared with an independent model.
In Table 5, the CFI and TLI indices are not reported due to their lack of robustness in the context of PLS estimations. Instead, the evaluation focuses on explanatory power and predictive validity through the coefficient of determination (R2), effect sizes (f2) and the Stone-Geisser indicator (Q2). The Q2 values obtained through the blindfolding procedure were substantially greater than zero for all endogenous constructs (Ease of use = 0.514, Intention to use = 0.642, Perceived profit = 0.695), confirming the model’s strong out-of-sample predictive relevance.

4.4. Discriminant Validity

Discriminant validity was verified through a complementary approach integrating the heterotrait–monotrait ratio (HTMT) and the Fornell-Larcker criterion. The joint use of both methods provides a more rigorous and robust evaluation: while HTMT offers a more precise estimation of the true correlation between constructs, the Fornell-Larcker criterion corroborates that the variance shared with the error does not exceed the variance captured by the construct. This methodological triangulation ensures that each latent variable is conceptually unique, following the criteria of [49]. This indicator assesses whether the constructs included are conceptually distinct, accepting values below 0.90.
The results obtained (Table 6) showed that all HTMT coefficients were below the established threshold, confirming that each construct measures a unique concept and that the correlations between them are sufficiently differentiated. Additionally, the square root of AVE values (Table 7) exceeded the bivariate correlations between constructs, reinforcing the convergent and discriminant validity of the model.

4.5. Structural Equation Model

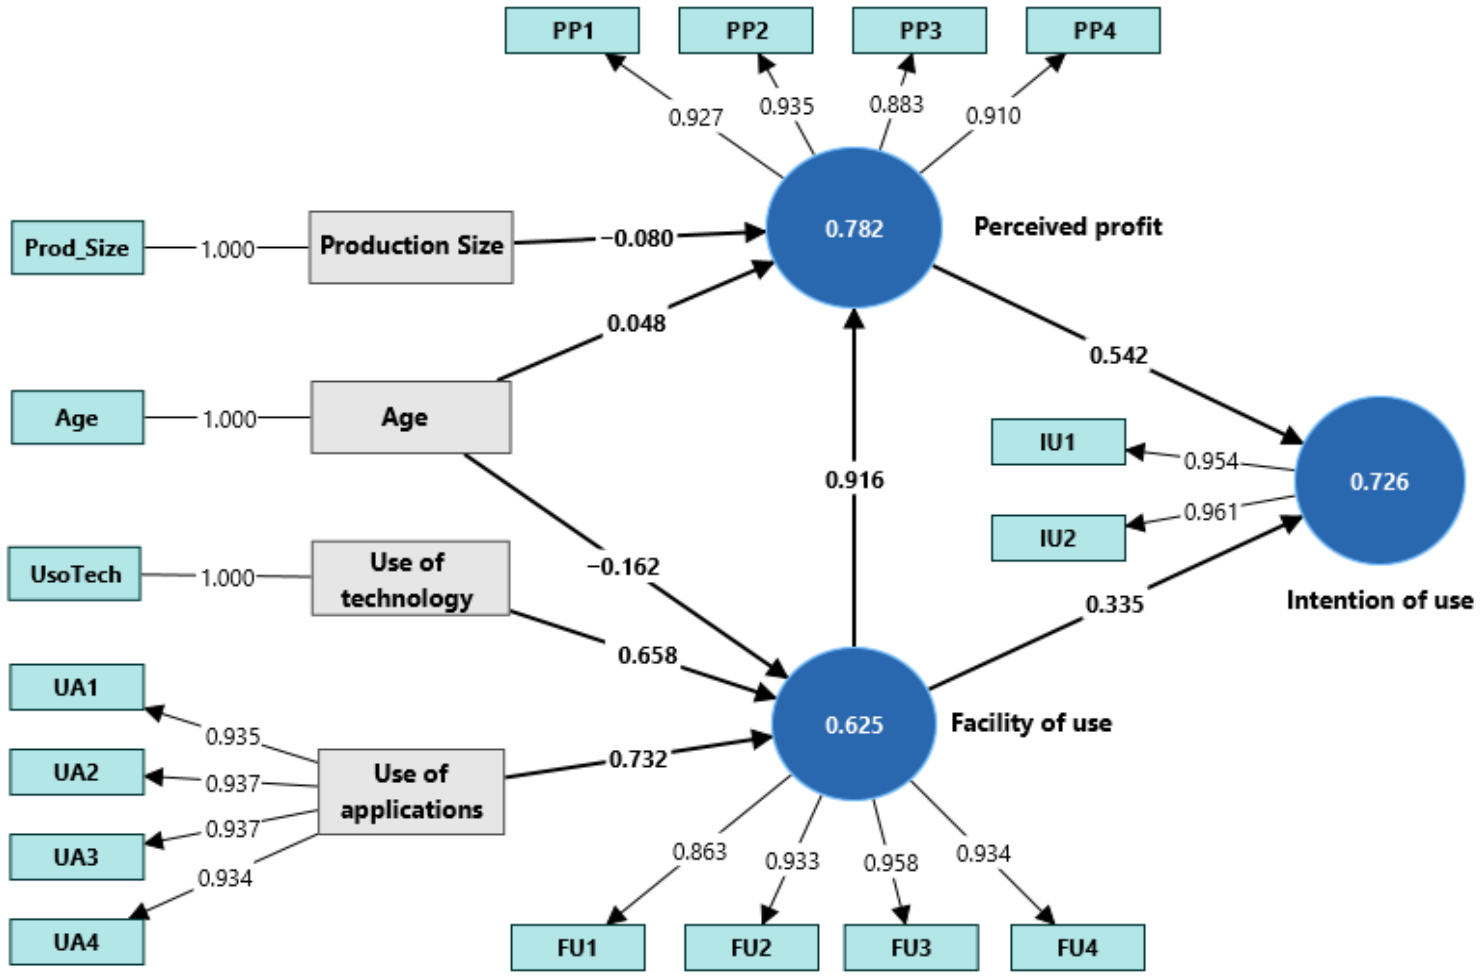
The structural model estimated using PLS-SEM (Figure 2) allows us to understand the causal relationships between the proposed variables. The results show that perceived ease of use is the main determinant of both perceived usefulness and effective use of technological applications in livestock management.
Likewise, perceived usefulness acts as a significant mediator between individual variables—such as age and production size—and intention to use. This finding suggests that the perception of practical benefits of mobile applications has a greater influence on technology adoption than the demographic or structural characteristics of producers.
The beta coefficient (0.916) between Ease of Use and Perceived Usefulness suggests a conceptual redundancy within this specific sample. In the context of the rural Amazon, the usefulness of a mobile tool is intrinsically linked to the producer’s ability to operate it without assistance, which explains the overlap between the two constructs.
Table 8 presents the evaluation of the hypotheses proposed. All hypothetical relationships were statistically significant (p < 0.05), which empirically supports the proposed theoretical model and confirms the relevance of the factors considered in the adoption of digital technologies in the livestock sector.

5. Discussion

The results of this study confirm the relevance of the Technology Acceptance Model in explaining the adoption of mobile applications among small-scale livestock farmers. It was observed that perceived ease of use and perceived usefulness significantly influenced behavioral intention, consistent with the studies by [38]. Ref. [39] conducted in agricultural contexts. Furthermore, perceived ease of use had a strong positive effect on perceived usefulness, which supports the internal structure of the TAM [40].
However, rather than merely confirming these relationships, the results suggest the existence of context-specific mechanisms that amplify these effects in rural settings on the Amazon. In particular, the strong influence of perceived ease of use on perceived utility can be explained by low levels of digital literacy, where usability becomes a prerequisite for recognizing any functional value in technology. This implies that, unlike contexts with greater digital maturity, ease of use does not function as a secondary attribute, but rather as a fundamental condition for the perception of value. In such environments, technologies that are not immediately understood are unlikely to be perceived as useful, regardless of their technical capabilities. This interpretation aligns with the findings of [7], which highlight the importance of simplicity and intuitive design in populations with low exposure.
Furthermore, the magnitude of the relationships observed in the model suggests the need for a more critical interpretation. The relatively strong path coefficients can be partially explained by contextual homogeneity and a possible common-method bias, since the data were collected using self-report measures in a single setting; furthermore, the functional nature of technology use in smallholder farming systems may lead to more consistent and less variable responses among participants. Nevertheless, the absolute confirmation of all proposed hypotheses, coupled with the extremely high path coefficients, warrants a critical interpretation. Rather than reflecting a perfect theoretical fit, this uniformity suggests an undifferentiated perception among the surveyed population. In rural settings characterized by nascent digital literacy, users may not sharply delineate the conceptual boundary between a tool being ‘easy to use’ and it being ‘useful’; if a tool is too complex to operate, its utility drops to zero in the user’s perception. Therefore, these results should be interpreted as a context-specific behavioral fusion of constructs rather than a universally applicable phenomenon.
Furthermore, in resource-constrained settings, technology is evaluated using utilitarian logic, which reduces perceptual ambiguity and strengthens the relationships between constructs [26]. This could explain why perceived utility emerges as a particularly strong predictor of behavioral intention, consistent with previous findings by [31,38]. Furthermore, the role of prior technological experience further underscores the importance of learning processes in shaping adoption. It was observed that prior exposure to digital tools positively influenced perceived ease of use, consistent with the study by [32].
It is important to note that the Amazonian context plays a key role in shaping these results. The region’s structural constraints create a scenario in which only those technologies that are simple, accessible, and yield immediate benefits are likely to be adopted [1,50]. This means that technology adoption in Amazonian livestock systems is highly selective and driven by survival-oriented decision-making, in which farmers prioritize solutions that are low in complexity and high in utility. Unlike more developed agricultural systems, where adoption may be driven by trends toward innovation or long-term optimization, in this context adoption is linked to short-term functionality and risk minimization.
From a theoretical perspective, these results highlight significant limitations of the TAM. While the model effectively explains individual perceptions, it does not fully account for the structural and environmental constraints that influence technology adoption in rural settings. Therefore, the results suggest that the TAM should be expanded to incorporate contextual variables such as infrastructure, digital access, and territorial conditions, especially in developing regions [10]. Without these considerations, the model could overestimate the role of individual perceptions and underestimate systemic barriers.
Finally, this study contributes to the literature by extending the application of the TAM to a largely understudied context. While previous studies have focused on regions such as sub-Saharan Africa and Asia [38,50], evidence regarding Amazonian livestock systems in Latin America remains scarce. This study will not only fill a geographical gap but will also demonstrate that contextual conditions can alter the functioning and interpretation of the fundamental relationships within the TAM, providing a more nuanced understanding of technology adoption in rural settings.

6. Conclusions

This study analyzed the determinants of mobile application adoption among small-scale livestock farmers in the Peruvian Amazon using a PLS-SEM approach based on the Technology Acceptance Model (TAM).
Regarding the main empirical findings, the results indicate that perceived ease of use is the most influential factor in the adoption process, both directly affecting behavioral intention and indirectly through perceived usefulness. In turn, perceived usefulness plays a mediating role that reinforces adoption intention. The strength of this relationship suggests a context-specific dynamic in which the perceived simplicity of technology conditions its perceived value. Additionally, prior technological experience positively affects perceived ease of use, highlighting the relevance of learning processes in technology adoption.
From a theoretical perspective, this study extends the application of TAM to a rural and structurally constrained context. The findings reveal that, under conditions of limited connectivity and low digital literacy, the distinction between perceived ease of use and perceived usefulness becomes less pronounced, suggesting the need for context-sensitive adaptations of technology adoption models.
Overall, the study demonstrates that digital adoption in Amazonian livestock systems is shaped by the interaction between cognitive perceptions and structural constraints. These results contribute to a more nuanced understanding of technology adoption in rural agricultural settings and provide a basis for future research aimed at incorporating contextual variables into established theoretical models.

Practical Implications and Future Research Directions

The findings generate several practical implications for stakeholders involved in the digital transformation of rural livestock systems, including practitioners, communication specialists, and policymakers.
For practitioners and technical advisors, the results highlight the importance of promoting digital solutions that prioritize usability and simplicity in interface design. In contexts characterized by limited digital literacy, intuitive applications can significantly reduce perceived technological barriers and facilitate initial adoption. At the same time, interventions aimed at promoting digital tools should emphasize the tangible economic and operational benefits associated with their use. In this sense, training programs may benefit from shifting beyond traditional operation-focused workshops toward demonstration-based strategies that illustrate how digital applications can reduce production uncertainty, support decision-making, and improve farm management efficiency.
For communication specialists, the results suggest that the diffusion of technological innovations in rural environments should not rely solely on technical instruction. Instead, communication strategies that highlight concrete success stories, observable economic benefits, and locally relevant experiences may be more effective in fostering trust and encouraging adoption. The visibility of peer experiences within farming communities can play an important role in reducing skepticism and strengthening the perceived credibility of digital innovations.
From a policy perspective, the findings underscore the structural importance of rural connectivity as a foundational condition for digital transformation. Limited internet access continues to represent a major barrier to the adoption of digital livestock management tools in remote territories. This evidence aligns with previous research emphasizing that universal and affordable access to ICT infrastructure, consistent with SDG target 9c, is essential for enabling digital innovation and inclusive technological development in rural areas [25]. Therefore, investments aimed at expanding rural connectivity and strengthening producers’ digital capabilities could play a critical role in facilitating the broader integration of digital technologies into livestock production systems.
In addition to these practical implications, the study opens several avenues for future research. First, future studies could adopt longitudinal research designs to analyze how digital adoption evolves over time as farmers accumulate technological experience. Second, incorporating behavioral data derived from actual application use could provide a more precise understanding of the gap between perceived acceptance and effective technological adoption.

Author Contributions

Conceptualization, supervision and project administration P.M.H.S.; Methodology and writing—review and editing, A.M.C.R.; Software and data analysis, J.P.V.; Writing—original draft preparation, D.R.L.T.C. All authors have read and agreed to the published version of the manuscript.

Funding

This research received no external funding.

Institutional Review Board Statement

This study is waived for ethical review as the non-clinical and strictly observational nature of the socioeconomic/community evaluation under the aforementioned official governmental and academic agreement falls within the exemption criteria defined by the guidelines of the Instituto de Investigation en Agronegocios of National University Toribio Rodríguez de Mendoza.

Informed Consent Statement

Informed consent was obtained from all subjects involved in the study.

Data Availability Statement

The original contributions presented in this study are included in the article. Further inquiries can be directed to the corresponding author.

Conflicts of Interest

The authors declare no conflicts of interest.

References

  1. Liang, J.; Qiao, C. Digital Economy and High-Quality Agricultural Development: Mechanisms of Technological Innovation and Spatial Spillover Effects. Sustainability 2025, 17, 3639. [Google Scholar] [CrossRef]
  2. Sotomayor, O.; Ramírez, E.; Martínez, H. Digitalización y Cambio Tecnológico en las Mipymes Agrícolas y Agroindustriales en América Latina. 2021. Available online: https://www.cepal.org/es/publicaciones/46965-digitalizacion-cambio-tecnologico-mipymes-agricolas-agroindustriales-america (accessed on 30 April 2026).
  3. Yu, H.; Qubi, W.; Luo, J. Digital Transformation in Agricultural Supply Chains Enhances Green Productivity: Evidence From Provincial Data in China. Earth’s Future 2025, 13, e2025EF006089. [Google Scholar] [CrossRef]
  4. Ramavhale, P.M.; Zwane, E.M.; Belete, A. The Benefits of Social Media Platforms Used in Agriculture for Information Dissemination. S. Afr. J. Agric. Ext. (SAJAE) 2024, 52, 77–90. [Google Scholar] [CrossRef]
  5. Puntel, L.A.; Bolfe, É.L.; Melchiori, R.J.M.; Ortega, R.; Tiscornia, G.; Roel, A.; Scaramuzza, F.; Best, S.; Berger, A.G.; Hansel, D.S.S.; et al. How digital is agriculture in a subset of countries from South America? Adoption and limitations. Crop Pasture Sci. 2023, 74, 555–572. [Google Scholar] [CrossRef]
  6. Oliveira, F.M.; Ferraz, G.A.e.S.; André, A.L.G.; Santana, L.S.; Norton, T.; Ferraz, P.F.P. Digital and Precision Technologies in Dairy Cattle Farming: A Bibliometric Analysis. Animals 2024, 14, 1832. [Google Scholar] [CrossRef] [PubMed]
  7. Usuga-Escobar, J.F.; Palacio-Baena, L.G.; Barrios, D. Aceptación tecnológica de una aplicación móvil para la gestión de negocios lecheros. Rev. CEA 2022, 8, e2007. [Google Scholar] [CrossRef]
  8. Yar, F.G.M.; Naderi, M.E. Smart Rural Development: Using Information Technology for Sustainable Rural Planning. Eduvest-J. Univers. Stud. 2025, 5, 3277–3286. [Google Scholar] [CrossRef]
  9. Udisha, O.; Ambily Philomina, I.G. Bridging the Digital Divide: Empowering Rural Women Farmers Through Mobile Technology in Kerala. Sustainability 2024, 16, 9188. [Google Scholar] [CrossRef]
  10. Yang, C.; Ji, X.; Cheng, C.; Liao, S.; Obuobi, B.; Zhang, Y. Digital economy empowers sustainable agriculture: Implications for farmers’ adoption of ecological agricultural technologies. Ecol. Indic. 2024, 159, 111723. [Google Scholar] [CrossRef]
  11. Akpe, O.-E.E.; Collins Mgbame, A.; Ogbuefi, E.; Abayomi, A.A.; Adeyelu, O.O. Technology Acceptance and Digital Readiness in Underserved Small Business Sectors. J. Front. Multidiscip. Res. 2023, 4, 252–268. [Google Scholar] [CrossRef]
  12. Cao, A.; Guo, L.; Li, H. Understanding farmer cooperatives’ intention to adopt digital technology: Mediating effect of perceived ease of use and moderating effects of internet usage and training. Int. J. Agric. Sustain. 2025, 23, 2464523. [Google Scholar] [CrossRef]
  13. Sindakis, S.; Showkat, G. The digital revolution in India: Bridging the gap in rural technology adoption. J. Innov. Entrep. 2024, 13, 29. [Google Scholar] [CrossRef]
  14. De la Peña-López, I.J.; Acosta-Gonzaga, E. Adoption of Technology in Older Adults in Mexico City: An Approach from the Technology Acceptance Model. Brain Sci. 2025, 15, 632. [Google Scholar] [CrossRef]
  15. Méndez-Zambrano, P.V.; Tierra Pérez, L.P.; Ureta Valdez, R.E.; Flores Orozco, Á.P. Technological Innovations for Agricultural Production from an Environmental Perspective: A Review. Sustainability 2023, 15, 16100. [Google Scholar] [CrossRef]
  16. Viera-Arroyo, W.; Binego, L.; Ryans, F.; López, D.; Moya, M.; Vera, L.; Caicedo, C. Systematic Review of Integrating Technology for Sustainable Agricultural Transitions: Ecuador, a Country with Agroecological Potential. Sustainability 2025, 17, 6053. [Google Scholar] [CrossRef]
  17. Pamela, D.; Galvez, C.; Chavarry Galvez, W.P. Digital technologies in agricultural development: The experience of Latin American countries. E3S Web Conf. 2024, 537, 08014. [Google Scholar] [CrossRef]
  18. Kara, M.; Alp, N.Ç. Assessing the adoption of the Yavuz Battleship application in the mixed reality environment using the technology acceptance model. Multimed. Syst. 2024, 30, 76. [Google Scholar] [CrossRef]
  19. Linh, T.T.; Huyen, N.T.T. An extension of Trust and TAM model with TPB in the adoption of digital payment: An empirical study in Vietnam. F1000Research 2025, 14, 127. [Google Scholar] [CrossRef]
  20. Brar, P.S.; Shah, B.; Singh, J.; Ali, F.; Kwak, D. Using Modified Technology Acceptance Model to Evaluate the Adoption of a Proposed IoT-Based Indoor Disaster Management Software Tool by Rescue Workers. Sensors 2022, 22, 1866. [Google Scholar] [CrossRef]
  21. Ly, B.; Ly, R. Internet banking adoption under Technology Acceptance Model—Evidence from Cambodian users. Comput. Hum. Behav. Rep. 2022, 7, 100224. [Google Scholar] [CrossRef]
  22. Sorce, J. Extended Technology Acceptance Model (TAM) for adoption of Information and Communications Technology (ICT) in the US construction industry. J. Inf. Technol. Constr. (ITcon) 2021, 26, 227–248. [Google Scholar] [CrossRef]
  23. Wang, Z.; Wang, Y.; Zeng, Y.; Su, J.; Li, Z. An investigation into the acceptance of intelligent care systems: An extended technology acceptance model (TAM). Sci. Rep. 2025, 15, 17912. [Google Scholar] [CrossRef]
  24. Neethirajan, S. The role of sensors, big data and machine learning in modern animal farming. Sens. Biosensing Res. 2020, 29, 100367. [Google Scholar] [CrossRef]
  25. Obregón Perdomo, L.A.; Ortiz Meneses, C.A.; Cuellar Medina, Y. La utilización de las herramientas tecnológicas en los sistemas de producción ganaderas doble propósito. I+D Rev. Investig. 2022, 17, 34–48. [Google Scholar] [CrossRef]
  26. de Oca Munguia, O.M.; Llewellyn, R. The Adopters versus the Technology: Which Matters More when Predicting or Explaining Adoption? Appl. Econ. Perspect. Policy 2020, 42, 80–91. [Google Scholar] [CrossRef]
  27. Cristofaro, M. E-business evolution: An analysis of mobile applications’ business models. Technol. Anal. Strateg. Manag. 2020, 32, 88–103. [Google Scholar] [CrossRef]
  28. Amoussouhoui, R.; Arouna, A.; Ruzzante, S.; Banout, J. Adoption of ICT4D and its determinants: A systematic review and meta-analysis. Heliyon 2024, 10, e30210. [Google Scholar] [CrossRef]
  29. Dibbern, T.; Romani, L.A.S.; Massruhá, S.M.F.S. Main drivers and barriers to the adoption of Digital Agriculture technologies. Smart Agric. Technol. 2024, 8, 100459. [Google Scholar] [CrossRef]
  30. Arangurí, M.; Mera, H.; Noblecilla, W.; Lucini, C. Digital Literacy and Technology Adoption in Agriculture: A Systematic Review of Factors and Strategies. AgriEngineering 2025, 7, 296. [Google Scholar] [CrossRef]
  31. Addison, M.; Bonuedi, I.; Arhin, A.A.; Wadei, B.; Owusu-Addo, E.; Antoh, E.F.; Mensah-Odum, N. Exploring the impact of agricultural digitalization on smallholder farmers’ livelihoods in Ghana. Heliyon 2024, 10, e27541. [Google Scholar] [CrossRef]
  32. Daum, T. Digitalization and skills in agriculture. Outlook Agric. 2025, 54, 171–181. [Google Scholar] [CrossRef]
  33. Nyika, G.T. Use of ICTS for socio-economic development of marginalised communities in rural areas: Proposals for establishment of sectoral Rural Entrepreneurial Networks. J. Dev. Commun. Stud. 2020, 7, 71–91. [Google Scholar] [CrossRef]
  34. Mapiye, O.; Makombe, G.; Molotsi, A.; Dzama, K.; Mapiye, C. Information and communication technologies (ICTs): The potential for enhancing the dissemination of agricultural information and services to smallholder farmers in sub-Saharan Africa. Inf. Dev. 2023, 39, 638–658. [Google Scholar] [CrossRef]
  35. Ortiz-Crespo, B.; Steinke, J.; Quirós, C.F.; van de Gevel, J.; Daudi, H.; Gaspar Mgimiloko, M.; van Etten, J. User-centred design of a digital advisory service: Enhancing public agricultural extension for sustainable intensification in Tanzania. Int. J. Agric. Sustain. 2021, 19, 566–582. [Google Scholar] [CrossRef]
  36. Davis, F. Perceived usefulness, perceived ease of use and user acceptance of information technology. MIS Q. 1989, 13, 319–340. [Google Scholar] [CrossRef]
  37. Venkatesh, V.; Morris, G.B.; Davis, F. User acceptance of information technology: Toward a unified view. MIS Q. 2003, 27, 425–478. [Google Scholar] [CrossRef]
  38. Muromba, P.; Keeni, M.; Fuyuki, K. A systematic review of mobile agricultural service applications for smallholder farmers in sub-Saharan Africa: Perspectives from the technology acceptance model. Agric. Food Secur. 2025, 14, 34. [Google Scholar] [CrossRef]
  39. Silva-Cortés, A.; Villa-Enciso, E.M.; Rendón, A.M.; Casadiego-Alzate, R.; Tirado-Ballestas, I.P.; Gallego, J.L. Assessing drivers of organic agriculture adoption among smallholder communities in Colombia: An application of the Technology acceptance model. Org. Agric. 2025, 15, 759–777. [Google Scholar] [CrossRef]
  40. Simmachan, T.; Wongsai, N.; Wongsai, S.; Lerdsuwansri, R. Correction: Modeling road accident fatalities with underdispersion and zero-inflated counts. PLoS ONE 2024, 19, e0309234. [Google Scholar] [CrossRef]
  41. Haji-Othman, Y.; Yusuff, M.S.S. Assessing Reliability and Validity of Attitude Construct Using Partial Least Squares Structural Equation Modeling (PLS-SEM). Int. J. Acad. Res. Bus. Soc. Sci. 2022, 12, 378–385. [Google Scholar] [CrossRef]
  42. Michels, M.; Bonke, V.; Musshoff, O. Understanding the adoption of smartphone apps in dairy herd management. J. Dairy Sci. 2019, 102, 9422–9434. [Google Scholar] [CrossRef] [PubMed]
  43. Ringle, C.M.; Sarstedt, M.; Sinkovics, N.; Sinkovics, R.R. A perspective on using partial least squares structural equation modelling in data articles. Data Brief 2023, 48, 109074. [Google Scholar] [CrossRef]
  44. Danks, N.P.; Sharma, P.N.; Sarstedt, M. Model selection uncertainty and multimodel inference in partial least squares structural equation modeling (PLS-SEM). J. Bus. Res. 2020, 113, 13–24. [Google Scholar] [CrossRef]
  45. Cheah, J.-H.; Roldán, J.L.; Ciavolino, E.; Ting, H.; Ramayah, T. Sampling weight adjustments in partial least squares structural equation modeling: Guidelines and illustrations. Total Qual. Manag. Bus. Excell. 2021, 32, 1594–1613. [Google Scholar] [CrossRef]
  46. Kline, R. Principles and Practice of Structural Equation Modeling; Guilford Publications Inc.: New York, NY, USA, 2023. [Google Scholar]
  47. Al-Gahtani, S.S. Empirical investigation of e-learning acceptance and assimilation: A structural equation model. Appl. Comput. Inform. 2016, 12, 27–50. [Google Scholar] [CrossRef]
  48. Senger, I.; Borges, J.A.R.; Machado, J.A.D. Using structural equation modeling to identify the psychological factors influencing dairy farmers’ intention to diversify agricultural production. Livest. Sci. 2017, 203, 97–105. [Google Scholar] [CrossRef]
  49. Owoseni, A.; Twinomurinzi, H. Mobile apps usage and dynamic capabilities: A structural equation model of SMEs in Lagos, Nigeria. Telemat. Inform. 2018, 35, 2067–2081. [Google Scholar] [CrossRef]
  50. Dibbern, T.; Romani, L.; Massruhá, S. Drivers and Barriers to Digital Agriculture Adoption: A Mixed-Methods Analysis of Challenges and Opportunities in Latin American. Sustainability 2025, 17, 3676. [Google Scholar] [CrossRef]
Figure 1. Flowchart of technology adoption among livestock farmers. Note: Created by the author.
Sustainability 18 05346 g001
Figure 2. PLS-SEM Structural Model.
Sustainability 18 05346 g002
Table 1. Description of variables.
VariableDescription
Production sizeNumeric variable
AgeNumeric variable
Use of technologyNumeric variable
Application usage (Functionality) (UA)Variable on a 5-point Likert scale (1–5). Interest in livestock information management
UA1Used to indicate the level of daily milk production and accumulated weekly, biweekly, and monthly costs
UA2Used to generate reminders for feeding and breeding livestock
UA3I use it to find micro courses and information related to livestock management
UA4Used to determine the level of production profitability
Ease of use (FU)Variable on a 5-point Likert scale (1–5). Interest in the ease of use of technological applications
FU1General perception of ease of use of a mobile application.
FU2Perception of effortless benefit for livestock management
FU3Perception of skill acquisition for using a mobile application
FU4Ordinal variable. Perception of learning to use a mobile application for livestock information management
Perceived usefulness (PP)Variable on a 5-point Likert scale (1–5). Interest in the usefulness of a mobile application
PP1Perceived usefulness for improving the overall effectiveness of livestock management
PP2Perception of assistance in accelerating the execution of daily work
PP3Perceived improvement in livestock profitability
PP4Perception of ease of observing livestock welfare and health
Intended use (IU)Variable on a 5-point Likert scale (1–5). Interest in the intended use of a mobile application for livestock information management
IU1Intention to use a mobile application for livestock information management
IU2Future use of a mobile application for livestock information management
Note: Own elaboration, based on research by [7,42] and the TAM theoretical model [36].
Table 2. Descriptive statistics of the sociodemographic characteristics and technological infrastructure of the surveyed livestock producers.
DimensionIndicator%St. Dev.
(s)
Variance
(s2)
Coef. Var.
(CV %)
Skewness
(g1)
Kurtosis
(g2)
Age RangeLess than 25 years55.801.28531.65262.440.5658−1.4704
26–35 years5.80
36–50 years15.00
50+ years23.30
GenderMale59.380.53350.284636.370.4723−1.0701
Female40.63
Livestock CountLess than 225.801.15221.327745.940.0128−1.4358
3–5 heads25.00
6–10 heads21.70
10+ heads27.50
Mobile Phone OwnershipYes96.700.18030.032517.445.265526.1615
No3.30
Smartphone UsageYes93.130.56880.323545.52.75158.7306
No6.88
Stable Internet ConnectionYes64.201.1321.281564.691.1796−0.0926
No10.80
Partially11.70
Depends on the weather13.30
Internet Usage
Frequency
Daily51.701.37721.896667.181.0474−0.3879
Several times a week23.30
Several times a month1.70
Rarely15.00
Never8.30
Use of Digital Technology/Software for Livestock
Management
Yes15.630.50520.255226.820.98246.751
No84.38
Preferred
Technological
Device
Mobile phone63.301.24341.546167.521.0262−0.75
Computer11.70
Tablet2.50
None22.50
Table 3. Reliability and data validity.
LVCACRAVEVIF
Ease of use0.9410.9580.8521.082
Intention to use0.9090.9570.9172.861
Use of applications0.9530.9660.8761.112
Use of technology0.9020.9170.8911.489
Perceived profit0.9340.9530.8352.949
Table 4. Indicators of Model Fit.
Model FitValues
SRMR0.048
d_ULS4.355
d_G4.728
Chi-square3858.178
NFI0.814
Table 5. Model Fit Indices.
R Adj. SquareQ2p Valuef Squarep Value
Ease of use0.6250.5140.000--
Intention to use0.7260.6420.000--
Perceived profit0.7810.6950.000--
Age → Ease of use- -0.0650.000
Age → Perceived profit- -0.0090.000
Ease of use → Intention to use- -0.0920.000
Ease of use → Perceived profit- -3.1260.000
Production size → Perceived profit- -0.0270.000
Use of applications → Ease of use- -1.2850.000
Use of technology → Ease of use- -0.0000.000
Perceived profit → Intention to use- -0.2420.000
Table 6. Discriminant validity analysis.
Original Sample (O)Average Sample (M)Bias
Ease of use ↔ Age0.3660.362−0.003
Intention to use ↔ Age0.2670.265−0.002
Intention to use ↔ Ease of use0.8770.876−0.001
Production size ↔ Age0.0420.0770.035
Production size ↔ Ease of use0.2370.2390.002
Production size ↔ Intention to use0.2810.2820.001
Use of applications ↔ Age0.2700.265−0.005
Use of applications ↔ Ease of use0.8170.813−0.003
Use of applications ↔ Intention to use0.8140.812−0.002
Use of applications ↔ Production size0.0340.0850.051
Use of technology ↔ Age0.0280.0700.042
Use of technology ↔ Ease of use0.1260.1430.017
Use of technology ↔ Intention to use0.1390.1450.007
Use of technology ↔ Production size0.0270.0870.059
Use of technology ↔ Use of applications0.1710.1740.003
Perceived profit ↔ Age0.2850.282−0.003
Perceived profit ↔ Ease of use0.8320.831−0.001
Perceived profit ↔ Intention to use0.8050.804−0.001
Perceived profit ↔ Production size0.1340.1470.013
Perceived profit ↔ Use of applications0.7740.773−0.001
Perceived profit ↔ Use of technology0.2150.214−0.001
Table 7. Square Roots of AVE.
Square Root of AVESignificance (p)
Ease of use0.9230.000
Intention to use0.9580.000
Use of applications0.9360.000
Use of technology0.9440.000
Perceived profit0.9140.000
Table 8. Confirmation of the research model.
Beta
Coefficient
T
Statistics
p ValuesDecision
Use of applications → Ease of use0.73213.5550.000Accepted
Use of technology → Ease of use0.6580.0600.001Accepted
Ease of use → Intended use0.3352.4380.015Accepted
Ease of use → Perceived usefulness0.91630.3310.000Accepted
Perceived usefulness→ Intended use0.5424.0350.000Accepted
Disclaimer/Publisher’s Note: The statements, opinions and data contained in all publications are solely those of the individual author(s) and contributor(s) and not of MDPI and/or the editor(s). MDPI and/or the editor(s) disclaim responsibility for any injury to people or property resulting from any ideas, methods, instructions or products referred to in the content.