Article

A Case Study of Changes in the Healthiness, Equity, and Environmental Sustainability of an Australian University Food Environment: Findings from Two Audits Using the Uni-Food Tool (2022–2025)


1
Nutrition and Dietetics, Susan Wakil School of Nursing and Midwifery, Faculty of Medicine and Health, The University of Sydney, Sydney, NSW 2050, Australia
2
Institute for Physical Activity and Nutrition, Deakin University, Melbourne, VIC 3125, Australia
3
The School of Life and Environmental Sciences, Faculty of Science, The University of Sydney, Sydney, NSW 2006, Australia
4
Charles Perkins Centre, The University of Sydney, Sydney, NSW 2006, Australia
5
Leeder Centre for Health Policy, Economics and Data, School of Public Health, Faculty of Medicine and Health, The University of Sydney, Sydney, NSW 2006, Australia
*
Author to whom correspondence should be addressed.
These authors contributed equally to this work.
Sustainability 2026, 18(11), 5351; https://doi.org/10.3390/su18115351
Submission received: 30 March 2026 / Revised: 12 May 2026 / Accepted: 21 May 2026 / Published: 26 May 2026
(This article belongs to the Special Issue Healthy, Equitable and Environmentally Sustainable Food Environments)

Abstract

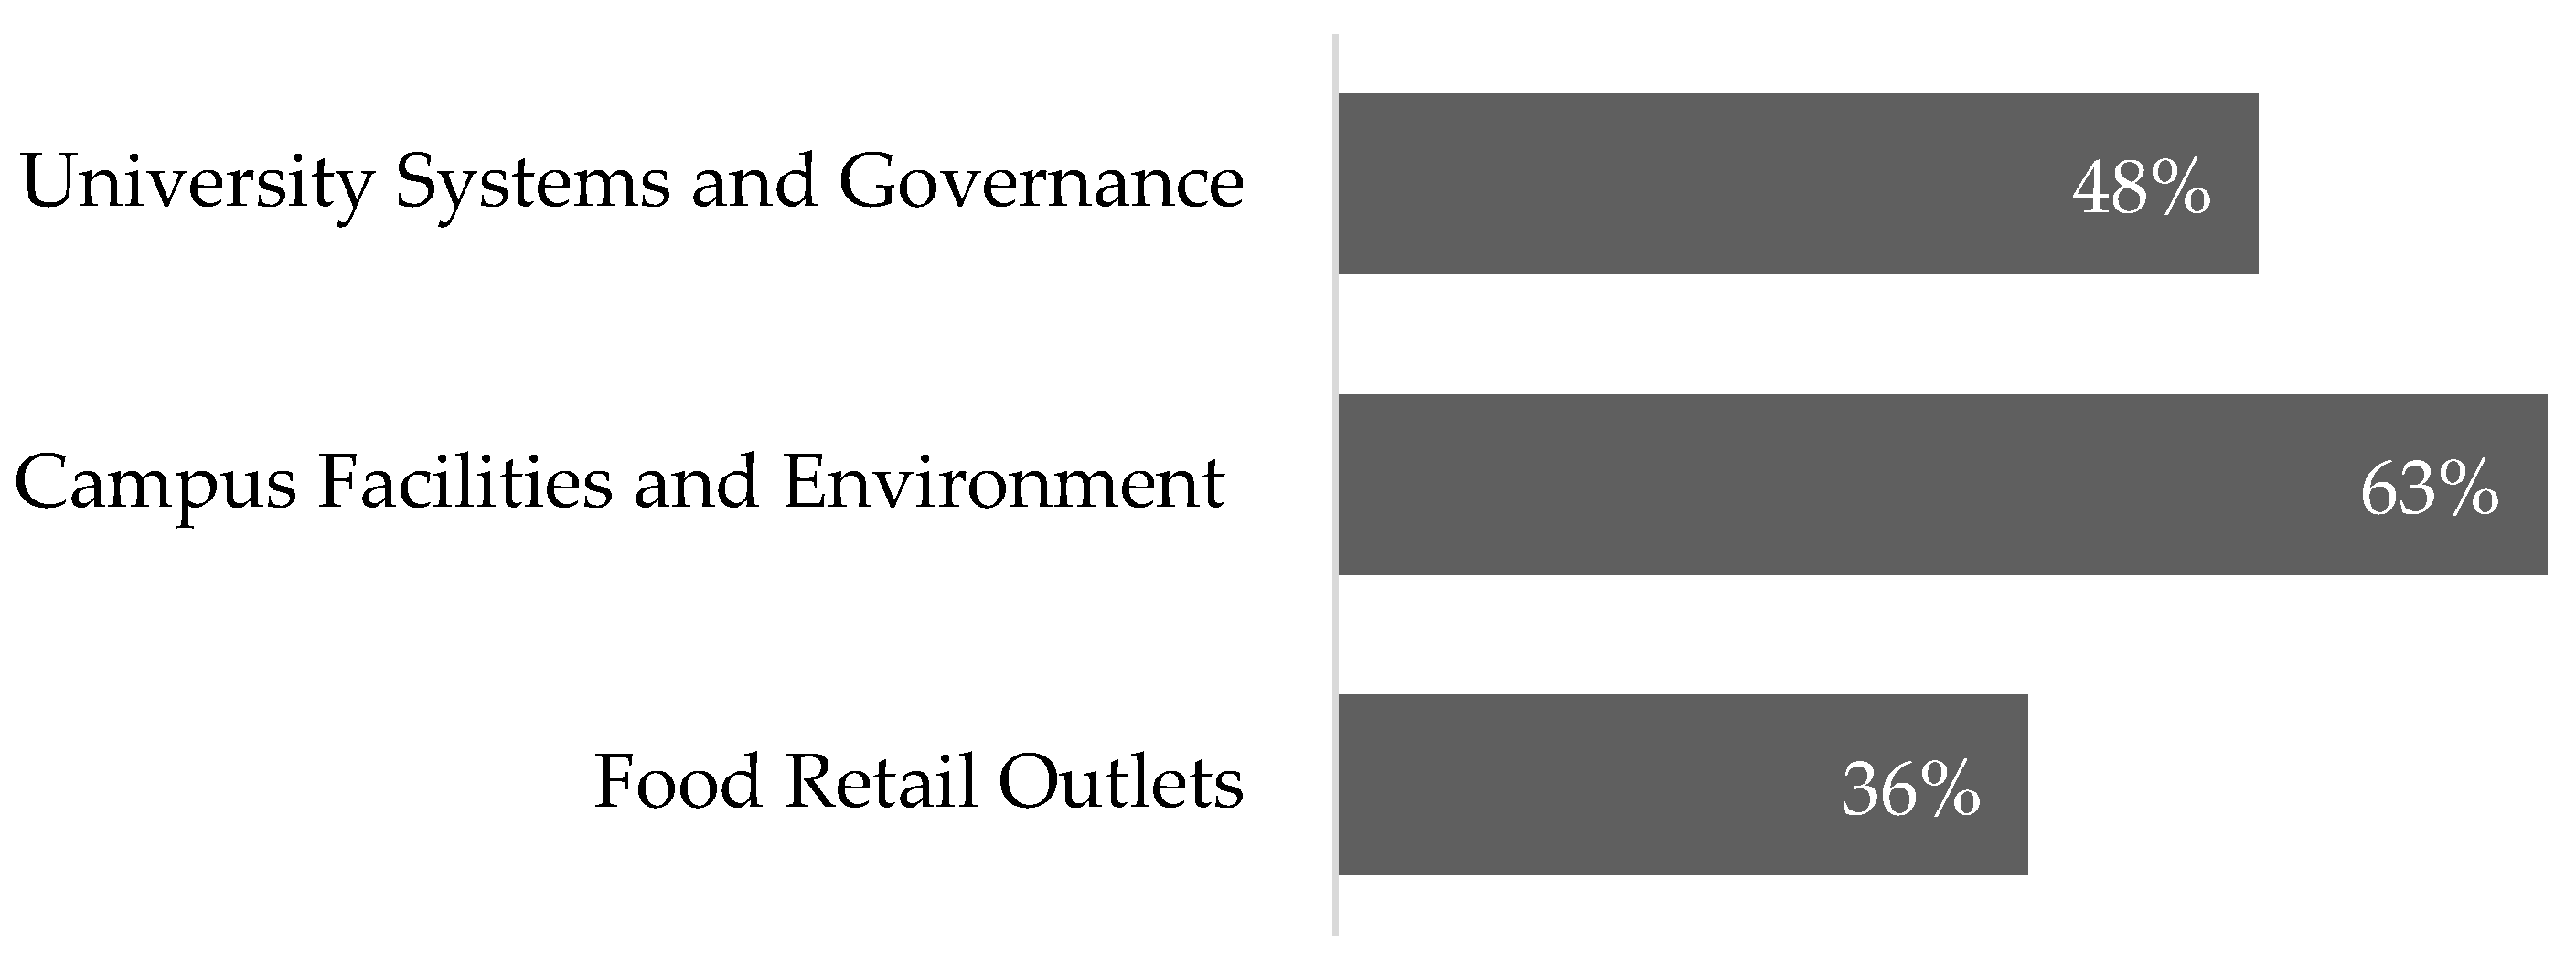
This case study aimed to benchmark the healthiness, equity, and environmental sustainability of a large, urban Australian university food environment through two audits conducted in 2022 and 2025. Two cross-sectional audits were completed at a large urban university campus using the Uni-Food tool, which assesses 68 best practice indicators across three components: policy, campus facilities, and food retail outlets. Four assessors independently conducted the audits with excellent inter-rater reliability (Cohen’s Kappa = 0.89). Final scores out of 100 were calculated using weighted domains. Descriptive and inferential statistics were used to compare changes over time. In 2025, the university achieved a score of 52%, up from 48% in 2022, indicating medium compliance with best practice standards. Findings highlight that scores differed modestly but there were persistent gaps in university food policy and practice. Specifically, the policy component remained low (48%), demonstrating strong overall planning but a lack in food retail policy and monitoring systems. The campus component scored moderately (63%), with various nutrition knowledge-building opportunities and environmental sustainability initiatives available but heavy promotion of unhealthy foods at campus events. The food retail component scored lowest overall (36%), especially as there was a lack of adequate nutrition information provided at food outlets. Continued investment in policy development, campus-wide strategies, and food retail innovation is essential to create healthier, more equitable, and environmentally sustainable food environments in tertiary settings.

1. Introduction

Food environments have an influence on the dietary habits and wellbeing of those who interact with them [1]. The high number of unhealthy foods found in modern food environments is likely contributing to poorer dietary habits and rising rates of obesity [1]. Modern food environments are also characterised by poorer access to, and higher cost of, healthy and culturally appropriate foods, which likely contributes to food insecurity [2]. In addition to the impact on human health, current food environments have major planetary health impacts which are likely a result of increased food and packaging wastage, greenhouse gas emissions and land use related to ultra-processed food production and animal agriculture [3].
University food environments play a key role in the diets of students, particularly among young adults (aged 18–24 years old) who make up 75% of university students [4,5]. This means universities are ideal settings for influencing dietary behaviours of young adults. They have a responsibility to promote equity and sustainability and are an environment where young adults have greater autonomy over their dietary choices [4]. However, university food environments predominantly provide and incentivise the purchasing of unhealthy and unsustainable foods and beverages [6,7,8,9]. Food insecurity is another public health issue faced by 27.5% of university students. International students make up a significant proportion of the Australian university student population and experience twice the risk of food insecurity [10,11,12]. Food insecurity is tied to resilience in the sense of cost of living, inflation, shocks (such as pandemics), and institutional buffering mechanisms. University food environments exacerbate food insecurity as healthy, culturally appropriate and sustainable foods are more expensive and difficult to access on campus compared to unhealthy foods [13,14]. This promotes poorer dietary behaviour in students as cost and availability are significant purchasing factors for students when purchasing food on campus [14]. Consequently, student health outcomes may be negatively impacted, such as through chronic disease development and mental wellbeing, which can have further implications on academic performance [15].
Environmental sustainability is another emerging consideration in university food environments. Universities often lack comprehensive policies that address the environmental sustainability of food environments, despite being leaders in sustainability research and innovation [16]. Notably, students take interest in sustainable dietary behaviours, making it attractive for universities to pursue [17].
Due to the impact of university food environments on students’ diets and environment sustainability, university-based interventions must help students to consume healthy and environmentally sustainable diets [18]. University-based interventions have proven effective in promoting healthy and sustainable dietary behaviours and addressing food insecurity [19]. To identify priority action areas for intervention, the university food environment must first be assessed [18]. This can be achieved by the University Food environment (Uni-Food) tool. This tool benchmarks the healthiness (defined by the Australian Dietary Guidelines), equity (the access to, and affordability of, culturally diverse, healthy and environmentally sustainable foods and beverages), and environmental sustainability (minimising the environmental impact of food consumption on campus) of Australian university food environments [18]. This tool differs from existing university food environment audit tools as it captures the complexity of food environments from multiple aspects of the Sustainable Development Goals, unlike other existing food environment tools which only capture health measures [20,21].
A current audit of the university food environment, using the Uni-Food tool, is warranted to monitor changes to the healthiness, equity, and environmental sustainability of the food environment since the most recent audit in 2022. The last audit was completed one year after local COVID-19 lockdowns were lifted, during which food outlets were closed and prior work on healthy food and sustainability became undone. A repeat audit in 2025 will highlight if and how the food environment recovered from this, and how it addresses newer priorities such as food insecurity. Studies have found universities have implemented policies and initiatives to address food insecurity post-COVID-19; however, food outlets may have increased menu pricing and the sale of ultra-processed foods due to rises in cost-of-living expenses [12]. Furthermore, repeat monitoring of the food environment is needed to recognise current priority action areas, considering the urgency for universities to promote food environments that address the Sustainable Development Goals [22]. Thus, the aim of this study is to assess the healthiness, equity and environmental sustainability of a university food environment using the Uni-Food Tool and identify opportunities for improving the university’s food environment.

2. Materials and Methods

A cross-sectional audit was conducted on the university’s main campus, which represents where the majority of students and staff are based and where most food outlets and facilities are located. This study compared university food environment audit results between 2022 and 2025. The 2022 audit data were previously published as part of the Uni-Food Tool validation study [18]. An earlier audit of the same university food environment was conducted in 2014 using a different food environment auditing tool; however, comparisons are limited due to the different audit tools used [9].
As of 2023, this university holds a population of 68,421 undergraduate and postgraduate students and 9051 academic and professional staff members [23]. The Uni-Food audit involved observation of the campus food environment and review of publicly available institutional documents and did not involve collecting identifiable human participant data. The Institutional Human Research Ethics Committee (HREC) approved the study as a low-risk study—HREC approval number: 2025/HE000938. The audit was conducted using the Uni-Food tool, included in the Supplementary File. A pilot study indicated the tool is sensitive enough to differentiate between different university food environments and showed moderate inter-rater reliability (Gwets AC1 > 0.70); inter-rater reliability for the present audit was assessed separately between our auditors using Cohen’s Kappa. The tool comprises 68 indicators and measures adherence to three audit components: (1) ‘University Systems and Governance’, (2) ‘Campus Facilities and Environments’, and (3) ‘Food Retail Outlets’. Within the three components, the indicators are categorised into 16 domains and 42 sub-domains. Each component, domain and sub-domain is assigned a weighting, determining its contribution to the university’s overall score out of 100. The components ‘University Systems and Governance’ and ‘Campus Facilities and Environment’ account for 40% each and ‘Food Retail Outlets’ accounts for 20% of the total Uni-Food score. Additionally, each of the 68 indicators contribute to the scoring criteria. The trained assessors (n = 4) scored the university’s compliance to each indicator, where higher scores indicated the university being more compliant to the best practice statement. The scores were supported by written justifications and photographic evidence. Two auditors conducted the ‘University Systems and Governance’ and ‘Campus Facilities and Environment’ audits, and four auditors conducted the ‘Food Retail Outlets’ audit, two assigned to each zone of the main campus. Zone A and Zone B were treated as two zones within the same main campus precinct and are reported separately for operational clarity.
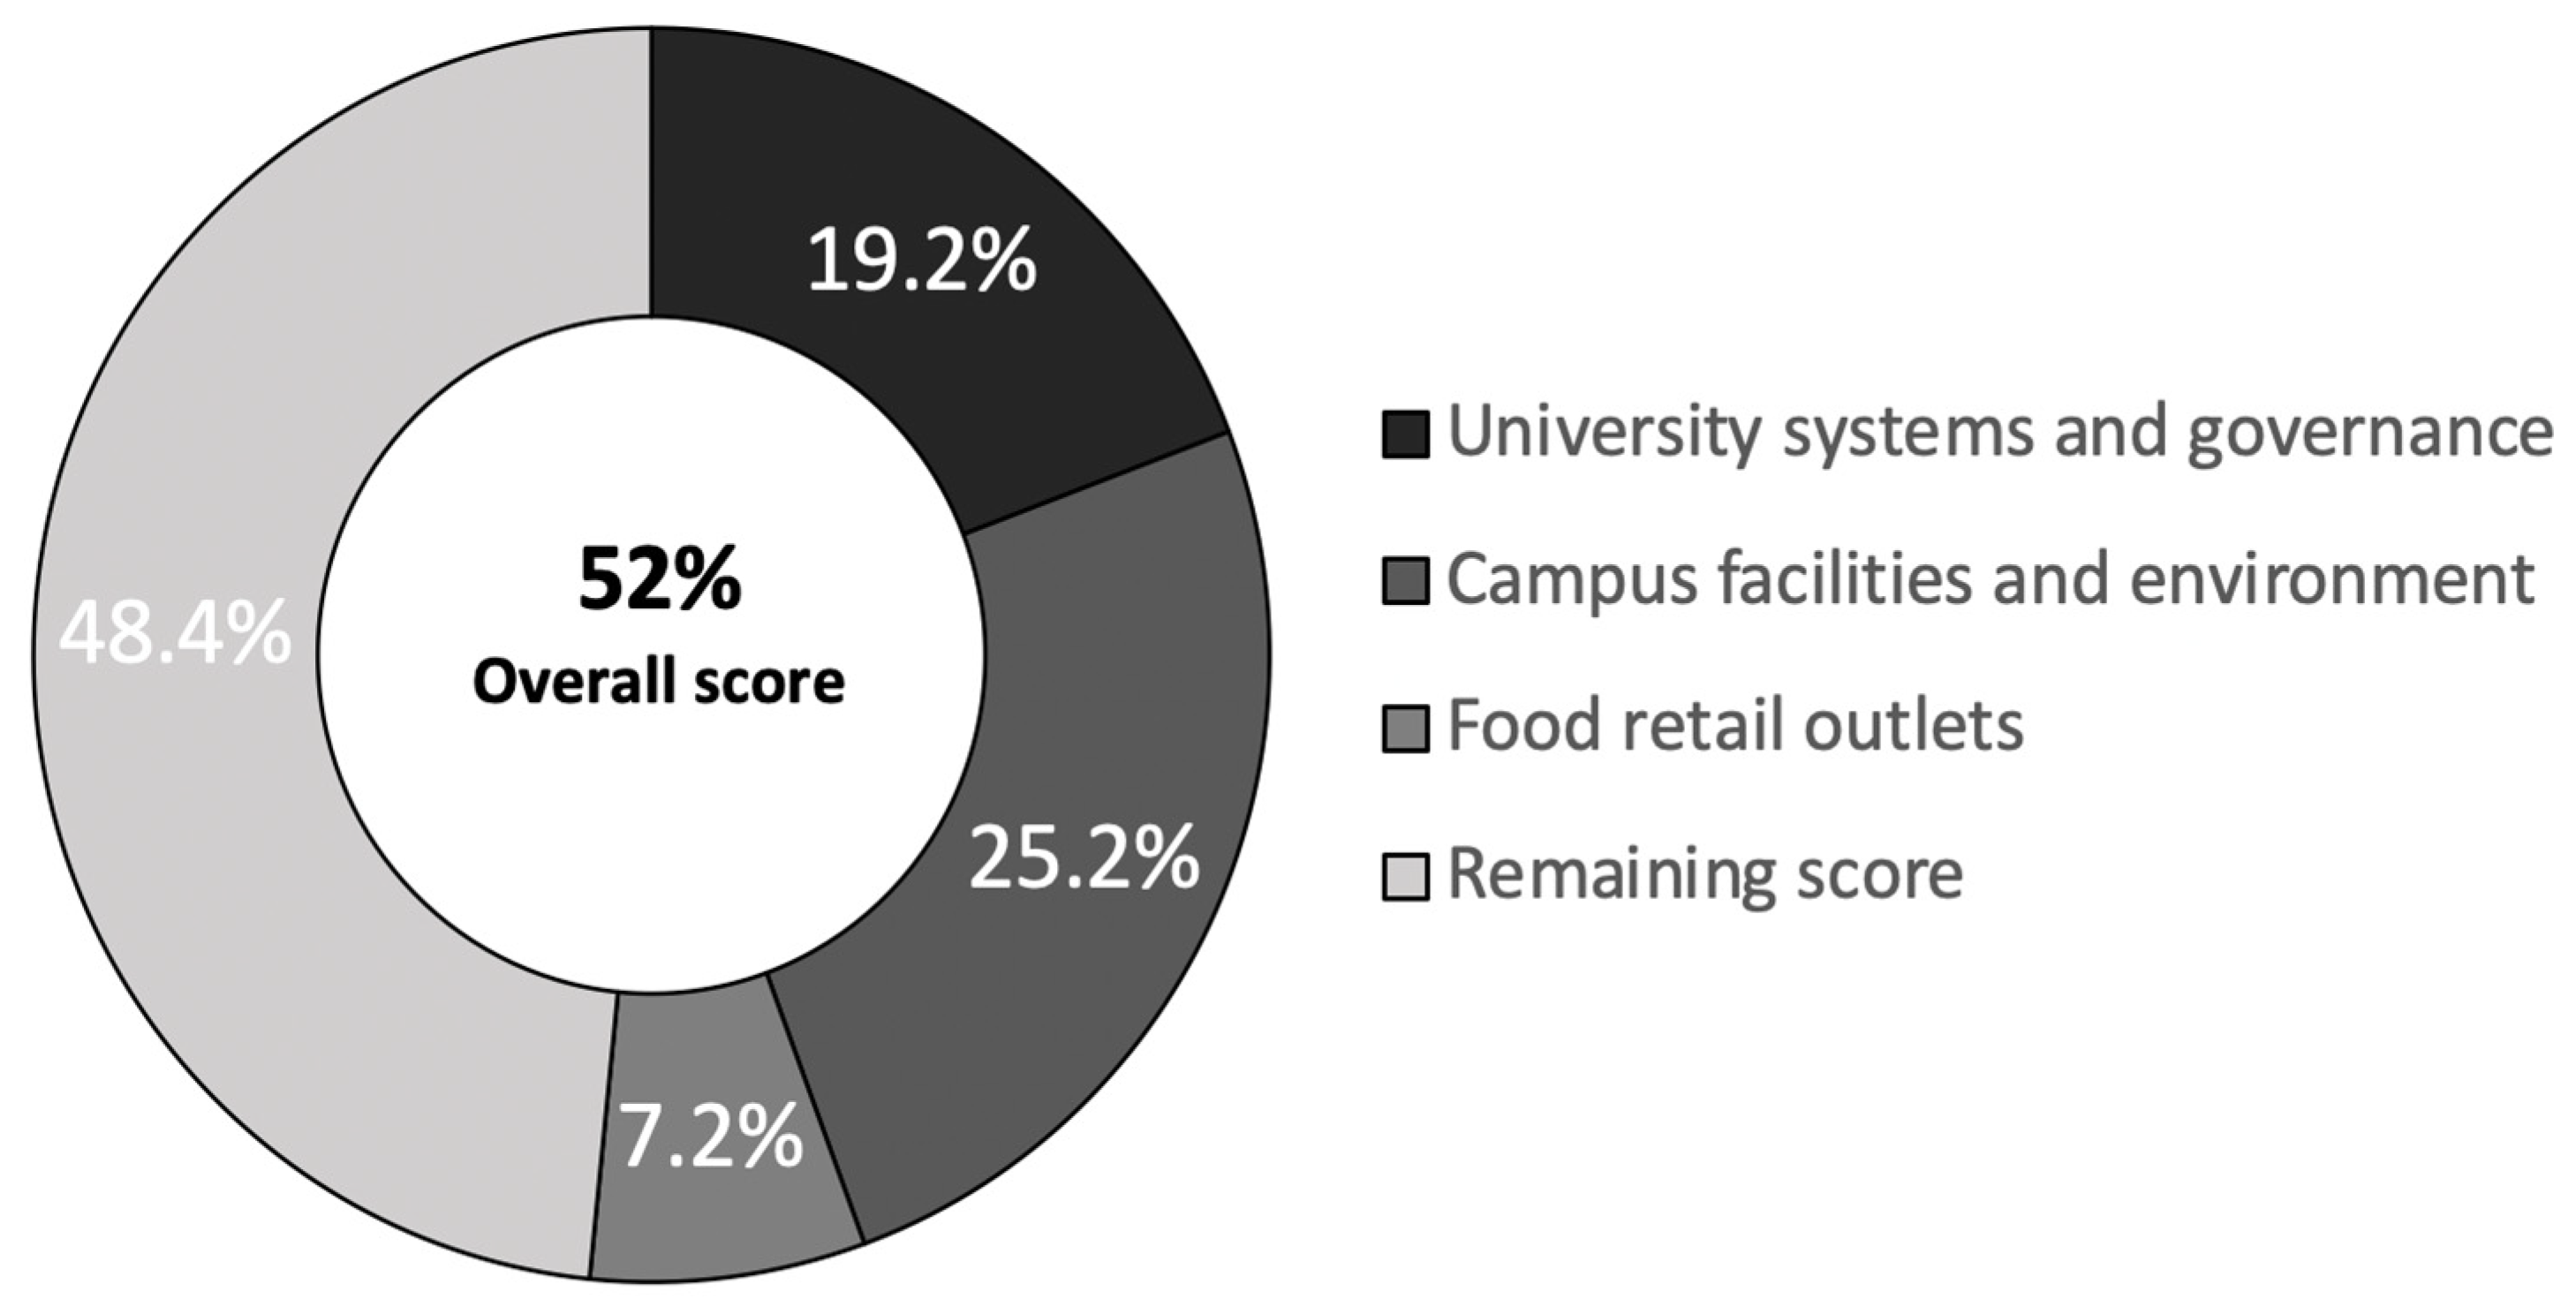
Trained assessors (n = 4) assigned scores to each Uni-Food indicator using the published scoring criteria. These initial outputs are referred to as raw indicator scores (i.e., prior to any weighting). Raw indicator scores were then aggregated to form sub-domain scores, which were weighted to produce domain scores according to the Uni-Food Tool’s published weightings. Domain scores were then weighted to generate component scores for (1) University Systems and Governance, (2) Campus Facilities and Environments, and (3) Food Retail Outlets. Finally, the overall Uni-Food score (0–100) was calculated by applying the component weightings specified in the tool (40% Governance, 40% Campus, 20% Retail). For transparency, we report (i) component and domain scores prior to applying the final component weighting (reported as ‘unweighted’ in figures), and (ii) the overall weighted Uni-Food score.
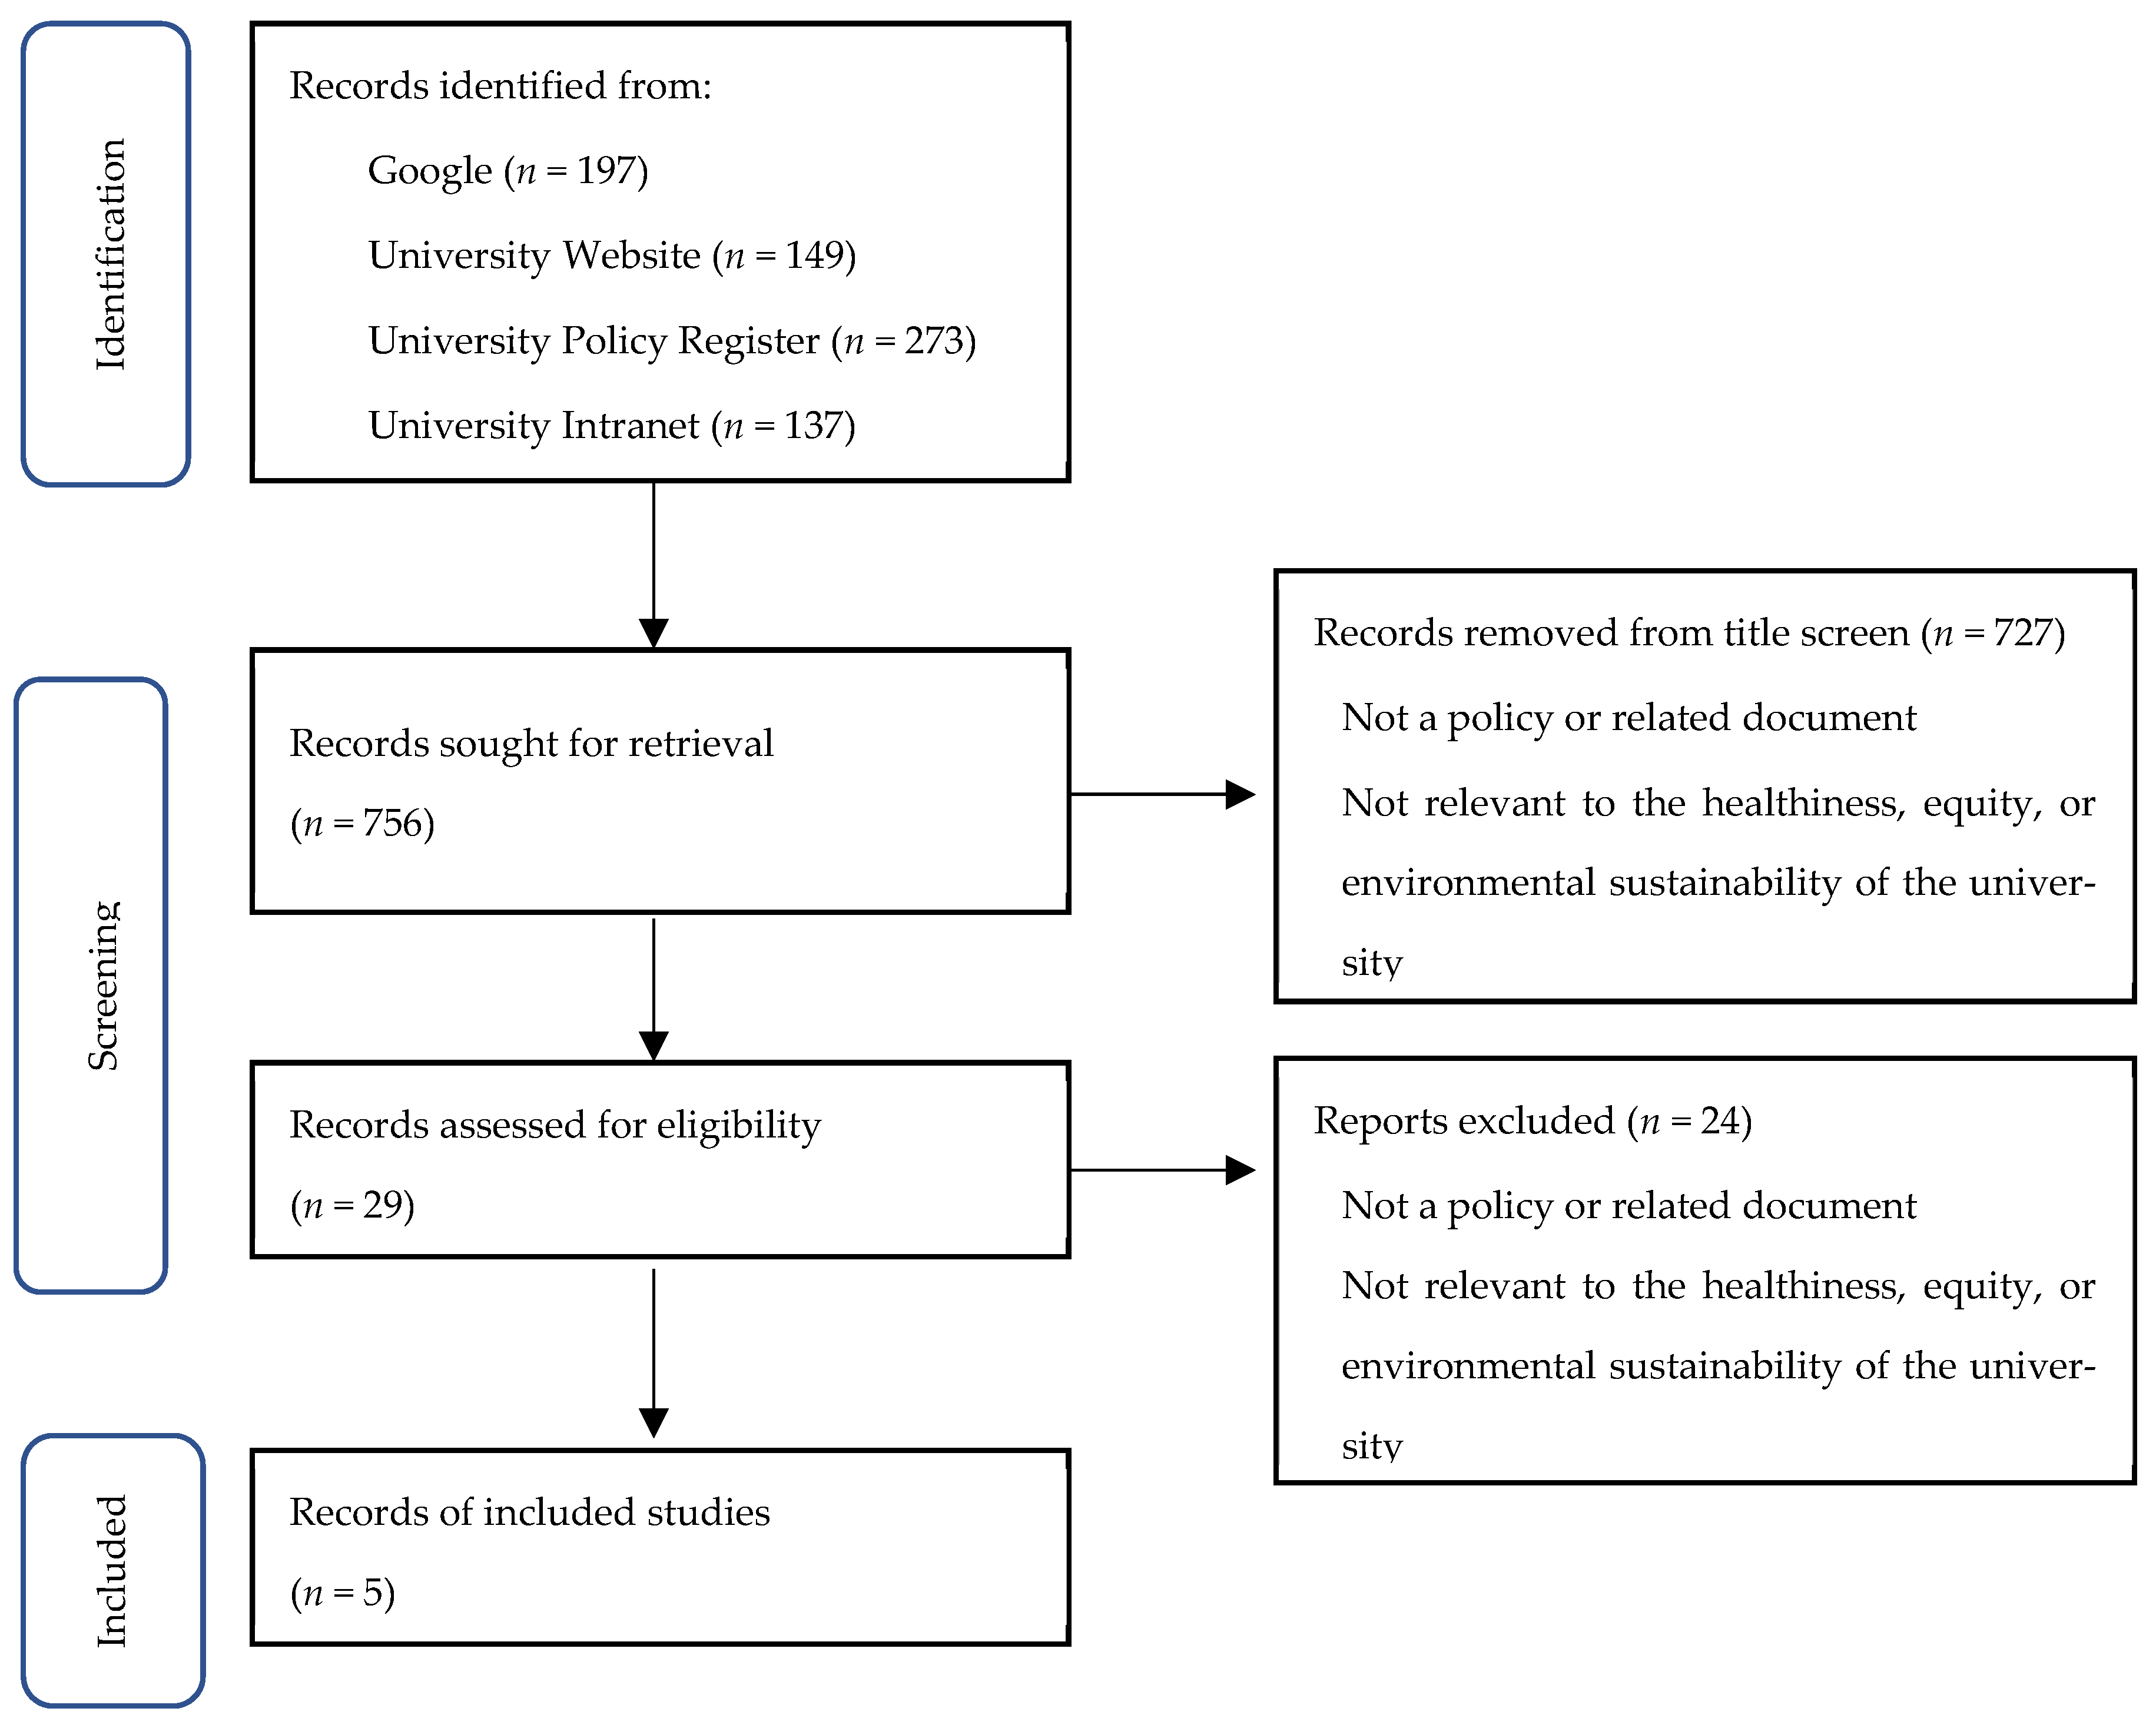
The ‘University Systems and Governance’ audit was conducted over two weeks via a systematic search on Google and the university website, intranet, and policy register to locate relevant university policies, strategy documents and reports. Search terms included (health or equity or sustainability or food) AND (policy or strategy or report or guideline) AND (the full name of the university or acronym). The auditors screened records for eligibility by their titles. The majority of records were not formal university policies and/or were irrelevant to the university food environment; for example, many were related to the university’s research on healthy, equitable and sustainable food development in the world, but not its own food environment. Following the title screen, full texts of the records were screened to determine relevance to the tool’s indicators. For indicators for which evidence from the systematic search could not be obtained, specific terms from the indicators were used to search for targeted evidence on Google and the university website, intranet, and policy register. Where relevant documents could not be located, staff members of the university were consulted. Policies and strategies were then evaluated as per the Uni-Food tool.
The ‘Campus Facilities and Environment’ and ‘Food Retail Outlets’ audits were conducted via a walking campus audit between 19 March 2025 and 15 April 2025. Each outlet took approximately one hour to audit. Campus facilities and outlets were identified using the university website and university campus map and during the walking audit. The ‘Campus Facilities and Environment’ component was assessed by the presence of water fountains, waste management systems, kitchen facilities, food advertising, vending machines, and food outlets showing innovation in sustainability and food equity. Equity was operationalised using Uni-Food indicator criteria such as affordability indicators (price promotions, cheaper healthy options), food relief availability, culturally appropriate options (where captured by tool), accessibility (water, kitchens), etc. Food outlets were assessed by their menus, displays, promotions, pricing, and sustainability. The Australian Guide to Healthy Eating was used as the standard for defining foods sold at retail outlets and vending machines as ‘healthy’ (defined as foods from the five food groups) and ‘unhealthy’ (defined as discretionary foods or foods high in saturated fat, added sugars and/or salt) [24].
The assessors completed the audits independently to reduce bias. Inter-rater reliability was assessed by pilot testing the auditing tool on four outlets before formal data collection. The remaining outlets were assessed in duplicates. Where large discrepancies, defined as scores differing by a range of 3 or more, arose in the scoring of each indicator, discussions were held with a third auditor to achieve a consensus. A Cohen’s Kappa score of 0.89 (p < 0.001) was calculated using IBM SPSS Statistics (SPSS version 29.0.1.0 (171), SPSS Inc., Chicago, IL, USA, 2023) indicating almost perfect inter-rater reliability [25]. As per the Uni-Food tool, the university’s final score out of 100 was determined using weighted sub-domain and domain scores in Excel. The interpretation scale for the total score (ranging from 0 to 100) is categorised as follows, per the Uni-Food tool: 0–25% indicates very little implementation; 25–50% represents low implementation; 50–75% denotes a medium level of implementation; and 75–100% signifies a high level of implementation. Further analysis assessed trends between component scores and outlet types. Descriptive and inferential statistics were performed using IBM SPSS Statistics (SPSS version 29.0.1.0 (171), SPSS Inc., Chicago, IL, USA, 2023) [26]. The normality of data was assessed using the Shapiro–Wilk test. Paired t-tests were then used for normally distributed comparisons. The Mann–Whitney U and Kruskal–Wallis H tests were used for non-parametric comparisons [25].

3. Results

This Results Section presents findings from the 2025 data collection. Full results are reported for 2025, and comparative analyses are undertaken to examine changes between 2022 and 2025 in overall scores, domain-level scores, and component-level scores. With a calculated score of 52%, the university’s performance falls within the medium implementation bracket. The ‘Campus Facilities and Environment’ component scored highest, while ‘Food Retail Outlets’ scored lowest (Figure 1 and Figure 2, Table 1).
Overall scores differed modestly between 2022 and 2025 (48% vs. 52%), but component-level differences were not statistically significant (paired t-tests, all p > 0.017). The Shapiro–Wilk test indicated normal distribution for component scores, supporting the use of paired t-tests. Due to multiple comparisons (three paired t-tests), the researchers used a Bonferroni-adjusted significance threshold of p < 0.017. Changes in all components were not statistically significant (paired-sample t-tests, all p > 0.017).

3.1. University Systems and Governance

The search process for policies for the ‘University Systems and Governance’ audit is depicted in the PRISMA diagram in Figure 3. This flow diagram is provided to transparently report document identification, screening, and inclusion for the policy audit (adapted from PRISMA-style reporting). Five relevant policy documents (four sustainability strategies/reports and one procurement policy) were selected from 756 initial search results (Figure 3).
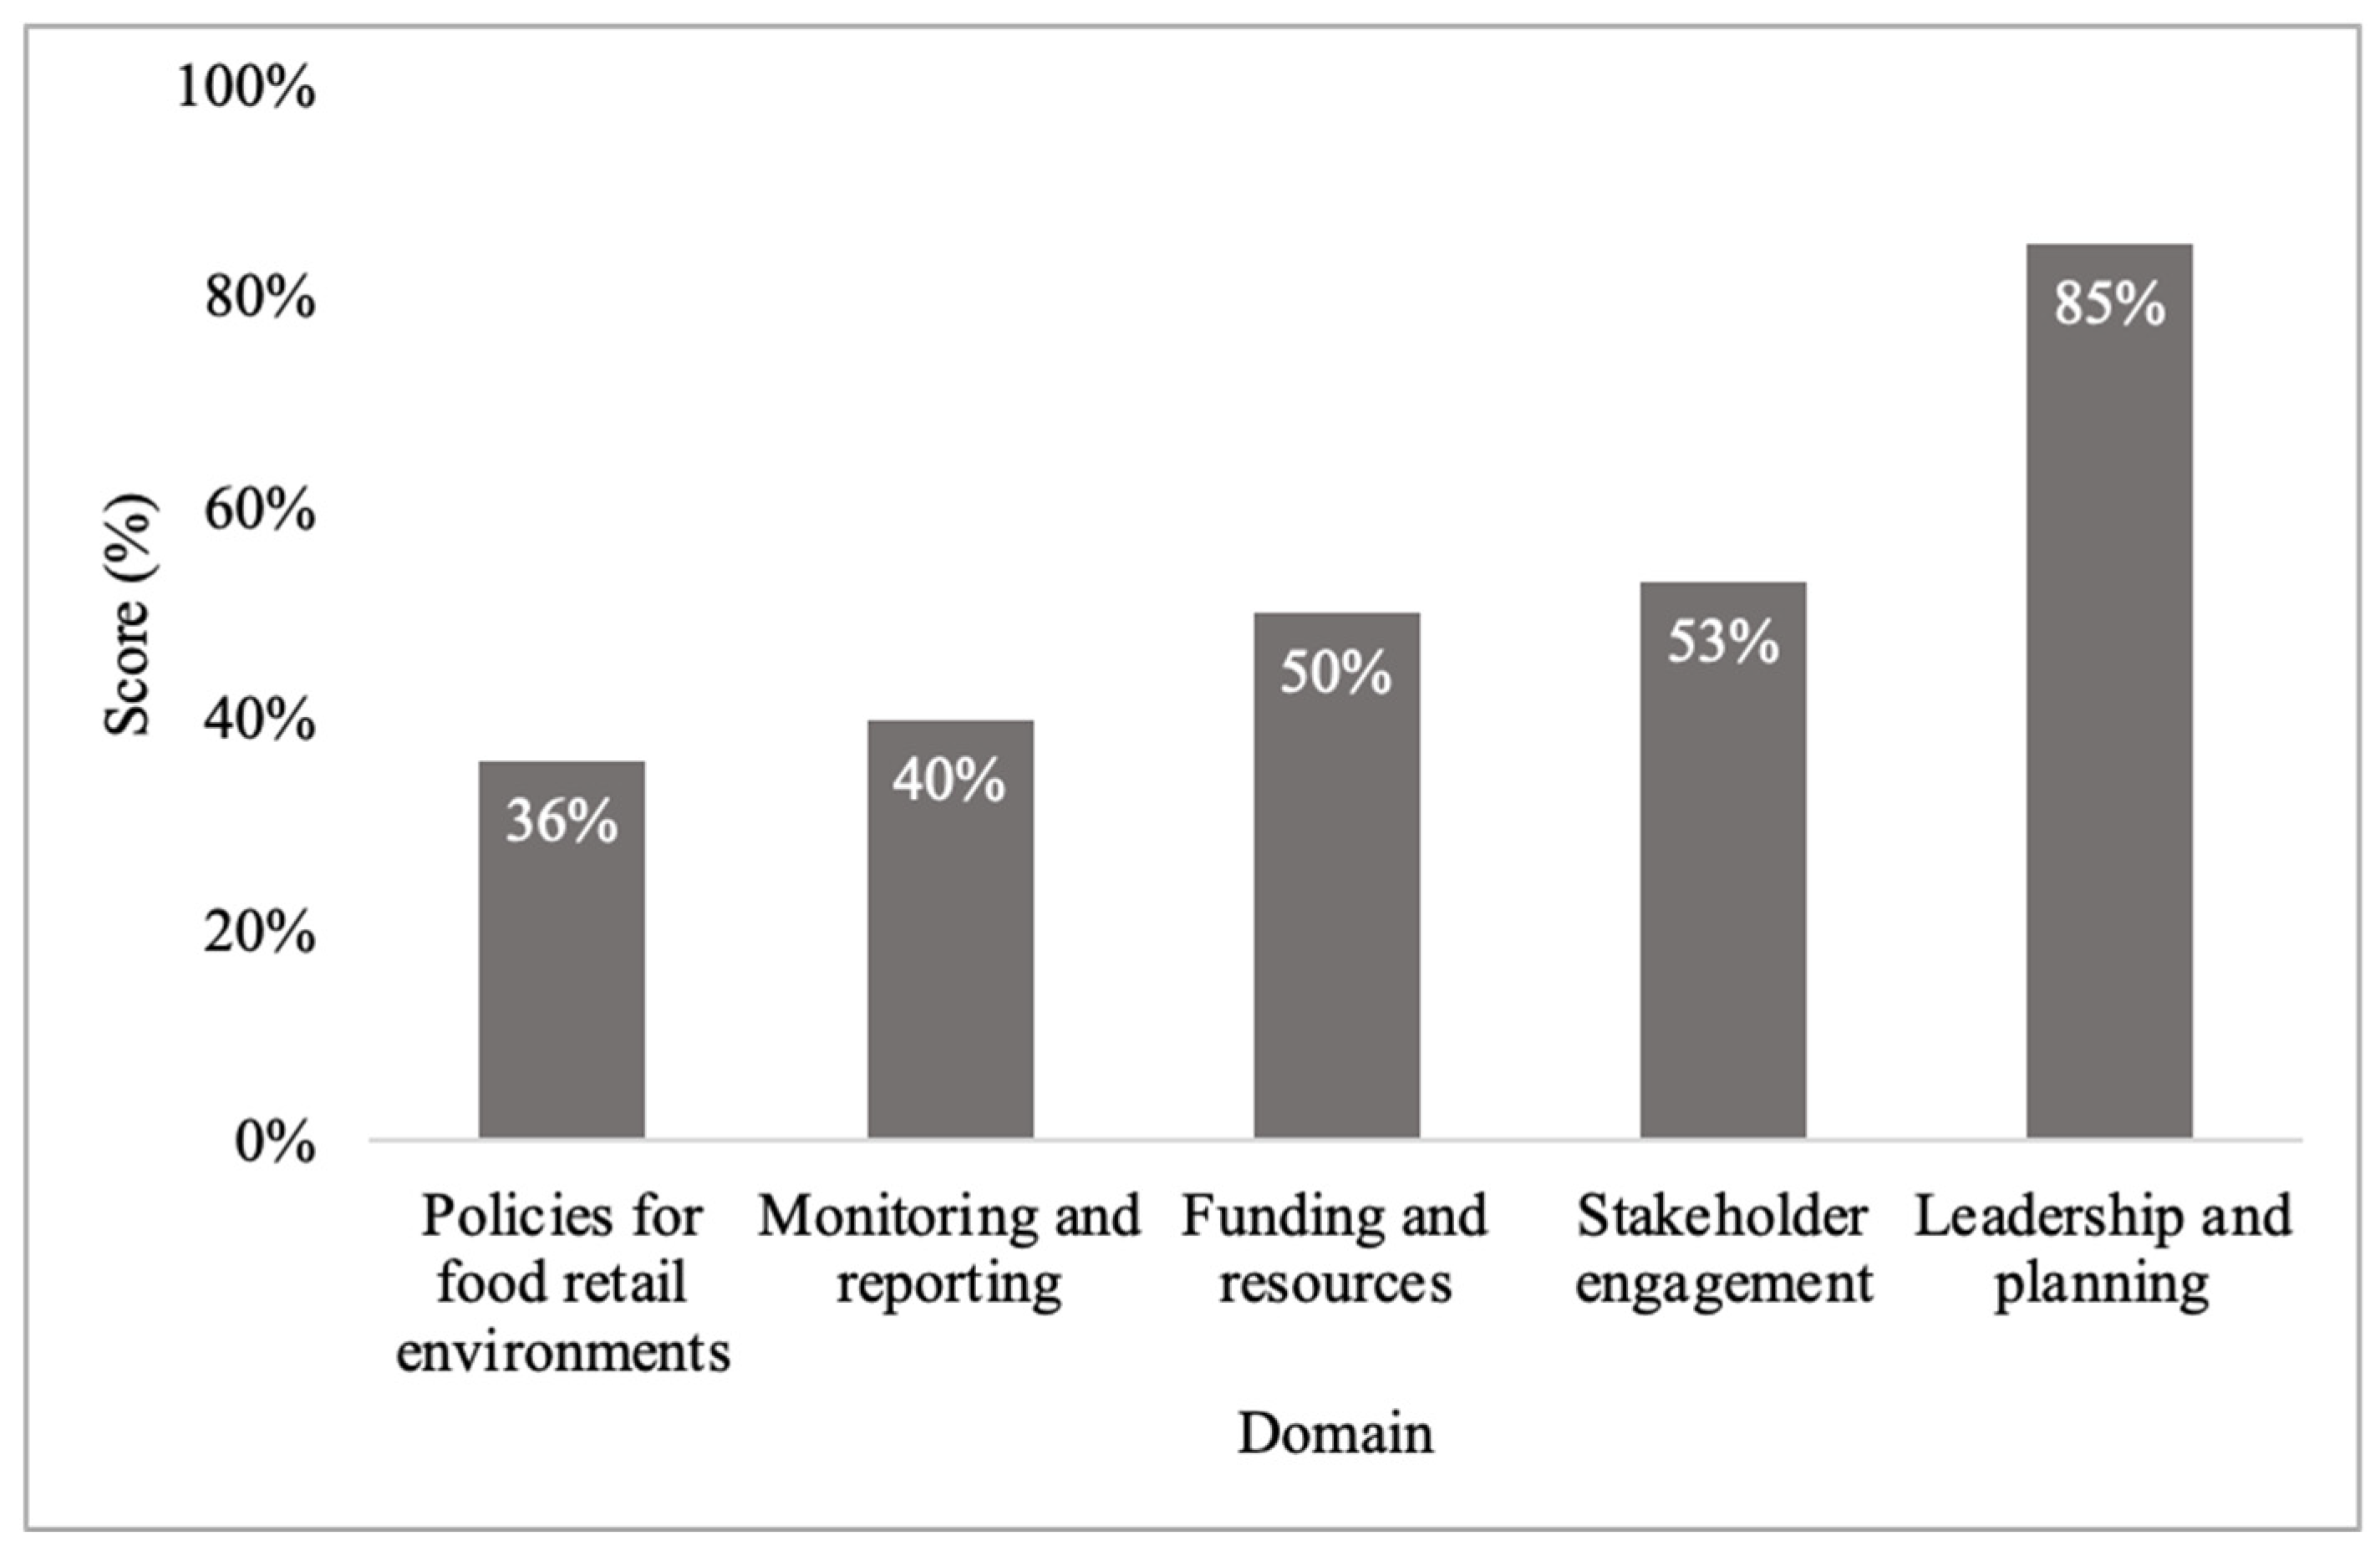
The domain scores for the ‘University Systems and Governance’ component are shown in Figure 4. Policies for ‘Food Retail Outlets’ and ‘Monitoring and Reporting’ scored lowest, reflecting limited policy comprehensiveness and food environment monitoring measures. ‘Funding and Resources’ scored moderately as funding was dedicated to the University Student Union (USU) to run numerous student-led food security and sustainability initiatives. ‘Leadership and Planning’ scored highest as university strategies addressed the healthiness, equity, and sustainability of the food environment (Figure 4).

3.2. Campus Facilities and Environments

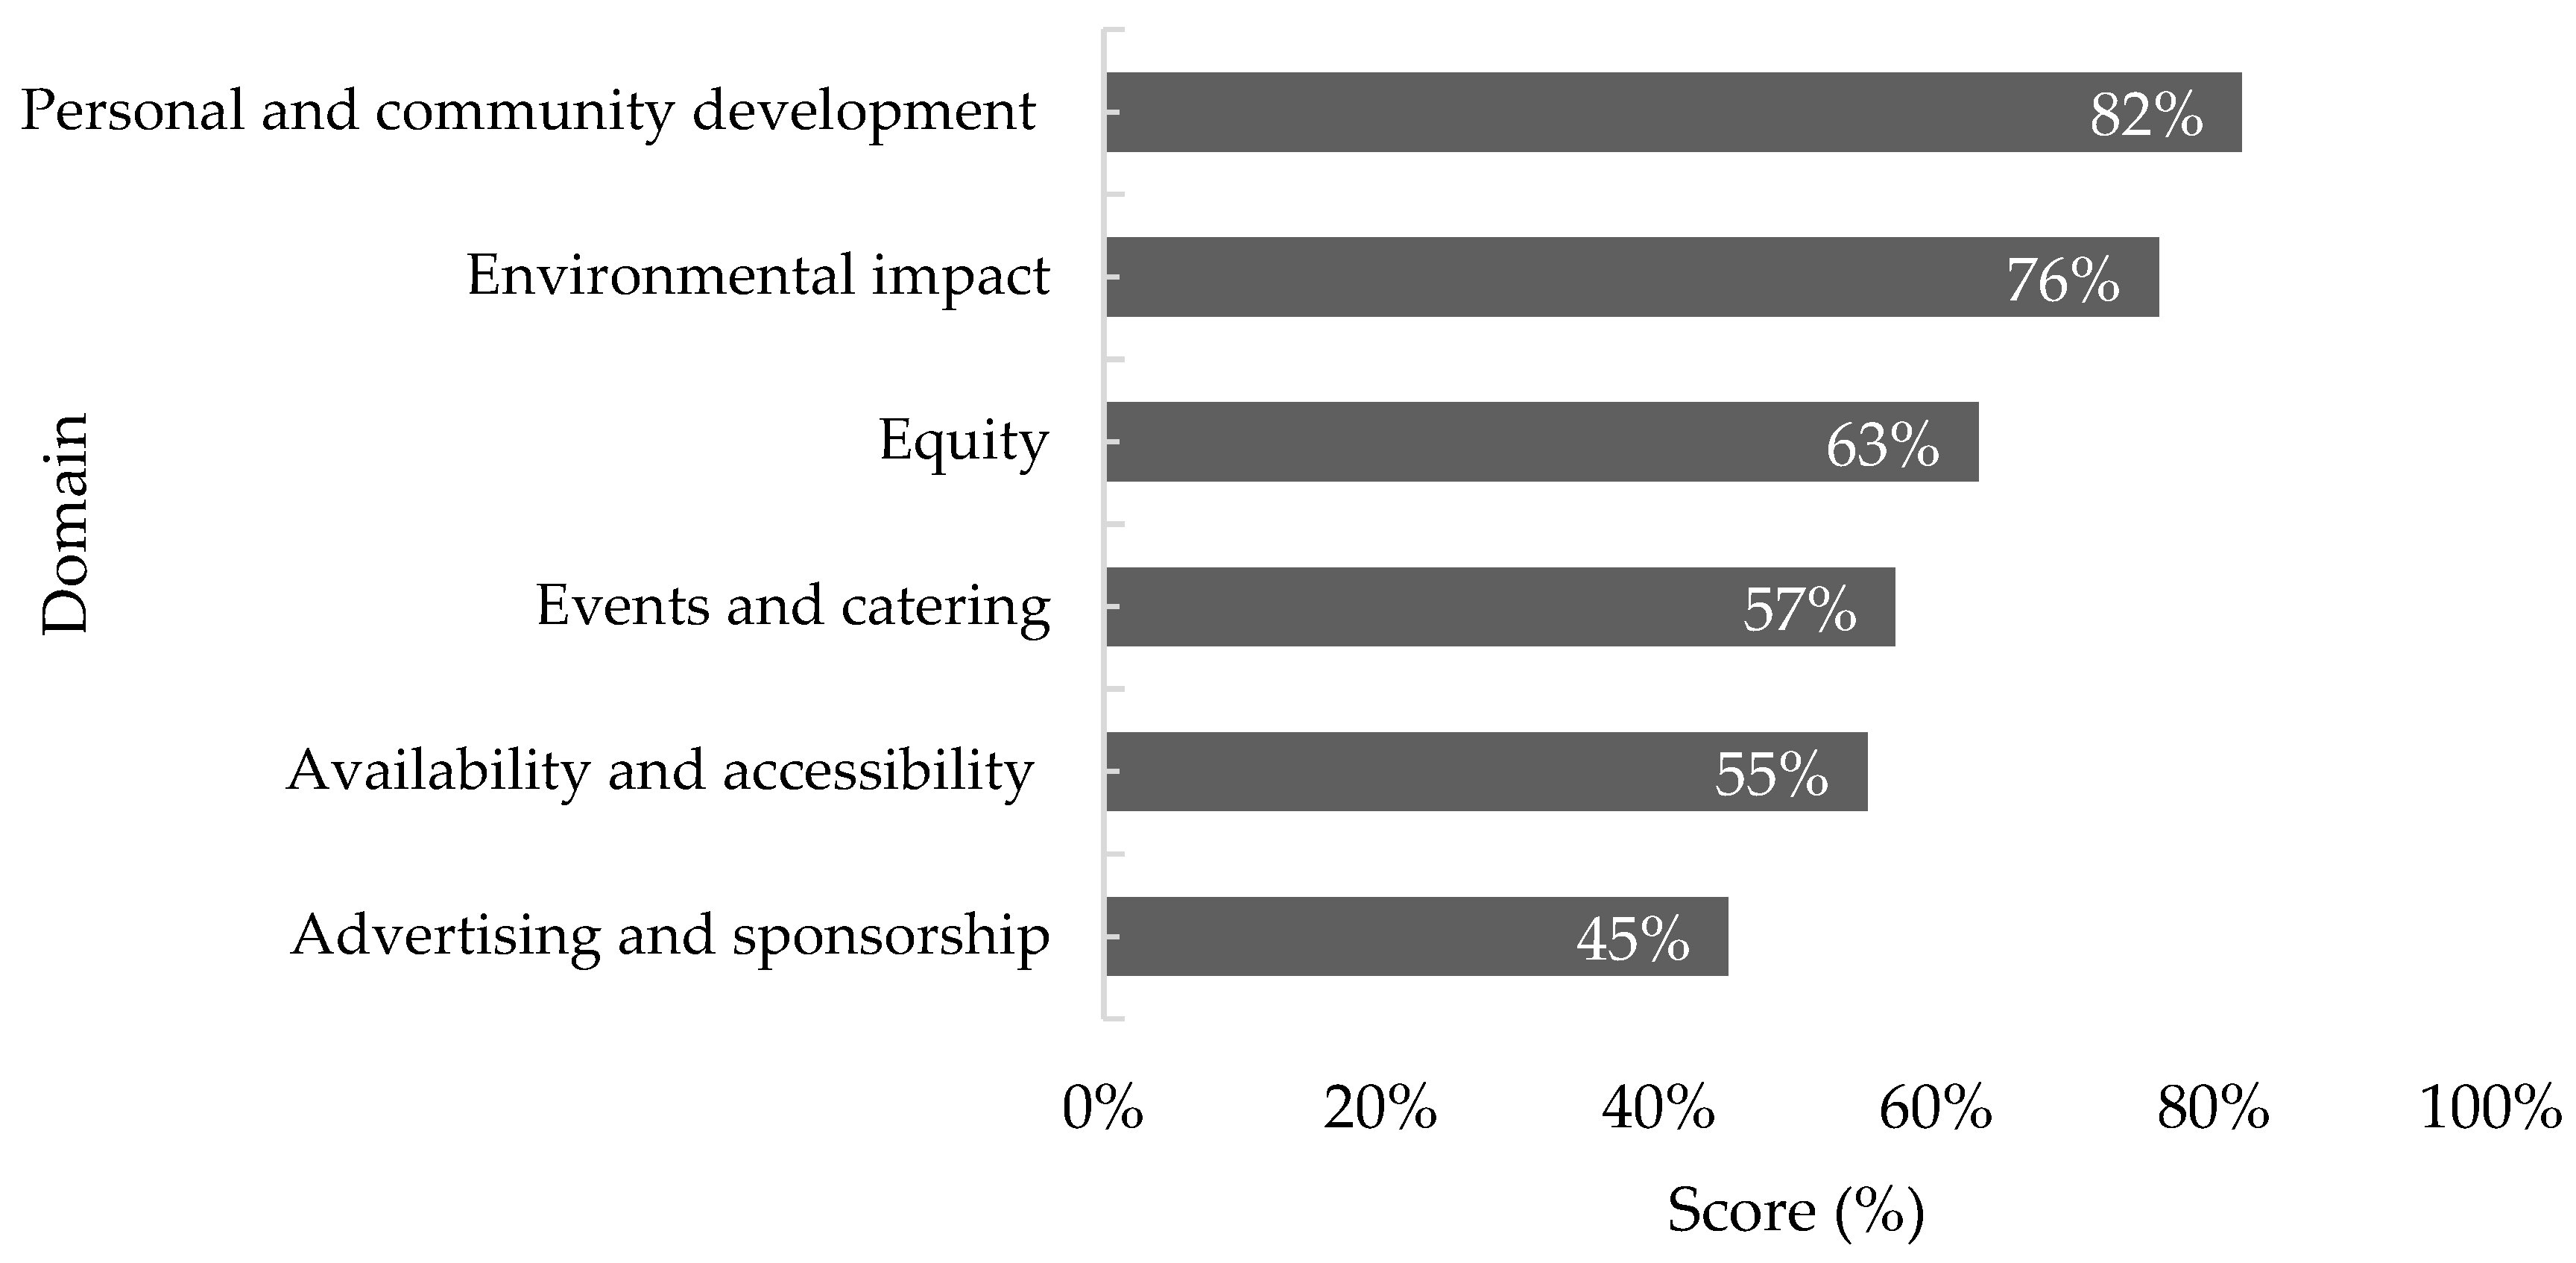
The ‘Campus Facilities and Environment’ component was the highest-scoring, and its domain scores are shown in Figure 5. ‘Advertising and Sponsorship’ scored lowest due to unhealthy event promotions by student-led groups. ‘Availability and Accessibility’ scored moderately, as vending machines did not provide nor label healthy foods. ‘Equity’ scored moderately, reflecting the availability of a widely available food relief programme run by the university union. The highest scores were for ‘Personal and Community Development’ and ‘Environmental Impact’, as nutrition knowledge-building workshops and sustainability initiatives, such as waste monitoring systems, were available (Figure 5).

3.3. Food Retail Outlets

Forty-seven food retail outlets were audited, including 17 identified during the campus audit; 13 were owned and operated by the university union (Table 2). Given the campuses form one contiguous precinct, results are interpreted at the combined precinct level; zone-level results are presented to support operational targeting.
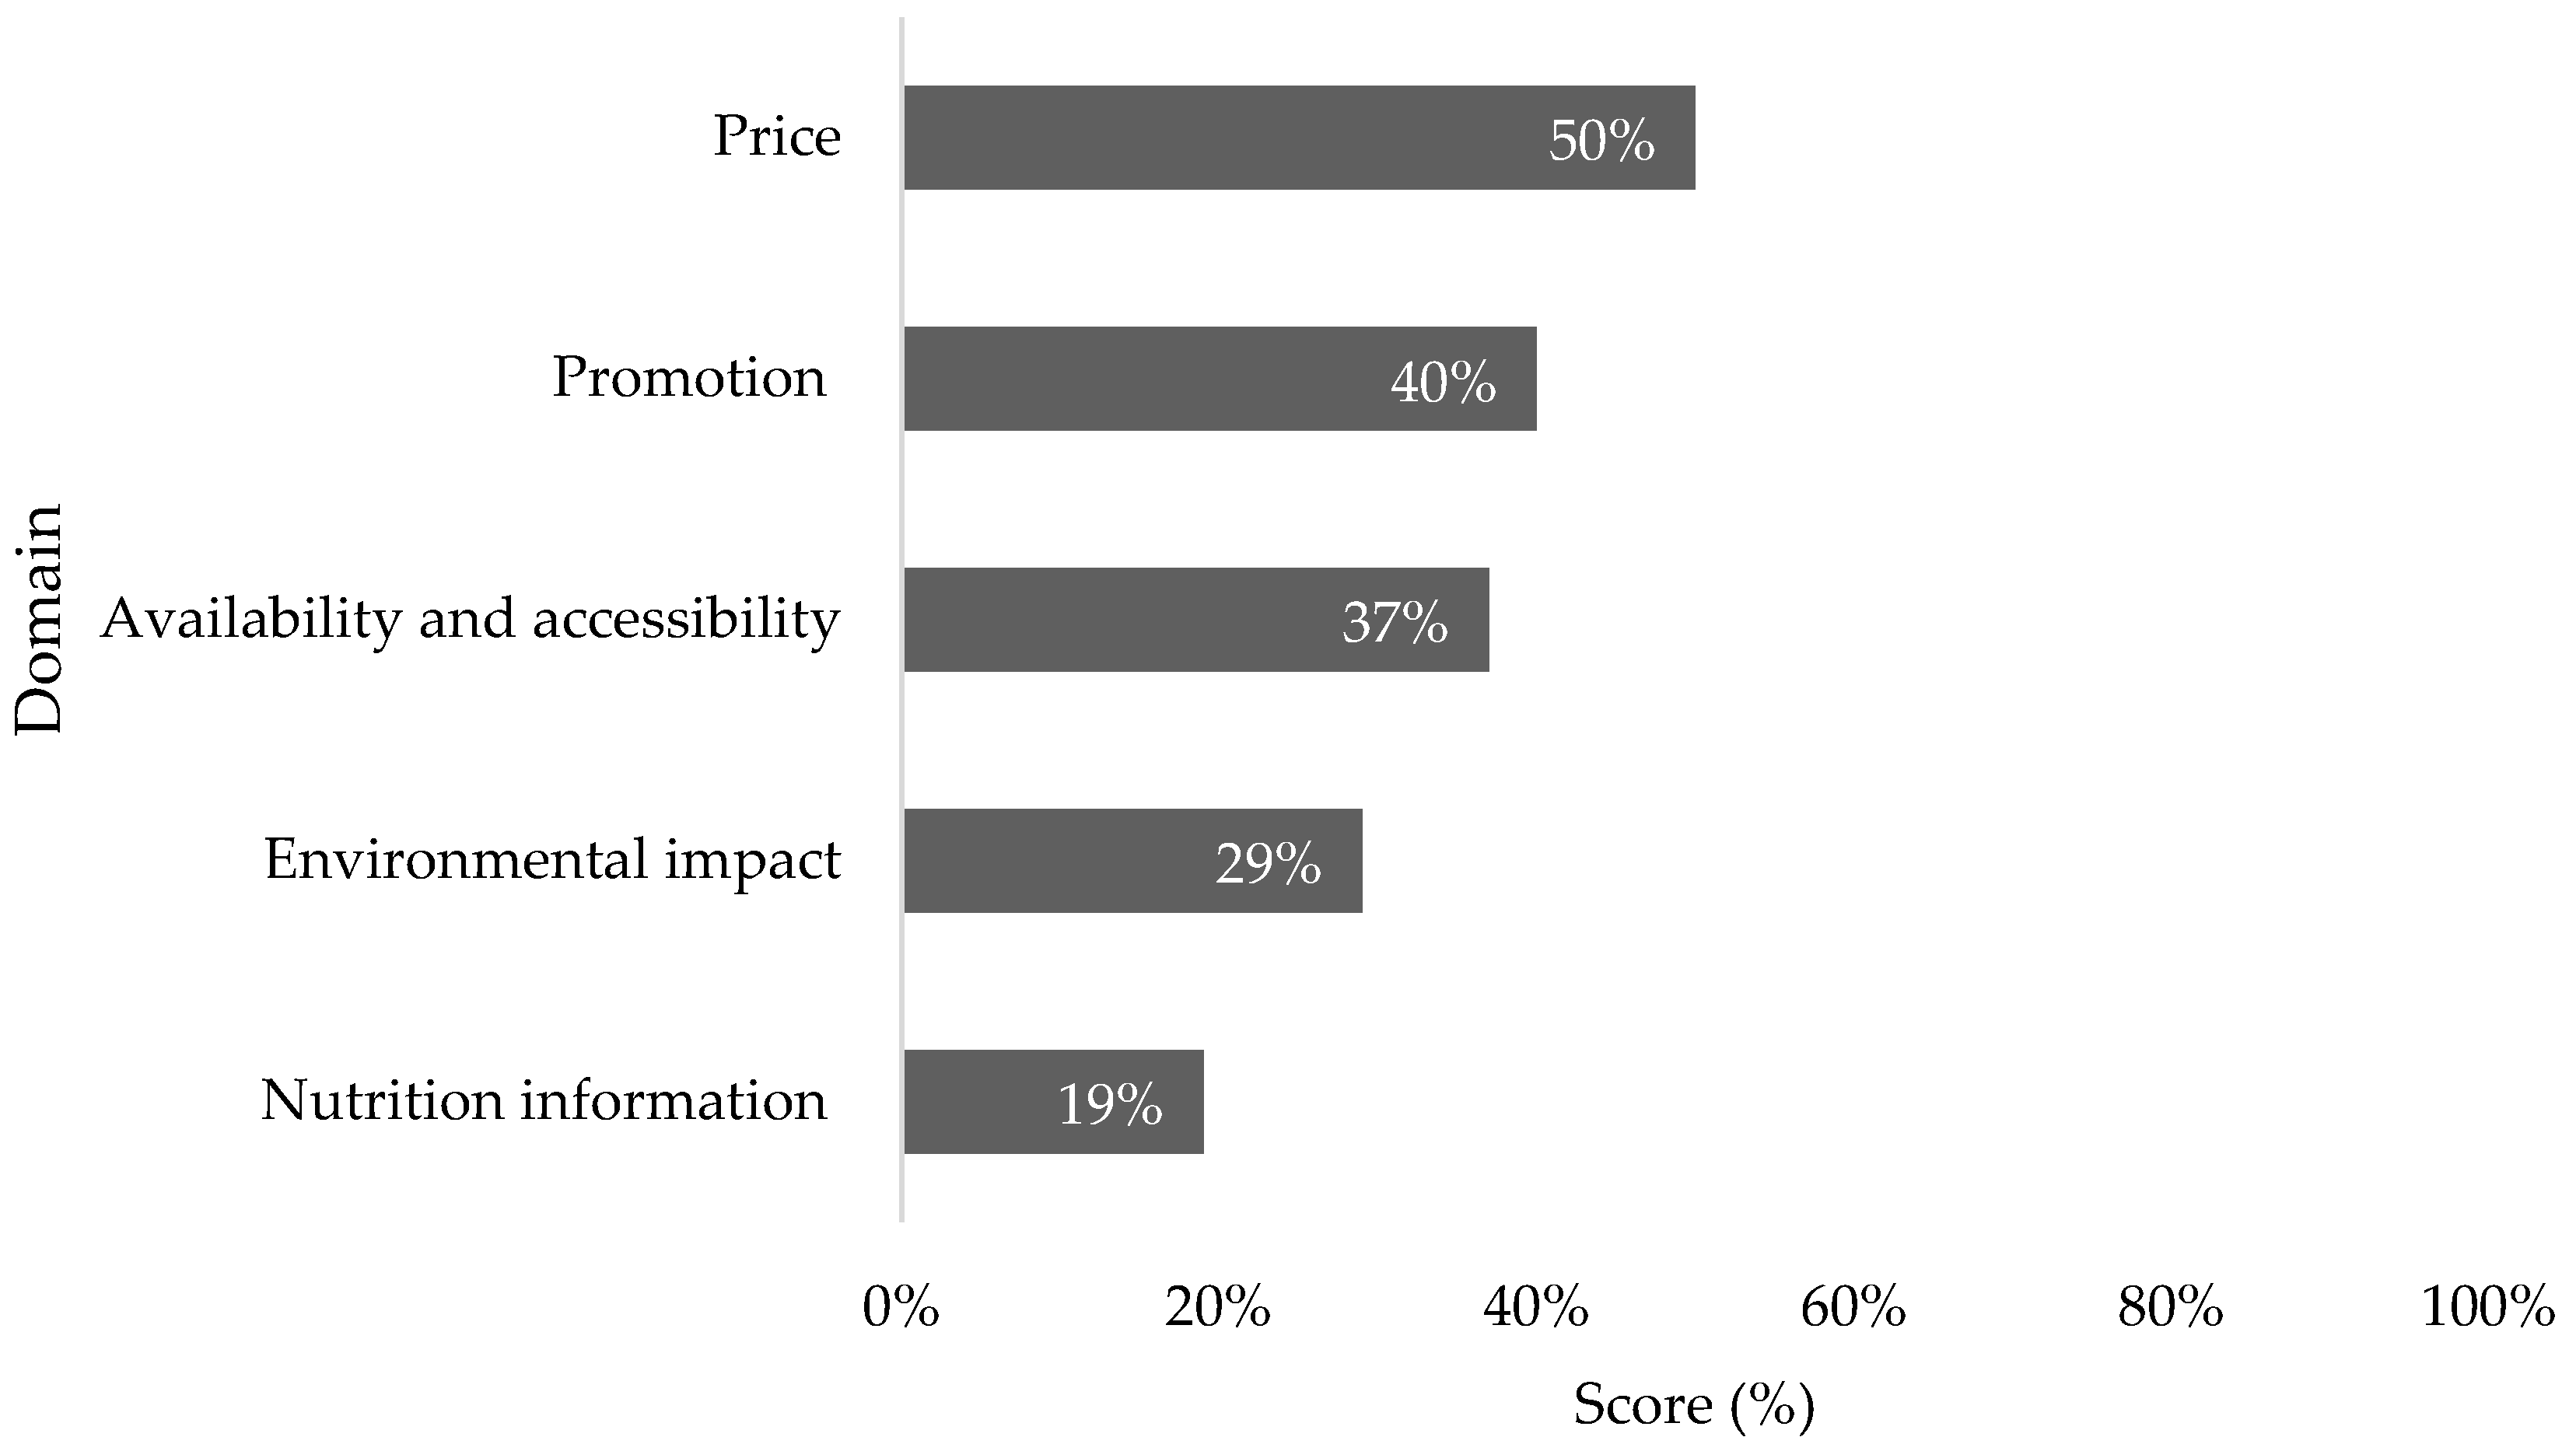
The unweighted domain scores for the ‘Food Retail Outlets’ component are shown in Figure 6. This component was the lowest scoring. ‘Nutrition Information’ and ‘Environmental Impact’ domains scored lowest due to limited nutritional signage and sustainable practices. ‘Promotion’ showed low scores as a popular energy drink brand dominated advertisements found in outlets. ‘Price’ showed moderate scores with minimal differentiation between healthy and unhealthy items (Figure 6).

Food Retail Scores by Outlet Type

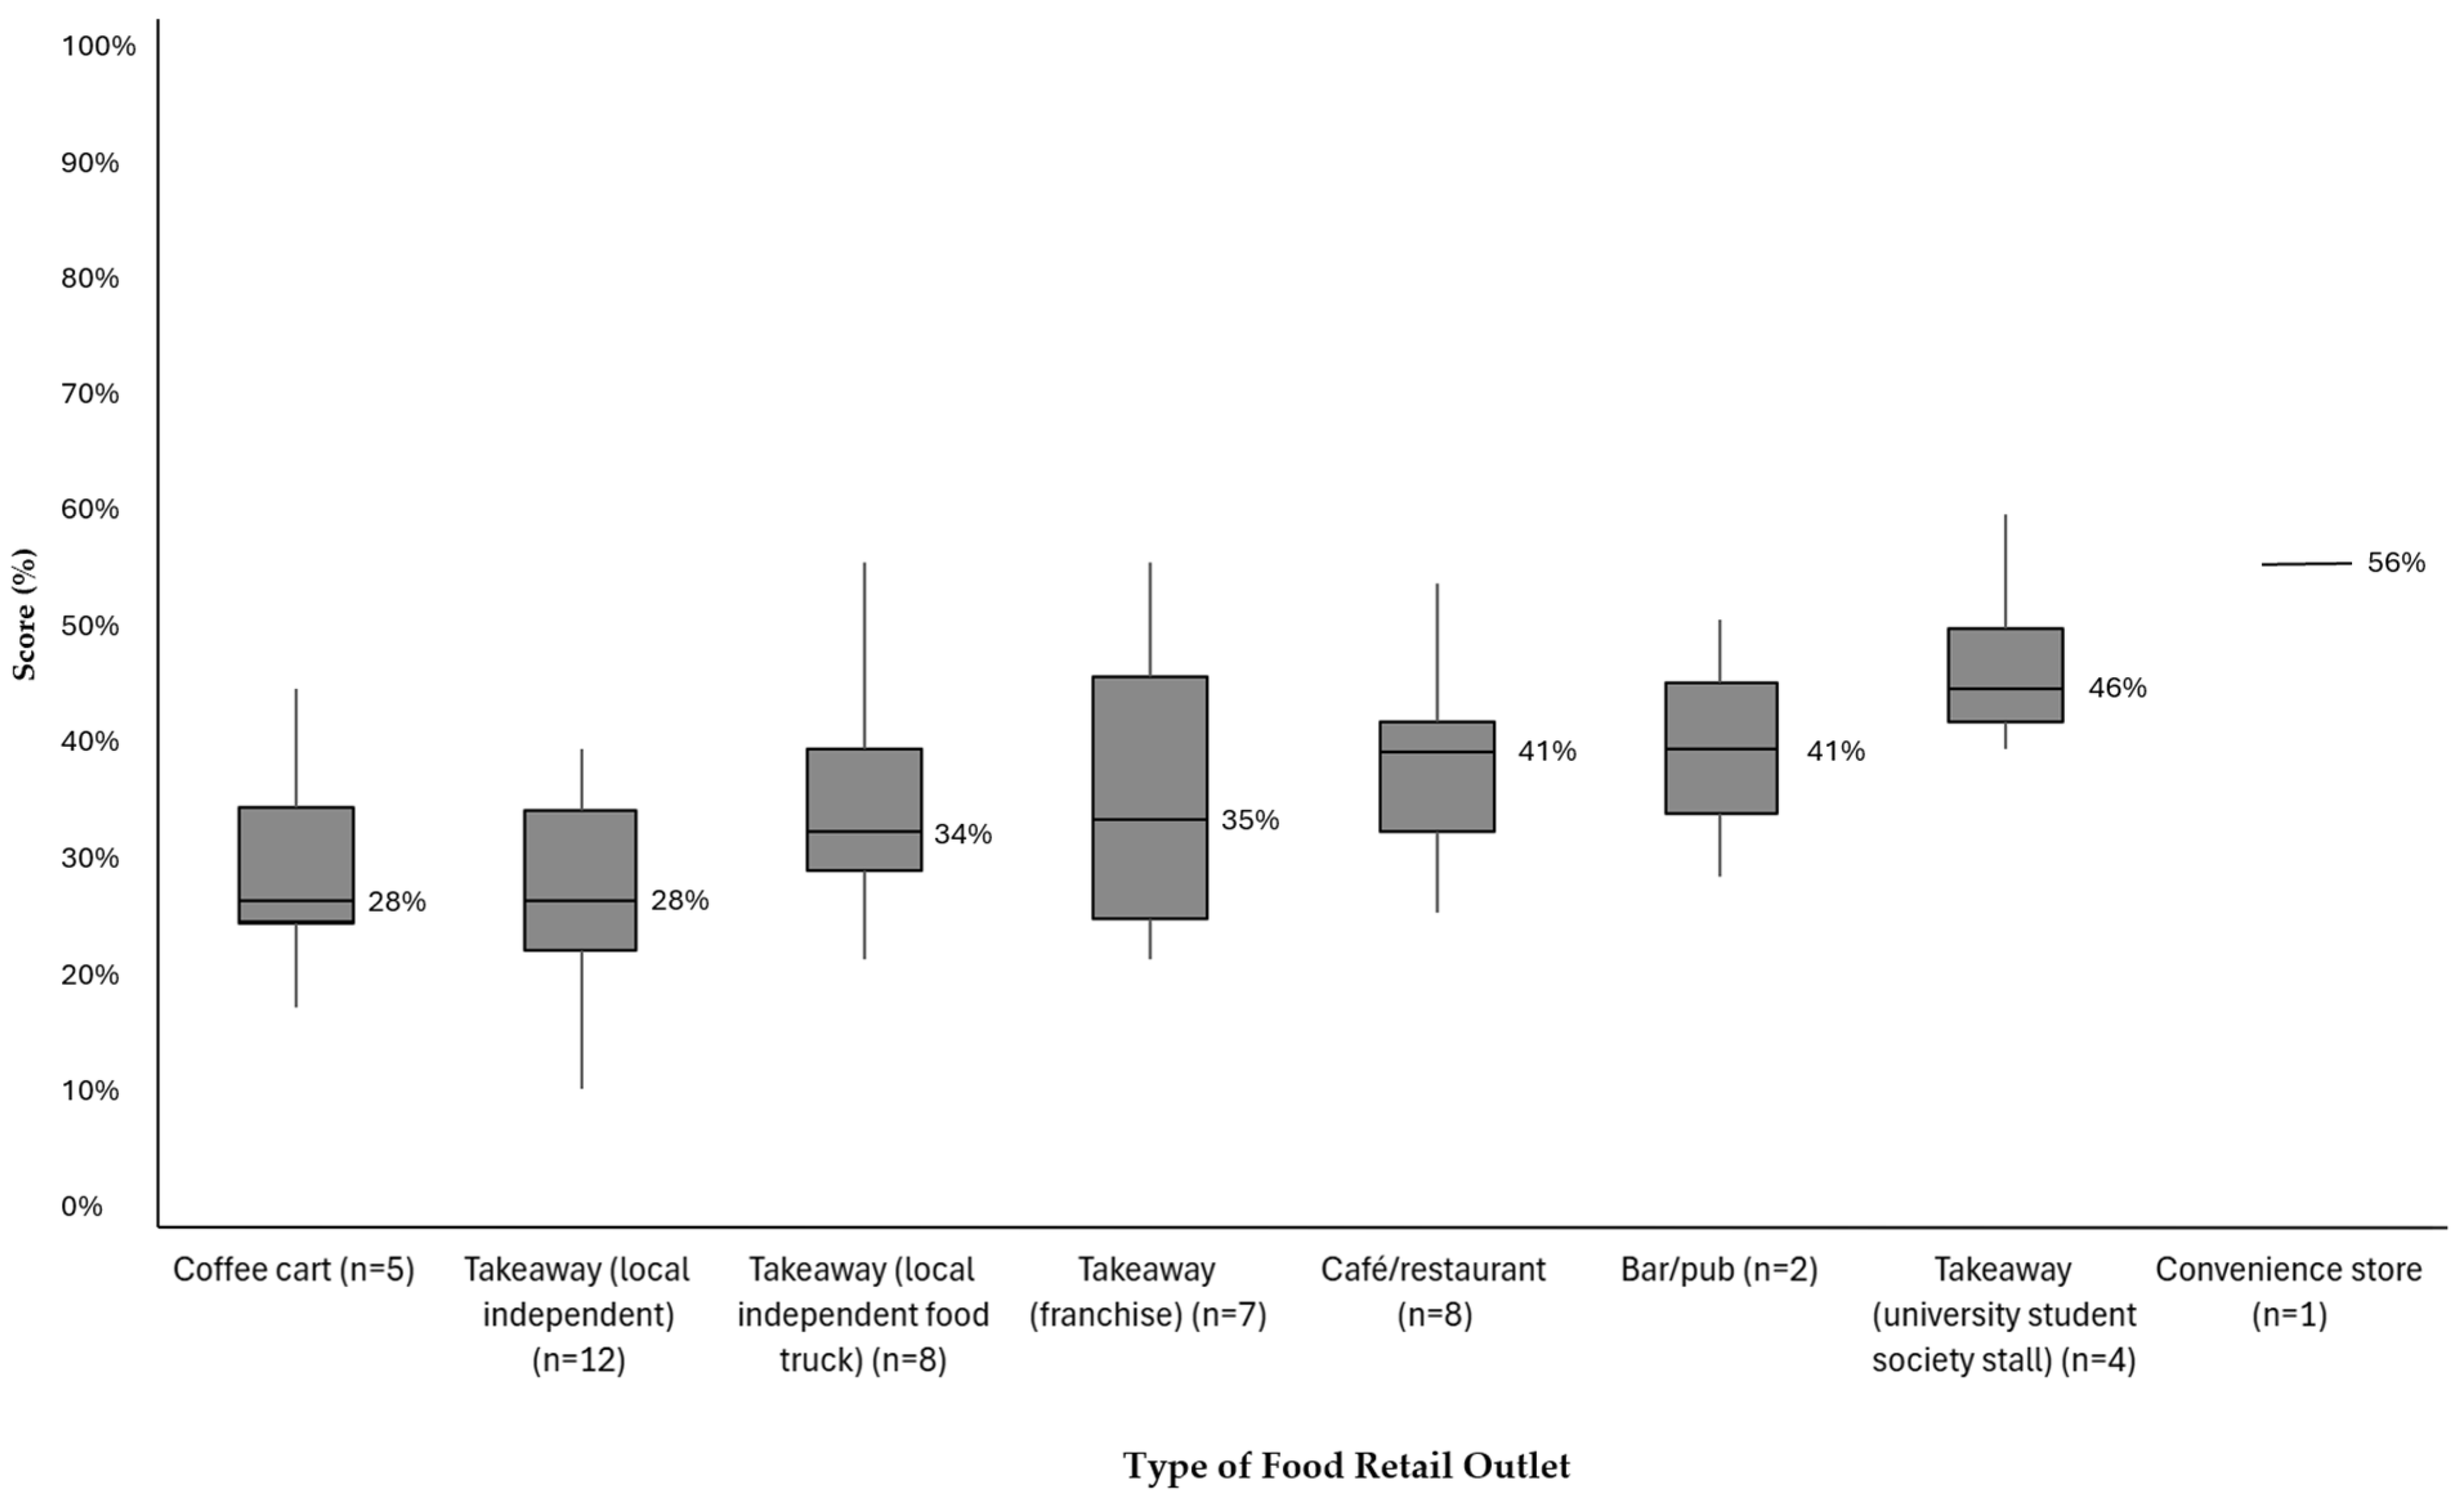
Median scores varied by outlet type, as shown in Figure 7, and were all within the low compliance range. No significant differences were observed between outlet types (Kruskal–Wallis test, p = 0.06; Figure 7). Outlet types with very small sample sizes (n < 3) are reported descriptively only.
Outlets were categorised into low- and high-performing by outlet type, as shown in Table 3. Local independent outlets had the greatest number of low-scoring outlets. A limited number of outlets performed highly, with coffee carts and local independent outlets being the only outlet types with no high-performing outlets.
Domain scores for each outlet type are shown in Table 4. All outlet types scored very poorly for ‘Nutrition Information’ and ‘Environmental Impact’. Coffee carts and local independent outlets scored the lowest for ‘Price’, as unhealthy foods were often cheaper than healthy foods. For ‘Availability and Accessibility’, all scored below 50% of the domain total. Coffee carts had the lowest median score, as most of their products comprised discretionary foods and drinks. For ‘Promotion’, most outlet types scored very poorly, as they displayed prominent advertisements for a popular energy drink and other unhealthy foods.

4. Discussion

This study aimed to assess the healthiness, equity, and environmental sustainability of a university food environment. According to the Uni-Food tool, this university moderately adhered to best practice in 2025. Most domain scores were below 75%, giving rise to various areas for improvement. Furthermore, there have been minimal improvements since the last audit which was completed in the year after the COVID-19 lockdowns [18]. The 2022 audit was conducted during a post-COVID-19 recovery period after substantial disruption to campus trading in 2020–2021, including outlet closures and business turnover. As a result, 2022 should be interpreted as a transitional baseline rather than a typical ‘pre-intervention’ state. With an increase in food outlets from 32 in 2022 to 47 in 2025, the 2025 audit reflects a more stabilised campus food environment. The observed differences may therefore represent recovery dynamics as much as policy or practice change.
The low performance of the ‘University Systems and Governance’ component was attributed to the lack of a comprehensive policy that addressed all aspects of the food environment. The university’s sustainability strategy included specific, measurable, attainable, relevant, and timely (SMART) strategies to address campus food and plastic wastage; however, it lacked comprehensive strategies addressing the healthiness and equity of the food environment [27]. Previously, the university targeted unhealthy foods on campus through a ‘Healthy University’ project with a university-wide working group of academic, professional and Union staff; however, that project was completed in 2019 [28]. This aligns with the literature, as universities generally have stronger sustainability policies, and lack policies to address the healthfulness and equity of university food environments [29]. The prioritisation of environmental sustainability may be a result of universities aiming to meet sustainability rankings on a global stage [16,29,30]. However, the issues of health and equity should be addressed alongside sustainability, given the current issues of poor dietary habits and food insecurity that students face [31]. The lack of a food retail policy was also identified as a major area for improvement given that food retail outlets are a major source of food purchases. The lack of a policy regulating the sale, promotion, and pricing of healthy and sustainable foods in outlets was a common finding in other Australian universities [29]. Furthermore, unhealthy foods are pervasive in university food retail outlets [4,29,31,32,33]. This warrants attention as greater accessibility to unhealthy foods nudges student dietary behaviours towards these foods, and unfavourable pricing reduces equitable access to healthy foods [32]. Hence, to foster favourable dietary habits, the foods provided by food retail outlets and relative pricing of healthy versus unhealthy foods could be regulated.
The lack of systematic and publicly available food environment monitoring, and surveys of campus food and beverage consumption, suggests a limited ability to track and implement changes to the food environment. Similar findings were observed in many Australian universities as they lacked comprehensive monitoring of their food environments [29]. Regular and comprehensive tracking is necessary to illustrate a thorough picture of university food environments, to progress policy and practice change [18,21,29,31].
The studied university performed moderately well in the ‘Campus Facilities and Environment’ component. Consistent with international evidence that university food security initiatives are often delivered through partnerships (e.g., student unions, campus services, and retailers), the University of Sydney union supported a suite of student-facing programmes including food relief, free food events, and sustainability practices within union-operated outlets [31]. Food relief programmes in Australian universities are commonly supported by student unions as they prioritise addressing issues faced by students. This highlights the importance of partnering with student unions to promote better food environments. The university’s strong overall campus waste management systems may be attributed to the dedication of research, sustainability groups and resources to comprehensive waste management [27]. Universities previously audited using the Uni-Food tool similarly scored above 50% in this domain [29]. However, partnership requires an explicit strategy to navigate differing narratives about individual responsibility, choice, and the role of institutions in nutrition [34]. Industry-aligned discourses are frequently reflected in public discussions of nutrition policy, particularly among young adults, and may influence perceptions of what actions are considered appropriate or acceptable in campus settings.
Food retail outlets and vending machines were dominated by unhealthy food options placed in prominent locations and lacked nutrition signage. Furthermore, unhealthy and animal-source foods were advertised and priced equally to healthy and plant-source foods in food outlets. As such, student demand for affordable, nutritious foods is not actively supported, and reliance is placed on the university population to have prior nutrition knowledge when making food choices [35]. Universities previously audited using the Uni-Food tool and other similar tools were also found to be dominated by unhealthy options and lacked point-of-purchase interventions to assist students in choosing healthier options [9,29,36]. These weaknesses may reflect limited policy levers and implementation support to make healthier and environmentally sustainable choices commercially viable for vendors.

Strengths and Limitations

A key limitation is that the first timepoint (2022) occurred during recovery from COVID-19-related disruption, when the number and mix of outlets and operating conditions were not representative of typical campus operations. A pre-pandemic audit (no true pre-COVID-19 baseline, e.g., 2019, available) would provide a more appropriate baseline for assessing structural change, but such data was not available. An audit of the same university food environment using a different audit tool was conducted in 2014. The study found that tertiary-education food environments are generally unhealthy, with a median food environment quality index score of 72 out of a possible 148 across 252 outlets. Unhealthy items like sugar-sweetened beverages, chocolates, high-energy foods, chips, and confectionery were the most frequently available, accessible, and promoted, while healthy options were less so [9]. A strength of the current study is its contribution to the ongoing monitoring of this university food environment, aligning with best practice of the Uni-Food tool. Notably, to translate findings into policy and practice change, further advocacy and communication with relevant stakeholders is needed. Another strength is that the Uni-Food tool evaluated the wider experience of food on campus by including policy and campus facilities, not only food retail outlets. However, since this study addressed many pillars of the food environment, a comprehensive analysis of the nutritional quality of foods sold was not undertaken. Healthiness of foods on campus was scored by categorising foods into very broad categories of ‘healthy’ and ‘unhealthy’, meaning that the healthiness of foods may be over- or under-estimated. The classification of foods may be oversimplified and can be improved by using nutrient quality assessment tools in conjunction with the Uni-Food Tool [29]. Another strength of this audit was that all food outlets agreed to participate in the audit, which reduced self-selection bias. In addition, the auditors achieved high agreement which minimised individual bias. Furthermore, despite being an objective tool, the Uni-Food tool criteria included subjective language, which may reduce reliability. However, rigorously pilot testing the tool and establishing consensus interpretation of the criteria aimed to mitigate these biases [18].
Several important implications for future research, practice, and policy can be derived from these results. These research findings will be disseminated to key stakeholders, including leaders at the university and the student union. This audit highlights the need for intervention in food outlets and vending machines, and recommends point-of-purchase studies as an avenue for future research. Assessing the effectiveness, cost effectiveness and acceptance of these interventions would support policy translation and ensure interventions are realistic and practical for vendors. Firstly, the provision of healthy and sustainable foods in outlets and vending machines is needed to address the low availability of such foods [6,8,37]. This can be regulated through provider contracts and university guidelines, such as the healthy food procedure implemented by Monash University [38]. To maintain business viability, promotional support may be provided to vendors to reduce implementation barriers and help vendors to increase the provision of healthy and sustainable options, which may present financial uncertainty. Furthermore, vendors may be encouraged to gradually increase the provision of healthy and sustainable foods allowing for evaluation and refinement. Next, the effects of nutrition signage in food outlets and vending machines should be assessed. The use of the Australian Health Star Rating (HSR) system may be an effective method in helping students to choose healthier options [21,35,39,40,41]. This is most effective when delivered with robust marketing strategies to increase awareness and competency in using the system [36]. Furthermore, a university-led marketing campaign may minimise the responsibility placed on vendors to implement robust marketing strategies, thus improving the uptake of nutrition signage by vendors. Notably, students have demonstrated a preference for vending machines with nutrition signage, making this a demanded area of intervention [7]. Next, with many students experiencing food insecurity, cost is often prioritised when choosing meals [14,42]. Price promotions, when delivered with marketing campaigns, have proven effective in nudging students to choose healthier options [43]. Promotions must be financially supported and co-designed with vendors to reduce any effects on their profits. Importantly, ‘support’ does not necessarily imply an ongoing subsidy; universities can trial revenue-neutral approaches such as cross-subsidised meal deals, choice-preserving promotions, and menu/placement redesign, alongside procurement and contract levers (e.g., minimum standards, preferred locations, longer leases). These approaches may gradually shift purchasing behaviours towards healthier options without affecting the profitability of vendors. Where upfront costs exist, small time-limited pilots can be funded through existing wellbeing/sustainability budgets or external seed funding and evaluated for revenue and equity impacts prior to scaling. Importantly, implementation of healthier retail policies in university settings may be contested by students and retail operators who prioritise consumer choice [34]. This highlights the need for governance approaches that emphasise partnership, co-design, and ‘choice-preserving’ strategies rather than solely restrictive policy levers.
The reinstatement of the previously existing university-wide working group would allow such research to be conducted [28]. Rather than assuming consensus on ‘healthy food’ goals, a structured partnership model is recommended (e.g., university leadership, student union, vendors, facilities/procurement and student representatives). Clear roles, shared objectives, and agreed principles that preserve choice are important. This could begin with union-owned outlets as a feasible pilot setting, alongside co-designed point-of-purchase strategies (e.g., signage, pricing trials) that are tested for effectiveness and acceptability before being scaled into formal policy and contracts. This is consistent with calls to strengthen ‘health-promoting universities’ through institutional leadership and resourcing, rather than relying on short-term projects. Taylor et al. [44] further emphasise the need for national and institutional investment to embed health promotion within university systems and culture. The working group can also support repeat monitoring using the Uni-Food Tool and regular student surveys to assess consumer satisfaction.
The coherent findings of the current study with previous university food environment audits shows that transferability may be relevant to similar large, urban universities; but findings are context-specific, and the tool is generalisable, not the site result. However, transferability may be less relevant for smaller universities with less resources and facilities. Audits on individual universities may inform more personalised recommendations.

5. Conclusions

This study audited the healthiness, equity and environmental sustainability of a university food environment using the Uni-Food tool. There were no significant differences found between the current audit and a previous audit completed in 2022, despite there being a four-percentage point directional change. Key findings include a lack of comprehensive policies implemented which regulate the food environment, particularly in food retail outlets, as well as widespread availability of unhealthy and environmentally unsustainable food. This highlights the need for policy development and implementation, and stronger practical initiatives. A policy that regulates the monitoring and evaluating of the food environment is recommended to benchmark the university’s progress towards its sustainability strategy. Future research should examine the effectiveness, acceptance, and feasibility of point-of-purchase interventions in the university food environment. This may inform food retail policy and promote advocacy and communication with relevant stakeholders to work towards a healthy, equitable and sustainable university food environment.

Supplementary Materials

The following supporting information can be downloaded at: https://www.mdpi.com/article/10.3390/su18115351/s1, Figure S1: Weightings of components, domains and sub-domains in relation to final score; Figure S2: Uni-Food Tool, showing each component and their respective domains, sub-domains and indicators.

Author Contributions

Conceptualization, R.R., A.A.G. and A.L.G.; methodology, R.R., B.T.L., M.A.-F., N.C., A.L.G., K.E.H. and K.Y.; formal analysis, B.T.L., N.C., K.E.H. and K.Y.; investigation, B.T.L., N.C., K.E.H. and K.Y.; writing—original draft preparation, K.E.H. and K.Y.; writing—review and editing, R.R., B.T.L., M.A.-F., N.C., A.L.G., K.E.H. and K.Y.; supervision, R.R., A.A.G. and A.L.G.; project administration, R.R. All authors have read and agreed to the published version of the manuscript.

Funding

This research received no external funding.

Institutional Review Board Statement

The study design was reviewed by the institutional Human Research Ethics Committee (HREC) from the University of Sydney (2025/HE000938, approval date: 11 September 2025) and was exempt from full ethics review as no human data was collected.

Informed Consent Statement

It’s waived according to the institutional Human Research Ethics Committee (HREC) from the University of Sydney.

Data Availability Statement

The data presented in this study are available on request from the corresponding author.

Acknowledgments

The authors would like to thank Ines Loureiro and Ruqi Li for their assistance in data collection. During the preparation of this manuscript/study, the authors used ChatGPT version 5.2 for the purposes of editing sentences. The authors have reviewed and edited the output and take full responsibility for the content of this publication.

Conflicts of Interest

The authors declare no conflicts of interest.

References

  1. Pineda, E.; Stockton, J.; Scholes, S.; Lassale, C.; Mindell, J.S. Food environment and obesity: A systematic review and meta-analysis. BMJ Nutr. Prev. Health 2024, 7, 204–211. [Google Scholar] [CrossRef]
  2. Odoms-Young, A.; Brown, A.G.M.; Agurs-Collins, T.; Glanz, K. Food Insecurity, Neighborhood Food Environment, and Health Disparities: State of the Science, Research Gaps and Opportunities. Am. J. Clin. Nutr. 2024, 119, 850–861. [Google Scholar] [CrossRef] [PubMed]
  3. García, S.; Pastor, R.; Monserrat-Mesquida, M.; Álvarez-Álvarez, L.; Rubín-García, M.; Martínez-González, M.Á.; Salas-Salvadó, J.; Corella, D.; Fitó, M.; Martínez, J.A.; et al. Ultra-processed foods consumption as a promoting factor of greenhouse gas emissions, water, energy, and land use: A longitudinal assessment. Sci. Total Environ. 2023, 891, 164417. [Google Scholar] [CrossRef] [PubMed]
  4. Li, X.; Braakhuis, A.; Li, Z.; Roy, R. How Does the University Food Environment Impact Student Dietary Behaviors? A Systematic Review. Front. Nutr. 2022, 9, 840818. [Google Scholar] [CrossRef]
  5. Australian Bureau of Statistics. Education and Work, Australia. Available online: https://www.abs.gov.au/statistics/people/education/education-and-work-australia/latest-release#cite-window2 (accessed on 12 May 2026).
  6. Grech, A.; Hebden, L.; Roy, R.; Allman-Farinelli, M. Are products sold in university vending machines nutritionally poor? A food environment audit. Nutr. Diet. 2017, 74, 185–190. [Google Scholar] [CrossRef] [PubMed]
  7. Roy, R.; Soo, D.; Conroy, D.; Wall, C.R.; Swinburn, B. Exploring University Food Environment and On-Campus Food Purchasing Behaviors, Preferences, and Opinions. J. Nutr. Educ. Behav. 2019, 51, 865–875. [Google Scholar] [CrossRef]
  8. Shi, Y.; Wang, Q.; Norman, C.; Allman-Farinelli, M.; Colagiuri, S. It Is Time to Make Policy for Healthier Food Environments in Australian Universities. Nutrients 2018, 10, 1909. [Google Scholar] [CrossRef]
  9. Roy, R.; Hebden, L.; Kelly, B.; De Gois, T.; Ferrone, E.M.; Samrout, M.; Vermont, S.; Allman-Farinelli, M. Description, measurement and evaluation of tertiary-education food environments. Br. J. Nutr. 2016, 115, 1598–1606. [Google Scholar] [CrossRef]
  10. Shi, Y.; Allman-Farinelli, M. Food insecurity in international and domestic students at an Australian university 2 years into the global COVID-19 pandemic. Nutrition 2023, 116, 112196. [Google Scholar] [CrossRef]
  11. Australian Government Department of Education. International Student Numbers by Country, by State and Territory. Available online: https://www.education.gov.au/international-education-data-and-research/international-student-numbers-country-state-and-territory (accessed on 12 May 2026).
  12. Kent, K.; Visentin, D.; Peterson, C.; Elliott, C.; Primo, C.; Murray, S. Food Insecurity Among Australian University Students Is Higher and More Severe Across an Extended Period of High Inflation: A Repeated Cross-Sectional Study 2022–2024. Health Promot. J. Austr. 2025, 36, e70037. [Google Scholar] [CrossRef]
  13. Dharmayani, P.N.A.; Williams, M.; Lopes, C.V.A.; Ronto, R.; Chau, J.Y.; Partridge, S.R.; Mihrshahi, S. Exploring reasons for high levels of food insecurity and low fruit and vegetable consumption among university students post-COVID-19. Appetite 2024, 200, 107534. [Google Scholar] [CrossRef]
  14. Tam, R.; Yassa, B.; Parker, H.; O’Connor, H.; Allman-Farinelli, M. University students’ on-campus food purchasing behaviors, preferences, and opinions on food availability. Nutrition 2017, 37, 7–13. [Google Scholar] [CrossRef]
  15. Kent, K.; Visentin, D.; Peterson, C.; Ayre, I.; Elliott, C.; Primo, C.; Murray, S. Severity of Food Insecurity among Australian University Students, Professional and Academic Staff. Nutrients 2022, 14, 3956. [Google Scholar] [CrossRef]
  16. Grech, A.; Howse, E.; Boylan, S. A scoping review of policies promoting and supporting sustainable food systems in the university setting. Nutr. J. 2020, 19, 97. [Google Scholar] [CrossRef]
  17. Kent, K.; Visentin, D.; Peterson, C.; Primo, C.; Elliott, C.; Otlowski, M.; Murray, S. The Perceived Importance and Intended Purchasing Patterns of Sustainable Foods in Australian University Students. Sustainability 2021, 13, 11928. [Google Scholar] [CrossRef]
  18. Mann, D.; Kwon, J.; Naughton, S.; Boylan, S.; Chan, J.; Charlton, K.; Dancey, J.; Dent, C.; Grech, A.; Hobbs, V.; et al. Development of the University Food Environment Assessment (Uni-Food) Tool and Process to Benchmark the Healthiness, Equity, and Environmental Sustainability of University Food Environments. Int. J. Environ. Res. Public Health 2021, 18, 11895. [Google Scholar] [CrossRef] [PubMed]
  19. Franchini, C.; Biasini, B.; Rosi, A.; Scazzina, F. Best practices for making the university campus a supportive environment for healthy and sustainable diets. Curr. Opin. Environ. Sci. Health 2023, 32, 100436. [Google Scholar] [CrossRef]
  20. Swinburn, B.; Sacks, G.; Vandevijvere, S.; Kumanyika, S.; Lobstein, T.; Neal, B.; Barquera, S.; Friel, S.; Hawkes, C.; Kelly, B.; et al. INFORMAS (International Network for Food and Obesity/non-communicable diseases Research, Monitoring and Action Support): Overview and key principles. Obes. Rev. 2013, 14, 1–12. [Google Scholar] [CrossRef]
  21. Dahl, A.A.; Fandetti, S.M.; Ademu, L.O.; Harris, R.; Racine, E.F. Assessing the Healthfulness of University Food Environments: A Systematic Review of Methods and Tools. Nutrients 2024, 16, 1426. [Google Scholar] [CrossRef]
  22. SDSN Australia/Pacific. Getting Started with the SDGs in Universities: A Guide for Universities, Higher Education Institutions, and the Academic Sector; SDSN Australia/Pacific: Melbourne, Australia, 2017. [Google Scholar]
  23. The University of Sydney. Annual Report 2023; The University of Sydney: Camperdown, Australia, 2024. [Google Scholar]
  24. National Health and Medical Research Council. Australian Dietary Guidelines. Available online: https://www.eatforhealth.gov.au/sites/default/files/2022-09/n55_australian_dietary_guidelines.pdf (accessed on 12 May 2026).
  25. Cohen, J. A Coefficient of Agreement for Nominal Scales. Educ. Psychol. Meas. 1960, 20, 37–46. [Google Scholar] [CrossRef]
  26. Harris, J.E.; Boushey, C.; Bruemmer, B.; Archer, S.L. Publishing nutrition research: A review of nonparametric methods, part 3. J. Am. Diet. Assoc. 2008, 108, 1488–1496. [Google Scholar] [CrossRef]
  27. The University of Sydney. Sustainability Strategy 2020; The University of Sydney: Camperdown, Australia, 2020. [Google Scholar]
  28. The University of Sydney. Healthy Sydney University; The University of Sydney: Camperdown, Australia, 2017. [Google Scholar]
  29. Sacks, G.; Chan, J.; Mann, D.; Dickie, S.; Gaucher-Holm, A.; Naughton, S.; Ruffini, O.; Robinson, E. Benchmarking the healthiness, equity and environmental sustainability of university food environments in Australia, 2021/22. BMC Nutr. 2025, 11, 38. [Google Scholar] [CrossRef]
  30. Leal Filho, W.; Viera Trevisan, L.; Wahaj, Z.; Déda Araújo Nunes, D.; Ruy Portela de Vasconcelos, C.; Aparecida Dibbern, T.; Ruiz Vargas, V.; Iyer-Raniga, U.; Anholon, R.; Novikau, A.; et al. University rankings and sustainable development: The state of the art. Int. J. Sustain. High. Educ. 2024. ahead of print. [Google Scholar] [CrossRef]
  31. Keat, J.; Dharmayani, P.N.A.; Mihrshahi, S. Benchmarking the university campus food environment and exploring student perspectives about food insecurity and healthy eating: A case study from Australia. BMC Public Health 2024, 24, 1245. [Google Scholar] [CrossRef]
  32. Dhillon, J.; Diaz Rios, L.K.; Aldaz, K.J.; De La Cruz, N.; Vu, E.; Asad Asghar, S.; Kuse, Q.; Ortiz, R.M. We Don’t Have a Lot of Healthy Options: Food Environment Perceptions of First-Year, Minority College Students Attending a Food Desert Campus. Nutrients 2019, 11, 816. [Google Scholar] [CrossRef] [PubMed]
  33. Pulz, I.S.; Martins, P.A.; Feldman, C.; Veiros, M.B. Are campus food environments healthy? A novel perspective for qualitatively evaluating the nutritional quality of food sold at foodservice facilities at a Brazilian university. Perspect. Public Health 2017, 137, 122–135. [Google Scholar] [CrossRef] [PubMed]
  34. Howse, E.; Hankey, C.; Bauman, A.; Freeman, B. Are young adults’ discussions of public health nutrition policies associated with common food industry discourses? A qualitative pilot study. Aust. N. Z. J. Public Health 2021, 45, 171–180. [Google Scholar] [CrossRef]
  35. Chan, J.; McMahon, E.; Brimblecombe, J. Point-of-sale nutrition information interventions in food retail stores to promote healthier food purchase and intake: A systematic review. Obes. Rev. 2021, 22, e13311. [Google Scholar] [CrossRef]
  36. Calabro, R.; Kemps, E.; Prichard, I.; Tiggemann, M. Healthy vending machines on campus: The effect of traffic light labelling on food and beverage choices. Public Health Nutr. 2025, 28, e68. [Google Scholar] [CrossRef] [PubMed]
  37. Rickrode-Fernandez, Z.; Kao, J.; Lesser, M.N.R.; Guess, K. Implementation of a Healthy Food and Beverage Policy at a Public University. J. Nutr. Educ. Behav. 2021, 53, 891–899. [Google Scholar] [CrossRef]
  38. Monash University. Healthy Food Procedure. Available online: https://publicpolicydms.monash.edu/Monash/documents/1935615 (accessed on 20 May 2026).
  39. Seward, M.W.; Block, J.P.; Chatterjee, A. Student experiences with traffic-light labels at college cafeterias: A mixed methods study. Obes. Sci. Pract. 2018, 4, 159–177. [Google Scholar] [CrossRef]
  40. Maffiola, C.; Olds, D. College students’ food choices in a university dining hall using a traffic light labeling system. J. Foodserv. Manag. Educ. 2022, 16, 17–29. [Google Scholar]
  41. Fogolari, N.; Souza, A.D.; Bernardo, G.L.; Uggioni, P.L.; Oliveira, R.C.; Rodrigues, V.M.; Proença, R.P.C.; Fernandes, A.C. Qualitative menu labelling in university restaurants and its influence on food choices: A systematic review and synthesis without meta-analysis. Nutr. Bull. 2023, 48, 160–178. [Google Scholar] [CrossRef]
  42. Hutchesson, M.J.; Whatnall, M.C.; Patterson, A.J. On-campus food purchasing behaviours and satisfaction of Australian university students. Health Promot. J. Austr. 2022, 33, 649–656. [Google Scholar] [CrossRef] [PubMed]
  43. Afshin, A.; Peñalvo, J.L.; Del Gobbo, L.; Silva, J.; Michaelson, M.; O’Flaherty, M.; Capewell, S.; Spiegelman, D.; Danaei, G.; Mozaffarian, D. The prospective impact of food pricing on improving dietary consumption: A systematic review and meta-analysis. PLoS ONE 2017, 12, e0172277. [Google Scholar] [CrossRef] [PubMed]
  44. Taylor, P.; Saheb, R.; Howse, E. Creating healthier graduates, campuses and communities: Why Australia needs to invest in health promoting universities. Health Promot. J. Austr. 2019, 30, 285–289. [Google Scholar] [CrossRef]
Figure 1. Unweighted scores for each component of the Uni-Food tool. Unweighted component scores were derived from weighted sub-domain and domain scores.
Sustainability 18 05351 g001
Figure 2. Weighted scores for each component of the Uni-Food tool.
Sustainability 18 05351 g002
Figure 3. PRISMA flow diagram of policy document screening process.
Sustainability 18 05351 g003
Figure 4. Unweighted domain scores for the ‘University Systems and Governance’ audit. Note: Unweighted domain scores were calculated using weighted sub-domain scores.
Sustainability 18 05351 g004
Figure 5. Unweighted domain scores for the ‘Campus Facilities and Environment’ audit.
Sustainability 18 05351 g005
Figure 6. Unweighted domain scores for the ‘Food Retail Outlets’ audit.
Sustainability 18 05351 g006
Figure 7. Box and whisker plot of median food retail environment scores and interquartile ranges by outlet type. Number of outlets per outlet type in both Campus Zone A and Campus Zone B is denoted by number.
Sustainability 18 05351 g007
Table 1. Summary of results of the healthiness, equity and environmental sustainability of The University of Sydney food environment using the Uni-Food Tool in 2022 and 2025.
20222025% Point Changep Value
Number of food retailers assessed 3247
Overall university score 148%52%+4%
Component (unweighted) 2Domain (unweighted) 3
University systems and governance 46%48%+2%0.82
Leadership and planning 398%85%−13%
Policies for food retail environments 331%36%+5%
Monitoring and reporting 327%40%+13%
Funding and resources 367%50%−17%
Stakeholder engagement 348%53%+5%
Campus facilities and environment 57%63%+6%0.59
Availability and accessibility 351%55%+4%
Equity 353%63%+10%
Advertising and sponsorship 368%45%−23%
Events and catering 333%57%+24%
Personal and community development 354%82%+28%
Environmental impact 390%76%−14%
Retail food outlets 40%36%−4%0.60
Availability and accessibility 338%37%−1%
Promotion 375%40%−35%
Price 355%50%−5%
Nutrition information 313%19%+6%
Environmental impact 317%29%+12%
1 Weighted scores shown include weighting at component, domain and sub-domain levels. 2 Scores shown include weighting at domain and sub-domain level only; weighting at component level not applied. 3 Scores shown include weighting at sub-domain level only; weighting at component or domain level not applied. Paired-samples t-test used. Bonferroni-adjusted significance threshold of p < 0.017.
Table 2. Types and proportions of outlets audited on each campus zone for the ‘Food Retail Outlets’ audit.
Campus Zone ACampus Zone BZone A and B Combined
Type of Outletsn%n%n%
Takeaway (franchise) 1517%212%715
Coffee cart 2413%16%511
Cafe/restaurant 3413%424%817
Takeaway (local independent) 4413%847%1226
Takeaway (local independent food truck) 5827%00%817
Takeaway (university student society stall) 6413%00%49
Bar/pub 713%16%24
Convenience store 800%16%12
Total outlets30 17 47
1 represents a takeaway outlet or food truck that is part of a franchised brand. 2 represents a takeaway outlet that predominantly sells coffees and other hot beverages, snacks and a small selection of main meals. 3 represents a dine-in outlet that offers a large selection of main meals and beverages. 4 represents an independently owned takeaway outlet. 5 represents an independently owned food truck. 6 represents a takeaway food stall run by university student societies. 7 is as implied by name. 8 represents an outlet that supplies dry and fresh produce but not ready-to-eat meals.
Table 3. Number of low-performing and high-performing outlets by outlet type.
Outlet Type Low Performing aHigh Performing b
Coffee cart (n = 5)10
Cafe/restaurant (n = 8)02
Takeaway (franchise) (n = 7)21
Takeaway (local independent food truck) (n = 8)12
Takeaway (local independent) (n = 12)50
Bar/pub (n = 2)01
Convenience store (n = 1)01
Takeaway (university student society stall) (n = 4)01
a Low-performing scores < 25%. b High-performing scores > 50%.
Table 4. Median domain scores (weighted) across outlet types. Interquartile ranges are shown in brackets.
Outlet TypeNutrition Information 1Environmental Impact 2Price 3Availability and Accessibility 4Promotion 5
Coffee cart (n = 5)3.0% (3.0–6.0)6.7% (4.0–8.7)10% (10–11)6.3% (6.3–6.9)3.0% (1.5–3.0)
Cafe/restaurant (n = 8)3.4% (2.8–4.3)8.3% (6.5–10)12% (10–13)11% (10–11)3.8% (3.0–6.4)
Takeaway (franchise) (n = 7)2.3% (1.9–3.8)2.7% (0.7–7.7)12% (12–15)12% (8.1–14)3.0% (0.0–9.0)
Takeaway (local independent food truck) (n = 8)0.8% (0.0–2.3)8.3% (6.8–8.7)15% (13–16)7.2% (5.9–8)3.4 (3.0–9.4)
Takeaway (local independent) (n = 12)2.3% (0.6–2.4)4.0% (2.5–6.7)11% (8.4–15)8.1% (5.3–9.5)2.3% (0.0–3.4)
Bar/pub (n = 2)6.0% (3.0–9.0)8.0% (7.0–9.0)15% (13–16)10% (10–11)2.3% (1.9–2.6)
Convenience store (n = 1)3.0% (3.0–3.0)9.3% (9.3–9.3)17% (17–17)11% (11–11)15% (15–15)
Takeaway (university student society stall) (n = 4)1.1% (0.6–2.4)4.3% (2.8–6.2)18% (16–19)9.7% (6.4–13)15% (15–15)
1 Maximum possible score 15%. 2 Maximum possible score 20%. 3 Maximum possible score 25%. 4 Maximum possible score 25%. 5 Maximum possible score 15%.
Disclaimer/Publisher’s Note: The statements, opinions and data contained in all publications are solely those of the individual author(s) and contributor(s) and not of MDPI and/or the editor(s). MDPI and/or the editor(s) disclaim responsibility for any injury to people or property resulting from any ideas, methods, instructions or products referred to in the content.