Article

Improvement Pathways for Irrigation Water Use Efficiency in Large and Medium-Sized Irrigation Districts Based on Analysis of Influencing Factors: A Machine Learning Case Study in Anhui, China


Anhui Provincial Key Laboratory of Water Science and Intelligent Water Conservancy, Water Resources Research Institute of Anhui Province and Huaihe River Commission of the Ministry of Water Resources, Hefei 230088, China
*
Authors to whom correspondence should be addressed.
These authors contributed equally to this work.
Sustainability 2026, 18(10), 5204; https://doi.org/10.3390/su18105204
Submission received: 24 April 2026 / Revised: 16 May 2026 / Accepted: 20 May 2026 / Published: 21 May 2026

Abstract

Irrigation water use efficiency (IWUE) is a core indicator for assessing agricultural water use efficiency. However, existing studies predominantly focus on linear relationships between IWUE and individual correlates, with insufficient attention to the nonlinear interactions among multiple factors and the staged pathways of IWUE improvement. Taking 153 large- and medium-sized irrigation districts in Anhui Province as a case study, this research identifies seven key influencing factors—including canal lining rate (CLR), proportion of water-saving irrigation area (WSIR), and water price (WP)—and employs a random forest model coupled with SHAP (SHapley Additive exPlanations) interpretability analysis to uncover the driving mechanisms and enhancement pathways of IWUE. The results reveal that CLR, WSIR, and WP are the top three correlates, collectively contributing 67.80% to IWUE variation, with CLR being the most influential (28.75%). Their effects exhibit strong nonlinearity and threshold behavior: the marginal benefit of CLR diminishes significantly beyond approximately 75%; the optimal incentive range for WP lies between 0.09 and 0.14 CNY/m3; and precipitation exerts a persistent negative constraint. Moreover, IWUE improvement follows a sequential hierarchy: CLR serves as the foundational prerequisite; once CLR reaches a certain threshold, advancing WSIR becomes essential; and further gains require synergistic interaction between WSIR and WP after both attain sufficient levels. This study elucidates the nonlinear response mechanisms and stage-dependent driving patterns of IWUE, offering scientific insights and quantitative support for targeted, precision-oriented upgrades of irrigation infrastructure in Anhui Province and analogous humid/semi-humid regions, thereby contributing to sustainable agricultural water management.

1. Introduction

Irrigation accounts for more than 70% of global freshwater withdrawals, making it one of the main water-consuming sectors [1]. Irrigation water use efficiency (IWUE) is a key indicator for measuring agricultural water use efficiency and is closely related to sustainable water resource utilization, food security, and sustainable agricultural development. In China, large-scale irrigation districts contribute more than 26% of the national grain production, but the average IWUE in China still lags behind that of developed countries [2,3]. Anhui Province, located in the Yangtze and Huaihe River basins, is an important grain-producing region, yet it faces prominent issues of uneven spatial and temporal distribution of water resources and a sharp contradiction between supply and demand [4]. According to the report of Anhui Provincial Department of Water Resources (http://nssd.mwr.gov.cn/gdcz/202601/t20260104_2097667.html, accessed on 1 February 2026), by the end of 2025, the province had built 11 large-scale irrigation districts and 450 medium-scale ones, with a designed irrigation area of approximately 2.59 million hectares. These districts play a vital role in ensuring regional grain production. In recent years, Anhui has invested considerable funds in the continuing construction and water-saving retrofitting of its irrigation districts [5]. However, the IWUE of some districts remains relatively low, and the effectiveness of the improvements is uneven [6]. Therefore, there is an urgent need to identify the key factors affecting IWUE, reveal their mechanisms, and clarify the pathway for moving from low IWUE to high IWUE, thereby providing a scientific basis for irrigation district management.
Regarding the factors influencing IWUE, existing studies have explored multiple dimensions, including engineering, economics, nature, and society. In terms of engineering measures, canal lining and water-saving irrigation technologies have been shown to effectively improve IWUE, but most studies assume linear relationships and pay little attention to the possibility of diminishing marginal returns [7,8,9]. As an economic regulation tool, the effect of water pricing reform is debated in empirical studies; this may stem from the nonlinear relationship between water price and water-saving behavior—too low a price fails to create effective incentives, while too high a price may increase the burden on farmers [10,11]. Natural conditions (e.g., precipitation) and socioeconomic factors (e.g., cropping structure, agricultural population ratio) have also been confirmed to affect IWUE, but existing studies often treat them as control variables and provide insufficient analysis of their mechanisms [12,13,14]. Methodologically, traditional linear models struggle to capture nonlinear relationships, whereas machine learning methods (e.g., random forest) are increasingly applied in agricultural water management due to their strong nonlinear fitting ability [15,16]. Several recent studies have successfully employed random forest or other ensemble algorithms to predict IWUE and identify its associated factors in various regions, such as the agro-pastoral ecotone in Northern China [17,18]. However, models such as random forest are often considered “black boxes” whose internal decision mechanisms are difficult to interpret directly, limiting the credibility and comprehensibility of research conclusions [19,20]. In recent years, the SHAP (SHapley Additive exPlanations) method has been proposed; based on the Shapley value from cooperative game theory, it decomposes model predictions into the sum of contributions from each feature, effectively quantifying the marginal effect of each feature on the prediction outcome, thereby enhancing model interpretability [21,22]. SHAP has been successfully applied in related agricultural water management contexts, including evapotranspiration estimation and crop water productivity analysis [23,24]. Nevertheless, the application of SHAP in IWUE research on irrigation districts remains rare. In summary, existing studies have obvious deficiencies in both the mechanisms of factor effects and the pathways for improvement, and they pay insufficient attention to the interpretability of machine learning models.
To address these gaps, this study takes 153 large and medium-sized irrigation districts in Anhui Province as the sample. It comprehensively considers the influence of seven candidate factors—canal lining rate, water price, proportion of water-saving irrigation area, mean annual precipitation, effective irrigation area ratio, grain crop planting ratio, and agricultural population ratio—uses random forest and SHAP to identify the main influencing factors and explain their nonlinear mechanisms and critical thresholds, and then compares the shifting dominance of driving factors at different IWUE levels, thereby revealing the sequential, stage-specific stepwise pathway for moving from low IWUE to high IWUE through engineering, technological, and economic interventions.

2. Materials and Methods

2.1. Study Area

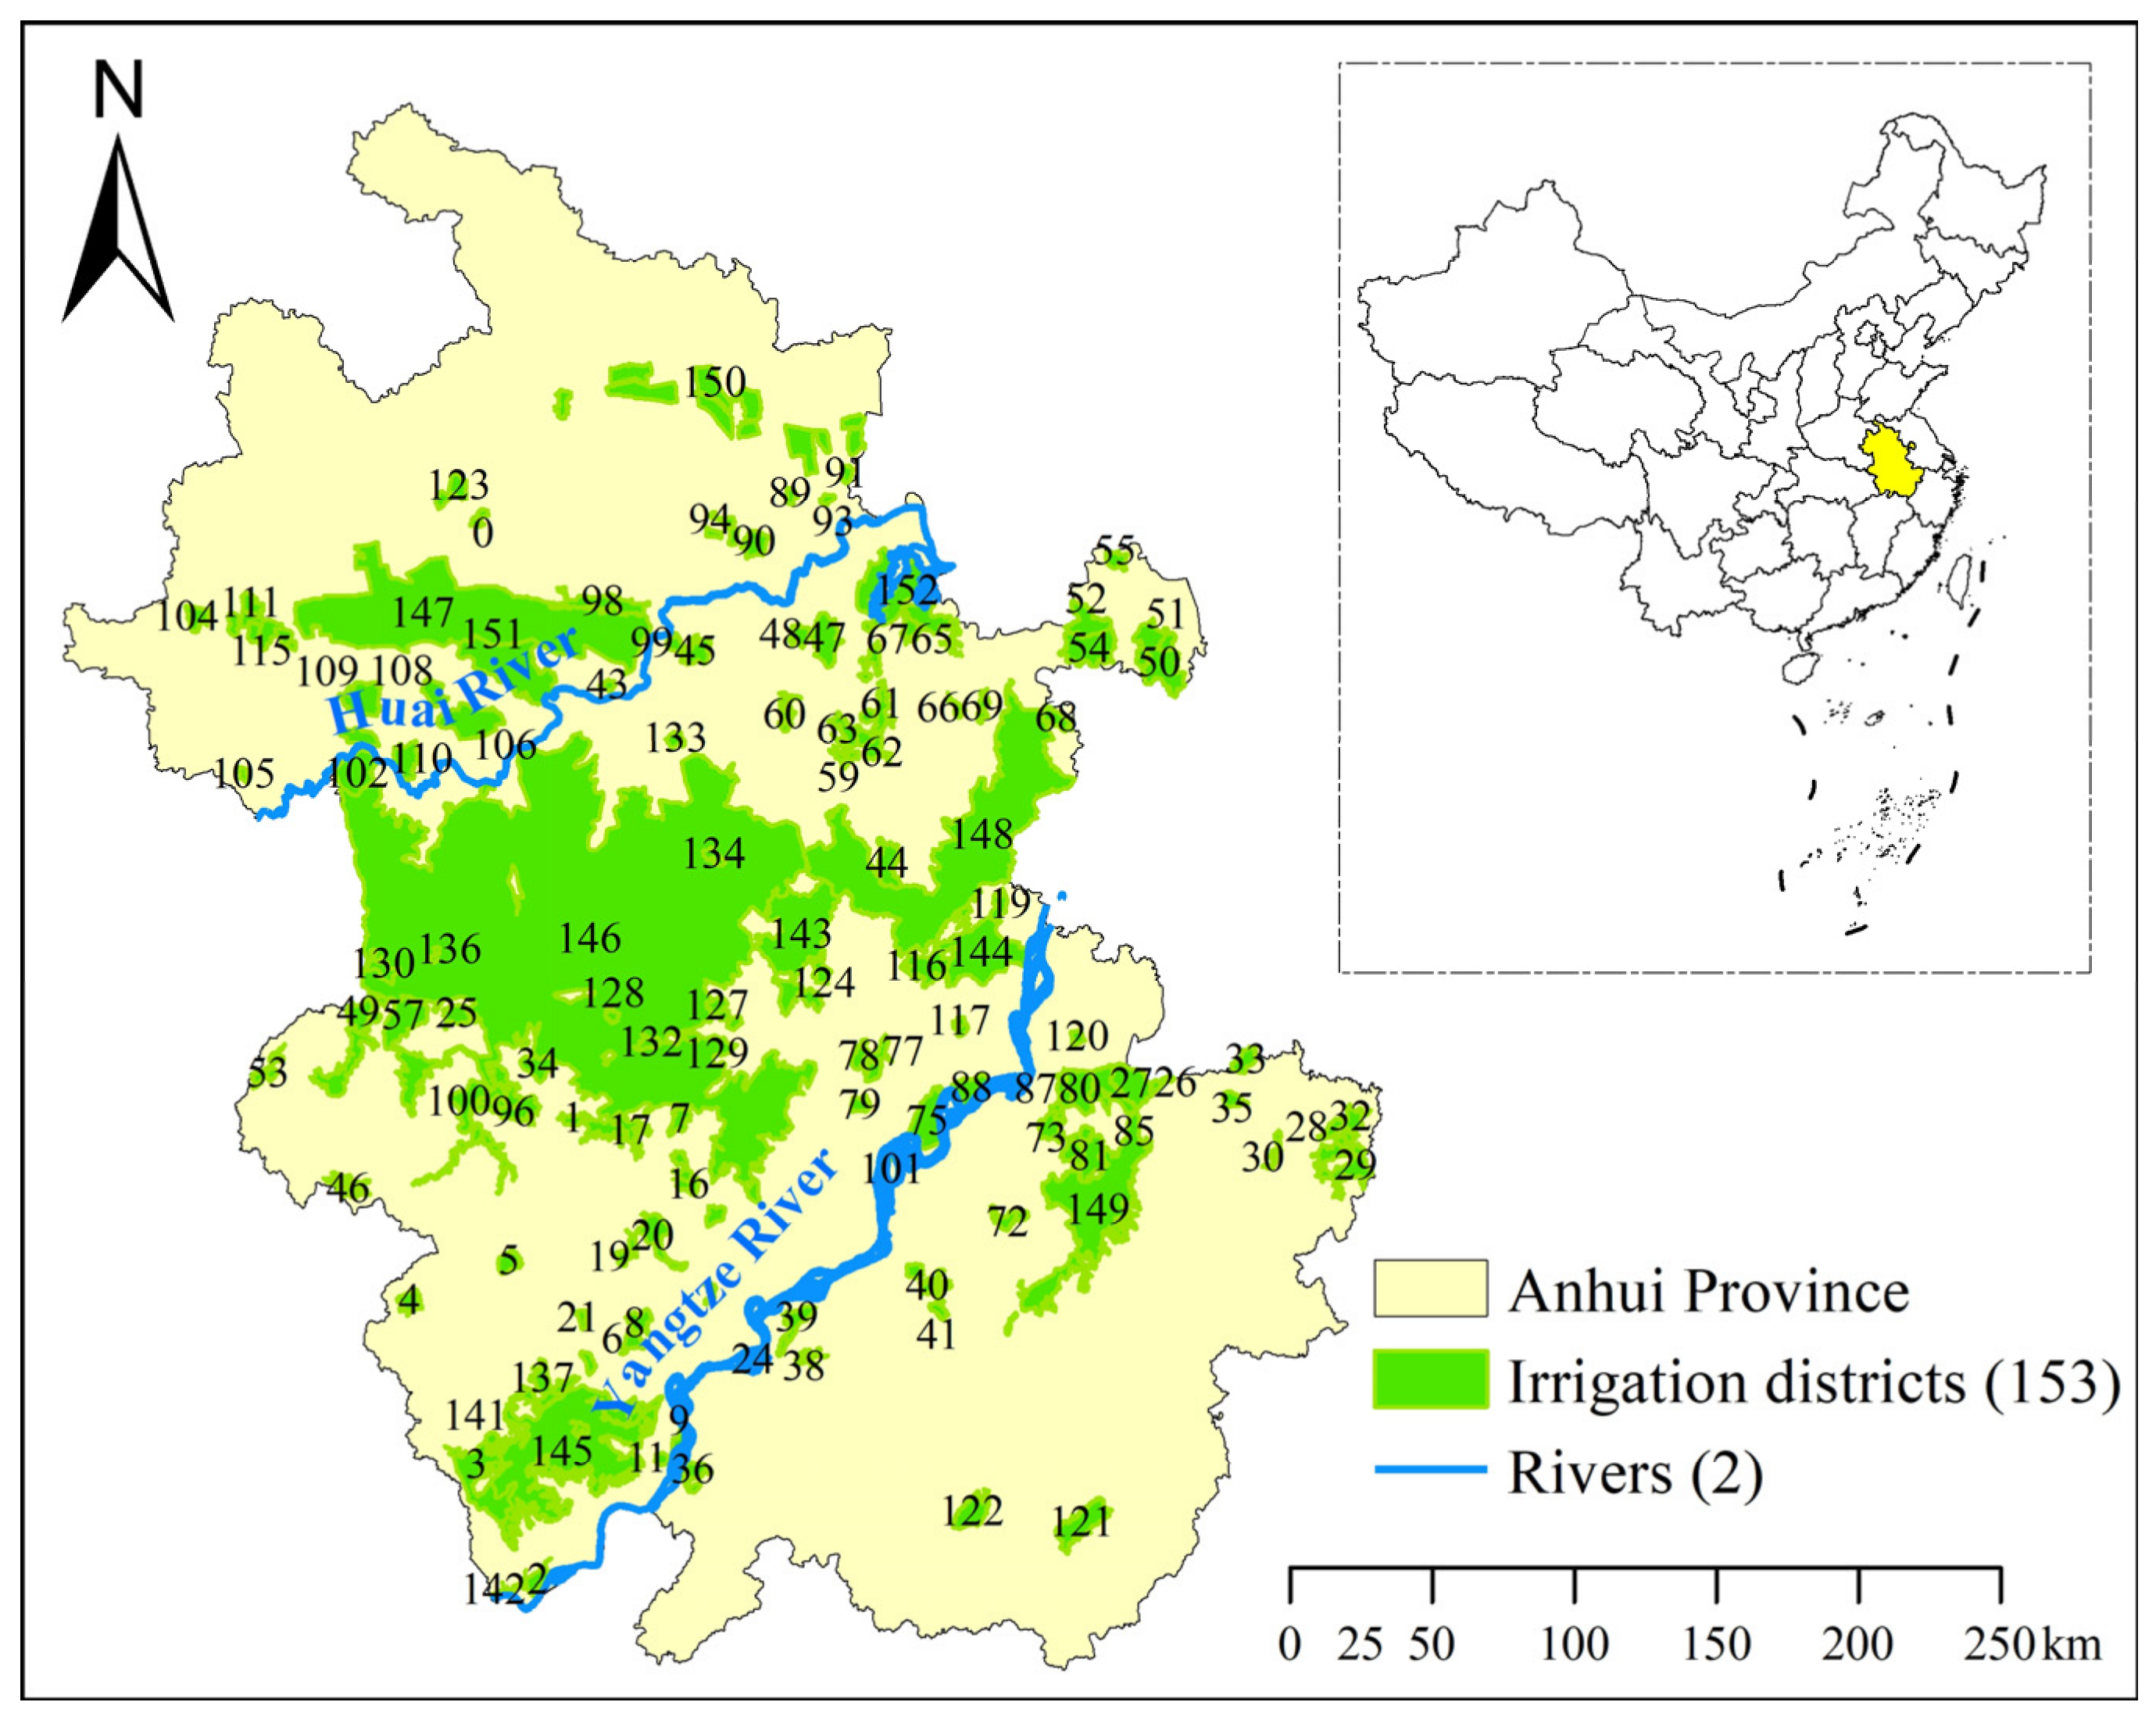
Anhui Province is located in central-eastern China (114°54′–119°37′ E, 29°41′–34°38′ N), spanning the Yangtze River and Huaihe River basins. The climate exhibits transitional characteristics between the northern subtropical and warm temperate zones, with mean annual precipitation ranging from 800 to 1800 mm but showing considerable interannual variability [25]. The province has numerous large and medium-sized irrigation districts, which play a vital role in regional grain production. This study selected 153 of these districts with complete and reliable datasets as the research subjects. These districts cover three major topographic types: the Huaibei Plain along the Huaihe River, the Jianghuai Hilly Area, and the polder regions along the Yangtze River. They represent a wide range of climatic, engineering, economic, and cropping conditions, making them highly representative of the major irrigation systems in central-eastern China. The geographical locations and spatial distribution of the 153 selected irrigation districts are shown in Figure 1.

2.2. Variable Definitions and Data Sources

IWUE data were directly sourced from the annual performance assessment reports of the Anhui Provincial Department of Water Resources, where IWUE is officially defined and calculated as the product of canal-system efficiency and field application efficiency. The other variables were compiled from multiple sources to ensure comprehensive coverage across engineering, economic, natural, and social dimensions. Engineering variables—namely the canal lining rate (CLR) and the proportion of water-saving irrigation area (WSIR)—were derived from the implementation plans for the “14th Five-Year Plan” renovation and modernization of large-scale irrigation districts, the overall plans for the renovation and water-saving retrofitting of medium-scale irrigation districts, and project proposal reports. Critically, the reported values are actual completed statistical values. For each irrigation district, we extracted a single value corresponding to the year its renovation was completed between 2021 and 2023. All raw data were obtained from the annual completion reports and operational statistics submitted by the local water resources departments to the Anhui Provincial Department of Water Resources. Economic data, represented by the water price (WP), were obtained from the agricultural water pricing approval documents of the Anhui Provincial Price Bureau and the agricultural water pricing reform plans of various counties and cities.
Natural data, specifically the mean annual precipitation (PRE), were provided by the Anhui Provincial Meteorological Bureau as multi-year (1981–2023) averages based on observed meteorological station data for the counties where each irrigation district is located. A long-term (43-year) average was used for PRE because precipitation has high interannual variability; using a single-year precipitation value (e.g., limited to the renovation completion year of each district) could be unrepresentative of the stable climatic background that shapes long-term irrigation practices and IWUE. Thus, the time ranges of the independent variables are not fully consistent: CLR and WSIR reflect conditions at renovation completion (years varying across districts between 2021 and 2023), while PRE reflects a multi-decadal climate baseline. Considering that engineering variables are nearly static over the short period in question, and the long-term precipitation average is a standard covariate in cross-sectional irrigation efficiency studies, we argue that the potential bias is limited.
Social and cropping data—including the effective irrigation area ratio (EIR), grain crop planting ratio (GCR), and agricultural population ratio (APR) —were sourced from the Anhui Statistical Yearbook (https://tjj.ah.gov.cn/ssah/qwfbjd/tjnj/index.html, accessed on 1 February 2026), the national economic and social development statistical bulletins of counties and cities, and the renovation implementation plans for large- and medium-scale irrigation districts. Although EIR is defined as the ratio of actual irrigated area to designed irrigated area, it is often interpreted as reflecting facility integrity or land utilization. Its influence on IWUE operates through two indirect pathways. Low EIR leads to diseconomies of scale because fixed maintenance costs are spread over a smaller area, which discourages timely repairs and worsens water leakage. It may also signal poor coordination between water supply and demand or inadequate management. Thus, EIR serves as a proxy for operational intensity and system level management. All variables were aggregated at the irrigation district level, and the dataset contained no missing values. The definitions and descriptive statistics of all variables are summarized in Table 1.

2.3. Methods

2.3.1. Overall Analytical Framework and Data Preprocessing

The analytical workflow of this study is structured into three sequential stages: (1) construction of a Random Forest regression model to identify the primary factors governing IWUE; (2) application of SHAP analysis to decompose model predictions and quantify the direction, magnitude, and nonlinear threshold characteristics of each factor’s marginal contribution; and (3) stratification of irrigation districts by IWUE quartiles combined with ordinal logistic regression to delineate the stage-specific driving mechanisms underlying transitions from low to high efficiency. All statistical computations and visualizations were implemented in the R environment (version 4.5.3) [26], with specific package versions noted in the corresponding subsections.
Prior to modeling, all seven independent variables were subjected to z-score standardization (mean = 0, standard deviation = 1) to eliminate dimensional discrepancies among predictors and to ensure that the Random Forest algorithm evaluates each feature on a comparable scale during node splitting and importance ranking. The dependent variable, IWUE, was retained in its original dimensionless form. Given the limited sample size (n = 153) and the documented robustness of ensemble tree methods to extreme observations [27], outliers were not artificially truncated or winsorized; retaining the full range of natural and engineering variability—including sparse high-precipitation events or exceptionally high canal lining rates—was deemed essential to avoid biasing the marginal response surfaces estimated by SHAP. A preliminary examination of variable distributions confirmed that all recorded values resided within physically plausible bounds with no indication of data entry errors.

2.3.2. Random Forest Regression

Random Forest (RF) is an ensemble learning algorithm that constructs a multitude of decision trees and aggregates their predictions to improve accuracy and control overfitting [20]. Each tree is grown on a bootstrap sample of the training data, and at each split a random subset of predictors is considered as candidates. For regression tasks, the final output is the arithmetic mean of the predictions from all constituent trees. This procedure endows RF with several desirable properties for the present investigation: it automatically accommodates nonlinear relationships and high-order interactions among variables without requiring explicit specification; it is largely insensitive to multicollinearity; and it provides a robust measure of variable importance based on the reduction in node impurity attributable to each predictor.
The RF regression model was fitted using the randomForest package (version 4.7-1.2). To ensure reproducibility, a fixed random seed (set.seed (2026)) was employed throughout model training and evaluation. Stratified sampling based on the quartiles of IWUE was applied to partition the dataset into a training set (70%, n = 107) and an independent validation set (30%, n = 46), thereby preserving the representation of both low- and high-efficiency irrigation districts in both subsets. Hyperparameter optimization was conducted exclusively on the training set via a grid search coupled with five-fold cross-validation. The search grid encompassed the number of trees (ntree = {100, 200, 300, 500}), the minimum size of terminal nodes (nodesize = {2, 5, 10}), and the maximum number of terminal nodes (maxnodes = {3, 6, 10, NULL}); no explicit constraint was imposed on tree depth. The combination yielding the lowest cross-validated root mean square error (ntree = 300, nodesize = 5, maxnodes = NULL) was selected as the optimal configuration. The final model was refitted on the entire training set using these hyperparameters and subsequently evaluated once on the held-out validation set.
Model performance was evaluated using three metrics: the coefficient of determination (R2), root mean square error (RMSE), and mean absolute error (MAE). These metrics are defined as follows:
R 2 = 1 i = 1 n ( y i p i ) 2 i = 1 n ( y i m ) 2
R M S E = 1 n i = 1 n ( y i p i ) 2
M A E = 1 n i = 1 n y i p i
where yi is the observed value, pi is the predicted value, m is the mean of observed values, and n is the number of samples. No separate validation data were used during hyperparameter tuning; instead, cross-validation was performed on the training set.

2.3.3. SHAP Explainability Analysis

Although RF offers native variable importance metrics, it does not directly reveal the directionality or functional form of individual predictor effects. To address this interpretive limitation, we employed SHAP, a post hoc model-agnostic method grounded in cooperative game theory [19]. SHAP decomposes the model’s prediction for a given instance into the sum of contributions from each feature, where each contribution represents the marginal effect of that feature relative to the average prediction. Specifically, the SHAP value for a feature is computed as the weighted average of the change in model output when the feature is included versus excluded across all possible subsets of the remaining features, thereby satisfying the axioms of local accuracy, missingness, and consistency. The mean absolute SHAP value across all samples provides a global measure of feature importance, while SHAP dependence plots illustrate how the contribution of a single feature varies with its own value, capturing nonlinearities and potential threshold effects.
SHAP values were computed using the fastshap package (version 0.1.1) with the entire training set serving as the background distribution to approximate the conditional expectation of the model output. Visualizations were generated with the shapviz package (version 0.10.3). An important post-processing step was applied to enhance interpretability: because the RF model was trained on standardized predictors, the SHAP analysis initially produced feature coordinates and SHAP values in z-score space. For domain-relevant interpretation, the feature axes in all SHAP plots were inverse-transformed back to their original physical units (e.g., percentage for canal lining rate, millimeters for precipitation, CNY/m3 for water price). This transformation does not alter the SHAP values themselves—which remain in the unit of the model output (IWUE)—but enables the identification of policy-relevant thresholds on naturally intuitive scales. The principal visualization outputs included a feature importance bar plot (mean absolute SHAP value), a SHAP beeswarm summary plot depicting the distribution and direction of feature effects, and SHAP dependence plots that reveal the shape of marginal relationships and inflection points. Thresholds identified from SHAP dependence plots (e.g., zero crossing and plateau onset) were determined by fitting a LOESS smoother and applying sign-change and slope-based criteria (slope < 0.005).

2.3.4. Classification of Irrigation Districts and Analysis of Staged Improvement Pathways

To elucidate the sequential pattern of IWUE improvement across the sample, the 153 irrigation districts were stratified into four ordered efficiency groups based on the quartiles of observed IWUE values: low efficiency (<Q1), medium-low efficiency (Q1–Q2), medium-high efficiency (Q2–Q3), and high efficiency (>Q3). For each group, the arithmetic mean of each of the seven influencing factors was computed in its original physical unit to characterize the typical engineering, economic, and natural conditions associated with each efficiency stratum. Because the factors are measured on disparate scales (e.g., percentages, monetary units, and precipitation amounts), the group means were subsequently normalized to a common 0–1 range using min–max normalization, defined for a given factor as:
x = x x min x max x min
where x denotes the original group mean and xmin and xmax are, respectively, the minimum and maximum observed values of that factor across all 153 irrigation districts. The resulting normalized means express the relative standing of each factor within its own empirical range of variation. These normalized values were plotted as a function of IWUE level to generate line charts that trace the trajectory of each factor across the efficiency gradient. Furthermore, the incremental changes in normalized means between consecutive efficiency levels (Q1 → Q2, Q2 → Q3, Q3 → Q4) were calculated and displayed as bar plots. This descriptive analytic framework, which does not rely on inferential modeling assumptions, provides a straightforward means of identifying the factors that exhibit the largest relative gains at each stage of the IWUE improvement pathway, thereby informing stage-targeted management priorities.

3. Results

3.1. Model Performance and Feature Importance

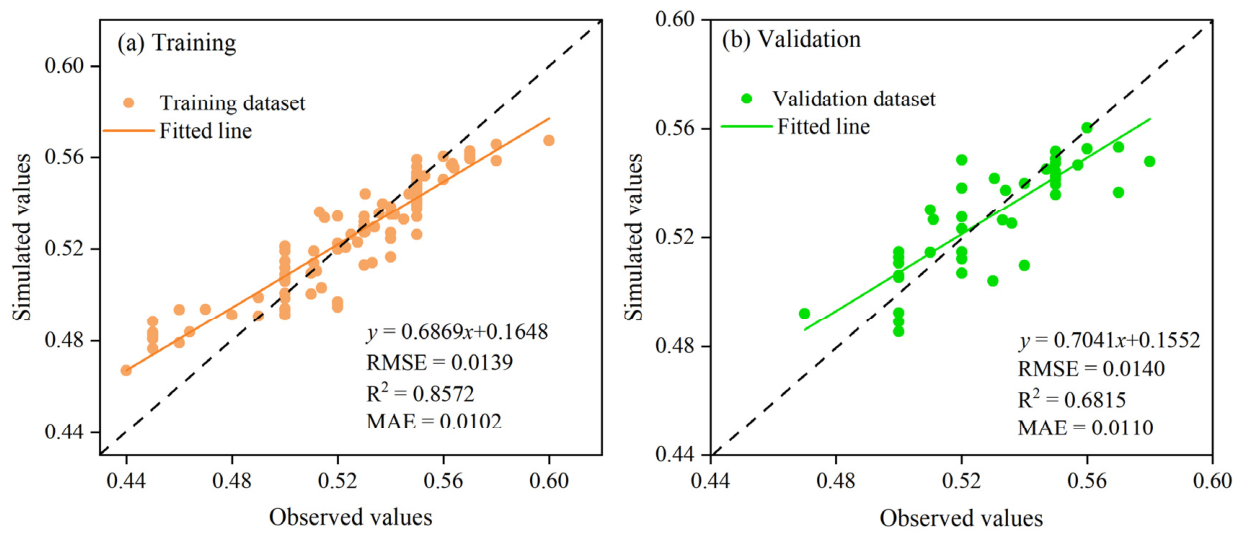
The performance metrics of the RF model on the training and validation sets are shown in Figure 2. The R2 was 0.8572 for the training set and 0.6815 for the validation set; the RMSE was 0.0139 for the training set and 0.0140 for the validation set; the MAE was 0.0102 for the training set and 0.0110 for the validation set. The validation R2 of 0.6815 indicates that the model can explain approximately 68% of the variation in irrigation water use efficiency, demonstrating good predictive capability. The observed discrepancy between training and validation accuracy suggests mild overfitting, which may be attributable to the limited sample size (n = 153) and model complexity; nevertheless, the overall performance remains within an acceptable range.
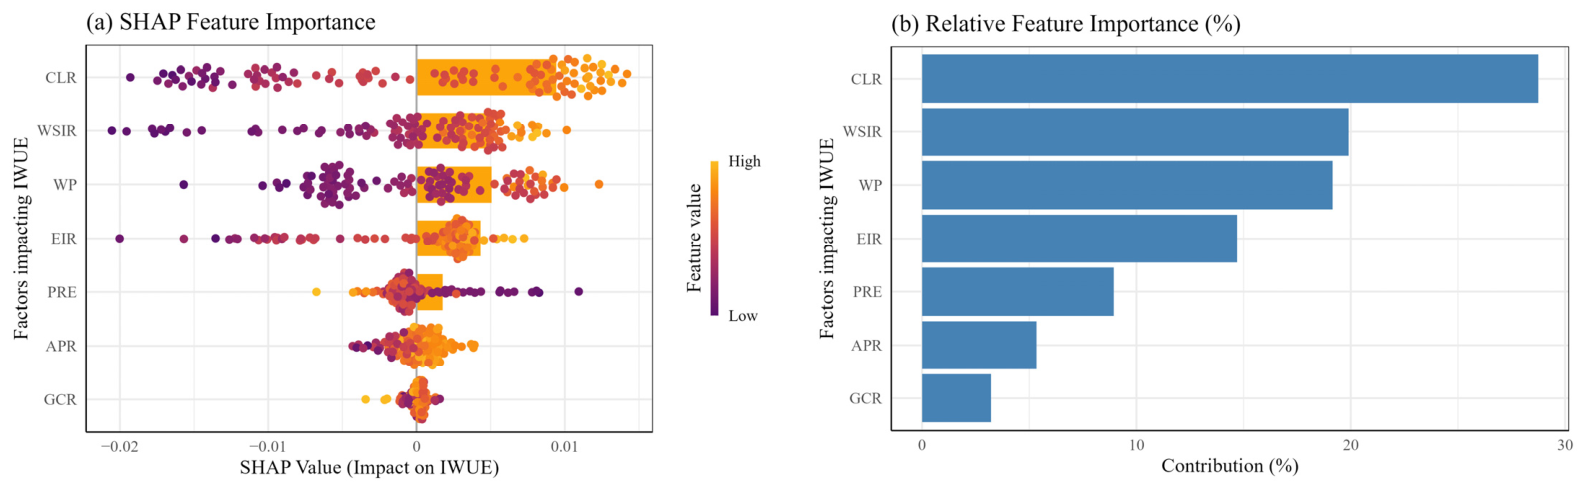
As shown in Figure 3a, the SHAP analysis reveals that CLR and WSIR are the two most influential factors driving irrigation water use efficiency. CLR exhibits a clear positive trend, with low feature values corresponding to negative SHAP values and high values aligning with strongly positive SHAP values, indicating it consistently enhances IWUE as its level increases. WSIR follows a similar pattern, with higher values shifting toward positive SHAP values though with slightly greater distribution spread. In contrast, factors like WP and PRE show non-monotonic effects; WP’s low values correlate with negative impacts on IWUE, while PRE’s high values tend to reduce IWUE. GCR and APR show weak, near-zero SHAP values with no consistent directional trend, reflecting limited influence on IWUE.
The relative feature importance analysis in Figure 3b quantifies the contributions of each factor to regional IWUE variation, as shown in the bar plot. CLR emerges as the dominant driver, contributing 28.75% of the total variation, followed by WSIR (19.90%), WP (19.15%), and EIR (14.70%). Together, these four factors account for 82.50% of the explained variance, establishing them as the core determinants of IWUE. PRE contributes 8.95% to the total variation, while APR and GCR contribute only 5.34% and 3.21%, respectively, consistent with their weak marginal effects observed in the SHAP analysis. Collectively, these results highlight that infrastructure conditions (CLR) and water-saving technology adoption (WSIR) are the primary correlates of regional IWUE, with economic and management factors (e.g., WP) playing secondary regulatory roles, and climatic factors (PRE, APR, GCR) exerting relatively minor influences.

3.2. Effects of Various Factors on Irrigation Water Use Efficiency

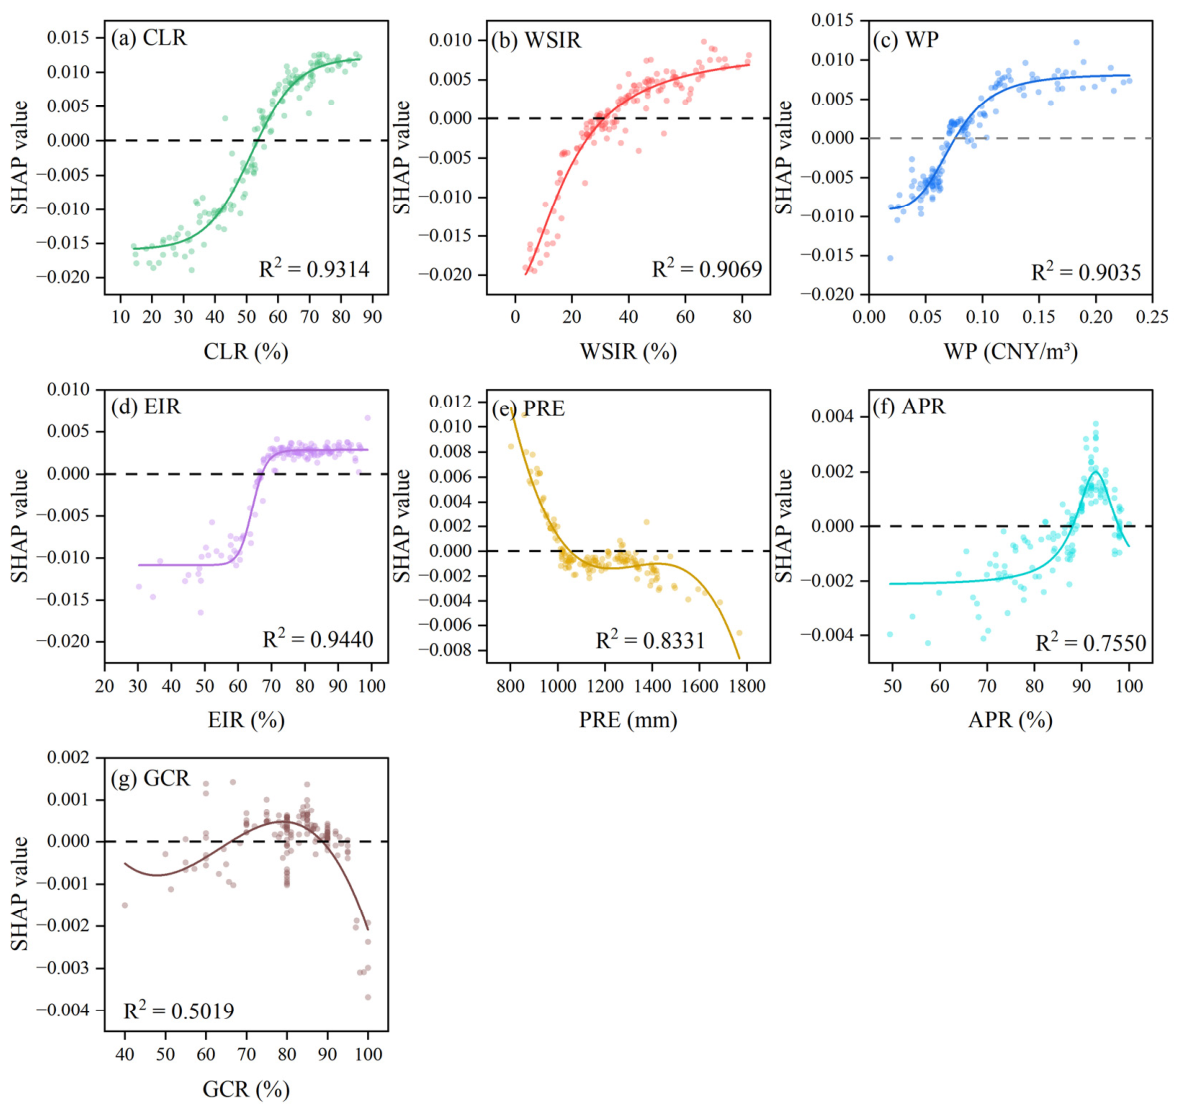
Figure 4 presents SHAP dependence plots for the seven key factors influencing IWUE, revealing how each factor’s marginal contribution changes with its actual value. For CLR (Figure 4a), the SHAP value is negative below approximately 53.8%, rises rapidly from negative to positive within the 53.8–70% range, and plateaus beyond 75%, demonstrating pronounced diminishing marginal returns. For the WSIR (Figure 4b), the SHAP value is negative at low levels, turns positive at 31.7%, and continues to rise afterward but with a gradually slowing growth rate, indicating an overall positive yet marginally diminishing effect on IWUE. For the WP (Figure 4c), the SHAP value follows a typical S-shaped curve: below 0.07 CNY/m3, it is near zero or slightly negative; between 0.07 and 0.15 CNY/m3, it rises sharply (with an optimal incentive range of 0.09–0.14 CNY/m3); beyond 0.15 CNY/m3, it flattens, implying that further price increases no longer provide significant marginal incentives. For the EIR (Figure 4d), the SHAP value remains significantly negative below 60%, rises sharply and transitions from negative to positive in the 60–70% interval, and stabilizes at a positive value after exceeding 70%, exhibiting a stepwise positive influence on IWUE.
For the PRE (Figure 4e), the SHAP value shows a strong negative correlation with IWUE: below 1050 mm, it is positive; between 1050 and 1500 mm, it rapidly turns negative and declines steadily; beyond 1500 mm, this negative effect intensifies, corroborating a “resource curse” whereby abundant precipitation reduces water-saving awareness and investment in irrigation infrastructure, thereby lowering IWUE. For the APR (Figure 4f), the SHAP value is significantly negative for values below 88%, rises sharply to a positive peak at 93%, and then gradually declines, reflecting a weakly unimodal pattern. For the GCR (Figure 4g), the SHAP value is slightly negative below 66%, weakly positive between 66% and 87%, and turns negative again beyond 87%, forming a weak inverted U-shaped trend.

3.3. Pathways for Improving Irrigation Water Use Efficiency

3.3.1. Classification of Irrigation Districts by IWUE Level

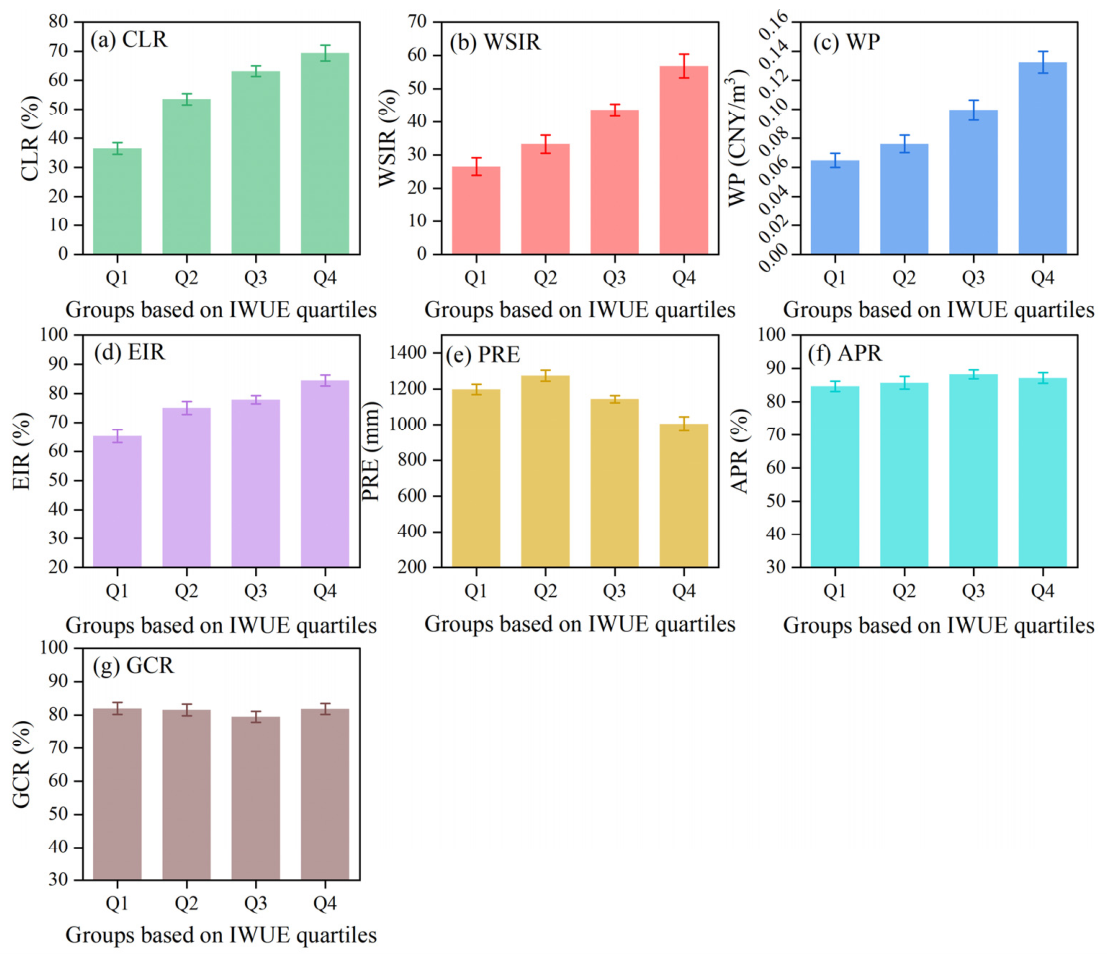
Based on the quartiles of IWUE, 153 irrigation districts were categorized into four groups: Q1 (low IWUE, <0.50, n = 43), Q2 (0.50–0.53, n = 36), Q3 (0.53–0.56, n = 48), and Q4 (>0.56, n = 26). Figure 5 presents the variations in seven influencing factors across these groups. From Q1 to Q4, CLR increased from 36.47% to 69.39%, WSIR from 26.51% to 56.81%, WP from 0.065 to 0.132 CNY/m3, and EIR from 65.30% to 84.47% (Figure 5a–d). PRE exhibited a non-monotonic pattern, rising from 1198.48 mm (Q1) to 1274.85 mm (Q2) and then declining to 1005.22 mm (Q4), indicating an overall decreasing trend (Figure 5e). In contrast, both APR and GCR showed little variation across quartiles, with APR ranging from 84.68% to 88.27% and GCR from 79.49% to 81.97%, displaying no clear directional trend (Figure 5f,g). The low-IWUE group (Q1) exhibited the lowest values of CLR, WSIR, WP, and EIR, with moderate GCR (81.97%) and APR (84.68%). Progressive improvements in these indicators were observed in Q2 and Q3, and Q4 attained the highest levels (CLR 69.39%, WSIR 56.81%, WP 0.132 CNY/m3, EIR 84.47%) alongside the minimum PRE. These results suggest that higher IWUE is associated with enhanced irrigation infrastructure, greater adoption of water-saving irrigation, higher water pricing, and a higher effective irrigation ratio, whereas PRE, APR, and GCR do not exhibit consistent monotonic relationships with IWUE.

3.3.2. Stage-Specific Correlates of IWUE Improvement

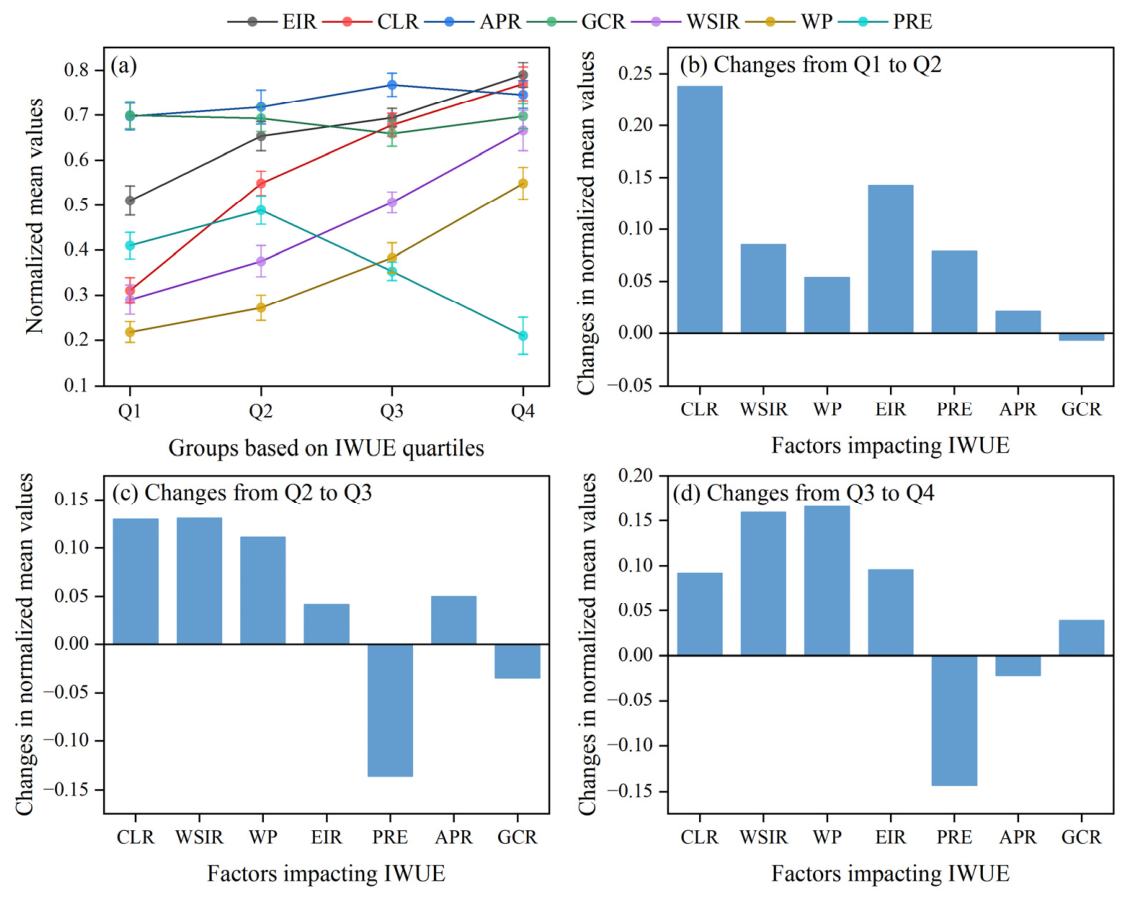
To identify stage-specific correlates of IWUE improvement, we analyzed the normalized SHAP values of seven influencing factors across four IWUE quartiles (Figure 6a) and their incremental changes (denoted as Δ) between consecutive levels (Figure 6b–d). The dominant correlates varied systematically across efficiency stages. The early transition (Q1 → Q2) was led by CLR, which exhibited the largest positive increment (Δ = 0.238), with additional support from EIR (Δ = 0.143) and WSIR (Δ = 0.085) (Figure 6b). The mid-stage shift (Q2 → Q3) relied on balanced contributions from CLR (Δ = 0.130) and WSIR (Δ = 0.131), with WP emerging as a secondary driver (Δ = 0.111) (Figure 6c). The advanced-stage improvement (Q3 → Q4) was primarily driven by WP (Δ = 0.166) and WSIR (Δ = 0.159), alongside sustained positive contributions from CLR (Δ = 0.092) and EIR (Δ = 0.096), while PRE consistently showed negative changes in the later stages (Δ = −0.136 for Q2 → Q3 and Δ = −0.143 for Q3 → Q4) (Figure 6d).
This pattern defines a clear staged pathway for IWUE improvement. The initial leap from low to medium-low efficiency hinges on investment in hard infrastructure (canal lining) to reduce water loss, laying the foundation for subsequent gains. The mid-stage advancement requires coordinated development of engineering infrastructure and adoption of water-saving technologies, moving beyond single-factor improvements toward system-wide upgrades. The final push to high efficiency is powered by market-based economic incentives (reasonable water pricing) and widespread diffusion of advanced water-saving practices, marking a shift from infrastructure-driven to efficiency-oriented governance.

4. Discussion

4.1. Contributions of Multidimensional Correlates to IWUE and Their Underlying Mechanisms

Based on the variable importance ranking obtained from the RF and SHAP analysis (Figure 3), the CLR contributes the most to IWUE, accounting for 28.75% of the total importance. CLR directly determines water leakage during canal conveyance and water resource allocation capacity. Fan et al. [28] emphasized that the integrity of main canal systems serves as a core indicator for evaluating engineering water-saving performance in large irrigation districts. In this study, CLR increased from 36.47% in the low-efficiency group to 69.39% in the high-efficiency group, accompanied by a sharp rise in IWUE from below 0.50 to above 0.56 (Figure 5a). This result strongly supports the consensus that engineering infrastructure constitutes the fundamental basis for improving irrigation efficiency. WSIR reflects the adoption of sprinkler, drip, and micro-irrigation technologies, with a contribution of approximately 20% (Figure 3b). Ju et al. [29] reported that water-saving irrigation area exerted a highly significant effect on IWUE, and insufficient coverage of efficient irrigation technologies often acts as a bottleneck restricting efficiency improvement. The WSIR value in the high-efficiency group reached 56.81%, more than double that in the low-efficiency group (26.51%), indicating that on-farm water conservation and canal loss reduction are equally indispensable for IWUE enhancement (Figure 5b). WP, as a critical economic instrument, contributed about 19.15% to IWUE (Figure 3b). Zhang et al. [30] demonstrated that appropriate agricultural water pricing provides effective incentives for water-saving behavior within farmers’ affordability. Li et al. [31] further verified that tiered water pricing significantly improved irrigation technical efficiency and reduced water consumption in arid regions. EIR reflects the actual utilization efficiency of irrigation infrastructure, with a contribution of 14.70% (Figure 3b). The SHAP value of EIR shifted from negative to positive within 60–70% (Figure 4d), suggesting that scale benefits become evident only when the actual irrigated area approaches a sufficient proportion of the designed capacity. Low EIR usually leads to idled engineering assets and high maintenance costs, forming a vicious cycle of low efficiency and insufficient investment [32]. Admittedly, EIR is not a direct hydraulic driver of IWUE but rather a composite indicator of facility utilization and management effectiveness; its strong empirical contribution (14.70%) underscores the importance of utilization intensity and scale economies as mediating mechanisms.
PRE, APR, and GCR show relatively limited impacts (Figure 3b). Abundant precipitation may diminish water-saving awareness and weaken incentives for canal maintenance [33,34]. The effect of APR presents a weak unimodal pattern related to rural labor transition and irrigation management. GCR shows negligible influence, likely due to its small variation and indirect effects mediated by other factors [35]. This finding, however, does not imply that APR and GCR are universally irrelevant. In the context of Anhui Province, their weak marginal effects can be attributed to limited spatial variability (APR: SD 9.9%; GCR: SD 11.1%) (Table 1) and strong masking by the dominant engineering and economic correlates (CLR, WSIR, WP). Whether complex interaction effects exist—e.g., APR moderating canal maintenance in low-CLR districts—remains unresolved and warrants further investigation with larger sample sizes or factorial designs. In summary, the driving factors can be categorized into core engineering factors (CLR, EIR), technical and economic factors (WSIR, WP), and natural and social background factors (PRE, APR, GCR). Improvements in IWUE should prioritize engineering renovation, water-saving technology popularization, rational water pricing, and infrastructure utilization efficiency, while considering the regulatory role of natural and social conditions. Despite the reasonable predictive performance (validation R2 = 0.6815), approximately 31.8% of the variance in IWUE remains unexplained by the seven factors included in our model. This unexplained portion likely stems from omitted variables (e.g., soil texture, groundwater depth, irrigation scheduling, water user association performance), measurement errors in water price and precipitation data, the cross-sectional design which cannot account for inter-annual variability and dynamic behavioral responses, and the moderate sample size (n = 153) which limits model complexity. Addressing these limitations through panel data, high-resolution covariates, and process-informed machine learning represents a key direction for future research.

4.2. Nonlinear Marginal Effects and Threshold Characteristics of Influencing Factors

SHAP dependence plots (Figure 4) reveal the nonlinear impacts and key thresholds of seven factors on IWUE, providing direct guidance for precise irrigation district renovation and investment optimization. Our analysis identifies a CLR of 53.8% as a critical efficiency threshold: below this level, CLR is associated with negative SHAP contributions, indicating a detrimental effect on IWUE (Figure 4a). The marginal benefit of lining increases sharply within the 53.8–70% interval, where SHAP values rise rapidly from negative to positive, and subsequently plateaus beyond 75%, reflecting clear diminishing marginal returns. Accordingly, we recommend a CLR of 75% as the practical investment saturation ceiling, and caution that lining projects in districts where current CLR falls below 53.8% are likely to be counterproductive. The higher saturation ceiling relative to the 34.8% threshold in arid areas [36] highlights the climate-dependence of optimal lining targets. Both WSIR and WP display clear nonlinearity (Figure 4b,c). For WSIR, SHAP values are negative below 31.7%, become positive above this inflection point, and increase at a progressively slower rate with higher coverage (Figure 4b). This is consistent with Han et al. [37], who identified insufficient coverage as an efficiency bottleneck. Our study finds that WP exhibits an S-shaped curve, with the optimal incentive range identified at 0.09–0.14 CNY/m3 (Figure 4c). This finding is consistent with the 0.1 CNY/m3 threshold reported by Yang et al. [38] in Jiangsu Province, confirming the existence of a nonlinear price incentive mechanism for irrigation water use efficiency. For EIR, SHAP values are negative below 67%, turn positive thereafter, and plateau beyond 70%, identifying 70% as a critical operational threshold (Figure 4d). This pattern aligns with previous findings on irrigation facility management [37].
Notably, PRE, APR, and GCR exhibited comparatively weak and statistically diffuse influences, lacking well-defined inflection points amenable to targeted intervention. PRE displayed a monotonic negative trend across its entire observed range, consistent with a persistent dampening effect of abundant natural water availability on IWUE, yet without a discernible critical value (Figure 4e). APR and GCR showed only weak unimodal and inverted U-shaped patterns, respectively, with SHAP contributions too modest to support the identification of actionable regulatory thresholds (Figure 4f,g). These observations reinforce the conclusion that nonlinear, threshold-driven responses are predominantly confined to engineering and economic levers, while natural and demographic background factors serve primarily as contextual constraints rather than direct instruments for precision management [39,40].

4.3. Key Factors Regulation and Improvement Path of Irrigation Water Use Efficiency

Stratifying districts by IWUE quartiles reveals a sequential driver hierarchy (Figure 5). Our results show that canal lining rate is the fundamental prerequisite for improving IWUE from low to medium-low levels. CRL below ~50% contributes negligibly to system efficiency (Figure 5a), indicating piecemeal upgrades are ineffective in Anhui’s humid climate. This aligns with assessments showing that China’s backbone canal completion and intactness remain at only ~70% and ~60%, respectively [41]. For advancing IWUE to medium-high efficiency, our analysis shows that once CLR attains a threshold, expanding water-saving irrigation area becomes necessary. WSIR must exceed 40% coverage to yield measurable district-scale gains (Figure 5b). However, even in water-scarce northern China, adoption of efficient techniques remains low, highlighting the need for sustained training and subsidies [42,43]. The final advance to high efficiency, according to our results, requires synergistic interaction between WSIR and WP after both CLR and WSIR reach sufficient levels. SHAP analysis identifies an optimal WP range of 0.09–0.14 CNY/m3 (Figure 5c), effective only when infrastructure enables volumetric control. Incremental contributions across stages (Figure 6b–d) confirm WP gains prominence exclusively in the Q3→Q4 transition. This resonates with evidence from tiered water price pilots showing that pricing without adequate infrastructure can paradoxically induce excessive irrigation [44,45].
Taken together, our findings delineate a clear improvement pathway: from infrastructure to technology synergy and onward to economic incentive. This hierarchy highlights the risk of stage mismatch—promoting advanced pricing mechanisms or high-efficiency irrigation technologies before canal conveyance reliability is assured not only yields limited efficiency gains but may also provoke farmer resistance, a concern echoed in recent assessments of infrastructure imbalance in China’s irrigation districts [46]. For irrigation districts in Anhui that remain at lower efficiency levels, policy efforts should prioritize completing backbone canal upgrades, consistent with the widely endorsed principle of “establish the mechanism before building the project” in China’s agricultural water pricing reform [47]. Once this foundation is in place, coordinated expansion of water-saving irrigation area and precisely calibrated water price reforms can be progressively advanced, as exemplified by successful pilot cases [30].

4.4. Limitations and Future Research

Several limitations exist in this study. First, the sample is limited to Anhui Province. Although the irrigation districts in the province cover diverse topographic types and provide good regional representativeness, the applicability of the conclusions to other climatic regions still requires cross-regional validation, especially in arid or groundwater-depleted zones. Second, due to data constraints, this study uses cross-sectional data and cannot capture the dynamic evolution or time-lag effects of the driving factors. Third, the RF and SHAP methods primarily reveal associations rather than strict causal relationships; future research could combine quasi-experimental designs to further identify net effects. Fourth, the independent variables have inconsistent time scales: CLR and WSIR reflect conditions at renovation completion (varying across districts between 2021 and 2023), while PRE is a 43-year long-term average. Although the potential bias is limited due to the slow-changing nature of engineering variables and the standard use of long-term climate averages, future panel data studies with time-matched annual precipitation could further validate our findings. These limitations do not undermine the robustness or practical value of the core findings. The three key driving factors (canal lining rate, proportion of water-saving irrigation area, and water price) and their nonlinear thresholds have general implications grounded in engineering logic and economic theory. Moreover, the staged “engineering → technology → institution” improvement pathway derived from IWUE quartile classification does not rely on cross-sectional assumptions or a specific causal direction and aligns well with practical renovation experience. Thus, while future research can be deepened by expanding datasets, dynamic analysis, and causal identification, the quantitative conclusions and differentiated policy framework presented here already provide a direct and reliable scientific basis for improving large and medium-sized irrigation districts in Anhui Province and similar regions.

5. Conclusions

In conclusion, the random forest-SHAP framework effectively captures the nonlinear driving mechanisms and hierarchical pathways of IWUE. Canal lining rate (CLR), proportion of water-saving irrigation area (WSIR), and water price (WP) are identified as the three core associated factors, jointly accounting for 67.8% of IWUE variation in this study, with CLR being the most influential. Nonlinear marginal effects and distinct thresholds are observed: the marginal benefit of CLR saturates beyond approximately 75%; WP exhibits an optimal incentive range (0.09–0.14 CNY/m3 in Anhui); and WSIR becomes positively effective only after exceeding a threshold (around 31.7% here). Importantly, the improvement in IWUE follows a sequential hierarchy: CLR serves as the fundamental prerequisite; once CLR attains a sufficient level, promoting WSIR becomes essential; and after both reach adequate levels, synergistic interaction between WSIR and WP is required for further advancement. To operationalize this pathway, funding for CLR and WSIR in low-efficiency districts should be prioritized under the High Standard Farmland Construction program, and the optimal WP range should be implemented via tiered pricing with subsidies to protect farmers’ affordability. These findings provide quantitative support for stage-targeted retrofitting strategies in large and medium-sized irrigation districts in Anhui Province and analogous humid/semi-humid regions, advancing the sustainable use of agricultural water resources.

Supplementary Materials

The following supporting information can be downloaded at: https://www.mdpi.com/article/10.3390/su18105204/s1, Table S1: List of the 153 irrigation districts shown in Figure 1.

Author Contributions

H.Z. directed the writing of the manuscript. H.Z. drafted the first draft of the manuscript. S.J. and S.Z. supervised the writing process. F.Y. revised the figures and tables. H.Z. and B.X. were responsible for data collection and article conceptualization, H.Z. was responsible for data and figure verification, and B.X. was involved in data organization. All authors have read and agreed to the published version of the manuscript.

Funding

This research was funded by the Anhui Provincial Natural Science Foundation, Grant Numbers [2308085US06, 2508085QE207].

Institutional Review Board Statement

Not applicable.

Informed Consent Statement

Not applicable.

Data Availability Statement

The data that support the findings of this study are available from the Anhui Provincial Department of Water Resources and its subordinate municipal and county water resources bureaus. Restrictions apply to the availability of these data, which were used under license for this study. Data are, therefore, not publicly available. Interested parties may direct data access requests to the corresponding author, subject to approval from the aforementioned authorities.

Acknowledgments

The authors gratefully acknowledge the Anhui Provincial Department of Water Resources and its subordinate municipal and county water resources bureaus for providing invaluable data and planning documents pertaining to the 153 large- and medium-sized irrigation districts examined in this study.

Conflicts of Interest

The authors declare no conflicts of interest.

References

  1. McDermid, S.; Nocco, M.; Lawston-Parker, P.; Keune, J.; Pokhrel, Y.; Jain, M.; Jägermeyr, J.; Brocca, L.; Massari, C.; Jones, A.D.; et al. Irrigation in the Earth system. Nat. Rev. Earth Environ. 2023, 4, 435–453. [Google Scholar] [CrossRef]
  2. Cheng, H.; Liu, D.; Ming, G.; Hussain, F.; Ma, L.; Huang, Q.; Meng, X. Evaluation of Water Balance and Water Use Efficiency with the Development of Water-Saving Irrigation in the Yanqi Basin Irrigation District of China. Agronomy 2023, 13, 2990. [Google Scholar] [CrossRef]
  3. Chen, M.Z. Accelerating modernization of irrigation district for high quality development. China Water Resour. 2021, 17, 1–3. (In Chinese) [Google Scholar]
  4. Wang, C.; Li, Z.; Chen, H.; Wang, M. Comprehensive Evaluation of Agricultural Water Resources’ Carrying Capacity in Anhui Province Based on an Improved TOPSIS Model. Sustainability 2023, 15, 13297. [Google Scholar] [CrossRef]
  5. Yan, L.; Jiao, D.; Yongshi, Z. Evaluation of regional water resources carrying capacity in China based on variable weight model and grey-markov model: A case study of Anhui province. Sci. Rep. 2023, 13, 13490. [Google Scholar] [CrossRef]
  6. Zhao, T.; Wang, Y.; Zhang, Y.; Wang, Q.; Wu, P.; Yang, H.; He, Z.; Li, J. Multiscale Spatiotemporal Variation Analysis of Regional Water Use Efficiency Based on Multifractals. Remote Sens. 2024, 16, 4269. [Google Scholar] [CrossRef]
  7. Koech, R.; Langat, P. Improving Irrigation Water Use Efficiency: A Review of Advances, Challenges and Opportunities in the Australian Context. Water 2018, 10, 1771. [Google Scholar] [CrossRef]
  8. Alharbi, S.; Felemban, A.; Abdelrahim, A.; Al-Dakhil, M. Agricultural and Technology-Based Strategies to Improve Water-Use Efficiency in Arid and Semiarid Areas. Water 2024, 16, 1842. [Google Scholar] [CrossRef]
  9. Kumar, D.B.U. Increasing Water Use Efficiency by Canal Lining: A Case Study on the Birinchiguri Flow Irrigation Project, Assam, India. Int. J. Sci. Res. 2024, 13, 1634–1638. [Google Scholar] [CrossRef]
  10. Qu, W.; Yan, J.; Tan, Y.; Tu, Q. Analysis on the Influencing Factors of Farmers’ Cognition on the Function of Agricultural Water Price—Taking Hexi Corridor as an Example. Sustainability 2021, 13, 5197. [Google Scholar] [CrossRef]
  11. Zhu, X.; Zhang, G.; Yuan, K.; Ling, H.; Xu, H. Evaluation of Agricultural Water Pricing in an Irrigation District Based on a Bayesian Network. Water 2018, 10, 768. [Google Scholar] [CrossRef]
  12. Du, D.; Dong, B.; Zhang, R.; Cui, S.; Chen, G.; Du, F. Spatiotemporal dynamics of irrigated cropland water use efficiency and driving factors in northwest China’s Hexi Corridor. Ecol. Process. 2024, 13, 72. [Google Scholar] [CrossRef]
  13. Li, G.; Yi, Z.; Qian, T.; Chang, Y.; Gao, H.; Yu, F.; Han, L.; Lu, Y.; Zuo, K. Synergistic Effects of Drivers on Spatiotemporal Changes in Carbon and Water Use Efficiency in Irrigated Cropland Ecosystems. Agronomy 2025, 15, 1500. [Google Scholar] [CrossRef]
  14. Liu, J.; Sun, B.; Shen, H.; Ding, P.; Ning, D.; Zhang, J.; Qiu, X. Crop Water Requirement and Utilization Efficiency-Based Planting Structure Optimization in the Southern Huang-Huai-Hai Plain. Agronomy 2022, 12, 2219. [Google Scholar] [CrossRef]
  15. Zhao, J.; Zhong, H.; Wang, C. Estimation of Reference Crop Evapotranspiration in the Yellow River Basin Based on Machine Learning and Its Regional and Drought Adaptability Analysis. Agronomy 2025, 15, 1237. [Google Scholar] [CrossRef]
  16. Abioye, E.A.; Hensel, O.; Esau, T.J.; Elijah, O.; Abidin, M.S.Z.; Ayobami, A.S.; Yerima, O.; Nasirahmadi, A. Precision Irrigation Management Using Machine Learning and Digital Farming Solutions. AgriEngineering 2022, 4, 70–103. [Google Scholar] [CrossRef]
  17. Wu, Z.; Wang, C. Evaluation and Analysis of Agricultural Water Use Efficiency Based on Machine Learning. China Rural. Water Hydropower 2024, 9, 188–195. (In Chinese) [Google Scholar] [CrossRef]
  18. Mortazavizadeh, F.; Bolonio, D.; Mirzaei, M.; Ng, J.L.; Mortazavizadeh, S.V.; Dehghani, A.; Mortezavi, S.; Ghadirzadeh, H. Advances in machine learning for agricultural water management: A review of techniques and applications. J. Hydroinform. 2025, 27, 474–492. [Google Scholar] [CrossRef]
  19. Umutoni, L.; Samadi, V. Application of machine learning approaches in supporting irrigation decision making: A review. Agric. Water Manag. 2024, 294, 108710. [Google Scholar] [CrossRef]
  20. Virro, H.; Kmoch, A.; Vainu, M.; Uuemaa, E. Random forest-based modeling of stream nutrients at national level in a data-scarce region. Sci. Total Environ. 2022, 840, 156613. [Google Scholar] [CrossRef]
  21. Ponce-Bobadilla, A.V.; Schmitt, V.; Maier, C.S.; Mensing, S.; Stodtmann, S. Practical guide to SHAP analysis: Explaining supervised machine learning model predictions in drug development. Clin. Transl. Sci. 2024, 17, e70056. [Google Scholar] [CrossRef]
  22. Gebreyesus, Y.; Dalton, D.; De Chiara, D.; Chinnici, M.; Chinnici, A. AI for Automating Data Center Operations: Model Explainability in the Data Centre Context Using Shapley Additive Explanations (SHAP). Electronics 2024, 13, 1628. [Google Scholar] [CrossRef]
  23. Zhao, Q.; Gao, F.; He, B.; Li, Y.; Li, H.; Xiao, Y.; Lin, R. Analysis of temporal and spatial variations in cropland water-use efficiency and influencing factors in Xinjiang based on the XGBoost–SHAP model. Agronomy 2025, 15, 1902. [Google Scholar] [CrossRef]
  24. Sahoo, S.; Kumar, A. Predictive modeling of evapotranspiration using LSTM and explainable AI. Adv. Mod. Agric. 2025, 6, 3534. [Google Scholar] [CrossRef]
  25. Bai, X.; Yu, J.; Li, Y.; Jin, J.; Wu, C.; Zhou, R. Variability Identification and Uncertainty Evolution Characteristic Analysis of Hydrological Variables in Anhui Province, China. Entropy 2025, 27, 305. [Google Scholar] [CrossRef]
  26. R Core Team. R: A Language and Environment for Statistical Computing, Version 4.5.3; R Foundation for Statistical Computing: Vienna, Austria, 2026; Available online: https://www.R-project.org/ (accessed on 1 February 2026).
  27. Sahin, E.K. Assessing the predictive capability of ensemble tree methods for landslide susceptibility mapping using XGBoost, gradient boosting machine, and random forest. SN Appl. Sci. 2020, 2, 1308. [Google Scholar] [CrossRef]
  28. Fan, X.; Qin, J.; Xu, L.; Liu, R.; Gu, S.; Lv, M. Construction and empirical analysis of the evaluation index system for the water-saving level of large-sized irrigation districts. Trans. CSAE 2021, 37, 99–107. (In Chinese) [Google Scholar] [CrossRef]
  29. Ju, Y.; Xing, Y.; Dong, A.; Qi, F.; Hou, M.; Zhang, W. An analysis on influencing factors of irrigation water effective utilization coefficient—A case study of Jiangsu province, China. Water Supply 2022, 22, 8233–8252. [Google Scholar] [CrossRef]
  30. Zhang, C.; Oki, T. Water pricing reform for sustainable water resources management in China’s agricultural sector. Agric. Water Manag. 2023, 275, 108045. [Google Scholar] [CrossRef]
  31. Li, G.; Ma, D. Can a tiered water price policy improve the technical efficiency of crop irrigation for maize in the Heihe River Basin in Northwest China? Agric. Water Manag. 2025, 309, 109350. [Google Scholar] [CrossRef]
  32. Shi, Y.; Yang, X.; Zhao, L.; Ji, R. Analysis of agricultural irrigation dilemma and development ideas under the perspective of rural revitalization strategy. Water Resour. Dev. Res. 2023, 23, 39–43. (In Chinese) [Google Scholar] [CrossRef]
  33. Praskievicz, S. The myth of abundance: Water resources in humid regions. Water Policy 2019, 21, 1065–1080. [Google Scholar] [CrossRef]
  34. Trumbo, C.W.; Markee, N.L.; O’Keefe, G.J.; Park, E. Antecedent precipitation as a methodological concern in attitude surveys on water conservation. Water Resour. Res. 1999, 35, 1269–1273. [Google Scholar] [CrossRef]
  35. Yang, J.; Xiao, Z.; Liu, R.; Dai, J.; Liu, W. Optimizing major grain crop planting structure and analysis of water use efficiency in the Sichuan Province from the perspective of water footprint. Trans. CSAE 2024, 40, 117–127. (In Chinese) [Google Scholar] [CrossRef]
  36. Zhang, J.; Tian, H.; Guo, B. Determination Method of Water Saving Threshold in Arid Area. Procedia Eng. 2012, 28, 873–876. [Google Scholar] [CrossRef]
  37. Han, Z.; Feng, B.; Tian, Y.; Huang, Z. Potential for improving irrigation water use efficiency in China and realization path. China Water Resour. 2025, 11, 28–33. (In Chinese) [Google Scholar] [CrossRef]
  38. Yang, X.; Hou, M.; Zhang, W.; Ju, Y.; Wang, Z. Optimization of agricultural water price setting strategy and government subsidy mechanisms based on game analysis. Agric. Water Manag. 2025, 319, 109814. [Google Scholar] [CrossRef]
  39. Yan, Z.; Li, M.; Li, Z. Efficient and Economical Allocation of Irrigation Water under a Changing Environment: A Stochastic Multi-Objective Nonlinear Programming Model. Irrig. Drain. 2021, 70, 103–116. [Google Scholar] [CrossRef]
  40. Li, M.; Fu, Q.; Singh, V.P.; Liu, D.; Li, T.; Zhou, Y. Managing agricultural water and land resources with tradeoff between economic, environmental, and social considerations: A multi-objective non-linear optimization model under uncertainty. Agric. Syst. 2020, 178, 102685. [Google Scholar] [CrossRef]
  41. Ministry of Water Resources of the People’s Republic of China. Statistical Bulletin on Water Resources in China 2022; Ministry of Water Resources: Beijing, China, 2022. [Google Scholar]
  42. Wang, S.; Yin, N.; Yang, Z. Factors affecting sustained adoption of irrigation water-saving technologies in groundwater over-exploited areas in the North China Plain. Environ. Dev. Sustain. 2021, 23, 10528–10546. [Google Scholar] [CrossRef]
  43. Wang, Y.; Wang, Z.; Zhao, M.; Li, B. The influence of technology perceptions on farmers’ water-saving irrigation technology adoption behavior in the North China Plain. Water Policy 2024, 26, 170–188. [Google Scholar] [CrossRef]
  44. Zhou, Q.; Zhang, Y.; Wu, F. Can Water Price Improve Water Productivity? A Water-Economic-Model-Based Study in Heihe River Basin, China. Sustainability 2022, 14, 6224. [Google Scholar] [CrossRef]
  45. Ben-Gal, A.; Weikard, H.P.; Shah, S.H.H.; Zee, S.E.A.T.M. A coupled agronomic-economic model to consider allocation of brackish irrigation water. Water Resour. Res. 2013, 49, 2861–2871. [Google Scholar] [CrossRef]
  46. Wang, H.; Lu, W.; Xu, L. Progress and prospects of comprehensive reform of agricultural water prices. China Water Resour. 2025, 21, 19–24. (In Chinese) [Google Scholar] [CrossRef]
  47. Wang, X.J.; Chen, N.; He, L.J. The inner logic, realistic dilemma and deepening direction of China’s comprehensive reform of agricultural water price policy. Res. Agric. Mod. 2023, 44, 444–453. (In Chinese) [Google Scholar] [CrossRef]
Figure 1. Location of Anhui Province in China and the spatial distribution of the 153 irrigation districts within the province. Note: The yellow area in the inset figure represents the study area (Anhui Province). The names of the irrigation districts indicated by the numbers in the figure are listed in Supplementary Table S1.
Sustainability 18 05204 g001
Figure 2. Performance of the random forest model in simulating irrigation water use efficiency (IWUE) against observed data for the training (n = 107) (a) and validation (n = 46) sets (b). Note: The dash-dot line indicates the 1:1 reference line.
Sustainability 18 05204 g002
Figure 3. Assessment of feature importance with SHAP analysis (a) and Random Forest variable importance (b). Note: In panel (a), the horizontal bars represent the mean absolute SHAP values for each feature, reflecting their overall contribution to the model output (IWUE); longer bars indicate greater importance. Panel (b) displays variable importance from the Random Forest model, calculated using the IncNodePurity criterion and normalized to sum to 100%.
Sustainability 18 05204 g003
Figure 4. SHAP dependence plots for the seven influencing factors: (a) canal lining rate (CLR), (b) proportion of water-saving irrigation area (WSIR), (c) water price (WP), (d) effective irrigation area ratio (EIR), (e) mean annual precipitation (PRE), (f) agricultural population ratio (APR), and (g) grain crop planting ratio (GCR).
Sustainability 18 05204 g004
Figure 5. Variation in key irrigation and agricultural performance indicators across IWUE quartile groups (Q1–Q4). Note: See Table 1 for abbreviation definitions and units.
Sustainability 18 05204 g005
Figure 6. Normalized mean values of the various influencing factors across IWUE quartiles (a), and their changes from Q1 to Q2 (b), Q2 to Q3 (c), and Q3 to Q4 (d). Note: See Table 1 for abbreviation definitions and units.
Sustainability 18 05204 g006
Table 1. Variable definitions and descriptive statistics.
VariableSymbolUnitDefinitionMeanSDMinMax
Irrigation water use efficiencyIWUEProduct of canal system water use efficiency and field water use efficiency0.530.030.440.60
Canal lining rateCLR%Ratio of lined main canal length to total main canal length × 10054.2117.5414.2685.85
Proportion of water-saving irrigation areaWSIR%Ratio of high-efficiency water-saving irrigation area to total irrigated area × 10038.0618.273.6882.45
Per-unit water priceWPCNY/m3End-user agricultural water price (converted)0.090.050.020.23
Mean annual precipitationPREmmMulti-year (1981–2023) average precipitation11721868031769
Effective irrigation area ratioEIR%Ratio of effective irrigated area to designed irrigated area × 10074.5513.6530.3398.86
Grain crop planting ratioGCR%Ratio of grain crop sown area to total sown area × 10080.9811.1240.00100
Agricultural population ratioAPR%Ratio of agricultural population to total population of the county where the irrigation district is located × 10086.529.9249.45100
Note: The exchange rate at the time of data collection (2020–2022) was approximately 1 CNY = 0.14 USD.
Disclaimer/Publisher’s Note: The statements, opinions and data contained in all publications are solely those of the individual author(s) and contributor(s) and not of MDPI and/or the editor(s). MDPI and/or the editor(s) disclaim responsibility for any injury to people or property resulting from any ideas, methods, instructions or products referred to in the content.