Article

Reviving Water Circulation in Manzala Lagoon, Egypt: A Sustainable Hydrodynamic Modeling Approach


by
Hesham M. El-Asmar
and
Mahmoud Sh. Felfla
*
Geology Department, Faculty of Science, Damietta University, New Damietta City 34517, Damietta, Egypt
*
Author to whom correspondence should be addressed.
Sustainability 2026, 18(10), 4889; https://doi.org/10.3390/su18104889
Submission received: 13 April 2026 / Revised: 7 May 2026 / Accepted: 11 May 2026 / Published: 13 May 2026
(This article belongs to the Section Sustainable Water Management)

Abstract

Egypt’s largest coastal lagoon, Manzala Lagoon, has undergone severe degradation due to sediment infilling, aquatic vegetation proliferation, and untreated wastewater. It has shrunk from 805 km2 in 1985 to 525 km2 by 2017, with poor water quality and heavy metal accumulation. The 2017–2022 restoration project deepened the lagoon to 3–4 m, restoring 750 km2 of open water and temporarily improving water quality. However, the reuse of dredged sediments to construct 13 elongated sand barriers and man-made islands inadvertently created semi-isolated sub-basins, disrupting east–west circulation, fostering localized stagnation, and coinciding with vegetation resurgence and seasonal algal blooms. This study employs coupled CMS-Flow and CMS-Wave modeling to evaluate hydrodynamic conditions and test innovative restoration strategies. Four scenarios were analyzed: pre-purification (2017), post-intervention project (2025), and two proposed interventions aimed at restoring connectivity, either through complete barrier removal or selective channel excavation, to enhance east–west water circulation and reduce stagnation. This study demonstrates that targeted, data-driven interventions can rapidly restore water circulation, revive ecological function, and optimize management strategies, providing a conceptually transferable framework for hydrodynamic assessment and sustainable management of coastal lagoons subject to similar anthropogenic pressures.

1. Introduction

Coastal-deltaic lagoons worldwide are highly sensitive to anthropogenic interventions and hydrodynamic alterations, which can substantially impact ecosystem services, water quality, and sediment dynamics. Coastal lagoons are among the most productive yet vulnerable ecosystems, supporting fisheries, biodiversity, and coastal protection while facing intense anthropogenic pressures such as eutrophication, sediment infilling, and altered hydrodynamics [1,2,3,4]. Large-scale restoration projects, often involving dredging and wastewater diversion, have been implemented in many lagoons (e.g., Venice Lagoon, Mar Menor, Indian River Lagoon), but the reuse of dredged material to construct barriers or islands frequently disrupts natural circulation, creating semi-isolated sub-basins, localized stagnation, and unexpected vegetation resurgence and algal blooms [5,6,7,8].
The Manzala Lagoon, known as Lake Manzala, is one of Egypt’s largest northern coastal-deltaic lagoons, situated along the northeastern Mediterranean coast between latitudes 31°00′ N to 31°31′ N and longitudes 31°48′ E to 32°17′ E (Figure 1). This brackish, shallow lagoon has historically been a vital ecological and socio-economic resource, serving as a critical habitat for migratory birds, providing over 30% of Egypt’s commercial fish production, and acting as a natural barrier against Mediterranean seawater intrusion into surrounding agricultural lands [9,10,11].
Since the early 1980s, the lagoon has undergone progressive shrinkage and severe environmental degradation. The lagoon’s surface area decreased from 805 km2 in 1985 to 525 km2 by 2017 due to progressive sediment infilling, eutrophication from untreated agricultural, industrial, and municipal wastewater discharges via major drains like Bahr El-Baqar and Faraskour (Figure 1), which together contribute ≈7500 million m3/yr [12,13,14]. Environmental monitoring data from the Egyptian Environmental Affairs Agency (EEAA) revealed high pollution levels. The average Biochemical Oxygen Demand (BOD) reached 51 mg/L in 2014, and peaked at 276.73 mg/L near Bahr El-Baqar Drain. The Chemical Oxygen Demand (COD) averaged 121.40 mg/L, indicating severe organic pollution and hypoxic conditions that impaired fisheries, biodiversity, and navigation [10,15,16]. Heavy metal contamination in sediments, including Mn, Cd, Cr, Cu, Pb, and Zn, intensified ecological risks from industrial effluents [10,17,18,19]. These cumulative issues, including the fact that by 2017 over 80% of the lagoon’s surface area had become shallower than 1 m [14], prompted the government to launch a comprehensive dredging and restoration project from 2017 to 2022 [20]. This initiative comprised purification, dredging, and restoration to restore 3–4 m depths and treat wastewater, revitalizing the lagoon’s ecosystem [20,21].
Despite early successes, such as improved water exchange with the Mediterranean via El-Gamil inlets and the introduction of new fish species, post-intervention challenges have emerged, primarily related to hydrodynamic disruptions caused by the reuse of dredged sediments. These sediments were stored in 13 traps along the lagoon‘s margin, each 4–7 km long and up to 500 m wide, and several fully isolated man-made islands situated within the interior of the lagoon (Figure 1), intended to enhance ecological balance, prevent encroachments, and improve safety. While both structural forms function collectively as sediment traps, it is the elongated land-connected sand barriers, hereafter referred to consistently as sand barriers, that constitute the primary hydrodynamic obstacle addressed in this study, owing to their semi-continuous alignment along the lagoon margin. However, these sand barriers have inadvertently functioned as hydrodynamic obstacles, transforming the lagoon into a series of semi-isolated basins, restricting the east–west circulation that drives marine water renewal, resulting in localized stagnation, eddy formations, and reduced nutrient transport. Consequently, partial recirculation without effective mixing has occurred, contributing to lower dissolved oxygen (DO) levels, increased organic matter accumulation, and vegetation resurgence in vulnerable areas, particularly near Bahr El-Baqar Drain in the southeast and scattered zones across the western region. In September 2023, extensive green algal blooms were observed throughout the northeastern and eastern sectors [22]. Although the lagoon surface area stabilized at ≈750 km2 by 2025, representing partial hydrological recovery relative to the 805 km2 documented in 1985, these barriers have compromised overall hydrodynamic efficiency, potentially undermining improvements in water quality and biodiversity if left unaddressed.
To tackle such complex hydrodynamic challenges, numerical modeling has become a crucial approach for simulating water circulation, wave–current interactions, and morphological changes, enabling the evaluation of sustainable management scenarios without extensive field trials [23,24,25]. Among these tools, the Coastal Modeling System (CMS), developed by the U.S. Army Corps of Engineers, effectively integrates CMS-Flow and CMS-Wave to represent coupled hydrodynamic and sediment–wave processes in estuarine and lagoonal settings [26,27,28,29,30]. CMS has been widely applied to assess navigation channel performance, sediment exchange at inlets, and restoration strategies in marginal seas, coastal bays, and lagoons, including evaluations of shoreline protection, water quality dynamics, and tidal influences [28,29,31,32]. For instance, it has been used to model hydrodynamic and water quality variations in shallow coastal lagoons [30]. In the Mediterranean context, CMS has informed inlet management and sediment transport studies in Egyptian coastal systems, demonstrating its utility for predicting post-intervention scenarios [26,27,28,29,31].
The main objective of this study is to assess the effectiveness of the dredging and restoration project carried out between 2017 and 2022 and to evaluate the current (2025) hydrodynamic conditions of Manzala Lagoon. Using CMS-based hydrodynamic modeling, the study further aims to develop sustainable management scenarios to enhance east-to-west water circulation, mitigate stagnation and re-vegetation risks, and support the long-term ecological restoration and management of the lagoon. To this end, all hydrodynamic scenarios were simulated under identical, statistically representative forcing conditions, ensuring that differences in modeled circulation patterns reflect exclusively the structural consequences of each lagoon configuration rather than variations in meteorological forcing. Seasonal variability and extreme event responses, while acknowledged as relevant to lagoon dynamics, lie outside the defined scope of this comparative structural assessment. In this context, hydrodynamic improvement is herein defined as the combined reduction in localized stagnation and quasi-eddy circulation, restoration of unimpeded bidirectional water exchange across the lagoon, equilibration of current velocities and tidal ranges between the eastern and western sectors, and an overall decrease in the spatial variability of these parameters.

2. Dataset and Methods

2.1. Dataset Description

Given the critical importance of this study for implementing measures to enhance Manzala Lagoon’s water circulation, diverse data sources were meticulously selected and validated for accuracy prior to modeling. These include the following:

2.1.1. Remotely Sensed Data

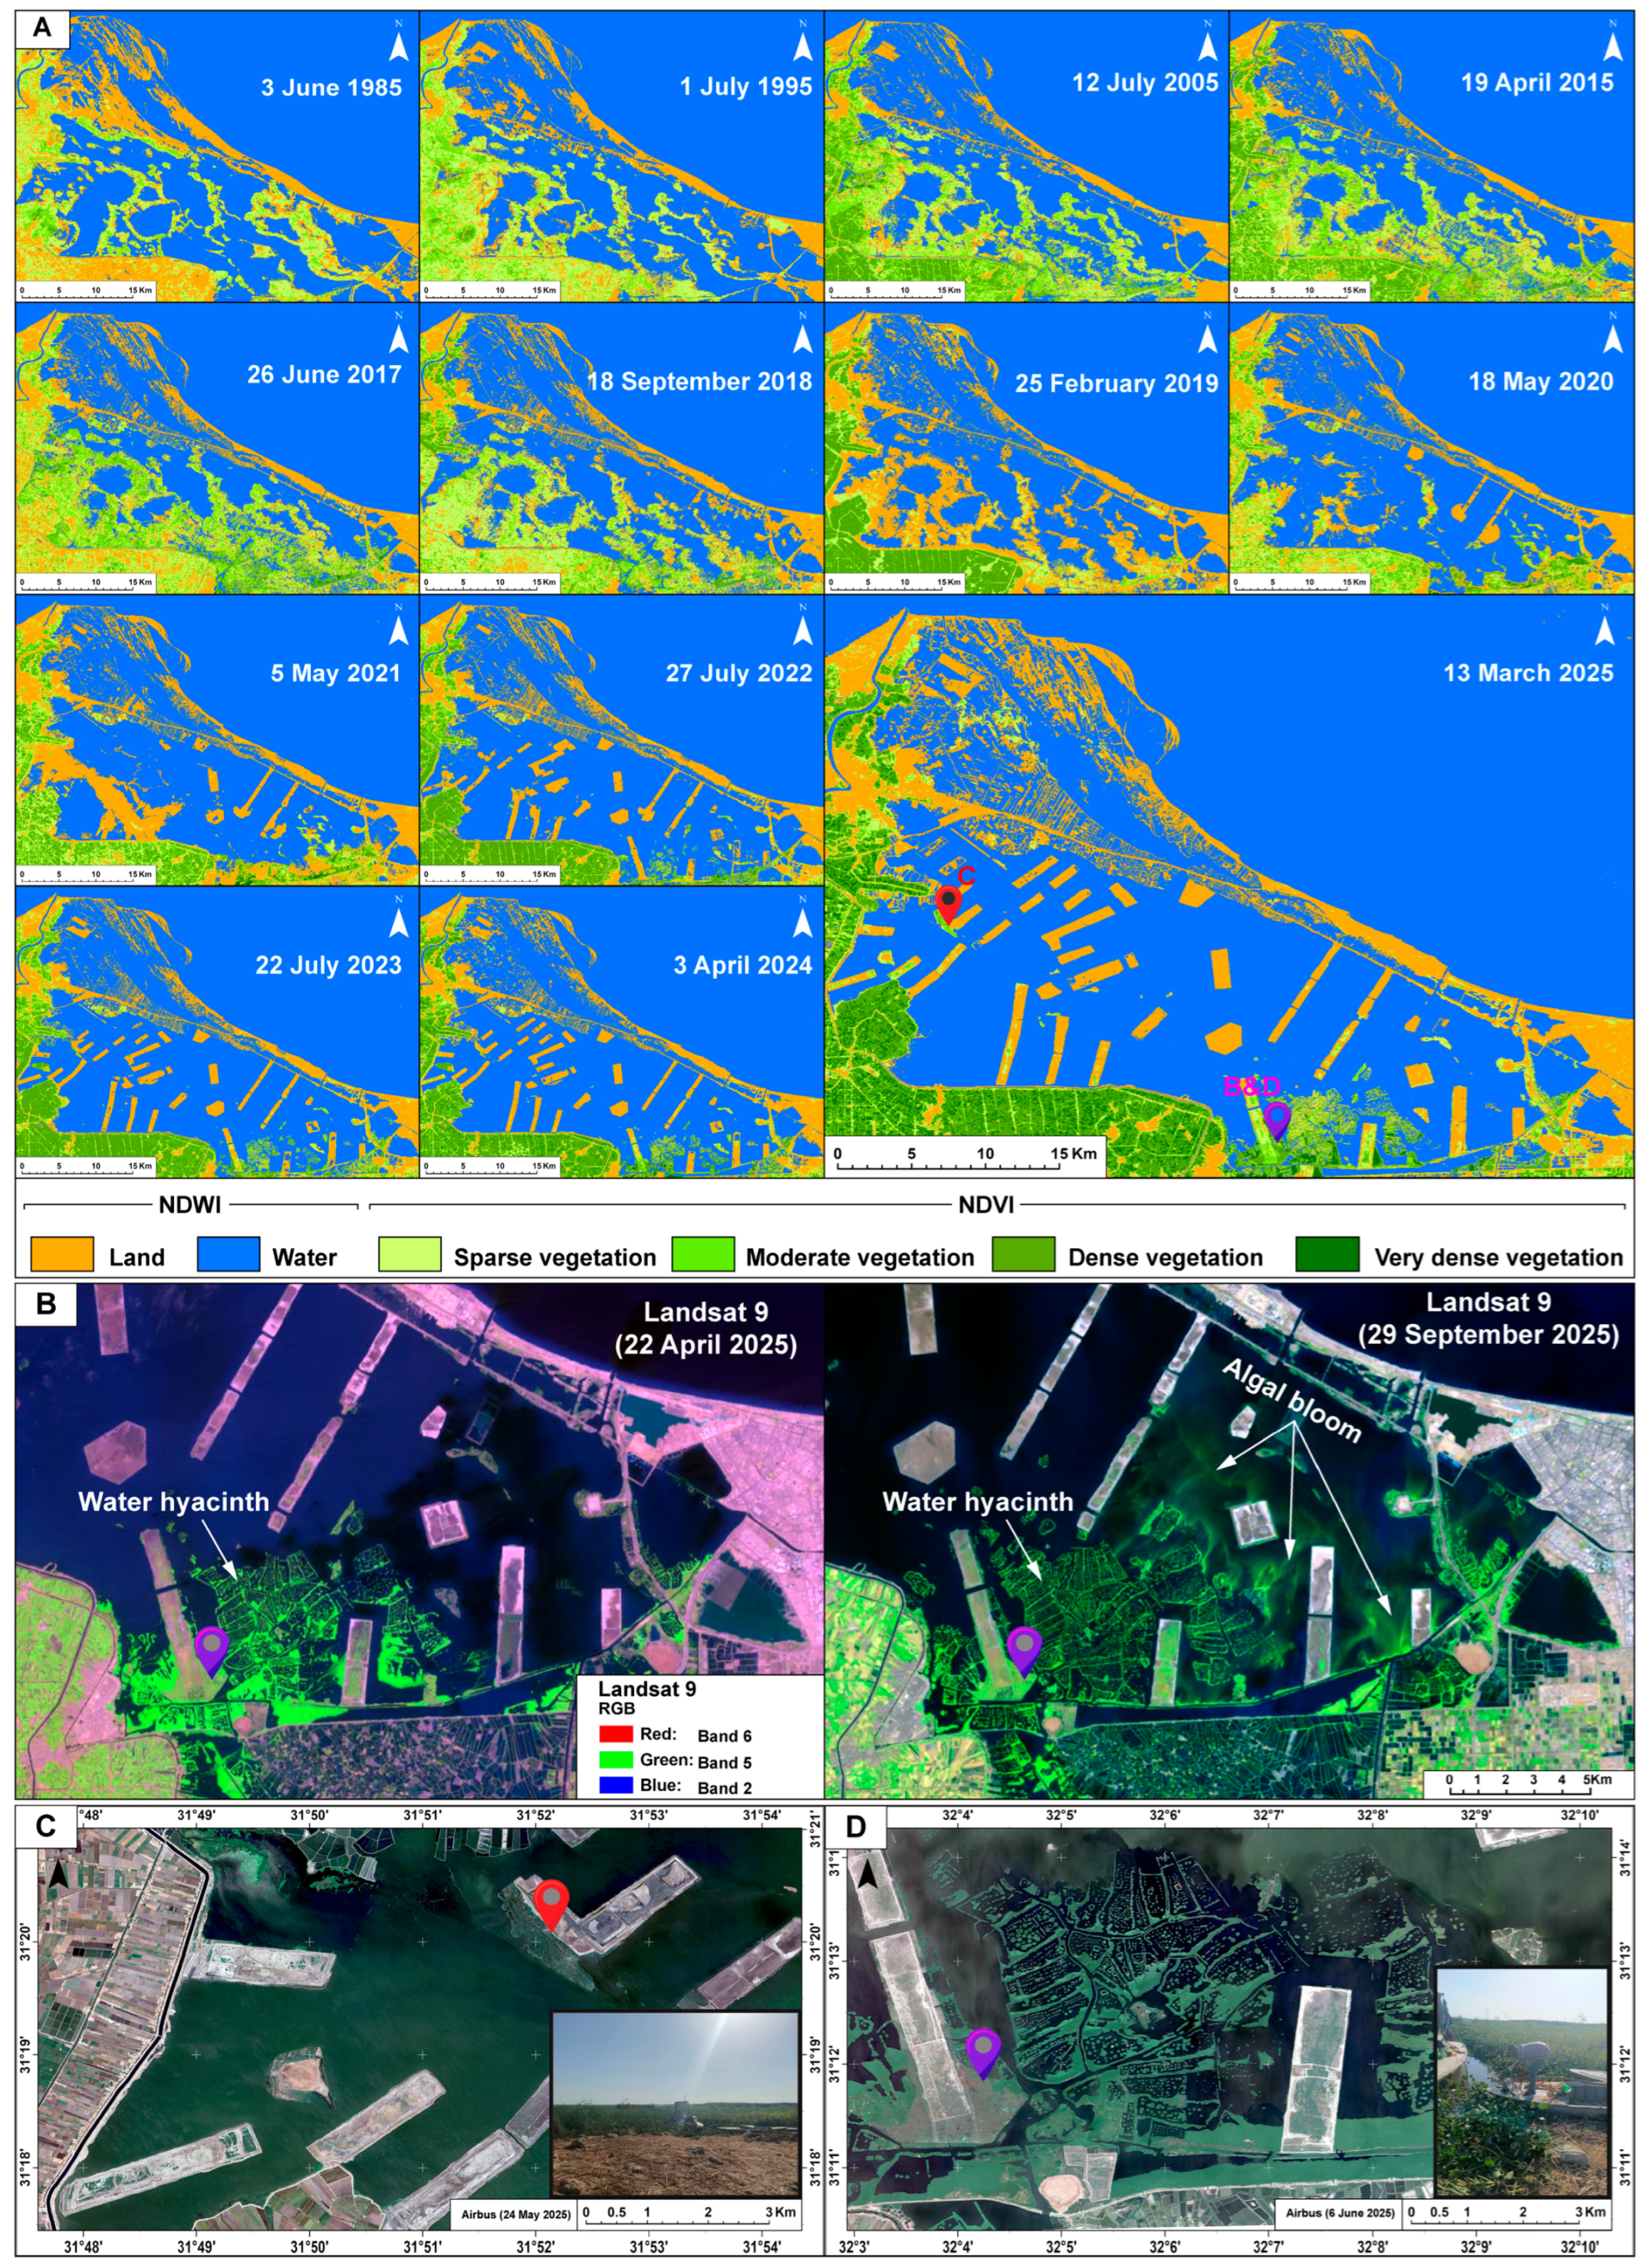
Landsat 5 and 8 imagery (30 m/pixel resolution) from 1985 to 2025 was used to monitor the temporal evolution of Manzala Lagoon’s water surface and vegetation cover. The Normalized Difference Water Index (NDWI) [13,33,34,35] was applied to track water extent, while the Normalized Difference Vegetation Index (NDVI) [36,37,38] assessed vegetation density (Figure 2A). In addition, Landsat 9 “Agriculture” composite imagery (Bands 6-5-2; SWIR-1, NIR, Blue) from the ArcGIS Living Atlas (2025) was employed to monitor algal bloom expansion and aquatic vegetation not clearly captured by NDWI [39,40,41]. Water/land boundaries derived from NDWI were delineated using a threshold of zero, calibrated against ground-truth reference points of known land and water surfaces both within and adjacent to the study area, consistent with standard practice in coastal remote sensing applications [33,34]. High-resolution Airbus imagery (30 cm/pixel) was employed to evaluate post-intervention vegetation resurgence, particularly in the western and southeastern sectors (Figure 2C,D).

2.1.2. Water Surface Elevation

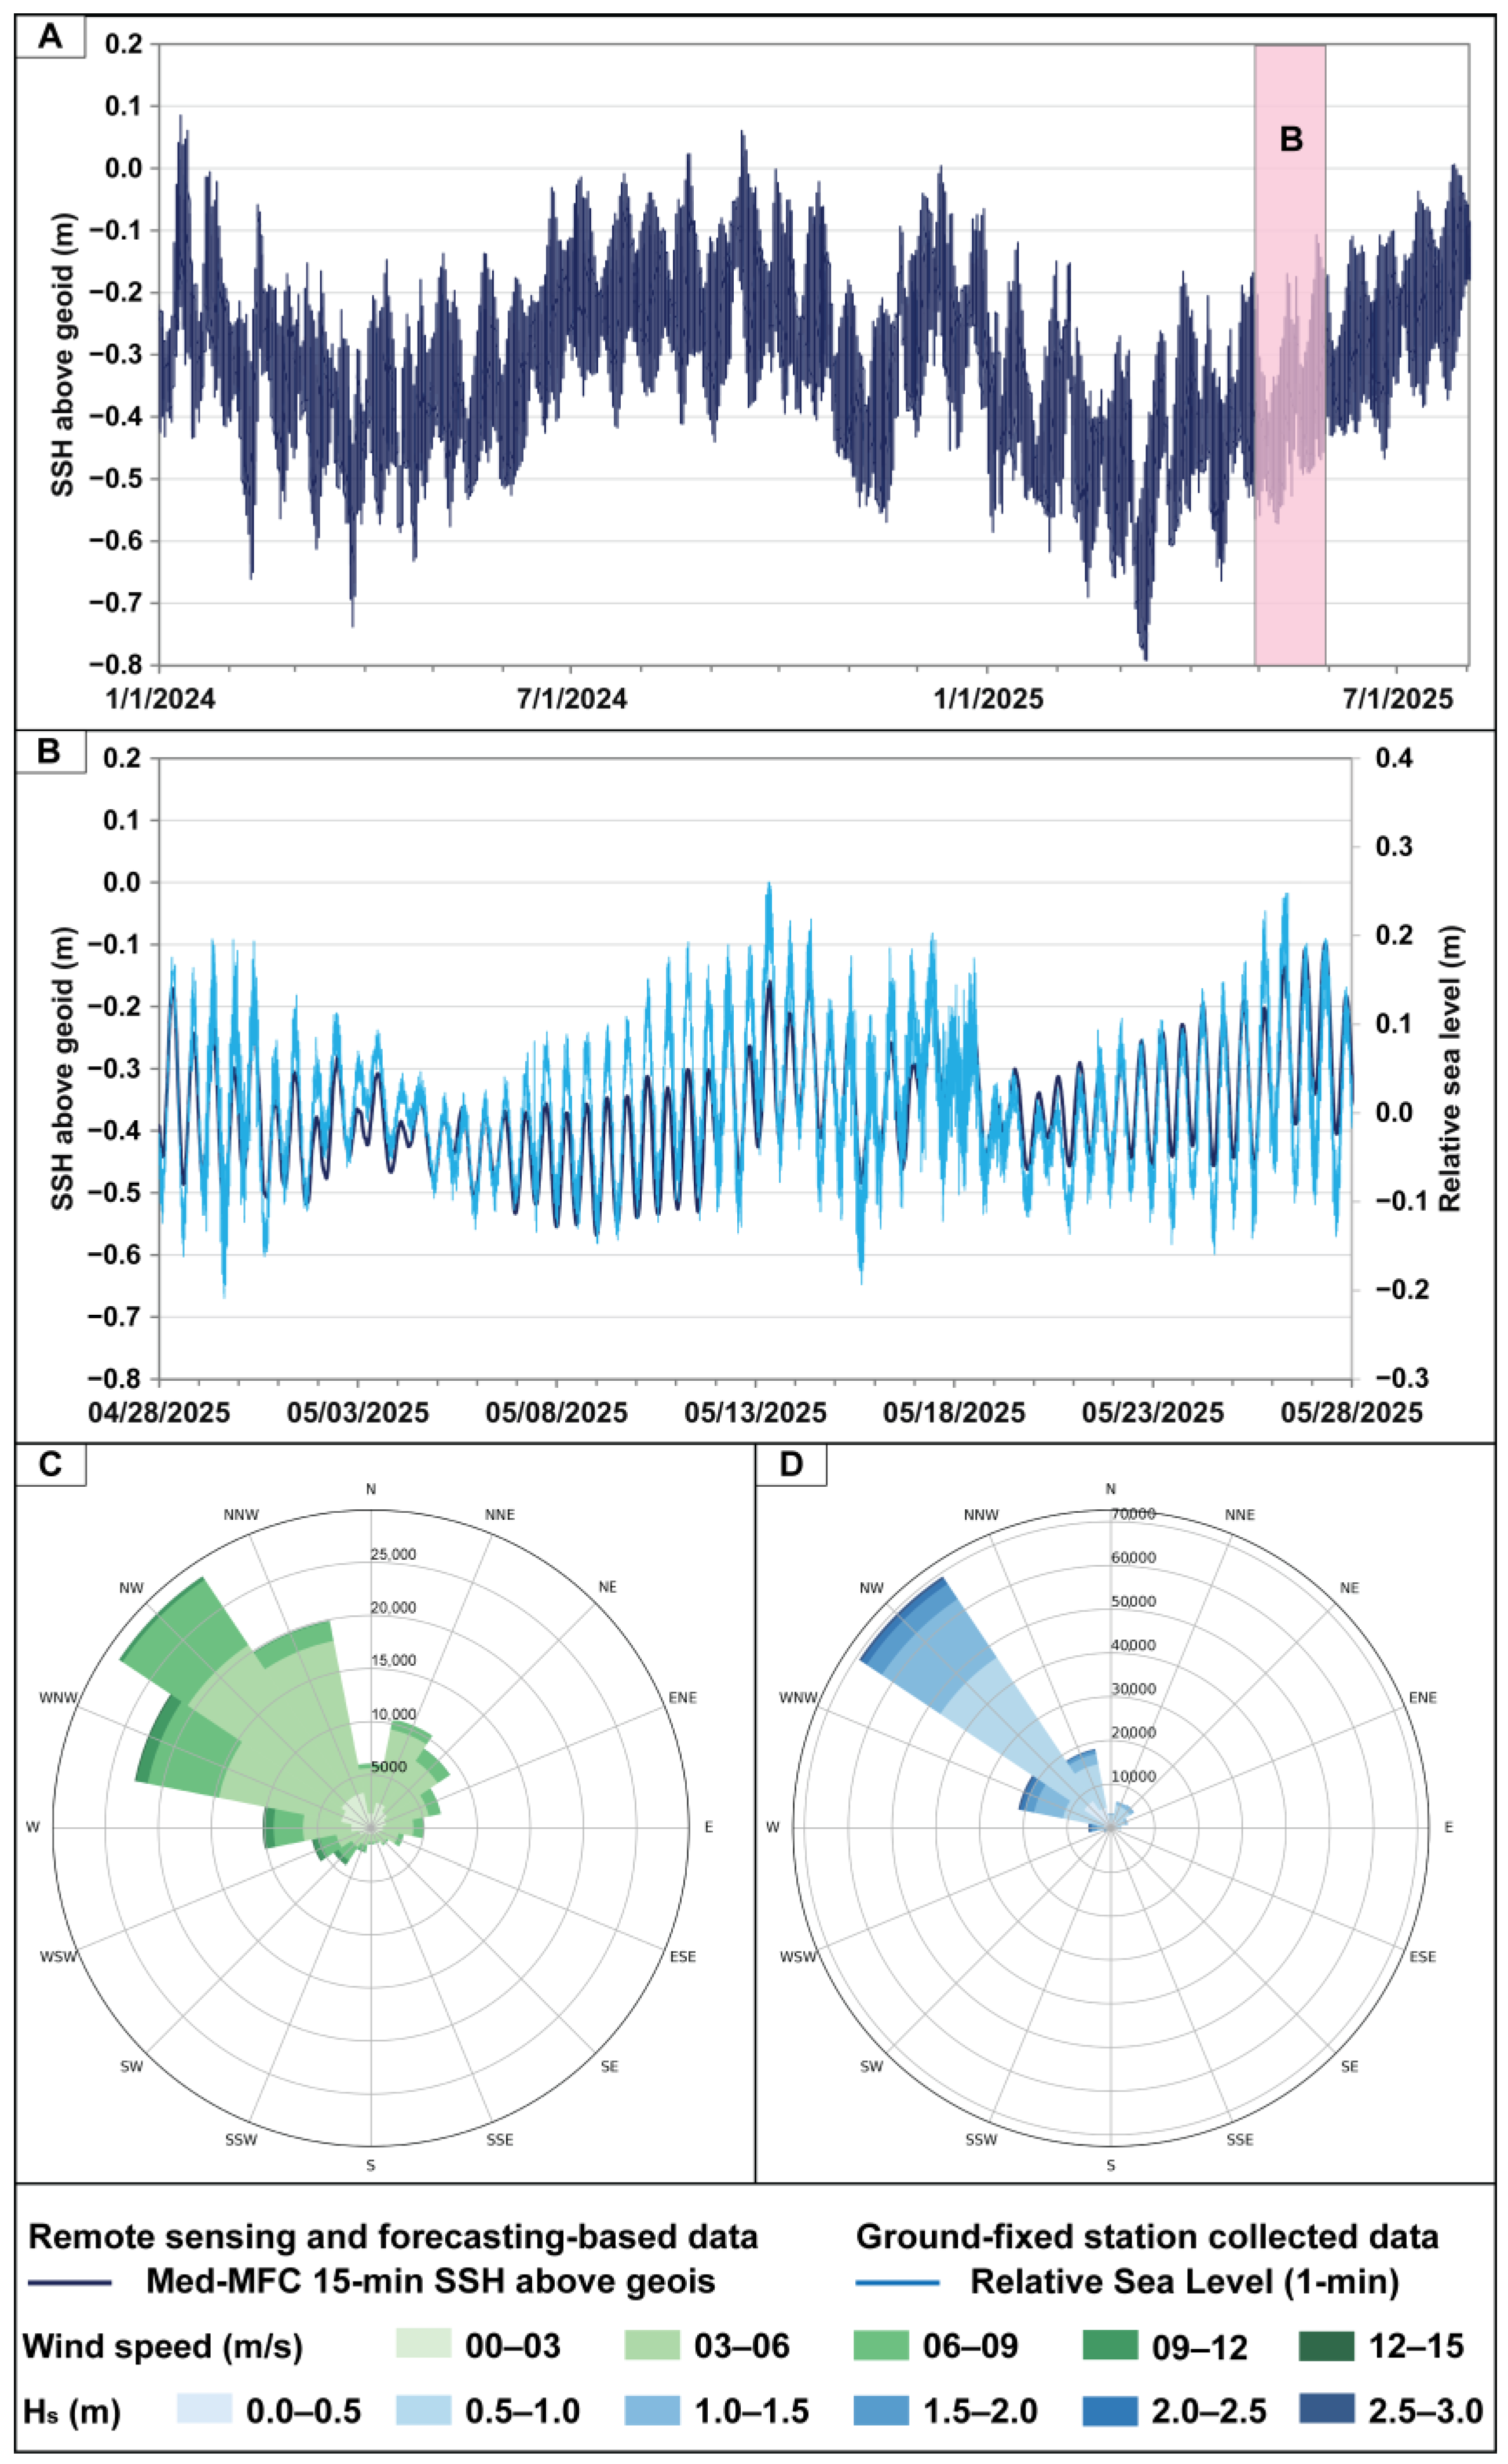
Water surface elevation (WSE) data, representing relative sea level variations over a lunar month, were obtained from two complementary sources (Figure 3A,B). The first is in situ measurements: high-frequency water-level data were collected from the National Institute of Oceanography and Fisheries (NIOF) station in Alexandria, Egypt (31°12′44.9634″ N, 29°53′7.101″ E). This operational station, equipped with a primary water-level sensor, recorded data at a 1 min sampling rate, providing precise tidal and sea level information for the region. The second is Remote Sensing and Forecasting Data: Additional WSE data, at point 31°31′53.31″ N, 32°10′48.64″ E, were derived from the Copernicus Mediterranean Forecasting Centre (Med-MFC) dataset, covering 1 January 2024 to 1 July 2025, with a spatial resolution of 0.042° × 0.042° and temporal resolution ranging from 15min to monthly, including sea surface height above geoid (SSH) and de-tided SSH [42] (Figure 3A). These data were validated against the Alexandria station, showing a strong Pearson correlation coefficient (r = 0.916) and a root mean square error (RMSE) of 6.738 cm with quality-controlled coastal observations, indicating satisfactory predictive accuracy for the representative fair-weather conditions under which the hydrodynamic simulations were conducted [43,44]. The integrated datasets support accurate hydrodynamic modeling of Manzala Lagoon’s water exchange with the Mediterranean (Figure 3A,B).

2.1.3. Climate Data

Wind and wave data were obtained from the ERA5 reanalysis dataset (ECMWF, 2025) for the point 31°31′53.31″ N, 32°10′48.64″ E, covering the period 1975–2024 with a 3-hourly temporal resolution. These data, including wind speed, direction, significant wave height ( H s ), wave direction, and peak wave period ( T p ), were used to generate classified wind rose and wave rose diagrams (Figure 3C,D), quantifying mean wind speeds and dominant wave conditions for hydrodynamic modeling. The reliability of ERA5 data was validated against in situ observations, ensuring robust boundary conditions for CMS simulations [45,46,47,48].

2.1.4. Bathymetry Data

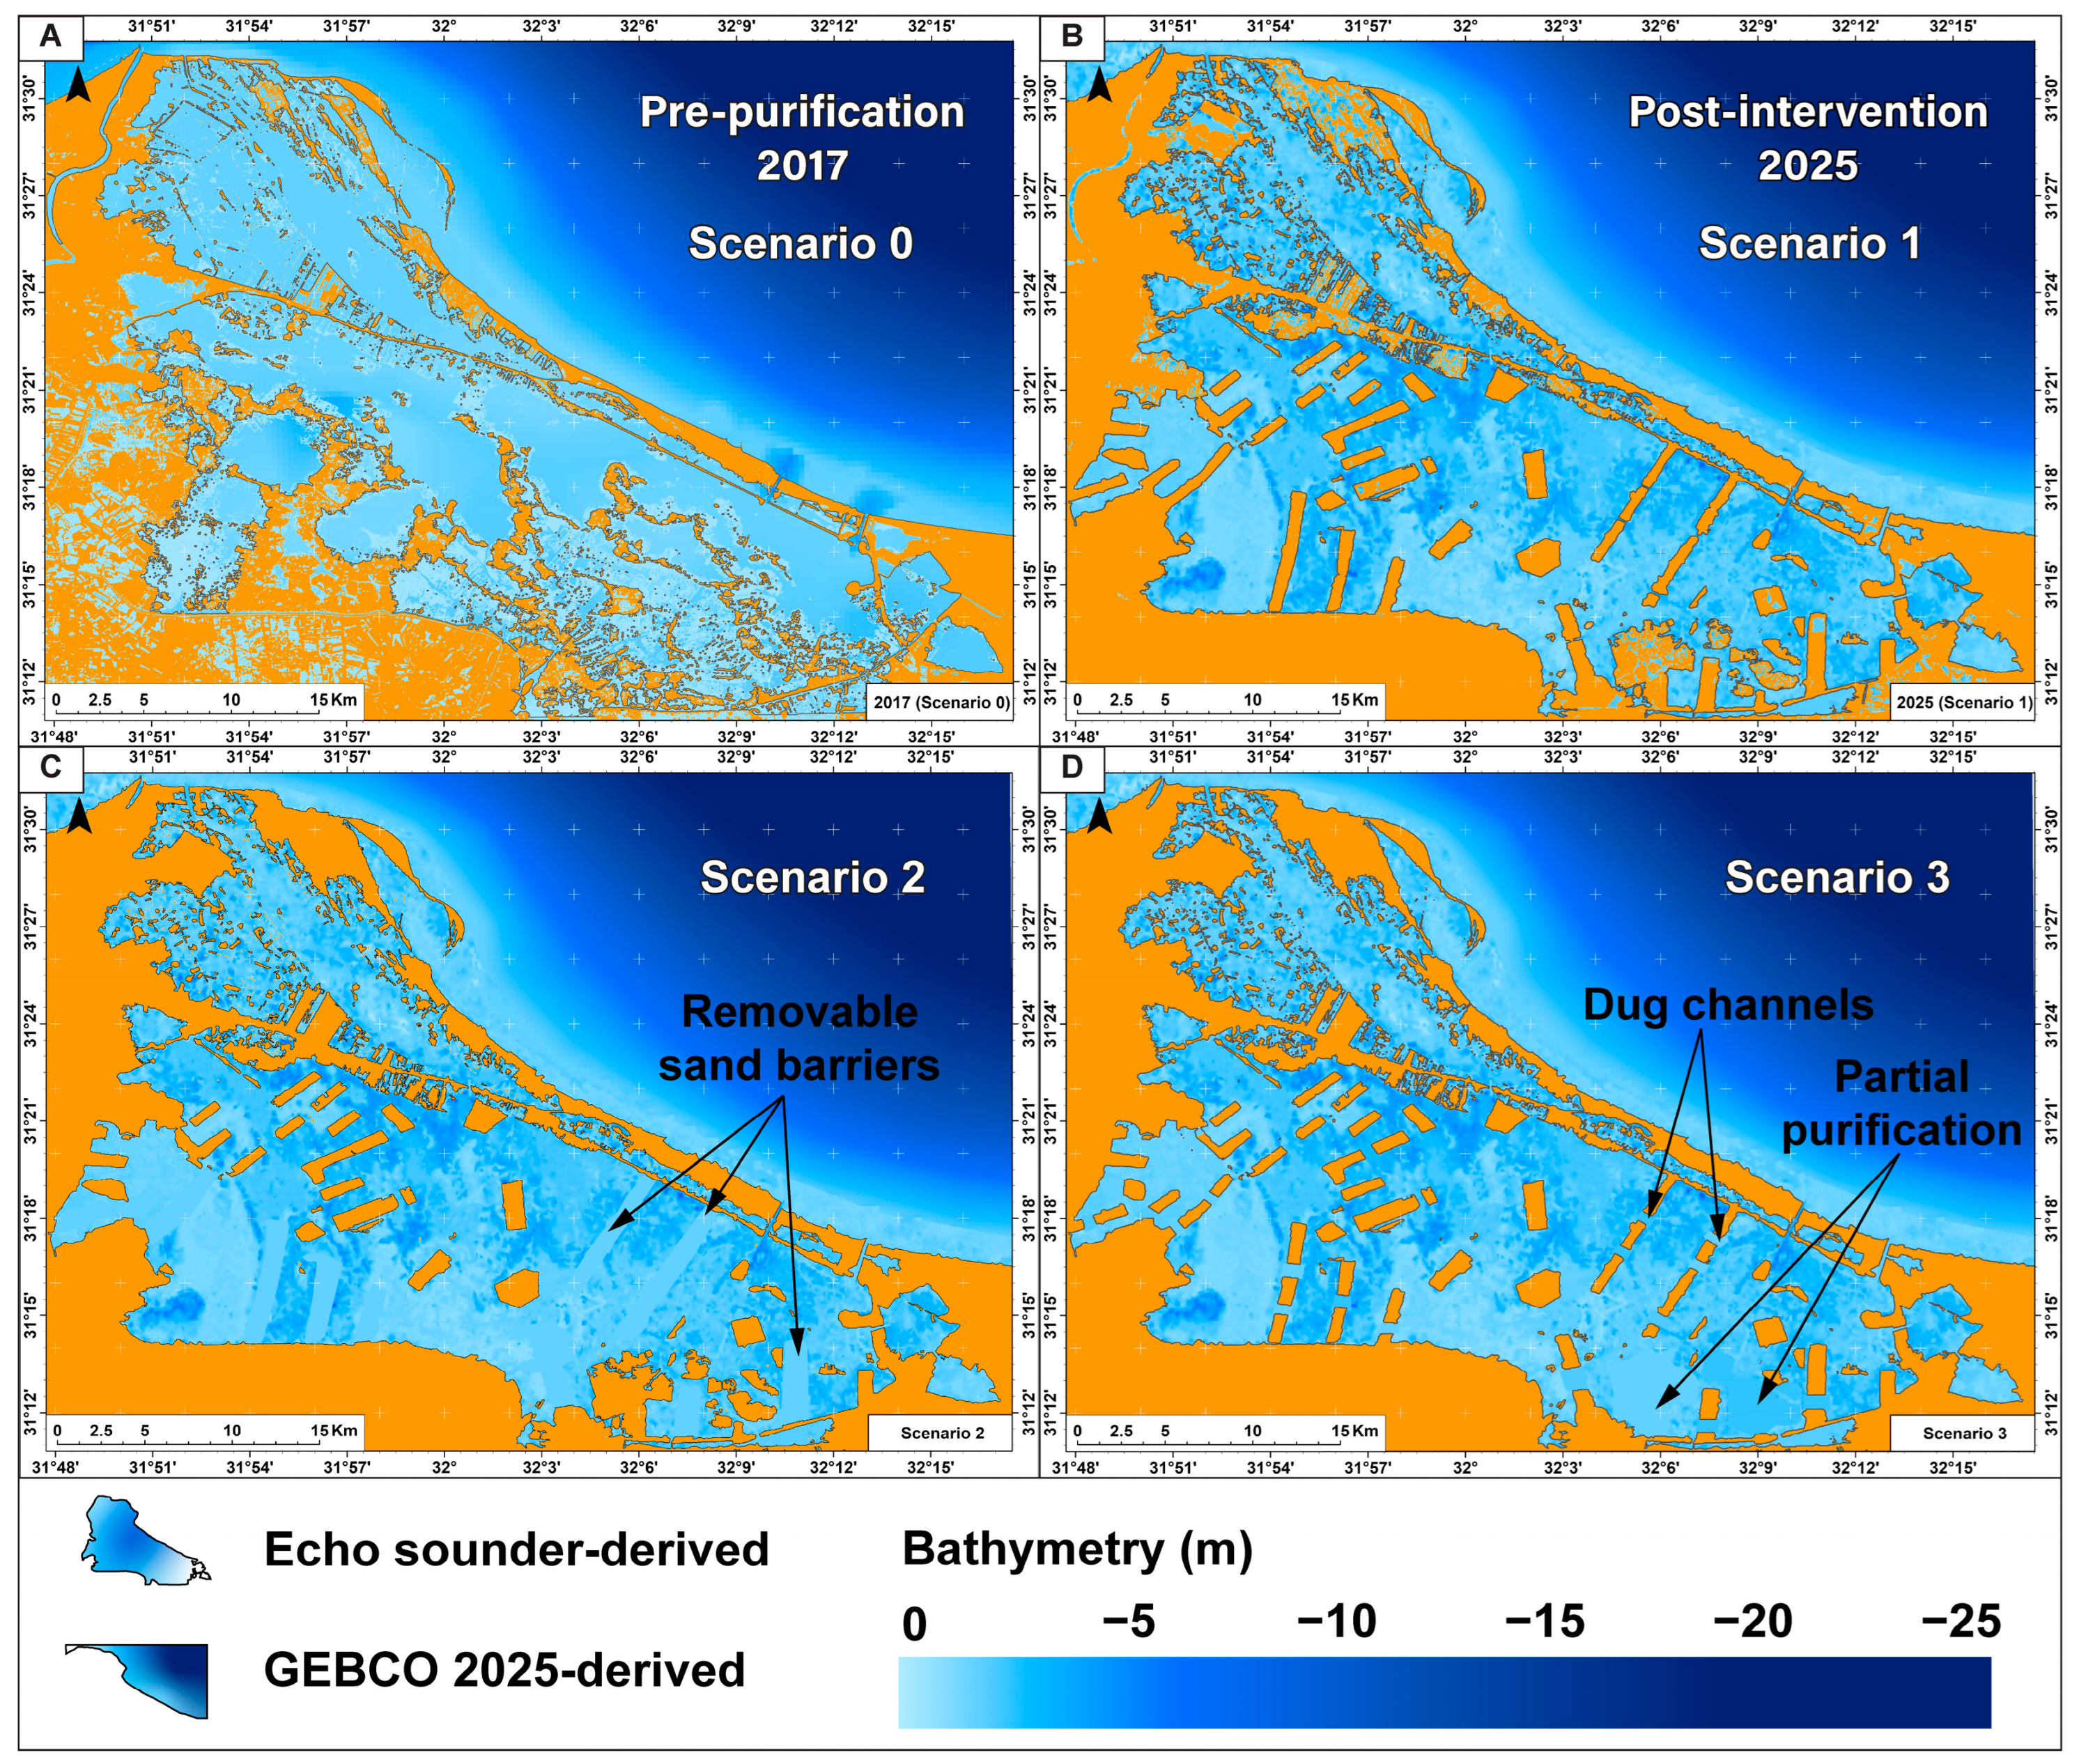
Historical bathymetric data for Manzala Lagoon, representing pre-purification conditions (2017, Scenario 0), were sourced from published studies [14,49], indicating maximum depths of 2 m and over 80% of the lagoon shallower than 1 m due to sediment infilling (Figure 4A). Recent bathymetric data were collected in March 2025 using a Hydrotrac II single-frequency echo sounder (Odom Hydrographic Systems, Baton Rouge, LA, USA), georeferenced with an RTK GNSS system (SOKKIA GRX2) featuring a base station for real-time corrections and a mobile unit on the survey vessel for precise positioning, yielding a high-resolution depth model with post-intervention depths of 3–4 m in key areas (Figure 4B). Vertical accuracy of the 2025 Hydrotrac II single-beam survey was ±8–13 cm in open-water areas as determined from repeated transects and RTK-GNSS control points. Sensitivity tests in CMS-Flow showed that even a conservative uniform depth perturbation of ±15 cm produced <5% change in basin-averaged current velocity and <2% change in tidal range across all scenarios in the western sector of the lagoon.
Offshore bathymetry for the adjacent Mediterranean Sea was obtained from the GEBCO dataset [50], enabling representation of water exchange through the El-Gamil inlets. These integrated datasets formed a comprehensive bathymetric model for hydrodynamic simulations using CMS-Wave and CMS-Flow [29,32].

2.2. Methods

2.2.1. Field Work Investigations

Field investigations were conducted to monitor the resurgence of aquatic vegetation, particularly water hyacinth, which is currently the fastest-spreading floating plant in the lagoon following the restoration project, and to validate NDVI-derived assessments, as well as to identify areas of water stagnation for comparison with hydrodynamic modeling results (Figure 2C,D). The fieldwork included measurements of electrical conductivity (EC) and salinity to evaluate water exchange with the sea, with the results compared against historical datasets. Additionally, bottom sediment samples were collected to characterize sediment properties and assess their influence on hydrodynamic conditions.

2.2.2. Hydrodynamic Modeling

To unravel the intricate hydrodynamic behavior and water circulation patterns within Manzala Lagoon, this study employed the CMS, a robust, process-based numerical framework developed by the U.S. Army Corps of Engineers. CMS is widely recognized for its capability to simulate coupled hydrodynamics, wave transformation, sediment transport, and morphodynamic evolution in both coastal and lacustrine environments [26,29,32,35,51,52,53]. A detailed description of the CMS-Wave and CMS-Flow governing equations, numerical schemes, and model configuration is provided in Appendix A.
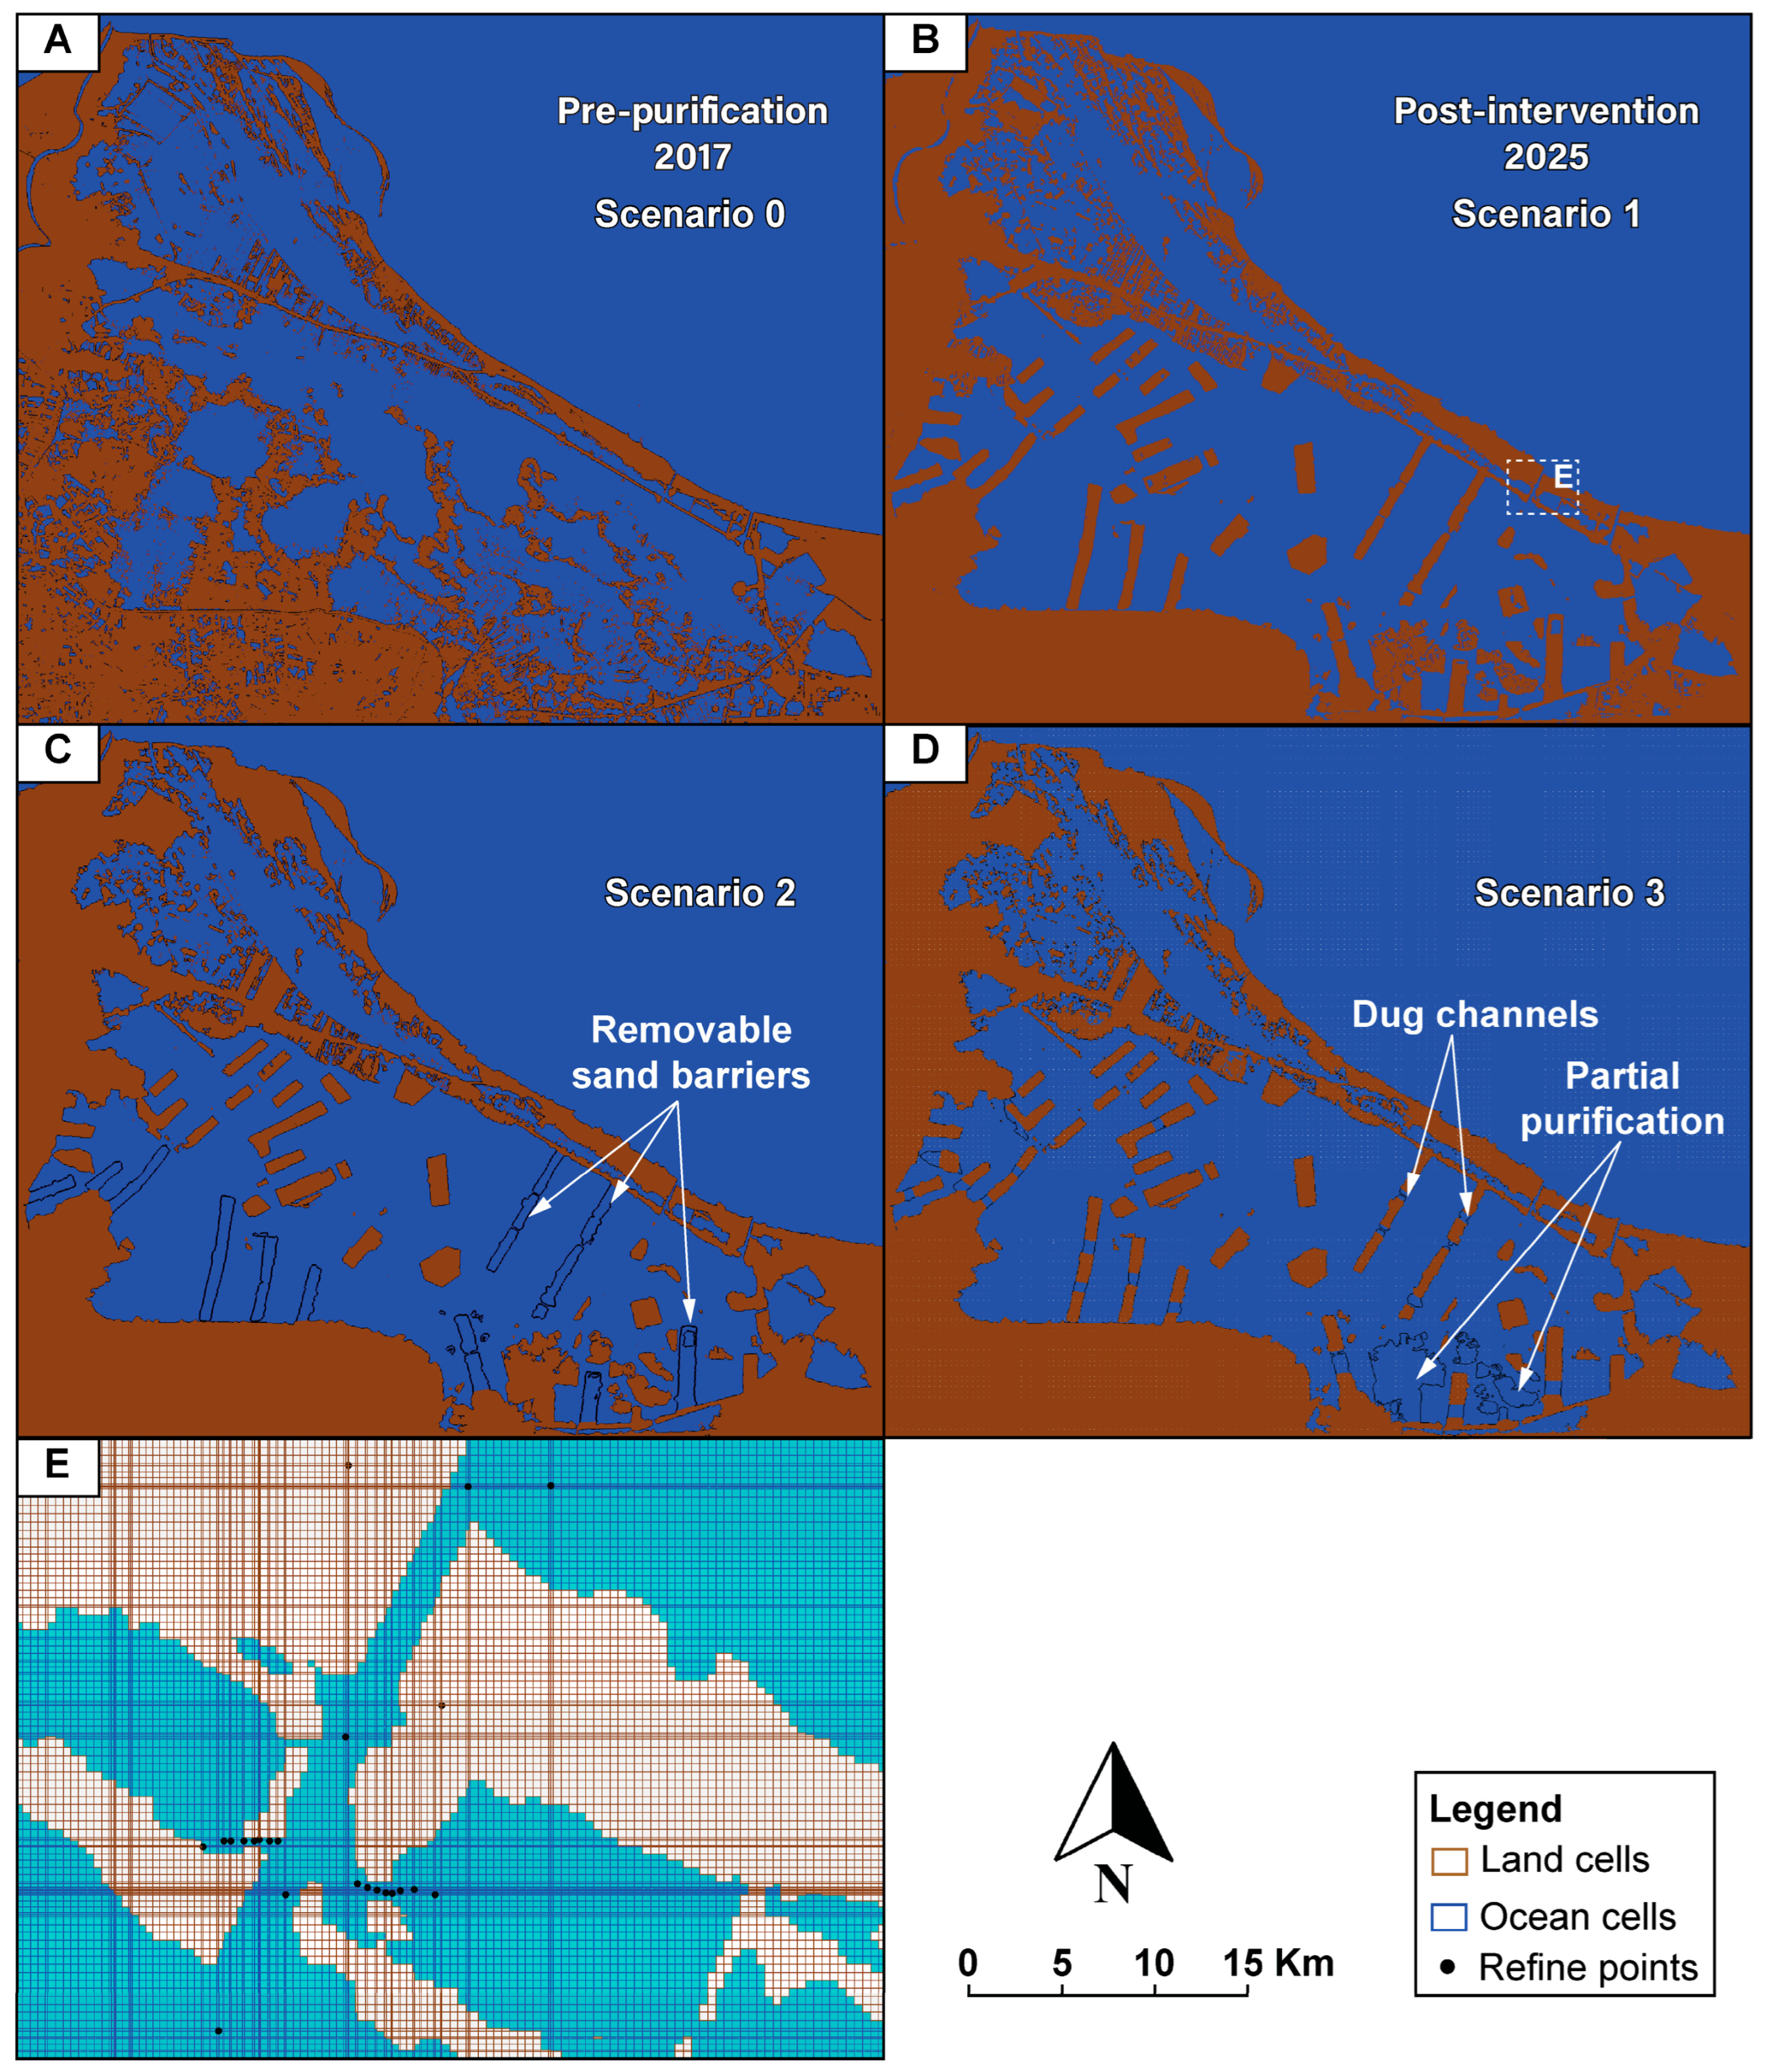
In the current study, the CMS framework was implemented within the Aquaveo Surface-water Modeling System (SMS), version 13.4.4. The computational domain was discretized into a Cartesian grid covering ≈1885 km2, capturing the lagoon and its adjoining marine zone. The grid employed variable spatial resolution, from 5 m × 5 m along critical inlets and narrow passages (e.g., El-Gamil-1) to 30 m × 30 m across open lagoon and offshore areas, accurately capturing flow pathways and shoreline complexity (Figure 5; Appendix A).
The CMS-Wave simulations were conducted under moderate environmental conditions derived from the ERA5 dataset (model formulation and spectral wave solution are described in Appendix A) at the specified coordinate. For simulation consistency, wind and wave direction were applied from N315°, with wind speed of 5 m/s and H s of 1 m, representing the prevailing low-energy conditions observed in the ERA5 dataset, where wind speeds of ≈5 m/s, with 64.8% of winds originating from the northwest (N–W), ≈86% of waves have H s ≤ 1 m and 72.55% of waves originate from WNW–NNW directions (Figure 3C,D). The wave spectrum was defined using a JONSWAP-type formulation with a peak wave period T p of 4.46 s, peak enhancement factor γ = 2, and directional spreading coefficient n = 2, applied at the offshore boundary consistent with the ERA5-derived wave climatology. The Manning’s roughness coefficient (n) was set to 0.02, informed by field-collected bottom sediment samples obtained during the March 2025 survey campaign, which characterized the lagoon bed as predominantly fine sand to silty sediments. This value is consistent with the reference ranges established by Chow [54] for fine-grained shallow water bodies, and is further supported by the near-absence of benthic vegetation across the lagoon bed, a condition attributable to the extensive dredging operations carried out between 2017 and 2022, which left the substrate largely unvegetated at the time of survey. Zones of dense water hyacinth coverage, which would warrant a substantially higher effective n, were treated as morphological boundaries rather than active flow zones in the model domain and were therefore excluded from the roughness parameterization. Tidal boundary conditions were imposed using the Med-MFC WSE curve shown in Figure 3A. CMS-Flow simulations were run with a fixed time step of 600 s over a simulation period of 30 days, representing one full lunar tidal cycle, with a ramp duration of 24 h applied at the start of each simulation to gradually introduce forcing conditions and ensure numerical stability.
Subsequent CMS-Flow simulations were fully coupled with CMS-Wave outputs, integrating the same wind and wave conditions along with WSE variations derived from Med-MFC and NIOF Alexandria in situ measurements (Figure 3A). This coupled modeling approach enabled a detailed and coherent analysis of tide- and wave-induced current dynamics across the lagoon under different hydrodynamic scenarios, providing a physically consistent representation of circulation patterns and water exchange between the lagoon and the Mediterranean Sea.
Model performance was qualitatively validated by comparing simulated circulation patterns against observed salinity and electrical conductivity gradients, locations of recurrent vegetation resurgence, and satellite-observed algal bloom extent (Figure 1 and Figure 2). In addition, the simulated hydrodynamic patterns for the pre-restoration configuration were compared qualitatively with previously published numerical simulations of Manzala Lagoon, particularly the CMS-based results reported by Elshemy et al. [55], which showed similar circulation patterns. The coupled CMS accurately reproduced the observed east–west salinity gradient, quasi-eddy recirculation between barriers, and near-stagnant zones in the southwestern sector. It is acknowledged that direct validation against field-measured current velocities or discharge rates was not feasible in this study owing to logistical constraints and the absence of concurrent in situ velocity measurements within the lagoon. This represents an inherent limitation of the present modeling exercise, which future studies should address through dedicated current meter deployments or acoustic Doppler current profiler (ADCP) surveys.
A sensitivity analysis carried out at the entrances of the two El-Gamil inlets in the eastern sector using different grid sizes (uniform 15 × 15 m and 40 × 40 m meshes) revealed only minor differences (<6%) in basin-scale current magnitude and tidal range. Despite these small variations, this sensitivity to grid resolution is noted as one of the inherent limitations of the model. Although CMS is limited to a maximum grid size of 2500 × 2500 cells, the adopted variable-resolution strategy (5 × 5 m at inlets and channels, up to 30 × 30 m in open areas) efficiently resolved critical narrow passages while maintaining computational stability. These tests confirm that the primary circulation features and scenario comparisons are robust with respect to grid resolution and bathymetric uncertainty, under the representative fair-weather forcing conditions applied uniformly across all scenarios.
Two scenarios were designed to represent actual conditions and to assess the effectiveness of the recent restoration project carried out in Manzala Lagoon (2017–2022). Scenario 0 reflects the pre-purification conditions in 2017, prior to large-scale dredging and restoration operations (Figure 5A), while Scenario 1 represents the post-intervention lagoon’s conditions as of May 2025, following multiple phases of dredging and vegetation clearance (Figure 5B).
Two additional scenarios were developed to explore potential interventions aimed at improving hydrodynamic conditions and enhancing water circulation within the lagoon. Scenario 2 simulates a full restoration scenario for May 2025, assuming the complete removal of eleven man-made sand barriers (Figure 5C) that currently restrict exchange with the sea and east–west water circulation within the lagoon. Scenario 3 represents a partial restoration approach for the same period, involving selective purification of recently vegetated and silted areas combined with the excavation of artificial channels 400–500 m wide through the sand barriers (Figure 5D). This configuration seeks to balance restoration effectiveness with practical feasibility, promoting improved circulation and tidal exchange while retaining portions of the natural barrier system. The selected channel width of 400–500 m was determined iteratively through multiple modeling trials, informed by field observations confirming the hydrodynamic insufficiency of existing narrow openings (50–70 m; Figure 1) currently present within the barriers. Channel orientation and positioning were guided by established principles of tidal channel morphology, water momentum dynamics, and hydraulic efficiency [56,57,58], as well as direct field knowledge of the lagoon’s circulation patterns.

3. Results

3.1. Temporal Changes in Water Chemistry, Surface Area, and Vegetation Dynamics

Manzala Lagoon is divided by the Damietta–Port Said road into two basins, the northern triangle basin and the southern basin [13] (Figure 1 and Figure 2). The current study focuses on the southern basin extending south to 31°11′0.19″ N excluding the Manzala triangle (Figure 1 and Figure 2), distinct from the larger historical basin described by El-Asmar and Hereher [13], which previously covered 1100 km2 in 1973, reaching 873 km2 in the early 1990s (Figure 2A, 1995), and gradually decreased to 525 km2 by 2017 (Figure 2A, 2017), while the southern portion was converted to fishing farms. Analyses of Landsat imagery from 1985 to 2025 revealed a dynamic trajectory in lagoon water surface area, driven by sediment deposition, vegetation proliferation, and human interventions. The large-scale purification and dredging project implemented between 2017 and 2022 largely reversed this decline, restoring hydrological connectivity and expanding the water surface to nearly 750 km2 by 2025 (Figure 2A, 2022–2025).
Prior to the intervention, aquatic vegetation, particularly Eichhornia crassipes (water hyacinth), Azolla filiculoides, Typha domingensis, and Phragmites australis [59], had expanded extensively by 2017, clogging channels, fragmenting the lagoon into semi-isolated sub-basins, and promoting localized stagnation (Figure 2A, 2017). Following the dredging activities, vegetation cover declined sharply between 2017 and 2022, with most areas largely cleared by 2022 (Figure 2A, 2017–2022). However, remote-sensing observations and field surveys conducted in 2025 indicate a renewed proliferation of undesirable vegetation, especially water hyacinth, in semi-stagnant zones of the southwestern and southeastern sectors near the Bahr El-Baqar Drain (Figure 2C,D).
In addition to macrophyte dynamics, recurring seasonal green algal blooms were detected in the eastern sector of the lagoon during September of 2023, 2024, and 2025. These blooms extended over ≈120 km2, from the southern areas near Bahr El-Baqar Drain toward Port Said (Figure 2B, 2025), and typically developed in mid- to late September, occasionally persisting until mid-October, indicating a consistent seasonal pattern in this part of the lagoon.
Comparative analysis with data from the EEAA revealed measurable shifts in the lagoon’s hydrochemical characteristics between 2017 and 2023. Electrical conductivity in the central lagoon increased from 7.79 to 14.39 mS/cm. DO levels rose moderately from 5.8 to 6.5 mg/L, while BOD increased from 18.67 to 29.46 mgO2/L [60].
Field measurements further revealed the hydrodynamic heterogeneity within the lagoon. In the southern sector, south of Tinnis Island (31°12′17.9″ N, 32°12′06.9″ E), EC was as low as 3.3 mS/cm, with a salinity of 1.9 g/L and a pH of 9.11. This contrasts sharply with conditions in the central lagoon (31°17′49.14″ N, 32°5′40.81″ E), where EC reached 7.47 mS/cm, salinity 4.33 g/L, and pH 8.65, and near the inlets (31°17′29.07” N, 32°9′41.75″ E), where EC was 13.49 mS/cm, salinity 7.77 g/L, and pH 8.6 (Figure 1B–D).

3.2. Pre- and Post-Intervention Bathymetry and Sediment Dynamics

The bathymetry of the lagoon underwent a transformative shift following the 2017–2022 restoration project, as revealed by integrating historical data, recent echo-sounder surveys (Figure 4A,B). In 2017, pre-purification conditions showed maximum depths of ≈2 m, with over 80% of the lagoon shallower than 1 m due to extensive sediment infilling, severely restricting water circulation and navigation [14,49]. By 2025, post-intervention mapping indicated restored depths reaching nearly 4 m in key zones such as the El-Gamil inlets [21] (Figure 4B). A distinct depth gradient was established, ranging from −0.6 m in the vegetated southwestern shallows to −4.0 m near central and inlet areas, with roughly 70% of the lagoon floor lying between −0.9 m and −2.5 m (Figure 4B).
Field investigations, including bottom sediment sampling (Figure 2D), revealed notable textural contrasts relative to pre-purification conditions. In 2016, bottom sediments consisted of 36.51% sand and 63.49% silt, with an average total organic carbon (TOC) content of 3.33%. By 2023, sand content had declined to 17.47%, while silt increased to 82.53%, and TOC slightly decreased to 3.21% [60]. These observations confirmed a post-restoration project fining trend and persistent sediment heterogeneity, with finer, organic-rich deposits dominating stagnant zones and coarser sediments prevailing near active inlets (Figure 4A,B).

3.3. Hydrodynamic Simulation Results

Under fair-weather conditions applied uniformly across all modeled scenarios, ERA5 collected data points revealed mean wind speeds of ≈5 m/s, with 64.8% of winds originating from the northwest (N–W) sector. Additionally, wave simulations indicated that 86% of waves had H s between 0 and 1 m, with an average T p of 4.65 s, predominantly propagating from WNW–NNW directions, comprising 72.55% of total wave occurrences (Figure 3C,D). These wind and wave patterns provided critical boundary conditions for hydrodynamic modeling, influencing water circulation and exchange dynamics in the lagoon, with results presented as follows:

3.3.1. Wave Propagation and Attenuation Patterns

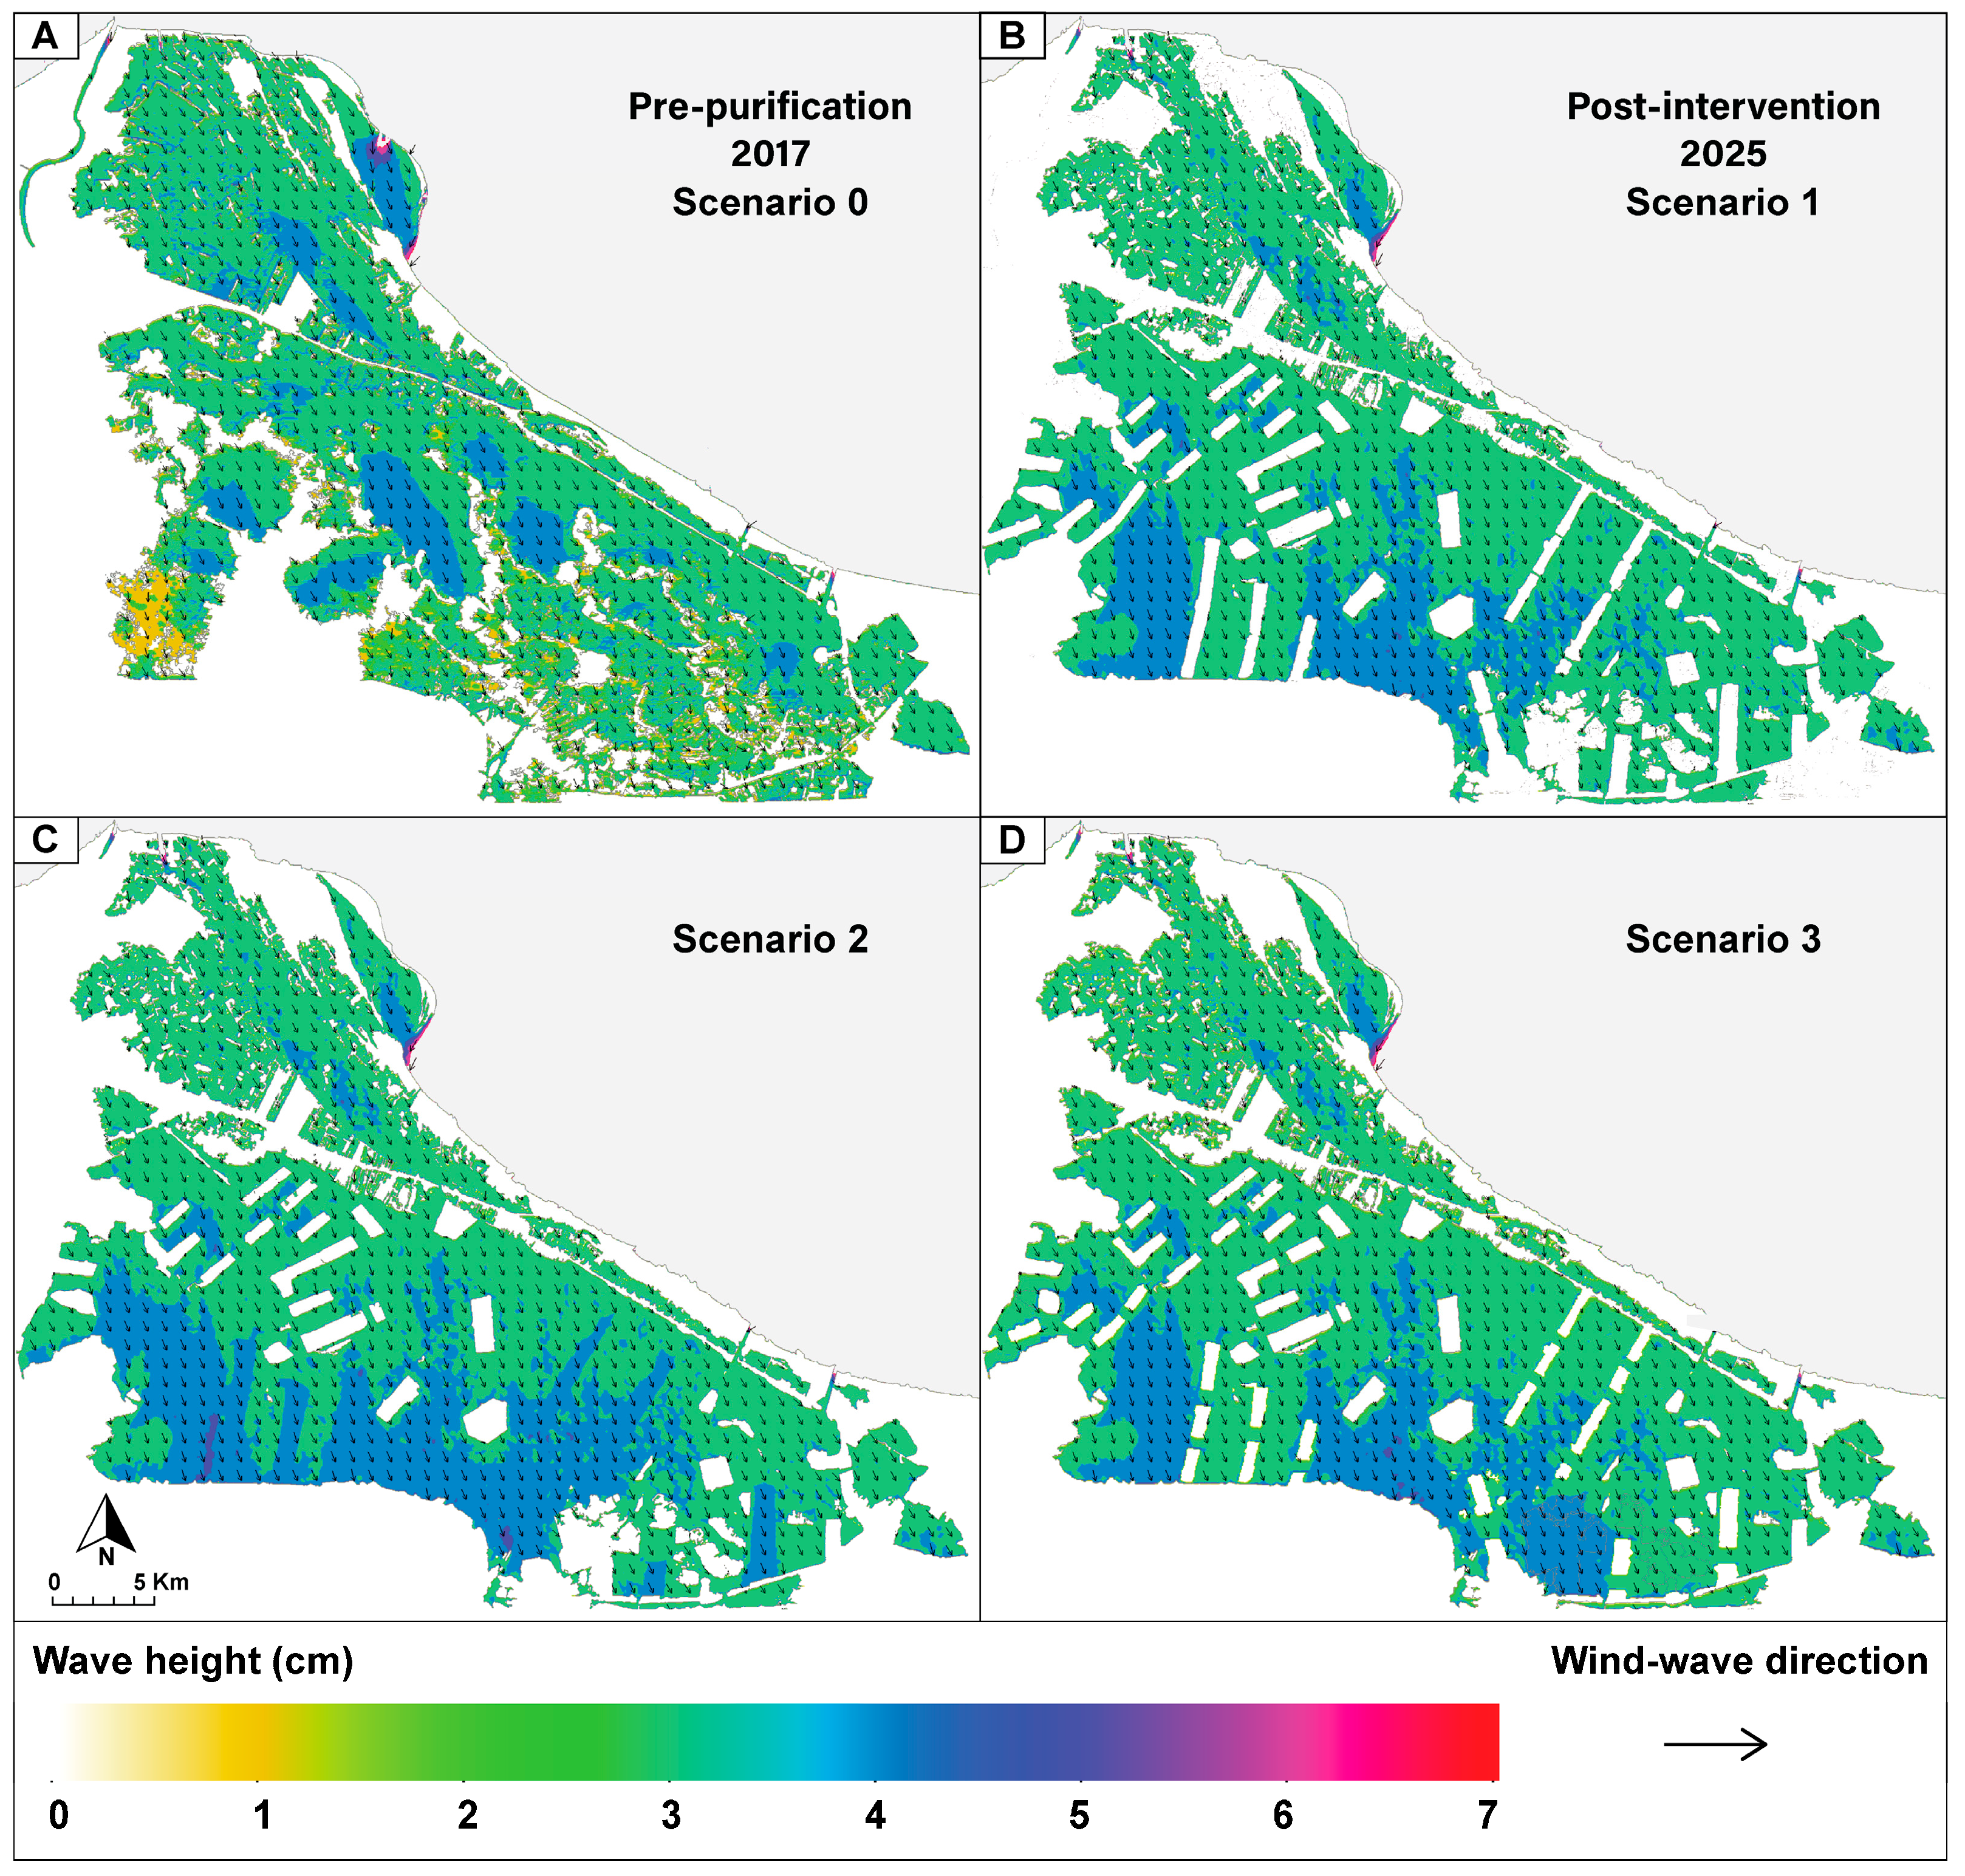
The CMS-Wave model simulations revealed that wave activity within Manzala Lagoon was generally weak, characterized by small-scale ripples with H s averaging around 3 cm (Figure 6B). Under the pre-purification condition (2017, Scenario 0), confined sub-basins exhibited minimal wave development, with H s commonly below 2 cm and seldom exceeding 0.04 m, reflecting the limited fetch and shallow depths (Figure 6A). By 2025 (Scenario 1), following the intervention, H s increased slightly, ranging between 3 cm in most areas and up to 4 cm in more open central zones where circulation had improved (Figure 6B).
In the proposed Scenario 2, simulated wave propagation intensified, with broader regions exhibiting 3–4 cm H s and localized peaks approaching 5 cm (Figure 6C). Conversely, Scenario 3, compared directly to Scenario 1 (2025), exhibited a spatial pattern largely similar, indicating that the additional structural adjustments implemented under this configuration had minimal influence on wave dynamics (Figure 6D). Overall, the spatial distribution across scenarios underscores the dominance of low-energy wave conditions within the lagoon, primarily modulated by basin openness, water depth, and connectivity to inlets (Figure 6).

3.3.2. Surface Current and Water Circulation Patterns

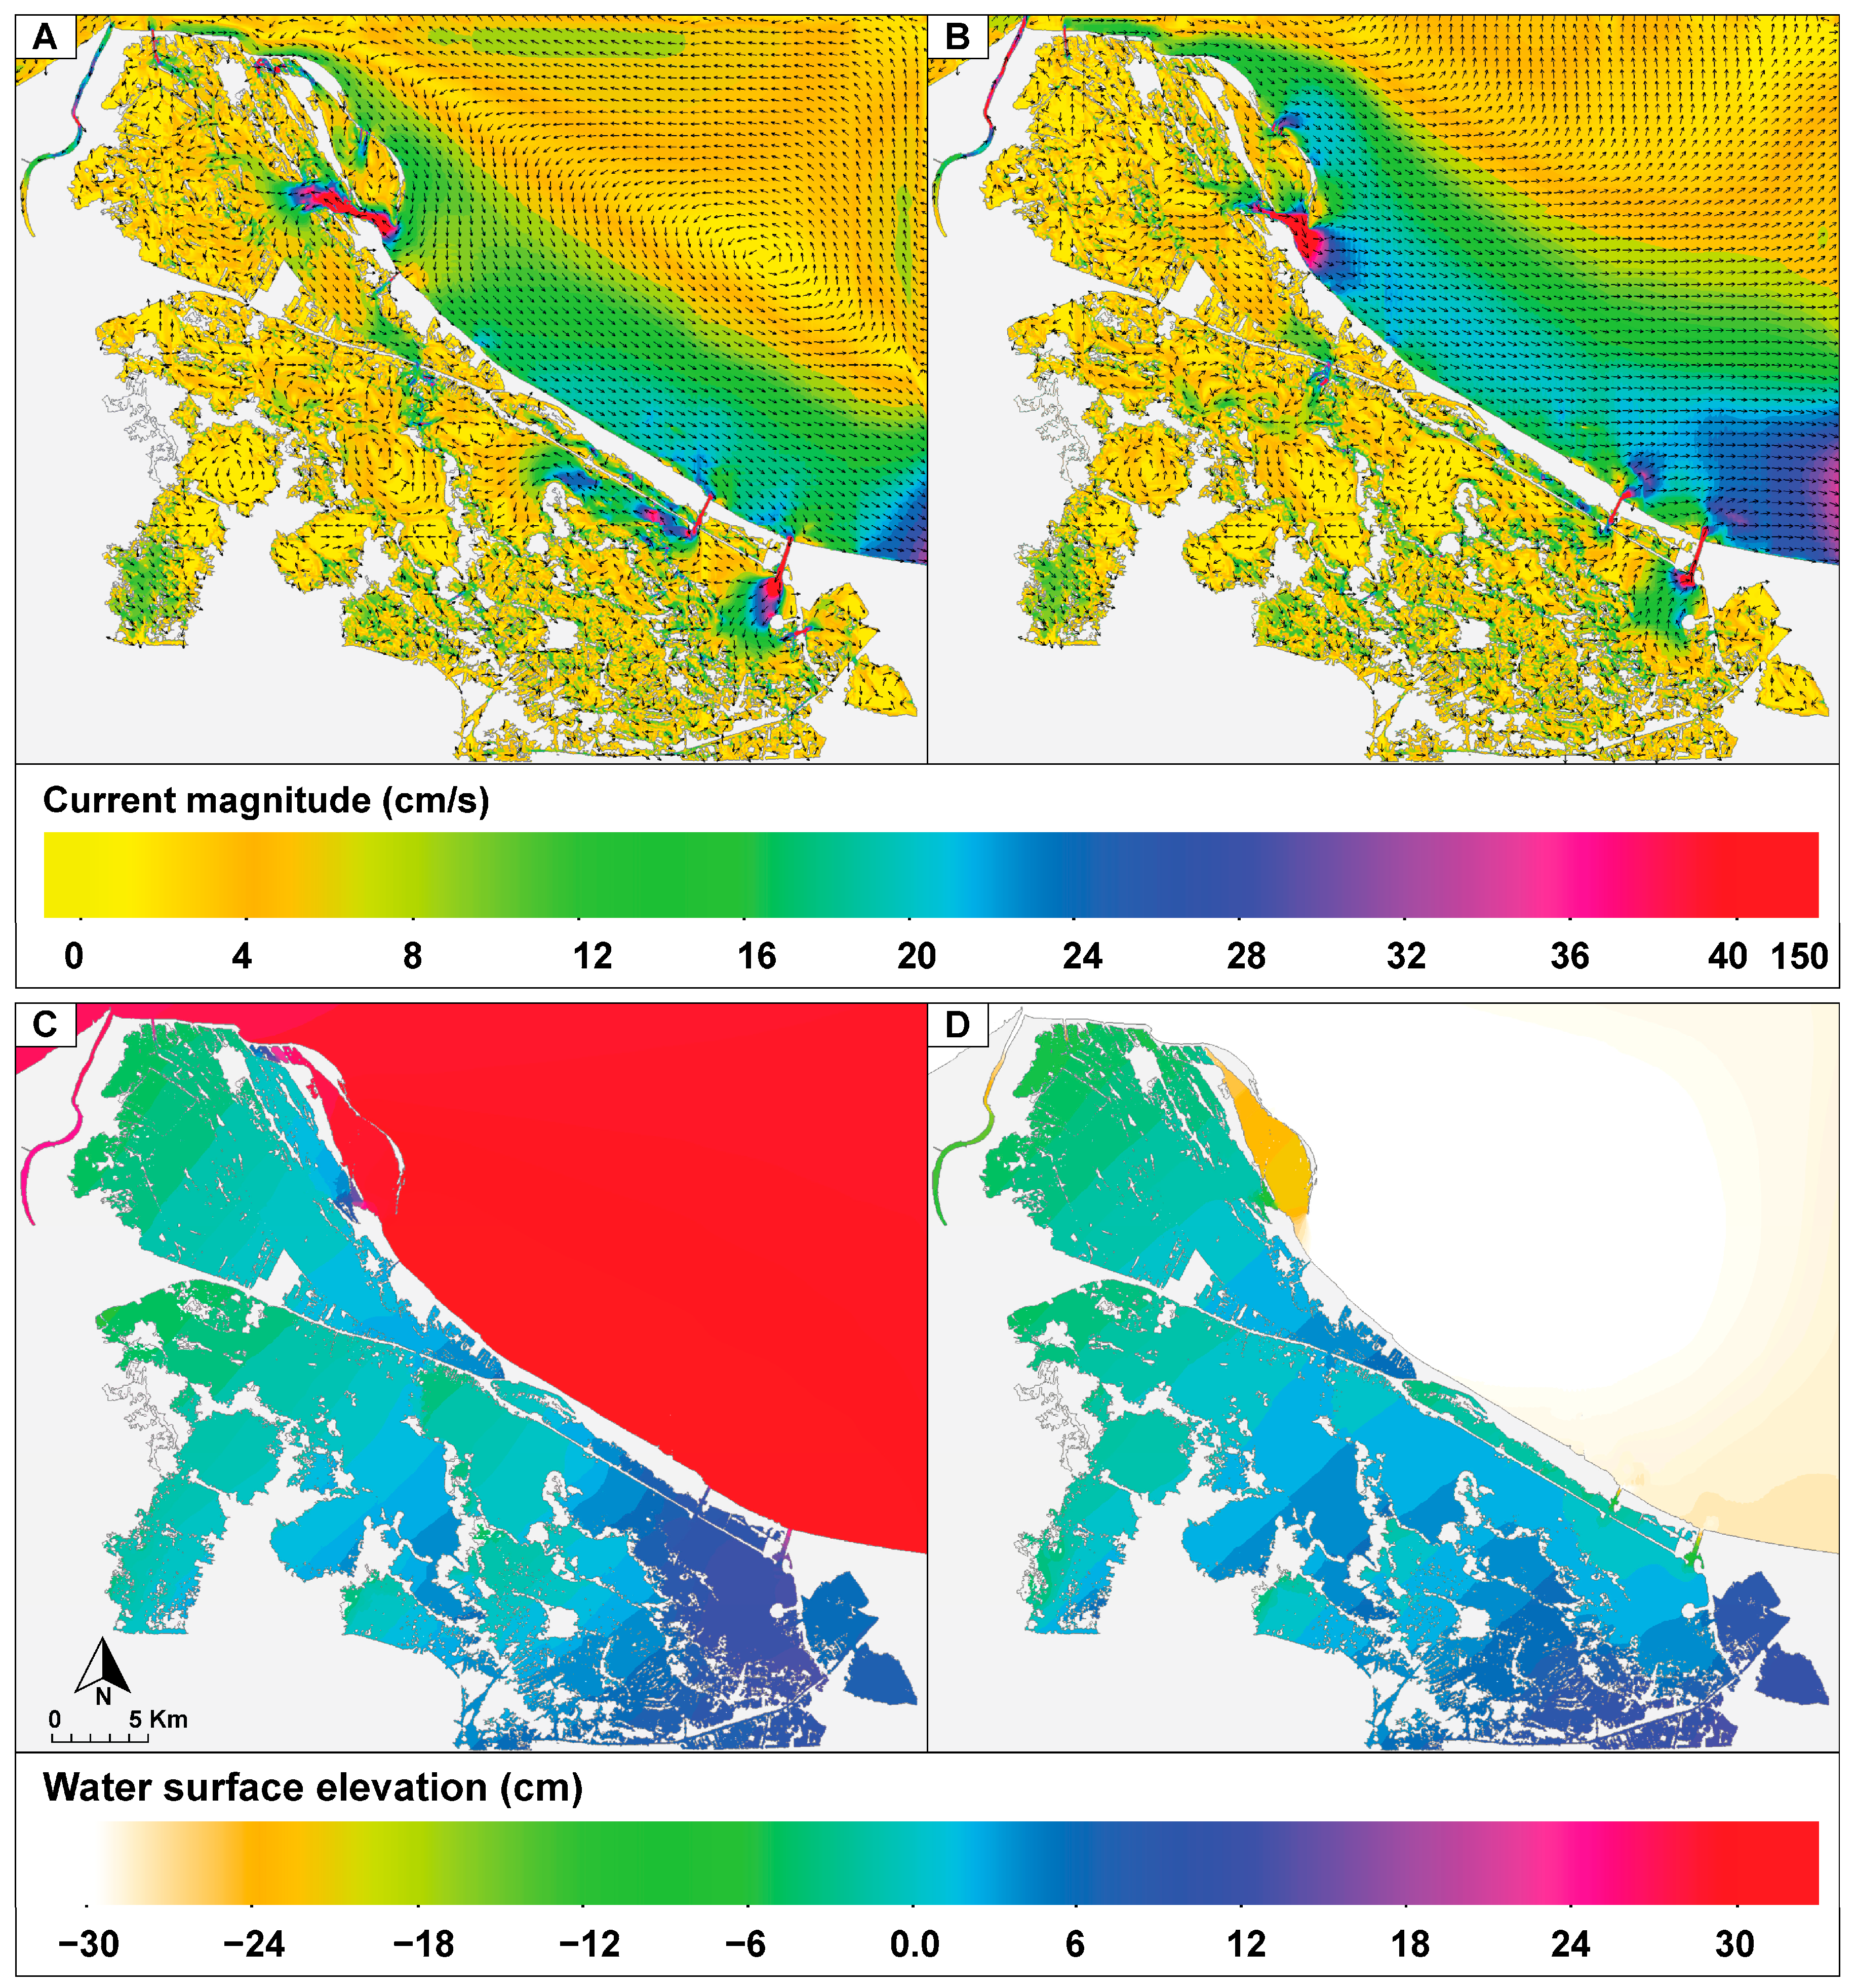
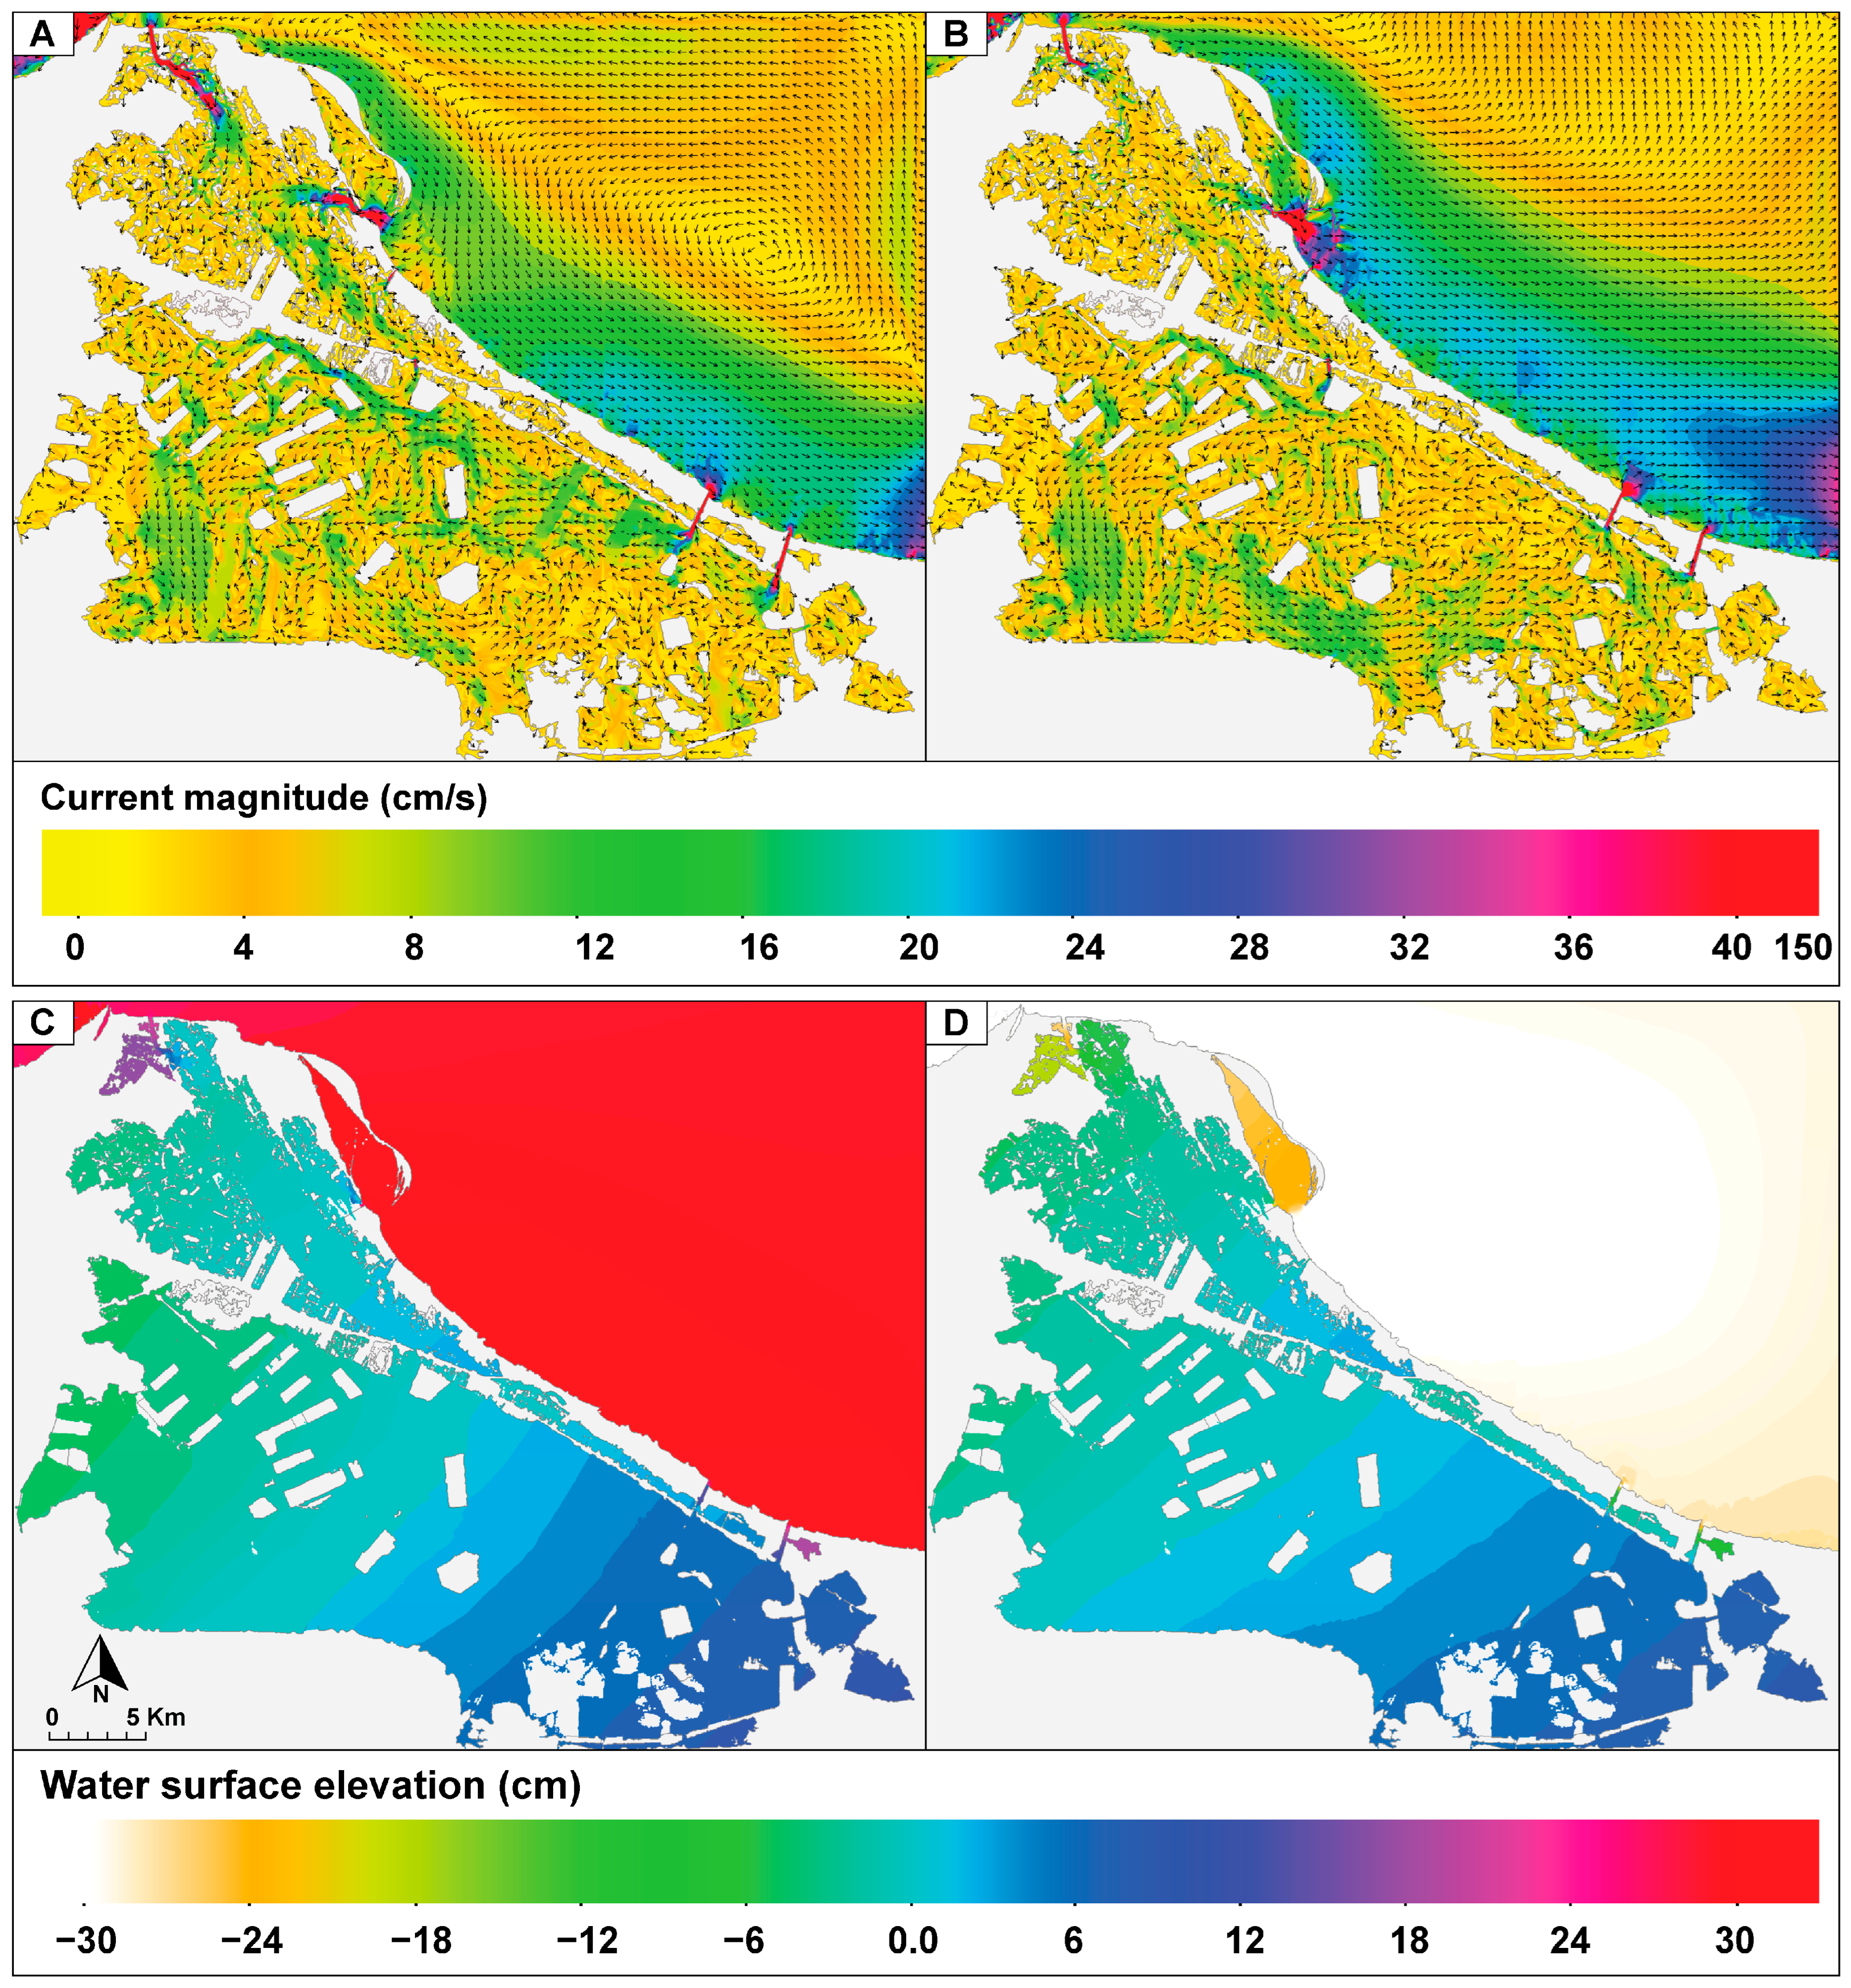
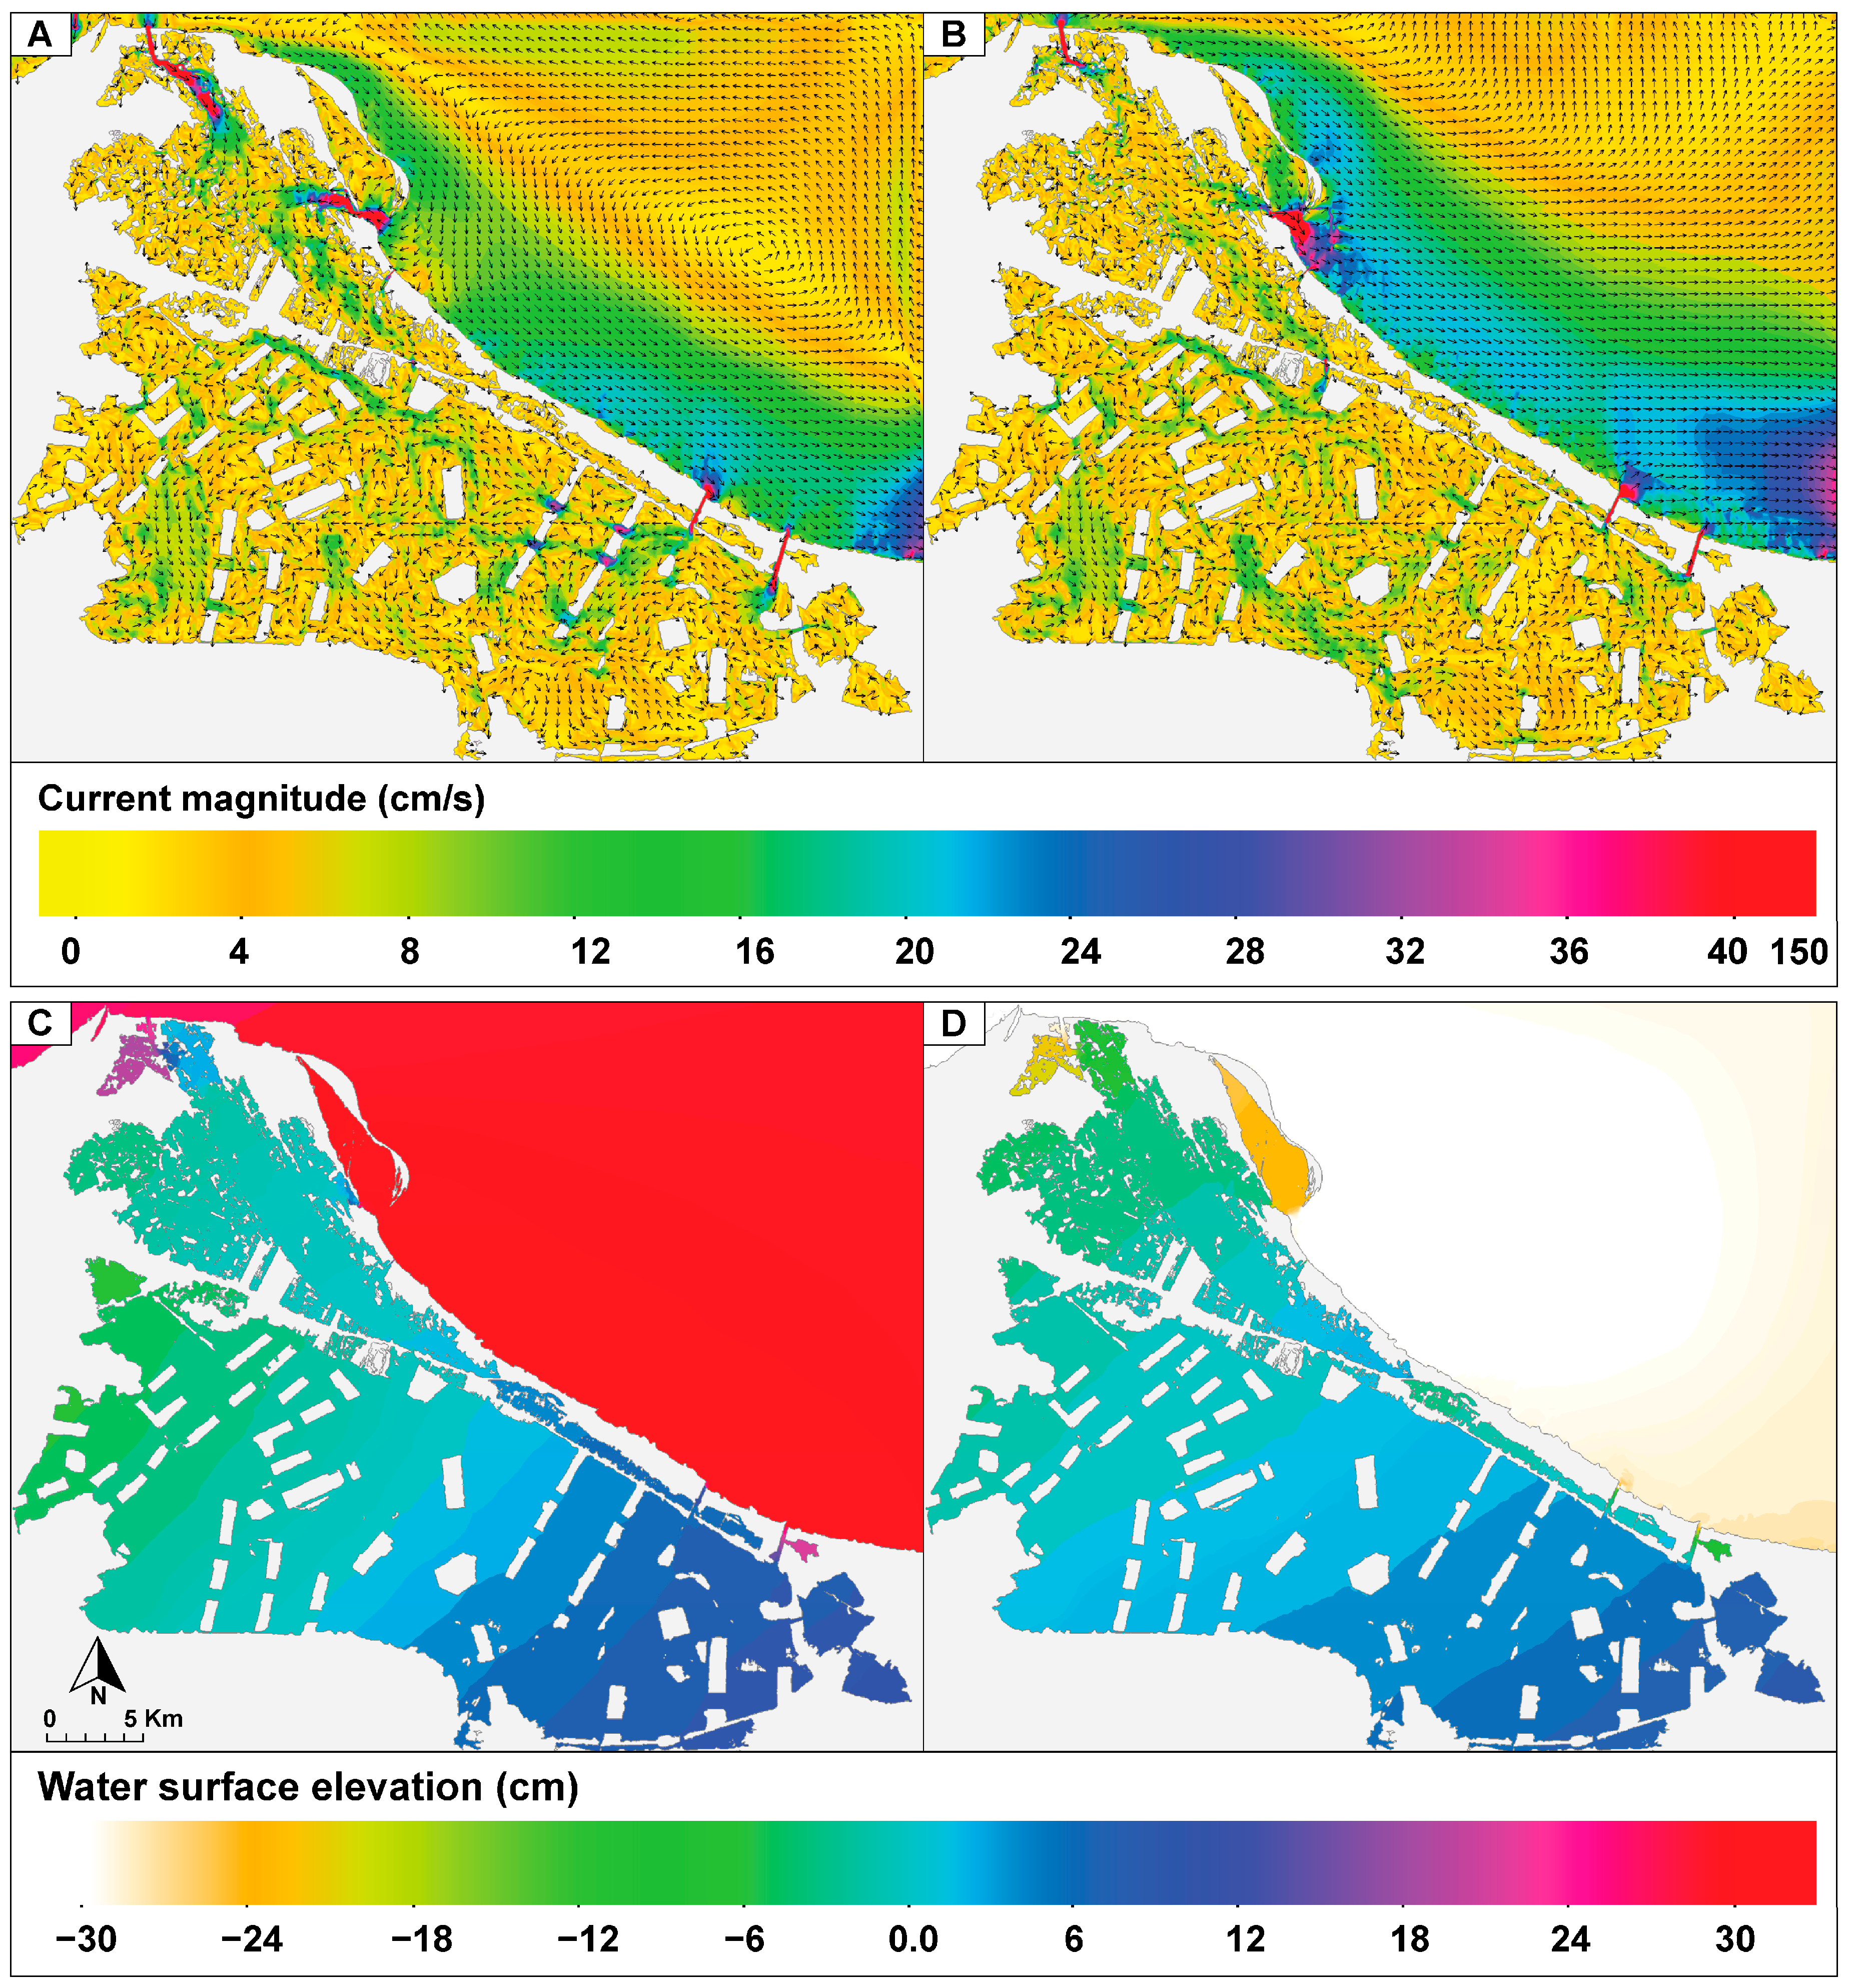
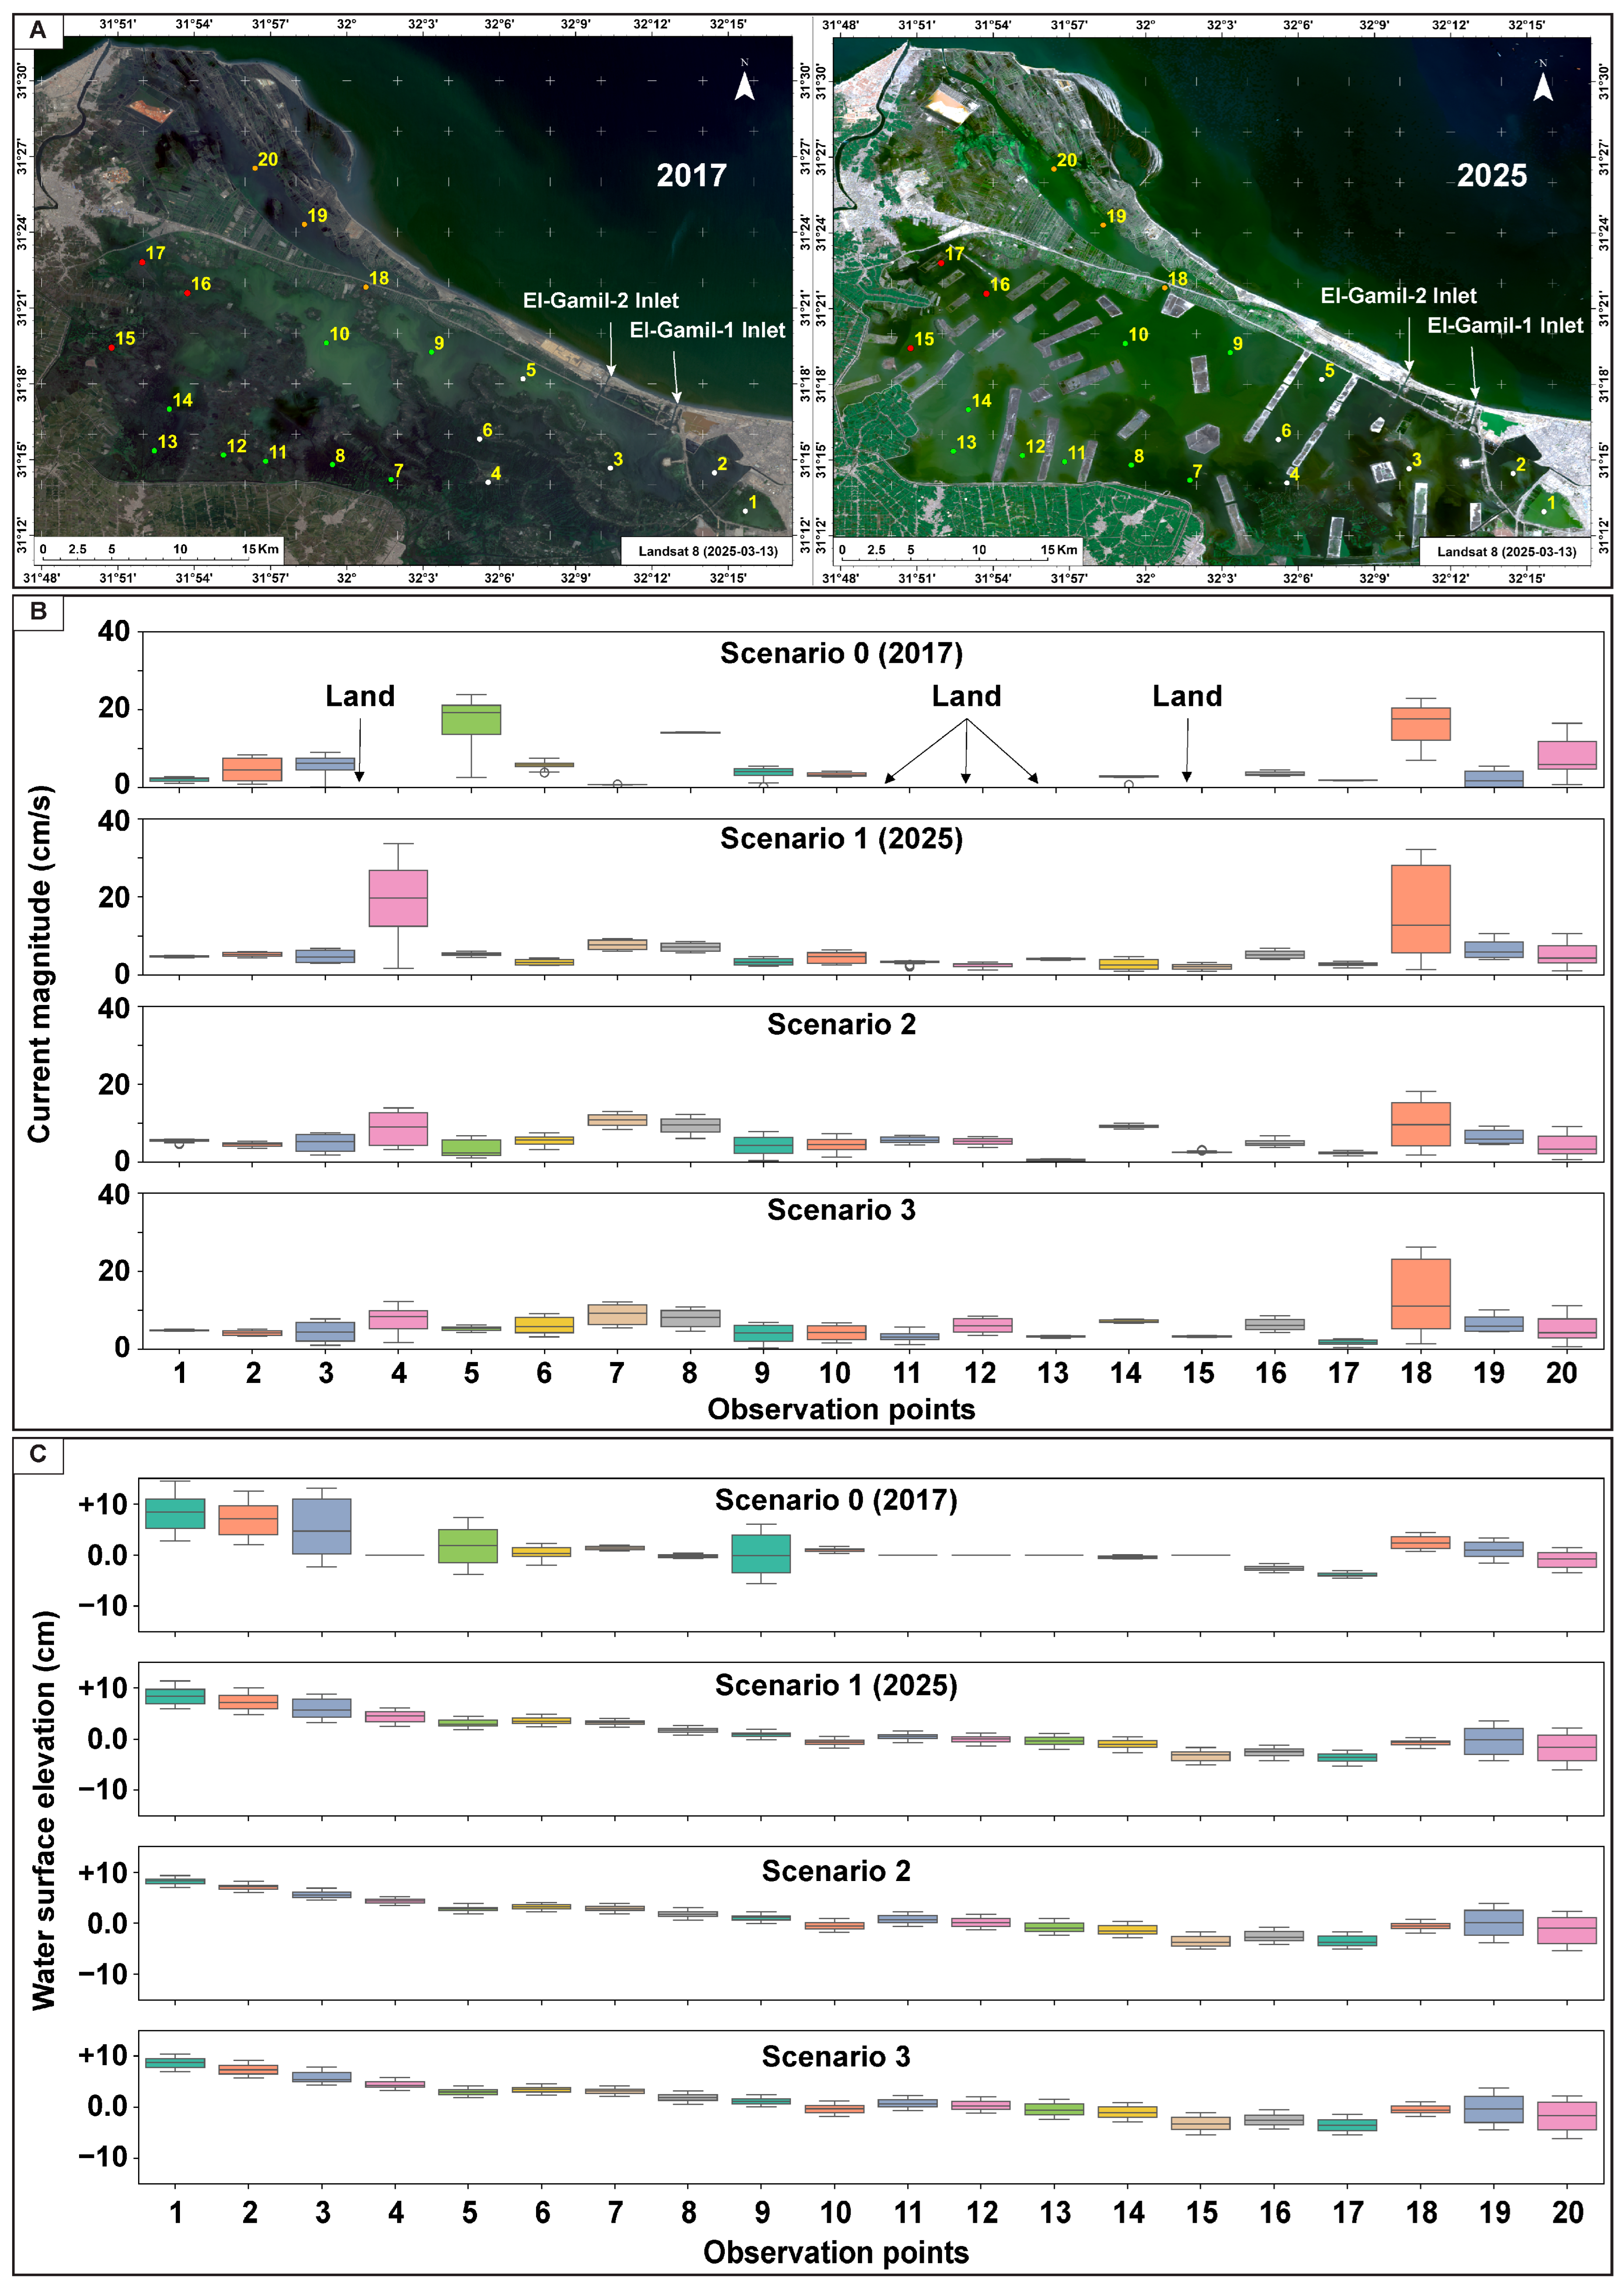
CMS-Flow simulations for Scenario 0 revealed distinct spatial variability in surface current velocities and tidal ranges across the lagoon (Figure 7). In the eastern sector, near the El-Gamil 1 and 2 inlets, current velocities reached up to 17 cm/s at measuring point 5, with an average of 6.26 cm/s across the eastern measuring points, reflecting stronger exchange with the Mediterranean (Figure 7A,B; Table 1). In contrast, the western sector exhibited sluggish, near-stagnant flow conditions, with average current velocities around 3.9 cm/s (Figure 7A,B; Table 1). Tidal ranges showed a similar pattern, peaking at 15 cm and 11 cm during spring tides at points 3 and 5, respectively, and averaging 6.9 cm in the eastern sector. Meanwhile, the western lagoon experienced minimal tidal oscillation, with ranges below 2.5 cm and an average of 2.14 cm (Figure 7C,D; Table 1).
For Scenario 1, CMS-Flow simulations demonstrated a noticeable moderation of current velocities across the lagoon basin, with no evidence of widespread stagnation (Figure 8). The eastern sector exhibited a mean current velocity of 7.2 cm/s, while the western sector averaged 5.07 cm/s (Figure 8A,B; Table 1). Flow magnitudes generally remained below 8 cm/s across most measuring points, except at point 4, located along the main east–west water passes of the lagoon, where a localized acceleration reached 19 cm/s. Tidal oscillations also showed partial equilibration between sectors, averaging 3.67 cm in the east and 3.33 cm in the west, with a maximum amplitude of 5.6 cm observed at point 3 near the El-Gamil inlets and a minimum of 2.4 cm at observation point 12 in the southwestern sector of the lagoon (Figure 8C,D; Table 1). Despite this overall improvement in hydrodynamic activity compared with 2017 (Scenario 0), quasi-eddy circulations developed between the man-made land-connected sand barriers, which formed semi-isolated sub-basins within the lagoon (Figure 8A,B). The elongated, near-continuous sand barriers act as lateral constrictions that sharply reduce the effective cross-sectional area available for east–west exchange. This geometry induces flow separation at the barrier tips and generates persistent quasi-stationary recirculation zones in the lee of each barrier, visible as closed circulation cells in Figure 8A. Spatially, these recirculation cells are most pronounced in the inter-barrier pockets along the central and northwestern lagoon margin, where flow separation at barrier tips generates persistent clockwise and counterclockwise eddies. The southwestern sector, characterized by depths shallower than 1 m and proximity to Bahr El-Baqar drain outflow, exhibits the most persistent near-stagnant conditions, with current velocities consistently below 3 cm/s regardless of tidal phase (Figure 8A,B). The resulting lengthening and tortuosity of flow paths, combined with increased frictional damping of the already weak tidal wave, produce the observed velocity reduction and create sheltered dead-water regions conducive to sediment fining and vegetation resurgence. These physical mechanisms explain the observed quasi-eddy circulations in Scenario 1 and the improved balance in Scenarios 2 and 3 after channel introduction.
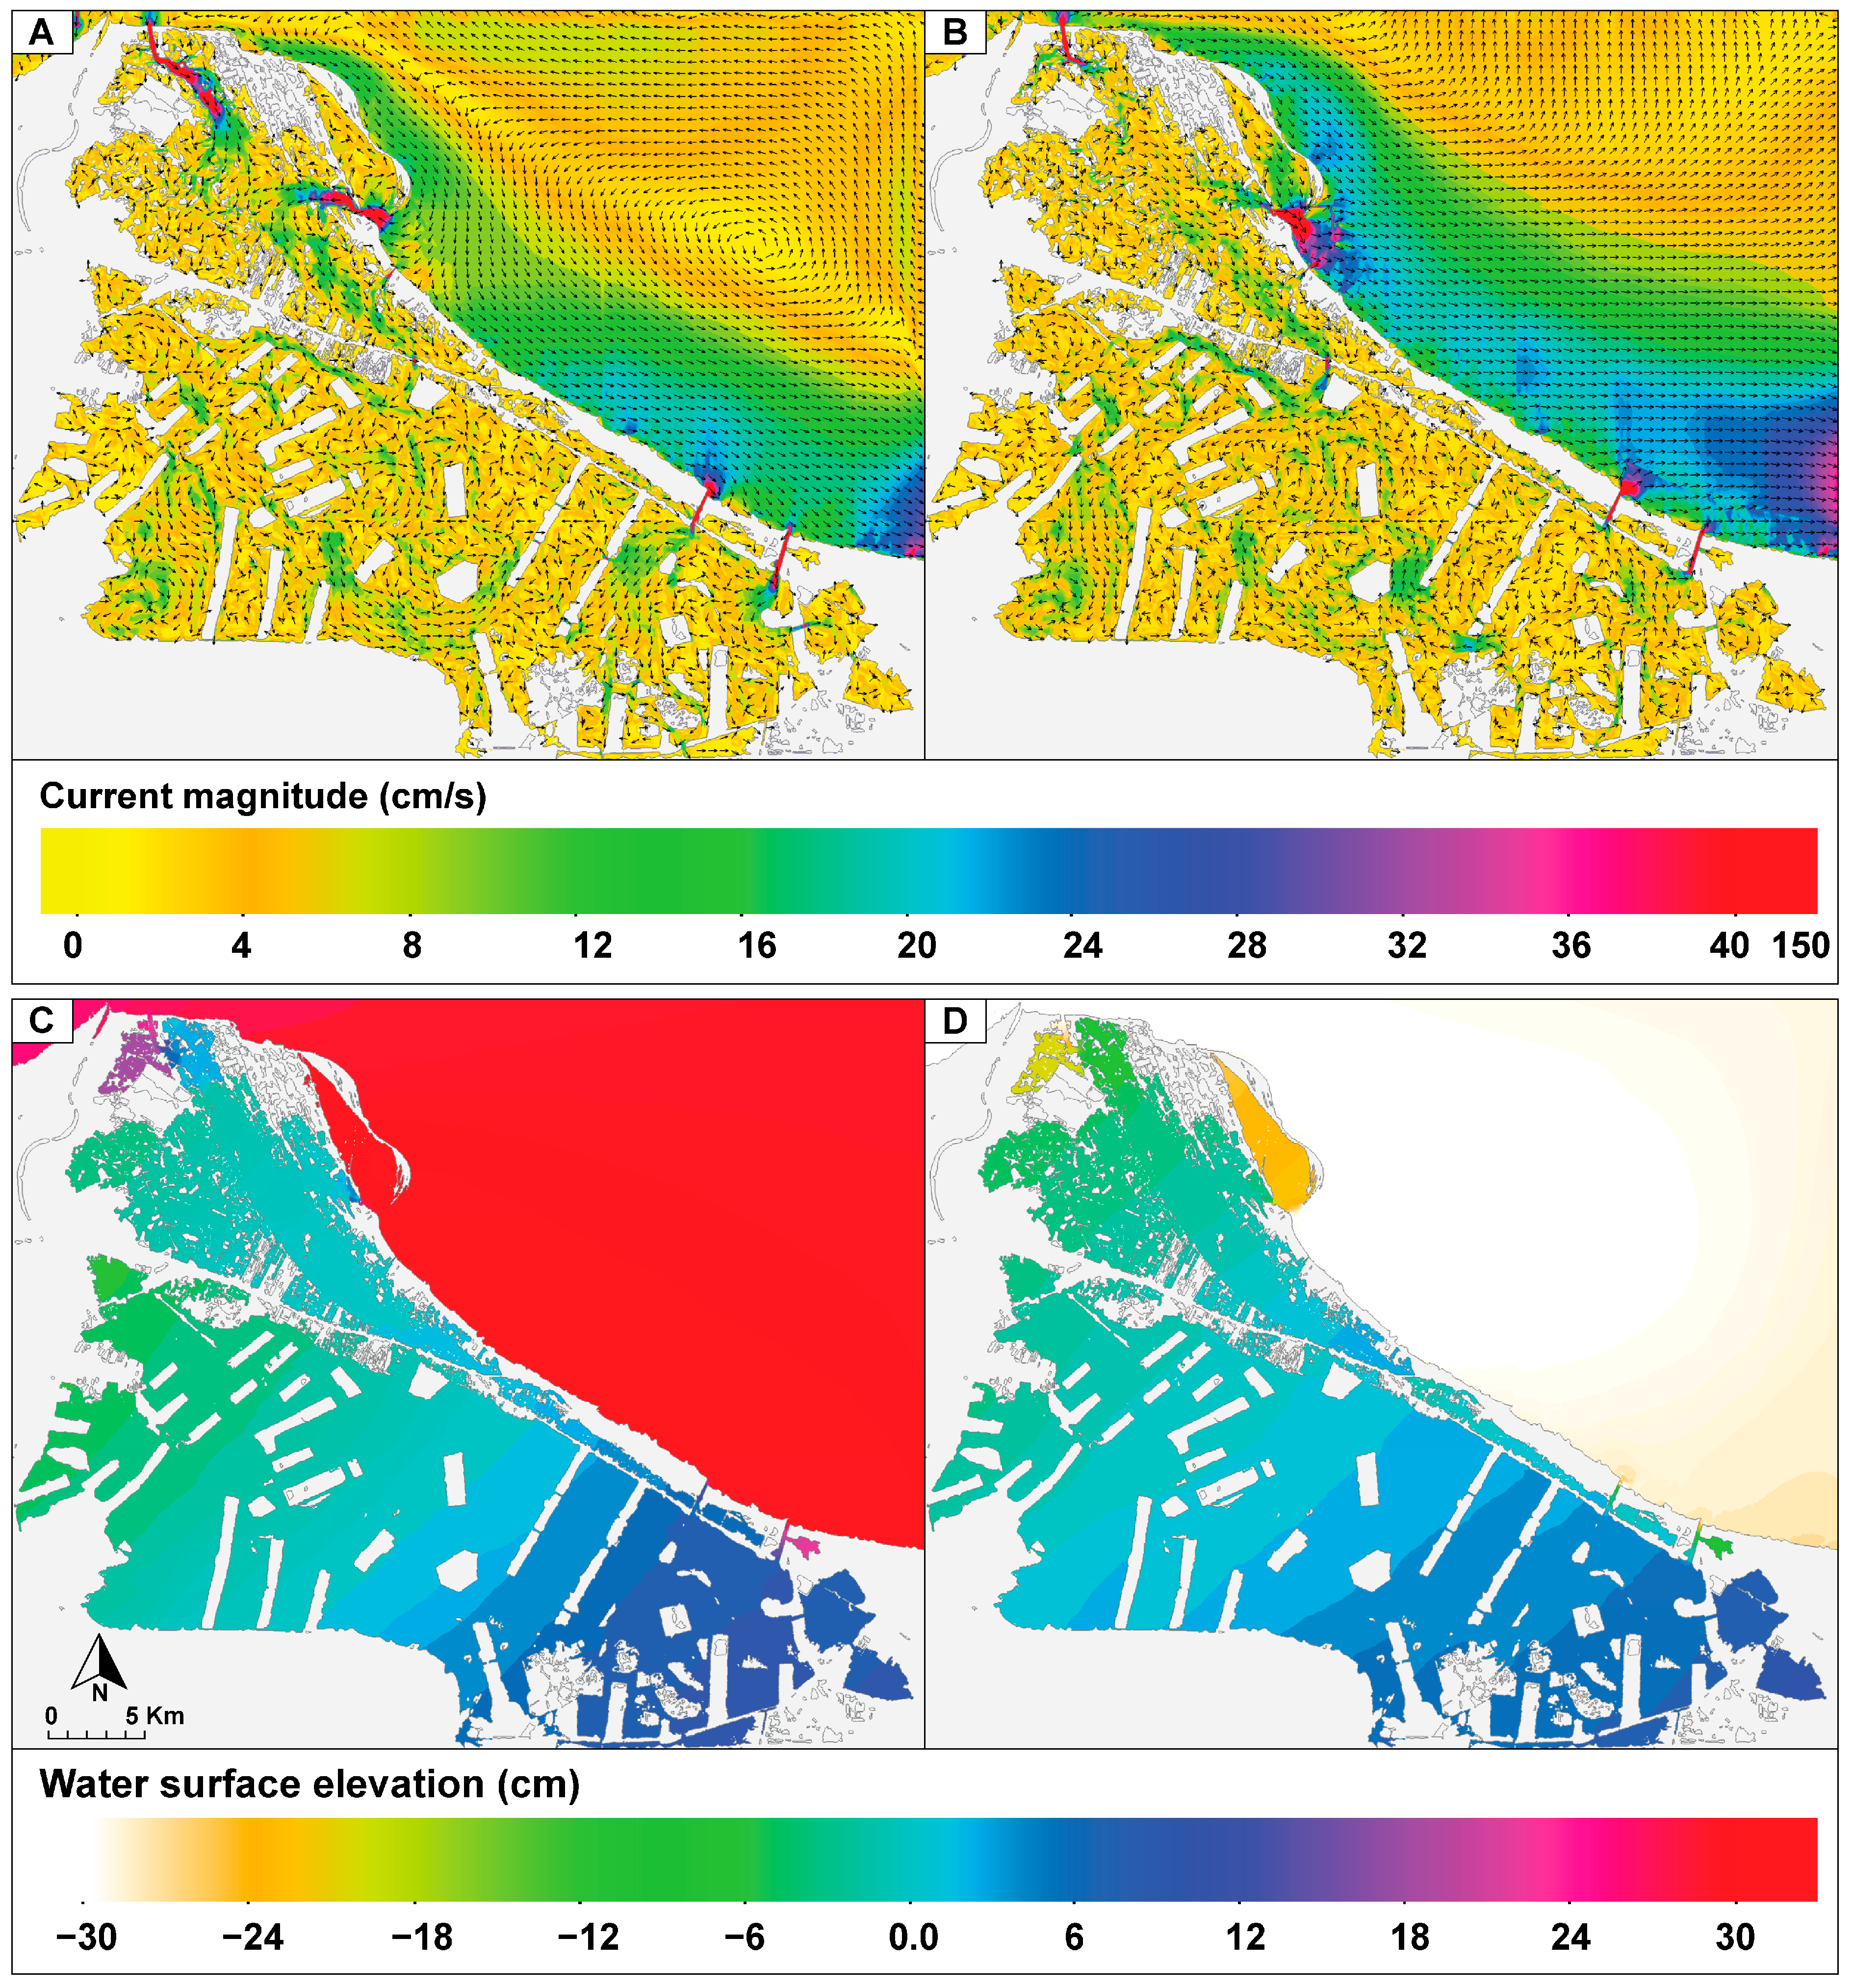
Scenario 2 showed further moderation and enhanced balance of current velocities across the entire lagoon basin, with no quasi-eddy circulations development (Figure 9). In the eastern sector, the maximum current velocity reached 10.7 cm/s at measuring point 7, with an average of 6.62 cm/s, while the western sector experienced a slight increase over Scenario 1, averaging 5.32 cm/s (Figure 9A,B; Table 1), demonstrating a clearer equilibrium in flow dynamics between east and west compared with previous scenarios. Spatially, the removal of barriers allows tidal currents to propagate in a broadly zonal east–west pattern across the full lagoon width, with flow streamlines extending continuously from the El-Gamil inlets to the western margin without deflection or recirculation (Figure 9A,B). Current velocity contours show a gradual and monotonic westward decay consistent with tidal energy dissipation over distance, rather than the abrupt spatial gradients associated with barrier-induced flow separation in Scenario 1. Tidal ranges also showed the most uniform distribution among all scenarios, with averages of 3.59 cm in the east and 3.52 cm in the west (Figure 9C,D; Table 1).
Scenario 3 exhibited the most stable and balanced hydrodynamic behavior across the lagoon (Figure 10). Current velocities peaked at 8.9 cm/s, averaging 6.18 cm/s in the eastern sector and 5.56 cm/s in the western sector (Figure 10A,B; Table 1). This indicates a well-balanced flow regime between both sectors, with no evidence of localized stagnation or excessive flow acceleration (Figure 10A,B). Spatially, the non-aligned channel configuration generates a series of interconnected flow pathways that redirect tidal currents through successive barrier openings in a staggered pattern, effectively shortening the hydraulic path length between the eastern inlets and the western basin (Figure 10A,B). This configuration produces a more uniform spatial distribution of current velocity contours across the lagoon, with residual low-velocity zones confined to the distal ends of retained barrier segments rather than extending across entire inter-barrier sub-basins as in Scenario 1. Tidal ranges followed a similar pattern of equilibrium, averaging 3.62 cm in the east and 3.56 cm in the west, confirming the persistence of hydrodynamic balance throughout the lagoon basin (Figure 10C,D and Figure 11; Table 1).
The standard deviation (SD) analysis across measuring points (Table 1) revealed the highest variability in Scenario 0 (4.99 cm/s for current velocity and 5.49 cm for tidal range), which progressively decreased through Scenario 1 (3.95 cm/s and 1.26 cm) and Scenario 2 (2.67 cm/s and 0.56 cm). In Scenario 3, the SD of current velocity reached its minimum at 1.81 cm/s, while the SD of tidal range slightly increased to 0.67 cm, yet remained lower than Scenario 1, reflecting overall hydrodynamic stability across the lagoon.
It is noted that observation points 1–6, situated in the eastern sector in close proximity to the El-Gamil inlets, and points 18–20, located within El Deeba Triangle at the northeastern margin of the lagoon where direct Mediterranean connectivity is maintained through multiple independent inlets and navigation channels, consistently exhibit higher current velocities and tidal ranges relative to interior lagoon stations across all scenarios. This spatial pattern reflects the well-established attenuation of tidal energy with distance from marine boundary conditions and reinforces the central argument that proximity to, or direct connection with, the open sea is the primary driver of hydrodynamic vitality within the lagoon basin.

4. Discussion

4.1. Historical Degradation and Long-Term Anthropogenic Pressures

The long-term degradation of Manzala Lagoon exemplifies severe anthropogenic pressures on Nile Delta ecosystems, where progressive sediment infilling and land reclamation have dramatically reduced its surface area, from over 800 km2 in the mid-1980s to 525 km2 by 2017, driven primarily by agricultural expansion and urban encroachment [12,13,14]. This contraction, coupled with the proliferation of aquatic vegetation, as reflected by NDVI peaks in 2017 (Figure 2A), has compartmentalized the lagoon into partially isolated basins, further enhancing stagnation and weakening hydrodynamic connectivity [49,61,62] (Figure 2A). The excessive vegetation growth, dominated by species such as water hyacinth, not only obstructs water exchange but also intensifies eutrophication by trapping nutrients and fostering hypoxic conditions that impair biodiversity and fisheries productivity [63,64]. Simultaneously, weak currents and semi-stagnant flows have accelerated pollutant accumulation, with untreated discharges from drains such as Bahr El-Baqar elevating concentrations of heavy metals (e.g., Cd, Pb, Zn) and nutrients, leading to increased BOD and COD levels that degrade water quality and benthic habitats [65,66,67]. These processes, amplified by reduced Nile inflows following the construction of the Aswan High Dam, underscore the vulnerability of coastal lagoons to cascading ecological disruptions, where diminished circulation perpetuates a feedback loop of sedimentation, pollutant retention, and habitat loss [16,62]. Ultimately, such localized conditions characterized by restricted circulation create favorable environments for opportunistic vegetation, highlighting the persistent hydrodynamic challenges despite ongoing restoration efforts.

4.2. Restoration Efforts and Hydrodynamic Improvements (2017–2022)

In response to the long-term degradation of the lagoon, the Egyptian government launched a large-scale purification, dredging, and restoration initiative in 2017. The primary objective was to reestablish a stable environmental state by halting the inflow of industrial and agricultural effluents from major drains, Hadous, Faraskur, Al-Serw, Mataria, and Bahr El-Baqar, which collectively discharge over 4000 million m3/year of untreated wastewater rich in nutrients, pesticides, and heavy metals [64,66,68].
Between 2017 and 2022, extensive macrophyte removal and dredging increased average depths from ≈2.5 m to over 4 m in central and inlet zones, depths comparable to well-functioning Mediterranean lagoons such as Mar Menor, Spain [2,69] and Étang de Thau, France [70,71]. These interventions were explicitly framed to improve water quality, reduce pollutant loads, and support socio-economic uses [20].
The initiative also aimed to reactivate circulation within the lagoon, which had become nearly stagnant, as reflected in pre-purification hydrodynamic data, Scenario 0, showing weak east–west velocity gradients, 6.26 cm/s vs. 4.3 cm/s, and limited tidal ranges, 6.9 cm vs. 2.14 cm, with SDs of 4.99 cm/s for current velocity and 5.49 cm for tidal range along the lagoon basins (Figure 7; Table 1). These modeled circulation patterns are also consistent with earlier hydrodynamic simulations of the lagoon, which similarly reported weak flushing and strong spatial gradients in current velocity between the eastern inlets and the western basin [55]. Similar hydrodynamic controls, including the combined influence of tides, waves, and local winds on water circulation, have been observed in shallow lagoon–inlet–coastal ocean systems such as the Maryland Coastal Bays, where inlet geometry and seasonal variability regulate exchange flows and localized circulation patterns [3,72].
The 2017–2022 interventions partially improved the environmental condition of Manzala Lagoon, though persistent hydrodynamic constraints and organic enrichment indicate that full ecological recovery remains incomplete. Electrical conductivity increased from 7.79 to 14.39 mS/cm, and dissolved oxygen rose from 5.8 to 6.5 mg/L, reflecting enhanced water renewal and oxygenation. However, BOD also increased from 18.67 to 29.46 mgO2/L, suggesting that organic loading and nutrient enrichment persist despite these improvements [60]. The concurrent increase in both DO and BOD is not contradictory but rather mechanistically consistent: the expansion of open-water area following dredging enhanced localized water movement and surface oxygenation, yet the semi-continuous sand barriers continued to restrict basin-wide water exchange, promoting the internal accumulation of organic matter and nutrients. This condition is reflected in the recurrent seasonal green algal blooms observed each September–October in the eastern lagoon, confirming that apparent hydrodynamic improvement has not translated into effective nutrient export or meaningful reduction in organic enrichment. Hydrodynamic efficiency remains limited, as the extensive sand barriers continue to divide the lagoon into semi-isolated basins. This segmentation promotes quasi-eddy circulations and maintains east–west disparities in both current velocities, 7.2 cm/s vs. 5.07 cm/s with SDs of 3.95 cm/s for current velocity, and tidal ranges, 3.67 cm vs. 3.33 cm with SD of 1.26 cm for tidal range within the lagoon, under the existing configuration (Figure 8; Table 1).
The engineering reuse of dredged sediments to construct long, land-connected sand barriers and islands effectively compartmentalized the lagoon into semi-enclosed basins (Figure 1). Such partial obstruction of exchange is known to alter flushing, promote localized quasi-eddy circulations, and change water and sediment transport pathways [73,74,75]. The resulting semi-isolated sub-basins within Manzala now show persistent signs of reduced east–west exchange and renewed macrophyte growth in low-flow pockets (Figure 2 and Figure 8), consistent with observations from other modified lagoon systems where constraints have encouraged the re-expansion of undesirable aquatic vegetation (Figure 2A, 2022–2025), as stagnant, low-shear environments foster the retention of nutrient-rich sediments and the proliferation of opportunistic species such as Eichhornia crassipes [76,77,78,79] (Figure 2B,C). Comparable phenomena have been reported elsewhere: in Ciénaga Grande de Santa Marta in Colombia [80] and the Orbetello Lagoon in Italy [81], where the human impact enhanced the aquatic vegetation by reducing exchange with seawater; in Mar Menor, Spain, where artificial barriers enhanced eddy recirculation and eutrophication [4]; in the Venice Lagoon in Italy, where inlet alterations and closures are linked to persistent gyres and increased residence times [82,83]; and in Australia’s Gippsland Lakes, where dredged embankments promoted eddy formation and limited inter-basin connectivity [1].
Despite these improvements, dense green algal blooms were observed during September 2023–2025 in the eastern lagoon, spanning ≈14 km from the Port Said Fishing Club to El-Gamil inlets. According to Hussein et al. [22], these blooms result from nutrient accumulation, elevated temperatures, alkaline pH, and semi-isolated sub-basins caused by sand barriers that limit water exchange, creating low-flow, stagnant pockets conducive to cyanobacterial proliferation [84,85]. This highlights the ongoing challenge of managing eutrophication under partial hydrodynamic constraint.
The persistent east–west asymmetry in Scenario 1 (7.2 cm/s east vs. 5.07 cm/s west; tidal range 3.67 cm vs. 3.33 cm) arises primarily from the much greater distance of the western sector from the El-Gamil inlets, the semi-continuous alignment of sand barriers that forces longer and more tortuous flow paths westward, and the gentle westward shallowing, reflected in the bathymetric gradient from −4.0 m near the El-Gamil inlets and central zones to −0.6 m in the vegetated southwestern shallows, with approximately 70% of the western lagoon floor lying between −0.9 m and −2.5 m (Figure 4B), coupled with residual vegetation drag in sheltered southeastern pockets. These structural and frictional constraints continue to dampen tidal propagation and limit lateral mixing despite the overall depth increase achieved by dredging.

4.3. Comparative Evaluation of Restoration Scenarios

Scenario 2, representing the complete removal of eleven of these barriers, demonstrated a more balanced hydrodynamic regime, with nearly uniform current velocities (6.62 cm/s east, 5.32 cm/s west, and lower SD of 2.67 cm/s) and tidal amplitudes (3.59 cm east, 3.52 cm west, and SD of 0.56 cm). This scenario effectively reduced localized eddies and stagnation, enhanced cross-lagoon exchange, and restored near-natural flow connectivity (Figure 9; Table 1). Even under this open-basin configuration, a minor residual east–west gradient persists (6.62 cm/s east vs. 5.32 cm/s west) owing to the inherent tidal damping over the 30 km distance from the inlets and the gentle westward bathymetric shallowing, effects that cannot be fully eliminated. Similar improvements have been documented in other open-basin restoration projects, such as Australia’s Peel–Harvey Estuary [86], Florida’s Indian River Lagoon [87], and Mar Menor Lagoon in Spain [2,4], where dredging and barrier removal successfully reestablished circulation and mitigated eutrophication.
However, Scenario 2 was deemed practically infeasible due to high costs (over 450 million USD) and logistical challenges in removing 100–110 million m3 of barrier sediments (EEAA officials, personal communications, July 2025).
In response, the EEAA requested cost-effective alternatives that would retain the sand barriers while aligning with Egypt’s broader tourism vision (EEAA officials, personal communications, July 2025; [20]). Scenario 3, which introduced 400–500 m wide channels through the existing barriers, produced a more balanced hydrodynamic regime, with mean current velocities of 6.18 cm/s in the east and 5.56 cm/s in the west (SD = 1.81 cm/s), and tidal ranges of 3.62 cm and 3.56 cm (SD = 0.67 cm), respectively, slightly higher variability than Scenario 2 (SD = 0.56 cm) and much lower than Scenario 1 (SD = 1.26 cm), but without the need for complete barrier removal (Figure 10 and Figure 11B,C; Table 1). The non-aligned channel paths, in the adjacent sand barriers, resulted in non-linear flow patterns, which can improve water exchange between basins, amplify tidal motions, and mitigate localized eddy formations [88,89,90] (Figure 10). By introducing wide (400–500 m), deliberately non-aligned channels, Scenario 3 short-circuits the longest and most sinuous flow paths imposed by the barriers, reducing the effective propagation distance for the tidal wave and markedly lowering frictional losses in the western sector. Consequently, the east–west velocity difference shrinks to only 0.62 cm/s (6.18 cm/s vs. 5.56 cm/s) and the tidal-range difference to 0.06 cm, values low enough to prevent widespread stagnation and vegetation resurgence while preserving the barriers for navigational safety and future eco-tourism infrastructure. This configuration effectively minimized stagnation and maintained water exchange (Figure 10) while preserving structural elements that could support eco-tourism initiatives, similar to recreational zoning in Venice Lagoon [91] and the barrier-linked tourism model of Mar Menor, Spain [4,92].
The restoration of more uniform east–west circulation is expected to enhance oxygenation, reduce thermal stratification, and mitigate seasonal algal blooms. Regular monitoring of channel cross-sections and vegetation cover is recommended to ensure continued ecological effectiveness and to support sustainable use of the barriers for tourism and other activities.
Although the modeled current velocities (5–7 cm/s) and tidal ranges (3–4 cm) may appear modest in absolute terms, they are consistent with, and in several cases exceed, values reported for well-functioning Mediterranean coastal lagoons operating under comparable micro-tidal and semi-enclosed conditions, including Mar Menor, Spain (3–6 cm/s; [2,4]) and Étang de Thau, France (2–5 cm/s; [70,71]). It is important to note that the Mediterranean Sea is a semi-enclosed basin inherently characterized by micro-tidal regimes, with tidal ranges along most coastlines rarely exceeding 30–60 cm; accordingly, lagoonal systems within this basin cannot be evaluated against macrotidal or open-ocean benchmarks. In shallow lagoonal environments, current velocities exceeding 3–5 cm/s are generally sufficient to inhibit fine sediment deposition and limit the establishment of floating macrophytes such as Eichhornia crassipes [76,77]. Furthermore, the observed increase in electrical conductivity from 7.79 to 14.39 mS/cm and DO from 5.8 to 6.5 mg/L between 2017 and 2023 provides field-based evidence that even partial hydrodynamic improvement under Scenario 1 has produced measurable water quality responses, supporting the ecological relevance of the velocity and tidal range increments projected under Scenario 3.

4.4. Wave Dynamics, Sediment Stability, and Management Implications

Beyond the variations in current velocity and tidal range, the CMS-Wave simulations provided further insight into how wave energy propagates across the lagoon under different restoration scenarios, revealing notable contrasts in wave height distribution and fetch effects. Wave simulations revealed that Scenario 2 produced the highest wave heights within the lagoon, reaching 3–5 cm, due to the expanded wave fetch created by the open-basin configuration [93,94,95] (Figure 6C). In contrast, Scenario 0 exhibited minimal wave activity (<2–3 cm) as a result of confined sub-basins and limited fetch [93,95] (Figure 6A), where wave directions aligned with the closed western basin, reinforcing existing circulation and creating localized low-energy zones (Figure 7A,B). Scenarios 1 and 3 displayed moderate wave heights (3–4 cm), reflecting more balanced conditions following dredging and selective channel openings (Figure 6B,D). Wave propagation in these scenarios amplifies current velocities along channels, promotes sediment mobility, and supports more uniform water exchange, limiting stagnation and reducing conditions favorable for dense vegetation growth [93,94,95]. Maintaining a moderate fetch, as observed in Scenarios 1 and 3, helps prevent excessive wave growth during storms, thereby reducing erosion of man-made islands and sand barriers and limiting sediment resuspension [96]. These results are consistent with established wave-fetch relationships [95,96,97], underscoring that controlled fetch is crucial for sustaining hydrodynamic stability and sediment resilience in semi-enclosed lagoons.

4.5. Study Limitations

Notwithstanding the robustness of the modeling framework and the multi-source validation strategy adopted, several limitations inherent to this study should be acknowledged. First, direct quantitative validation of simulated current velocities and discharge rates against in situ measurements was not feasible owing to logistical constraints and the absence of concurrent field velocity data; model confidence was therefore established through indirect observational evidence and inter-model comparison with Elshemy et al. [55]. Second, the CMS-Flow framework employs depth-averaged, two-dimensional hydrodynamics and does not explicitly resolve vertical turbulence structure or three-dimensional stratification effects, which may be locally relevant in the vicinity of freshwater drain inlets such as Bahr El-Baqar. Third, numerical diffusion inherent to the finite-difference discretization scheme may partially smooth sharp gradients in current velocity near barrier tips and narrow channel margins, potentially underestimating localized flow separation at sub-grid scales. Fourth, the simulations were conducted under statistically representative fair-weather forcing conditions; responses under seasonal variability and episodic storm events, while acknowledged as marginal in the Mediterranean micro-tidal context, were not characterized. Fifth, spatial validation of tidal boundary conditions was limited to a single in situ station at Alexandria, owing to the absence of additional ground-truth records within the study region. These limitations collectively define the boundaries of interpretation of the present results and identify priority directions for future field campaigns and modeling refinements.

5. Conclusions

Decades of anthropogenic pressures, including sediment infilling, uncontrolled vegetation growth, and untreated wastewater discharges, shrank Manzala Lagoon’s surface area from 805 km2 in 1985 to 525 km2 by 2017, severely disrupting natural circulation, fostering hypoxic conditions, and degrading habitats critical for fisheries and migratory birds, necessitating a 2017–2022 restoration project, the outcomes of which are detailed below:
  • The restoration initiative deepened the lagoon successfully to 3–4 m, expanded its open-water area to nearly 750 km2, and improved water quality, evidenced by higher EC and DO levels, though organic enrichment remains a challenge.
  • Hydrodynamic modeling revealed stark pre-purification stagnation in 2017, with sluggish currents (6.26 cm/s east vs. 4.3 cm/s west) and limited tidal ranges (6.9 cm east vs. 2.14 cm west), driven by sediment accumulation and vegetation-clogged channels.
  • Post-intervention conditions, in 2025, showed moderate improvements, with current velocities of 7.2 cm/s east and 5.07 cm/s west and tidal ranges of 3.67 cm east and 3.33 cm west, but sand barriers constructed from dredged sediments created semi-isolated basins, promoting quasi-eddy circulations, vegetation resurgence, and algal bloom formation.
  • The proposed scenario of complete removal of 11 sand barriers achieves balanced hydrodynamics with uniform currents (6.62 cm/s east, 5.32 cm/s west) and tidal ranges (3.59 cm east, 3.52 cm west), eliminates eddies, and improves basin-wide connectivity. However, it is impractical due to high costs (over 450 million USD plus 110 million m3 sediment removal) and higher wave heights within the lagoon compared with other scenarios.
  • Scenario 3, involving 400–500 m non-aligned channels through some selected barriers, delivered near-optimal hydrodynamics (6.18 cm/s east, 5.56 cm/s west; tidal ranges 3.62 cm east, 3.56 cm west) with low variability (SD 1.81 cm/s currents, 0.67 cm tidal oscillations), reducing stagnation while preserving barriers for eco-tourism and aquaculture.
  • The non-aligned channels maximized flow and inter-barrier exchange, limited eddies, supported ecological stability, and maintained moderate wave fetch, reducing erosion and sediment resuspension, while requiring only 18–20 million m3 of excavated sediments that can reinforce barriers, significantly lowering costs compared with full removal.
The outcomes of this study offer a conceptually transferable framework for hydrodynamic assessment and sustainable management of deltaic and coastal lagoons subject to comparable anthropogenic pressures, while acknowledging that site-specific calibration and validation would be required for application in other systems. By combining field validation, remote sensing, and process-based modeling, this research provides practical insight into designing resilient lagoon systems that harmonize environmental integrity with socio-economic development objectives.
It is acknowledged that the simulations presented herein were conducted under statistically representative fair-weather forcing conditions and do not capture episodic storm-driven or seasonally variable flushing dynamics. Such extreme events represent a statistically marginal fraction of the annual meteorological record, and their net hydrodynamic influence within a semi-enclosed, shallow basin such as Manzala Lagoon is inherently constrained by its confined geometry, restricted inlet cross-sections, and the high frictional dissipation characteristic of such environments. Future studies should nonetheless extend this modeling framework to include seasonal forcing variability and extreme wind-wave events to further characterize their episodic contribution to lagoon flushing dynamics.

Author Contributions

H.M.E.-A., conceptualization, investigation, methodology, resources, supervision, writing—review and editing; M.S.F., data curation, investigation, methodology, formal analysis, software, visualization, writing—original draft. All authors have read and agreed to the published version of the manuscript.

Funding

This research did not receive any external funding.

Institutional Review Board Statement

Not applicable.

Informed Consent Statement

Not applicable.

Data Availability Statement

The original contributions presented in this study are included in the article. Further inquiries can be directed to the corresponding author.

Acknowledgments

The authors acknowledge the Egyptian Environmental Affairs Agency for providing comprehensive historical and recent environmental data on Manzala Lagoon, which was essential for conducting this study. The authors also gratefully acknowledge Aquaveo, LLC (Provo, UT, USA) for providing a temporary educational license for the Surface-water Modeling System (SMS 13.4), which supported the hydrodynamic simulations conducted as part of this doctoral research. This work forms part of the doctoral research of Mahmoud Sh. Felfla.

Conflicts of Interest

The authors declare no conflicts of interest. No personal circumstances or interests that may be perceived as inappropriately influencing the representation or interpretation of reported research results.

Appendix A

Governing equations and numerical framework of the CMS:
The hydrodynamic simulations in this study were conducted using the CMS, a process-based numerical modeling framework developed by the U.S. Army Corps of Engineers. CMS integrates hydrodynamics, wave transformation, sediment transport, and morphological change through two coupled modules: CMS-Wave and CMS-Flow, which are dynamically linked through a steering module that exchanges forcing terms between both models during simulation. Detailed descriptions of the CMS architecture and its applications in coastal and lagoonal environments are provided in previous studies (e.g., [32]) and in applied implementations such as Karambas and Samaras [98] and El-Asmar et al. [26].

Appendix A.1. Wave Module (CMS-Wave)

Wave propagation within the model domain is simulated using CMS-Wave, which solves the steady-state wave-action balance equation on a non-uniform Cartesian grid. The governing equation is
( C x N ) x + ( C y N ) y + ( C θ N ) θ = k 2 C C g c o s 2 θ N y C C g 2 c o s 2 θ N y y + S i n + S d p + S n l
where N = E/σ represents the wave-action density, defined as the ratio between wave energy density E and intrinsic frequency σ. The coordinates x and y denote the horizontal spatial axes, while θ represents the wave direction measured counterclockwise from the x-axis. C and Cg correspond to wave celerity and group velocity, respectively. Cx, Cy, and Cθ are characteristic propagation velocities in spatial and directional dimensions. k is an empirical coefficient related to wave intensity. S i n represents wind-input source terms, S d p includes dissipative processes such as bottom friction, depth-induced breaking, and whitecapping, and S n l accounts for nonlinear wave–wave interactions.

Appendix A.2. Hydrodynamic Module (CMS-Flow)

CMS-Flow solves the depth-integrated continuity and momentum equations using a finite-volume formulation on a Cartesian grid. The governing continuity equation is expressed as
h + η t + q x x + q y y = 0
The depth-integrated momentum equations in the x- and y-directions are given by:
q x t + u q x x + v q x y + 1 2 g ( h + η ) 2 x = x D x q x x + y D y q x y + f q y τ b x + τ w x + τ S x
q y t + u q y x + v q y y + 1 2 g ( h + η ) 2 y = x D x q y x + y D y q y y + f q y τ b y + τ w y + τ S y
where h is the still-water depth referenced to the vertical datum and η is the water-surface elevation above the still-water level. t denotes time. qx and qy represent the depth-integrated flows per unit width in the x and y directions, respectively. u and v are the depth-averaged velocity components. g is gravitational acceleration. Dx and Dy denote horizontal diffusion coefficients, while f is the Coriolis parameter. The terms τbx and τby represent bottom stresses, τwx and τwy represent wind stresses, and τSx and τSy represent wave-induced radiation stresses.
Comprehensive derivations and implementation details of the CMS numerical framework, including discretization methods and coupling between the wave and hydrodynamic modules, are presented in previous studies applying the system to coastal and lagoonal environments.

References

  1. Boon, P.I.; Cook, P.; Woodland, R. The Gippsland Lakes: Management Challenges Posed by Long-Term Environmental Change. Mar. Freshw. Res. 2016, 67, 721–737. [Google Scholar] [CrossRef]
  2. De Pascalis, F.; Pérez-Ruzafa, A.; Gilabert, J.; Marcos, C.; Umgiesser, G. Climate Change Response of the Mar Menor Coastal Lagoon (Spain) Using a Hydrodynamic Finite Element Model. Estuar. Coast. Shelf Sci. 2012, 114, 118–129. [Google Scholar] [CrossRef]
  3. Mao, M.; Xia, M. Wave–Current Dynamics and Interactions near the Two Inlets of a Shallow Lagoon–Inlet–Coastal Ocean System under Hurricane Conditions. Ocean. Model. 2018, 129, 124–144. [Google Scholar] [CrossRef]
  4. Pérez-Ruzafa, A.; Marcos, C.; Pérez-Ruzafa, I.M.; Pérez-Marcos, M. Coastal Lagoons: “Transitional Ecosystems” between Transitional and Coastal Waters. J. Coast. Conserv. 2011, 15, 369–392. [Google Scholar] [CrossRef]
  5. García-Oliva, M.; Pérez-Ruzafa, Á.; Umgiesser, G.; McKiver, W.; Ghezzo, M.; De Pascalis, F.; Marcos, C. Assessing the Hydrodynamic Response of the Mar Menor Lagoon to Dredging Inlets Interventions through Numerical Modelling. Water 2018, 10, 959. [Google Scholar] [CrossRef]
  6. Gamito, S. Benthic Ecology of Semi-Natural Coastal Lagoons, in the Ria Formosa (Southern Portugal), Exposed to Different Water Renewal Regimes. Hydrobiologia 2006, 555, 75–87. [Google Scholar] [CrossRef][Green Version]
  7. Day, J.W.; Rismondo, A.; Scarton, F.; Are, D.; Cecconi, G. Relative Sea Level Rise and Venice Lagoon Wetlands. J. Coast. Conserv. 1998, 4, 27–34. [Google Scholar] [CrossRef]
  8. Garrido, M.; Cecchi, P.; Collos, Y.; Agostini, S.; Pasqualini, V. Water Flux Management and Phytoplankton Communities in a Mediterranean Coastal Lagoon. Part I: How to Promote Dinoflagellate Dominance? Mar. Pollut. Bull. 2016, 104, 139–152. [Google Scholar] [CrossRef]
  9. El-Asmar, H.M. Short Term Coastal Changes along Damietta-Port Said Coast Northeast of the Nile Delta, Egypt. J. Coast. Res. 2002, 18, 433–441. [Google Scholar]
  10. Redwan, M.; Elhaddad, E. Heavy Metal Pollution in Manzala Lake Sediments, Egypt: Sources, Variability, and Assessment. Environ. Monit. Assess. 2022, 194, 436. [Google Scholar] [CrossRef]
  11. Taha, M.M.N.; El-Asmar, H.M. Geo-Archeoheritage Sites Are at Risk, the Manzala Lagoon, NE Nile Delta Coast, Egypt. Geoheritage 2019, 11, 441–457. [Google Scholar] [CrossRef]
  12. Dewidar, K. Monitoring Temporal Changes of the Surface Water Area of the Burullus and Manzala Lagoons Using Automatic Techniques Applied to a Landsat Satellite Data Series of the Nile Delta Coast. Medit. Mar. Sci. 2011, 12, 462. [Google Scholar] [CrossRef][Green Version]
  13. El-Asmar, H.M.; Hereher, M.E. Change Detection of the Coastal Zone East of the Nile Delta Using Remote Sensing. Environ. Earth Sci. 2011, 62, 769–777. [Google Scholar] [CrossRef]
  14. Elshazly, R.E.; Armanuos, A.M.; Zeidan, B.A.; Elshemy, M. Evaluating Remote Sensing Approaches for Mapping the Bathymetry of Lake Manzala, Egypt. Euro-Mediterr. J. Environ. Integr. 2021, 6, 77. [Google Scholar] [CrossRef]
  15. EEAA. Environmental Balance of Lake Manzala; Egyptian Environmental Affairs Agency: Cairo, Egypt, 2016. [Google Scholar]
  16. Zahran, M.A.E.-K.; El-Amier, Y.A.; Elnaggar, A.A.; Mohamed, H.A.E.-A.; El-Alfy, M.A.E.-H. Assessment and Distribution of Heavy Metals Pollutants in Manzala Lake, Egypt. GEP 2015, 3, 107–122. [Google Scholar] [CrossRef]
  17. Abdelhady, A.A.; Khalil, M.M.; Ismail, E.; Mohamed, R.S.A.; Ali, A.; Snousy, M.G.; Fan, J.; Zhang, S.; Yanhong, L.; Xiao, J. Potential Biodiversity Threats Associated with the Metal Pollution in the Nile–Delta Ecosystem (Manzala Lagoon, Egypt). Ecol. Indic. 2019, 98, 844–853. [Google Scholar] [CrossRef]
  18. Elmorsi, R.R.; Abou-El-Sherbini, K.S.; Abdel-Hafiz Mostafa, G.; Hamed, M.A. Distribution of Essential Heavy Metals in the Aquatic Ecosystem of Lake Manzala, Egypt. Heliyon 2019, 5, e02276. [Google Scholar] [CrossRef]
  19. Mandour, R. Distribution and Accumulation of Heavy Metals in Lake Manzala, Egypt. Egypt. J. Basic Appl. Sci. 2021, 8, 284–292. [Google Scholar] [CrossRef]
  20. PARE Lake Manzala; Egyptian Presidency: Cairo, Egypt, 2021; Available online: https://www.presidency.eg (accessed on 26 March 2025).
  21. El-Hamaimi, A.; Mirdan, A.; Elshemy, M.; Hassan, A. Impact Assessment of Radial Channels Project on Water Quality Status in Lake Manzala, Eastern Nile Delta, Egypt. Port-Said Eng. Res. J. 2018, 22, 8–18. [Google Scholar] [CrossRef][Green Version]
  22. Hussein, M.A.; Eissa, A.E.; Eltarabily, R.M.; Abdelghany, M.F.; Elnakeeb, M.A.; Ismail, E.M.; Ragab, R.H.; Dessouki, A.A. Poor Water Quality as a Trigger of Harmful Algal Blooms in Lake Manzala. Mansoura Vet. Med. J. 2024, 25, 1. [Google Scholar] [CrossRef]
  23. Gic-Grusza, G. Numerical Modeling of the Three-Dimensional Wave-Induced Current Field. Water 2025, 17, 1336. [Google Scholar] [CrossRef]
  24. Lan, Y.-R.; Huang, Z.-C. Numerical Modeling on Wave–Current Flows and Bed Shear Stresses over an Algal Reef. Environ. Fluid Mech. 2024, 24, 697–718. [Google Scholar] [CrossRef]
  25. Teles, M.J.; Pires-Silva, A.A.; Benoit, M. Numerical Modelling of Wave Current Interactions at a Local Scale. Ocean. Model. 2013, 68, 72–87. [Google Scholar] [CrossRef]
  26. El-Asmar, H.M.; Elkotby, M.R.; Felfla, M.S.; Ragab, M.T. Integrated Predictive Modeling of Shoreline Dynamics and Sedimentation Mechanisms to Ensure Sustainability in Damietta Harbor, Egypt. Sustainability 2025, 17, 11174. [Google Scholar] [CrossRef]
  27. El-Asmar, H.M.; Felfla, M.S.; ElKotby, M.R.; El-Kafrawy, S.B.; Naguib, D.M. Multi-Decadal Shoreline Dynamics of Ras El-Bar, Nile Delta: Unraveling Human Interventions and Coastal Resilience. Sci. Afr. 2025, 30, e02937. [Google Scholar] [CrossRef]
  28. Masria, A.A.; Negm, A.M.; Iskander, M.M.; Saavedra, O.C. Hydrodynamic Modeling of Outlet Stability Case Study Rosetta Promontory in Nile Delta. Water Sci. 2013, 27, 39–47. [Google Scholar] [CrossRef][Green Version]
  29. Nassar, K.; Masria, A.; Mahmod, W.E.; Negm, A.; Fath, H. Hydro-Morphological Modeling to Characterize the Adequacy of Jetties and Subsidiary Alternatives in Sedimentary Stock Rationalization within Tidal Inlets of Marine Lagoons. Appl. Ocean. Res. 2019, 84, 92–110. [Google Scholar] [CrossRef]
  30. Wu, W.; Rosati, J.D.; Brown, M.E.; Demirbilek, Z.; Li, H.; Reed, C.W.; Sanchez, A. Coastal Modeling System: Mathematical Formulations and Numerical Methods; Engineer Research and Development Center (U.S.): Vicksburg, MS, USA, 2014. [Google Scholar]
  31. ElKotby, M.R.; Sarhan, T.A.; El-Gamal, M.; Masria, A. Impact Evaluation of Development Plans in the Egyptian Harbors on Morphological Changes Using Numerical Simulation (Case Study: Damietta Harbor, Northeastern Coast of Egypt). Remote Sens. Appl. Soc. Environ. 2024, 36, 101301. [Google Scholar] [CrossRef]
  32. Reed, C.W.; Brown, M.E.; Sánchez, A.; Wu, W.; Buttolph, A.M. The Coastal Modeling System Flow Model (CMS-Flow): Past and Present. J. Coast. Res. 2011, 59, 1–6. [Google Scholar] [CrossRef]
  33. McFeeters, S.K. The Use of the Normalized Difference Water Index (NDWI) in the Delineation of Open Water Features. Int. J. Remote Sens. 1996, 17, 1425–1432. [Google Scholar] [CrossRef]
  34. El-Asmar, H.M.; Felfla, M.S. Comparative Assessment of AI-Based and Classical DSAS Approaches in Multi-Temporal Shoreline Prediction: A Case Study of Ras El-Bar Coast, Egypt. ISPRS J. Photogramm. Remote Sens. 2026, 233, 407–422. [Google Scholar] [CrossRef]
  35. El-Asmar, H.M.; Felfla, M.S.; Mokhtar, A.A. Spatio-Temporal Shoreline Changes and AI-Based Predictions for Sustainable Management of the Damietta–Port Said Coast, Nile Delta, Egypt. Sustainability 2026, 18, 1557. [Google Scholar] [CrossRef]
  36. Jensen, J.R. Remote Sensing of the Environment: An Earth Resource Perspective, 2nd ed.; Prentice Hall series in geographic information science; Pearson Prentice Hall: Upper Saddle River, NJ, USA, 2007; ISBN 978-0-13-188950-7. [Google Scholar]
  37. Rouse, J.W.; Haas, R.H.; Schell, J.A.; Deering, D.W. Monitoring Vegetation Systems in the Great Plains with ERTS. In Proceedings of the Third ERTS-1 Symposium; NASA Goddard Space Flight Center: Greenbelt, MD, USA, 1974; Volume 1. [Google Scholar]
  38. Tucker, C.J. Red and Photographic Infrared Linear Combinations for Monitoring Vegetation. Remote Sens. Environ. 1979, 8, 127–150. [Google Scholar] [CrossRef]
  39. Keith, D.; Rover, J.; Green, J.; Zalewsky, B.; Charpentier, M.; Thursby, G.; Bishop, J. Monitoring Algal Blooms in Drinking Water Reservoirs Using the Landsat 8 Operational Land Imager. Int. J. Remote Sens. 2018, 39, 2818–2846. [Google Scholar] [CrossRef]
  40. Kumar, A.; Mishra, D.R.; Ilango, N. Landsat 8 Virtual Orange Band for Mapping Cyanobacterial Blooms. Remote Sens. 2020, 12, 868. [Google Scholar] [CrossRef]
  41. Liu, M.; Ling, H.; Wu, D.; Su, X.; Cao, Z. Sentinel-2 and Landsat-8 Observations for Harmful Algae Blooms in a Small Eutrophic Lake. Remote Sens. 2021, 13, 4479. [Google Scholar] [CrossRef]
  42. Copernicus Marine Service. Mediterranean Sea Physics Analysis and Forecast; Copernicus Marine Service: Toulouse, France, 2025. [Google Scholar]
  43. Coppini, G.; Clementi, E.; Cossarini, G.; Salon, S.; Korres, G.; Ravdas, M.; Lecci, R.; Pistoia, J.; Goglio, A.C.; Drudi, M.; et al. The Mediterranean Forecasting System—Part 1: Evolution and Performance. Ocean Sci. 2023, 19, 1483–1516. [Google Scholar] [CrossRef]
  44. Ravdas, M.; Zacharioudaki, A.; Korres, G. Implementation and Validation of a New Operational Wave Forecasting System of the Mediterranean Monitoring and Forecasting Centre in the Framework of the Copernicus Marine Environment Monitoring Service. Nat. Hazards Earth Syst. Sci. 2018, 18, 2675–2695. [Google Scholar] [CrossRef]
  45. Alkhalidi, M.; Al-Dabbous, A.; Al-Dabbous, S.; Alzaid, D. Evaluating the Accuracy of the ERA5 Model in Predicting Wind Speeds Across Coastal and Offshore Regions. J. Mar. Sci. Eng. 2025, 13, 149. [Google Scholar] [CrossRef]
  46. El-Asmar, H.M.; Felfla, M.S.; El-Kafrawy, S.B.; Gaber, A.; Naguib, D.M.; Bahgat, M.; El Safty, H.M.; Taha, M.M.N. A Little Tsunami at Ras El-Bar, Nile Delta, Egypt; Consequent to the 2023 Kahramanmaraş Turkey Earthquakes. Egypt. J. Remote Sens. Space Sci. 2024, 27, 147–164. [Google Scholar] [CrossRef]
  47. Hersbach, H.; Bell, B.; Berrisford, P.; Hirahara, S.; Horányi, A.; Muñoz-Sabater, J.; Nicolas, J.; Peubey, C.; Radu, R.; Schepers, D.; et al. The ERA5 Global Reanalysis. Q. J. R. Meteoro. Soc. 2020, 146, 1999–2049. [Google Scholar] [CrossRef]
  48. Shestakova, A.A.; Fedotova, E.V.; Lyulyukin, V.S. Relevance Of ERA5 Reanalysis For Wind Energy Applications: Comparison With Sodar Observations. GES 2024, 17, 54–66. [Google Scholar] [CrossRef]
  49. Thompson, J.R.; Flower, R.J.; Ramdani, M.; Ayache, F.; Ahmed, M.H.; Rasmussen, E.K.; Petersen, O.S. Hydrological Characteristics of Three North African Coastal Lagoons: Insights from the MELMARINA Project. Hydrobiologia 2009, 622, 45–84. [Google Scholar] [CrossRef]
  50. GEBCO. The General Bathymetric Chart of the Oceans: Gridded Bathymetry Data 2025; GEBCO: Springfield, VA, USA, 2025. [Google Scholar]
  51. Karambas, T.V. Design of Detached Breakwaters for Coastal Protection: Development and Application of an Advanced Numerical Model. Int. Conf. Coastal. Eng. 2012, 1, 1–15. [Google Scholar] [CrossRef]
  52. Li, H.; Lin, L.; Johnson, C.; Ding, Y.; Brown, M.; Beck, T.; Sánchez, A.; Wu, W. A Revisit and Update on the Verification and Validation of the Coastal Modeling System (CMS): Report 1—Hydrodynamics and Waves; Engineer Research and Development Center (U.S.): Vicksburg, MS, USA, 2022. [Google Scholar]
  53. Tsiaras, A.-C.; Karambas, T.; Koutsouvela, D. Design of Detached Emerged and Submerged Breakwaters for Coastal Protection: Development and Application of an Advanced Numerical Model. J. Waterw. Port Coast. Ocean Eng. 2020, 146, 04020012. [Google Scholar] [CrossRef]
  54. Chow, V.T. Open-Channel Hydraulics; McGraw-Hill: New York, NY, USA, 1959; ISBN 978-1-932846-18-8. [Google Scholar]
  55. Elshemy, M.; Khadr, M.; Atta, Y.; Ahmed, A. Hydrodynamic and Water Quality Modeling of Lake Manzala (Egypt) under Data Scarcity. Environ. Earth Sci. 2016, 75, 1329. [Google Scholar] [CrossRef]
  56. Fan, J.; Kuang, C.; Cong, X.; Gong, L.; Wang, G.; Xing, R. Hydrodynamic Influences on Water Exchange Capacity of a Coastal Lagoon after Phasic Restoration Projects. Estuar. Coast. Shelf Sci. 2024, 299, 108671. [Google Scholar] [CrossRef]
  57. Ingrassia, E.; Nasello, C.; Ciraolo, G. Hydrodynamic Modelling in a Mediterranean Coastal Lagoon—The Case of the Stagnone Lagoon, Marsala. Water 2024, 16, 2602. [Google Scholar] [CrossRef]
  58. Simonetti, I.; Cappietti, L. Influence of Inlets Morphology and Forcing Mechanisms on Water Exchange between Coastal Basins and the Sea: A Hindcast Study for a Mediterranean Lagoon. J. Mar. Sci. Eng. 2022, 10, 1929. [Google Scholar] [CrossRef]
  59. Haroon, A.M. Review on Aquatic Macrophytes in Lake Manzala, Egypt. Egypt. J. Aquat. Res. 2022, 48, 1–12. [Google Scholar] [CrossRef]
  60. EEAA. Technical Report on Water Quality and Bottom Sediments in Lake Manzala during the Period 2010–2023; Egyptian Environmental Affairs Agency: Cairo, Egypt, 2025. [Google Scholar]
  61. Ayache, F.; Thompson, J.R.; Flower, R.J.; Boujarra, A.; Rouatbi, F.; Makina, H. Environmental Characteristics, Landscape History and Pressures on Three Coastal Lagoons in the Southern Mediterranean Region: Merja Zerga (Morocco), Ghar El Melh (Tunisia) and Lake Manzala (Egypt). Hydrobiologia 2009, 622, 15–43. [Google Scholar] [CrossRef]
  62. Kock Rasmussen, E.; Svenstrup Petersen, O.; Thompson, J.R.; Flower, R.J.; Ahmed, M.H. Hydrodynamic-Ecological Model Analyses of the Water Quality of Lake Manzala (Nile Delta, Northern Egypt). Hydrobiologia 2009, 622, 195–220. [Google Scholar] [CrossRef]
  63. El-Khayat, H.; Mahmoud, K.; Gaber, H.; Abdel-Hamid, H.; Abu Taleb, H. Studies on the Effect of Pollution on Lake Manzala Ecosystem in Port-Said, Damietta and Dakahlia Governorates, Egypt. J. Egypt. Soc. Parasitol. 2015, 45, 153–166. [Google Scholar] [CrossRef]
  64. Hegazy, W.H.; Hamed, M.A.; Toufeek, M.E.S.; Mabrouk, B.K.A. Determination of Some Heavy Metals in Water of the Southern Region of Lake Manzala, Egypt. Egypt. J. Aquat. Biolo. Fish. 2016, 20, 69–81. [Google Scholar] [CrossRef]
  65. Elkady, A.A.; Sweet, S.T.; Wade, T.L.; Klein, A.G. Distribution and Assessment of Heavy Metals in the Aquatic Environment of Lake Manzala, Egypt. Ecol. Indic. 2015, 58, 445–457. [Google Scholar] [CrossRef]
  66. Mohamedein, L.I.; El-Sawy, M.A.; Bek, M.A. Sediment Contaminants in Northern Egyptian Coastal Lakes. In Egyptian Coastal Lakes and Wetlands: Part I; Negm, A.M., Bek, M.A., Abdel-Fattah, S., Eds.; The Handbook of Environmental Chemistry; Springer International Publishing: Cham, Switzerland, 2018; Volume 71, pp. 63–81. ISBN 978-3-319-93589-8. [Google Scholar]
  67. Siegel, F.R.; Gupta, N.K.; Shergill, B.S.; Stanley, D.J.; Gerber, C. Geochemistry of Holocene Sediments from the Nile Delta. J. Coast. Res. 1995, 11, 415–431. [Google Scholar]
  68. Elsaeed, G.; El-Hazek, A.N.; Bahgat, M.; Fathallah, N.F. Investigating the Improvement of Water Circulation of the Egyptian Northern Lakes, Case Study “Al-Manzala Lake”. Int. J. Appl. Sci. Res. 2020, 3, 85. [Google Scholar]
  69. Alcolea, A.; Contreras, S.; Hunink, J.E.; García-Aróstegui, J.L.; Jiménez-Martínez, J. Hydrogeological Modelling for the Watershed Management of the Mar Menor Coastal Lagoon (Spain). Sci. Total Environ. 2019, 663, 901–914. [Google Scholar] [CrossRef]
  70. Bacher, C.; Millet, B.; Vaquer, A. Modélisation de l’impact des mollusques cultivés sur la biomasse phytoplanctonique de l’étang de Thau (France). Comptes Rendus L’académie Sci.—Ser. III—Sci. Vie 1997, 320, 73–81. [Google Scholar] [CrossRef]
  71. Bernard, J.-P.; Frénod, E.; Rousseau, A. Modeling Confinement in Étang de Thau: Numerical Simulations and Multi-Scale Aspects. In Proceedings of the Conference Publications; AIMS Press: Springfield, MO, USA, 2013; Volume 2013, pp. 69–76. [Google Scholar]
  72. Fitzenreiter, K.; Mao, M.; Xia, M. Characteristics of Surface Currents in a Shallow Lagoon–Inlet–Coastal Ocean System Revealed by Surface Drifter Observations. Estuaries Coasts 2022, 45, 2327–2344. [Google Scholar] [CrossRef]
  73. Martínez-Suástegui, L.; Treviño, C. Mathematical Model of Tidal Water Transport by a Partial Blockage of a Coastal Lagoon. Appl. Math. Model. 2018, 60, 592–605. [Google Scholar] [CrossRef]
  74. Mora, J.W.; Burdick, D.M. The Impact of Man-Made Earthen Barriers on the Physical Structure of New England Tidal Marshes (USA). Wetl. Ecol. Manag. 2013, 21, 387–398. [Google Scholar] [CrossRef]
  75. Orton, P.; Ralston, D.; Van Prooijen, B.; Secor, D.; Ganju, N.; Chen, Z.; Fernald, S.; Brooks, B.; Marcell, K. Increased Utilization of Storm Surge Barriers: A Research Agenda on Estuary Impacts. Earth’s Future 2023, 11, e2022EF002991. [Google Scholar] [CrossRef]
  76. Bornette, G.; Puijalon, S. Response of Aquatic Plants to Abiotic Factors: A Review. Aquat. Sci. 2011, 73, 1–14. [Google Scholar] [CrossRef]
  77. Gong, W.; Shen, J.; Jia, J. The Impact of Human Activities on the Flushing Properties of a Semi-Enclosed Lagoon: Xiaohai, Hainan, China. Mar. Environ. Res. 2008, 65, 62–76. [Google Scholar] [CrossRef]
  78. Rodríguez-Gallego, L.; Sabaj, V.; Masciadri, S.; Kruk, C.; Arocena, R.; Conde, D. Salinity as a Major Driver for Submerged Aquatic Vegetation in Coastal Lagoons: A Multi-Year Analysis in the Subtropical Laguna de Rocha. Estuaries Coasts 2015, 38, 451–465. [Google Scholar] [CrossRef]
  79. Van Geest, G.J.; Coops, H.; Roijackers, R.M.M.; Buijse, A.D.; Scheffer, M. Succession of Aquatic Vegetation Driven by Reduced Water-level Fluctuations in Floodplain Lakes. J. Appl. Ecol. 2005, 42, 251–260. [Google Scholar] [CrossRef]
  80. Röderstein, M.; Perdomo, L.; Villamil, C.; Hauffe, T.; Schnetter, M.-L. Long-Term Vegetation Changes in a Tropical Coastal Lagoon System after Interventions in the Hydrological Conditions. Aquat. Bot. 2014, 113, 19–31. [Google Scholar] [CrossRef]
  81. Lenzi, M. Experiences for the Management of Orbetello Lagoon: Eutrophication and Fishing. In Marine Coastal Eutrophication; Elsevier: Amsterdam, The Netherlands, 1992; pp. 1189–1198. ISBN 978-0-444-89990-3. [Google Scholar]
  82. Umgiesser, G.; Ferrarin, C.; Bajo, M.; Bellafiore, D.; Cucco, A.; De Pascalis, F.; Ghezzo, M.; McKiver, W.; Arpaia, L. Hydrodynamic Modelling in Marginal and Coastal Seas—The Case of the Adriatic Sea as a Permanent Laboratory for Numerical Approach. Ocean. Model. 2022, 179, 102123. [Google Scholar] [CrossRef]
  83. Umgiesser, G.; Ferrarin, C.; Cucco, A.; De Pascalis, F.; Bellafiore, D.; Ghezzo, M.; Bajo, M. Comparative Hydrodynamics of 10 Mediterranean Lagoons by Means of Numerical Modeling. J. Geophys. Res. Oceans 2014, 119, 2212–2226. [Google Scholar] [CrossRef]
  84. Elbahnasawy, M.A.; ElSayed, E.E.; Azzam, M.I. Newly Isolated Coliphages for Bio-Controlling Multidrug-Resistant Escherichia Coli Strains. Environ. Nanotechnol. Monit. Manag. 2021, 16, 100542. [Google Scholar] [CrossRef]
  85. Zakem, E.J.; Al-Haj, A.; Church, M.J.; Van Dijken, G.L.; Dutkiewicz, S.; Foster, S.Q.; Fulweiler, R.W.; Mills, M.M.; Follows, M.J. Ecological Control of Nitrite in the Upper Ocean. Nat. Commun. 2018, 9, 1206. [Google Scholar] [CrossRef]
  86. Potter, I.C.; Rose, T.H.; Huisman, J.M.; Hall, N.G.; Denham, A.; Tweedley, J.R. Large Variations in Eutrophication among Estuaries Reflect Massive Differences in Composition and Biomass of Macroalgal Drift. Mar. Pollut. Bull. 2021, 167, 112330. [Google Scholar] [CrossRef]
  87. Ji, Z.-G.; Hu, G.; Shen, J.; Wan, Y. Three-Dimensional Modeling of Hydrodynamic Processes in the St. Lucie Estuary. Estuar. Coast. Shelf Sci. 2007, 73, 188–200. [Google Scholar] [CrossRef]
  88. Bo, T.; Ralston, D.K. Flow Separation and Increased Drag Coefficient in Estuarine Channels With Curvature. JGR Ocean. 2020, 125, e2020JC016267. [Google Scholar] [CrossRef]
  89. Guo, L.; Wang, Z.B.; Townend, I.; He, Q. Quantification of Tidal Asymmetry and Its Nonstationary Variations. JGR Ocean. 2019, 124, 773–787. [Google Scholar] [CrossRef]
  90. Radermacher, M.; De Schipper, M.A.; Swinkels, C.; MacMahan, J.H.; Reniers, A.J.H.M. Tidal Flow Separation at Protruding Beach Nourishments. JGR Ocean. 2017, 122, 63–79. [Google Scholar] [CrossRef]
  91. Mel, R.; Carniello, L.; D’Alpaos, L. Addressing the Effect of the Mo.S.E. Barriers Closure on Wind Setup within the Venice Lagoon. Estuar. Coast. Shelf Sci. 2019, 225, 106249. [Google Scholar] [CrossRef]
  92. García-Oliva, M.; Marcos, C.; Umgiesser, G.; McKiver, W.; Ghezzo, M.; De Pascalis, F.; Pérez-Ruzafa, A. Modelling the Impact of Dredging Inlets on the Salinity and Temperature Regimes in Coastal Lagoons. Ocean. Coast. Manag. 2019, 180, 104913. [Google Scholar] [CrossRef]
  93. Jouon, A.; Lefebvre, J.P.; Douillet, P.; Ouillon, S.; Schmied, L. Wind Wave Measurements and Modelling in a Fetch-Limited Semi-Enclosed Lagoon. Coast. Eng. 2009, 56, 599–608. [Google Scholar] [CrossRef]
  94. Morote-Sánchez, B.; López-Castejón, F.; Gilabert, J. Waves in a Temperate, Microtidal and Restricted Mediterranean Coastal Lagoon. Ocean. Model. 2025, 197, 102578. [Google Scholar] [CrossRef]
  95. Young, I.R.; Verhagen, L.A. The Growth of Fetch Limited Waves in Water of Finite Depth. Part 1. Total Energy and Peak Frequency. Coast. Eng. 1996, 29, 47–78. [Google Scholar] [CrossRef]
  96. Pascolo, S.; Petti, M.; Bosa, S. On the Wave Bottom Shear Stress in Shallow Depths: The Role of Wave Period and Bed Roughness. Water 2018, 10, 1348. [Google Scholar] [CrossRef]
  97. Leonardi, N.; Ganju, N.K.; Fagherazzi, S. A Linear Relationship between Wave Power and Erosion Determines Salt-Marsh Resilience to Violent Storms and Hurricanes. Proc. Natl. Acad. Sci. USA 2016, 113, 64–68. [Google Scholar] [CrossRef]
  98. Karambas, T.; Samaras, A. An Integrated Numerical Model for the Design of Coastal Protection Structures. J. Mar. Sci. Eng. 2017, 5, 50. [Google Scholar] [CrossRef]
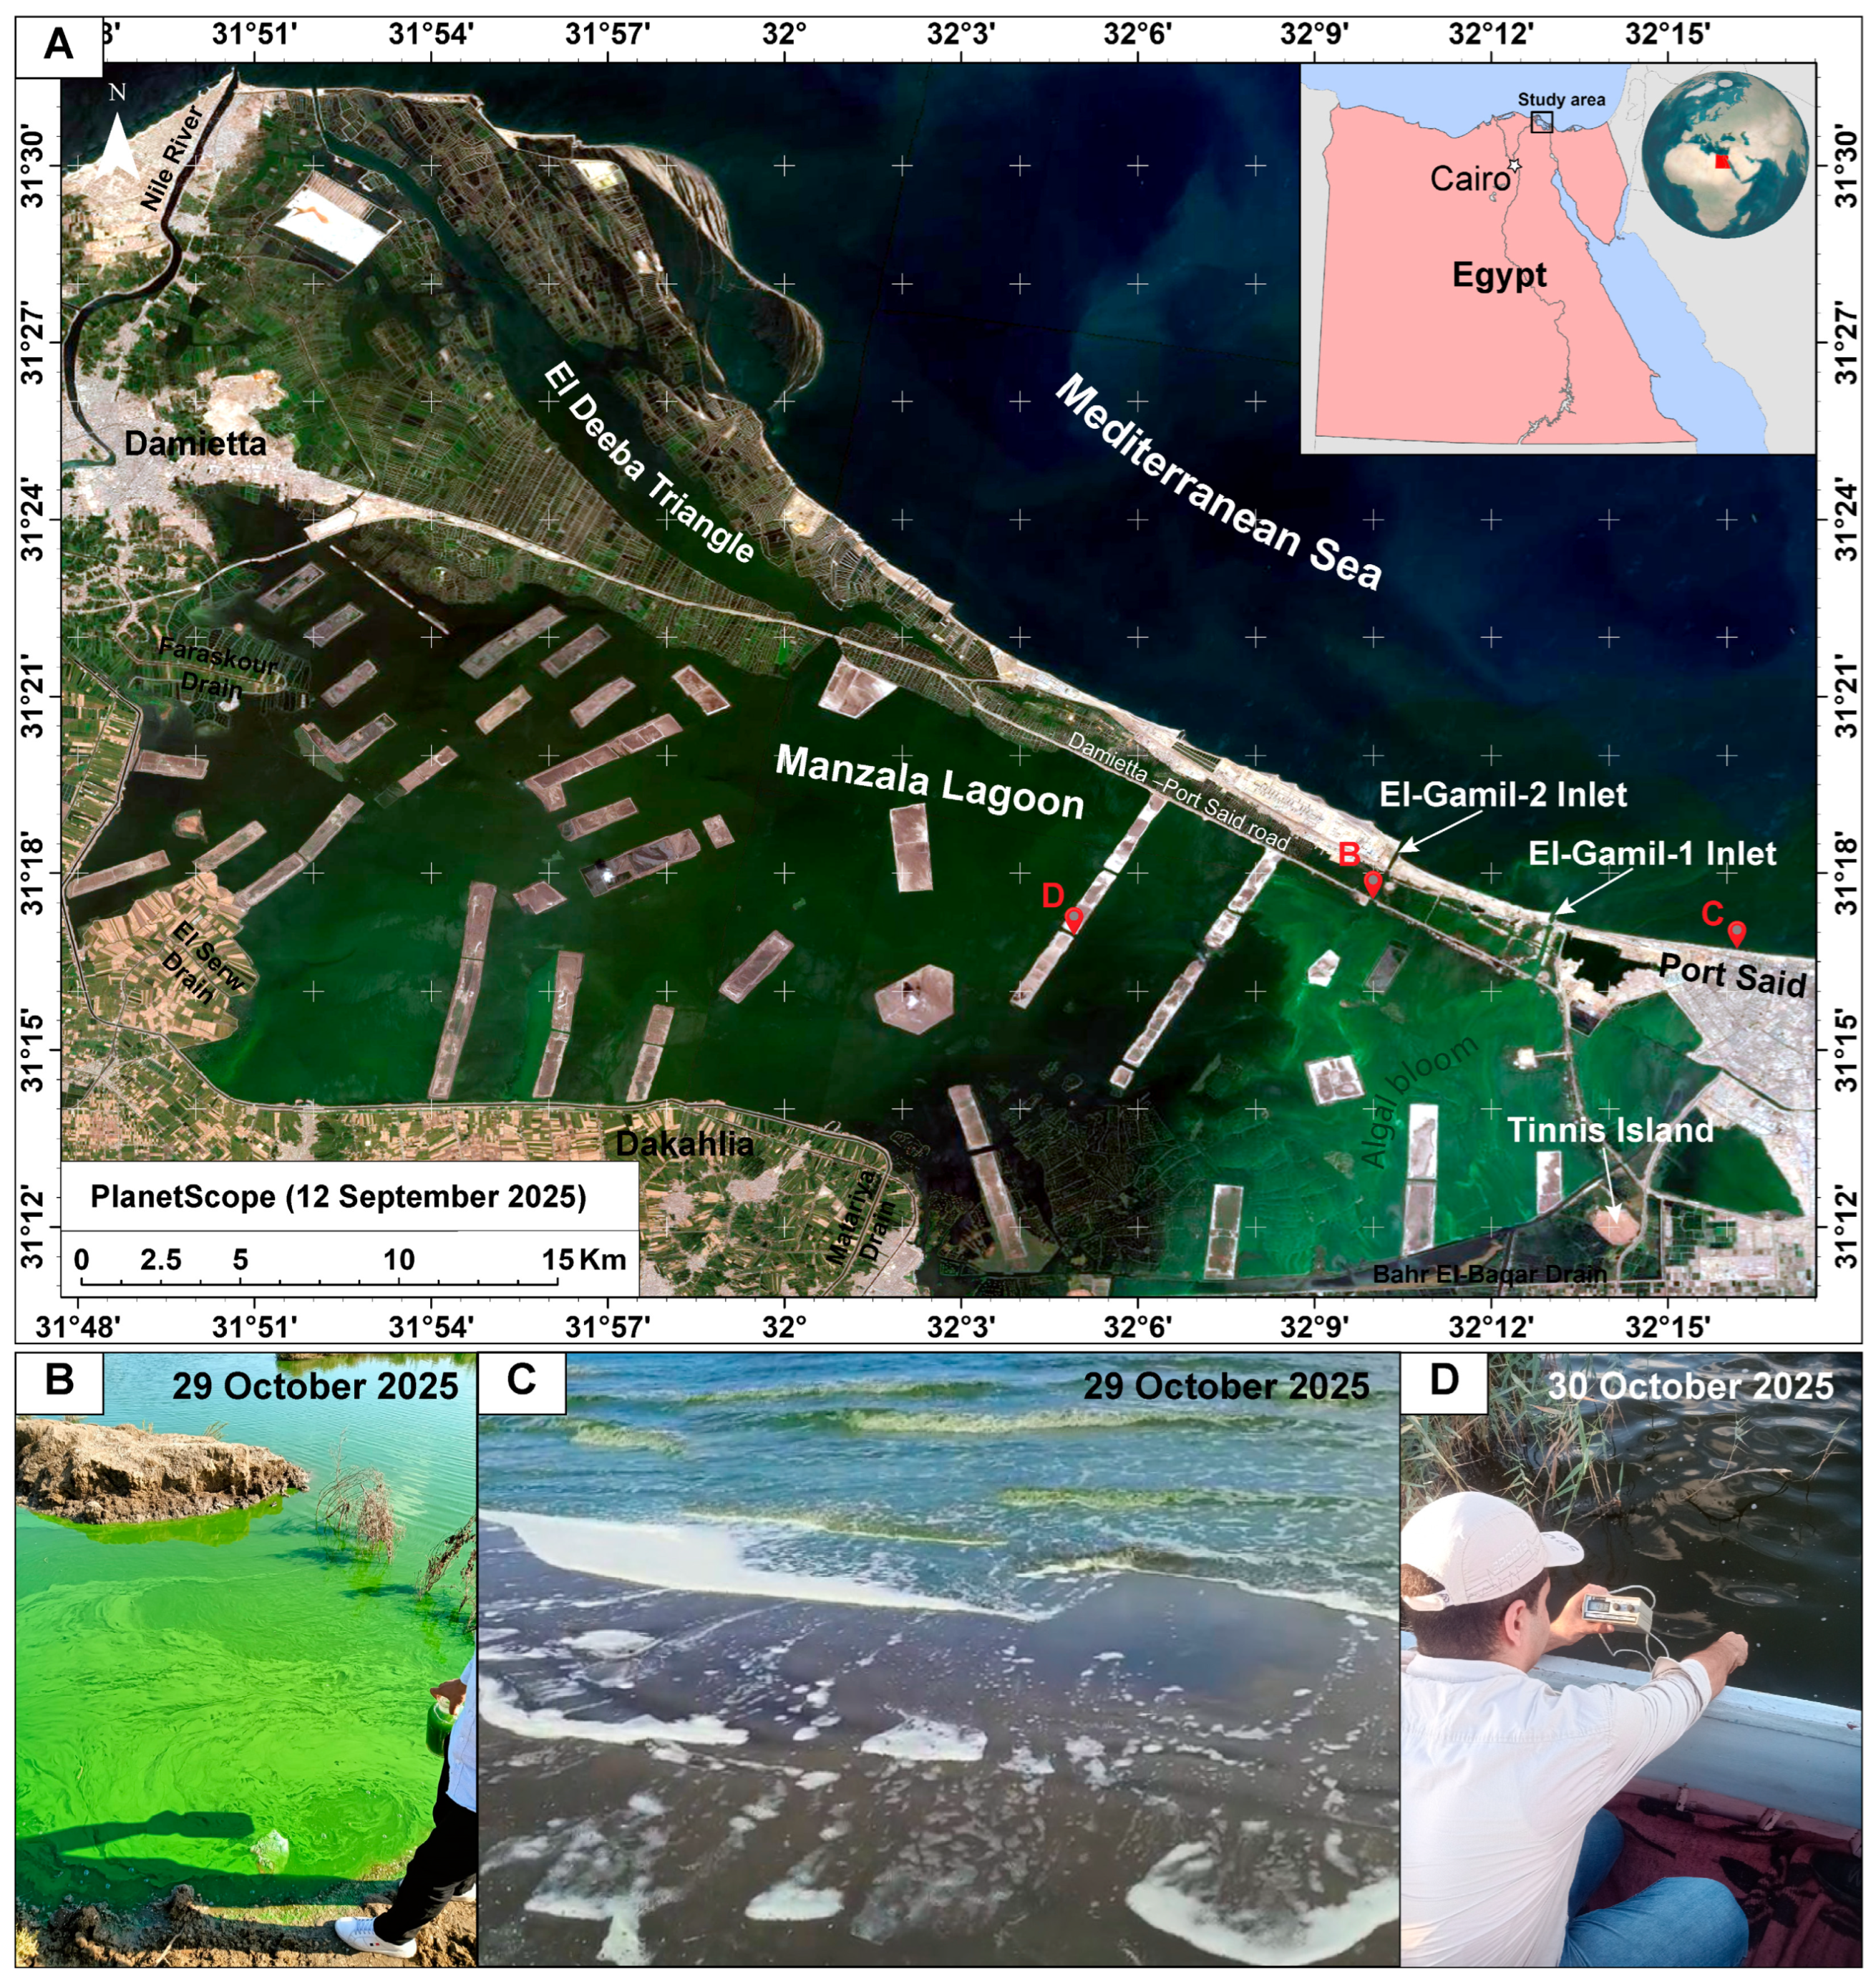
Figure 1. (A) PlanetScope satellite imagery location map of the study area, illustrating the rectangular man-made islands and land-connected sand barriers in the Manzala Lagoon. (B,C) Field photographs illustrate the green algal blooms at selected sites in (A). (D) Field photograph shows the water chemical properties measurement.
Sustainability 18 04889 g001
Figure 2. (A) Temporal evolution of Manzala Lagoon vegetation and water extent (1985–2025) derived from NDWI and NDVI indices. (B) Landsat 9 “Agriculture” composite (Bands 6-5-2; SWIR-1, NIR, Blue) from 29 April and 29 September 2025, highlighting condensed mats of water hyacinth and algal blooms in the eastern lagoon during September. (C,D) Airbus imagery (May–June 2025) and field photographs (August 2025) showing dense vegetation in western and southeastern sectors.
Sustainability 18 04889 g002
Figure 3. (A) Med-MFC WSE from 1 January 2024 to 1 July 2025. (B) Validation of the Med-MFC WSE over a lunar month (28 April to 28 May 2025) against the NIOF ground-fixed station in Alexandria (r = 0.916; RMSE = 6.738 cm). (C) Wind rose diagram showing the dominant wind directions and frequencies in the study area during the period 1975–2024. (D) Wave rose diagram illustrating the prevailing wave directions, frequencies, and H s in the study area during the same period.
Sustainability 18 04889 g003
Figure 4. Bathymetric maps used in the hydrodynamic modeling, integrated from echo-sounder surveys and GEBCO 2025 global bathymetric data. (A) Pre-purification condition (2017, Scenario 0), (B) Post-intervention (2025, Scenario 1), (C) Scenario 2, and (D) Scenario 3.
Sustainability 18 04889 g004
Figure 5. (AD) High-resolution Cartesian grids used in the CMS-Wave and CMS-Flow hydrodynamic simulations. (E) Zoomed-in view highlighting the refined mesh points used to enhance resolution within narrow water pathways, such as the El-Gamil-1 inlet.
Sustainability 18 04889 g005
Figure 6. CMS-Wave model simulated spatial distribution of significant wave height within Manzala Lagoon under four hydrodynamic scenarios: (A) Pre-purification condition (2017, Scenario 0), (B) Post-intervention condition (2025, Scenario 1), (C) Scenario 2, and (D) Scenario 3. These results illustrate the spatial variability of wave height across the lagoon, emphasizing the effects of restoration interventions and proposed management scenarios on wave fetch, propagation, and attenuation processes.
Sustainability 18 04889 g006
Figure 7. CMS-Flow model results for the pre-purification condition (2017, Scenario 0). (A) Maximum flood tide and associated wave-induced current magnitude. (B) Maximum ebb tide and associated wave-induced current magnitude. (C) WSL distribution during the maximum flood. (D) WSL distribution during the maximum ebb.
Sustainability 18 04889 g007
Figure 8. CMS-Flow model results for the post-intervention condition (2025, Scenario 1). (A) Maximum flood tide and associated wave-induced current magnitude. (B) Maximum ebb tide and associated wave-induced current magnitude. (C) WSL distribution during the maximum flood. (D) WSL distribution during the maximum ebb.
Sustainability 18 04889 g008
Figure 9. CMS-Flow model results for the proposed scenario of removing sand barriers (Scenario 2). (A) Maximum flood tide and associated wave-induced current magnitude. (B) Maximum ebb tide and associated wave-induced current magnitude. (C) WSL distribution during the maximum flood. (D) WSL distribution during the maximum ebb.
Sustainability 18 04889 g009
Figure 10. CMS-Flow model results for the proposed scenario of dug channels (Scenario 3). (A) Maximum flood tide and associated wave-induced current magnitude. (B) Maximum ebb tide and associated wave-induced current magnitude. (C) WSL distribution during the maximum flood. (D) WSL distribution during the maximum ebb.
Sustainability 18 04889 g010
Figure 11. Quantitative analysis of hydrodynamic variations within Manzala Lagoon. (A) Satellite imagery maps (2017 and 2025) showing the measuring points (1–20) used for measuring marine current magnitude and WSE variations throughout the month within the lagoon basin. (B) Box plots comparing current magnitudes at the monitoring points across Scenarios 0–3. (C) Box plots comparing WSE range values at the same points across Scenarios 0–3, highlighting the hydrodynamic response of the lagoon to restoration and management interventions. Observation points 1–6 are located in the eastern sector proximate to El-Gamil inlets, the primary conduits for direct Mediterranean water exchange, while points 18–20 are situated within El Deeba Triangle, a sub-basin maintaining independent direct connectivity with the Mediterranean through multiple navigation channels; both clusters characteristically exhibit higher current velocities and tidal ranges than interior lagoon stations across all scenarios.
Sustainability 18 04889 g011
Table 1. Summary of CMS-Flow model results showing spatial variations in current velocity and tidal range across the western and eastern sectors of Manzala Lagoon under the four simulated scenarios.
ScenarioCurrent Velocity (cm/s)Tidal Range (cm)
Western SectorEastern SectorSD *Western SectorEastern SectorSD *
Scenario-03.96.264.992.146.95.49
Scenario-15.077.23.953.333.671.26
Scenario-25.326.622.673.523.590.56
Scenario-35.566.181.813.563.620.67
* SD denotes the standard deviation of mean current velocity and tidal range values calculated from the observation points distributed along the lagoon.
Disclaimer/Publisher’s Note: The statements, opinions and data contained in all publications are solely those of the individual author(s) and contributor(s) and not of MDPI and/or the editor(s). MDPI and/or the editor(s) disclaim responsibility for any injury to people or property resulting from any ideas, methods, instructions or products referred to in the content.