Article

Multidimensional Comparative Assessment of Decarbonization Technologies for Cement Production: Evidence from China

1
State Key Laboratory of Regional and Urban Ecology, Research Center for Eco-Environmental Sciences, Chinese Academy of Sciences, Beijing 100085, China
2
University of Chinese Academy of Sciences, Beijing 100049, China
3
School of Environment, Tsinghua University, Beijing 100084, China
4
Huzhou Institute, Zhejiang University, Huzhou 313001, China
5
Institute of Process Engineering, Chinese Academy of Sciences, Beijing 100085, China
*
Author to whom correspondence should be addressed.
Sustainability 2026, 18(10), 4828; https://doi.org/10.3390/su18104828
Submission received: 9 April 2026 / Revised: 5 May 2026 / Accepted: 6 May 2026 / Published: 12 May 2026
(This article belongs to the Section Air, Climate Change and Sustainability)

Abstract

Rapid urbanization and escalating demands for pollution and carbon reduction pose significant challenges to the cement industry in China, characterized by high energy consumption and emissions. However, a multidimensional framework to assess the synergies and trade-offs between environmental, carbon, and economic effects for various decarbonization technologies in cement production is still lacking. Here, six application scenarios of new suspension preheater dry process cement production were developed and evaluated using a life cycle assessment (LCA) framework to quantify environmental impacts, synergistic reduction of pollution and carbon emissions (SRPC), and economic performance. A multi-attribute decision-making model, Analytic Hierarchy Process–entropy–TOPSIS (AHP–entropy–TOPSIS), was applied to assess environmental–economic trade-offs. The results indicate that biomass fuel substitution and high grinding efficiency achieved the best SRPC and environmental–economic trade-off scores (Snorm: 0.17–0.22). Alternative raw materials moderately reduced carbon but increased pollutant emissions and economic uncertainty (Snorm: 0.14–0.20). Mono-ethanolamine absorption and calcium looping provided substantial carbon reduction but weaker overall performance due to environmental trade-offs and higher costs (Snorm: 0.12–0.16). These findings provide quantitative guidance for prioritizing and combining decarbonization strategies to support the green transition and sustainable development of the cement industry.

1. Introduction

The cement industry, characterized by high carbon emissions, intensive energy consumption, and severe pollution, has become a focal point of global climate governance amid the climate crisis and the imperative to meet the 1.5 °C target set by the Paris Agreement [1]. Cement production requires substantial fuel input for limestone calcination [2], resulting in significant carbon emissions—particularly from carbonate decomposition during clinker production, which accounts for twice the emissions of fuel combustion [3]. As the largest cement producer in the world, China manufactured 2.38 billion tons of cement in 2022, accounting for 5–9% of global carbon emissions [4]. Notably, cement production in China is predominantly based on the new suspension preheater (NSP) dry process [5], which constitutes the mainstream industrial configuration and forms the basis for most decarbonization strategies. Additionally, the process emits multiple air pollutants, including sulfur dioxide (SO2), nitrogen oxides (NOx), and particulate matter (PM), contributing to serious air pollution [6]. Therefore, it is of great significance to conduct an integrated assessment of feasible emission-reduction strategies in China’s cement sector, particularly through the evaluation of technological pathways.
The development and deployment of decarbonization technologies show considerable potential for carbon mitigation, representing a critical strategy for enabling sustainable development in the cement industry [7]. These technologies demonstrate diverse development trajectories, including raw material and fuel substitution, process optimization, and carbon capture, utilization, and storage (CCUS) technologies [8,9,10,11]. Notably, CCUS technology is projected to contribute up to 42% of sectoral emission reductions in the European Union by 2050 [8]. However, these technologies exhibit substantial variation in their environmental and economic impacts. For instance, alternative fuels reduce reliance on fossil energy but may increase the risk of acidification, while CCUS facilitates deep decarbonization at the expense of higher energy consumption and capital costs [12]. These conflicts across the multidimensional performance of various decarbonization technologies create barriers for integrated assessment and optimal technology selection.
To systematically evaluate these technologies, life cycle assessment (LCA) has been widely applied in the cement industry to quantify environmental impacts [13] and simulate future scenarios of low-carbon technological pathways [14]. Existing studies have explored raw materials substitution [15], alternative fuels (e.g., solid recovered fuel (SRF), refuse-derived fuel (RDF), tire-derived fuel (TDF), biological sludge (BS), and hydrogen) [6,16,17], new cement processes [18], and carbon capture technologies [19,20,21] across various geographic contexts. These efforts aim to identify optimal decarbonization pathways [22,23,24] and to evaluate future emission-reduction potential under varied technology application scenarios [25]. Although individual technologies have been thoroughly evaluated, cross-technology comparisons are hindered by inconsistencies in system boundaries, functional units, methodological choices, technological processes, geographical scopes, and underlying assumptions [26,27]. Thus, a unified and systematic framework is needed to enable consistent cross-technology comparisons across all cement production stages.
In parallel, synergistic reduction of pollution and carbon (SRPC) has emerged as a key strategy under global climate and environmental governance agendas. SRPC involves a multifaceted alignment of environmental objectives through upstream-downstream coordination and integrated management across various media and impact indicators. SRPC assessments aim to identify strategies that maximize environmental co-benefits. Prior studies have largely focused on macro-level assessments at regional or sectoral scales [28], and in the cement sector, existing research has explored technology-level synergistic benefits using bottom-up optimization models [29], the marginal abatement cost method [30], and monetized evaluations integrating energy efficiency supply curves [31]. However, these studies primarily examine the synergies between carbon and air pollutants at the atmospheric scale, while neglecting other environmental impacts and potential trade-offs linked to decarbonization. Thus, quantitative evaluations of synergistic effects at the technology level remain limited. This challenge is consistent with broader difficulties in resolving coupled system behaviors under multi-factor interactions observed in complex engineered systems [32,33]. In addition, although numerous studies have assessed the environmental performance of decarbonization technologies, few have systematically examined the trade-offs between environmental and economic dimensions [34,35]. Moreover, existing multi-criteria decision-making approaches often rely exclusively on either subjective or objective weighting schemes, potentially resulting in biased or one-dimensional technology rankings [36].
Therefore, to address these limitations—specifically, inconsistent comparison boundaries and inadequate multidimensional trade-off analysis—there is a critical need for a comprehensive and integrative technology assessment framework that simultaneously considers environmental and economic dimensions, along with their associated synergies and trade-offs. As such, this study aims to: (1) quantitatively assess the environmental impacts, SRPC, and economic performance of commonly used decarbonization technologies in the cement industry from a life cycle perspective. These assessments were conducted under a unified system boundary, utilizing a benchmark model based on traditional cement production processes in China and parametric technology application scenarios, thereby enabling direct and comparable evaluation across diverse technology types; (2) integrate SRPC with life cycle assessment (LCA), extending the evaluation of pollution–carbon synergy from simple pairwise interactions (carbon versus air pollutants) to multiple environmental impact categories; and (3) develop a multi-attribute decision-making (MADM) model that combines subjective and objective weighting through the analytic hierarchy process (AHP)–entropy method coupled with the technique for order preference by similarity to ideal solution (TOPSIS), referred to as the AHP–Entropy–TOPSIS method, to systematically assess environmental–economic trade-offs across different technology scenarios. The findings can facilitate policy formulation and investment prioritization, offering a scientific foundation for promoting sustainable cement production in China.

2. Materials and Methods

2.1. Goal and Scope

Following ISO 14040 [37] and ISO 14044 [38] standards, the LCA process comprises four main phases: (1) goal and scope definition; (2) life cycle inventory (LCI) analysis; (3) life cycle impact assessment (LCIA); and (4) interpretation of results, including recommendations for improvement. The objective was to analyze the environmental and economic performance of various decarbonization technology scenarios in the Chinese cement industry to elucidate the respective advantages and disadvantages of each technology. The baseline scenario (S0) was constructed for the purpose of comparison, based on a cement plant with a production capacity of 4000 tons of clinker per day (t cl/d). The functional unit was defined as 1 ton of Ordinary Portland Cement (OPC) with a compressive strength of 42.5 MPa.
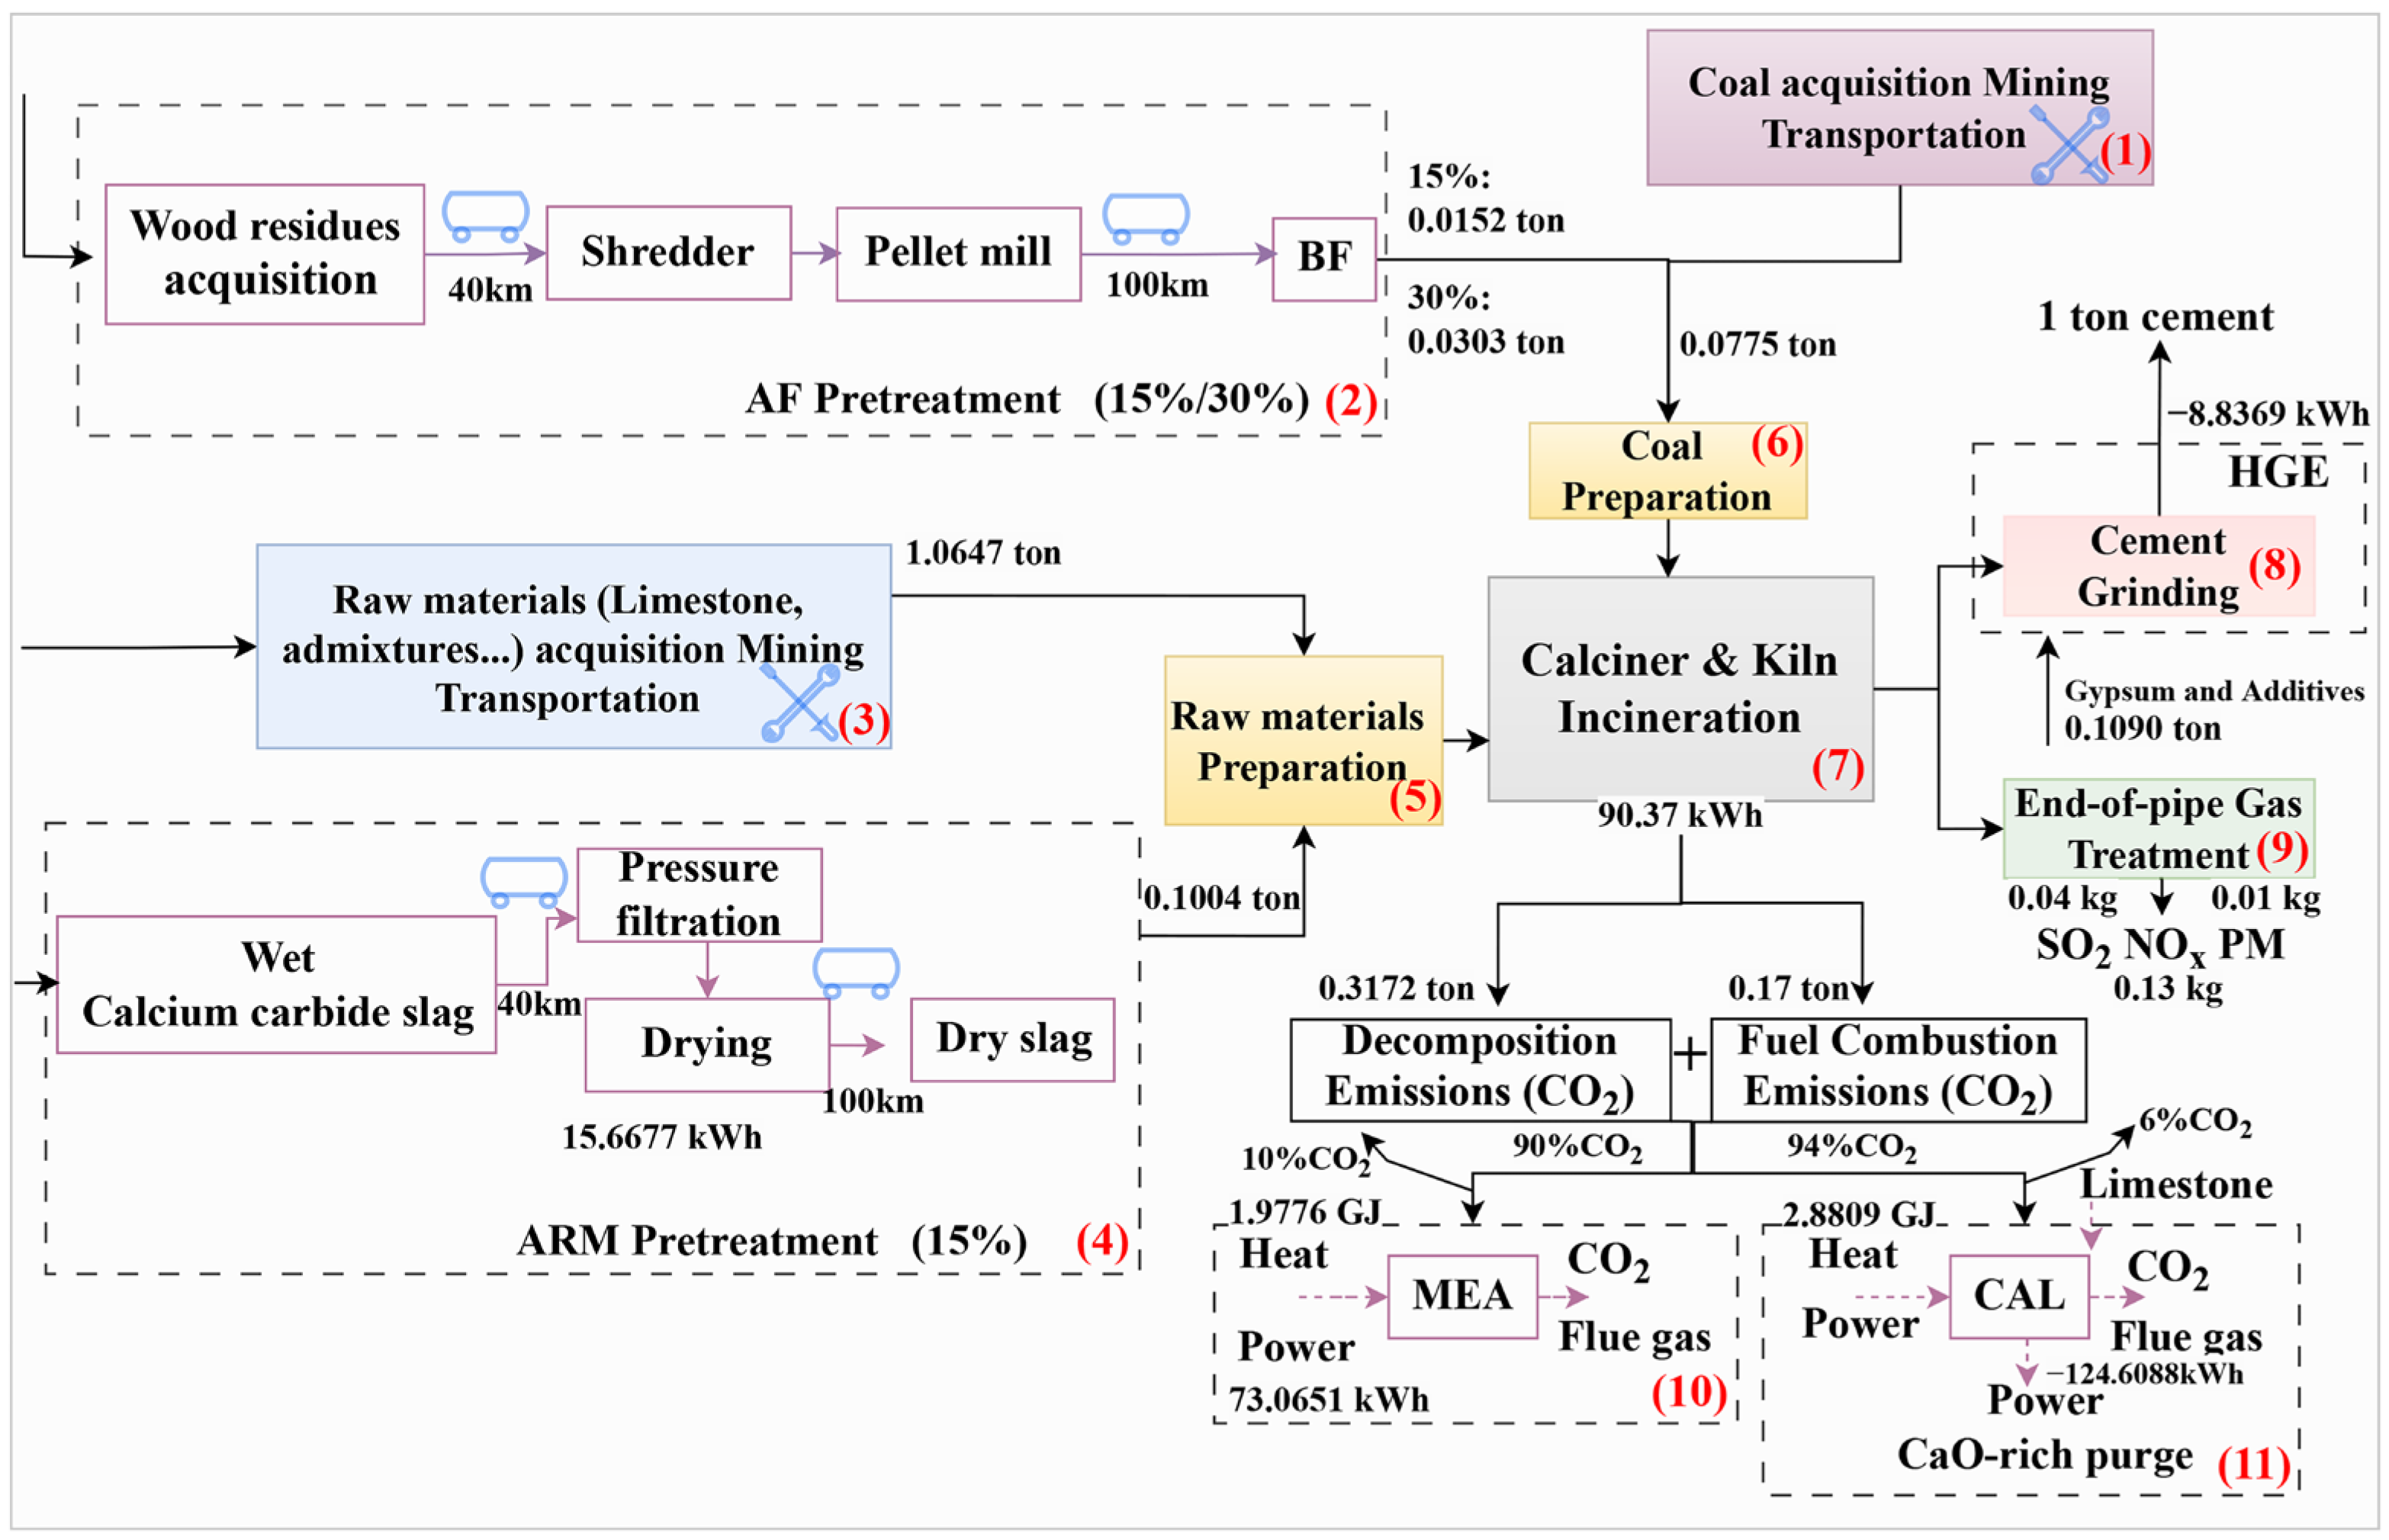
The system boundary was analyzed from cradle to gate, as shown in Figure 1. For S0, the cement production process was divided into seven stages: Process (1) and (3) involved the acquisition of raw materials (e.g., limestone, sandstone) and coal, encompassing extraction, processing, and transportation; (5) and (6) focused on the preparation of raw materials and fuels, including grinding and homogenization processes; (7) represented the incineration stage, during which fuel combustion, carbonate decomposition, carbon and pollutant emissions occurred, along with the implementation of end-of-pipe control technologies (process 9), including bag filters, selective non-catalytic reduction (SNCR), and limestone-gypsum desulfurization; and (8) corresponded to the milling stage, which involved the grinding of clinker with gypsum and other additives.
A series of hypothetical decarbonization technology scenarios was developed to evaluate the potential impacts of various pathways toward carbon neutrality. These scenarios encompassed all additional upstream, downstream, and on-site processes resulting from technological modifications. For alternative raw materials (ARM, Figure 1. process (4)), it replaced limestone with calcium carbide slag with 15% substitution rates, reducing calcination emissions but increasing electricity demand for slag drying. For high grinding efficiency (HGE, Figure 1. process (8)), it improved energy efficiency during the grinding stage, reducing electricity consumption. For biomass fuel (BF, Figure 1. process (2)) as an alternative fuel (AF), it substituted 15% and 30% of the calcination heat input, increasing pretreatment electricity consumption and changing the system’s carbon and pollutant emission processes. This scenario assumed biomass carbon neutrality and did not account for potential land-use changes or counterfactual residue management. For mono-ethanolamine (MEA, Figure 1. process (10)) absorption, it employed MEA-based chemical absorption to capture CO2, requiring significant steam for solvent regeneration. For calcium looping (CAL, Figure 1. process (11)), it applies calcium looping to capture CO2 post-combustion, with partial heat recovery offsetting energy demands.

2.2. Inventory Sources and Assumptions

Prospective data for S0 were primarily obtained from on-site operational data collected in 2021 from a typical NSP cement production line in northern China. The dataset reflects the typical energy use and process practices of NSP cement production in China and serves as a unified baseline for comparative assessment of decarbonization scenarios [5,11]. Background data were sourced from the Ecoinvent 3 database [39] and modeled using SimaPro 9.5 software. For the six technology scenarios, the detailed technical assumptions are described below. The underlying technical principles are described in the Supplementary Materials Text S1, while the technological parameters and sources are summarized in Table S1. The resulting life cycle inventories are presented in Table 1.
In the ARM scenario, a 15% substitution of limestone with calcium carbide slag was assumed not to affect cement plant operation or clinker quality. At the macroscopic level, this assumption is supported by previous studies showing that, when appropriate chemical moduli (e.g., Lime Saturation Factor (LSF), Silica Modulus (SM), and Alumina Modulus (AM)) are maintained, clinker phase composition can remain within the typical OPC range, ensuring comparable mechanical performance [40,41]. However, from a microscopic perspective, variations in calcium availability and coordination environment may still influence hydration product structure and material properties [42]. Therefore, while performance equivalence is considered achievable, the residual uncertainties have been characterized through the uncertainty analysis described below. The limestone substitution caused only minor changes in raw meal chemistry; electricity consumption during raw material preparation was assumed to remain unchanged. On the basis of the mass balance of the four principal oxides (CaO, SiO2, Al2O3, and Fe2O3), the required amount of calcium carbide slag and the supplementary inputs of sandstone, bauxite, and steel slag were recalculated. The composition of all raw materials is reported in Table S2. The moisture content of calcium carbide slag upon delivery to the cement plant was assumed to be approximately 15%. Prior to transport, calcium carbide slag with an initial moisture content of about 90% underwent filter pressing and drying; the associated electricity demand and process parameters were derived from an on-site industrial survey. Limestone substitution reduced the thermal demand for carbonate decomposition in the kiln system, thereby lowering coal consumption. Accordingly, carbon emission changes in the ARM scenario mainly resulted from reduced process emissions associated with lower carbonate decomposition and decreased fuel consumption. Detailed calculations are provided in Table S3 (Equations S(3.2)–S(3.6)). Relative to S0, ARM was assumed to have no effect on SO2, NOx, or PM emissions. For transportation, all alternative raw materials were assumed to be transported 40 km from their source to the preprocessing facility and 100 km from the preprocessing facility to the cement plant, whereas raw materials and coal of S0 were assumed to be transported directly to the cement plant over a distance of 100 km. All materials were transported by heavy-duty trucks with a transport coefficient of 3.763 kg diesel per t·100 km [43].
For HGE, improved grinding efficiency reduced electricity consumption in the grinding system. It was assumed to have no direct effect on carbon emissions or conventional air pollutant emissions.
In the BF scenario, BF was produced from forestry residues through crushing and pelletizing processes. The residues were assumed to originate locally and were transported by heavy-duty trucks for 40 km to the preprocessing facility and subsequently 100 km to the cement plant. Associated preprocessing losses, electricity consumption, and transportation emissions were obtained from the Ecoinvent database [39]. The fuel properties and chemical composition were derived from an on-site industrial survey (see Table S4). The thermal demand of the cement kiln system was assumed to remain constant. The BF requirements were recalculated based on the lower heating value (LHV) of the fuels and the specified thermal substitution rate (TSR). Carbon emissions were calculated in accordance with the national guidelines for greenhouse gas accounting and reporting for enterprises [44], with biogenic carbon considered carbon-neutral. Conventional air pollutants (NOx and SO2) were estimated using an element balance approach within a multi-input allocation framework [45]. Specifically, fuel-related NOx emissions were calculated from the nitrogen content of the fuel and the corresponding conversion factor, whereas thermal NOx emissions were assumed to remain constant across scenarios [45]. SO2 emissions were estimated from sulfur and chlorine inputs while accounting for the absorption capacity of alkaline materials in the kiln system. PM emissions were assumed to be primarily controlled by end-of-pipe treatment systems and were therefore only marginally affected by fuel substitution [45]. Detailed calculation methods are provided in Table S3 (Equations S(3.1)–S(3.9)).
In the MEA scenario, flue gas was routed to an MEA-based carbon capture system for purification. The MEA solvent was replenished at 1.4 kg per ton of CO2 captured due to degradation during operation, and the system achieved a CO2 absorption rate of 90%. The process required substantial thermal energy for solvent regeneration, as well as electricity for operating fans and pumps in the capture system and for CO2 conditioning, including compression or liquefaction.
In the CAL scenario, flue gas was treated in a calcium looping system, achieving a CO2 absorption rate of 94%. The CaO-rich solids generated by the CAL process were recycled to the cement kiln and incorporated into the raw meal. The process required limestone and thermal energy as inputs, while the CaO-rich solids produced during operation could be internally recirculated. Oxygen was supplied by an air separation unit (ASU). Electricity was required for the ASU, the core CAL process, and CO2 purification; however, part of this demand could be offset through steam generation from process waste heat recovery.

2.3. Life Cycle Impact Assessment

We assessed the environmental impacts of all scenarios using the Recipe 2016H method [46], which converted LCIs—including resource consumption and emissions into environmental impact indicators through characterization factors. Considering the consistency of system boundaries across scenarios, we selected environmental impact categories that were highly relevant to emissions from the cement industry and corresponded to the pollutants in LCI, including global warming potential (GWP), fine particulate matter formation (FPMF), and terrestrial acidification (TA). Among the impacts, GWP quantified the contribution of greenhouse gases to climate change and served as an indicator of carbon effect, while FPMF and TA were classified as pollution effects.

2.4. SRPC Assessment

To quantify the SRPC of the decarbonization technologies, we applied the synergistic effect coefficient method [47] (see Equations (1)–(3)) to calculate the coefficients linking carbon effect with two pollution effect indicators across six technology scenarios. Since pollutants of equal mass can have varying types and magnitudes of environmental impacts, comparing their synergistic effects solely based on mass is inappropriate [48]. Therefore, we standardized each environmental impact as a fraction of the pollutant’s total global emissions, enabling a normalized assessment of synergy, and defined the normalized SRPC Index (SI) based on the reduction rates of environmental and carbon impacts as follows.
E I i , j = Δ E i , j E 0 , j = E 0 , j E i , j E 0 , j
G W P I i = Δ G W P i G W P 0 = G W P 0 G W P i G W P 0
S I = E I i , j G W P I i
where E0,j is the jth pollution effect indicator in S0; Ei,j is the jth pollution indicator in the ith technology; EIi,j is the pollution reduction rate (%) of the jth pollution indicator for the ith technology relative to the S0. GWP0 is the GWP value in S0, and GWPi is the GWP value in the ith technology. GWPIi is the carbon reduction rate (%) of GWP for the ith technology compared to the S0. The SRPC Index (SI) is used to assess the synergetic relationship between pollution and carbon reduction. Based on the sign of SI and GWPIi, synergetic effects are further classified into four categories: (1) SI < 0 and GWPIi > 0 indicate carbon reduction with pollution increase; (2) SI < 0 and GWPIi < 0 indicate pollution reduction with carbon increase; (3) SI > 0 and GWPIi > 0 indicate co-reduction of pollution and carbon emissions; (4) SI > 0 and GWPIi < 0 indicate co-increase, where both indicators increase simultaneously.

2.5. Economic Assessment

To assess the economic feasibility of six technological scenarios per functional unit, we established a net cost (NC) accounting framework for cement production [49]. With the baseline scenario S0 as the reference, the incremental cost (IC) and incremental benefit (IB) of technology implementation were quantified (see Equations (4)–(7)). Cost and benefit data were obtained from corporate environmental reports, database, and on-site industrial survey, while detailed economic parameters are provided in Table 2.
The total annualized cost (TAC) consists of annualized capital investment, fixed operating costs, and variable operating costs:
T A C = C c a p , a n n + C f i x + C v a r
where Ccap,ann represents the capital investment annualized using a discount rate of 7% to account for the time value of money [50]; Cfix denotes fixed operating costs (e.g., maintenance and labor); Cvar refers to variable costs such as raw materials, fuels, and electricity consumption. These values are based on the industry database [50].
IC includes the TAC as well as additional preprocessing and transportation costs associated with process modifications.
I C = T A C + I C p r e + I C t r a n
where ICpre represents the annualized cost and energy consumption of additional preprocessing facilities (e.g., crushing, drying, or dewatering of alternative fuels or materials before entering the production system); ICtran represents the difference between additional transportation costs due to new material supply and transportation savings resulting from reduced raw material and fuel consumption.
IB mainly arises from cost savings due to energy and resource substitution, as well as revenues from material treatment fees.
I B = B e l e + B c o a l + B r a w + B f e e
where Bele represents the benefit from electricity savings; Bcoal denotes the benefit from coal savings; Braw refers to the raw material substitution benefits; Bfee represents revenues from material treatment services.
Finally, NC is defined as the difference between IC and IB; its negative value represents the net benefit (NB).
N C = I C I B
All costs and benefits are normalized to the functional unit. When NC < 0, the technology generates net economic benefits; when NC > 0, additional economic investment is required. This framework integrates technology investment, operational costs, and economic compensation from resource substitution, thereby enabling a comparable economic evaluation of different decarbonization technology scenarios.

2.6. Environmental–Economic Trade-Offs via AHP–Entropy–TOPSIS Framework

To comprehensively evaluate the environmental–economic trade-offs among decarbonization technologies, we employed the AHP–Entropy–TOPSIS model [36]. This model integrates the objective weighting of the entropy method with the subjective weighting of AHP and the relative closeness evaluation of the TOPSIS method, and is widely used in multi-criteria decision-making analysis (see Equations (8)–(14)). In this study, the raw data were first normalized to eliminate dimensional differences among indicators. For positive indicators, the normalization equation is given as follows:
r i j = x i j m i n x j m a x x j m i n x j
The entropy weight of each indicator wj was determined based on the information entropy ej:
p i j = r i j i = 1 m r i j , k = 1 ln m , e j = k i = 1 m p i j ln p i j , w j = 1 e j j = 1 n ( 1 e j )
where pij represents the normalized proportion and k denotes the normalization coefficient.
For the AHP method, a pairwise comparison matrix was constructed, and the weight vector wahp= [w1, w2, …, wn] was obtained by normalizing the eigenvector corresponding to the maximum eigenvalue λmax of the matrix. The consistency of the matrix was verified using the consistency index (CI) and the consistency ratio (CR):
C I = λ m a x n n 1 , C R = C I R I
where RI is the random consistency index for the matrix size n. A CR value less than 0.1 indicates acceptable consistency.
The final hybrid weight wc for each indicator was obtained by equally combining the AHP and entropy weights:
w c = 0.5 w j + 0.5 w a h p
Then, the positive and negative ideal solutions were determined as:
D i + = j = 1 n w c ( r i j r j + ) 2 , D i = j = 1 n w c ( r i j r j ) 2
where is the weighted normalized value, vj+ and vj- represent the positive and negative ideal solutions for each indicator, respectively.
Finally, the relative closeness coefficient Si was calculated for each scenario to rank and evaluate the overall performance of the technological pathways:
S i = D i D i + + D i
S n o r m = S i S i
where Si is the final evaluation score, and Snorm is the normalized score, where values closer to 1 indicate a more sustainable overall performance.

2.7. Uncertainty and Sensitivity Analysis

Uncertainty in key technical parameters was characterized to reflect both the variability in their source data and potential deviations affecting functional equivalence using a Monte Carlo simulation with 1000 iterations [52], including energy consumption, heat demand, and transportation distances.
Moreover, A sensitivity analysis was performed to identify the most critical parameters and evaluate their influence on the environmental impacts and economic performance of the technologies [52]. For environmental impact parameters, each key parameter was independently varied by ±10% from its baseline value. For economic parameters, which inherently exhibit practical variation ranges, adjustments were applied according to their actual ranges, while all other variables were held constant. The resulting changes in each indicator were quantified using sensitivity coefficients (Eᵢ,ⱼ), as specified in Equation (15).
E i , j = A i F j
where ΔFj denotes the relative change in the j-th input factor with respect to its baseline value—±10% for environmental parameters and the actual relative variation for economic parameters. ΔAi represents the corresponding relative change in the i-th environmental or economic indicator with respect to its baseline. The sensitivity coefficient of each input variable is defined as Ei,j. Higher values of Ei,j indicate greater sensitivity. Sensitivity levels are commonly classified into four categories: Ei,j ≥1 indicates a highly sensitive parameter; 0.2 ≤ Ei,j <1 indicates a sensitive parameter; 0.05 ≤ Ei,j ≤ 0.2 reflects low sensitivity; and 0 ≤ Ei,j <0.05 denotes an insensitive parameter.

3. Results and Discussion

3.1. Environmental Impacts

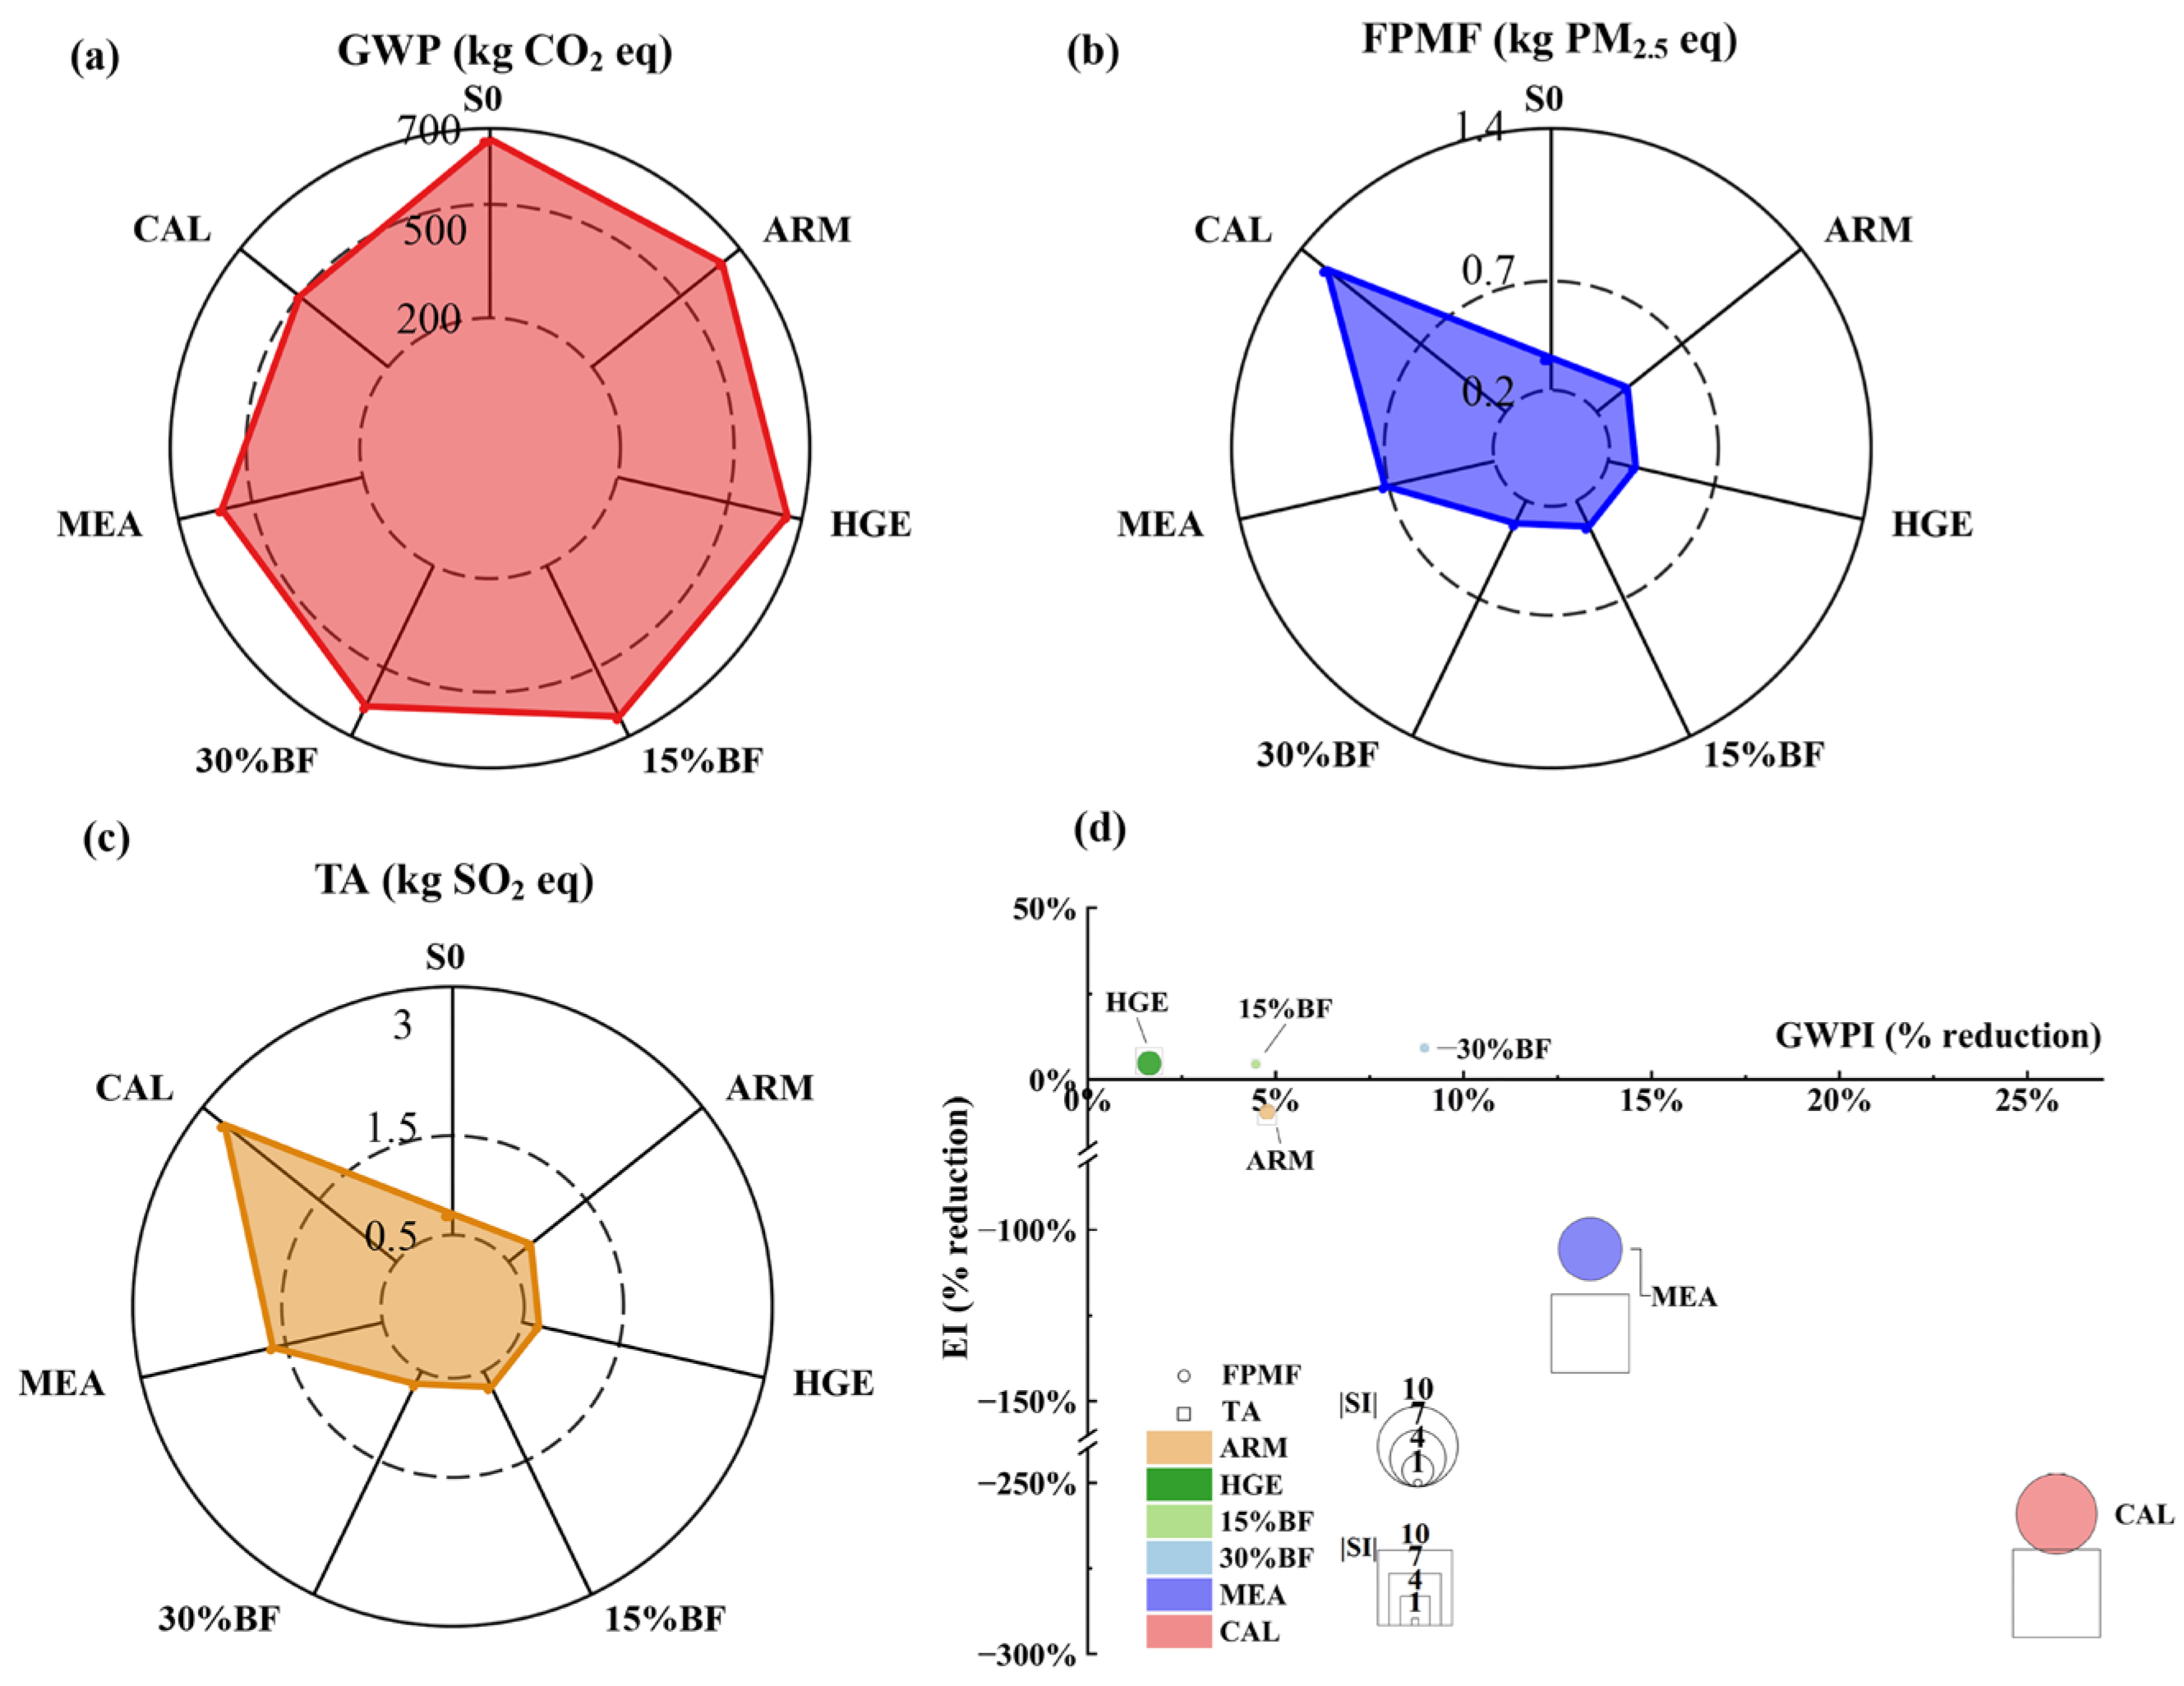
Figure 2a–c illustrate the performance of different technology scenarios across three environmental impacts, while Figure 2d presents the environmental impact mitigation rate (%) and carbon–pollution mitigation synergy of the six technologies compared to S0. Overall, the environmental performance of the technologies varied significantly. 30%BF, 15%BF, and HGE exhibited the most coordinated environmental impact performance. By contrast, ARM, MEA, and CAL technologies showed evident pollution transfer effects, although CAL achieved the most significant reductions in GWP.
A contribution analysis was conducted to examine the sources of environmental impacts across different scenarios. In S0, calcination emerged as the dominant source of environmental burdens for GWP, contributing about 80% of the total stage. Cement grinding was identified as the second-largest contributor. For FPMF and TA, contributions from the cement grinding stage significantly exceeded those from calcination, primarily due to the reliance on thermal power generation. This finding aligns with the conclusions of [53], highlighting the critical role of clean electricity.
For GWP, although raw material preprocessing increased GWP due to additional electricity consumption, the reduction in direct carbon emissions resulting from limestone substitution dominated the overall effect, leading to an approximate 5% reduction in GWP. Although HGE significantly reduced electricity consumption, its overall mitigation effect remained limited because other operational parameters were unchanged, resulting in only an approximately 2% reduction in GWP. For BF, although preprocessing slightly increased GWP, the carbon contained in biofuel was treated as biogenic and therefore did not contribute to net greenhouse gas emissions. Consequently, the 15%BF scenario reduced GWP by approximately 4%. With increasing substitution ratios, the mitigation effect became more pronounced, reaching nearly 9% in the 30%BF scenario.
Similarly, the MEA system required additional electricity input and steam for solvent regeneration; however, the direct capture of CO2 substantially outweighed these additional energy burdens, resulting in a GWP reduction of approximately 13%. The CAL technology achieved the most significant mitigation effect, reducing GWP by about 26%. This improvement was primarily attributed to the combined environmental benefits of direct CO2 capture and additional electricity generation, which outweighed the impacts associated with increased natural gas consumption for heating. This finding aligns with Galusnyak et al. [54], indicating that CCS provides the greatest carbon mitigation potential, with CAL emerging as the most sustainable post-combustion carbon capture option due to its system design.
These results highlight a typical system boundary selection effect in energy systems, where indirect energy-related emissions must be balanced against the environmental benefits of carbon removal and by-product utilization [55].
A similar ranking pattern was observed for both FPMF and TA indicators. The ARM scenario exhibited negative mitigation effects (PM2.5 eq: −9%; SO2 eq: −11%) due to the electricity consumption associated with calcium carbide slag preprocessing. This result contrasts with the emission reductions reported in studies on alternative raw materials by Zhang et al. [56], primarily because the present study incorporates additional electricity consumption during preprocessing, highlighting the sensitivity of conclusions to system boundary definitions. Likewise, both MEA (PM2.5 eq: −106%; SO2 eq: −130%) and CAL (PM2.5 eq: −259%; SO2 eq: −282%) resulted in increased emissions. For MEA, the additional electricity and steam heat demand enhanced upstream fossil fuel consumption, leading to higher emissions of particulate precursors and sulfur compounds. In the case of CAL, the emission reductions associated with electricity generation were insufficient to offset the increased emissions caused by additional heat consumption, leading to net emission increases. Although electricity generation under CAL contributed to partial emission reductions, its substantially higher thermal energy consumption relative to MEA resulted in greater net emissions. This observation is consistent with Cavalett et al. [57], emphasizing the detrimental effects of increased energy consumption on other environmental impact categories. By contrast, other technologies demonstrated emission-reduction effects. The HGE scenario reduced emissions mainly through decreased electricity consumption (PM2.5 eq: 5%; SO2 eq: 5%). For BF, emission reductions were primarily attributed to the lower pollutant-forming elemental content of the substitute fuels (PM2.5 eq: 5–9%; SO2 eq: 5–9%).
A sensitivity analysis was conducted on the technological parameters influencing the environmental impacts of each technology, with the sensitivity coefficients presented in Table S5. The environmental impacts of the technologies exhibited varying responses to different parameters. Except for CAL and MEA, the remaining technologies demonstrated low sensitivity to parameter uncertainties, indicating that their performance rankings are generally robust. In contrast, the environmental impacts of CAL and MEA were highly sensitive to the heat parameter, with sensitivity coefficients exceeding 0.3. Although this heightened sensitivity leads to variations in the reduction rates for CAL and MEA, the relative ranking of technologies with respect to environmental impacts remains robust. Moreover, Uncertainty was quantified through the mean, median, standard deviation (SD), coefficient of variation (CV), and standard error of the mean (SEM) (see Table S6). Across all scenarios, except for CAL, CV values remained below 3%, and SEM values were consistently low (<0.6), indicating stable estimates of central tendency. These results suggest that parameter uncertainty exerts a minimal effect on the relative ranking of the evaluated scenarios.
In conclusion, the environmental impacts of various decarbonization technologies varied depending on material inputs, energy structures, and emission characteristics. These results underscore the necessity of a subsequent synergistic effect analysis, particularly because certain technologies exhibit conflicting performances across environmental indicators.

3.2. SRPC Index

Figure 2d presents the SRPC Index (SI) for various technology scenarios between GWP and the two indicators, FPMF and TA. The quadrant in which the SI is located reflects the direction of the SRPC. When the absolute SI value exceeds 1, the rate of change in pollution impacts surpasses that of carbon emissions, meaning that efforts to reduce GWP may result in disproportionately greater changes (positive or negative) in conventional pollution impacts. Conversely, values closer to 1 indicate a more balanced proportional relationship between carbon mitigation and pollution reduction, whereas larger deviations from 1 reflect increasing disproportionality between the two objectives. The SI provides a standardized quantitative metric that simultaneously captures both the direction and magnitude of SRPC, enabling the classification of technologies into four synergy levels. This approach improves interpretability and facilitates structured comparisons among different technological pathways.
The results indicate that the SRPC patterns of FPMF and TA were highly consistent across the evaluated technology scenarios, suggesting that the key processes governing these indicators respond similarly to technological interventions. Technologies such as HGE, 15%BF, and 30%BF demonstrated varying degrees of synergistic effects in reducing both carbon emissions and conventional pollutants.
In contrast, although MEA and CAL achieved reductions in GWP, they exhibited non-synergistic relationships with FPMF and TA, with absolute SI values reaching approximately 8–10. Due to the influence of the most sensitive parameter—heat—the SI values ranged from 6 to 16. However, this variation did not alter the overall ranking of the technologies. This indicates a pronounced imbalance between carbon mitigation and pollution reduction, whereby climate benefits are accompanied by increased burdens in other environmental impact categories. Similar findings were reported by [58], where implementation of MEA led to improvements in GWP, while other environmental impact categories exhibited adverse effects.
These trade-offs are particularly critical in long-term infrastructure planning, where improvements in one environmental dimension may conflict with broader sustainability or resource efficiency goals.

3.3. Economic Assessment Results

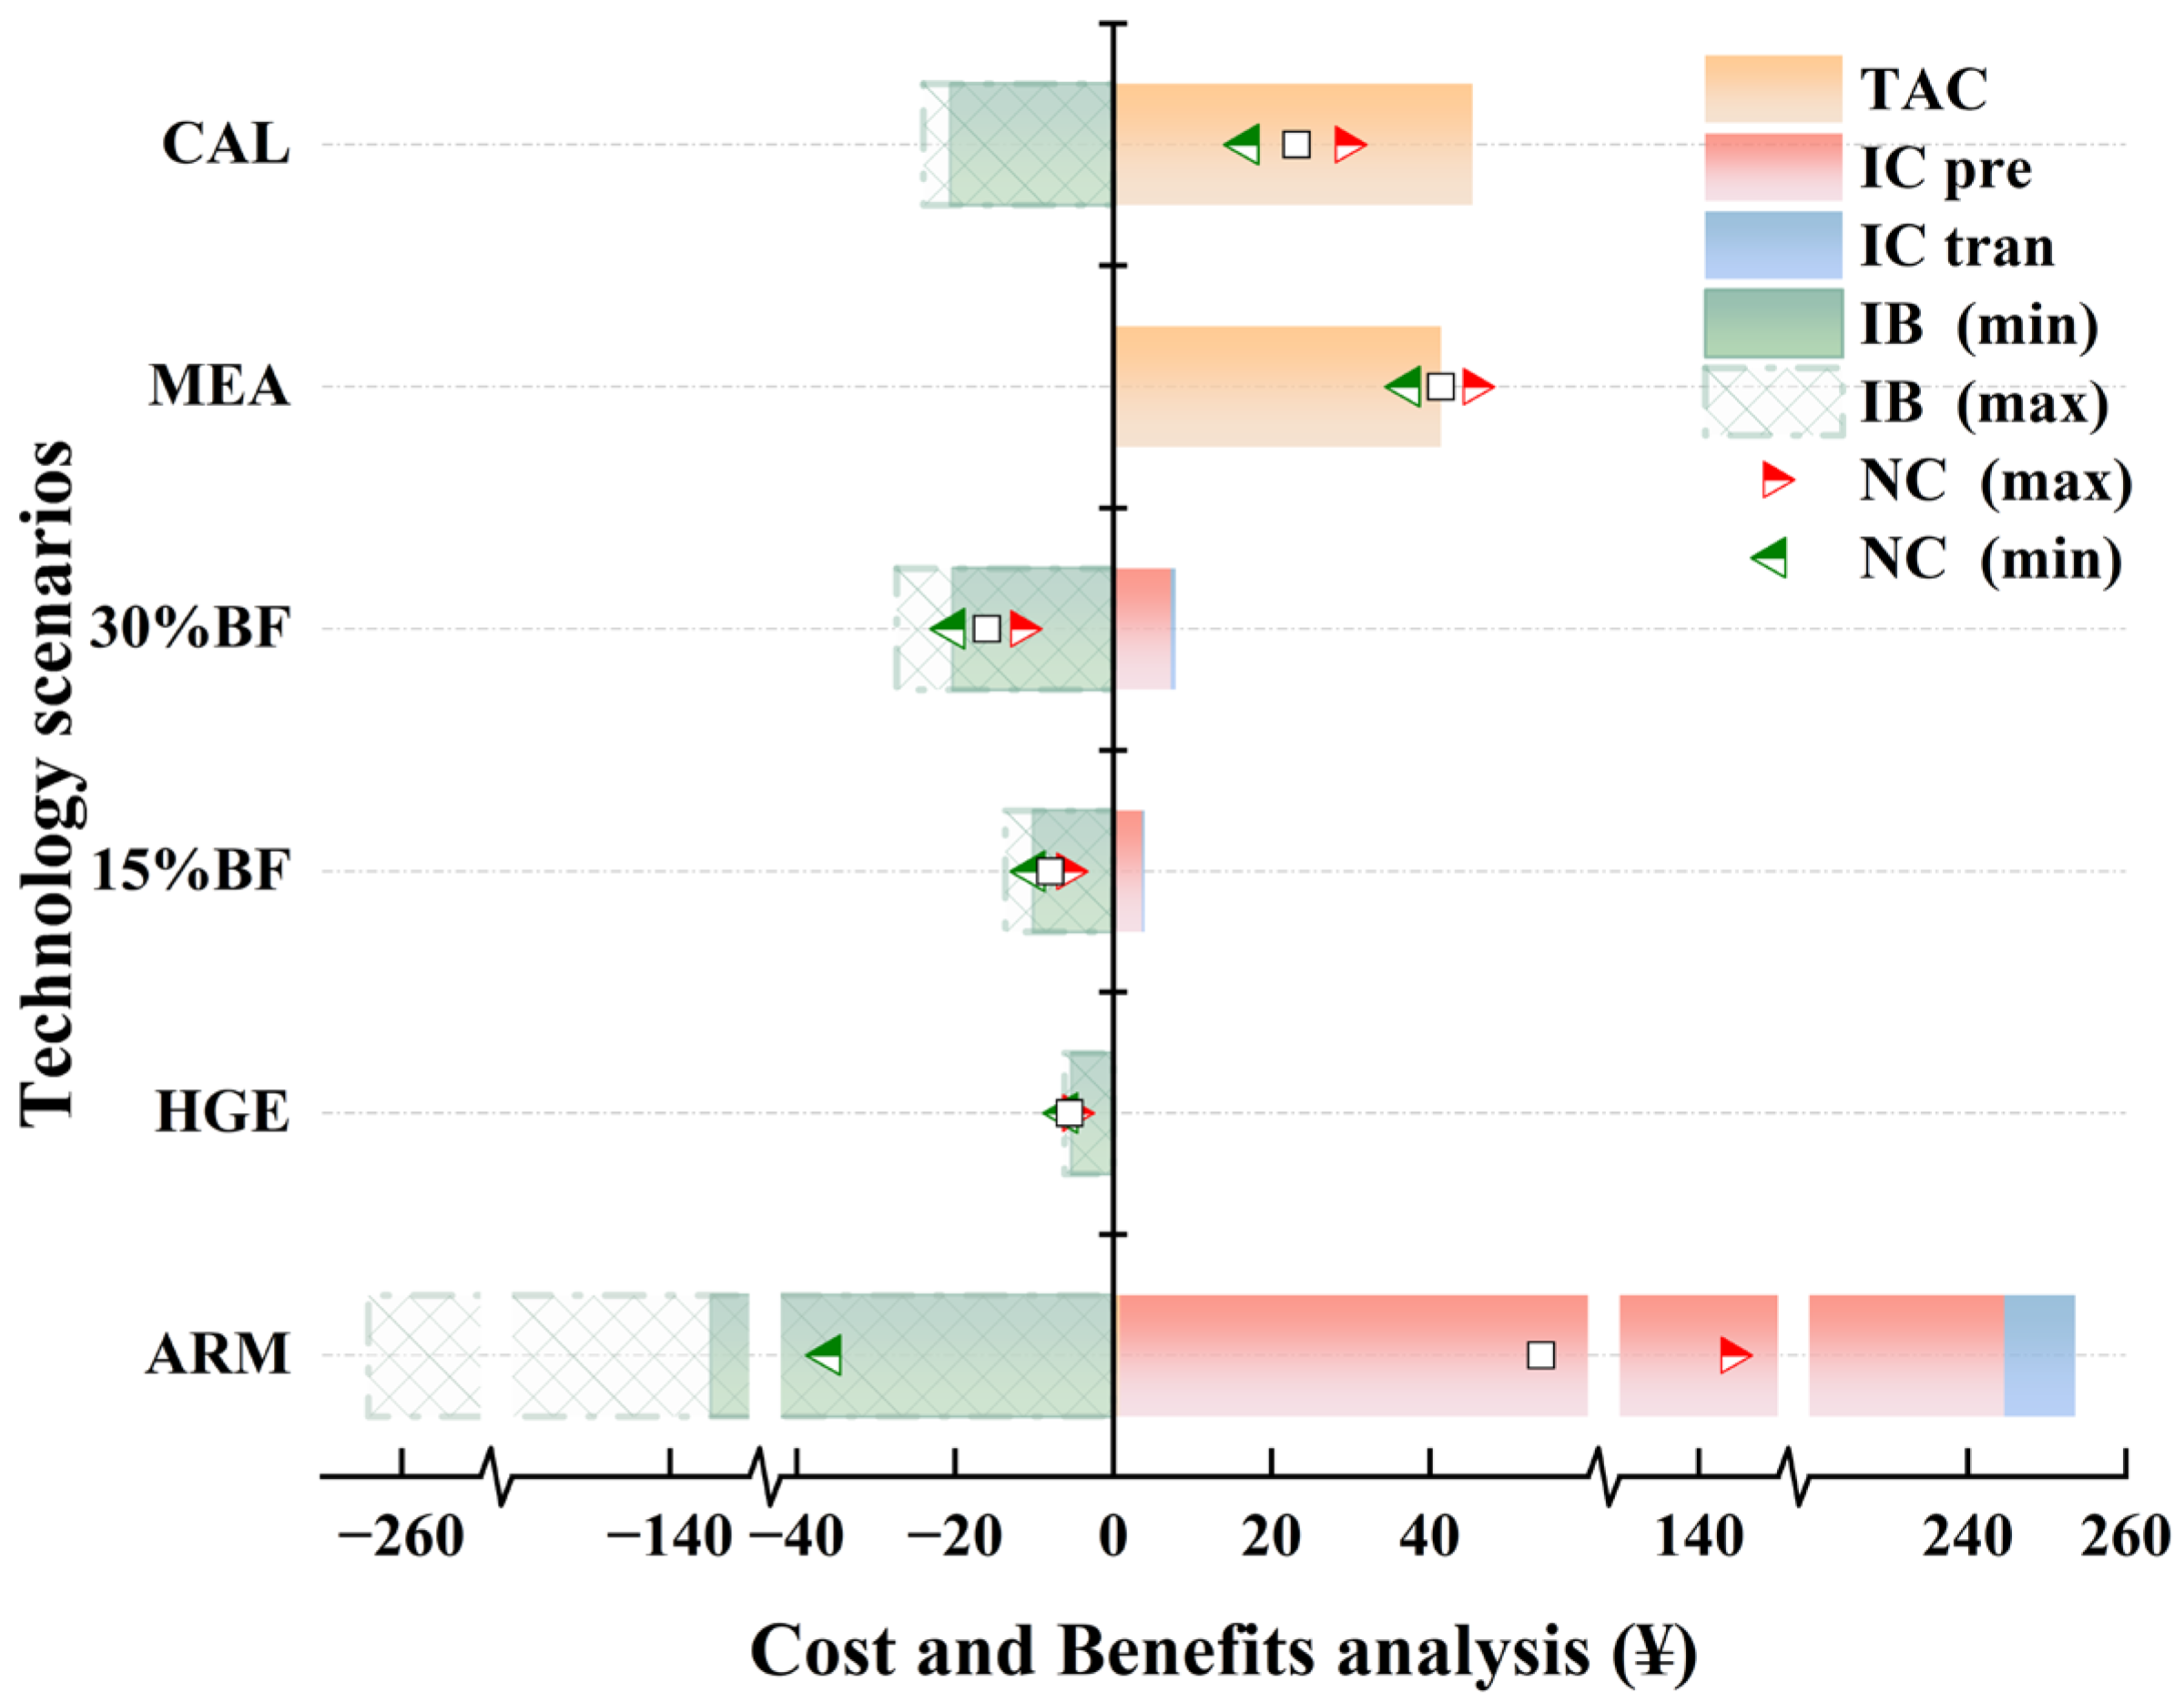
Figure 3 presents the cost–benefit analysis of the six technology scenarios. Overall, the economic performance varied significantly across technologies.
The 30%BF scenario exhibited the best economic performance, with NC ranging between −20 CNY and −12 CNY. The relatively low NC was mainly attributed to coal-saving benefits resulting from fuel substitution, which substantially exceeded the additional costs associated with biofuel preprocessing and transportation. Similarly, the 15%BF scenario also demonstrated strong economic feasibility. The HGE scenario showed relatively stable economic performance, with an NC of approximately −5~−6 CNY.
In contrast, the CAL and MEA scenarios exhibited moderate economic performance. Although CAL generated higher economic benefits than MEA, its higher capital investment offset these gains, resulting in an NC slightly lower than MEA (approximately 41 CNY), with a fluctuation range of 17–29 CNY. This finding suggests that, without policy incentives, relying solely on the intrinsic economic advantages of emerging technologies may be insufficient to offset the high upfront investments in upstream processes [35].
Among all scenarios, ARM showed the highest cost. This was mainly driven by the capital investment required for calcium carbide slag preprocessing facilities and the associated electricity consumption. In addition, the benefits of ARM exhibited considerable volatility due to fluctuations in calcium carbide slag treatment fees and pretreatment cost, leading to NC ranging from −36 CNY to 144 CNY. This indicates a higher level of economic uncertainty compared with other technology pathways.
To elucidate the key determinants of the economic performance of the technologies, a sensitivity analysis was performed (see Table S7). Overall, the technologies exhibited markedly heterogeneous responses to these parameters. ARM was particularly sensitive to the capital cost of the carbide slag pretreatment line and the associated treatment expenses; the corresponding sensitivity coefficients were sufficiently large to influence its economic ranking. In contrast, the NC of HGE was predominantly driven by revenues from electricity savings. BF showed pronounced sensitivity to the pretreatment cost of alternative fuels as well as to the economic benefits derived from coal substitution. Both MEA and CAL demonstrated strong sensitivity to TAC, indicating that their economic performance was largely governed by overall cost structures. In addition, CAL exhibited notable sensitivity to incremental electricity-saving benefits, further highlighting the importance of energy-related parameters in determining its economic viability.
Overall, 30%BF and 15%BF provided the most favorable balance between economic costs and benefits. In contrast, CAL and MEA exhibited relatively weaker economic competitiveness under the current cost structure; an appropriate carbon market price will be crucial for the deployment of CCS technology [59]. These results suggest that selecting optimal technology pathways requires careful consideration of both IC and potential economic benefits.

3.4. Environmental–Economic Trade-Offs

To comprehensively evaluate the environmental and economic performance of different technological pathways, four indicators were selected: NB, GWP reduction, FPMF reduction, and TA reduction. NB captures economic performance, while GWP, FPMF, and TA reflect the key environmental impacts. Given NB’s high sensitivity to parameters, three economic scenarios were established based on parameter variation ranges: the maximum economic benefit scenario, the minimum economic benefit scenario, and the baseline economic benefit scenario. Within these scenarios, the environmental–economic trade-offs of different technologies were assessed at fixed emission-reduction levels.
Table 3 presents the trade-off scores (Snorm) and rankings of six technology scenarios under the three economic conditions using the AHP–Entropy–TOPSIS model. The AHP weights were derived from pairwise comparison matrices assessed by 20 experts from industry, government, and academia (see Table S8). To verify the robustness of the weighting scheme, scores and rankings were also calculated using entropy-weighted, equal-weighted, and AHP-based TOPSIS methods under weighting schemes (see Table S9). Furthermore, a reversal test based on the AHP–Entropy results confirmed the stability of the rankings. Notably, the entropy-weighted method yielded rankings that differed from the other approaches, reflecting variations in the underlying data structure; the rankings derived from this method were not adopted.
Under the baseline economic benefit scenario, 30%BF achieved the highest Snorm value (0.215), indicating the best overall performance. It was followed by 15%BF (0.196), HGE (0.186), ARM (0.148), and MEA (0.132), while CAL ranked last (0.124). In the maximum economic benefit scenario, 30% BF remained the top performer, while ARM ranked second, owing to its low pretreatment line cost and high slag processing revenue; the relative rankings of the remaining technologies were consistent with the baseline scenario. Under the minimum economic benefit scenario, 30%BF remained the optimal solution, followed by 15%BF and HGE. In contrast, ARM’s ranking fell below that of MEA due to increased pretreatment costs and reduced slag processing revenue, while CAL consistently exhibited the lowest performance.
Overall, BF demonstrated the most favorable environmental–economic trade-offs under the three scenarios, indicating strong robustness to economic fluctuations. In contrast, ARM was more sensitive to economic conditions, and its overall performance deteriorated significantly under the minimum economic benefit scenario. This suggests that its environmental advantages may not be fully realized under stricter economic constraints. Although CAL and MEA exhibit clear environmental advantages, these technologies still face significant economic barriers during early deployment stages. Therefore, policy incentives or market mechanisms are likely necessary to support the adoption of technologies that offer long-term environmental benefits [25]. Overall, achieving a balanced relationship between environmental performance and economic feasibility can facilitate the simultaneous realization of environmental and economic benefits in practical applications. Such technologies may serve as viable transitional solutions, particularly in developing regions where financial constraints coexist with emission-reduction targets [25].

4. Limitations and Perspectives

Our findings indicate that the implementation of decarbonization technologies involves interactions across multiple system levels and stakeholders. During practical deployment, different technological pathways face distinct challenges in environmental impacts and economic feasibility. In general, emerging technologies often encounter more complex economic barriers prior to large-scale deployment, whereas conventional decarbonization technologies tend to follow more stable yet relatively conservative development trajectories. Using a northern Chinese NSP cement plant as a case study, we analyzed the potential environmental and economic implications of decarbonization technologies. While these results can inform similar production lines, they do not represent the broader Chinese cement industry. Combining multiple advantageous technologies could generate greater environmental and economic benefits; however, the effects of combining high- and low-performing technologies remain uncertain.
This study acknowledges several limitations. Data collection was constrained by industrial confidentiality, necessitating that certain parameters be obtained from literature or estimated. This limitation restricted the range of environmental impact categories that could be assessed and may affect the accuracy of technology differentiation. The assumed carbon neutrality of biomass ignores land-use changes and alternative residue management, potentially overestimating net greenhouse gas mitigation, while material substitution may affect cement microstructure, including compressive strength. Prior research indicates that microstructural optimization—such as tailored material combinations or interface modifications—can substantially enhance concrete durability and crack resistance [60,61]. Future studies could integrate decarbonization strategies with downstream material performance evaluations. Furthermore, our evaluation model does not fully account for exogenous variables, including carbon market dynamics and regional energy structures, which may limit its broader applicability.
Future research should explore multi-technology combinations, collect empirical emission data, and evaluate the effects of technology integration on material performance and durability. Improving the temporal and spatial resolution of databases through real-time IoT monitoring and process simulation software (e.g., Aspen Plus 15.0) would enhance assessment accuracy. Moreover, the development of a dynamic, scalable evaluation framework with modules for regional technology suitability could strengthen supply and demand analyses. Methodologically, future studies might integrate dynamic LCA (DLCA), input–output analysis (IOA), and big data forecasting [62] to address the nonlinear ‘scale effect marginal benefit’ relationship during technology diffusion. From an application perspective, extending the assessment to industries such as iron and steel or chemicals could uncover cross-industry synergistic pathways for carbon reduction. Finally, at the decision-making level, building a regional technology projection platform based on digital twins to simulate interactions between policy instruments (e.g., carbon taxes, technical standards) and techno-economic indicators would provide a quantitative basis for differentiated environmental regulation. These advances would shift green technology assessment from static comparisons to dynamic optimization, ultimately supporting systematic strategies for low-carbon industrial transformation.

5. Conclusions

Based on the LCA results and the AHP–Entropy–TOPSIS model, we quantitatively evaluated the performance of six decarbonization technologies in terms of environmental impacts, SRPC, economic performance, and the environmental–economic trade-offs. The results indicate that calcination is the dominant contributor to GWP, whereas the grinding process mainly drives FPMF and TA. In terms of carbon mitigation performance, CAL achieved the strongest reduction effect, followed by MEA. Among the alternative fuel pathways, 30%BF demonstrated the best mitigation performance. ARM reduced GWP by approximately 5% through substituting limestone with calcium carbide slag, outperforming both HGE and 15%BF in terms of carbon reduction. Regarding synergistic environmental effects, HGE and BF-based technologies simultaneously demonstrated the potential to reduce both carbon emissions and conventional air pollutants. In contrast, although ARM reduced GWP, increased electricity consumption during raw material preprocessing led to higher FPMF and TA. Similarly, MEA and CAL achieved significant carbon reductions but also increased conventional pollutant burdens, indicating clear environmental trade-offs across impact categories.
From an economic perspective, 30%BF showed the most favorable economic performance. The 15%BF and HGE technologies exhibited relatively stable economic outcomes, whereas MEA and CAL were constrained by higher operational and capital costs. ARM displayed the highest economic uncertainty due to fluctuations in material treatment costs.
Overall, 30%BF represents the most balanced technology under current conditions. HGE and 15%BF can be considered promising near-term deployment options, whereas ARM may only become competitive under favorable economic benefits. In contrast, CAL demonstrates strategic value for long-term deep decarbonization.
This work further reveals that unidimensional technology assessments may lead to biased decision-making. Therefore, technology evaluation should account for potential environmental impact transfer effects and adopt an integrated environmental–economic framework. It provides a systematic decision-making paradigm that aligns environmental red lines with industrial benefits, providing theoretical support for technology promotion and business transformation.

Supplementary Materials

The following supporting information can be downloaded at: https://www.mdpi.com/article/10.3390/su18104828/s1, Text S1: Detailed scenario descriptions; Table S1: Parameters for All Scenarios and Emission Calculations; Table S2: The Composition of Raw Materials; Table S3: Emission Calculations Equations; Table S4: Fuel Properties and Chemical Composition; Table S5: Sensitivity Coefficients of Technological Parameters on Environmental Impacts (±10%); Table S6: Uncertainty Analysis Results for Different Scenarios; Table S7: Sensitivity Coefficients of Technological Parameters on Net Cost (NC); Table S8: Pairwise Comparison Matrix Derived from Expert Scoring; Table S9: Results for Different Weighting Schemes [63,64,65,66,67,68,69,70,71].

Author Contributions

Conceptualization, L.Q.; methodology, L.S.; software, L.S.; validation, X.Z.; investigation, W.Z.; resources, X.L.; writing—original draft preparation, L.S.; writing—review and editing, H.N.; supervision, Y.S.; funding acquisition, Y.S.; Conceptualization, Y.S.; writing—review and editing, Y.S. All authors have read and agreed to the published version of the manuscript.

Funding

This research was funded by the National Key R&D Program of China, grant number 2023YFC3804902, and the APC was funded by the Research Center for Eco-Environmental Sciences, Chinese Academy of Sciences.

Institutional Review Board Statement

Not applicable.

Informed Consent Statement

Not applicable.

Data Availability Statement

Data are contained within the article.

Conflicts of Interest

The authors declare no conflicts of interest.

Abbreviations

The following abbreviations are used in this manuscript:
LCAlife cycle assessment
SRPCsynergistic reduction of pollution and carbon
AHPanalytic hierarchy process
TOPSISTechnique for Order Preference by Similarity to Ideal Solution
MADMmulti-attribute decision-making
MEAmono-ethanolamine
CALcalcium looping
NSPnew suspension preheater
ARMalternative raw materials
HGEhigh grinding efficiency
SRFsolid recovered fuel
CCUScarbon capture, utilization, and storage
RDFrefuse-derived fuel
TDFtire-derived fuel
BSbiological sludge
LCIlife cycle inventory
LCIAlife cycle impact assessment
SNCRselective non-catalytic reduction
BFbiomass fuel
AFalternative fuel
LHVlower heating value
TSRthermal substitution rate
ASUair separation unit
GWPglobal warming potential
FPMFfine particulate matter formation
TAterrestrial acidification
TACtotal annualized cost
SDstandard deviation
CVcoefficient of variation
SEMstandard error of the mean
LSFLime Saturation Factor
SMSilica Modulus
AMAlumina Modulus
ICincremental cost
IBincremental benefit
NCnet cost
NBnet benefit
DLCAdynamic LCA
IOAinput–output analysis
OPCOrdinary Portland Cement

References

  1. Meinshausen, M.; Lewis, J.; McGlade, C.; Gütschow, J.; Nicholls, Z.; Burdon, R.; Cozzi, L.; Hackmann, B. Realization of Paris Agreement Pledges May Limit Warming Just below 2 °C. Nature 2022, 604, 304–309. [Google Scholar] [CrossRef]
  2. Thwe, E.; Khatiwada, D.; Gasparatos, A. Life Cycle Assessment of a Cement Plant in Naypyitaw, Myanmar. Clean. Environ. Syst. 2021, 2, 100007. [Google Scholar] [CrossRef]
  3. Cai, B.; Wang, J.; He, J.; Geng, Y. Evaluating CO2 Emission Performance in China’s Cement Industry: An Enterprise Perspective. Appl. Energy 2016, 166, 191–200. [Google Scholar] [CrossRef]
  4. Guo, X.; Li, Y.; Shi, H.; She, A.; Guo, Y.; Su, Q.; Ren, B.; Liu, Z.; Tao, C. Carbon Reduction in Cement Industry—An Indigenized Questionnaire on Environmental Impacts and Key Parameters of Life Cycle Assessment (LCA) in China. J. Clean. Prod. 2023, 426, 139022. [Google Scholar] [CrossRef]
  5. Song, D.; Yang, J.; Chen, B.; Hayat, T.; Alsaedi, A. Life-Cycle Environmental Impact Analysis of a Typical Cement Production Chain. Appl. Energy 2016, 164, 916–923. [Google Scholar] [CrossRef]
  6. Georgiopoulou, M.; Lyberatos, G. Life Cycle Assessment of the Use of Alternative Fuels in Cement Kilns: A Case Study. J. Environ. Manag. 2018, 216, 224–234. [Google Scholar] [CrossRef]
  7. Busch, P.; Kendall, A.; Murphy, C.W.; Miller, S.A. Literature Review on Policies to Mitigate GHG Emissions for Cement and Concrete. Resour. Conserv. Recycl. 2022, 182, 106278. [Google Scholar] [CrossRef]
  8. CEMBUREAU. 2050 Carbon Neutrality Roadmap: Carbon Neutral by 2050—This Is Our Ambition; CEMBUREAU: Brussels, Belgium, 2020; Available online: https://www.cementeurope.eu/resources/reports/2050-carbon-neutrality-roadmap/ (accessed on 14 April 2025).
  9. Global Cement and Concrete Association Concrete Future: GCCA 2050 Cement and Concrete Industry Roadmap for Net Zero Concrete. Available online: https://gccassociation.org/concretefuture/ (accessed on 24 March 2025).
  10. Portland Cement Association Roadmap to Carbon Neutrality. Available online: https://www.cement.org/a-sustainable-future/roadmap-to-carbon-neutrality/ (accessed on 24 March 2025).
  11. Li, T.; Li, S.; Li, W.; Yan, R.; Zhang, M.; Wang, Y.; Fan, Y.; Zhang, Y.; Xia, L. The Road to Net Zero: Decarbonization in China’s Cement Industry; Rocky Mountain Institute and China Cement Association: Boulder, CO, USA, 2022; Available online: https://rmi.org/insight/net-zero-decarbonization-in-chinas-cement-industry/ (accessed on 24 March 2025).
  12. Wu, T.; Ng, S.T.; Chen, J. Incorporating Carbon Capture and Storage in Decarbonizing China’s Cement Sector. Renew. Sustain. Energy Rev. 2025, 209, 115098. [Google Scholar] [CrossRef]
  13. Olsson, J.A.; Miller, S.A.; Kneifel, J.D. A Review of Current Practice for Life Cycle Assessment of Cement and Concrete. Resour. Conserv. Recycl. 2024, 206, 107619. [Google Scholar] [CrossRef]
  14. Georgiades, M.; Shah, I.H.; Steubing, B.; Cheeseman, C.; Myers, R.J. Prospective Life Cycle Assessment of European Cement Production. Resour. Conserv. Recycl. 2023, 194, 106998. [Google Scholar] [CrossRef]
  15. Sánchez, A.R.; Ramos, V.C.; Polo, M.S.; Ramón, M.V.L.; Utrilla, J.R. Life Cycle Assessment of Cement Production with Marble Waste Sludges. Int. J. Environ. Res. Public Health 2021, 18, 10968. [Google Scholar] [CrossRef] [PubMed]
  16. Juangsa, F.B. Thermodynamic Analysis of Hydrogen Utilization as Alternative Fuel in Cement Production. S. Afr. J. Chem. Eng. 2022, 42, 23–31. [Google Scholar] [CrossRef]
  17. Khan, M.M.H.; Havukainen, J.; Horttanainen, M. Impact of Utilizing Solid Recovered Fuel on the Global Warming Potential of Cement Production and Waste Management System: A Life Cycle Assessment Approach. Waste Manag. Res. 2021, 39, 561–572. [Google Scholar] [CrossRef]
  18. Wang, Y.; Yang, M.; Shen, F.; Zhou, M.; Du, W. Conceptual Design and Life-Cycle Environmental and Economic Assessment of Low-Carbon Cement Manufacturing Processes. J. Clean. Prod. 2024, 471, 143349. [Google Scholar] [CrossRef]
  19. Bacatelo, M.; Capucha, F.; Ferrão, P.; Margarido, F. Selection of a CO2 Capture Technology for the Cement Industry: An Integrated TEA and LCA Methodological Framework. J. CO2 Util. 2023, 68, 102375. [Google Scholar] [CrossRef]
  20. Fan, J.-L.; Mao, Y.; Li, K.; Zhang, X. Early Opportunities for Onshore and Offshore CCUS Deployment in the Chinese Cement Industry. Engineering 2025, 46, 348–362. [Google Scholar] [CrossRef]
  21. Mao, Y.; Li, K.; Li, J.; Zhang, X.; Fan, J.-L. Spatial Heterogeneity of Plant-Level CCUS Investment Decisions in China’s Cement Industry under Various Policy Incentives. Earth’s Future 2025, 13, e2024EF004951. [Google Scholar] [CrossRef]
  22. Valderrama, C.; Granados, R.; Cortina, J.L.; Gasol, C.M.; Guillem, M.; Josa, A. Implementation of Best Available Techniques in Cement Manufacturing: A Life-Cycle Assessment Study. J. Clean. Prod. 2012, 25, 60–67. [Google Scholar] [CrossRef]
  23. Li, C.; Cui, S.; Nie, Z.; Gong, X.; Wang, Z.; Itsubo, N. The LCA of Portland Cement Production in China. Int. J. Life Cycle Assess. 2015, 20, 117–127. [Google Scholar] [CrossRef]
  24. Ren, M.; Ma, T.; Fang, C.; Liu, X.; Guo, C.; Zhang, S.; Zhou, Z.; Zhu, Y.; Dai, H.; Huang, C. Negative Emission Technology Is Key to Decarbonizing China’s Cement Industry. Appl. Energy 2023, 329, 120254. [Google Scholar] [CrossRef]
  25. Dinga, C.D.; Wen, Z. China’s Green Deal: Can China’s Cement Industry Achieve Carbon Neutral Emissions by 2060? Renew. Sustain. Energy Rev. 2022, 155, 111931. [Google Scholar] [CrossRef]
  26. Ige, O.E.; Olanrewaju, O.A.; Duffy, K.J.; Obiora, C. A Review of the Effectiveness of Life Cycle Assessment for Gauging Environmental Impacts from Cement Production. J. Clean. Prod. 2021, 324, 129213. [Google Scholar] [CrossRef]
  27. Galvez-Martos, J.-L.; Schoenberger, H. An Analysis of the Use of Life Cycle Assessment for Waste Co-Incineration in Cement Kilns. Resour. Conserv. Recycl. 2014, 86, 118–131. [Google Scholar] [CrossRef]
  28. Yin, Z.; Kuang, Y.; Liu, D.; Zhao, Y.; Zhang, X.; Li, Y. Evaluation method of synergistic benefits enhancement technologies for pollution abatement and carbon reduction in the ironmaking process. J. Environ. Eng. Technol. 2024, 14, 33–42. [Google Scholar] [CrossRef]
  29. Tan, Q.; Wen, Z.; Chen, J. Goal and Technology Path of CO2 Mitigation in China’s Cement Industry: From the Perspective of Co-Benefit. J. Clean. Prod. 2016, 114, 299–313. [Google Scholar] [CrossRef]
  30. Xi, Y. Quantifying Co-Benefit Potentials in the Chinese Cement Sector during 12th Five Year Plan: An Analysis Based on Marginal Abatement Cost with Monetized Environmental Effect. J. Clean. Prod. 2013, 58, 102–111. [Google Scholar] [CrossRef]
  31. Zhang, S. Evaluating Co-Benefits of Energy Efficiency and Air Pollution Abatement in China’s Cement Industry. Appl. Energy 2015, 147, 192–213. [Google Scholar] [CrossRef]
  32. Shi, Y.; Wang, Y.; Wang, L.-N.; Wang, W.-N.; Yang, T.-Y. Bridge Tower Warning Method Based on Improved Multi-Rate Fusion under Strong Wind Action. Buildings 2025, 15, 2733. [Google Scholar] [CrossRef]
  33. Shi, Y.; Wang, Y.; Wang, L.-N.; Wang, W.-N.; Yang, T.-Y. Bridge Cable Performance Warning Method Based on Temperature and Displacement Monitoring Data. Buildings 2025, 15, 2342. [Google Scholar] [CrossRef]
  34. Crossin, E. The Greenhouse Gas Implications of Using Ground Granulated Blast Furnace Slag as a Cement Substitute. J. Clean. Prod. 2015, 95, 101–108. [Google Scholar] [CrossRef]
  35. Zang, G.; Sun, P.; Elgowainy, A.; Wang, M. Technoeconomic and Life Cycle Analysis of Synthetic Methanol Production from Hydrogen and Industrial Byproduct CO2. Environ. Sci. Technol. 2021, 55, 5248–5257. [Google Scholar] [CrossRef]
  36. Karahalios, H. The Application of the AHP-TOPSIS for Evaluating Ballast Water Treatment Systems by Ship Operators. Transp. Res. Part D Transp. Environ. 2017, 52, 172–184. [Google Scholar] [CrossRef]
  37. ISO 14040; Environmental Management—Life Cycle Assessment-Principles and Framework. International Organization for Standardization: Geneva, Switzerland, 2006.
  38. ISO 14044; Environmental Management—Life Cycle Assessment-Requirements and Guidelines. International Organization for Standardization: Geneva, Switzerland, 2006.
  39. Ecoinvent, Version 3.10 Database; Ecoinvent Association: Zurich, Switzerland, 2023. Available online: https://Ecoinvent.Org/Ecoinvent-v3-10/ (accessed on 26 March 2025).
  40. Ige, O.E.; Kabeya, M. Multi-Objective Optimization of Raw Mix Design and Alternative Fuel Blending for Sustainable Cement Production. Sustainability 2025, 17, 7438. [Google Scholar] [CrossRef]
  41. Terzić, A.; Stojanović, J.; Marković, M.; Jelić, I.N.; Savić, A.R.; Radulović, D. Green Materials for Cement Clinker: Assessing Alternative Raw Material Potential. Materials 2026, 19, 741. [Google Scholar] [CrossRef]
  42. Cui, Y.; Chen, S.; Li, L.; Wang, X.; Liu, J. Atomistic Insights into the Hydration Behavior of N-a-S-H Gel via Ca2+ Substitution: A Molecular Dynamics Simulation Study. J. Non-Cryst. Solids 2026, 673, 123892. [Google Scholar] [CrossRef]
  43. Li, C.; Nie, Z.; Cui, S.; Gong, X.; Wang, Z.; Meng, X. The Life Cycle Inventory Study of Cement Manufacture in China. J. Clean. Prod. 2014, 72, 204–211. [Google Scholar] [CrossRef]
  44. Ministry of Ecology and Environment of the People’s Republic of China. Enterprise Greenhouse Gas Emissions Accounting and Reporting Guidelines—Cement Industry (CETS–AG–02.01–V01–2024); Ministry of Ecology and Environment: Beijing, China, 2024.
  45. Seyler, C.; Hellweg, S.; Monteil, M.; Hungerbühler, K. Life Cycle Inventory for Use of Waste Solvent as Fuel Substitute in the Cement Industry—A Multi-Input Allocation Model (11 Pp). Int. J. Life Cycle Assess. 2005, 10, 120–130. [Google Scholar] [CrossRef]
  46. Huijbregts, M.A.J.; Steinmann, Z.J.N.; Elshout, P.M.F.; Stam, G.; Verones, F.; Vieira, M.; Zijp, M.; Hollander, A.; Van Zelm, R. ReCiPe2016: A Harmonised Life Cycle Impact Assessment Method at Midpoint and Endpoint Level. Int. J. Life Cycle Assess. 2017, 22, 138–147. [Google Scholar] [CrossRef]
  47. Liu, M.; Yue, Y.; Liu, S.; Li, J.; Liu, J.H.; Sun, M. Multi-Dimensional Analysis of the Synergistic Effect of Pollution Reduction and Carbon Reduction in Tianjin Based on the STIRPAT Model. Environ. Sci. 2023, 44, 1277–1286. [Google Scholar] [CrossRef]
  48. Hou, H.; Zhang, S.; Guo, D.; Su, L.; Xu, H. Synergetic Benefits of Pollution and Carbon Reduction from Fly Ash Resource Utilization—Based on the Life Cycle Perspective. Sci. Total Environ. 2023, 903, 166197. [Google Scholar] [CrossRef]
  49. Yuan, X.; Chen, L.; Sheng, X.; Liu, M.; Xu, Y.; Tang, Y.; Wang, Q.; Ma, Q.; Zuo, J. Life Cycle Cost of Electricity Production: A Comparative Study of Coal-Fired, Biomass, and Wind Power in China. Energies 2021, 14, 3463. [Google Scholar] [CrossRef]
  50. CNTD. Available online: https://cntd.cityghg.com/ (accessed on 26 March 2026).
  51. National Bureau of Statistics. Available online: https://www.stats.gov.cn/ (accessed on 26 March 2025).
  52. Çankaya, S. Investigating the Environmental Impacts of Alternative Fuel Usage in Cement Production: A Life Cycle Approach. Environ. Dev. Sustain. 2020, 22, 7495–7514. [Google Scholar] [CrossRef]
  53. Li, Y.; Liu, Y.; Gong, X.; Nie, Z.; Cui, S.; Wang, Z.; Chen, W. Environmental Impact Analysis of Blast Furnace Slag Applied to Ordinary Portland Cement Production. J. Clean. Prod. 2016, 120, 221–230. [Google Scholar] [CrossRef]
  54. Galusnyak, S.C.; Petrescu, L.; Cormos, C.-C. Environmental Impact Assessment of Post-Combustion CO2 Capture Technologies Applied to Cement Production Plants. J. Environ. Manag. 2022, 320, 115908. [Google Scholar] [CrossRef]
  55. Tanzer, S.E.; Ramírez, A. When Are Negative Emissions Negative Emissions? Energy Environ. Sci. 2019, 12, 1210–1218. [Google Scholar] [CrossRef]
  56. Zhang, C.-Y.; Yu, B.; Chen, J.-M.; Wei, Y.-M. Green Transition Pathways for Cement Industry in China. Resour. Conserv. Recycl. 2021, 166, 105355. [Google Scholar] [CrossRef]
  57. Cavalett, O.; Watanabe, M.D.B.; Voldsund, M.; Roussanaly, S.; Cherubini, F. Paving the Way for Sustainable Decarbonization of the European Cement Industry. Nat. Sustain. 2024, 7, 568–580. [Google Scholar] [CrossRef]
  58. García-Gusano, D.; Garraín, D.; Herrera, I.; Cabal, H.; Lechón, Y. Life Cycle Assessment of Applying CO2 Post-Combustion Capture to the Spanish Cement Production. J. Clean. Prod. 2015, 104, 328–338. [Google Scholar] [CrossRef]
  59. Clark, G.; Davis, M.; Kumar, A. The Development of a Framework to Compare Carbon Capture and Storage Technologies as a Means of Decarbonizing Cement Production. Renew. Sustain. Energy Rev. 2025, 214, 115556. [Google Scholar] [CrossRef]
  60. Liu, Z.; Qi, X.; Ke, J.; Shui, Z. Enhancing the Toughness of Ultra-High Performance Concrete through Improved Fiber-Matrix Interface Bonding. Constr. Build. Mater. 2025, 491, 142616. [Google Scholar] [CrossRef]
  61. Hu, Z.; Yang, Y.; Zhang, H. Durability and Damage Evolution of Steel Fiber and Nano-SiO2 Reinforced Concrete under Freeze-Thaw and Salt Erosion Environments Based on Acoustic Emission and Computed Tomography Analysis. J. Build. Eng. 2025, 115, 114595. [Google Scholar] [CrossRef]
  62. Li, J.; Tian, Y.; Xie, K. Coupling Big Data and Life Cycle Assessment: A Review, Recommendations, and Prospects. Ecol. Indic. 2023, 153, 110455. [Google Scholar] [CrossRef]
  63. Cormos, C.-C. Decarbonization Options for Cement Production Process: A Techno-Economic and Environmental Evaluation. Fuel 2022, 320, 123907. [Google Scholar] [CrossRef]
  64. Liao, K.; Feng, Z.; Wu, J.; Liang, H.; Wang, Y.; Zeng, W.; Wang, Y.; Tian, J.; Liu, R.; Chen, L. Cement Kiln Geared up to Dispose Industrial Hazardous Wastes of Megacity under Industrial Symbiosis. Resour. Conserv. Recycl. 2024, 202, 107358. [Google Scholar] [CrossRef]
  65. Koppejan, J.; Schmidl, C. Nitrogen Flows in Biomass Combustion Systems: A Parametric Scoping Study Aimed at Optimising Nitrogen Flows in Biomass Combustion; IEA Bioenergy Task 32 Report; IEA Bioenergy: Paris, France, 2022. [Google Scholar]
  66. Ministry of Ecology and Environment of China. Manual of Emission Factors and Accounting Methods for Industrial Boilers (Heat Supply Sector) (4430 Industry); Ministry of Ecology and Environment of China: Beijing, China, 2021.
  67. Müller, A.; Harpprecht, C.; Sacchi, R.; Maes, B.; Van Sluisveld, M.; Daioglou, V.; Šavija, B.; Steubing, B. Decarbonizing the Cement Industry: Findings from Coupling Prospective Life Cycle Assessment of Clinker with Integrated Assessment Model Scenarios. J. Clean. Prod. 2024, 450, 141884. [Google Scholar] [CrossRef]
  68. CEMCAP. D4.6 CEMCAP Comparative Techno-Economic Analysis of CO2 Capture in Cement Plants; SINTEF Energy Research; SINTEF Energy Research: Trondheim, Norway, 2015. [Google Scholar]
  69. Huang, Z.; Xue, W.; Han, Q. Integrated Environmental and Economic Assessment of Calcium Carbide Slag Management toward 2035. Sustain. Chem. Pharm. 2025, 48, 102265. [Google Scholar] [CrossRef]
  70. Liu, J.; Tong, D.; Zheng, Y.; Cheng, J.; Qin, X.; Shi, Q.; Yan, L.; Lei, Y.; Zhang, Q. Carbon and Air Pollutant Emissions from China’s Cement Industry 1990–2015: Trends, Evolution of Technologies, and Drivers. Atmos. Chem. Phys. 2021, 21, 1627–1647. [Google Scholar] [CrossRef]
  71. Bourtsalas, A.C.; Zhang, J.; Castaldi, M.J.; Themelis, N.J. Use of Non-Recycled Plastics and Paper as Alternative Fuel in Cement Production. J. Clean. Prod. 2018, 181, 8–16. [Google Scholar] [CrossRef]
Figure 1. System boundaries of the baseline scenario (S0) and six technology scenarios, including alternative raw materials (ARM) with 15% calcium carbide slag substitution for limestone, high grinding efficiency (HGE), biomass fuel (BF) substitution as an alternative fuel (AF) at rates of 15% and 30%, and two post-combustion carbon capture technologies: mono-ethanolamine (MEA) absorption and calcium looping (CAL). The boundary of S0 includes processes (1), (3), (5), (6), (7), (8), and (9). Compared with S0, the ARM scenario expands the boundary by introducing process (4). HGE is implemented within process (8). BF further incorporates process (2). Additionally, the MEA system adds process (10) and the CAL system introduces process (11).
Sustainability 18 04828 g001
Figure 2. Environmental impacts and carbon–pollution mitigation synergy of cement production under S0 and six technology scenarios. Panels (ac) present the environmental impacts of different technologies in terms of global warming potential (GWP), fine particulate matter formation (FPMF), and terrestrial acidification (TA). In panel (d), the x-axis represents the GWP reduction rates of each technology scenario relative to S0, while the y-axis represents the reduction rates for FPMF and TA. Bubble colors indicate different technologies, and bubble shape (circle or square) represents FPMF or TA, respectively. The size of the circles and squares represents the absolute value of the SRPC Index (SI).
Sustainability 18 04828 g002
Figure 3. Economic assessment of cement production under the baseline (S0) and six technology application scenarios (CNY). The right panel shows the breakdown of cost components, including total annualized cost (TAC), transportation costs (ICtran), and preprocessing facilities costs (ICpre). The left panel presents incremental benefit (IB), with shadow bars indicating maximum values. Red and green triangles denote the maximum and minimum net cost (NC), respectively, and the white square represents the median value.
Sustainability 18 04828 g003
Table 1. The life cycle inventory (LCI) data of S0 and six technology scenarios based on 1 ton of cement.
System FlowsUnitS0ARMHGE15%BF30%BFMEACAL
InputAF/ARMt/+0.100/+0.015+0.030//
Coalt0.078−0.0010.078−0.012−0.0230.0780.078
Limestonet0.917−0.1380.9170.9170.9170.9170.917
Sandstonet0.026+0.0030.0260.0260.0260.0260.026
Bauxitet0.062+0.0020.0620.0620.0620.0620.062
Steel slagt0.060+0.0010.0600.0600.0600.0600.060
Coal ganguet0.0140.0140.0140.0140.0140.0140.014
Blast furnace slagt0.0580.0580.0580.0580.0580.0580.058
Gypsumt0.0370.0370.0370.0370.0370.0370.037
ElectricitykWh90.37106.0481.5390.40 [39]90.43 [39]163.44−34.24
Ammoniat0.0020.0020.0020.0020.0020.0020.002
HeatGJ/////1.9782.881
MEAkg/////0.682/
OutputCO2t0.4870.4290.4870.4620.4360.0490.029
SO2kg0.0420.0420.0420.0360.0310.0420.042
NOxkg0.1340.1340.1340.0790.0250.1340.134
PMkg0.0110.0110.0110.0110.0120.0110.011
Table 2. Economic Parameters for Economic Assessment.
ScenariosParametersValueUnitSource
ARMTAC1.47CNY/t cl[50]
ARMICpre2428.57CNY/t dry slagField survey
ARMICtran9.01CNY/t unitcalculated
ARMBraw6.87–8.25CNY/t unitcalculated
Diesel7.7234CNY/kg[51]
Limestone50–60CNY/tField survey
ARMBfee1275–2550CNY/t dry slagField survey
HGETAC0.26CNY/t clcalculated
HGEBele5.30–6.19CNY/t unitcalculated
Electricity0.6–0.7CNY/kWh[51]
15%/30%BFICpre240.1167CNY/t BFField survey
Coal874.3–1178.6CNY/t[51]
15%BFICtran0.30CNY/t unitcalculated
15%BFBcoal10.14–13.67CNY/t unitcalculated
30%BFICtran0.60CNY/t unitcalculated
30%BFBcoal20.28–27.34CNY/t unitcalculated
MEATAC72.42CNY/t cl[50]
CALTAC79.44CNY/t cl[50]
Bele20.54–23.97CNY/t unitcalculated
Table 3. Environmental–economic trade-offs scores (Snorm) and rankings of each technology under three economic benefit scenarios using different weighted TOPSIS methods.
ScenariosAHP–EntropyRankingsAHPRankingsEntropyRankingsEqual WeightRankings
Maximum Economic Benefit Scenario
ARM0.19620.19820.18220.1952
HGE0.17440.17540.15840.1744
15%BF0.18530.18530.17030.1843
30%BF0.20710.20810.19710.2061
MEA0.12150.11950.13460.1235
CAL0.11660.11460.15850.1186
Baseline Economic Benefit Scenario
ARM0.14840.14640.13660.1494
HGE0.18630.18730.17130.1853
15%BF0.19620.19720.18220.1942
30%BF0.21510.21710.20710.2141
MEA0.13250.13050.14050.1335
CAL0.12460.12360.16440.1256
Minimum Economic Benefit Scenario
ARM0.14050.13850.13860.1425
HGE0.18030.18130.16250.1793
15%BF0.18820.18920.17220.1872
30%BF0.20410.20510.19410.2041
MEA0.15740.15740.16640.1574
CAL0.13160.13160.16830.1326
Disclaimer/Publisher’s Note: The statements, opinions and data contained in all publications are solely those of the individual author(s) and contributor(s) and not of MDPI and/or the editor(s). MDPI and/or the editor(s) disclaim responsibility for any injury to people or property resulting from any ideas, methods, instructions or products referred to in the content.