Article

Ecosystem Product Value Realization Policy and Rural Economic Resilience: Quasi-Natural Experimental Evidence from China’s Pilot Program

College of Economics and Management, Shandong Agricultural University, Tai’an 271000, China
*
Author to whom correspondence should be addressed.
Sustainability 2026, 18(10), 4810; https://doi.org/10.3390/su18104810
Submission received: 22 March 2026 / Revised: 30 April 2026 / Accepted: 4 May 2026 / Published: 12 May 2026

Abstract

The institutional exploration of China’s ecological product value realization mechanism provides a unique context for studying the relationship between ecological capitalization and rural development. This paper uses national county-level panel data from 2016 to 2023, taking the GEP (Gross Ecosystem Product) assessment pilot policy as a quasi-natural experiment, and employs a staggered difference-in-differences model to evaluate its causal effect on rural economic resilience. The study finds that the pilot policy increased the economic resilience index of the treatment group by an average of approximately 1.5 percentage points, a conclusion that remains robust under multiple robustness tests. The reduced-form patterns are consistent with three plausible channels, namely income-structure adjustment, ecological-asset financialization, and income-risk smoothing. Heterogeneity analysis reveals that the policy effect is more significant in areas with high forest cover and in western regions.

1. Introduction

The in-depth implementation of China’s rural revitalization strategy has provided a historic opportunity for the sustainable development of rural areas. However, determining how to achieve an effective balance between ecological protection and economic growth remains a significant challenge for policymakers and academia. For a long time, the economic development model in rural areas has heavily relied on the extensive exploitation of natural resources, leading to a dilemma of coexisting ecological degradation and economic vulnerability [1]. Against this backdrop, exploring institutional pathways to transform ecological resource advantages into economic development momentum has become a key issue in promoting high-quality rural development.
In April 2021, the General Office of the CPC Central Committee and the General Office of the State Council jointly issued the “Opinions on Establishing and Improving the Mechanism for Realizing the Value of Ecological Products,” marking the elevation of the realization of the value of ecological products from local exploration to a national strategy. The core of this policy lies in establishing a Gross Ecosystem Product (GEP) accounting system, incorporating ecological performance into local government assessments, and opening up channels for converting ecological resources into monetary income through financial instruments such as forest tenure mortgages, carbon trading, and GEP loans [2]. This institutional innovation provides a unique research scenario for understanding the synergistic mechanism between ecological protection and farmers’ income growth. So, can the pilot policy for realizing the value of ecological products effectively enhance the resilience of the rural economy? What is its mechanism of action? Are there heterogeneities in policy effects across different regions? Answering these questions is of great theoretical and practical significance for improving the ecological civilization system and promoting the implementation of the rural revitalization strategy.
This paper uses national county-level panel data from 2016 to 2023, taking the Gross Ecosystem Product (GEP) assessment pilot policy as a quasi-natural experiment, and employs a staggered difference-in-differences model to assess the causal effect of the ecological product value realization mechanism on rural economic resilience. In recent years, the econometric literature has discussed the nature of staggered difference-in-differences estimators in depth, pointing out that traditional two-way fixed effects may be biased in cases of heterogeneous treatment effects [3,4,5]. To ensure the robustness of the estimation results, this paper reports both traditional estimators and heterogeneity-robust estimators. Empirical results show that the pilot policy increases the economic resilience index of the treatment group by an average of approximately 1.5 percentage points. The reduced-form patterns operate through three plausible channels, income-structure adjustment, ecological-asset financialization, and income-risk smoothing, and are more significant in areas with high forest cover and in western regions.
The marginal contribution of this paper is reflected in the following three aspects: At the theoretical level, this paper incorporates the mechanism for realizing the value of ecological products into the analytical framework of rural economic resilience, revealing the micro-mechanism by which ecological capitalization promotes farmers’ ability to withstand risks, and expanding the institutional dimension of regional economic resilience research [6]. At the methodological level, this paper utilizes the policy temporal staggered characteristics of the GEP assessment pilot program to construct a causal identification strategy, and adopts the heterogeneity-robust estimator proposed by Callaway and Sant’Anna [7] to overcome the potential bias of traditional two-way fixed effects, providing a methodological reference for ecological policy evaluation. At the practical level, the findings of this study provide empirical evidence for the orderly expansion of the GEP assessment pilot program, the improvement of ecological-asset registration and confirmation, and the design of differentiated policies tailored to local conditions, offering direct policy implications for realizing the development concept that “lucid waters and lush mountains are invaluable assets.”

2. Literature Review and Theoretical Analysis

2.1. Literature Review

2.1.1. GEP Accounting Methodology

Research on the mechanism of realizing the value of ecological products has made significant progress in recent years. Related studies have conducted in-depth discussions on the GEP accounting methodology, constructing an accounting framework covering material supply, regulatory services, and cultural services, laying a methodological foundation for the quantitative assessment of ecological assets [8,9]. Subsequent research has critically examined China’s GEP accounting practices, pointing out that the current accounting system still has room for improvement in terms of data availability, cross-regional comparability, and dynamic monitoring [10].

2.1.2. Value Realization Mechanisms and Green Finance

Regarding the policy effects of realizing the value of ecological products, some studies have focused on the promoting role of green finance policies in realizing the value of ecological products, finding that policy intervention can effectively activate the economic value of ecological resources [11]. In addition, some studies have examined the mechanism by which GEP accounting promotes common prosperity from the perspective of county-level green transformation, revealing the positive role of ecological capitalization in narrowing the urban–rural gap [12]. The relationship between green finance and rural development is another important research area. Previous studies have shown that the development of green finance can significantly promote agricultural investment growth, but policy constraints and financing thresholds remain key factors limiting the participation of smallholder farmers [13]. Further research has found that green finance policies have a positive spillover effect on rural revitalization, and this effect exhibits significant regional heterogeneity [14]. Regarding the control of agricultural non-point source pollution, studies have confirmed that green finance can effectively reduce the use of chemical fertilizers and pesticides by optimizing agricultural production structures [15]. Recent research has focused on the role of digital inclusive finance in enhancing the resilience of the rural economy, finding that improved credit accessibility is a key transmission channel [16]. From the perspective of high-quality agricultural development, related research has systematically evaluated the mechanism by which green finance promotes the green transformation of agriculture, emphasizing the importance of policy coordination [17,18].

2.1.3. Regional and Rural Economic Resilience

The connotations and measurement methods of economic resilience have undergone continuous evolution. Early studies defined regional economic resilience as the ability of an economic system to withstand shocks and restore its original growth path, emphasizing the two core dimensions of adaptability and resilience [6]. Subsequent studies further expanded the theoretical connotation of the resilience concept, extending it from static shock resistance to a dynamic evolutionary adaptation process, and constructing a conceptual framework of adaptation and resilience, distinguishing between short-term response and long-term transformation resilience mechanisms [19,20,21]. From a network perspective, some studies have examined the impact of the collaborative network structure of industrial clusters on the long-term development resilience of regions [22]. In the context of rural China, rural resilience research exhibits localized characteristics. Some studies have constructed a rural household resilience measurement system, examining the evolution of farmers’ risk resistance capabilities from the perspective of the transformation from “fragile smallholders” to “resilient smallholders” [23]. Regarding specific methods for measuring economic resilience, some studies have proposed using the deviation of county-level economic growth rates from the national average as a resilience indicator [24]. Against the backdrop of the COVID-19 pandemic, some studies have measured the livelihood resilience of farmers and revealed its spatial differentiation characteristics [25], while others have identified key factors constraining rural resilience in China [26,27].

2.1.4. Ecological Compensation and Ecosystem Service Payments

The literature on ecological compensation and ecosystem service payments provides important references for this paper. Early research made pioneering estimates of the global value of ecosystem services, laying the theoretical foundation for natural capital accounting [28]. Subsequent research has emphasized the urgency of incorporating ecosystem services into policy decisions and proposed valuation frameworks that integrate efficiency, equity, and sustainability goals [29,30,31]. Regarding China’s practices, some studies have assessed the effectiveness of ecological compensation schemes implemented during development and construction activities, and have proposed a quantitative compensation standard for the multifunctionality of forest ecosystem services based on the Human Development Index [32,33]. Regarding the impact of ecological compensation on farmers’ income distribution, related studies have found that ecological compensation policies can improve rural income inequality [34]. Research on forest carbon sinks and carbon trading provides the background for understanding the financialization of ecological assets. Some studies have assessed the carbon sink potential and emission reduction contribution of China’s forests from the perspective of carbon sink trading, finding that carbon sink growth has a positive spatial spillover effect on neighboring regions [35,36,37,38]. Regarding the overall progress of the rural revitalization strategy, recent studies have systematically reviewed China’s policy practices for rural poverty reduction and anti-recession strategies [39].
The four strands surveyed above remain conceptually distinct despite their thematic proximity, and the contribution of this paper is best understood relative to each. GEP accounting research establishes the feasibility and the methodological standards for valuing ecosystem services, yet stops short of evaluating the welfare consequences of policies anchored on such accounting. The value realization and green finance literature documents an association between policy intervention and the volume of ecological-resource-based credit, while rarely identifying the causal effect of pilot designation on outcomes at the household or county level. Regional resilience research has been applied across both urban and rural contexts in China but has only recently begun to incorporate the institutional dimension of ecological capitalization. Ecological compensation research has documented associations with income-distribution outcomes but operates through a different policy instrument than GEP-anchored capitalization. Specifically, on the causal economic effects of GEP pilots, prior work has established their accounting feasibility and their association with green finance volume [11,12], while their effects on rural welfare outcomes such as economic resilience, income volatility, and ecological-asset financialization remain to be identified through a credible quasi-experimental strategy. This intersection constitutes the gap addressed in this paper.

2.2. Theoretical Mechanism Analysis

The pilot policy for realizing the value of ecological products may enhance the resilience of the rural economy through three interconnected channels, with the diversification of income sources being the primary channel through which the policy takes effect. Under the traditional rural economic model, farmers’ income is highly dependent on agricultural production and migrant work, resulting in a lack of effective buffering mechanisms against market fluctuations and external shocks. The policy for realizing the value of ecological products incorporates ecological resources such as forests, water sources, and air into the value assessment system through GEP accounting, enabling farmers to obtain income from channels such as ecological resource rents, ecological compensation transfer payments, and ecotourism operations [34]. This shift signifies an evolution in farmers’ income structure from a single “selling timber and agricultural products” model to a diversified “selling ecology and services” model. The diversification of income sources itself constitutes a risk-mitigation channel; when one income source is impacted, other sources can provide compensation, thereby enhancing farmers’ ability to withstand economic fluctuations.
The ecological-asset financialization channel is a key link in the policy’s effectiveness. For a long time, rural areas have faced the dilemma of scarce collateral and narrow financing channels. Although ecological resources have potential economic value, they are difficult to transform into tradable and collateralizable financial assets. The establishment of the GEP (Gross Ecosystem Product) accounting system provides an institutional foundation for anchoring the value of ecological resources, making green finance products such as forest tenure mortgage loans, carbon sink pledge financing, and GEP loans possible [11]. The financialization of ecological assets not only broadens the financing channels for farmers and agricultural enterprises and reduces credit constraints, but also improves the allocation efficiency of ecological resources through market-based price discovery mechanisms. When facing external shocks, farmers can obtain liquidity support by mortgaging ecological assets, thereby smoothing consumption fluctuations, maintaining production and operation, and enhancing the resilience of the economic system.
The income-risk smoothing channel, together with the resulting resilience enhancement, is the ultimate manifestation of policy effects. Institutionalized ecological compensation mechanisms provide farmers with a stable and predictable source of transfer payments, operating similarly to risk-sharing arrangements in social insurance. Compared to the high volatility of traditional agricultural income, ecological compensation income is relatively stable, acting as an “income stabilizer” [32]. Furthermore, the Gross Ecosystem Product (GEP) assessment mechanism, by incorporating ecological performance into the local government’s performance evaluation system, strengthens the incentive for local governments to protect ecological resources and reduces the risk of resource depletion due to overexploitation. This institutional risk diversification arrangement, combined with income diversification at the individual farmer level, constitutes the micro-foundation for enhancing rural economic resilience.
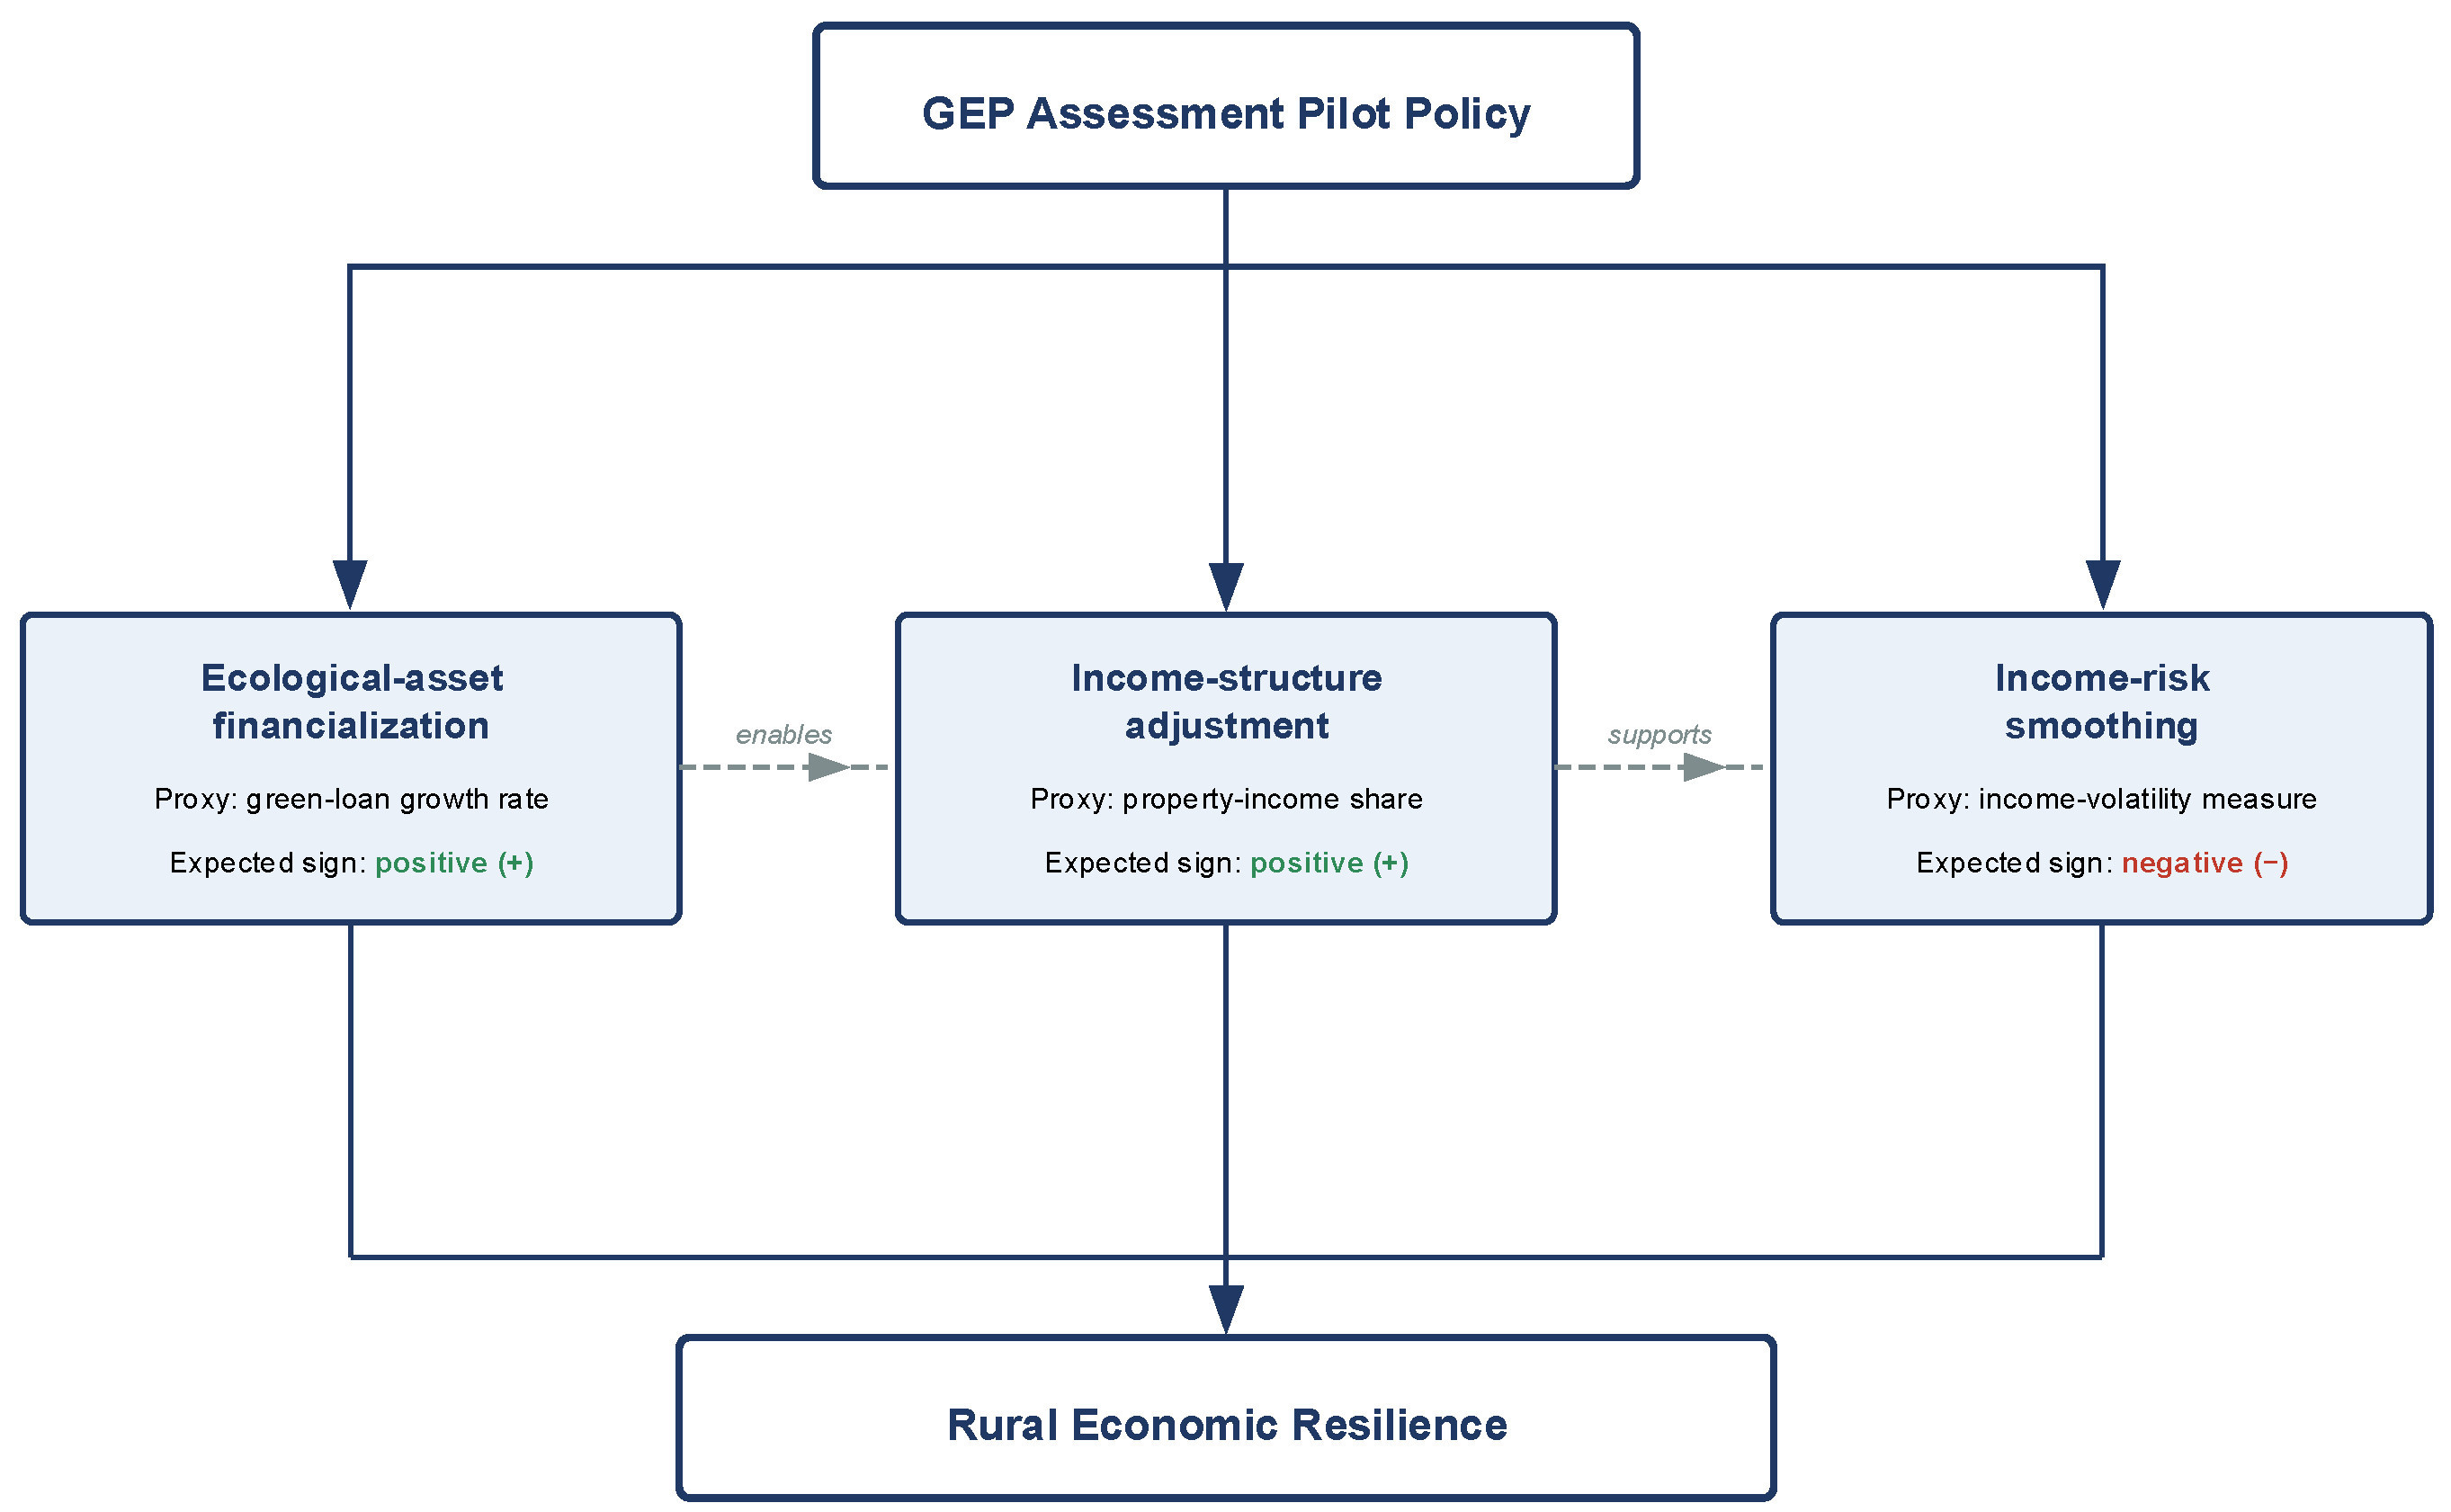
The three channels described above are consolidated in Figure 1, which traces the conceptual flow from the GEP assessment pilot through the three channels to rural economic resilience, with horizontal arrows indicating the sequential dependence among the channels. Considering the differences in ecological resource endowment and regional economic development levels, the policy effects may exhibit heterogeneity: regions rich in ecological resources have greater potential for value transformation, while regions with relatively lagging economic development may obtain higher marginal returns from the policy. This paper will test the above theoretical expectations in Section 4.

3. Institutional Background and Research Design

3.1. Institutional Background: Pilot Policies for Realizing the Value of Ecological Products

The institutional exploration of the mechanism for realizing the value of ecological products in China has evolved from local pilot projects to central top-level design. In January 2019, the National Development and Reform Commission approved and supported Lishui, Zhejiang Province, to carry out a pilot project for the mechanism for realizing the value of ecological products, making Lishui the first prefecture-level city in the country to undertake this reform task. Lishui’s pioneering exploration has accumulated practical experience for subsequent policy design. Its core innovation lies in establishing a Gross Ecosystem Product (GEP) accounting system covering four levels, city, county, township, and village, and incorporating GEP growth into the performance evaluation indicators of local governments.
In April 2021, based on summarizing local pilot experiences, the General Office of the CPC Central Committee and the General Office of the State Council jointly issued the “Opinions on Establishing and Improving the Mechanism for Realizing the Value of Ecological Products,” marking the elevation of the construction of the mechanism for realizing the value of ecological products from local exploration to a national strategy. This document clarified six major mechanisms for realizing the value of ecological products, covering investigation and monitoring, value assessment, operation and development, protection compensation, value realization guarantee, and promotion mechanisms, providing a policy framework for local practices. Subsequently, Fuzhou in Jiangxi Province, Nanping in Fujian Province, and other places successively launched pilot programs, and the National Development and Reform Commission together with the National Bureau of Statistics organized GEP accounting pilot work nationwide. By the end of 2022, the number of districts and counties included in the GEP assessment pilot program had expanded to 36, covering different types of regions in the eastern, central, and western regions. The list of pilot areas comes from official documents published on the National Development and Reform Commission’s government information disclosure website (https://www.ndrc.gov.cn/xxgk/, accessed on 24 January 2026). Given the high degree of consistency in policy content among the various batches of pilot programs, this article includes the Lishui pilot program in 2019, the expanded pilot program in 2021, and subsequent GEP assessment pilot programs within the unified analysis framework.
The core content of the pilot policies can be summarized as follows: at the accounting level, establishing technical specifications and statistical reporting systems for GEP accounting to achieve quantifiable and comparable ecological product value; at the assessment level, exploring a dual accounting, dual evaluation, and dual assessment mechanism for GEP and GDP, incorporating ecological performance into the performance evaluation system; at the trading level, innovating ecological resource rights trading models and developing green finance products such as forest tenure mortgage loans, carbon sink pledge financing, and GEP loans; and at the compensation level, improving the vertical ecological compensation system and establishing a horizontal ecological compensation mechanism across watersheds. These institutional arrangements collectively constitute the policy channel for transforming ‘lucid waters and lush mountains’ into ‘gold and silver mountains’.
The selection of GEP assessment pilot counties was a coordinated administrative process led by the National Development and Reform Commission jointly with the National Bureau of Statistics on the accounting-specification side, and with the Ministry of Ecology and Environment on the technical-guidance side. No publicly disclosed document specified a unified set of selection criteria, and the selection emerged in practice from a combination of local volunteering, provincial-level recommendation, and central-level coordination. This non-random selection implies that pilot counties may differ from non-pilots along observable dimensions such as ecological resource stocks and fiscal capacity, and possibly along unobservable dimensions such as local government reform motivation.

3.2. Model Specification

Given the differences in the timing of pilot inclusion across regions, this paper employs a staggered difference-in-differences model to assess the effect of the pilot policy on realizing the value of ecological products. In recent years, the econometric literature has extensively discussed the bias issues of traditional two-way fixed effects estimators in cases of heterogeneous treatment effects [3,4]. Related research indicates that when treatment times are staggered and treatment effects vary over time or among different groups, traditional estimators may treat earlier treatment groups as implicit controls for later treatment groups, leading to estimation bias or even sign errors [40]. To ensure the robustness of the estimation results, this paper also reports on both traditional two-way fixed effects estimators and the heterogeneity-robust estimator proposed by Callaway and Sant’Anna [7].
The baseline regression model is specified as follows:
E R i t = α + β D I D i t + γ X i t + μ i + λ t + ε i t
where E R i t represents the economic resilience index of county i in year t ; D I D i t is the policy treatment variable, taking a value of 1 when county i is included in the GEP assessment pilot program in year t and thereafter, and 0 otherwise; X i t is the control variable vector, including economic development level, industrial structure, fiscal capacity, population size, urbanization rate, and forest coverage rate; μ i is the county-level fixed effect, used to control for county-level characteristics that do not change over time; λ t is the year-level fixed effect, used to control for national macroeconomic shocks; and ε i t is the random error term, clustered at the county level to correct for potential serial correlations. The coefficient β reflects the average treatment effect of the pilot policy on rural economic resilience.
The key assumption for the effectiveness of the difference-in-differences model is the parallel trend assumption, that is, before the policy implementation, the treatment group and the control group should have similar trends in economic resilience. To test this hypothesis and characterize the dynamics of the policy effects, this paper employs the event study methodology for estimation [41]:
E R i t = α + k = 5 2 β k D i t k + k = 0 3 β k D i t k + γ X i t + μ i + λ t + ε i t
Here, D i t k is a dummy variable for event time, taking a value of 1 when the observation is in the k th period relative to the policy implementation, and 0 otherwise. The period before the policy implementation ( k = 1 ) is used as the base period and is omitted to avoid perfect collinearity. If the parallel trend assumption holds, the coefficient β k when k < 0 should be statistically insignificant.
Callaway and Sant’Anna [7] estimated the group–time average treatment effect in the following form:
A T T ( g , t ) = E [ Y t Y g 1 | G g = 1 ] E [ Y t Y g 1 | C = 1 ]
Here, G g represents the group that received treatment for the first time at period g , and C represents the control group that never received treatment. This estimator, by calculating the treatment effect for each group at each period separately, avoids the problem of using the early-treated group as a control for the later-treated group, and can provide an unbiased estimate when there is heterogeneity in the treatment effect. A recent methodological review systematically outlines the properties and applicable conditions of the above estimator [5].

3.3. Variable Definition and Measurement

The core explained variable in this paper is rural economic resilience (ER). Drawing on Martin and Sunley’s [6] definition of regional economic resilience and Wu et al.’s [24] measurement method, this paper operationalizes economic resilience as the degree of deviation of county-level economic growth rate from the national average growth rate:
E R i t = g i t g ¯ t
Here, g i t represents the real GDP growth rate of county i in year t , and g ¯ t represents the national real GDP growth rate in year t . A positive value indicates that the county’s economic growth rate is higher than the national average, reflecting strong resilience; a negative value indicates weak economic resilience. The advantage of this measurement method is that it eliminates the influence of macroeconomic cycles and can more accurately reflect the relative performance of the county economy. The deviation specification adopted from Wu et al. [24], in line with Martin and Sunley’s [6] conceptual framework, captures the county-level dimension of resilience and only approximates the rural-specific dimension under study. The county GDP series remains susceptible to the influence of industrial projects and fiscal investment, and the rural fit of the indicator therefore deserves direct examination rather than assumption. A rural-targeted analog of the deviation specification is constructed by replacing the total GDP growth rate in Equation (4) with the primary-industry value-added growth rate, which isolates rural-sector performance from urban-style growth drivers following the output-based approach of Shen and Hu [16]. Alongside this alternative specification, the growth rate of rural per capita disposable income enters the baseline regression as a co-equal alternative dependent variable rather than a secondary check. The pairwise correlations between the GDP-based deviation, the primary-industry-based deviation, and the rural disposable income growth rate are reported in the revised robustness subsection, providing direct quantitative evidence on the rural fit of the original measure. Estimates obtained from the alternative specifications align qualitatively with the baseline result, although point magnitudes vary modestly across measures.
Policy treatment variables (DID) are coded according to whether each county is included in the GEP assessment pilot program and the time of inclusion. This paper uses 36 GEP assessment pilot counties as the treatment group, and the pilot list comes from official documents issued by the National Development and Reform Commission and other relevant central agencies. Since Lishui City took the lead in launching the pilot program in 2019, while other regions were mainly included after 2021, this paper codes them separately according to the actual policy implementation time of each county in the event study to make full use of the overlapping characteristics of policy implementation time for identification.
Following the research of Hong and Su [42] and Zhang et al. [43], this paper controls for the following county-level characteristics that may simultaneously affect policy allocation and economic resilience: economic development level is measured by the natural logarithm of GDP per capita; industrial structure is measured by the proportion of tertiary sector value added to GDP; fiscal capacity is measured by the proportion of general public budget expenditure to GDP; population size is measured by the natural logarithm of resident population; urbanization rate is measured by the proportion of urban population to total population; and forest coverage rate is measured by the proportion of forest area to land area.
Construction details for the three mechanism variables are documented as follows: The property income share is computed as the ratio of property income to total disposable income at the county level, with both numerator and denominator drawn from the unified rural household survey series reported in the China County Statistical Yearbook, which ensures consistent definitional treatment across counties. The green-loan growth rate is constructed from manually compiled county-level Statistical Communiques and government work reports, as described in Section 5.1; local reporting conventions vary modestly across counties, and the cross-county comparability of this variable is therefore weaker than that of the other two mechanism variables, which should be borne in mind when interpreting the corresponding coefficient. Income volatility is computed as the rolling three-year standard deviation of the rural per capita disposable income growth rate, with the short post-policy window inevitably limiting the precision of the estimator. Missing observations are treated as such rather than imputed throughout, and any county-year cell lacking the underlying input is dropped from the corresponding mechanism regression without affecting the baseline panel or the other channels.
The definitions and data sources of each variable are shown in Table 1.

3.4. Data Sources and Sample Selection

The sample period spans 2016 to 2023, providing five pre-policy years to support the parallel trend test of the 2021 expansion pilot and approximately three post-policy years for effect identification. Sample selection proceeded in two stages. The opening stage excluded municipal districts and county-level units with more than thirty percent of data missing, removing urban-style observations and ensuring panel completeness. Counties with forest coverage below five percent or above eighty-five percent were also dropped to reduce undue leverage from extreme ecological resource endowments. The subsequent stage addressed concurrent national initiatives whose policy instruments could confound the gep assessment pilot. Counties participating in carbon-peaking pilots concurrently were excluded because their carbon-pricing instruments overlapped most directly with gep-anchored capitalization through the financialization channel. Other concurrent initiatives such as Sponge City pilots and Ecological Civilization Demonstration Zones operate on mechanisms distinct from rural ecological-asset financialization, with Sponge City pilots focused on urban stormwater management and Ecological Civilization Demonstration Zones operating through broader institutional reform rather than direct ecological pricing, and counties affected by these are retained in the analytical sample. The non-random selection of GEP pilot counties documented in Section 3.1 motivates the propensity-score-matched difference-in-differences specification reported in Section 4.4, which addresses observable selection on county-level economic and ecological characteristics, although unobservable dimensions of selection cannot be fully ruled out and are noted as a residual identification caveat. After the above selection, the final sample includes 1946 county-level units, totaling 15,568 county-year observations. The 36 GEP assessment pilot counties in the treatment group contribute a total of 288 county-year observations during the sample period, meeting the basic requirements of the Callaway and Sant’Anna [7] estimators for the treatment group sample size.

4. Empirical Results

4.1. Descriptive Statistics

The descriptive statistical results of the main variables are shown in Table 2. The mean of the rural economic resilience index is 0.008, and the standard deviation is 0.042, indicating that the overall economic growth rate of the sample counties is slightly higher than the national average, but there is significant heterogeneity among counties. The minimum value is −0.32, and the maximum value is 0.38, reflecting that some counties experienced significant economic fluctuations during the sample period. The mean of the growth rate of farmers’ income is 0.079, indicating that rural residents’ income maintained rapid growth during the sample period. The mean of the policy treatment variable is 0.008, which is basically consistent with the proportion of the treatment group in the whole sample. The mean of the forest coverage rate is 0.38, and the median is also about 38%, which will be used as the grouping basis for subsequent heterogeneity analysis.

4.2. Parallel Trend Test

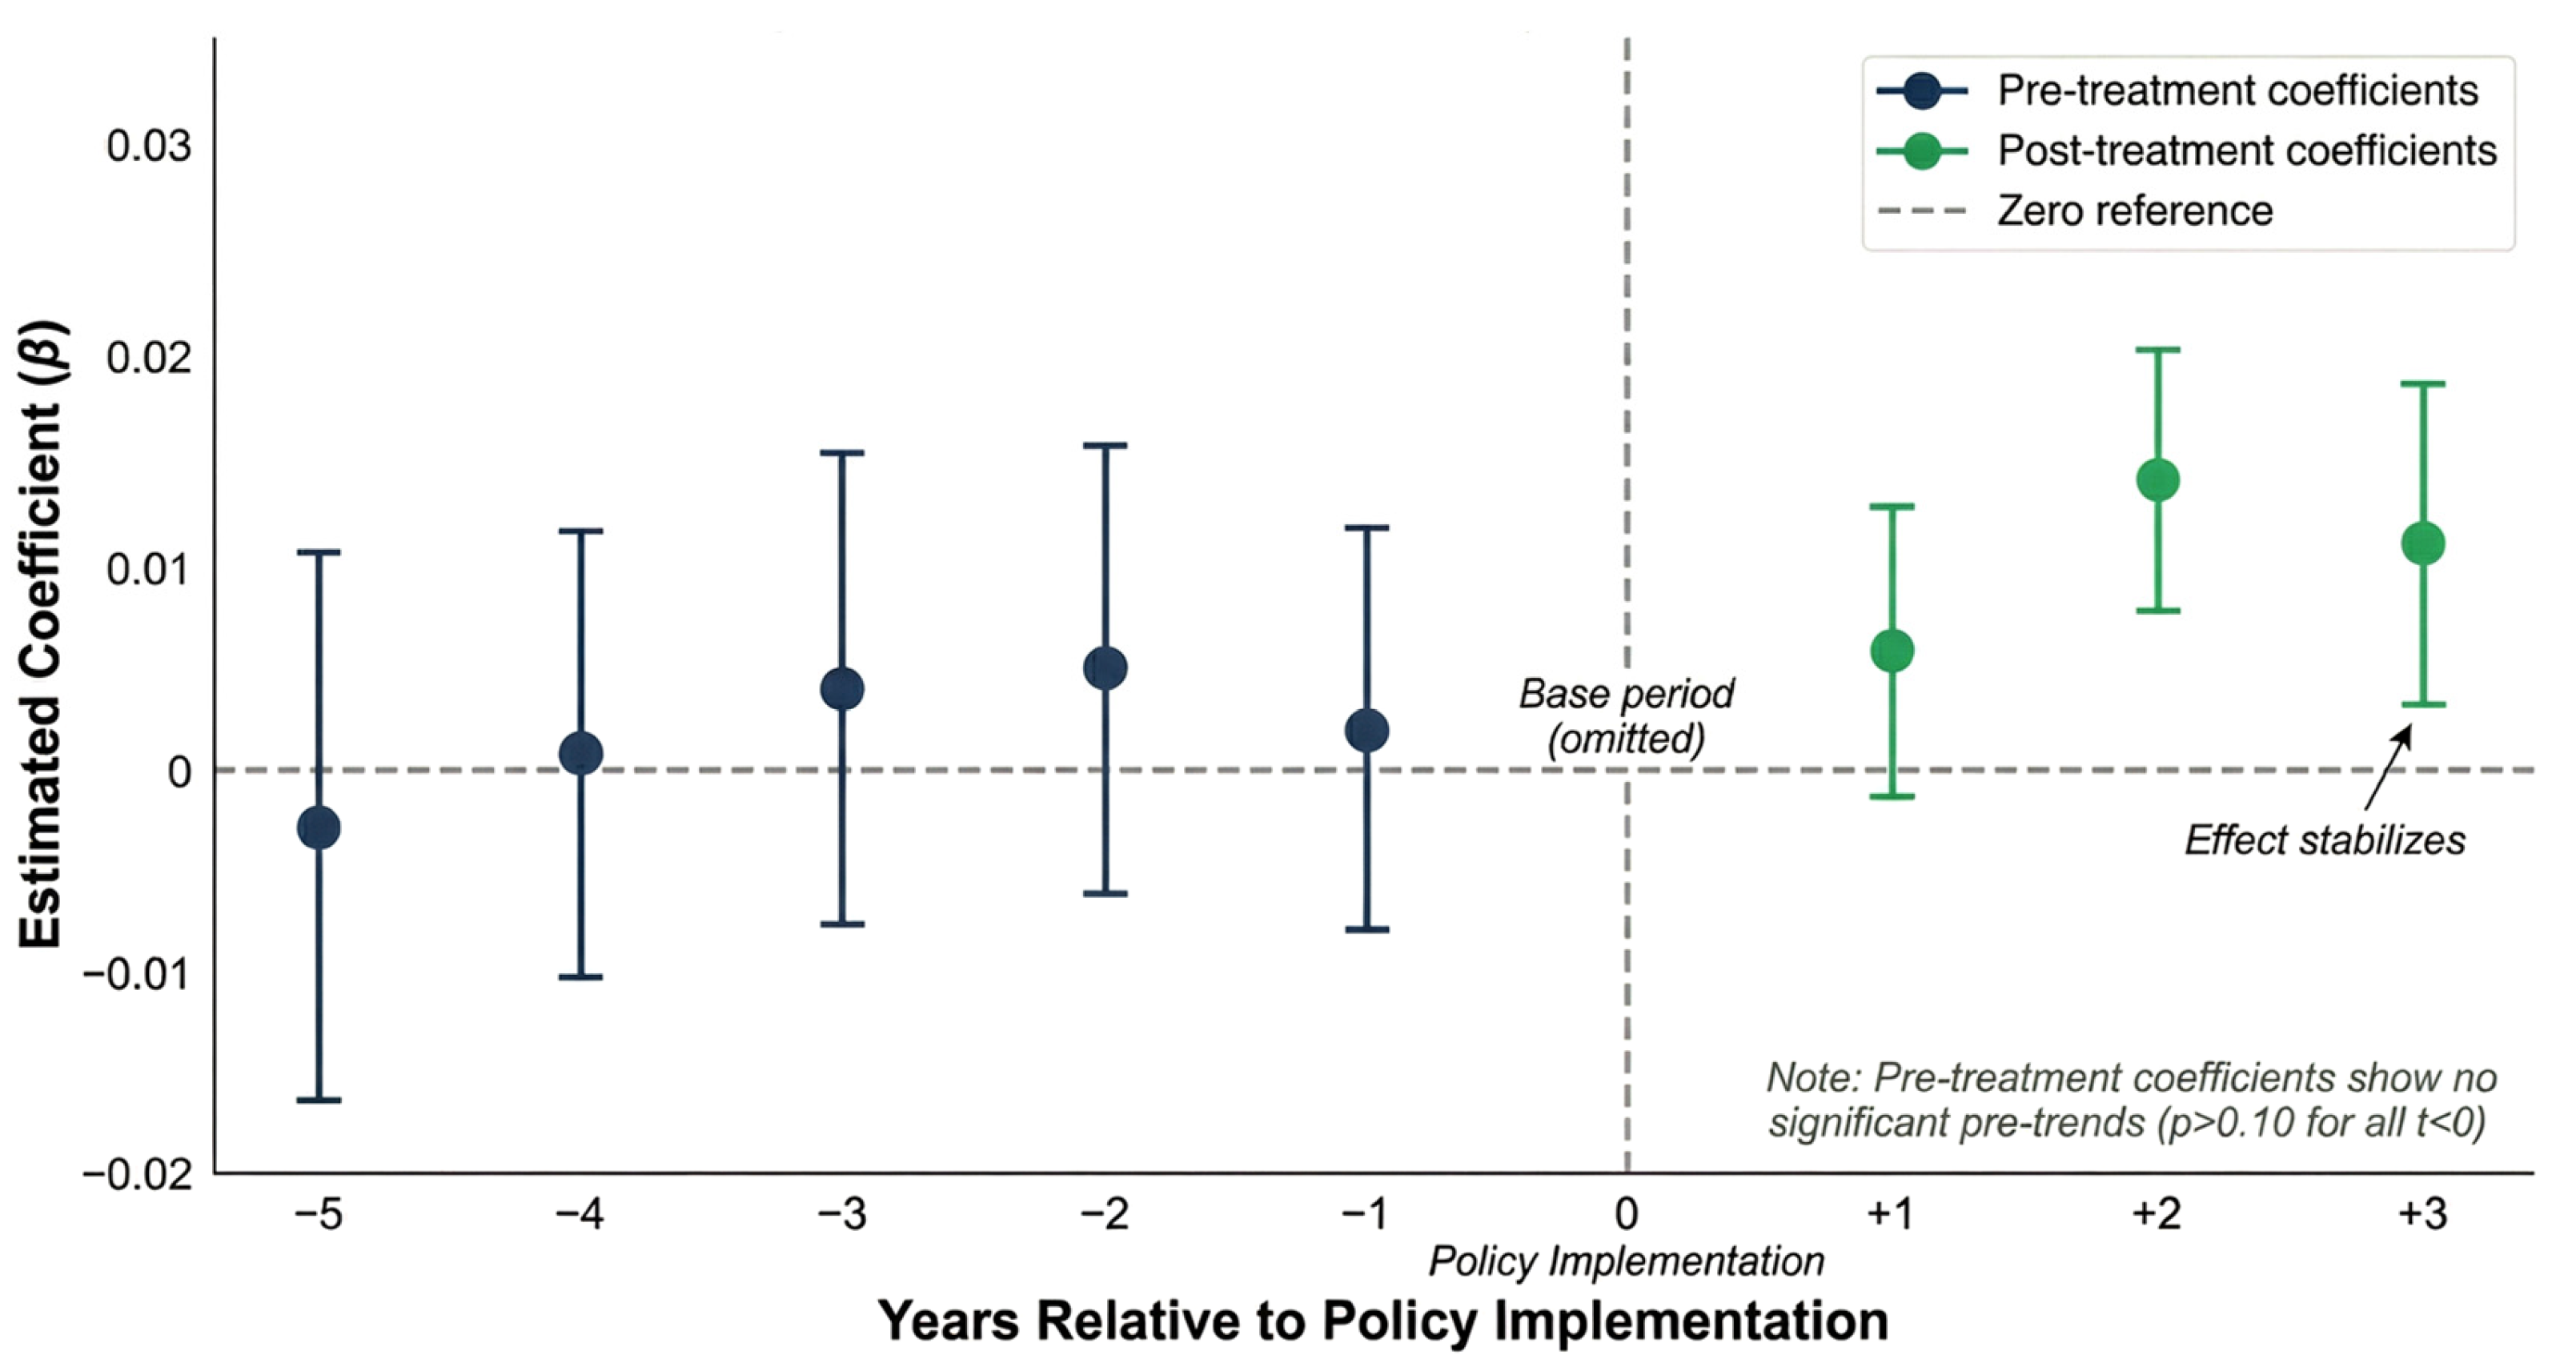
The results of the parallel trend test are shown in Figure 2. It can be observed that before the policy implementation (t = −5 to t = −1), the coefficients in each period fluctuated slightly around zero, and all confidence intervals crossed the zero line (p > 0.10), indicating that there was no systematic trend difference between the treatment group and the control group before the policy implementation, thus supporting the parallel trend hypothesis. After the policy implementation, the coefficients showed a significant positive change: the coefficient in period t = +1 was approximately 0.006, showing marginal significance, consistent with the lag of the policy effect; the coefficient in period t = +2 rose to approximately 0.014, indicating a significantly positive policy effect; and the coefficient in period t = +3 slightly decreased to 0.011, indicating that the policy effect tended to stabilize after an initial rapid release.

4.3. Benchmark Regression Results

The benchmark regression results are shown in Table 3. Under all model settings, the coefficients of the policy treatment variables are significantly positive, indicating that the pilot policy for realizing the value of ecological products has a robust positive impact on rural economic resilience. Column (1) only controls for two-way fixed effects, and the DID coefficient is 0.019; after adding control variables in column (2), the coefficient drops to 0.015, but is still significant at the 1% level. This means that the pilot policy increased the economic resilience index of the treatment group by an average of 1.5 percentage points. Considering that the mean of this index is only 0.008, the policy effect is quite considerable in economic terms. Columns (3) and (4) use the growth rate of farmers’ income as the dependent variable, and the results show that the pilot policy increased the growth rate of farmers’ income by 0.9 percentage points, further corroborating the income-increasing effect of the policy. The benchmark regression coefficient (0.015) reflects the average treatment effect of the policy, while the period coefficient (0.014) in the event study describes the dynamic effect at a specific point in time. The closeness of the two values indicates the inherent consistency of the estimation results.

4.4. Robustness Tests

To ensure the reliability of the baseline conclusions, this paper conducts robustness tests from multiple dimensions, and the results are summarized in Table 4.
The selection of pilot counties may be non-random; counties with better ecological endowments or stronger reform intentions are more likely to be included in the pilot program. To alleviate this concern, this paper calculates the propensity score of each county based on control variables and uses nearest neighbor matching (1:4 matching, caliper 0.05) as a control group with similar matching characteristics to the treatment group, and re-estimates on the matched samples. As shown in column (1) of Table 4, the coefficient of PSM-DID is 0.013, which is close to the baseline result and significant at the 1% level, indicating that the impact of sample selection bias on the conclusions is limited.
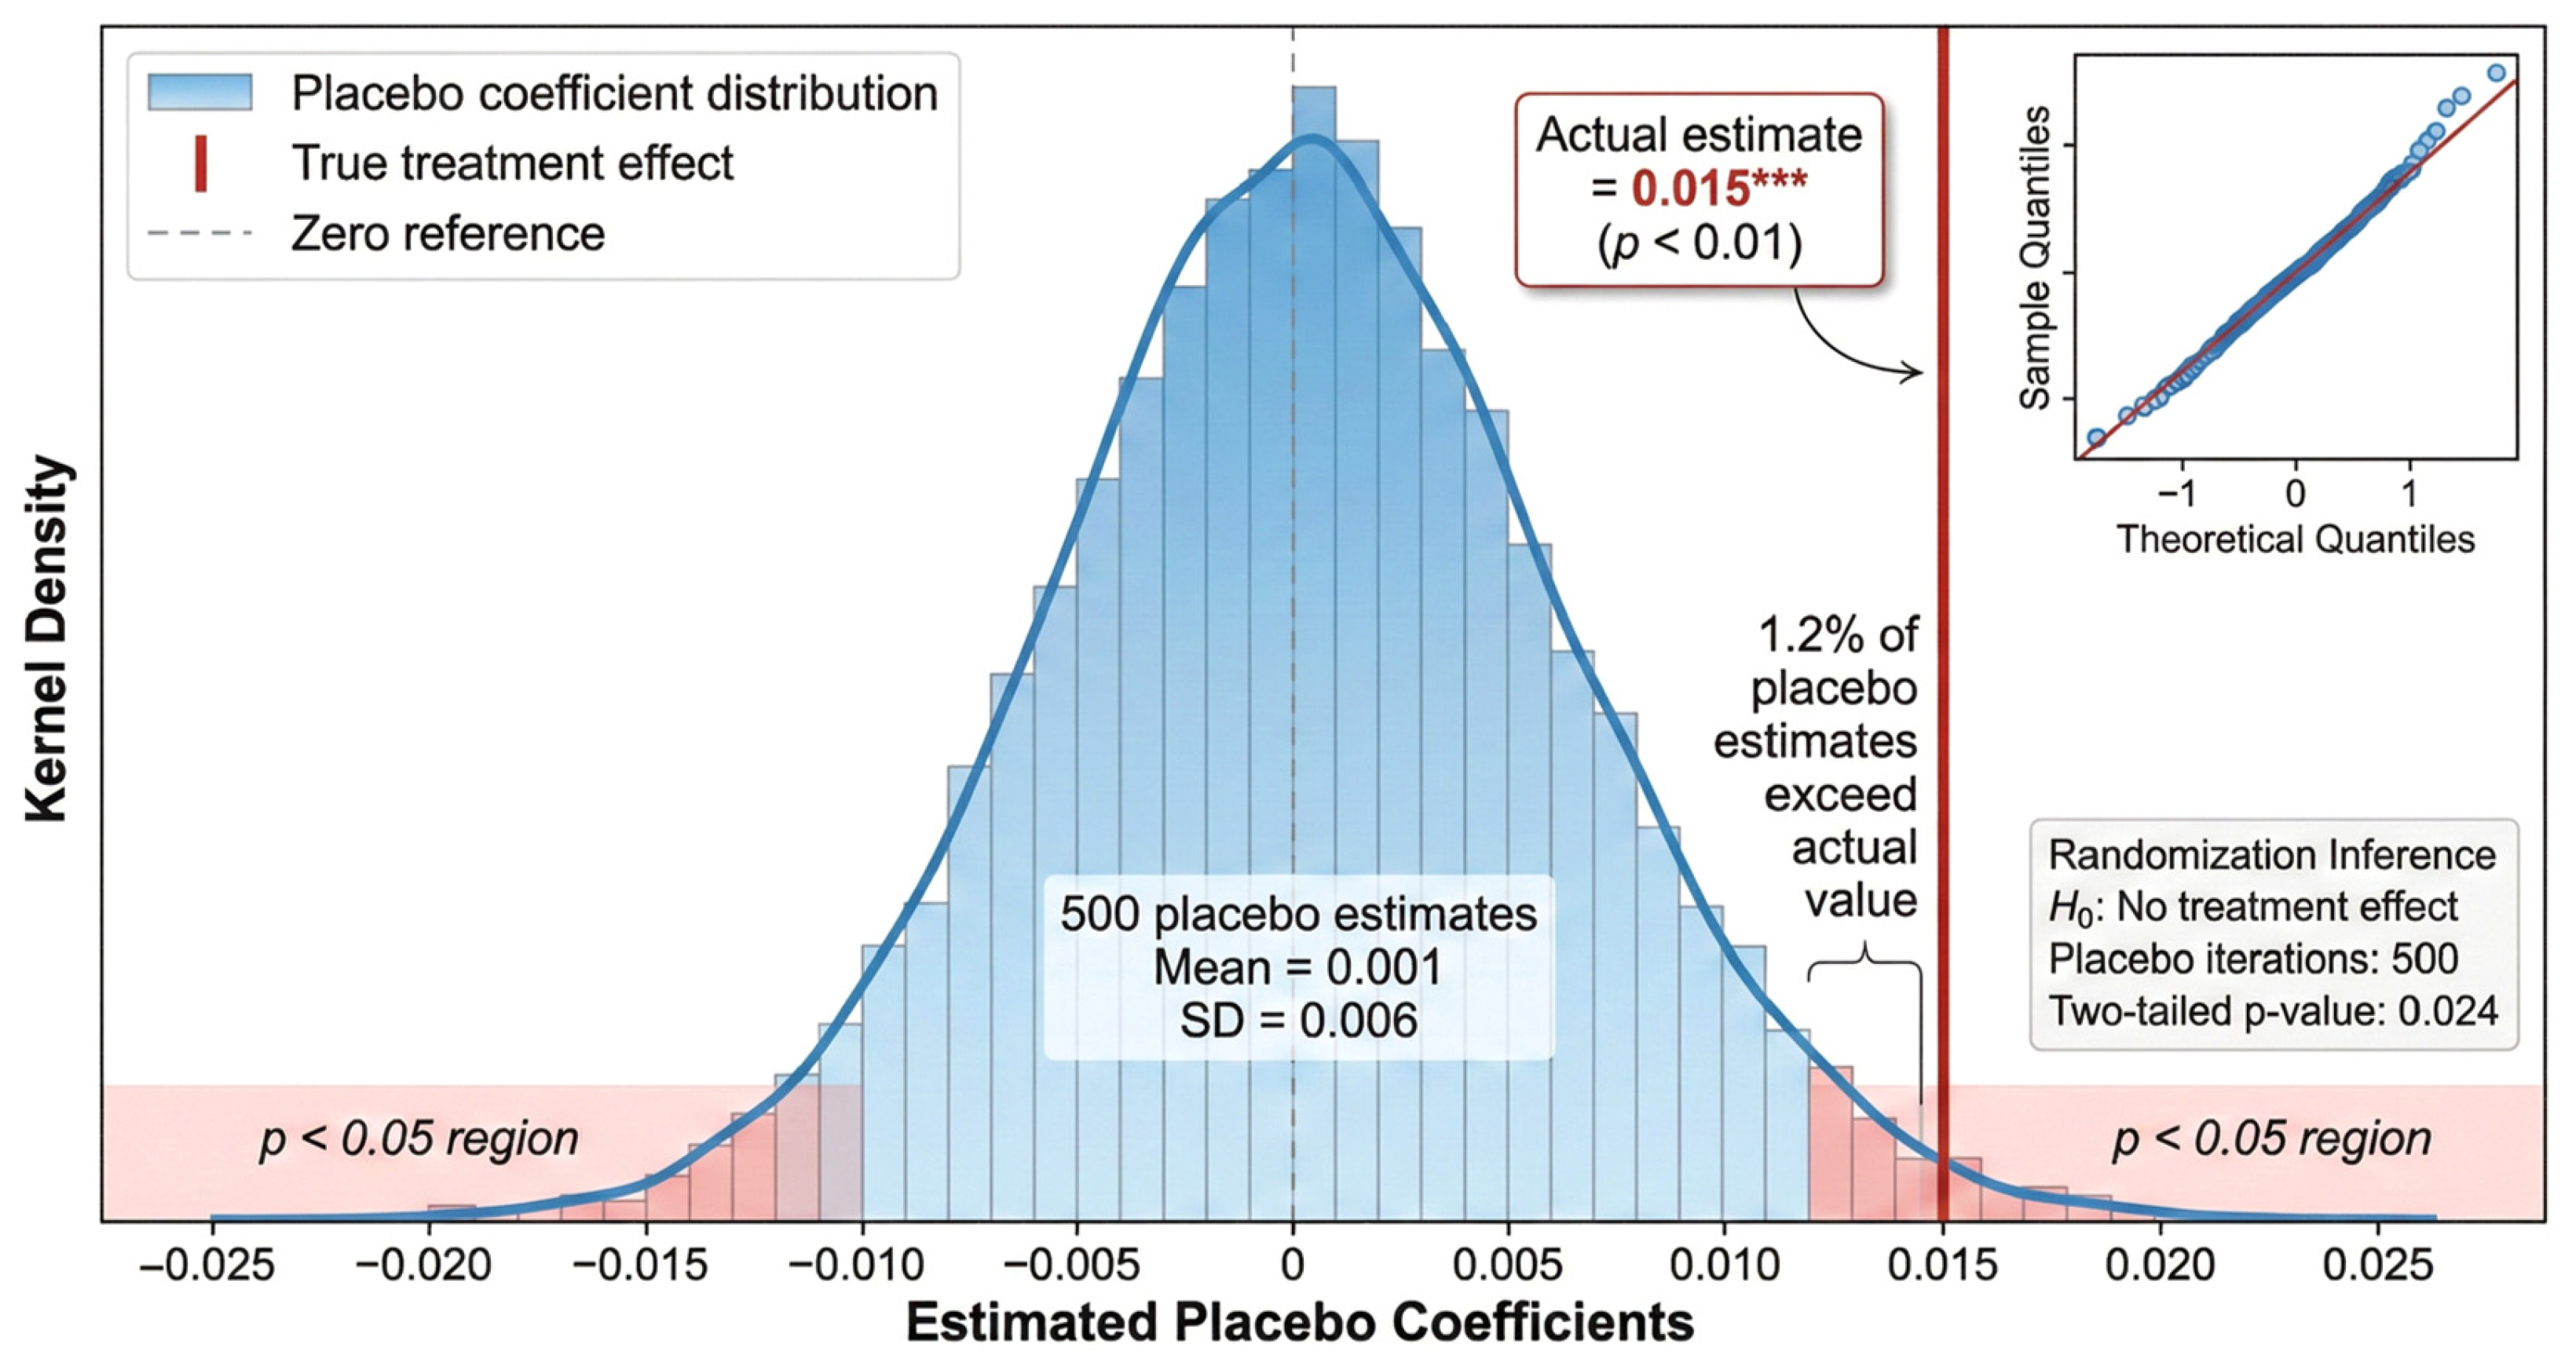
To rule out the possibility of spurious associations, this paper constructs a “pseudo-policy” by artificially advancing the policy implementation time by 2 years for testing. As shown in column (2) of Table 4, the coefficient is 0.002 and not significant, indicating that the baseline result is not driven by existing trend differences before policy implementation. This paper also conducts a randomized inference test, randomly selecting 36 counties from the control group as a “pseudo-treatment group” and repeating the estimation 500 times. The results are shown in Figure 3. The placebo coefficient distribution is approximately normal, with a mean of 0.001 and a standard deviation of 0.006. The true estimate of 0.015 is located at the right tail of the distribution; only 1.2% of the placebo estimates exceed this true value, and the two-tailed p-value is 0.024, indicating that the observed policy effect is unlikely to be due to random factors.
Given that traditional two-way fixed effects estimators may be biased when treatment times are staggered and treatment effects are heterogeneous [3,40], the Goodman-Bacon decomposition results show that the weight of the early treatment group vs. late treatment group is 8.5%, and the weight of the treatment group vs. untreated group is 91.5%, indicating that the potential sources of bias for traditional estimators are limited. This paper uses the heterogeneity-robust estimator of Callaway and Sant’Anna [7] to re-estimate, as shown in column (3) of Table 4. The ATT obtained by this estimator is 0.016, which is highly consistent with the baseline result, thus confirming the judgment of the decomposition results.
Alternative dependent variables and rural fit correlation: To verify that the GDP-based deviation indicator captures the rural-specific dimension of resilience, two additional checks are conducted alongside the four reported in Table 4. First, the primary-industry value-added growth rate replaces the total GDP growth rate in Equation (4) to construct a rural-targeted analog of the deviation specification, yielding a DID coefficient of 0.014 (SE 0.005), significant at the 1% level. Second, the rural per capita disposable income growth rate, already reported in column (4) of Table 3 with a DID coefficient of 0.009 (SE 0.003), is reframed as a co-equal alternative dependent variable rather than a secondary check. The pairwise Pearson correlations across the three measures range from approximately 0.38 to 0.52 in the full sample, with the strongest pairing between the GDP-based and primary-industry-based deviations and the weakest between the GDP-based deviation and the rural disposable income growth rate, providing direct quantitative evidence that the original measure adequately reflects rural-sector economic performance while leaving room for measure-specific differences in level.

4.5. Heterogeneity Analysis

Policy effects may exhibit heterogeneity due to differences in regional ecological endowments and location conditions. The grouped regression results are shown in Table 5.
The high-forest-cover gradient is interpreted through the three-channel framework of Section 2.2. The income-structure channel widens where ecological compensation transfers and ecotourism receipts grow more meaningful relative to traditional agricultural income, in line with the rural income-distribution evidence of Zhang et al. [34]. The financialization channel is amplified where forest assets are abundant because the volume of monetizable ecosystem flow scales with biophysical stock, consistent with the ecosystem service valuation tradition [28] and with carbon sink evidence in the Chinese context [35,36]. The risk-smoothing channel is reinforced since the magnitude of stable ecological transfers itself scales with stock. The western-region gradient operates on the same three channels from a lower starting base, since pricing institutions and collateral mechanisms for ecological assets have been largely absent in resource-rich but financially under-developed counties prior to the pilot, and the policy therefore produces a larger incremental movement on the financialization channel than in regions where these institutions are already in place, consistent with the differentiated development path argument of Liu et al. [12]. The eastern coefficient is positive but only marginally significant, consistent with the diversified income sources and developed financial markets already in place there. The high-forest-cover and western-region gradients are not fully independent because western counties tend to exhibit higher forest cover, and the two findings are interpreted as complementary readings of the same underlying resource-endowment dimension rather than as independent contrasts. The same qualitative gradient holds when the primary-industry-based deviation and the rural disposable income growth rate from Section 4.4 are substituted for the baseline dependent variable, with point magnitudes varying modestly across measures.

5. Mechanism Analysis

5.1. Mechanism Testing

The mechanism analysis is interpreted as a channel-decomposition exercise rather than as a formal mediation analysis. The empirical strategy identifies the reduced-form effect of pilot designation on each channel variable and on the outcome, but does not formally decompose the share of the total effect that flows through each channel. The estimates are therefore presented as suggestive of the conceptual pathway introduced in Section 2.2 rather than as quantitative mediation results. Baseline regression established the causal relationship between the pilot policy for realizing the value of ecological products and the resilience of the rural economy. Based on the three channels proposed in the theoretical analysis, this paper constructs three mechanism variables for testing: income-structure adjustment, ecological-asset financialization, and income-risk smoothing. Income-structure adjustment is measured by the share of property income in rural per capita disposable income. The numerator and denominator are drawn from the unified rural household survey series in the China County Statistical Yearbook, which ensures consistent definitional treatment across counties and years. The indicator captures the emerging income sources such as ecological resource rent, ecotourism receipts, and carbon trading income that the GEP assessment pilot is designed to activate. Ecological-asset financialization is measured by the year-on-year growth rate of agriculture-related green-loan balances at the county level. The underlying balance figures are extracted from county-level Statistical Communiques on National Economic and Social Development together with annual government work reports, since the relevant subseries is not consistently reported in the China County Statistical Yearbook, and each figure is cross-verified against the original document by the research team. Income-risk smoothing is measured by the rolling three-year standard deviation of the rural per capita disposable income growth rate, with a decrease in the value indicating an improvement in income stability. The three-year window is the longest stable interval available given the post-policy observation period. The estimator remains unbiased under stationarity assumptions, yet its sampling error is non-trivial in the short post-policy panel, and the corresponding mechanism coefficient should therefore be read with this caveat in mind.
The mechanism testing results are shown in Table 6. Column (1) shows that the pilot policy increased the proportion of property income by 2.5 percentage points, indicating that the policy effectively promoted the optimization of farmers’ income structure, with ecological resource rent and carbon trading income becoming new growth points. This is consistent with previous research findings on how ecological compensation improves rural income distribution [34]. Column (2) shows that the pilot policy increased the growth rate of ecological loans by 10.8 percentage points, reflecting the fact that GEP accounting provides a value anchor for ecological assets and activates market demand for green financial products such as forest tenure mortgage and GEP pledge, confirming the judgment of relevant research on how green finance promotes the realization of the value of ecological products [11]. Column (3) shows that the pilot policy reduced income volatility by 1.8 percentage points. The negative coefficient indicates a decrease in volatility, indicating that ecological compensation income played a “stabilizing” role and effectively smoothed out the fluctuations in farmers’ income. This finding echoes the research conclusion that ecological compensation schemes reduce the vulnerability of farmers’ income [32]. The patterns are consistent with all three theorized channels.

5.2. Mechanism Discussion

Based on the channel-test results, the pilot policy is associated with movements in three interconnected channel variables, the joint pattern of which is consistent with the conceptual pathway introduced in Section 2.2. This finding deepens the theoretical understanding of the relationship between ecological capitalization and rural development. Logically, the three channels are progressive and complementary: ecological-asset financialization is a prerequisite; GEP accounting assigns economic value labels to ecological resources, providing a foundation for subsequent income conversion, which aligns with the theoretical framework of ecosystem service value accounting [2]; income-structure adjustment is the intermediate link; financialization opens up channels for converting ecological resources into monetary income, making the transformation of “lucid waters and lush mountains” into “gold and silver mountains” possible; and income-risk smoothing is the ultimate effect; diversified income combinations naturally possess risk hedging functions, while institutionalized ecological compensation further strengthens the “safety net” effect.
This channel pattern is consistent with the core argument of regional economic resilience theory regarding adaptive capacity building [19,20]. The heterogeneity gradient documented in Section 4.5 operates through the same three channels and is not re-examined here to avoid duplication.
From a theoretical perspective, this paper’s mechanism analysis expands upon the existing literature in three ways. First, it organically integrates research on ecosystem service value accounting with research on regional economic resilience, revealing the micro-mechanism by which ecological capitalization enhances farmers’ resilience to risks, thus bridging the theoretical gap between the two research fields. Second, it identifies the mediating role of ecological-asset financialization between ecological protection and increased farmer income, providing a new analytical perspective for understanding the mechanism by which green finance serves rural revitalization, echoing related research on how green finance promotes sustainable rural development [14,17]. Third, it incorporates income stability into the framework for measuring economic resilience, extending the concept of resilience from macroeconomic fluctuations to microeconomic welfare stability. This perspective aligns with the policy objective of transitioning from “fragile smallholders” to “resilient smallholders” [23].
However, this paper’s mechanism analysis also has some limitations that need to be acknowledged. The relatively low R2 for income volatility (0.45) is interpreted as reflecting omitted-variable sources of variation, including farmers’ risk preferences, informal insurance mechanisms, and social network support that are not observable in the panel. This omitted-variable interpretation is distinct from the sampling-error caveat noted in Section 5.1 for the volatility estimator itself. The variable for ecological loan growth was manually compiled from county-level Statistical Communiques and government work reports, which may have introduced measurement errors and made it difficult to distinguish the relative contributions of supply-side driving forces and demand-side pulling forces. Furthermore, the mechanism test uses a simplified regression model rather than a complete mediation effect model, which limits the accuracy of causal inference. These limitations suggest that future research could utilize micro-level survey data from farmers, combined with structural equation modeling or instrumental variable methods, to further validate and refine the mechanism findings presented in this paper.

6. Conclusions and Policy Recommendations

This paper uses national county-level panel data from 2016 to 2023, taking the Gross Ecosystem Product (GEP) assessment pilot policy as a quasi-natural experiment, and employs a staggered difference-in-differences model to systematically evaluate the impact of the ecological product value realization mechanism on rural economic resilience. The study finds that the ecological product value realization pilot policy is associated with an increase in rural economic resilience, with the economic resilience index of pilot counties increasing by an average of approximately 1.5 percentage points. This effect remains robust under multiple robustness tests, including parallel trend tests, propensity-score-matched difference-in-differences (PSM-DID) tests, placebo tests, and heterogeneity-robust estimators. The reduced-form patterns operate through three plausible channels, namely income-structure adjustment, ecological-asset financialization, and income-risk smoothing. The pilot policy increases the proportion of property income by 2.5 percentage points and the growth rate of ecological loans by 10.8 percentage points, and reduces income volatility by 1.8 percentage points. The policy effect shows heterogeneity across resource-endowment groups, being more pronounced in areas with high forest cover and western regions, while the effect is relatively limited in areas with weaker ecological endowments and economically developed eastern regions.
Subject to the limitations discussed below, the empirical patterns reported here carry several tentative implications for policy design. The findings are consistent with an orderly expansion of the GEP assessment pilot program in counties whose ecological resource stocks are abundant relative to their stage of economic development, although the optimal pace and sequencing of expansion remain open empirical questions that this study does not settle. Strengthening the institutional infrastructure for ecological-asset registration and lowering the operational barriers to forest tenure mortgage, carbon sink pledge, and GEP-anchored credit appear to be complementary measures, conditional on the institutional infrastructure being mature enough to support such products. Differentiated implementation calibrated to local ecological endowments may help to avoid uniform standards that exceed the absorptive capacity of less resource-endowed regions.
This study has several limitations that require further improvement in future research. Regarding the sample size, the treatment group only includes 36 districts and counties. While the number of observations across years is sufficient, the size of the treatment group is still relatively small, and the extrapolation of the research conclusions to other regions needs to be approached with caution. In terms of data, mechanistic variables such as the growth rate of ecological loans need to be collected manually, which may introduce measurement errors. Furthermore, the aggregated data at the county level are insufficient to capture the heterogeneous responses at the individual farmer level. Regarding the time frame, the policy has only been implemented for 3 to 5 years, and its long-term effects and dynamic evolution characteristics need to be tracked and observed. The treatment sample of thirty-six counties also limits the generalizability of the conclusions to alternative institutional contexts, and the long-term effects of the pilot await additional post-policy observation as the post-policy window in this study extends only three to five years. Future research could incorporate micro-level survey data from farmers to explore the differentiated impacts of the policy on farmers of different income groups and livelihood types, deepening the understanding of the mechanism by which the realization of the value of ecological products promotes common prosperity.

Author Contributions

Conceptualization, S.W. and P.Z.; Methodology, S.W., Y.Z. and R.D.; Software, S.W., Y.Z. and R.D.; Validation, S.W.; Investigation, S.W. and R.D.; Resources, Y.Z.; Data curation, S.W.; Writing—original draft, S.W.; Writing—review & editing, P.Z.; Supervision, P.Z.; Project administration, P.Z.; Funding acquisition, P.Z. All authors have read and agreed to the published version of the manuscript.

Funding

This research received no external funding.

Institutional Review Board Statement

Not applicable.

Informed Consent Statement

Not applicable.

Data Availability Statement

The data used in this study are derived from publicly available sources, including the China County Statistical Yearbook and the China Forestry Statistical Yearbook, both accessible via the China National Knowledge Infrastructure (CNKI) database. The list of GEP assessment pilot counties was obtained from official documents published by the National Development and Reform Commission (https://www.ndrc.gov.cn/xxgk/, accessed on 24 January 2026). Data are available upon reasonable request from the corresponding author.

Conflicts of Interest

The authors declare no conflicts of interest.

References

  1. Liu, J.; Diamond, J. China’s environment in a globalizing world. Nature 2005, 435, 1179–1186. [Google Scholar] [CrossRef]
  2. Ouyang, Z.; Song, C.; Zheng, H.; Polasky, S.; Xiao, Y.; Bateman, I.J.; Liu, J.; Ruckelshaus, M.; Shi, F.; Xiao, Y.; et al. Using gross ecosystem product (GEP) to value nature in decision making. Proc. Natl. Acad. Sci. USA 2020, 117, 14593–14601. [Google Scholar] [CrossRef] [PubMed]
  3. Goodman-Bacon, A. Difference-in-differences with variation in treatment timing. J. Econom. 2021, 225, 254–277. [Google Scholar] [CrossRef]
  4. de Chaisemartin, C.; D’Haultfœuille, X. Two-way fixed effects estimators with heterogeneous treatment effects. Am. Econ. Rev. 2020, 110, 2964–2996. [Google Scholar] [CrossRef]
  5. Roth, J.; Sant’Anna, P.H.C.; Bilinski, A.; Poe, J. What’s trending in difference-in-differences? A synthesis of the recent econometrics literature. J. Econom. 2023, 235, 2218–2244. [Google Scholar] [CrossRef]
  6. Martin, R.; Sunley, P. On the notion of regional economic resilience: Conceptualization and explanation. J. Econ. Geogr. 2015, 15, 1–42. [Google Scholar] [CrossRef]
  7. Callaway, B.; Sant’Anna, P.H.C. Difference-in-differences with multiple time periods. J. Econom. 2021, 225, 200–230. [Google Scholar] [CrossRef]
  8. Ouyang, Z.; Zheng, H.; Xiao, Y.; Polasky, S.; Liu, J.; Xu, W.; Wang, X.; Wang, Y.; Jiang, L.; Rao, E.; et al. Gross ecosystem product: Concept, accounting framework and case study. Acta Ecol. Sin. 2013, 33, 6747–6761. [Google Scholar] [CrossRef]
  9. Zheng, H.; Wu, T.; Ouyang, Z.; Polasky, S.; Ruckelshaus, M.; Wang, L.; Xiao, Y.; Gao, X.; Li, C.; Daily, G.C. Gross ecosystem product (GEP): Quantifying nature for environmental and economic policy innovation. Ambio 2023, 52, 1952–1967. [Google Scholar] [CrossRef]
  10. Hao, C.; Wu, S.; Zhang, W.; Chen, Y.; Ren, Y.; Chen, X.; Wang, H.; Zhang, L. A critical review of Gross ecosystem product accounting in China: Status quo, problems and future directions. J. Environ. Manag. 2022, 322, 115995. [Google Scholar] [CrossRef]
  11. Wu, G.; Cheng, J.; Yang, F.; Chen, G. Can green finance policy promote ecosystem product value realization? Evidence from a quasi-natural experiment in China. Humanit. Soc. Sci. Commun. 2024, 11, 377. [Google Scholar] [CrossRef]
  12. Liu, K.; Jin, M.; Cheng, L. County green transformation: How does gross ecosystem product assessment promote common prosperity? Humanit. Soc. Sci. Commun. 2025, 12, 20. [Google Scholar] [CrossRef]
  13. Mei, B.; Khan, A.A.; Khan, S.U.; Ali, M.A.S.; Luo, J. An estimation of the effect of green financial policies and constraints on agriculture investment: Evidences of sustainable development achievement in Northwest China. Front. Public Health 2022, 10, 903431. [Google Scholar] [CrossRef] [PubMed]
  14. Sun, Y.; Ding, G.; Li, M.; Zhang, M.; Agyeman, F.O.; Liu, F. The spillover effect of green finance development on rural revitalization: An empirical analysis based on China’s provincial panel data. Environ. Sci. Pollut. Res. 2023, 30, 58907–58919. [Google Scholar] [CrossRef] [PubMed]
  15. Lv, W.; Zhang, Z.; Zhang, X. The role of green finance in reducing agricultural non-point source pollution—An empirical analysis from China. Front. Sustain. Food Syst. 2023, 7, 1199417. [Google Scholar] [CrossRef]
  16. Shen, Y.; Hu, G. How does digital inclusive finance improve rural economic resilience? Evidence from China. Digit. Econ. Sustain. Dev. 2024, 2, 12. [Google Scholar] [CrossRef]
  17. Yuan, X.; Zhang, J.; Shi, J.; Wang, J. What can green finance do for high-quality agricultural development? Fresh insights from China. Socio-Econ. Plan. Sci. 2024, 94, 101920. [Google Scholar] [CrossRef]
  18. Yi, C.; Xu, B.; Lin, K. Exploring the impact of green finance on sustainable rural development: Evidence from 283 cities in China. Discret. Dyn. Nat. Soc. 2025, 2025, 6680364. [Google Scholar] [CrossRef]
  19. Martin, R.; Sunley, P. Regional economic resilience: Evolution and evaluation. In The Economic Geography of Cross-Border Migration; Kourtit, K., Newbold, B., Nijkamp, P., Partridge, M., Eds.; Springer: Cham, Switzerland, 2020; pp. 10–35. [Google Scholar]
  20. Hu, X.; Hassink, R. Adaptation, adaptability and regional economic resilience: A conceptual framework. In Handbook on Regional Economic Resilience; Bristow, G., Healy, A., Eds.; Edward Elgar Publishing: Cheltenham, UK, 2020; pp. 54–68. [Google Scholar]
  21. Bristow, G.; Healy, A. Introduction to the handbook on regional economic resilience. In Handbook on Regional Economic Resilience; Edward Elgar Publishing: Cheltenham, UK, 2020; pp. 1–8. [Google Scholar]
  22. Crespo, J.; Suire, R.; Vicente, J. Network structural properties for cluster long-run dynamics: Evidence from collaborative R&D networks in the European mobile phone industry. Ind. Corp. Change 2016, 25, 261–282. [Google Scholar]
  23. Xu, J.; Lu, W.; Wang, W. From “fragile smallholders” to “resilient smallholders”: Measuring rural household resilience in China. Humanit. Soc. Sci. Commun. 2024, 11, 1712. [Google Scholar] [CrossRef]
  24. Wu, C.; Zhao, K.; Liu, Y.; Liu, J. Nonlinear effects of trade uncertainty shocks on economic resilience in China. Rev. Dev. Econ. 2026, 30, 679–690. [Google Scholar] [CrossRef]
  25. Zhao, X.; Xiang, H.; Zhao, F. Measurement and spatial differentiation of farmers’ livelihood resilience under the COVID-19 epidemic outbreak in rural China. Soc. Indic. Res. 2023, 166, 239–267. [Google Scholar] [CrossRef]
  26. Li, Y.; Song, C.; Huang, H. Rural resilience in China and key restriction factor detection. Sustainability 2021, 13, 1080. [Google Scholar] [CrossRef]
  27. Fan, J.; Mo, Y.; Cai, Y.; Zhao, Y.; Su, D. Evaluation of community resilience in rural China—Taking Licheng Subdistrict, Guangzhou as an example. Int. J. Environ. Res. Public Health 2021, 18, 5827. [Google Scholar] [CrossRef]
  28. Costanza, R.; d’Arge, R.; De Groot, R.; Farber, S.; Grasso, M.; Hannon, B.; Limburg, K.; Naeem, S.; O’Neill, R.V.; Paruelo, J.; et al. The value of the world’s ecosystem services and natural capital. Nature 1997, 387, 253–260. [Google Scholar] [CrossRef]
  29. Daily, G.C.; Polasky, S.; Goldstein, J.; Kareiva, P.M.; Mooney, H.A.; Pejchar, L.; Ricketts, T.H.; Salzman, J.; Shallenberger, R. Ecosystem services in decision making: Time to deliver. Front. Ecol. Environ. 2009, 7, 21–28. [Google Scholar] [CrossRef]
  30. Costanza, R. Valuing natural capital and ecosystem services toward the goals of efficiency, fairness, and sustainability. Ecosyst. Serv. 2020, 43, 101096. [Google Scholar] [CrossRef]
  31. Guerry, A.D.; Polasky, S.; Lubchenco, J.; Chaplin-Kramer, R.; Daily, G.C.; Griffin, R.; Ruckelshaus, M.; Bateman, I.J.; Duraiappah, A.; Elmqvist, T.; et al. Natural capital and ecosystem services informing decisions: From promise to practice. Proc. Natl. Acad. Sci. USA 2015, 112, 7348–7355. [Google Scholar] [CrossRef]
  32. Gao, S.; Bull, J.W.; Baker, J.; Ermgassen, S.O.E.; Milner-Gulland, E.J. Analyzing the outcomes of China’s ecological compensation scheme for development-related biodiversity loss. Conserv. Sci. Pract. 2023, 5, e13010. [Google Scholar] [CrossRef]
  33. Niu, X.; Xu, T.; Wang, B. Payments for forest ecosystem services in China: A multi-function quantitative ecological compensation standard based on the Human Development Index. Front. Earth Sci. 2025, 13, 1447513. [Google Scholar] [CrossRef]
  34. Zhang, Q.; Bilsborrow, R.E.; Song, C.; Tao, S.; Huang, Q. Rural household income distribution and inequality in China: Effects of payments for ecosystem services policies and other factors. Ecol. Econ. 2019, 160, 114–127. [Google Scholar] [CrossRef]
  35. Ke, S.; Zhang, Z.; Wang, Y. China’s forest carbon sinks and mitigation potential from carbon sequestration trading perspective. Ecol. Indic. 2023, 148, 110054. [Google Scholar] [CrossRef]
  36. Zhao, N.; Wang, K.; Yuan, Y. Toward the carbon neutrality: Forest carbon sinks and its spatial spillover effect in China. Ecol. Econ. 2023, 209, 107837. [Google Scholar] [CrossRef]
  37. Zhou, Y.; Xue, C.; Liu, S.; Zhang, J. Carbon sequestration costs and spatial spillover effects in China’s collective forests. Carbon Balance Manag. 2024, 19, 14. [Google Scholar] [CrossRef] [PubMed]
  38. Ge, J.; Zhang, Z.J.; Lin, B. Towards carbon neutrality: How much do forest carbon sinks cost in China? Environ. Impact Assess. Rev. 2022, 98, 106949. [Google Scholar] [CrossRef]
  39. Feng, Z.; Robinson, G.M.; Tan, Y. Rural revitalization in China: Reversing rural decline and eliminating poverty. Geogr. Compass 2025, 19, e70039. [Google Scholar] [CrossRef]
  40. Baker, A.C.; Larcker, D.F.; Wang, C.C.Y. How much should we trust staggered difference-in-differences estimates? J. Financ. Econ. 2022, 144, 370–395. [Google Scholar] [CrossRef]
  41. Sun, L.; Abraham, S. Estimating dynamic treatment effects in event studies with heterogeneous treatment effects. J. Econom. 2021, 225, 175–199. [Google Scholar] [CrossRef]
  42. Hong, Q.; Su, J. The impact of rural e-commerce platforms on the transformation of industrial structure: Evidence from China. Rev. Dev. Econ. 2024, 28, 1267–1291. [Google Scholar] [CrossRef]
  43. Zhang, J.; Fan, Z.; Liu, J.; Ahmad, F.; Cao, Z. Livelihood capital, risk response, and rural household poverty vulnerability: An Empirical Experience Based in China. Rev. Dev. Econ. 2025, 29, 1693–1711. [Google Scholar] [CrossRef]
Figure 1. Conceptual framework linking the GEP assessment pilot to rural economic resilience. Note: The figure illustrates the three channels through which the GEP assessment pilot is associated with rural economic resilience. Solid arrows connect the policy through the three channels to the outcome, while horizontal dashed arrows indicate that ecological-asset financialization enables income-structure adjustment, which in turn supports income-risk smoothing. Each channel is annotated with its empirical measure and the expected direction of effect.
Sustainability 18 04810 g001
Figure 2. Parallel trends test. Note: The figure displays the dynamic effect coefficients estimated using the event study method along with 95% confidence intervals. The horizontal axis represents the years relative to policy implementation (t = −1 as the base period), and the vertical axis represents the estimated coefficients. Standard errors are clustered at the county level.
Sustainability 18 04810 g002
Figure 3. Placebo test results. Note: The figure displays the kernel density distribution of coefficients from 500 randomization inference iterations. The red vertical line indicates the true policy estimate (0.015). The upper right corner shows the Q-Q plot. *** p < 0.01.
Sustainability 18 04810 g003
Table 1. Variable definitions and data sources.
Variable TypeVariable NameSymbolMeasurement MethodData Source
Dependent VariablesRural Economic ResilienceERCounty GDP growth rate − national GDP growth rateChina County Statistical Yearbook
Farmer Income GrowthIncomeAnnual growth rate of rural residents’ per capita disposable incomeChina County Statistical Yearbook
Core Explanatory VariablePilot PolicyDIDGEP assessment pilot county × post-pilot = 1Documents from NDRC and other relevant central agencies
Control VariablesEconomic Development LevellnGDPln(per capita GDP)China County Statistical Yearbook
Industrial StructureISTertiary industry value added/GDPChina County Statistical Yearbook
Fiscal CapacityFEGeneral public budget expenditure/GDPChina County Statistical Yearbook
Population SizelnPopln(permanent residents)China County Statistical Yearbook
Urbanization RateUrbanUrban population/total populationChina County Statistical Yearbook
Forest Coverage RateForestForest area/land areaChina Forestry Statistical Yearbook
Mechanism VariablesProperty Income SharePropProperty income/disposable incomeChina County Statistical Yearbook
Ecological Loan GrowthEcoLoanAnnual growth rate of agriculture-related green loansCounty-level Statistical Communiques on National Economic and Social Development and annual government work reports (manually compiled)
Income VolatilityIncVolRolling standard deviation of income growth rate over the past 3 yearsAuthor’s calculation
Note: Data from China County Statistical Yearbook sourced from CNKI; China Forestry Statistical Yearbook also from CNKI. The EcoLoan series is manually compiled and cross-verified by the research team.
Table 2. Descriptive statistics of main variables.
VariableSample SizeMeanStd. Dev.MinMax
Economic Resilience (ER)15,5680.0080.042−0.320.38
Farmer Income Growth15,5680.0790.031−0.080.22
Pilot (DID)15,5680.0080.10901
Log of Per Capita GDP15,56810.480.728.2112.35
Industrial Structure15,5680.420.120.150.78
Fiscal Capacity15,5680.280.150.050.85
Forest Coverage Rate15,5680.380.220.050.85
Table 3. Baseline regression results.
Variable(1) ER(2) ER(3) Income(4) Income
DID0.019 ***0.015 ***0.012 ***0.009 ***
(0.004)(0.004)(0.003)(0.003)
Control VariablesNoYesNoYes
County Fixed EffectsYesYesYesYes
Year Fixed EffectsYesYesYesYes
N15,56815,56815,56815,568
R20.650.710.620.68
Note: Robust standard errors clustered at the county level are reported in parentheses. *** p < 0.01.
Table 4. Robustness test results.
Test Method(1) PSM-DID(2) Placebo Test(3) CS Estimator(4) Excluding Provincial Capitals
DID/ATT0.013 ***0.0020.016 ***0.014 ***
(0.004)(0.006)(0.005)(0.004)
N12,48015,56815,56814,892
Note: Standard errors are reported in parentheses. Column (2) presents the placebo test with policy timing moved forward by 2 years. *** p < 0.01.
Table 5. Heterogeneity analysis results.
Grouping Criteria(1) High Forest Coverage(2) Low Forest Coverage(3) Eastern(4) Central(5) Western
DID0.022 ***0.0060.010 *0.014 ***0.021 ***
(0.005)(0.006)(0.005)(0.005)(0.006)
N72008368512049805468
Note: Robust standard errors clustered at the county level are reported in parentheses. Forest coverage rate is grouped by the median (38%). *** p < 0.01, * p < 0.1.
Table 6. Mechanism test results.
Mechanism Variable(1) Property Income Share(2) Ecological Loan Growth(3) Income Volatility
Income-Structure AdjustmentEcological-Asset FinancializationIncome-Risk Smoothing
DID0.025 ***0.108 ***−0.018 **
(0.007)(0.032)(0.008)
Control VariablesYesYesYes
Two-way Fixed EffectsYesYesYes
N15,56815,56815,568
R20.580.520.45
Note: Robust standard errors clustered at the county level are reported in parentheses. The negative coefficient indicates that the policy reduced income volatility. *** p < 0.01, ** p < 0.05.
Disclaimer/Publisher’s Note: The statements, opinions and data contained in all publications are solely those of the individual author(s) and contributor(s) and not of MDPI and/or the editor(s). MDPI and/or the editor(s) disclaim responsibility for any injury to people or property resulting from any ideas, methods, instructions or products referred to in the content.