Article

Measuring Livelihood Resilience in Ecologically Fragile Regions: An Entropy-Obstacle Diagnosis of Forest Farmers in Northern China

College of Economics and Management, Inner Mongolia Agricultural University, Hohhot 010011, China
*
Author to whom correspondence should be addressed.
Sustainability 2026, 18(10), 4826; https://doi.org/10.3390/su18104826
Submission received: 9 April 2026 / Revised: 7 May 2026 / Accepted: 11 May 2026 / Published: 12 May 2026

Abstract

Ecologically fragile regions face the dual challenge of environmental conservation and improving rural livelihoods. Forest-dependent households are especially exposed to ecological restoration constraints, market fluctuations, and limited institutional access. This study develops a micro-level diagnostic framework that combines the Sustainable Livelihood Framework with resilience theory by adding a risk-resilience dimension to the conventional five-capital structure. Using survey data from 444 forest-farmer households in Songshan District, Inner Mongolia, we calculate livelihood resilience with the entropy-weight method, classify household profiles with K-means clustering, and diagnose constraints with an obstacle-degree model. The mean resilience score is 0.6267, indicating a relatively strong but uneven resilience level. Livelihood risk resilience (0.7476) and financial capital resilience (0.6797) are the strongest dimensions, whereas human capital resilience (0.3521) and physical capital resilience (0.4099) remain weak. The main obstacles are relationships with village cadres (29.66%), household savings (16.25%), livestock and poultry assets (14.70%), village road conditions (13.23%), relationships with relatives and friends (10.99%), and corporate/cooperative assistance effects (6.88%). The findings support targeted interventions in linking social capital, savings capacity, infrastructure, and enterprise-farmer cooperation.

1. Introduction

Ecologically fragile regions face overlapping environmental, economic, and social pressures. Climate variability, resource degradation, market volatility, and demographic outmigration expose rural households to repeated shocks, particularly in areas where livelihoods depend heavily on land, forests, and small-scale agriculture [1]. Livelihood resilience provides a useful lens for assessing whether households can absorb disturbances, adjust livelihood strategies, and maintain or improve well-being under stress [2,3]. Although recent studies have advanced household-level resilience measurement in China and other fragile contexts, many remain macro-regional in scale, focus on general rural households, or pay limited attention to forest-dependent groups whose livelihoods are shaped simultaneously by ecological protection requirements and market uncertainty [4,5,6,7].
The Sustainable Livelihood Framework (SLF) remains a widely used tool for analyzing rural livelihoods because it links household outcomes to human, natural, financial, social, and physical capital [8,9]. However, the SLF pays relatively less attention to how households respond to shocks, chronic stressors, and changing institutional or market conditions. Resilience theory complements this perspective by emphasizing households’ absorptive, adaptive, and transformative capacities [10,11]. Building on the established integration of the SLF and resilience theory, this study focuses on its contextual application to forest farmers in a northern Chinese ecologically fragile region and on the operationalization of risk-related resilience as a diagnostic dimension.
Three research gaps motivate this study. First, existing livelihood-resilience research has paid limited attention to forest farmers, whose livelihood strategies are constrained by ecological restoration, land and forest-resource dependence, and uneven market access [12]. Second, micro-level evidence from northern China remains insufficient compared with studies on southwestern mountainous, coastal, or general rural areas [13,14,15,16]. Third, while many studies measure livelihood capital stocks, fewer examine how capital conditions and risk-response factors jointly shape household-level resilience under simultaneous ecological and market pressures [17]. Accordingly, this study asks three research questions: (1) What is the overall livelihood resilience level of forest farmers in Songshan District? (2) How does livelihood resilience vary by household type and township location? (3) Which indicators constitute the main diagnostic obstacles to livelihood-resilience improvement?
To answer these questions, this study uses survey data from 444 forest-farmer households in Songshan District, Chifeng City, Inner Mongolia. The analysis combines entropy-based weighting, K-means classification, and obstacle-degree diagnosis to measure resilience levels, classify household profiles, and identify priority constraints. The study makes three main contributions. First, it develops a context-specific six-dimensional indicator system that retains the five SLF capitals while adding livelihood risk resilience to capture price fluctuations, natural-disaster shocks, information access, government assistance, and enterprise/cooperative support. Second, it provides micro-level evidence on forest farmers in a northern agro-pastoral and ecologically fragile setting. Third, it identifies priority constraint indicators that can inform targeted interventions in linking social capital, savings capacity, rural infrastructure, and enterprise-farmer cooperation.

2. Theoretical Framework

2.1. Limitations of Existing Theoretical Perspectives

Research on rural livelihoods in ecologically fragile regions has long relied on the Sustainable Livelihood Framework (SLF), vulnerability theory, and multidimensional poverty theory. These perspectives provide important analytical foundations, but each has limitations when used independently to explain the livelihood resilience of forest farmers. The SLF is particularly useful because it links household livelihood outcomes to the structure and allocation of human, natural, financial, social, and physical capital [9,18]. It helps identify what resources households possess and how these resources support livelihood strategies. However, the SLF is less explicit about how households respond to sudden shocks, chronic stressors, and changing institutional or market conditions. In this sense, the SLF is strong in explaining asset structure but relatively weak in explaining dynamic adjustment.
Vulnerability theory offers another useful perspective by emphasizing exposure, sensitivity, and adaptive capacity [6]. It helps explain why households in ecologically fragile regions are more likely to be affected by environmental degradation, climate variability, and market instability. Nevertheless, vulnerability analysis often starts from risk exposure and tends to describe households as being affected by external shocks. This can understate the active role of households in reorganizing resources, adjusting livelihood strategies, and seeking support from community, government, and market actors. Multidimensional poverty theory further contributes by identifying deprivation across income, education, health, infrastructure, and other domains [17]. However, poverty measurement mainly reveals livelihood deprivation at a given point in time and often says less about how households maintain or improve livelihood outcomes when external conditions change.
These limitations are especially important for forest farmers in ecologically fragile regions. Their livelihood systems are shaped not only by household-level capital endowments but also by ecological restoration policies, forest-resource dependence, labor aging, market fluctuations, and uneven access to institutions. For example, a household with land or forest resources may still face weak resilience if ecological restrictions limit resource use, if roads and market channels are underdeveloped, or if the household lacks savings and social connections to respond to shocks. Therefore, a framework for analyzing forest farmers’ livelihood resilience needs to consider both livelihood capital stocks and the dynamic capacity to absorb, adapt to, and recover from external pressures.

2.2. Resilience Theory as a Dynamic Complement to Livelihood Analysis

Resilience theory provides a dynamic perspective for understanding how households respond to disturbances. In livelihood studies, resilience does not simply mean returning to a previous state after a shock. Rather, it refers to the ability of households to absorb disturbances, reorganize available resources, adjust livelihood strategies, and maintain or improve well-being under changing conditions [19,20,21]. This perspective complements the SLF because it shifts attention from the possession of livelihood capital to the capacity to mobilize that capital when households face ecological, economic, or social stress.
In this study, livelihood resilience is understood at the household level, but it is not treated as an isolated individual attribute. Forest farmers are embedded in broader social-ecological systems, and their resilience is shaped by interactions with communities, village cadres, local governments, financial institutions, enterprises, cooperatives, and ecological governance arrangements [18,22]. A household’s ability to respond to risk depends not only on its own labor, income, savings, land, and equipment, but also on whether it can obtain timely policy information, access credit, participate in community networks, receive technical support, and connect with market organizations.
This interpretation is particularly relevant in ecologically fragile regions. Environmental constraints and ecological restoration policies may reduce certain traditional livelihood options, while market volatility and natural disasters increase income uncertainty. At the same time, policy assistance, cooperative organizations, information networks, and enterprise-farmer linkages may provide new channels for adaptation. Therefore, resilience theory helps explain the process through which forest farmers convert livelihood resources into risk-buffering and adaptive capacity. It also provides a theoretical basis for extending the conventional livelihood capital framework by including a risk-related dimension.

2.3. Multi-Level Mechanisms of Livelihood Resilience Formation

The formation of livelihood resilience in ecologically fragile regions can be understood through three interacting mechanisms [23]. The first mechanism is exposure to external disturbances. Forest farmers face multiple sources of uncertainty, including natural disasters, agricultural price fluctuations, ecological restoration restrictions, and changes in production and market conditions. These disturbances create pressure on household income, resource use, production decisions, and long-term livelihood stability. The intensity of these pressures varies across households because households differ in resource endowments, livelihood strategies, and access to support.
The second mechanism is household livelihood-capital buffering. Livelihood capitals provide the basic resources through which households respond to shocks [24]. Human capital affects labor availability, health conditions, education level, and the ability to learn or adopt new production methods. Natural capital provides land and forest resources, but its contribution depends on resource quality and ecological regulation. Financial capital, including income, savings, and loan accessibility, determines whether households can smooth consumption, restore production, and invest in livelihood diversification. Social capital affects access to informal support, policy information, community participation, and external opportunities. Physical capital, such as roads, livestock, machinery, and vehicles, influences production efficiency and market access. These capitals do not operate separately; they interact with one another and jointly shape household resilience.
The third mechanism is institutional and market support [24]. In ecologically fragile regions, households often cannot rely only on internal resources to cope with risks. Access to village cadres, government programs, credit institutions, cooperatives, and enterprises can shape whether households obtain information, subsidies, training, technical assistance, loans, or market opportunities. These external support channels are especially important for monitored households, elderly households, and households with limited savings or weak labor capacity. They connect household-level livelihood capital with broader institutional and market systems.
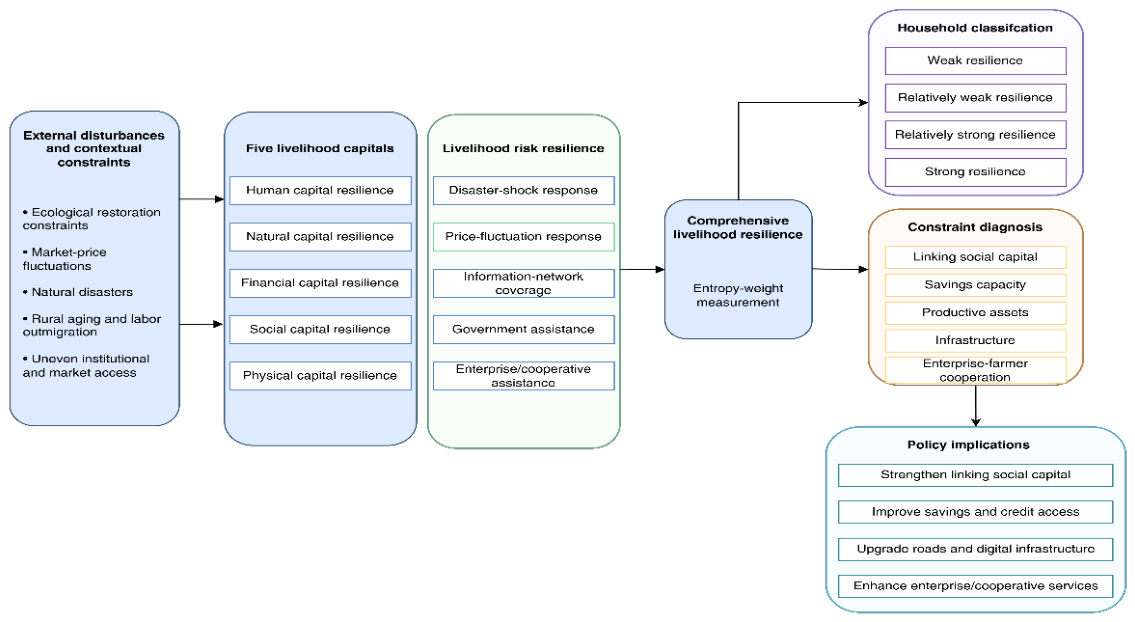
This logic is particularly relevant for forest farmers. Strong kinship ties may provide short-term assistance, but access to village cadres, cooperatives, and enterprises shapes whether households can obtain formal resources, market information, and policy support [19]. Similarly, land or forest resources may be valuable, yet their contribution to resilience depends on ecological regulations, infrastructure, and market channels. The theoretical framework in Figure 1, therefore, links external disturbances, livelihood capitals, risk-related support conditions, and livelihood outcomes. Figure 1 serves not only as a conceptual illustration but also as the analytical basis for selecting the six evaluation dimensions and interpreting the obstacle-degree results.

2.4. Construction of the Integrated Analytical Framework

Based on the above reasoning, this study constructs an integrated capital-risk framework for measuring and diagnosing the livelihood resilience of forest farmers. The framework contains six dimensions: human capital resilience, natural capital resilience, financial capital resilience, social capital resilience, physical capital resilience, and livelihood risk resilience. The first five dimensions correspond to the conventional SLF and represent the structural resource base of rural households. These dimensions capture whether households possess the human, natural, financial, social, and physical resources needed to sustain livelihoods and respond to shocks.
Livelihood risk resilience is introduced as an additional dimension because risk exposure and risk-support conditions cannot be fully reduced to asset stocks [25]. In ecologically fragile regions, two households with similar livelihood capital may differ substantially in their ability to cope with price fluctuations, natural disasters, information gaps, or uneven policy and enterprise support. For example, the impact of agricultural product price fluctuations reflects the degree to which household income is exposed to market instability. The impact of natural disasters reflects the pressure created by environmental shocks. Regional information-network coverage indicates whether households can obtain timely information for production and market decisions. Government policy assistance reflects the extent to which public support contributes to livelihood stabilization. Enterprise or cooperative assistance reflects whether market organizations provide effective technical, marketing, or income-enhancing support.
This sixth dimension, therefore, acts as a bridge between the vulnerability context and household adaptive capacity. It captures both risk pressure and external support conditions that influence whether livelihood capital can be effectively transformed into resilience. By combining the five livelihood capitals with livelihood risk resilience, the framework avoids treating resilience as either a simple asset stock or a purely subjective perception. Instead, it conceptualizes resilience as a multidimensional capacity formed through the interaction between household endowments, external disturbances, and support mechanisms.
The integrated framework also corresponds to the empirical strategy of this study. Entropy-based weighting is used to measure the relative information contribution of each indicator within the sample. K-means clustering is used to classify households into different resilience groups. The obstacle-degree model is then used to diagnose the indicators with the largest improvement gaps. In this way, the framework supports not only the measurement of comprehensive livelihood resilience but also the identification of priority constraints for policy intervention [6].

2.5. Theoretical Implications

Consistent with the measurement and diagnostic purpose of this study, the framework leads to three analytical propositions rather than causal hypotheses. These propositions are used to guide the empirical measurement, classification, and constraint diagnosis.
Proposition 1.
Livelihood resilience is uneven across capital and risk dimensions because forest farmers face different combinations of asset endowments, ecological pressures, market uncertainty, and institutional support.
Proposition 2.
Monitored households are expected to show weaker livelihood resilience than general households because labor, health, savings, social access, and productive-asset constraints are more concentrated among vulnerable households.
Proposition 3.
The main obstacle factors are expected to cluster around linking social capital, financial reserves, and infrastructure because these factors shape households’ access to formal resources, risk-buffering capacity, and market participation.
Together, these propositions clarify the analytical logic of the study. They do not claim causal identification; rather, they provide a theoretical basis for examining how livelihood capital, risk-response conditions, and external support jointly shape the measured resilience profile of forest farmers. This theoretical framing also helps connect the indicator system, household classification, and constraint diagnosis into a coherent empirical analysis.

3. Research Data and Methods

3.1. Study Area and Data Sources

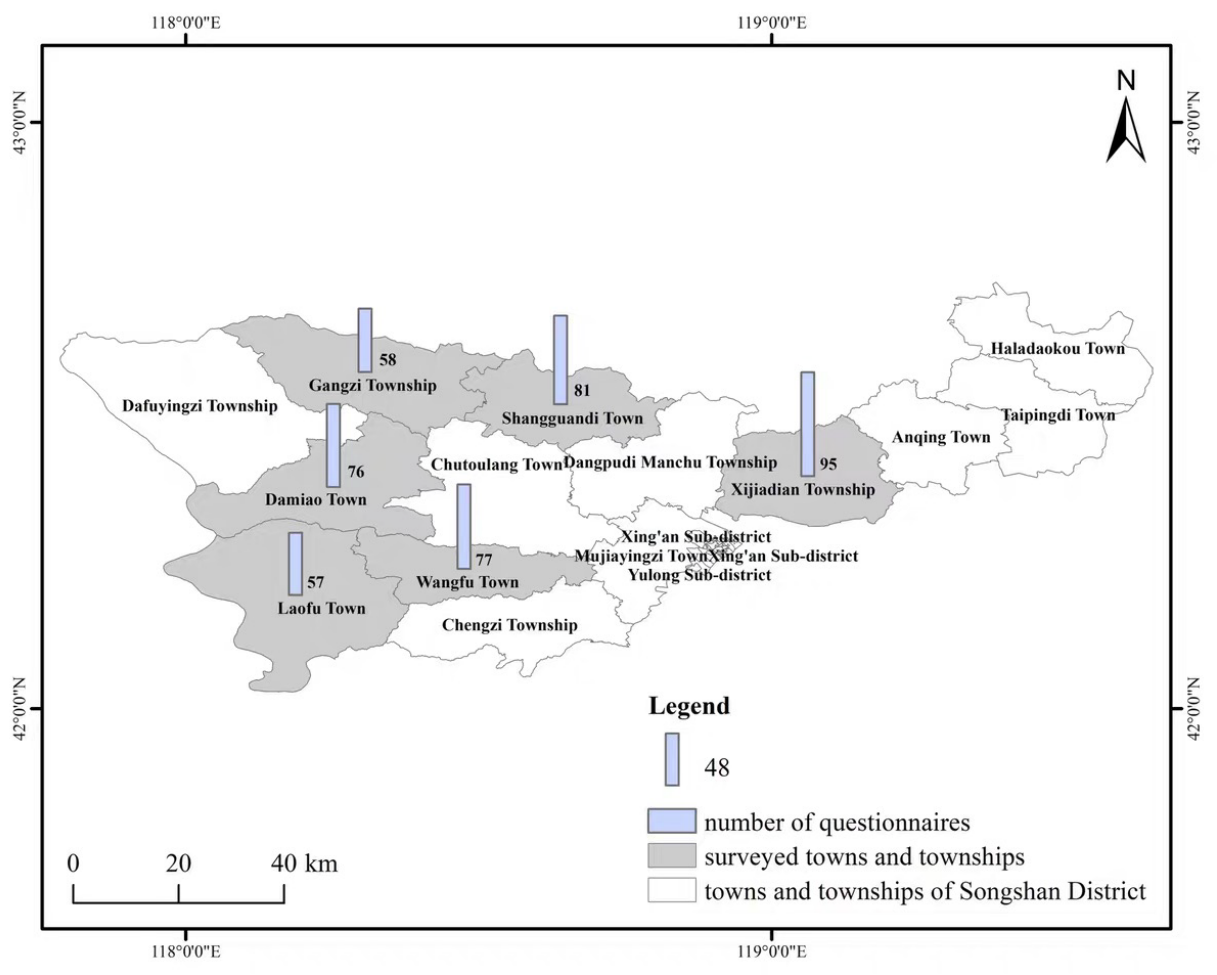
Songshan District, located in the southern part of Chifeng City, Inner Mongolia Autonomous Region, lies in the upper reaches of the Xiliao River and covers 5629 square kilometers (Figure 2). The district was selected because it combines typical features of northern China’s ecologically fragile regions: a semi-arid agro-pastoral transition environment, dependence on forest and land resources, ongoing ecological restoration pressures, rural labor outmigration, and uneven access to markets and public services [26]. The site is not claimed to represent all ecologically fragile areas in China. Rather, it provides an analytically relevant case for examining forest farmers who must balance ecological protection and livelihood improvement. Between 18 and 25 September 2024, the research team conducted structured questionnaires and semi-structured interviews. Of 469 questionnaires distributed and retrieved, 25 were excluded after consistency and completeness screening, resulting in 444 valid samples and an effective response rate of 94.67%.
The field survey followed a multi-stage sampling logic. Townships were selected to cover variation in location, production conditions, and village-level livelihood structures. Within townships, villages with forest-farmer households were identified with local administrative assistance. Eligible households were then interviewed face-to-face. To reduce response bias, enumerators explained the research purpose, confirmed anonymity, checked questionnaire completeness onsite, and excluded questionnaires with contradictory or missing key information. The concentrated survey period was chosen after the main agricultural production season and before winter, when households could report annual income, expenses, and shock experiences more consistently. The short fieldwork window remains a limitation and is acknowledged in the Discussion.

3.2. Sample Characteristics

The demographic and socioeconomic attributes of the respondents, summarized in Table 1, show that males constitute 78.15% of the sample and females 21.85%, indicating that men remain the main agricultural decision-makers in many surveyed households. A total of 60.81% of respondents are aged between 50 and 70 years, while respondents under 40 account for only 4.95%. In addition, 57.88% of households have two or fewer laborers. These patterns reflect rural aging and labor outmigration, which are relevant to human-capital resilience. Educational attainment is generally modest: junior high school and primary school graduates account for 56.98% and 24.32%, respectively, and only 4.06% have a college degree or above. General households account for 76.80% of the sample, whereas monitored households account for 23.20%, providing a basis for comparing households with different vulnerability profiles.

3.3. Indicator System and Model Construction

3.3.1. Indicator System Construction

Building on the SLF and household livelihood-resilience literature, this study constructs a formative indicator system rather than a reflective psychometric scale. The 21 indicators were selected through three steps. First, indicators frequently used in studies of livelihood capital, household resilience, ecological fragility, and rural development were screened from the literature [2,4,5,6,7,8,18,24,27]. Second, the indicators were matched to the livelihood context of forest farmers in Songshan District, including land/forest dependence, aging labor forces, market-price exposure, natural-disaster exposure, village-level social networks, and policy/enterprise support. Third, experts in rural livelihoods and ecological construction reviewed the relevance, measurability, and local applicability of the indicators. The expert review was conducted as a structured consultation rather than a formal Delphi survey. Experts assessed whether each indicator was theoretically relevant, locally measurable, and suitable for household-level resilience assessment. Indicators with ambiguous meaning or weak local applicability were revised or removed before the final system was determined. The final system includes six primary dimensions and 21 secondary indicators (Table 2). Objective variables, such as income and land area, and perception-based variables, such as relationships and perceived assistance effects, are intentionally combined because livelihood resilience depends on both asset stocks and access to support resources.
Because the index is formative, Cronbach’s alpha and exploratory factor analysis were not used as strict criteria for retaining or deleting indicators. The indicators represent complementary components of livelihood resilience, such as education, savings, road conditions, land resources, and social relationships, and therefore, they are not expected to behave as a purely reflective psychometric scale. Nevertheless, to improve methodological transparency and respond to concerns about indicator validity, several supplementary diagnostics were conducted. Construct validity was addressed through theoretical mapping, local contextual relevance, and expert review. Data-based diagnostics were then used to examine internal coherence, common information, and multicollinearity.
Using the household-level dataset, the overall Cronbach’s alpha for the 21 indicators was 0.818, indicating acceptable internal coherence for the integrated index. The Kaiser-Meyer-Olkin value was 0.825, and Bartlett’s test of sphericity was significant (chi-square = 5804.430, df = 210, p < 0.001), suggesting that the indicator matrix contained sufficient common information for integrated assessment. Variance inflation factors were also calculated for all indicators. The maximum VIF was 7.608, below the commonly used threshold of 10, and the largest pairwise correlation was 0.878 between two social-capital indicators. These results indicate that no severe multicollinearity problem exists, although social-capital indicators should be interpreted cautiously because of their conceptual proximity.

3.3.2. Model Construction

(1)
Entropy Method
To account for differences in measurement units and value ranges, all indicators were standardized before index construction. Min-max normalization transformed each indicator to the interval [0, 1]. Continuous monetary variables were winsorized at the 1st and 99th percentiles to reduce the influence of extreme values [28]. Positive indicators were standardized so that larger values represented stronger resilience. Negative indicators, such as the reported impact of price fluctuations and natural disasters, were reverse-coded so that larger standardized values also represented stronger resilience. The entropy method was used because it provides an objective weighting procedure based on observed dispersion and reduces reliance on researcher-assigned weights [29]. However, entropy weights reflect data variability rather than theoretical importance or causal effects. Therefore, the weights are interpreted as sample-specific diagnostic weights and are discussed together with theoretical reasoning and robustness checks.
For positive indicators, the standardization formula is:
Y i j = x i j min x i j max x i j min x i j
For negative indicators, the standardization formula is:
Y i j = max x i j x i j max x i j min x i j
Here, x i j represents the original value of the j -th indicator for the i -th household, and Y i j denotes the standardized value. The entropy weight method assigns larger weights to indicators with greater variation across households. This property is useful for identifying heterogeneous constraints, but it also means that the substantive interpretation of weights must be combined with theory and local context rather than treated as statistical causality. The indicator proportion P i j is calculated as follows:
P i j = Y i j i = 1 n Y i j
Next, the entropy value E j for each indicator is determined:
E j = 1 ln n i = 1 n P i j ln P i j
The objective weight W j is then computed:
W j = 1 E j j = 1 m 1 E j
Finally, the comprehensive livelihood resilience score S is calculated:
S = j = 1 m W j Y i j
The variable S represents the livelihood resilience score for each sampled household. A higher S value indicates stronger livelihood resilience for the forest farmers. A lower value indicates weaker resilience requiring targeted intervention.
(2)
Cluster Analysis
This study used K-means clustering to classify households according to comprehensive resilience scores. K-means was selected because it can form interpretable household groups along a continuous resilience gradient. Euclidean distance was used to measure similarity between observations. Four clusters were retained to correspond to four policy-relevant categories: weak resilience, relatively weak resilience, relatively strong resilience, and strong resilience [30,31]. To improve reproducibility, the number of clusters was examined using validation indices, including the silhouette coefficient, Calinski-Harabasz index, and Davies-Bouldin index.
d i , j = S i 1 S j 1 2 + S i 2 S j 2 2 + + S i n S j n 2
Households with similar resilience scores were grouped through iterative calculation. The four categories are weak resilience, relatively weak resilience, relatively strong resilience, and strong resilience. These categories are intended for diagnostic comparison and policy targeting, not for proving statistically discrete population types.
The number of clusters was further examined by comparing two to six clusters. For the four-cluster solution, the silhouette coefficient was 0.565, the Calinski-Harabasz index was 1596.8, and the Davies-Bouldin index was 0.507. Although a two-cluster solution produced a slightly higher silhouette coefficient, the four-cluster solution provided the most interpretable ordinal classification and the lowest Davies-Bouldin value among the tested solutions. Therefore, four categories were retained to distinguish weak, relatively weak, relatively strong, and strong livelihood resilience.
(3)
Obstacle Degree Model
Identifying constraints is crucial for policy formulation in ecologically fragile regions. The obstacle-degree model was therefore used to diagnose indicators that most restrict resilience improvement [27]. The model combines indicator weight and the gap between the observed standardized value and the ideal value. It is suitable for identifying priority weaknesses, but it is not a causal model. For this reason, the results are reported as constraint indicators rather than determinants.
I i j = 1 S i j
The variable S i j represents the standardized value of the respective indicator. The deviation degree measures the gap between the actual value and the optimal target. Subsequently, the obstacle degree O i is computed:
O i = I i j U i i = 1 m I i j U i
The variable U i represents the weight of the corresponding indicator. A larger O i degree percentage indicates a larger diagnostic gap between current conditions and the ideal resilience state. Because the result depends partly on the weighting method and the coding direction of indicators, obstacle rankings should be interpreted together with robustness checks and qualitative knowledge of the study area.

3.3.3. Methodological Scope and Robustness Strategy

This study is designed as a cross-sectional measurement and diagnostic analysis, and the results are not interpreted as causal estimates. Several robustness and validity checks were conducted. First, the entropy-based comprehensive score was compared with an equal-weighted index and a principal-component-based index. The Pearson and Spearman correlations between the entropy score and the equal-weighted score were both 0.974, while the corresponding correlations with the PCA-based score were 0.807 and 0.820, respectively. The first six principal components explained 73.08% of the total standardized variance. These results suggest that the overall ranking is not driven solely by the entropy-weighting scheme. Second, the study reports VIF and correlation diagnostics to reduce concerns about multicollinearity. Third, clustering results are supported by validation indices. Finally, the obstacle-degree model is interpreted as a constraint-diagnosis tool rather than a causal model; it identifies where the largest improvement gaps occur under the constructed index.
All statistical analyses were conducted using Python 3.11. Indicator standardization, entropy weighting, equal-weighted index construction, PCA-based robustness checks, VIF diagnostics, and cluster-validation indices were calculated using the standardized household-level indicator matrix. K-means clustering was implemented for k = 2–6 with n_init = 50, max_iter = 300, and random_state = 42. The equal-weighted index was constructed by assigning identical weights to the 21 secondary indicators, while the PCA-based index was constructed from the retained principal components explaining 73.08% of the standardized variance. The PCA-based score was calculated as a weighted sum of retained component scores, with weights proportional to their explained variance.

4. Results and Analysis

4.1. Weight Determination of Livelihood Resilience

Table 3 reports entropy-based weights for the six dimensions and 21 indicators. These weights should be read as sample-specific indicators of dispersion rather than causal importance. The robustness checks reported above show that the entropy-based score is highly correlated with alternative weighting approaches, which supports the use of entropy weights for diagnostic measurement in this study. Among the primary dimensions, livelihood risk resilience and financial capital resilience show the highest entropy-based weights, indicating that these dimensions contain relatively large variation and information contribution within the sample. At the secondary-indicator level, resilience to agricultural product price fluctuations, per capita annual household income, relationship with village cadres, and household savings receive relatively high weights. These results should be interpreted as data-dispersion patterns rather than evidence that these indicators are causally more important than others.

4.2. Comprehensive Measurement of Livelihood Resilience

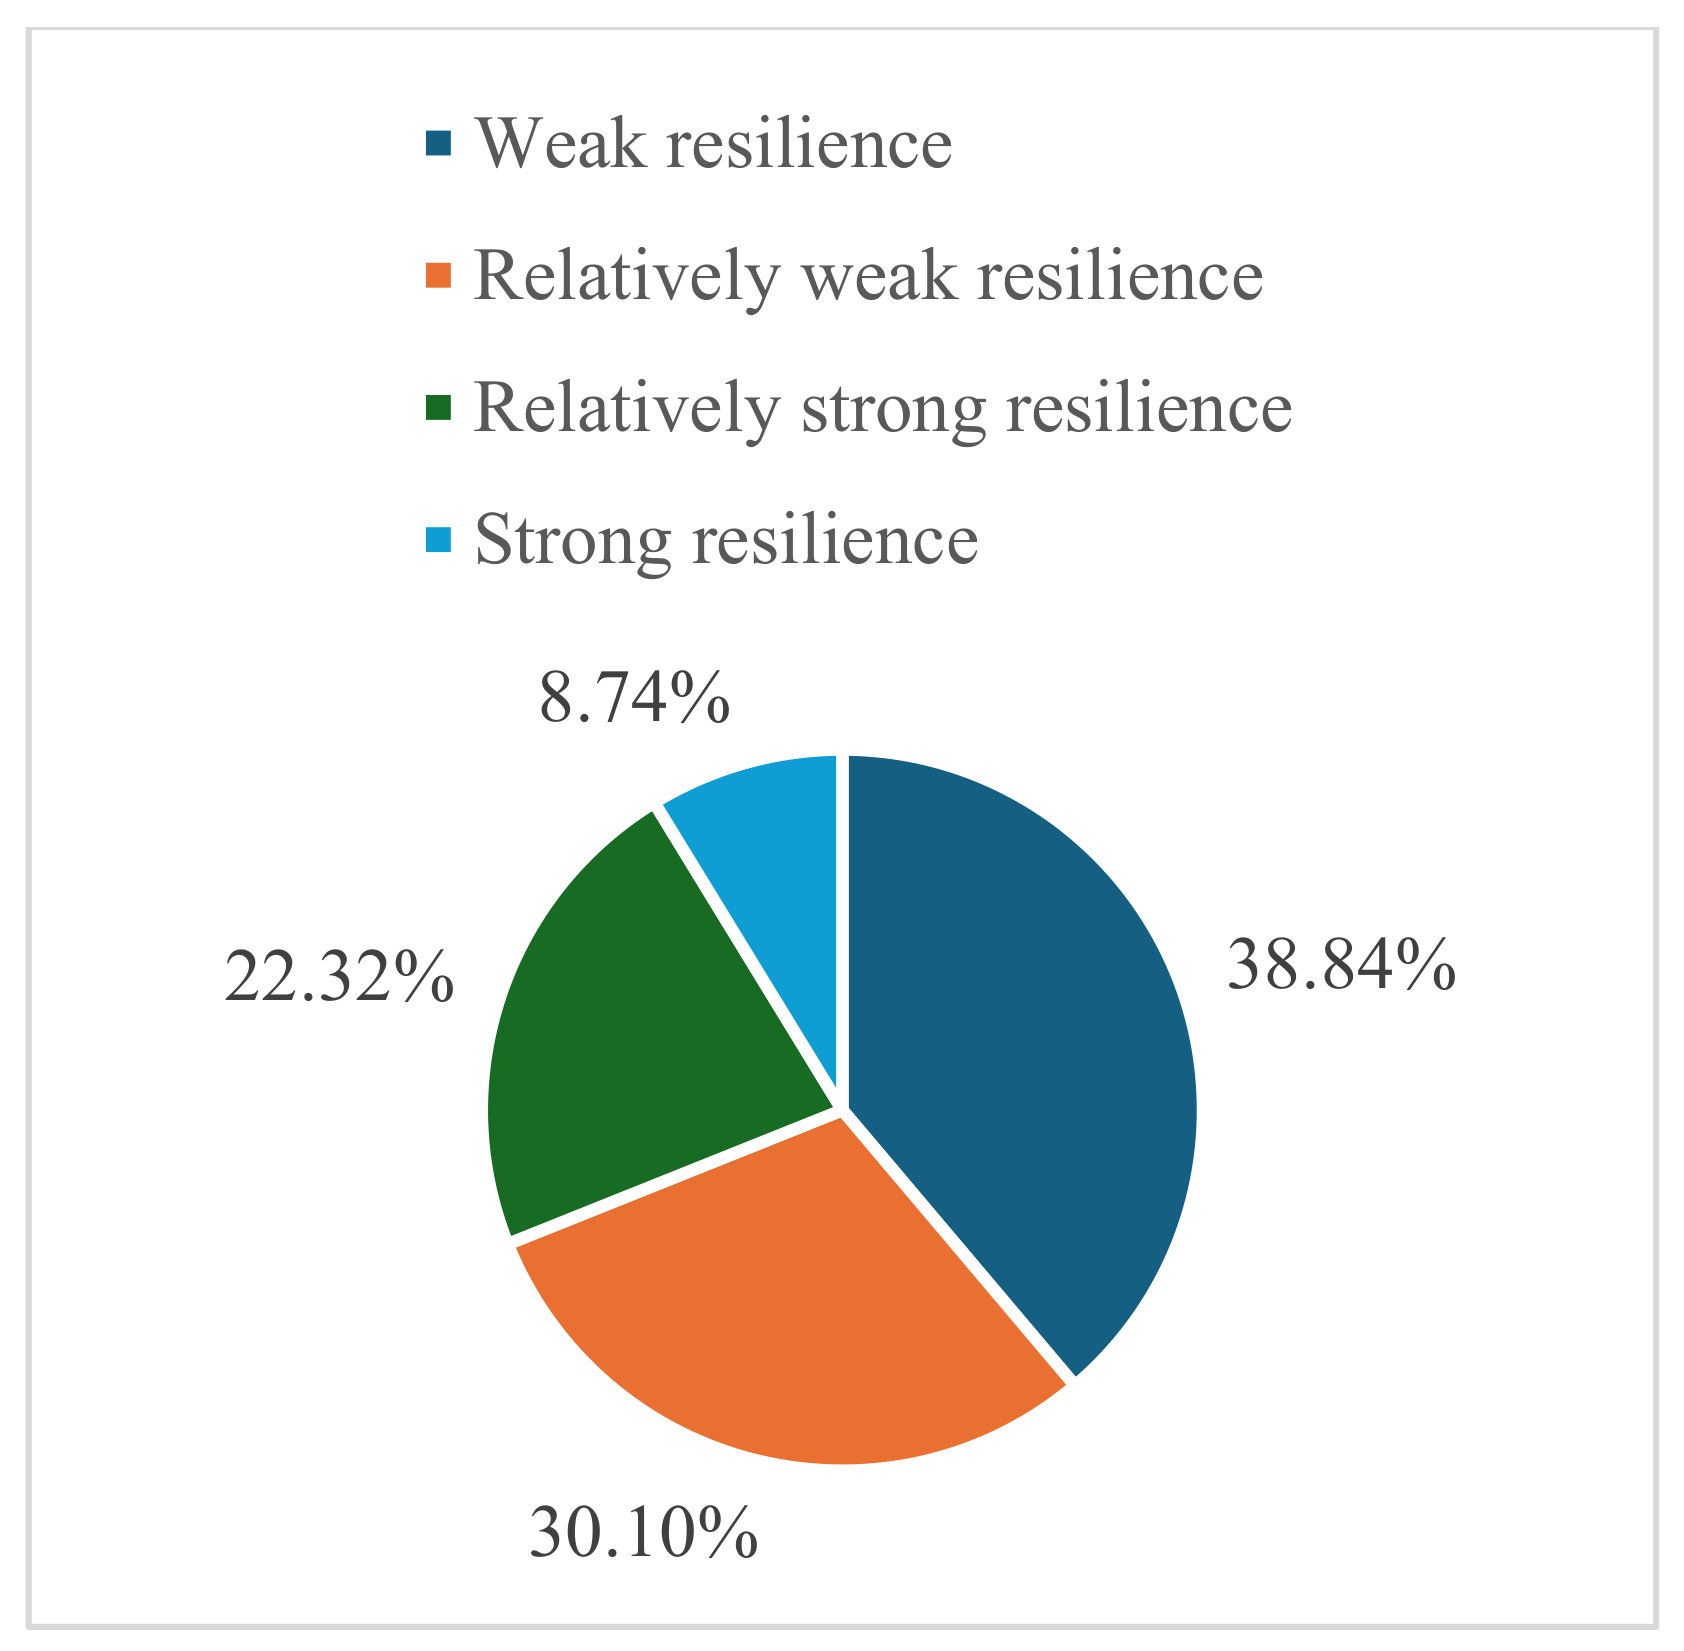
K-means clustering classified households into four resilience categories: weak resilience (0.3633–0.4673), relatively weak resilience (0.4674–0.5942), relatively strong resilience (0.5943–0.7160), and strong resilience (0.7161–0.8604). The overall resilience score is 0.6267, placing the study area in the relatively strong category. However, this average masks clear dimensional imbalance. Livelihood risk resilience (0.7476) and financial capital resilience (0.6797) are relatively high, whereas physical capital resilience (0.4099) and human capital resilience (0.3521) are weak. The results indicate that policy and financial access partially buffer shocks, but labor shortages, limited education, poor health conditions, road constraints, and low machinery ownership continue to restrict household capacity (Table 4).

4.3. Livelihood Resilience of Different Types of Forest Farmers

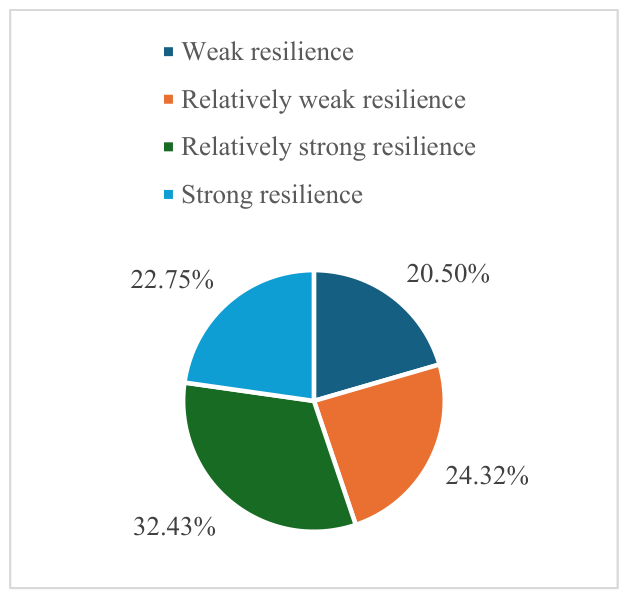
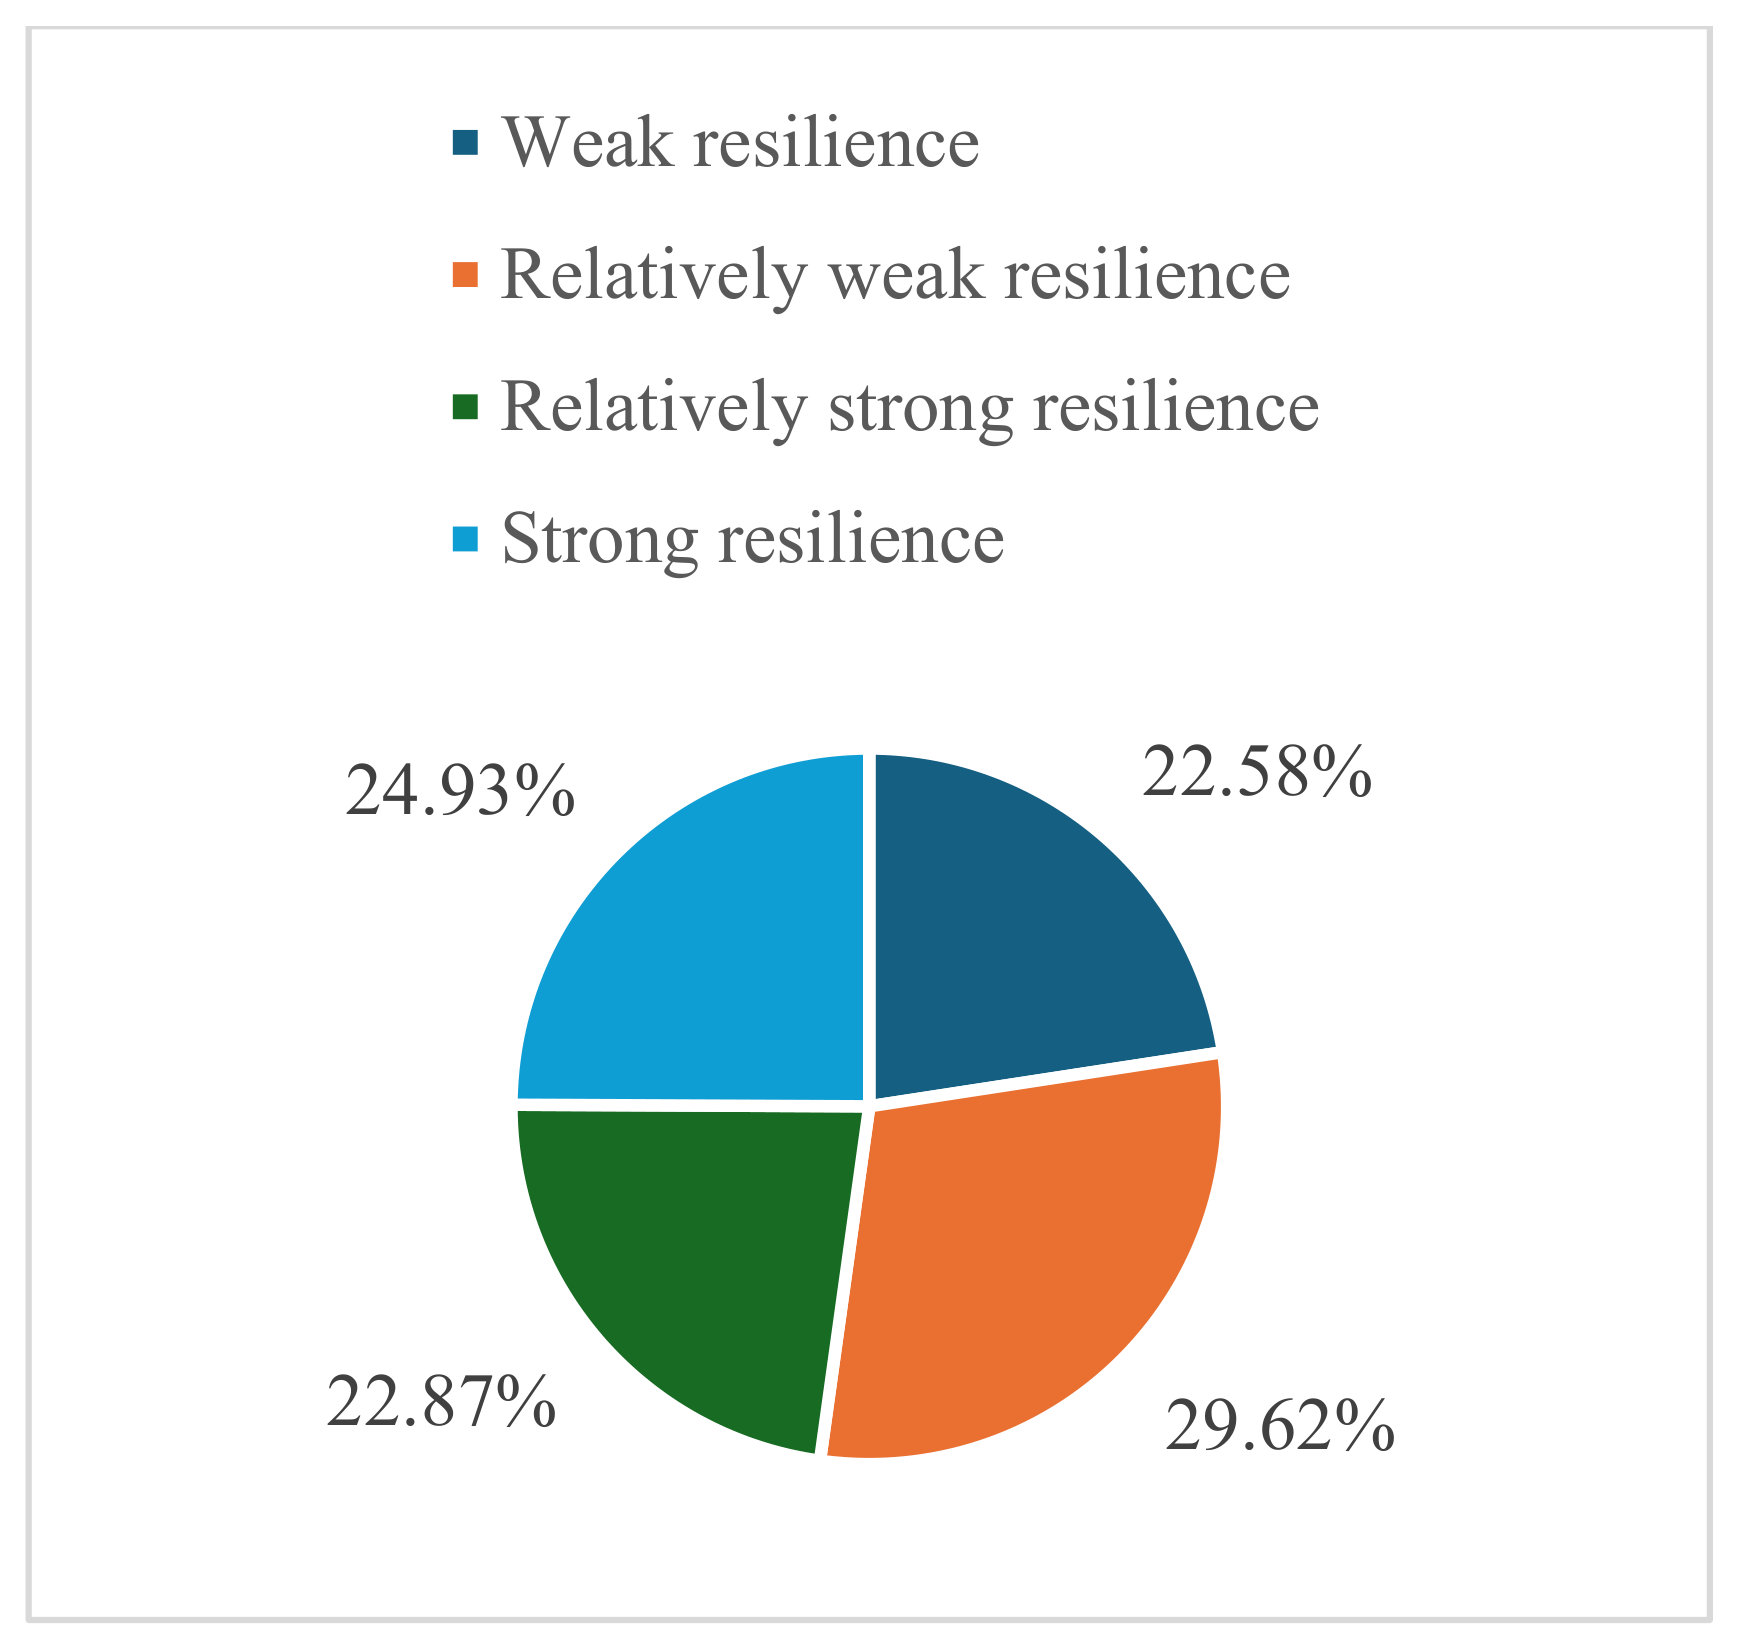
Forest farmers were categorized into general households and monitored households to examine whether resilience differs across vulnerability profiles. Figure 3, Figure 4 and Figure 5 show the distribution of resilience categories for the full sample and for the two household types.
Clear differences are observed between household types. General households have an average resilience score of 0.6786, which is above the sample mean of 0.6267. Monitored households have a lower average score of 0.5240. General households are more concentrated in the relatively strong and strong categories, whereas monitored households are more likely to fall into weak or relatively weak resilience categories. This pattern supports P2 and indicates that poverty-monitoring status is associated with weaker asset endowments and weaker access to support resources.
The gap is especially visible in physical, social, and financial capital. General households tend to have more machinery and livestock, stronger relationships with village cadres and relatives, and better capacity to obtain loans or absorb temporary income shocks. Monitored households face overlapping disadvantages: lower education, fewer laborers, poorer health conditions, limited savings, and weaker formal or informal networks. These combined constraints explain why monitored households may have difficulty converting policy support into actual resilience gains.

4.4. Spatial Variation of Livelihood Resilience

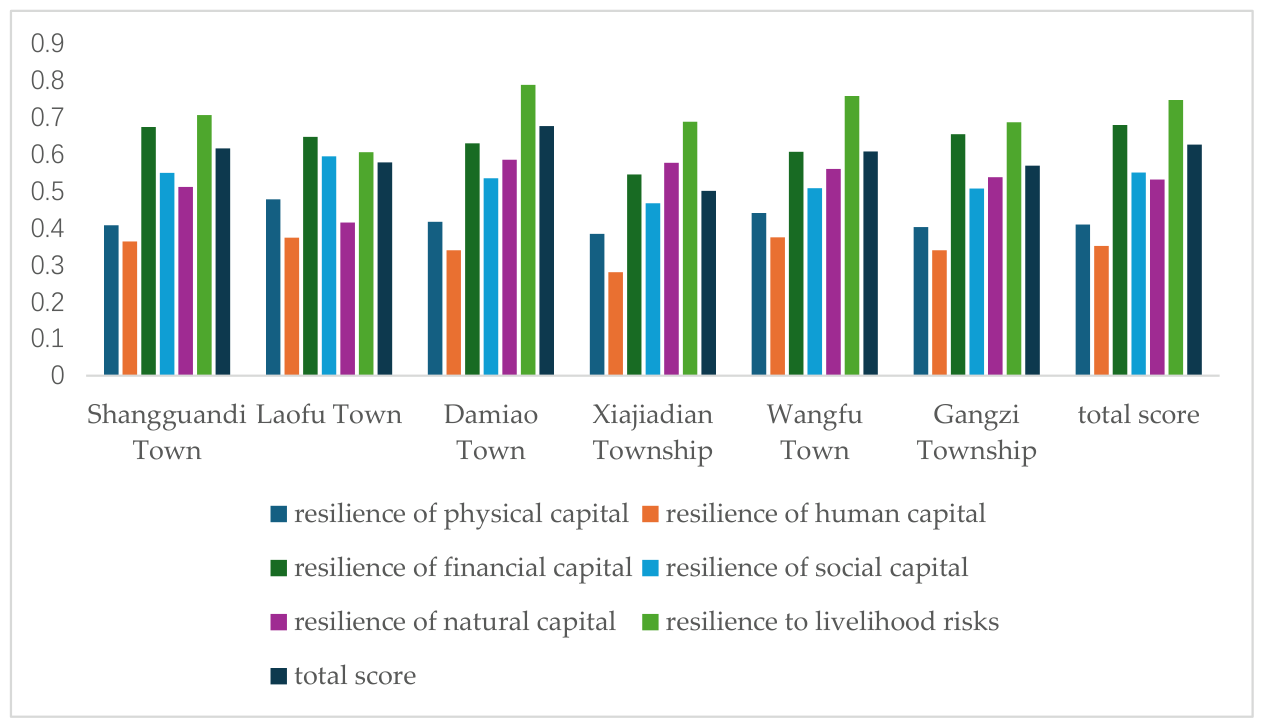
Regional differences in livelihood resilience were examined across surveyed townships. This spatial analysis is descriptive rather than spatial-econometric because the study uses household survey data from selected townships and does not model spatial dependence statistically. Figure 6 reports comprehensive scores across townships.
Descriptive spatial heterogeneity is evident. Damiao Township has the highest comprehensive score (0.6772), followed by Shangguandi (0.6165), Wangfu (0.6081), Laofu (0.5782), Gangzi (0.5698), and Xiajiadian (0.5011). The difference between Damiao and Xiajiadian is 0.1761 points. Damiao performs well in livelihood risk resilience (0.7890) and natural capital resilience (0.5858), which is consistent with its development of facility agriculture and characteristic agricultural industries. These industries provide employment opportunities and improve households’ ability to respond to production and market risks.
Shangguandi Township ranked second overall, relying on open field vegetable cultivation as a leading industry to increase local incomes and accumulate financial capital. This pattern may be related to local efforts to connect financial institutions with forest farmers, a measure that makes obtaining loans significantly easier during risk events. Wangfu Township exhibits balanced development across all dimensions, as the local government emphasizes education and labor training. This may help farmers adopt new agricultural technologies, which enhances both production efficiency and risk coping capabilities.
In contrast, Laofu and Gangzi have moderate scores because their industrial structures remain less diversified and lack high-value agricultural clusters. Gangzi has explored livestock breeding, but complementary support in finance, information, and market access remains insufficient. Xiajiadian has no clear advantage in the measured resilience dimensions. Its modern agricultural initiatives, including high-standard farmland and unmanned smart-farm models, are still developing and have not yet generated broad resilience benefits for ordinary households.

4.5. Constraint Diagnosis of Livelihood Resilience

The obstacle-degree model was used to identify indicators with the largest diagnostic gaps in livelihood resilience. Because the model combines indicator weights with the distance between observed and ideal values, it does not establish causal effects. Therefore, the results are interpreted as constraint indicators rather than determinants or causal influencing factors. To keep the results interpretable, Table 5 reports the top six constraint indicators for the full sample, general households, and monitored households.
Relationships with village cadres (B11) and relatives/friends (B10) rank among the main constraints, indicating that linking and bonding social capital operate differently. Weak links with village cadres may restrict timely access to policy information, training opportunities, credit channels, and public resources. Kinship and friendship networks provide emotional and short-term support, but their capacity is limited when surrounding households face similar economic pressures. This explains why social-capital constraints can remain prominent even in rural communities with strong interpersonal ties.
Household savings (B8) are also a major constraint, with an obstacle degree of 16.25% for the total sample and 28.00% for monitored households. Savings provide liquidity for restoring production after shocks, smoothing consumption, purchasing inputs, and investing in livelihood diversification. The higher obstacle degree among monitored households suggests that limited liquid assets are a core mechanism linking vulnerability status to weak resilience.
Village road conditions (B1) and livestock/poultry value (B2) represent physical-capital constraints. Poor road conditions increase transportation costs, reduce access to markets and services, and delay response during natural or market shocks. Livestock and poultry assets function as both productive capital and a buffer stock; low asset values reduce the ability of households to recover from income loss or expand production.
The income-boosting effect of corporate or cooperative assistance (B21) is another constraint. Interviews suggest that enterprise-farmer cooperation remains shallow in some areas: assistance often focuses on procurement or input supply rather than technical training, market information, quality certification, or risk sharing. If enterprises transfer price and disaster risks to farmers, the expected resilience effect of cooperation weakens. Policy design should therefore improve contract transparency, benefit-sharing mechanisms, and cooperative services.

5. Discussion

The findings show that livelihood resilience among forest farmers in Songshan District is relatively strong on average but uneven across dimensions and household groups. This pattern is consistent with recent resilience studies showing that rural households may improve risk-buffering capacity while still facing persistent constraints in human capital, infrastructure, and social access [6,7]. Compared with macro-level rural resilience studies, the present micro-level results reveal how household status, township development conditions, and specific indicator gaps jointly shape resilience in an ecologically fragile forest-farming context. These findings also resonate with international studies of livelihood resilience in forest-dependent and ecologically fragile communities. Research on coffee farmers, coastal communities, and forest-dependent households has similarly shown that resilience is shaped not only by asset ownership but also by market access, institutional support, social networks, and the ability to respond to repeated shocks [10,19,32]. The present study adds to this discussion by showing that, in a northern Chinese forest-farming context, linking social capital and liquidity constraints may remain important diagnostic bottlenecks even when households report relatively strong risk-resilience and financial-access scores. This suggests that resilience-building policies should not only increase asset stocks but also strengthen the channels through which households access formal support, market information, and cooperative services.
The prominence of social-capital constraints requires careful interpretation. The result does not mean that social relationships are more “important” than income or infrastructure in a causal sense. Instead, it indicates that the gap between current and ideal social access is large when combined with entropy weights. For forest farmers, relationships with village cadres reflect linking social capital: they shape access to policy information, subsidies, training, credit referrals, and emergency assistance. Relationships with relatives and friends reflect bonding social capital, which can provide informal help but may be insufficient when an entire community faces similar resource constraints. This distinction helps explain why social capital becomes a leading obstacle despite the presence of traditional rural networks.
The weak human-capital score also requires contextual interpretation. Although rural policies have improved public services and social assistance, human-capital resilience is constrained by aging, low education, labor outmigration, and health burdens. Policy support may increase access to assistance, but it cannot immediately reverse demographic aging or educational disadvantage. This explains why human capital remains weak even when government assistance is perceived as useful. The policy implications should therefore be targeted rather than generic. First, local governments should strengthen linking social capital by establishing regular village-cadre visits, transparent policy-information channels, and household-level follow-up mechanisms for monitored households. Second, financial institutions should design flexible credit products, savings incentives, and forest-rights or livestock-related collateral mechanisms to improve liquidity. Third, infrastructure investment should prioritize village roads and digital information networks that connect farmers to markets, training, and emergency services. Fourth, enterprises and cooperatives should move beyond purchase contracts by providing technical training, market intelligence, quality control, and risk-sharing arrangements. These measures are directly derived from the main obstacle factors identified in Table 5.
Several limitations remain. First, the cross-sectional survey design prevents causal inference and cannot resolve endogeneity between livelihood capital and resilience outcomes. Second, the fieldwork period was short, which may limit observation of seasonal dynamics. Third, the spatial analysis is descriptive and does not apply spatial econometric models because the sampling design was household-based rather than a spatial panel. Fourth, entropy weighting and obstacle-degree diagnosis are sensitive to indicator coding and dispersion. Future research should use panel data, instrumental-variable or quasi-experimental methods, spatial econometric models, and robustness checks with alternative weighting schemes to test the mechanisms suggested by this study. Accordingly, the empirical contribution of this study lies in measurement, classification, and constraint diagnosis rather than causal estimation. Because the composite index is constructed from the component indicators, using these same indicators as explanatory variables in a regression would create a mechanically circular relationship. Future studies should introduce external covariates, panel data, or quasi-experimental designs to test causal mechanisms more rigorously. Accordingly, the present results are interpreted as diagnostic evidence for policy prioritization.

6. Conclusions

This study measured the livelihood resilience of forest farmers in Songshan District using a six-dimensional capital-risk framework, entropy weights, K-means classification, and an obstacle-degree model. The analysis focuses on measuring resilience levels, classifying household profiles, and diagnosing priority constraints. Its contribution lies in adapting the SLF-resilience framework to forest farmers in a northern ecologically fragile region and in distinguishing livelihood risk resilience from conventional livelihood capital dimensions. The main conclusions are as follows:
(1)
The overall livelihood resilience score is 0.6267, indicating a relatively strong but uneven resilience level. Livelihood risk resilience and financial capital resilience are the strongest dimensions, while physical capital and human capital remain weak. This finding suggests that external support and financial access have improved, but infrastructure, labor, education, and health constraints continue to limit resilience.
(2)
Resilience differs by household type. General households score above the sample average and are more concentrated in the relatively strong and strong categories. Monitored households score below the average and face overlapping disadvantages in human capital, savings, physical assets, and social access.
(3)
Descriptive spatial variation exists across surveyed townships. Damiao has the highest resilience score, followed by Shangguandi, Wangfu, Laofu, and Gangzi, while Xiajiadian records the lowest level. The variation reflects differences in industrial development, infrastructure, financial access, and the maturity of modern agricultural initiatives.
(4)
The leading diagnostic constraints are relationships with village cadres (B11, 29.66%), household savings (B8, 16.25%), total value of livestock and poultry (B2, 14.70%), village road conditions (B1, 13.23%), relationships with relatives and friends (B10, 10.99%), and the income effect of corporate or cooperative assistance (B21, 6.88%). These results indicate that resilience improvement should focus on linking social capital, liquidity, productive assets, infrastructure, and higher-quality enterprise-farmer cooperation.

Author Contributions

Conceptualization, H.Z.; data curation, H.Z.; formal analysis, H.Z.; investigation, H.Z.; methodology, H.Z.; project administration, H.Z.; software, H.Z.; validation, H.Z.; writing—original draft preparation, H.Z.; funding acquisition, Q.B.; resources, Q.B.; supervision, Q.B.; writing—review and editing, Q.B. All authors have read and agreed to the published version of the manuscript.

Funding

This research was funded by: 1. The Fundamental Research Funds for Universities in Inner Mongolia Autonomous Region, Project on Science and Technology Innovation Team Construction, “Research Innovation Team on Forest and Grass Resource Economics and Ecological Security” (Grant No. BR231301); 2. The Inner Mongolia “Unveiling the List and Leading the Way” Project, “Coordinated Enhancement Technology and Demonstration of Eco-hydrological Functions in Sandy Land” (Grant No. 2024JBGS0005-5).

Institutional Review Board Statement

IRB approval obtained (approved by the Ethics Committee of Scientific Research Ethics Review Inner Mongolia Agricultural University (NNDKY2025005) on 1 December 2025).

Informed Consent Statement

Informed consent was obtained from all subjects involved in the study.

Data Availability Statement

The data presented in this study are available on request from the corresponding author. The data are not publicly available due to ongoing related research projects within the research group. Premature disclosure of the data may lead to overlaps in research progress and could compromise the integrity of subsequent in-depth studies.

Conflicts of Interest

The authors declare no conflicts of interest.

References

  1. Barrett, C.B.; Fanzo, J.; Herrero, M.; Mason-D’cRoz, D.; Mathys, A.; Thornton, P.K.; Wood, S.; Benton, T.G.; Fan, S.; Lawson-Lartego, L.; et al. COVID-19 pandemic lessons for agri-food systems innovation. Environ. Res. Lett. 2021, 16, 101001. [Google Scholar] [CrossRef] [Scilit]
  2. Quandt, A. Measuring livelihood resilience: The household livelihood resilience approach (HLRA). World Dev. 2018, 107, 253–263. [Google Scholar] [CrossRef] [Scilit]
  3. Béné, C.; Headey, D.; Haddad, L.; von Grebmer, K. Is resilience a useful concept in the context of food security and nutrition programmes? Some conceptual and practical considerations. Food Secur. 2016, 8, 123–138. [Google Scholar] [CrossRef] [Scilit]
  4. Zhang, C.; Fang, Y. Application of capital-based approach in the measurement of livelihood sustainability: A case study from the Koshi River basin community in Nepal. Ecol. Indic. 2020, 116, 106474. [Google Scholar] [CrossRef] [Scilit]
  5. Liu, W.; Li, J.; Ren, L.; Xu, J.; Li, C.; Li, S. Exploring livelihood resilience and its impact on livelihood strategy in rural China. Soc. Indic. Res. 2020, 150, 977–998. [Google Scholar] [CrossRef] [Scilit]
  6. Xu, J.; Lu, W.; Wang, W. From “fragile smallholders” to “resilient smallholders”: Measuring rural household resilience in China. Humanit. Soc. Sci. Commun. 2024, 11, 1712. [Google Scholar] [CrossRef] [Scilit]
  7. Wu, J.; Cao, Q.; Ouyang, W.; Chen, B.; Su, Y.; Xie, W.; Liu, S. Evolutionary patterns and influencing factors of livelihood resilience in tourism-dependent communities affected by an epidemic: An empirical study in the Wulingyuan scenic area, China. Sustainability 2025, 17, 2937. [Google Scholar] [CrossRef] [Scilit]
  8. Scoones, I. Sustainable Livelihoods and Rural Development; Practical Action Publishing: Rugby, UK, 2015; p. xv. [Google Scholar]
  9. Department for International Development. Sustainable Livelihoods Guidance Sheets; DFID: London, UK, 1999; Volume 445, p. 710.
  10. Saha, M.K.; Biswas, A.A.A. Faisal Livelihood vulnerability of coastal communities in context of the climate change: A index-based assessment. World Dev. Sustain. 2024, 4, 100152. [Google Scholar] [CrossRef] [Scilit]
  11. Ye, W.; Wang, Y.; Yang, X.; Wu, K. Understanding sustainable livelihoods with a framework linking livelihood vulnerability and resilience in the semiarid loess plateau of China. Land 2022, 11, 1500. [Google Scholar] [CrossRef] [Scilit]
  12. Newton, P.; Miller, D.C.; Byenkya, M.A.A.; Agrawal, A. Who are forest-dependent people? A taxonomy to aid livelihood and land use decision-making in forested regions. Land Use Policy 2016, 57, 388–395. [Google Scholar] [CrossRef] [Scilit]
  13. Liu, Y.; Li, J.T.; Yang, Y. Strategic adjustment of land use policy under the economic transformation. Land Use Policy 2018, 74, 5–14. [Google Scholar] [CrossRef] [Scilit]
  14. Chen, K.; Wang, Y.; Li, N.; Xu, Y.; Zheng, Y.; Zhan, X.; Li, Q. The impact of farmland use transition on rural livelihood transformation in China. Habitat Int. 2023, 135, 102784. [Google Scholar] [CrossRef] [Scilit]
  15. Sun, Y.; Wang, Y.; Huang, C.; Tan, R.; Cai, J. Measuring farmers’ sustainable livelihood resilience in the context of poverty alleviation: A case study from Fugong County, China. Humanit. Soc. Sci. Commun. 2023, 10, 75. [Google Scholar] [CrossRef] [Scilit] [PubMed]
  16. Zhao, X.; Zhao, R. The impact and mechanism of digital villages on agricultural resilience in ecologically fragile ethnic areas: Evidence from China’s provinces. Agriculture 2024, 14, 221. [Google Scholar] [CrossRef] [Scilit]
  17. Liu, W.; Dou, B.; Qian, L.; Zhao, X. Role of livelihood resilience in improving sustainable household well-being for disaster resettlement in Ankang Prefecture, Shaanxi Province, China. J. Mt. Sci. 2025, 22, 4190–4205. [Google Scholar] [CrossRef] [Scilit]
  18. Speranza, C.I.; Wiesmann, U.; Rist, S. An indicator framework for assessing livelihood resilience in the context of social–ecological dynamics. Glob. Environ. Change 2014, 28, 109–119. [Google Scholar] [CrossRef] [Scilit]
  19. Njurumana, G.N.; Ngongo, Y.; Octavia, D.; Suharti, S.; Rakatama, A.; Prameswari, D.; Maharani, R.; Wibowo, L.R.; Tampubolon, A.P.; Suratman; et al. Livelihood resilience of forest-dependent farmers amidst the COVID-19 pandemic in Sikka, Indonesia. Sustain. Futures 2025, 9, 10053. [Google Scholar] [CrossRef] [Scilit]
  20. Ke, L.; Ying, B.; Xiang, C.; Li, R.; Chen, X. Livelihood Resilience Among Zanthoxylum Bungeanum Farmers in Response to Technological Disruptions: Field Insights from Karst Rocky Desertification Mountainous Areas, China. Environ. Sustain. Indic. 2025, 28, 100901. [Google Scholar] [CrossRef] [Scilit]
  21. Barrett, C.B.; Constas, M.A. Toward a theory of resilience for international development applications. Proc. Natl. Acad. Sci. USA 2014, 111, 14625–14630. [Google Scholar] [CrossRef] [Scilit] [PubMed]
  22. Berkes, F.; Ross, H. Community resilience: Toward an integrated approach. Soc. Nat. Resour. 2013, 26, 5–20. [Google Scholar] [CrossRef] [Scilit]
  23. Li, E.; Deng, Q.; Zhou, Y. Livelihood resilience and the generative mechanism of rural households out of poverty: An empirical analysis from Lankao County, Henan Province, China. J. Rural Stud. 2022, 93, 210–222. [Google Scholar] [CrossRef] [Scilit]
  24. Tang, L.; Xu, Y.; Wang, W.; Wang, Y. Impact of livelihood capital and rural site conditions on livelihood resilience of farm households: Evidence from contiguous poverty–stricken areas in China. Environ. Sci. Pollut. Res. 2023, 30, 123808–123826. [Google Scholar] [CrossRef] [Scilit] [PubMed]
  25. Wang, Y.; Yan, J.; Wu, Y. Impact of policy measures on smallholders’ livelihood resilience: Evidence from Hehuang Valley, Tibetan Plateau. Ecol. Indic. 2024, 158, 111351. [Google Scholar] [CrossRef] [Scilit]
  26. Song, C.; Du, H. Spatial and temporal variations in the ecological vulnerability of northern China. J. Sens. 2022, 2022, 7232830. [Google Scholar] [CrossRef] [Scilit]
  27. Hu, C.; Dong, J. Measuring livelihood resilience of farmers and diagnosing obstacle factors under the impact of COVID-19 in Jiangsu Province, China. Front. Sustain. Food Syst. 2023, 7, 1250564. [Google Scholar] [CrossRef] [Scilit]
  28. Cheng, K.; Young, D.S. An approach for specifying trimming and winsorization cutoffs. J. Agric. Biol. Environ. Stat. 2023, 28, 299–323. [Google Scholar] [CrossRef] [Scilit]
  29. Şahin, M. A comprehensive analysis of weighting and multicriteria methods in the context of sustainable energy. Int. J. Environ. Sci. Technol. 2021, 18, 1591–1616. [Google Scholar] [CrossRef] [Scilit]
  30. Everitt, B.S.; Landau, S.; Leese, M.; Stahl, D. Hierarchical clustering. Clust. Anal. 2011, 5, 71–110. [Google Scholar]
  31. Javadi, S.; Hashemy, S.; Mohammadi, K.; Howard, K.; Neshat, A. Classification of aquifer vulnerability using K-means cluster analysis. J. Hydrol. 2017, 549, 27–37. [Google Scholar] [CrossRef] [Scilit]
  32. Campbell, D. Environmental change and the livelihood resilience of coffee farmers in Jamaica: A case study of the Cedar Valley farming region. J. Rural Stud. 2021, 81, 220–234. [Google Scholar] [CrossRef] [Scilit]
Figure 1. Capital-risk diagnostic framework for livelihood resilience among forest farmers in ecologically fragile regions.
Sustainability 18 04826 g001
Figure 2. Location of the study area and distribution of surveyed samples.
Sustainability 18 04826 g002
Figure 3. Overall distribution of livelihood resilience categories in the full sample.
Sustainability 18 04826 g003
Figure 4. Distribution of livelihood resilience categories among general households.
Sustainability 18 04826 g004
Figure 5. Distribution of livelihood resilience categories among monitored households.
Sustainability 18 04826 g005
Figure 6. Composite scores for forest farmers’ livelihood resilience across surveyed townships in ecologically fragile regions.
Sustainability 18 04826 g006
Table 1. Socioeconomic characteristics of surveyed forest-dependent households.
Statistical IndicatorsCategoryFrequencyPercentage
GenderMale34778.15%
Female9721.85%
AgeUnder 40 years old224.95%
40 to 50 years old (inclusive)9120.50%
50 to 70 years old (inclusive)27060.81%
Over 70 years old6113.74%
Education levelNo formal education20.45%
Primary school10824.32%
Junior high school25356.98%
Senior high school or vocational school6314.19%
College degree or above184.06%
Household labor force2 persons or fewer25757.88%
3 persons10724.10%
4 persons5712.84%
5 persons132.93%
6 persons or more102.25%
Household typeGeneral households34176.80%
Monitored households10323.20%
Table 2. Multidimensional indicator system for measuring livelihood resilience.
CategoryIndicator DescriptionMeasurement/Assignment
Physical capital resilience (A1)Village road conditions (B1)1 (Very poor); 2 (Poor); 3 (Average); 4 (Good); 5 (Very good)
Total value of livestock and poultry (B2)Discounted cash value of household livestock and poultry (RMB)
Ownership of agricultural machinery and vehicles (B3)1 (One type); 2 (Two types); 3 (Three types); 4 (Four types); 5 (Five or more types)
Human capital resilience (A2)Education level (B4)1 (Uneducated); 2 (Primary school); 3 (Junior high school); 4 (Senior high school or vocational school); 5 (College degree or above)
Number of household laborers (B5)Number of healthy laborers aged 16 to 65 (Persons)
Health status of family members (B6)1 (Long-term illness or disability); 2 (Frequent illness); 3 (Occasional illness); 4 (Rarely ill); 5 (Very healthy)
Financial capital resilience (A3)Per capita annual household income (B7)(Household income minus expenses) divided by family size (RMB)
Household savings amount (B8)Annual household income minus annual household expenses (RMB)
Ease of obtaining a loan when needed (B9)1 (Very difficult); 2 (Difficult); 3 (Average); 4 (Easy); 5 (Very easy)
Social capital resilience (A4)Relationship with relatives and friends (B10)1 (Very poor); 2 (Poor); 3 (Average); 4 (Good); 5 (Very good)
Relationship with village cadres (B11)1 (Very poor); 2 (Poor); 3 (Average); 4 (Good); 5 (Very good)
Frequency of participating in community activities (B12)Specific number of times participated
Natural capital resilience (A5)Existing household cropland area (B13)Per capita cropland area (Mu)
Quality of existing household cropland (B14)1 (Very poor); 2 (Poor); 3 (Average); 4 (Good); 5 (Very good)
Existing household forest land area (B15)Per capita forest land area (Mu)
Quality of existing household forest land (B16)1 (Very poor); 2 (Poor); 3 (Average); 4 (Good); 5 (Very good)
Livelihood risk resilience (A6)Impact of agricultural product price fluctuations on income (B17)Reverse-coded: 1 (Very large impact); 2 (Large); 3 (Average); 4 (Small); 5 (Very small impact)
Impact of natural disasters on income (B18)Reverse-coded: 1 (Very large impact); 2 (Large); 3 (Average); 4 (Small); 5 (Very small impact)
Regional information network coverage (B19)1 (Very small); 2 (Small); 3 (Average); 4 (Large); 5 (Very large)
Income effect of government policy assistance (B20)1 (Very small); 2 (Small); 3 (Average); 4 (Large); 5 (Very large)
Income effect of corporate or cooperative assistance (B21)1 (Very small); 2 (Small); 3 (Average); 4 (Large); 5 (Very large)
Table 3. Entropy-based weights of livelihood resilience indicators.
Primary Indicator (A)WeightRankSecondary Indicator (B)WeightRank
Physical capital resilience (A1)0.11655Village road conditions (B1)0.050212
Total value of livestock and poultry (B2)0.056210
Ownership of agricultural machinery and vehicles (B3)0.010121
Human capital resilience (A2)0.03856Education level (B4)0.011620
Number of household laborers (B5)0.012819
Health status of family members (B6)0.014118
Financial capital resilience (A3)0.21872Per capita annual household income (B7)0.07942
Household savings amount (B8)0.07234
Ease of obtaining a loan (B9)0.06706
Social capital resilience (A4)0.20803Relationship with relatives and friends (B10)0.07085
Relationship with village cadres (B11)0.07623
Frequency of participating in community activities (B12)0.06108
Natural capital resilience (A5)0.19604Existing household cropland area (B13)0.020317
Quality of existing household cropland (B14)0.054511
Existing household forest land area (B15)0.06277
Quality of existing household forest land (B16)0.05859
Livelihood risk resilience (A6)0.22231Resilience to agricultural product price fluctuations (B17)0.12131
Resilience to natural-disaster income shocks (B18)0.026314
Regional information network coverage (B19)0.026115
Income effect of government policy assistance (B20)0.021116
Income effect of corporate or cooperative assistance (B21)0.027513
Note: B17 and B18 were reverse-coded; higher scores indicate lower negative impacts and stronger resilience.
Table 4. Comprehensive scores of livelihood resilience indicators.
Primary Indicator (A)ScoreRankSecondary Indicator (B)ScoreRank
Physical capital resilience (A1)0.40995Village road conditions (B1)0.327217
Total value of livestock and poultry (B2)0.461615
Ownership of agricultural machinery and vehicles (B3)0.256919
Human capital resilience (A2)0.35216Education level (B4)0.250120
Number of household laborers (B5)0.134521
Health status of family members (B6)0.277518
Financial capital resilience (A3)0.67972Per capita annual household income (B7)0.66303
Household savings amount (B8)0.557810
Ease of obtaining a loan (B9)0.66412
Social capital resilience (A4)0.55103Relationship with relatives and friends (B10)0.56088
Relationship with village cadres (B11)0.461714
Frequency of participating in community activities (B12)0.56039
Natural capital resilience (A5)0.53194Existing household cropland area (B13)0.56846
Quality of existing household cropland (B14)0.467813
Existing household forest land area (B15)0.56757
Quality of existing household forest land (B16)0.57645
Livelihood risk resilience (A6)0.74761Resilience to agricultural product price fluctuations (B17)0.77401
Resilience to natural-disaster income shocks (B18)0.474012
Regional information network coverage (B19)0.477411
Income effect of government policy assistance (B20)0.58114
Income effect of corporate or cooperative assistance (B21)0.440516
Comprehensive livelihood resilience score0.6267
Note: B17 and B18 were reverse-coded; higher scores indicate lower negative impacts and stronger resilience.
Table 5. Obstacle-degree ranking of key constraint indicators on livelihood resilience.
Survey ObjectCategoryObstacle Degree
Rank 1Rank 2Rank 3Rank 4Rank 5Rank 6
Total sampleConstraint indicatorB11B8B2B1B10B21
Obstacle degree29.66%16.25%14.70%13.23%10.99%6.88%
General householdsConstraint indicatorB11B2B8B1B21B10
Obstacle degree31.23%19.87%12.40%11.42%7.44%3.56%
Monitored householdsConstraint indicatorB11B8B1B21B2B10
Obstacle degree30.04%28.00%21.50%10.58%6.22%4.68%
Disclaimer/Publisher’s Note: The statements, opinions and data contained in all publications are solely those of the individual author(s) and contributor(s) and not of MDPI and/or the editor(s). MDPI and/or the editor(s) disclaim responsibility for any injury to people or property resulting from any ideas, methods, instructions or products referred to in the content.