Article

Can Urban Agglomeration Construction Promote the Synergy of Digitalization and Greening?

1
Glorious Sun School of Business and Management, Donghua University, Shanghai 200051, China
2
School of Economics and Management, Zhoukou Normal University, Zhoukou 466001, China
*
Author to whom correspondence should be addressed.
Sustainability 2026, 18(10), 4659; https://doi.org/10.3390/su18104659
Submission received: 25 March 2026 / Revised: 27 April 2026 / Accepted: 3 May 2026 / Published: 7 May 2026

Abstract

As critical spatial carriers for concentrating factor resources related to digitalization and greening, urban agglomerations provide key platforms for advancing the synergistic development of these two domains. Drawing on a city-level panel covering 280 prefecture-level cities in China over 2003–2023, this study applies a time-varying difference-in-differences (DID) framework to evaluate the influence of urban agglomeration construction on digital-green synergy and to clarify the mechanisms through which this influence occurs. The empirical evidence shows that urban agglomeration construction exerts a significant positive impact on digital-green synergy. The effect is more evident among cities in the small and medium-sized categories, cities with relatively weak initial synergy, regions characterized by stronger government cooperation awareness, and cities located closer to central cities. It is also more evident in relatively underdeveloped regions. Mechanism analysis shows that urban agglomeration construction improves digital-green synergy mainly by reinforcing industrial collaboration, which strengthens inter-city specialization and complementary advantages. Moreover, alleviating market segmentation and accelerating factor flows further increases the positive effect of urban agglomeration construction on digital-green synergy. These findings offer empirical evidence and policy implications for improving urban agglomeration development strategies and promoting urban digital-green synergy.

1. Introduction

With the continued expansion of the digital economy and the deepening advancement of ecological civilization construction, the synergistic development of digitalization and greening (hereinafter referred to as “the synergy”) has increasingly become a key pathway for high-quality urban development. The synergy is not a simple addition of digitalization and greening. Instead, it describes a dynamic process through which urban digital systems and greening systems achieve mutual empowerment, interaction, coupling, and co-evolution by means of technology applications, industrial transformation, and governance practices. This process forms an interactive relationship whereby digitalization enables greening and greening guides digital transformation [1]. Digitalization relies on digital infrastructure construction and is supported by talent agglomeration and technological innovation. Through the intensive application of digital technologies, digitalization advances industrial digital transformation and digital industrialization, thereby enhancing resource allocation efficiency and environmental governance capacity. Greening, in turn, is grounded in resource and environmental constraints. By means of efficient resource and energy utilization, ecological environment governance, and low-carbon industrial transformation, greening provides green scenarios and transformation directions for applying digital technologies.
In this process, cities are not only the basic spatial units where digital technologies are applied and green governance is practiced, but also key carriers supporting regionally coordinated transformation. Along with the continued advancement of new urbanization as well as regional coordinated development strategies, the logic of urban development has gradually shifted from competition among individual cities to network-based collaboration. Against this background, urban agglomerations have become important institutional arrangements for reshaping spatial economic patterns and promoting cross-regional coordinated governance. Within the framework of regional innovation system theory, an urban agglomeration differs from the development logic of a single city and is not merely a geographic combination of multiple cities. Rather, through spatial agglomeration, division of labor and collaboration, knowledge spillover, and institutional coordination, it promotes the efficient flow and optimal allocation of capital, labor, and technology across a broader spatial scale [2]. Through the spatial radiation effects generated by agglomeration and diffusion, urban agglomerations optimize resource allocation and industrial division and collaboration. In this way, they provide a spatial foundation for cross-regional green technology diffusion across regions and the joint construction of digital infrastructure by providing a spatial foundation, while also offering institutional guarantees and innovation network support for the evolution of the synergy [3]. Therefore, under the guidance of urban agglomeration strategies, inter-city collaboration is expected to broaden the space for achieving the synergy and provide a new spatial governance pathway for high-quality urban development.
However, existing studies have yet to fully explain how urban agglomeration construction affects the synergy. First, studies on the policy effects of urban agglomerations have mainly examined traditional development outcomes, including economic growth, industrial upgrading, market integration, and innovation performance [4,5]. However, the question of whether urban agglomeration construction can promote the synergy as an emerging strategic goal remains insufficiently explored. Second, research on the synergy has mostly explored its determinants from the perspectives of economic foundations, industrial structure, technological innovation, policy support, and market environment [1,6,7]. Nevertheless, urban agglomeration construction has seldom been treated as a spatial institutional policy within this analytical framework, which makes it difficult to clarify the internal relationships among spatial governance, regional collaboration, and the synergy. Third, urban agglomerations exhibit significant structural heterogeneity. Cities of different sizes vary in resource endowments, technology absorption capacity, policy implementation capacity, and geographic location, implying that the policy effects of urban agglomeration construction may differ across cities [8,9]. Although existing practices indicate that core cities can generate strong radiation and driving effects and promote coordinated transformation in surrounding cities through technology spillovers and resource sharing [10], spatial agglomeration does not necessarily lead to functional synergy [11]. Institutional integration lag, market segmentation, and restricted factor mobility may continue to weaken the promoting effect of urban agglomerations on the synergy.
Therefore, it remains necessary to examine whether urban agglomeration construction can effectively improve the level of the synergy in cities, through what mechanisms this effect operates, and whether it varies across different cities and regions. To address these questions, this study uses panel data covering 280 prefecture-level cities in China over the period 2003 to 2023. The approval of national-level urban agglomeration plans is treated as a quasi-natural experiment, and a time-varying difference-in-differences (DID) model is applied to estimate how urban agglomeration construction affects the level of the synergy. In addition, this study examines the mediating mechanism of industrial collaboration and the moderating roles of market segmentation and factor flows. The potential marginal contributions of this paper can be summarized in four aspects. First, it broadens research on the policy effects of urban agglomerations by introducing the perspective of the synergy, thereby shifting the analytical focus from traditional economic performance to the synergistic development of digitalization and greening. Second, based on regional innovation system theory and the integration of institutional economics and new economic geography, this study incorporates industrial collaboration, market segmentation, and factor mobility into a unified analytical framework, thereby revealing the transmission mechanisms and boundary conditions through which urban agglomeration construction affects the synergy. Third, it identifies the heterogeneous effects of the policy from the perspectives of city size, synergy foundation, government cooperation awareness, and intra-agglomeration location, providing empirical evidence for understanding the “weakness-compensating” function and spatial heterogeneity of urban agglomeration construction. Fourth, considering the potential model misspecification problems of traditional linear regression models, a double/debiased machine learning (DML) model is further used for robustness checks, and a generalized random forest (GRF) algorithm is employed to estimate individual treatment effects, thereby strengthening the reliability of the conclusions. Overall, this study advances academic understanding of the policy effects of urban agglomerations and the synergistic development of digitalization and greening. In addition, it provides policy references for using urban agglomerations to promote the synergy and support cross-regional collaborative governance for high-quality urban development.

2. Literature Review and Research Hypotheses

2.1. Literature Review

2.1.1. Policy Effects of Urban Agglomeration Construction

As an important spatial policy instrument supporting China’s new urbanization and coordinated regional development, urban agglomeration construction has gradually developed, since the Eleventh Five-Year Plan period, into a multi-tiered network system in which central cities play a leading role and large, medium, and small cities pursue coordinated development. To date, eleven national-level urban agglomeration development plans have been approved by the State Council, with their spatial coverage extending across eastern, central, western, and northeastern regions. This evolution indicates that China’s regional development strategy has undergone a systemic shift from an “administrative region economy” to an “urban agglomeration economy”. The specific urban agglomerations and their approval dates are presented in Table 1. Existing studies have generally argued that national-level urban agglomeration policies can reduce administrative divisions and market barriers through institutional linkages and cross-regional coordination, thereby improving the efficiency of cross-city factor flows and resource allocation [12]. Related research has also identified the positive externalities generated by urban agglomeration construction in multiple dimensions, including transaction costs, economic growth, industrial collaboration, factor allocation, market integration, and green governance [13,14]. Furthermore, within urban agglomerations, the “core–periphery” structure strengthens industrial coordination and knowledge spillovers through gradient transmission mechanisms, thus serving as a crucial spatial carrier for reorganizing innovation factors and promoting technology diffusion [15]. By relying on their advantages in technology, capital, and institutions, central cities can transmit digital governance capabilities and green production models to surrounding cities through urban agglomeration networks [16]. Meanwhile, unified market rules and cross-regional policy coordination mechanisms contribute to alleviating the fragmentation of local governance and provide institutional guarantees for coordinated regional development [17].

2.1.2. Factors Influencing Digital-Green Synergy

Within the development trajectory of digitalization, the green orientation has continued to deepen. Meanwhile, in the process of green transformation, digital empowerment has played an increasingly prominent role. Against this background, the practical demand for the synergistic development of digitalization and greening has gradually become an important opportunity for promoting high-quality economic development. Existing literature has indicated that the realization of digital-green synergy is shaped by multiple factors operating at different levels. The level of economic development, policy support, and technological innovation constitute its foundational conditions. Specifically, digital technological progress provides key tools for green governance and low-carbon transformation, while the demand for green development further drives the application and iteration of digital technologies [4,5,18]. The pathways for achieving digital-green synergy are shaped by industrial structure and infrastructure conditions, with industrial diversity and innovation capacity providing application scenarios for the integration of digital and green technologies, while a clear bidirectional interaction exists between digital infrastructure and the demand for green governance [1,19]. Additionally, the degree of market integration, by reducing institutional frictions and resource misallocation, creates a favorable environment for the diffusion of digital-green technologies [17].
However, the energy-intensive nature of digital infrastructure itself, coupled with local governments’ investment preferences driven by short-term performance pressures, constitutes a fundamental contradiction with low-carbon objectives [20]. Digitalization and greening are neither inherently complementary nor inevitably in conflict; their synergistic effects are contingent upon conditions such as technological progress, institutional design, and governance capacity. Driven by practices such as green digital technologies, smart governance, and industrial internet platforms, the interaction between digitalization and greening is gradually shifting from potential conflict to conditional complementarity [21]. For example, Chongqing Municipality has established an online real-time monitoring platform for energy and carbon emissions through digital means, launching the “Industrial Greening Efficiency Code” which utilizes a “one-code access” system to achieve dynamic management of the entire green manufacturing process, thereby helping enterprises reduce the costs and risks associated with low-carbon transformation and accelerating the scaling up of green industries.
In summary, although the existing literature has provided relatively systematic discussions on the policy effects of urban agglomeration construction and the factors influencing digital-green synergy, several important gaps remain. First, most related studies have examined urban agglomeration policies primarily in relation to traditional economic performance and industrial development, while their role in achieving the emerging strategic objective of digital-green synergy has received limited attention. Second, although prior research has identified the multidimensional driving mechanisms of digital-green synergy, it remains unclear how urban agglomeration construction, as a spatial institutional policy, affects digital-green synergy through these mechanisms, and this issue still requires stronger theoretical integration and empirical testing. Third, energy constraints arising from digital expansion, together with the trade-offs faced by local governments between the digital economy and green transformation, remain practical issues that require further examination in digital-green synergy research. In this context, this study investigates how urban agglomeration construction affects digital-green synergy and through which underlying mechanisms this effect occurs from the perspective of urban agglomeration development, thereby offering a useful supplement to the relevant literature.
Taken together, although existing studies have examined both the policy effects of urban agglomeration construction and the influencing factors of the synergistic development of digitalization and greening, these two strands of research have not yet been sufficiently integrated. Specifically, on the one hand, studies on the policy effects of urban agglomerations have mainly emphasized traditional development outcomes, including economic growth, industrial upgrading, and market integration. As an emerging strategic goal, the synergistic development of digitalization and greening has not been sufficiently examined in relation to urban agglomeration construction, and the transformational function of this policy in the new development stage remains insufficiently clarified. On the other hand, although research on the synergy has identified multiple influencing factors from the perspectives of technological progress, institutional environment, and industrial structure, how urban agglomeration construction, as a typical spatial institutional arrangement, affects the synergy through optimized factor flows, strengthened industrial collaboration, and reduced market segmentation has not yet been fully supported by systematic theoretical integration or empirical evidence. Furthermore, the energy constraint effect associated with the expansion of digitalization, together with the trade-off faced by local governments between short-term economic performance and green transition goals, increases uncertainty in the pathways for achieving the synergy. In light of these gaps, this study takes urban agglomeration construction as a key spatial policy and systematically examines its impact and underlying mechanisms on digital-green synergy. In doing so, it constructs a theoretical linkage framework between urban agglomeration policy effects and the synergy, while providing new empirical evidence for understanding how spatial institutional arrangements facilitate the transition toward new development patterns.

2.2. Research Hypotheses

2.2.1. The Impact of Urban Agglomeration Construction Policies

As a new form of regional development characterized by spatial proximity, economic linkage, and governance coordination, urban agglomerations provide institutional spatial advantages and practical platforms for digital-green synergy [22]. On one hand, urban agglomeration construction breaks down traditional administrative boundaries, establishing cross-regional coordination mechanisms and unified policy frameworks. The interaction term digitalization, understood as the promotion of unified data standards, shared information platforms, and institutional arrangements for network security within urban agglomerations, effectively dismantles information silos in digital resources, thereby enhancing the efficiency of data circulation and application. In terms of greening, regionally unified environmental standards, ecological compensation mechanisms, and carbon emission trading platforms help to circumvent the problems of “pollution havens” and the “environmental race-to-the-bottom” [14]. Furthermore, co-construction and sharing within the urban agglomeration framework not only avoids redundant investments, enables the large-scale deployment of infrastructure, and lowers the threshold for digital-green transformation, but also alleviates vicious competition among local governments through mechanisms such as ecological compensation, tax revenue sharing, and joint investment promotion. These arrangements help foster an institutional environment conducive to digital-green synergy [10]. On the other hand, geographical proximity within urban agglomerations further strengthens internal knowledge spillover effects [23]. Technological innovations in digital technologies and breakthroughs in green technologies originating from central cities can be rapidly radiated to surrounding areas, accelerating the integrated innovation of digital-green technologies. Close interactions among research institutions, higher education institutions, and innovative enterprises within urban agglomerations also accelerate the continuous renewal and upgrading of digital technologies and green technologies [24]. Meanwhile, the diversified industrial structures and application scenarios within urban agglomerations serve as testing grounds for the integrated innovation of digital-green technologies, where emerging sectors such as smart energy, green manufacturing, and the circular economy are more likely to gain technological support and market validation [25].
Based on the preceding theoretical discussion, this study develops the following hypothesis:
H1. 
Urban agglomeration construction can enhance urban digital-green synergy.

2.2.2. The Mediating Mechanism of Industrial Collaboration

As a cross-administrative-boundary form of regional spatial organization, an urban agglomeration is not limited to strengthening economic linkages among cities. Rather, it serves as a key transmission mechanism for advancing digital-green synergy through vertical industrial chain integration, spatial reorganization of value chains, and cross-regional innovation collaboration [26]. From the perspective of value chain integration, urban agglomeration construction, by breaking down administrative fragmentation and market barriers, enables different cities to embed themselves into different segments of the regional industrial chain according to their respective resource endowments and comparative advantages, thereby forming a vertical division-of-labor system in which core cities act as hubs and peripheral cities serve as nodes. Relying on advantages in research institutions, high-skilled talent, digital infrastructure, and platform resources, core cities primarily undertake high-value-added functions such as basic research, key technology breakthroughs, digital platform development, and green technology R&D, thus becoming the knowledge production centers for digital and green technologies. In contrast, surrounding small and medium-sized cities, by leveraging their industrial carrying capacity, manufacturing base, and factor cost advantages, take on industrial segments such as ecological agriculture, clean energy, resource recycling, and green manufacturing, while achieving localized adaptation, scenario-based application, and large-scale diffusion of technologies during the process of industrial transfer [10]. The resulting model—characterized by R&D in core cities, transformation in peripheral cities, and innovation through interaction—not only shortens the distance from laboratory to industrial application for synergistic technologies but also helps build a well-defined, functionally complementary green and low-carbon industrial system.
Industrial collaboration within urban agglomerations is not limited to the division and articulation of industrial chain links. It also involves knowledge interaction, resource sharing, and capability complementarity among innovation agents, which is consistent with the logic of regional innovation systems. Dense industrial linkages within an urban agglomeration create channels for information exchange, collaborative R&D activities, and iterative learning across enterprises, universities, research institutions, and government agencies. Through cross-city and cross-industry collaboration, tacit technical knowledge can be disseminated, absorbed, and recombined more effectively. On the one hand, cross-city industrial collaboration reduces transaction costs and information asymmetry, mitigates low-quality redundant construction and homogeneous competition, and improves resource utilization efficiency. On the other hand, the technology supply from core cities and the application scenarios of peripheral cities are effectively matched through industrial collaboration networks, promoting the embedding of digital technologies into green production, energy management, pollution control, and the circular economy, while the demand for green transformation in turn drives iterative upgrading of digital technologies. In this process, the regional diffusion of green technologies and the collaborative development of digital infrastructure are advanced simultaneously, enabling digitalization and greening to move from separate and independent development toward deep integration at the industrial level. Therefore, industrial collaboration is not only an important outcome of urban agglomeration construction but also an intermediate transmission link through which spatial integration policies contribute to digital-green synergy.
Accordingly, this study proposes the following hypothesis:
H2. 
Urban agglomeration construction can enhance urban digital-green synergy through industrial collaboration.

2.2.3. The Moderating Roles of Market Segmentation and Factor Flow

Market segmentation has long constrained resource allocation across regions and serves as an important institutional barrier affecting the policy effects generated by urban agglomeration construction. Within the framework of institutional economics, market segmentation can be understood as a form of institutional transaction cost generated by local protectionism, administrative barriers, and unequal market access [27]. The synergistic development of digitalization and greening is supported by the large-scale diffusion of digital resources and green technologies. If market segmentation persists over the long term, even formally promoted urban agglomeration construction is unlikely to achieve cross-regional factor integration and technological synergy. Such a beggar-thy-neighbor development pattern fundamentally constrains the spatial advantages of urban agglomerations. Conversely, under conditions of a higher degree of market integration, unified market access rules, institutional coordination, and interconnected infrastructure, institutional transaction costs are significantly reduced, the diffusion of digital and green technologies across regions is promoted, and the contribution of urban agglomeration construction to the synergy is reinforced. Meanwhile, digital development itself, by reducing information asymmetry and transaction costs, may further promote regional market integration in reverse, thereby broadening the space for achieving the synergy.
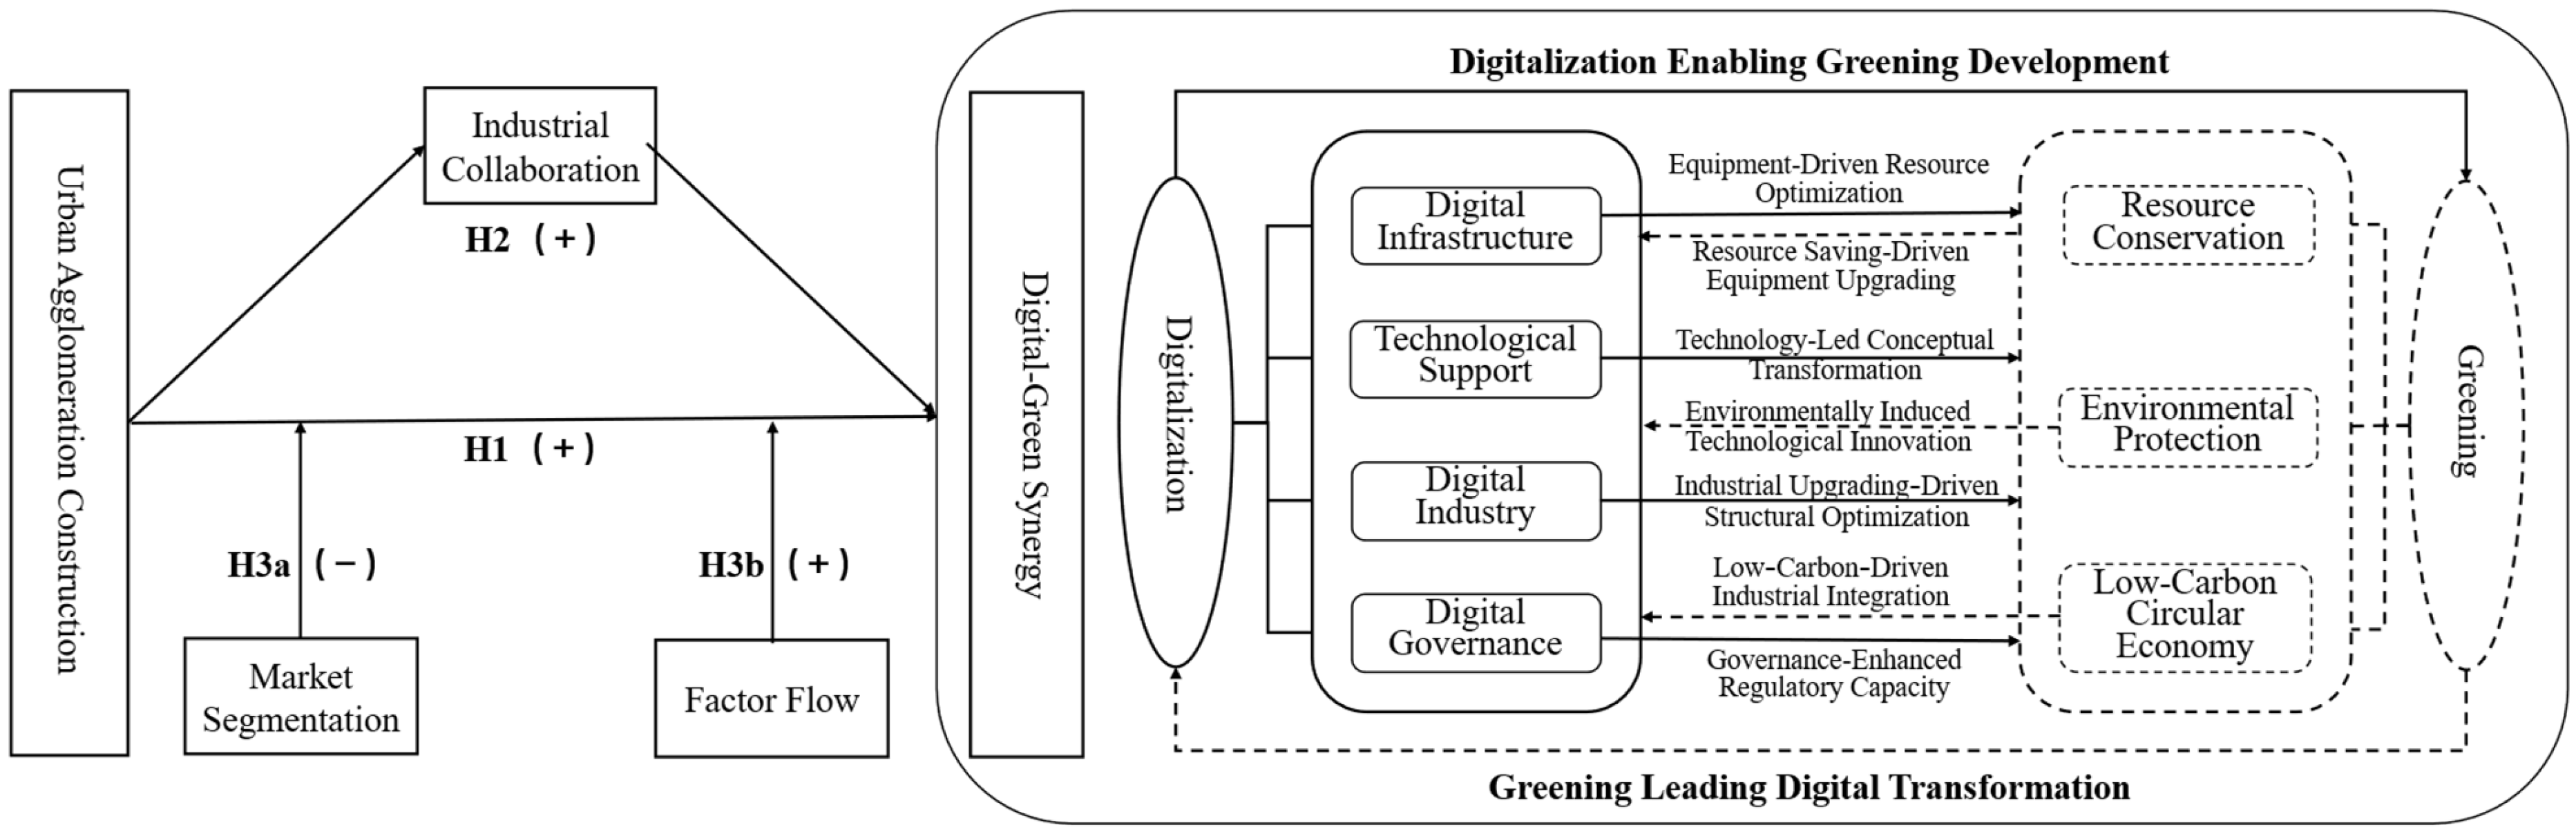
Factor flow, especially the efficient movement of labor and capital within an urban agglomeration, serves as a pivotal moderating mechanism through which urban agglomeration construction advances digital-green synergy. From the perspective of new economic geography, urban agglomerations, by reducing spatiotemporal distances between cities, lowering the costs of factor flow, and strengthening spatial spillover effects, enable the reallocation of labor, capital, technology, and information across different cities. The cross-city movement of high-quality labor helps diffuse digital skills, green knowledge, and innovation experience, thereby enhancing knowledge sharing and technology absorption capacity within the urban agglomeration. Cross-regional capital flow, in turn, provides funding support and risk-sharing mechanisms for digital infrastructure construction, green technology R&D, and low-carbon industrial projects. When labor and capital are able to flow freely and be matched effectively within the urban agglomeration, the technology supply and capital advantages of core cities can be better aligned with the industrial scenarios and green transformation needs of peripheral cities. This alignment enables digital achievements to serve the green transition more efficiently and reinforces the demand-driven pull of green development for upgrading digital technology applications. Therefore, more efficient factor flow further enhances the capacity of urban agglomeration construction to promote the synergy. The theoretical framework is presented in Figure 1.
Accordingly, this study proposes the following hypotheses:
H3a. 
Reducing market segmentation can effectively strengthen the role of urban agglomeration construction in enhancing digital-green synergy.
H3b. 
Accelerating factor flows can effectively strengthen the role of urban agglomeration construction in enhancing digital-green synergy.

3. Research Design

3.1. Baseline Model Specification

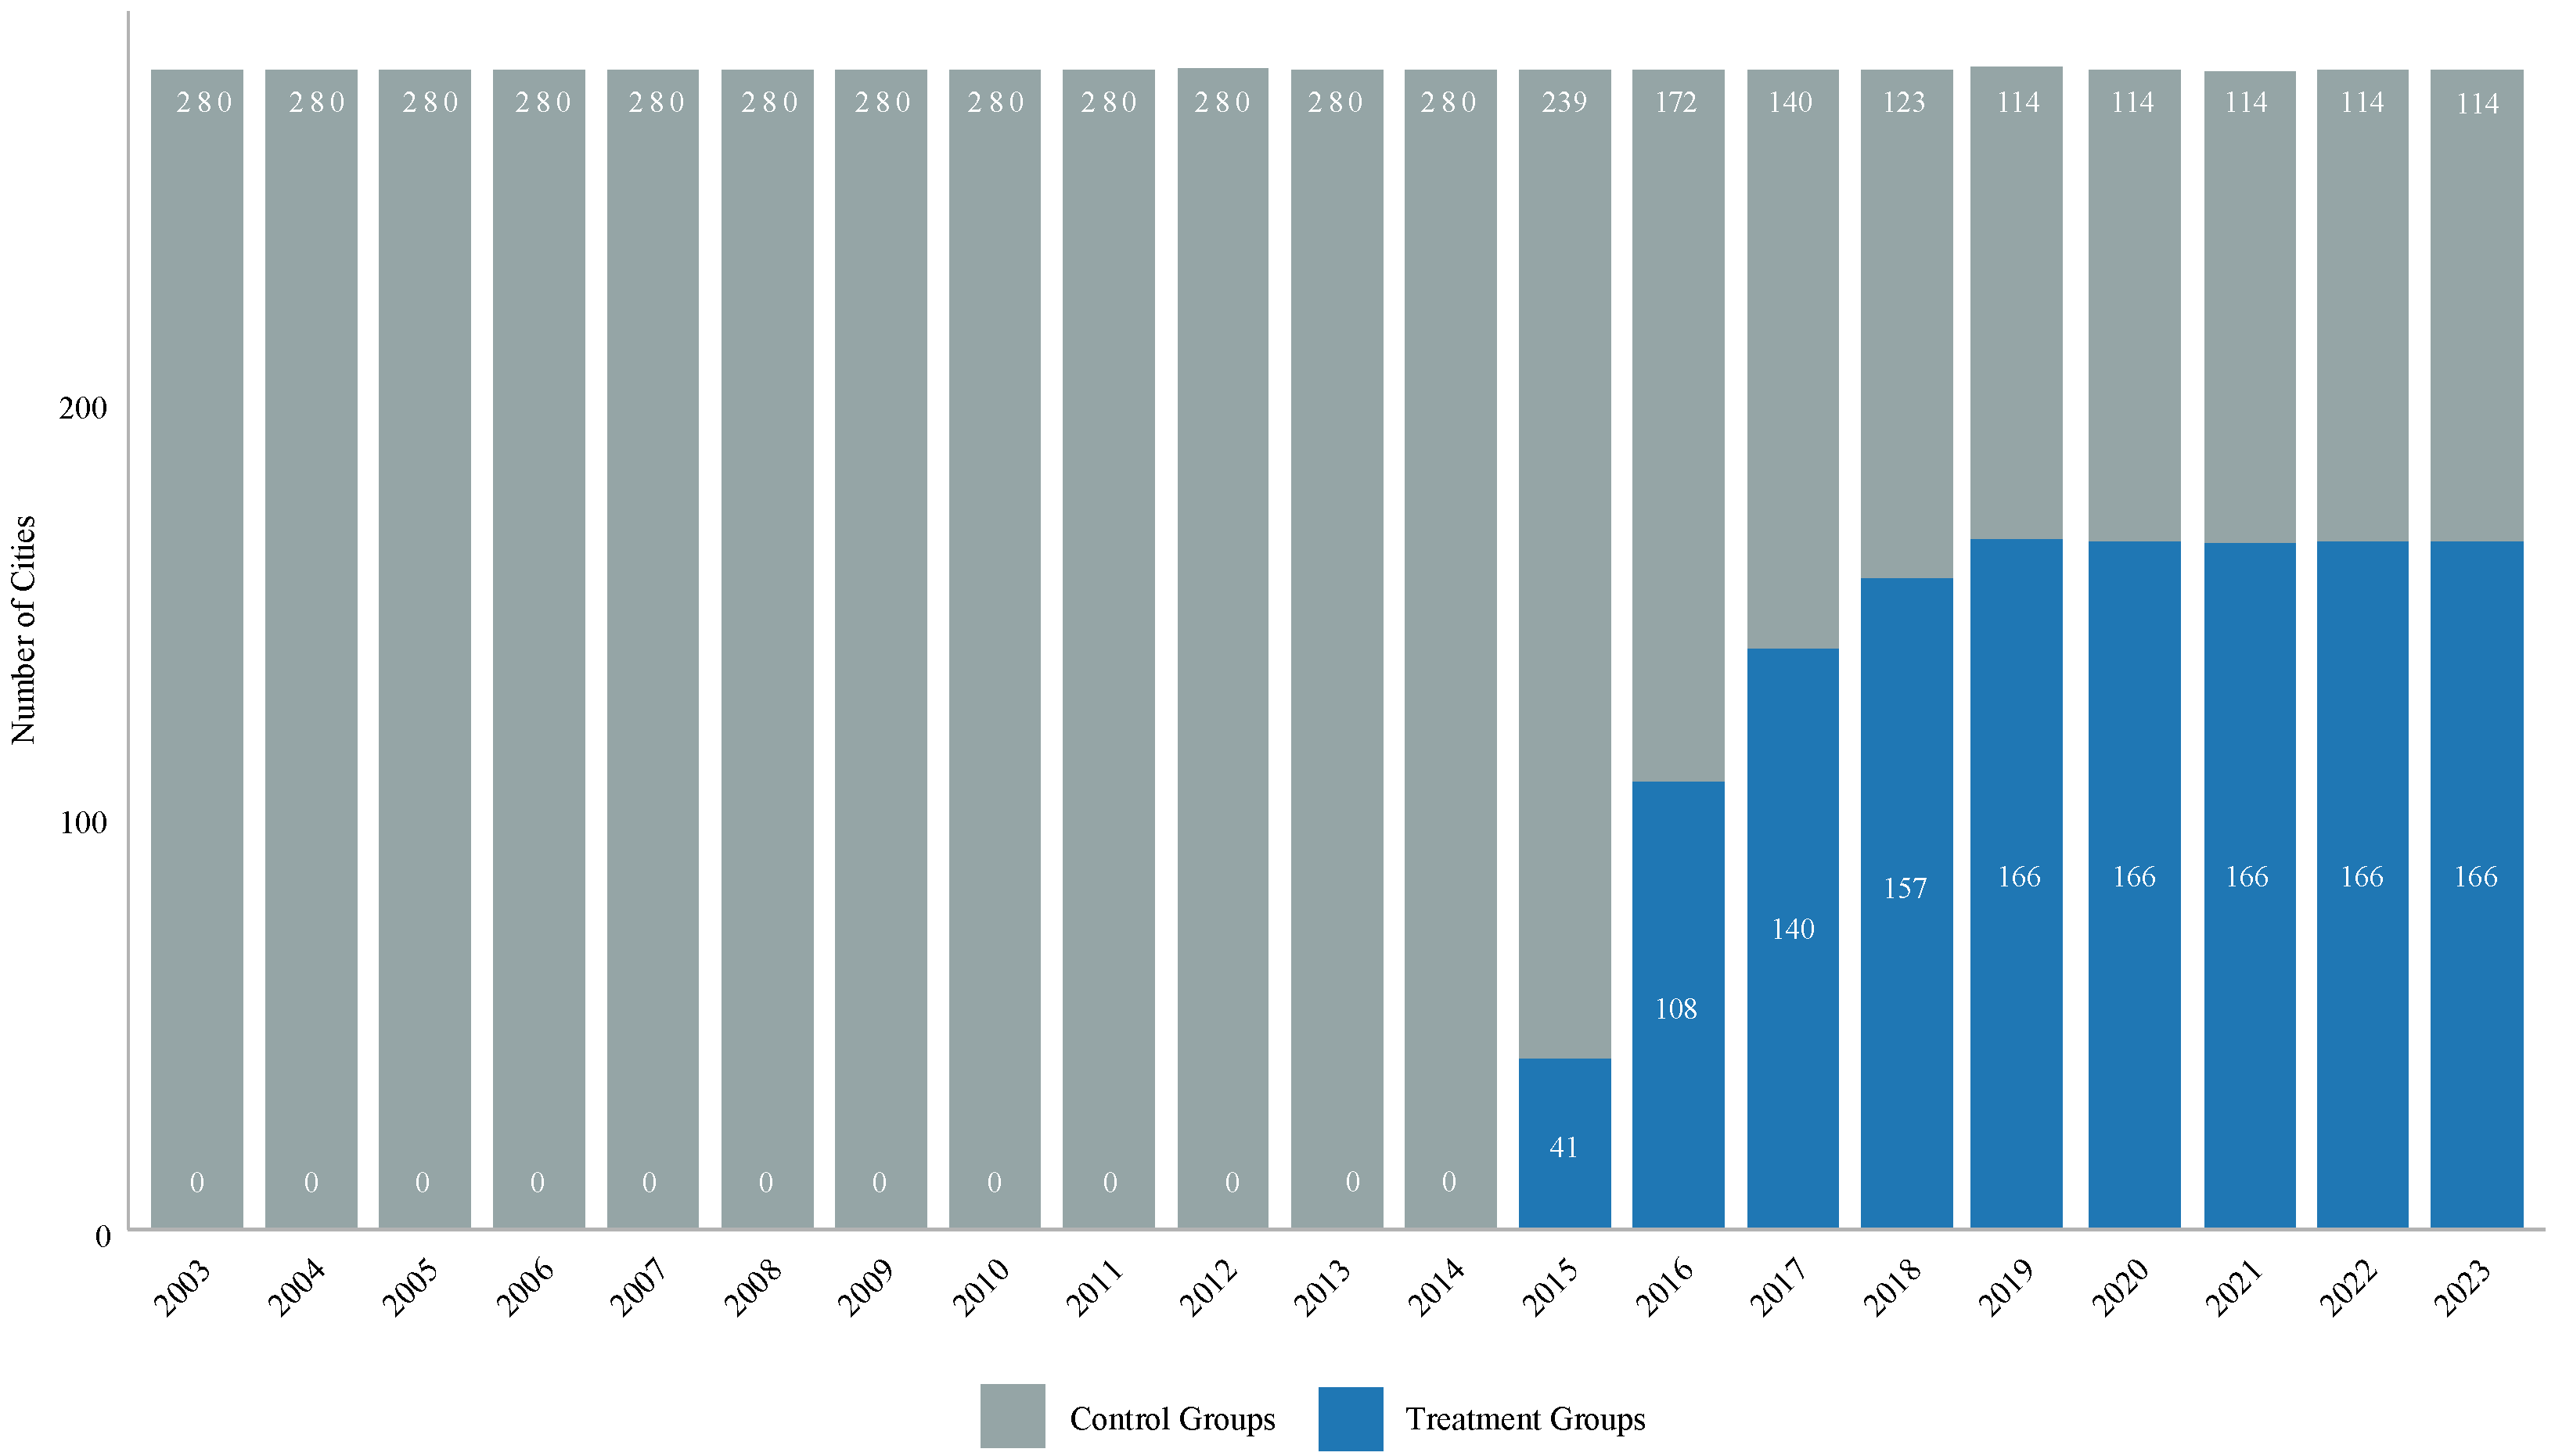
By the end of 2025, the State Council had approved a total of 11 national-level urban agglomerations, with the approval times varying significantly across these agglomerations, resulting in a policy arrangement characterized by a phased and staggered implementation. Because the policy was not implemented uniformly across time or space, it created a quasi-natural experimental setting for identifying the policy effects of urban agglomeration construction. On one hand, urban agglomeration policies were primarily formulated by the central government, with no clear reverse causality between these policies and the level of urban digital-green synergy. On the other hand, whether and when different cities were incorporated into national-level urban agglomerations exhibited exogenous variation, providing a realistic basis for constructing treatment and control groups. Accordingly, in the regression strategy, prefecture-level cities covered by the 11 nationally approved urban agglomerations were defined as the treatment group, while prefecture-level cities not included in any national-level urban agglomeration constituted the control group. Due to data availability constraints, samples from Hong Kong, Macao, and Taiwan, cities that had experienced administrative boundary changes, and cities with severe data missingness were excluded. After sample screening, 280 prefecture-level cities remained in the dataset, including 166 cities assigned to the treatment group and 114 cities assigned to the control group. Figure 2 shows how the treatment and control groups were distributed across policy implementation years.
Furthermore, according to the approval year of each national-level urban agglomeration plan, the policy intervention time was assigned at the city level. On this basis, a city-level time-varying difference-in-differences (DID) model was constructed following the classical specification of the staggered DID approach [16], so as to estimate the effect of national-level urban agglomeration policy implementation on urban digital-green synergy development. The specific econometric model was specified as follows:
Couple it   =   α   +   β Ua it   +   γ X it   +   μ i   +   λ t   +   ε it ,
where i denotes the city, t denotes the year, and the dependent variable Couple it represents the level of digital-green synergy development for city i in year t . The core explanatory variable Ua it is the interaction terms between a time dummy variable and a group dummy variable, representing national-level urban agglomeration construction. If city i was covered by a relevant national-level urban agglomeration policy, Ua it was set to 1 for the years after the policy implementation, and 0 for the years before; for cities in the control group without any national-level urban agglomeration policy, the Ua it variable was consistently set to 0. The coefficient β of Ua it captures the average treatment effect of urban agglomeration construction on the level of urban digital-green synergy development. X it represents the vector of control variables in the model, μ i denotes city fixed effects, λ t denotes time fixed effects, and ε it is the random error term. To enhance the robustness of the estimation results, city-level clustered robust standard errors were used in the regression analysis to address potential within-group serial correlation.

3.2. Variable Specification

3.2.1. Dependent Variable

The dependent variable, namely the level of digital-green synergy development, reflects the overall condition of mutual empowerment and co-evolution between digitalization and greening. Given the complex interactions between the two systems, neither simple linear aggregation nor single-dimensional measurement can adequately capture the actual level of digital-green synergy. In the study, the overall framework for the synergistic development of digitalization and greening proposed by the China Academy of Information and Communications Technology (CAICT) was adopted. Meanwhile, the relevant research findings of Shan et al. (2025) [1], Zheng et al. (2025) [6], and Li et al. (2024) [21] on the evaluation system of digital economy development, the regional green development index system, and the index system for the synergy were integrated.
Accordingly, a measurement index system for the synergy, as shown in Table 2, was constructed from two dimensions: digitalization-enabled development, and green transformation. The level of urban synergy was then measured using the coupling coordination degree model. To remove dimensional differences and maintain directional consistency, all variables were processed according to their economic meanings. Specifically, the level of digital development and the level of environmental governance were treated as positive indicators, whereas environmental pressure indicators, including energy intensity, water resource carrying pressure, air quality, and carbon emission intensity, were treated as negative indicators. Reverse coding was used for directional correction, thereby ensuring consistency in the analytical process and rigor in the interpretation of the results. On this basis, dimensionless processing was conducted through standardization, and the entropy weight method was applied to determine indicator weights, thereby improving the scientific validity and comparability of the comprehensive evaluation results. The weights of each indicator and the comprehensive scores were further calculated using the entropy method, with higher values indicating higher levels of development.
First, the coupling degree between digitalization and greening was calculated as follows:
C   =   2 Y 1 Y 2 Y 1 + Y 2 .
Subsequently, a comprehensive coordinated development index T was defined to capture the aggregate status of digitalization and greening. The weights were set as a = b = 0.5, indicating that digitalization and greening were considered equally important:
T   =   a Y 1   +   b Y 2 .
Finally, the coupling coordination development index was calculated to derive the synergy index Couple , reflecting the extent of co-improvement between the two dimensions. A higher index value indicated stronger coordination between digitalization and greening:
Couple   =   C · T .
The level of digital development (Y1) was measured from four dimensions: digital infrastructure, technological support, digital industry, and digital governance. The above indicator system highlighted the foundational roles of information infrastructure, technological innovation capacity, industrial digitalization level, and government governance capacity in shaping digital transformation. Among these, digital infrastructure, as the basic carrier of connectivity in the economic system, was considered to break spatiotemporal constraints and to serve as an important material foundation for the flow of information factors and information transmission. Regional digital infrastructure was evaluated based on mobile communications and the use of network facilities, reflecting the basic conditions under which urban agglomeration construction promotes information network development and the efficient flow of information factors. For technological support, technological innovation capacity and talent reserve levels were selected to capture the role of urban agglomeration construction in knowledge spillovers, talent agglomeration, and innovation-driven development. Digital industry was measured using indicators of digital benefits and technology investment to capture the scale and efficiency of digital industry development. This dimension reflected the role of urban agglomeration construction in promoting the digital economy and facilitating industrial structure transformation. Digital governance was measured based on the frequency of keywords related to digital technologies and applications in government work reports. This dimension reflected government policy attention to digital development and administrative promotion, as well as the implementation intensity and efficiency of urban agglomeration policies.
The level of green development (Y2) was measured from three dimensions: resource conservation, environmental protection, and low-carbon recycling. The construction of this indicator system focused on key dimensions such as resource utilization efficiency, ecological environment quality, and low-carbon development level. Specifically, resource conservation was measured by energy consumption levels and water resource carrying capacity, reflecting the effectiveness of resource-intensive and conservation-oriented development models under urban agglomeration planning. Environmental protection was measured using the greening index and air quality to capture the effects of urban agglomeration construction on ecological environment improvement, pollution control, and ecological civilization construction. Low-carbon recycling was evaluated through carbon emission intensity, the harmless treatment rate of domestic waste, and the sewage treatment rate. This dimension assessed the progress of regional low-carbon development and circular economy practices, while also reflecting the guiding role of urban agglomeration policies in promoting regional green development and sustainable lifestyles.
The indicator system is presented in Table 2.

3.2.2. Core Explanatory Variable

The core explanatory variable was defined as the interaction term Uait, which captured whether an urban agglomeration plan had been approved and the year in which the approval occurred. Among the 11 approved national-level urban agglomerations, the Central Plains Urban Agglomeration was the only plan approved in December. Considering the lag in policy implementation, the policy intervention time point for this agglomeration was incorporated into the following year, while the policy intervention time points for the remaining urban agglomerations were set as the year of approval. Specifically, if city i was approved for urban agglomeration construction in year t, then Uait was assigned a value of 1 from year t onward and 0 otherwise.

3.2.3. Control Variables

To identify the effect of national-level urban agglomeration construction on urban digital-green synergy development more accurately, this study selected the following control variables. The level of economic development (pgdp) was measured by real gross domestic product per capita, which reflected the material foundation and financial capacity supporting the application of digital technologies and the green transformation of cities. Government size (govsize) was measured by the ratio of local government fiscal expenditure to regional GDP. This variable captured the intensity of government commitment to public utilities and policy support, which directly influence infrastructure construction and public service provision and may either promote or constrain the coordinated development of digitalization and greening. The degree of openness (open) was measured by the ratio of total import and export volume to GDP. A higher degree of openness generally indicated that a region was more capable of accessing advanced digital and green technologies from abroad, while competitive pressure from international markets encourages local enterprises to pursue technological upgrading and green transformation. Financial development (finance) was measured by the ratio of outstanding deposits and loans of financial institutions at year-end to GDP. This variable reflects the capacity of the financial system to ease financing constraints, reduce innovation costs, and provide financial support and risk-sharing mechanisms for digital-green synergy. The level of environmental regulation (envreg) was measured using the frequency of keywords related to “environmental protection” in local government work reports. This variable reflected the pressure exerted by local governments’ green development orientation on digital transformation. The level of urbanization (urban) was measured by the share of urban permanent residents in the total city population. This variable captured population agglomeration and economies of scale, which directly affected the depth of regional industrial collaboration and the efficiency of resource allocation, thereby promoting digital-green synergy development.

3.3. Data Description and Descriptive Statistics

The research data were obtained mainly from the China Statistical Yearbook, China City Statistical Yearbook, provincial and municipal statistical yearbooks, CSMAR, CNRDS, EPS, the China Economic and Social Big Data Research Platform, and various municipal government work reports. Since most urban agglomeration plans were introduced around 2015, the sample period was defined as 2003 to 2023 so as to cover the full implementation cycle of all urban agglomeration policies. Linear interpolation was used to address missing values in some variables. Finally, a balanced panel dataset was constructed, covering 280 cities in China from 2003 to 2023, with 5880 city-year observations. Table 3 reports the descriptive statistics of the variables.

3.4. Stylized Facts Analysis

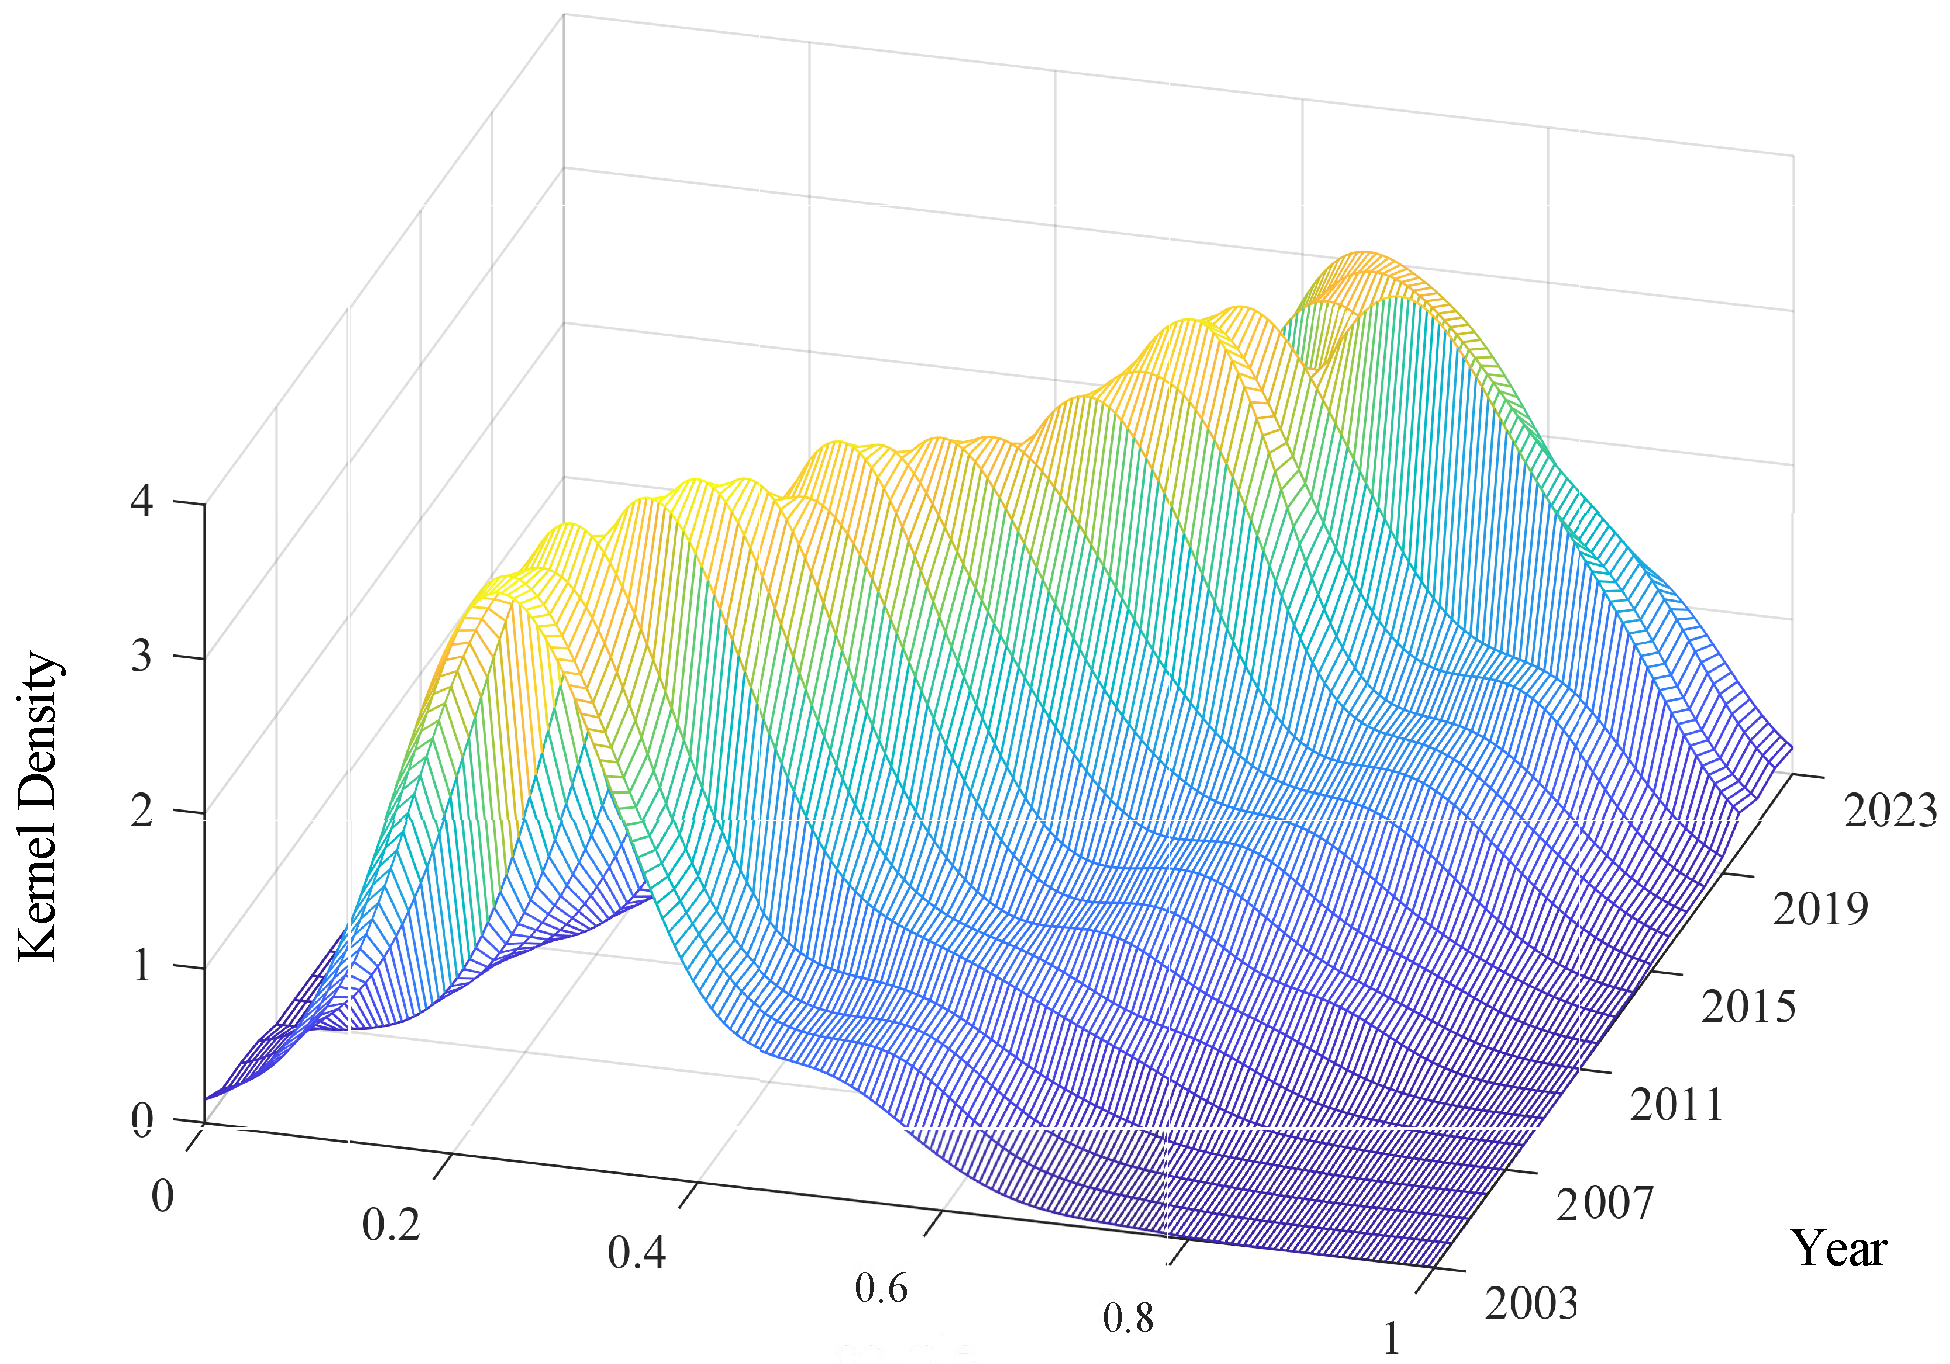
To intuitively illustrate the distribution of digital-green synergy across different time periods, MATLAB R2025a was employed to plot three-dimensional kernel density distributions of digital-green synergy development levels for 280 cities from 2003 to 2023. Figure 3 shows that the kernel density curves generally moved rightward, suggesting a year-by-year improvement in urban digital-green synergy across Chinese cities, with a relatively rapid growth rate. The overall surface exhibited a trend of continuous elevation from the low-value region (left side) to the medium- and high-value regions (right side), with the peak shifting outward year by year and the density peak gradually flattening. This indicates that most cities experienced a significant improvement in digital-green synergy over the two-decade period, accompanied by a more concentrated distribution and a gradual narrowing of inter-city gaps.
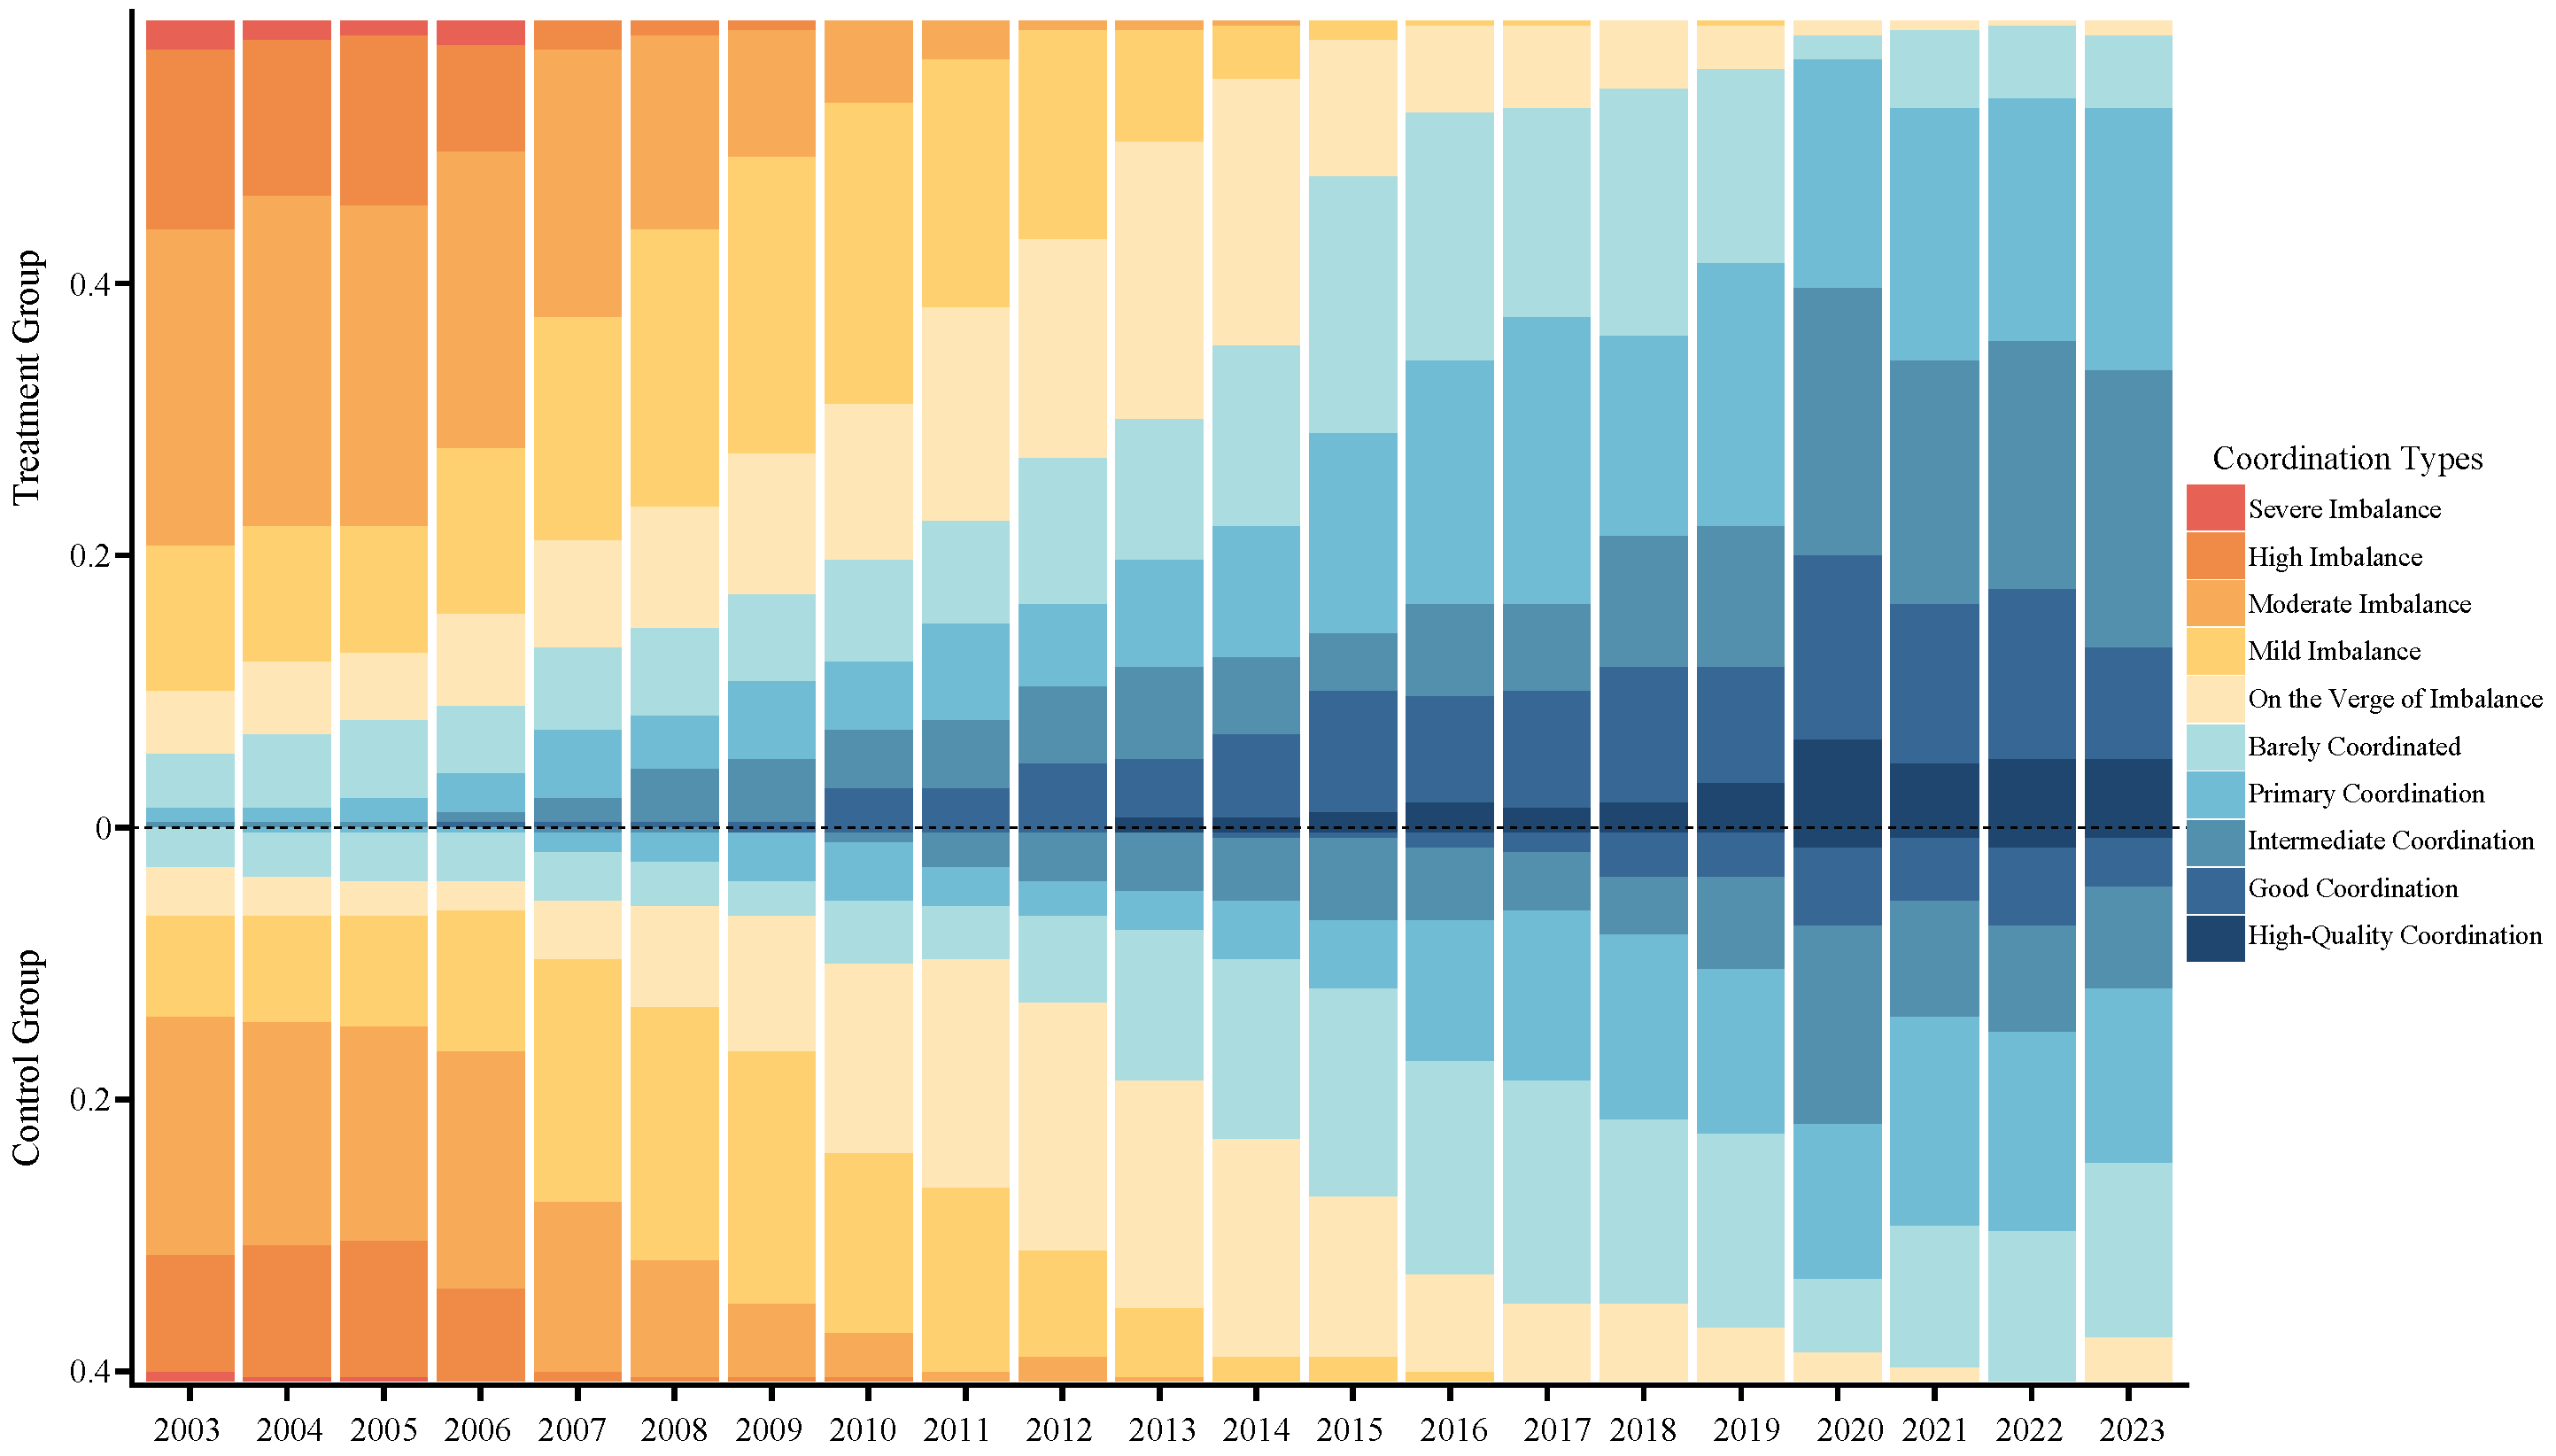
Drawing on the classification criteria for coordination levels and coordinated development degrees proposed by Wang et al. (2021) [28], this study measured the level of urban digital-green synergy in China to characterize the actual effectiveness of its synergistic advancement more accurately. Furthermore, this study plotted the proportions of different coordination types before and after the intervention of urban agglomeration construction policies to trace changes in digital-green synergy over the sample period (see Figure 4). In Figure 4, the region above 0 represents the treatment group, whereas the region below 0 represents the control group, with the two groups arranged symmetrically around 0. The color gradient changes progressively from red-orange, indicating severe imbalance, to dark blue, indicating high-quality coordination. This design allows a direct visual comparison of how the treatment group and the control group differed in their distribution across the ten categories from “severe imbalance” to “high-quality coordination” within the same year. The treatment group showed stronger performance than the control group in both the speed and magnitude of coordination level improvement, as well as in the share of high-level coordination categories. Notably, after the policy was initiated in 2015, the positive effect of urban agglomeration construction on enhancing urban digital-green synergy was preliminarily verified.

4. Empirical Results Analysis

4.1. Baseline Regression

To examine how urban agglomeration construction affects the synergy of digitalization and greening, a fixed-effects model was employed, with city and year fixed effects included and cluster-robust standard errors used. Table 4 reports the baseline regression results. Columns (1) and (2) show that urban agglomeration construction had a significantly positive effect on the synergy (couple) at the 1% level, both before and after control variables were included. This result indicates that urban agglomeration construction effectively promotes the synergistic development of digitalization and greening, thereby supporting Hypothesis H1 of this study.
These results suggest that spatial integration policies implemented through urban agglomerations can generate a significant transformation effect on regional development patterns. Even after city-specific heterogeneity and macro-level time shocks were controlled for, the promoting effect on the synergistic improvement of digital transformation and green development remained significant. Moreover, after control variables were included, the coefficient of the core explanatory variable remained statistically significant with the same sign, further supporting the robustness of the baseline estimates. These results provide empirical evidence for the positive role of urban agglomeration construction, as an important spatial institutional arrangement, in promoting high-quality urban development.

4.2. Parallel Trends Test

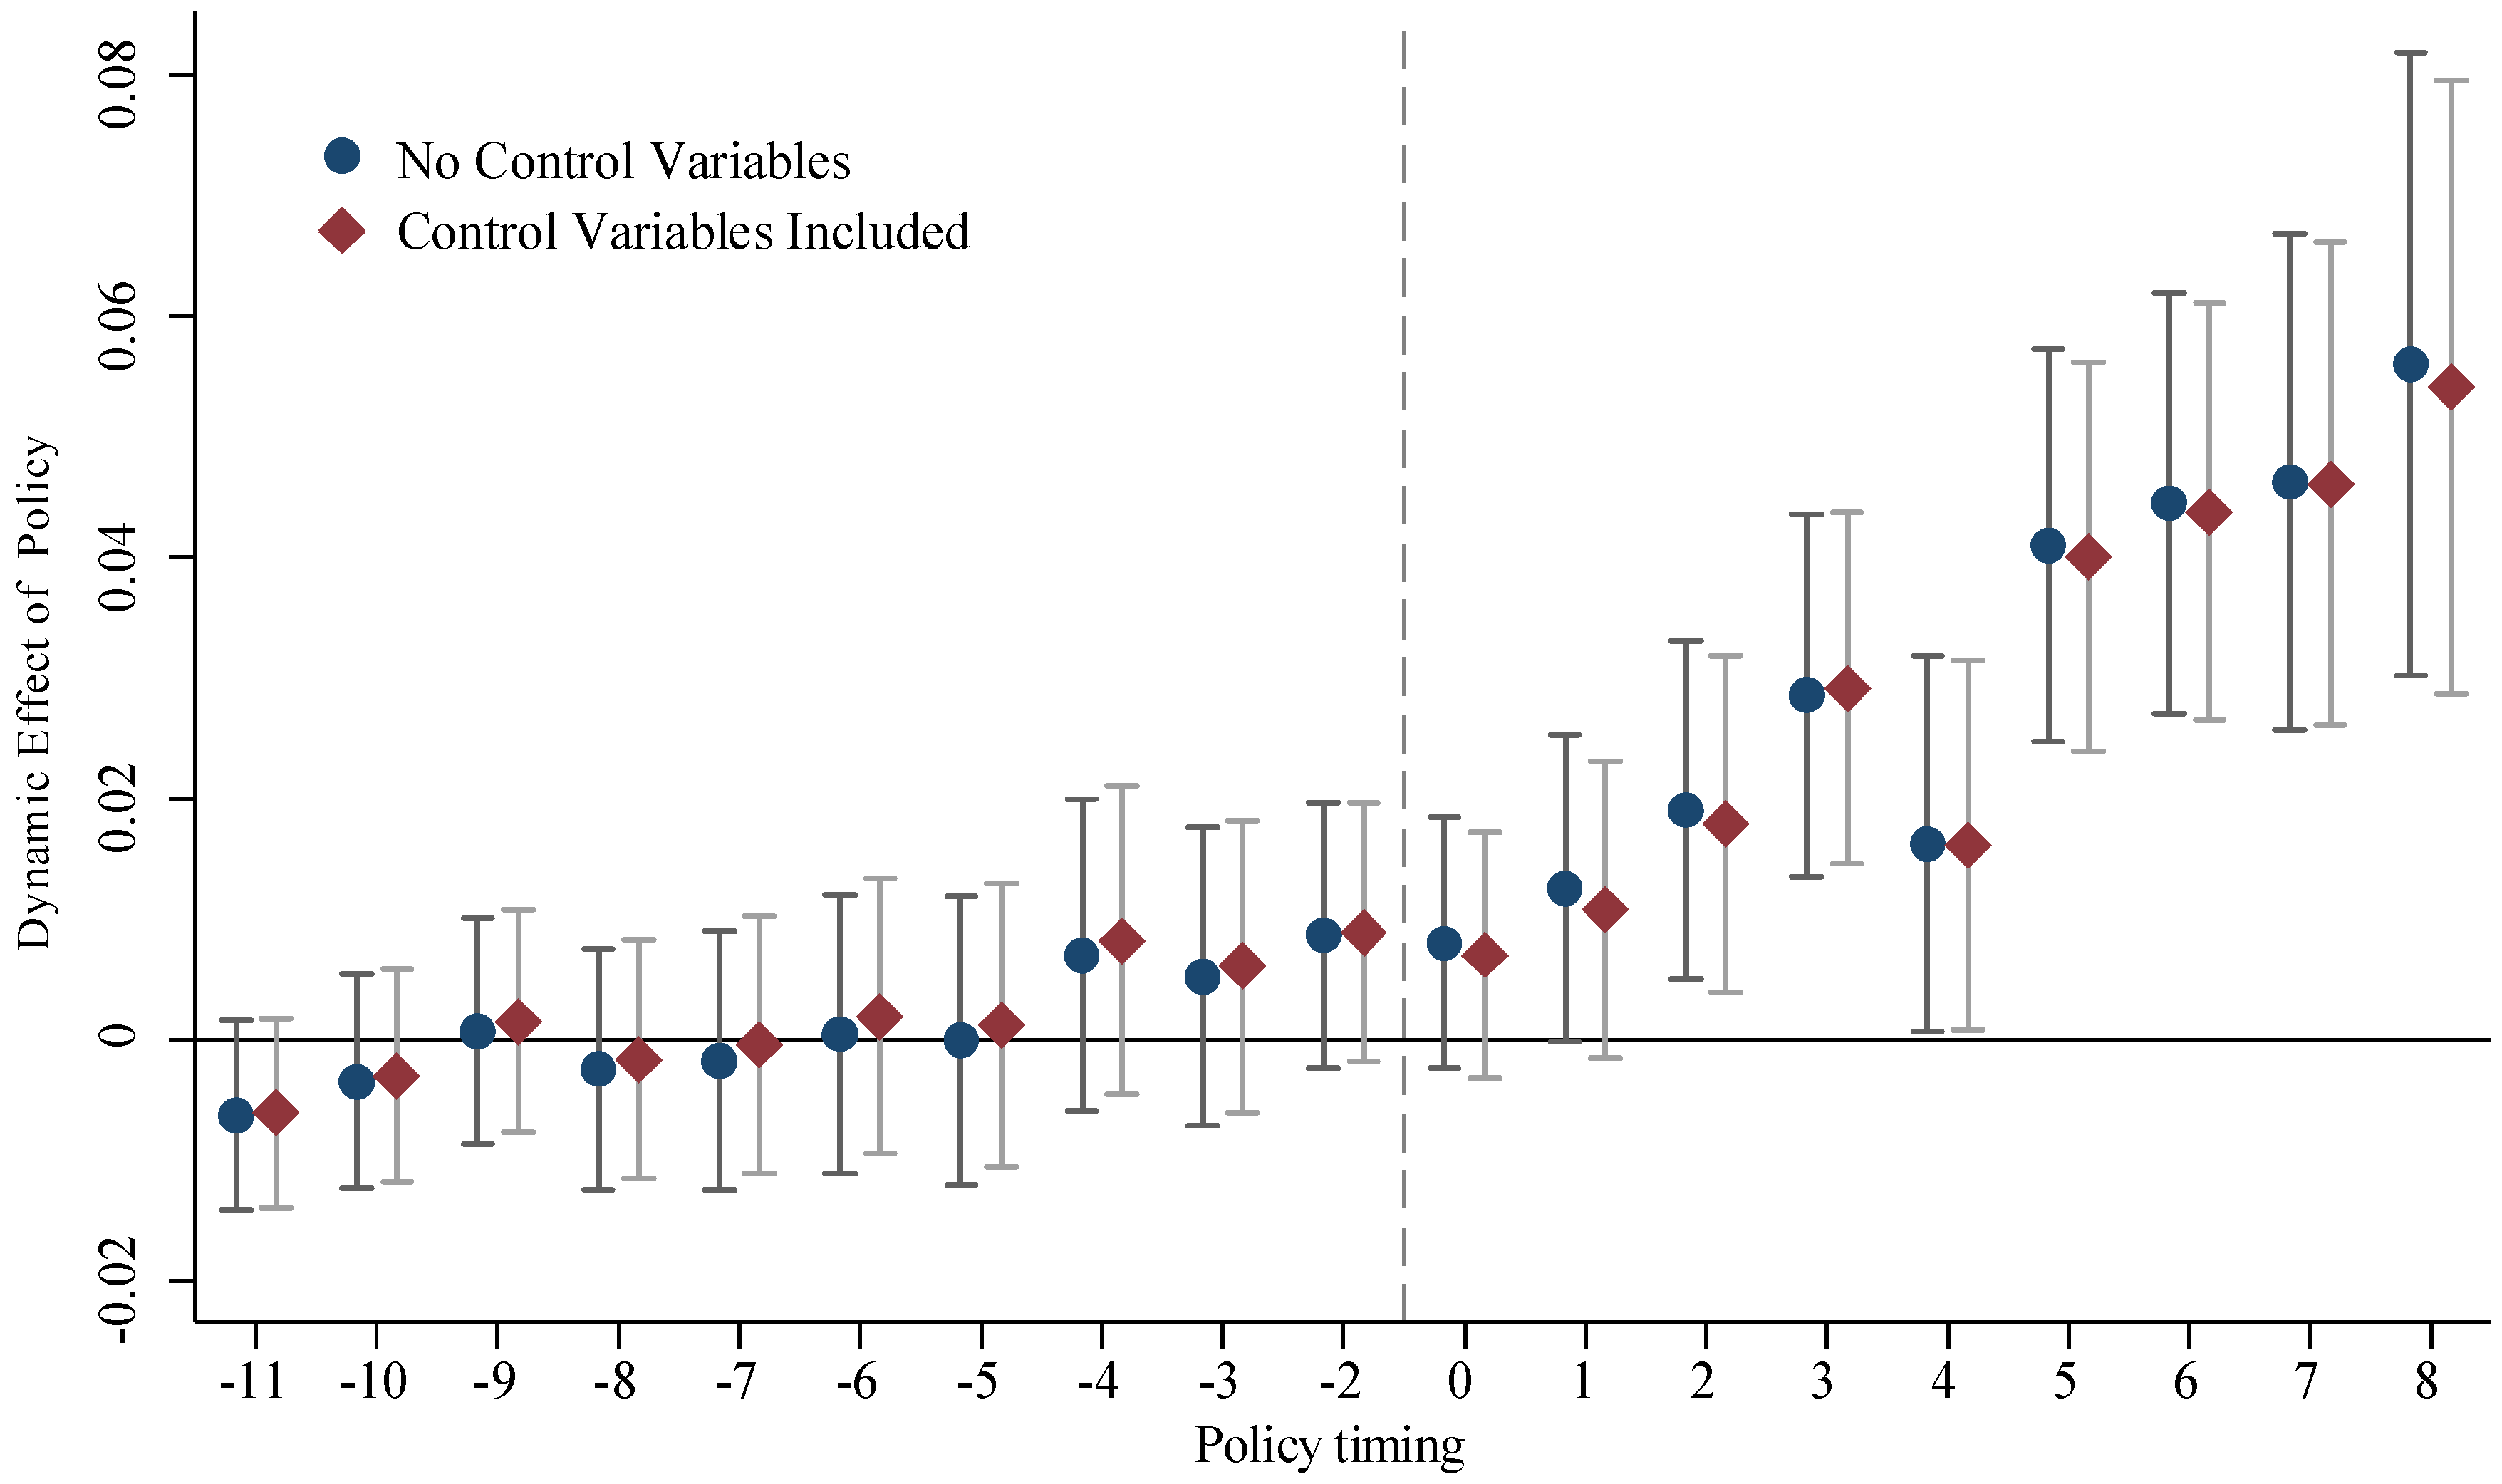
The difference-in-differences (DID) model is valid only when the parallel trends assumption is satisfied. Taking the year before policy implementation as the base period, this study examined the dynamic effects around policy implementation. The effect of urban agglomeration construction on the synergistic development of digitalization and greening was tested under two specifications: one without control variables, and the other with control variables. The results are reported in Figure 5. Under the 95% confidence interval, the estimated coefficients for all pre-policy periods were statistically insignificant and fluctuated around zero, regardless of whether control variables were included. This result indicates that, before policy implementation, no systematic trend difference existed between the treatment and control groups. Therefore, the baseline regression model satisfies the parallel trends assumption. Furthermore, from the dynamic effect results, the effect in the first year after policy implementation was not significant due to implementation lags. However, in subsequent periods, the estimated coefficients gradually increased and reached statistical significance, indicating that the promoting effect of urban agglomeration construction on the synergy is persistent. The results of joint significance tests further support the above conclusions. When no control variables were included, the pre-policy coefficients were jointly insignificant (p = 0.144), whereas the post-policy coefficients were jointly significant (p = 0.000). When control variables were included, the pre-policy coefficients were also jointly insignificant (p = 0.157), while the post-policy coefficients were jointly significant (p = 0.000). These findings indicate that the policy shock of urban agglomeration construction generated a significant dynamic policy effect.

4.3. Endogeneity Treatment

4.3.1. Instrumental Variable Estimation

Although city-year two-way fixed effects were controlled to alleviate omitted variable bias, endogeneity concerns related to time-varying unobserved city characteristics still remained. To address this concern, instrumental variables were constructed from two dimensions: internal linkage strength and external construction conditions associated with urban agglomeration construction. The two-stage least squares (2SLS) method was then employed for estimation.
From the perspective of internal linkage intensity, the approval of national-level urban agglomeration policies was closely associated with the degree of regional integration. Rivers, as important natural transportation corridors, facilitate factor flows within urban agglomerations and strengthen spatial linkages, thereby increasing the probability of policy approval. Moreover, river networks are largely determined by natural endowments and are difficult to be artificially manipulated by policy actors, giving them a strong exogenous character. Dialect similarity reduces cross-city communication costs and strengthens regional cultural identity, thereby improving the basis for regional coordination. Its influence on the level of the synergy, however, operates only indirectly through urban agglomeration policies. Following Nunn and Qian (2014) and Zhang et al. (2024) [29,30], this study constructed instrumental variables by interacting urban agglomeration dialect similarity (ds) and the river density of core cities (rd) with year dummy variables. As reported in Columns (1) and (2) of Table 5, the first-stage coefficients of the instrumental variables were significant at the 1% level. The Kleibergen–Paap rk Wald F statistic was 26.736, exceeding the critical value for weak instrument tests [31], and the K-PLM statistic was significant at the 1% level, indicating strong statistical validity of the instrumental variable specification. From the perspective of external construction conditions, terrain ruggedness, as a key natural constraint, directly affects infrastructure layout costs and the spatial connectivity of urban agglomerations. Flatter terrain is more conducive to the formation of continuous, low-cost transportation networks and industrial spatial structures, thereby increasing the feasibility and implementation intensity of national-level urban agglomeration construction. Because terrain ruggedness (tr) is a long-term stable natural geographic characteristic formed before the urban synergy transformation process during the study period, it is unlikely to directly affect the synergy outcomes. Therefore, its interaction with year dummy variables was used as an instrumental variable. As shown in Column (3) of Table 5, the coefficient of this instrumental variable was significantly negative at the 1% level. In Column (4), the Kleibergen–Paap rk Wald F statistic was 32.944, and the K-PLM statistic was 23.759; both were significant at the 1% level, further confirming the identification validity of the instrumental variable specification.

4.3.2. PSM-DID

However, the designation of policy pilot areas was not entirely random. Whether driven by governmental strategic considerations regarding policy effectiveness or by local governments’ proactive applications based on their own development foundations or performance objectives, sample selection bias may have arisen. To mitigate bias arising from sample self-selection and narrow the systematic differences between the treatment and control groups, a PSM-DID method was employed. All control variables in the baseline regression were included as matching covariates, and propensity scores were calculated using a Logit model. Three matching methods—nearest neighbor matching (1:2), caliper matching, and kernel matching—were used to obtain suitable control group samples that met the common support condition. The matched samples were then reintroduced into the regression analysis, and the models were re-estimated after the common support assumption was verified for the treatment and control groups. The regression results in Columns (2)–(4) of Table 6 indicate that all estimated coefficients were positive and significant at the 1% level, in line with the baseline regression results in Column (1). This suggests that the PSM-DID approach effectively reduced sample self-selection bias in policy assignment, thereby strengthening the causal identification of the effect of urban agglomeration construction on digital-green synergy and improving the credibility of the research findings.

4.3.3. Double/Debiased Machine Learning

To mitigate endogeneity biases caused by functional form misspecification in traditional linear regression, the high dimensionality of control variables, and potential omitted variables, five mainstream machine learning methods—Gradient Boosting, Random Forest, LASSO, Support Vector Machine (SVM), and Elastic Net—were used to conduct robustness checks for the policy effects of urban agglomeration construction. As shown in Table 7, the estimated policy coefficients remained positive with 1% statistical significance in all model specifications. This evidence further supports the robustness of the baseline regression results and enhances the credibility and causal identification rigor of the conclusions drawn in this study.

4.4. Robustness Test

4.4.1. Placebo Test

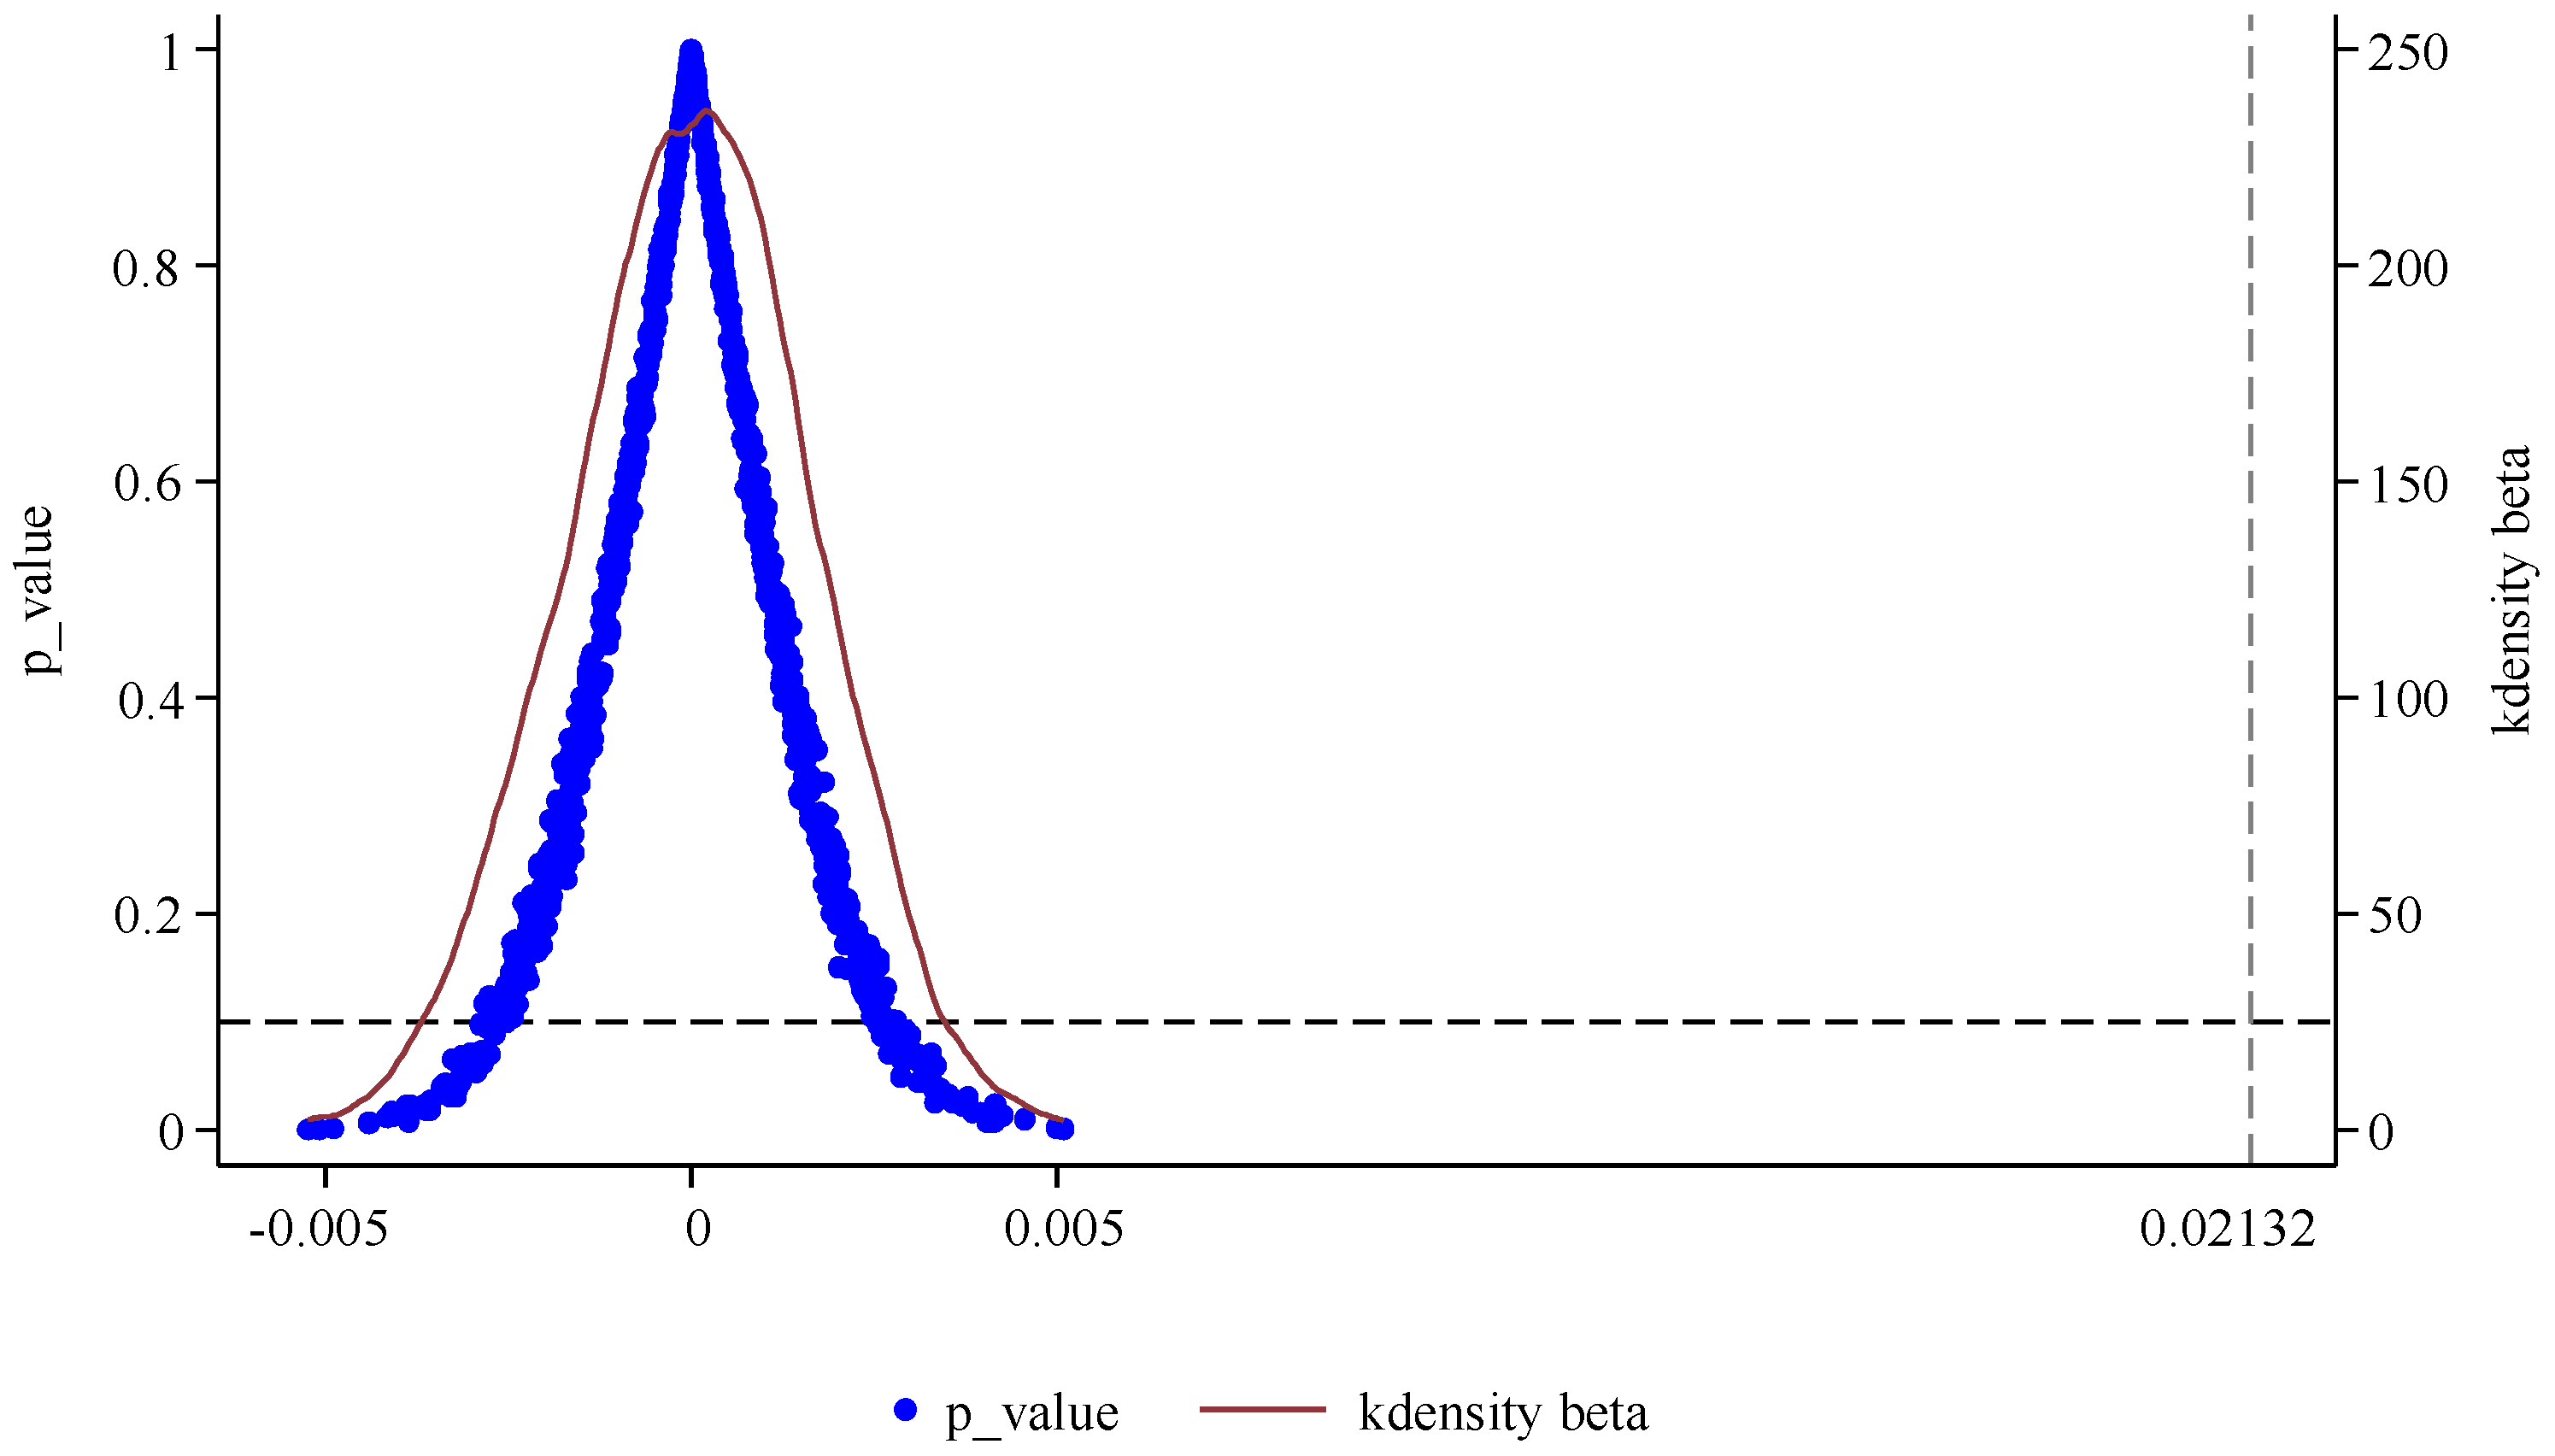
The placebo test was implemented by generating a fictitious treatment group. Specifically, the same number of cities as those covered by actual urban agglomeration construction were randomly drawn and assigned to the pseudo-treatment group, while all other cities served as the control group. The interaction between the pseudo-treatment indicator and the policy dummy variable was then entered into the regression. This random assignment procedure was repeated 1000 times. The distribution of the estimated interaction coefficients was plotted to determine whether the observed effect on digital-green synergy development could be explained by random shocks. If the estimated policy effect was genuine, the actual coefficient should be clearly separated from the center of the random distribution. In Figure 6, the blue scatter points display the pseudo-estimators and their corresponding p-values under random treatment assignment, whereas the red density curve depicts the kernel density of the pseudo-estimators. As can be observed, most pseudo-estimated β coefficients were distributed around zero, and their corresponding p-values were generally greater than 0.1, indicating that randomly assigned policy implementations rarely generated spurious policy effects. Moreover, the true estimated value (0.0213) was far away from the center of the random distribution and located in the extreme right-tail region. This evidence further confirms that the promoting effect of urban agglomeration construction on digital-green synergy was not driven by sample selection or model specification, thereby demonstrating strong internal validity.

4.4.2. Estimation of Heterogeneous Treatment Effects

To further examine whether heterogeneity bias affected the DID estimation results, this study followed Goodman-Bacon (2021) [32] and decomposed the two-way fixed effects estimator into three “2 × 2” DID groups. Table 8 reports the Goodman-Bacon decomposition results. Compared with the other two groups, the “later treatment group vs. earlier treatment group” constituted a “bad control group,” as the pre-treatment trends in this group had already changed, leading to biased estimation results. Although the coefficient was of opposite sign (−0.016), its weight was only 4.7%, exerting a negligible influence on the overall estimate. This finding indicates that the estimated policy effects were not significantly contaminated by heterogeneous dynamic treatment effects, confirming the robustness and reliability of the DID estimates.
Meanwhile, drawing on the approaches proposed by Sun and Abraham (2021), Cengiz et al. (2019), Dube et al. (2023), and Borusyak et al. (2021) [33,34,35,36], heterogeneity-robust estimators were re-estimated using the stacked estimator, the local projection method, the imputation estimator, and the SADID estimator, respectively. The test results are summarized in Table 9. Across the four estimation methods, the regression coefficients were positive and statistically significant, in line with the baseline estimates. These results confirm that the main conclusions were insensitive to the estimation strategy and that the treatment remained strongly robust.

4.4.3. Exclusion of Interference from Other Policies

If urban agglomeration construction overlapped with other policies in the sample period, the research results might have been affected. Seven types of policy pilot programs were identified: high-speed rail opening, Broadband China, new energy, energy conservation and emission reduction, smart cities, comprehensive innovation reform pilot zones, and big data management institution reforms, as presented in Columns (1) through (7), respectively. Given that their implementation periods overlapped with urban agglomeration construction and that they might have influenced the level of urban digital-green synergy, dummy variables for these policies were constructed and incorporated into the regression for robustness testing. As reported in Table 10, the five mainstream core coefficients remained positive with 1% statistical significance. This suggests that other related policies did not interfere with the research conclusions, which continued to demonstrate strong robustness.

4.4.4. Other Robustness Tests

To avoid the interference of time trends in control variables on the identification of policy effects, the approach of Shang and Liu (2025) [37] was adopted, in which non-parallel trends were controlled from three aspects. First, the time trend variable was used to replace the time fixed effects in the baseline model to eliminate the interference of overall time trends. Second, interaction terms between control variables and the time trend variable were introduced into the baseline model to control the trend effects of the control variables. Third, interaction terms between city fixed effects and the time trend variable were included to capture heterogeneity in individual time trends. As shown in Columns (1)–(3) of Table 11, the core policy variable remained positive and statistically significant at the 1% level, indicating that the baseline conclusions were highly robust. Considering that differences in administrative hierarchy might have introduced systematic bias, the analysis was further re-estimated after excluding provincial capital cities and municipalities directly under the central government. Column (4) of Table 11 shows that the policy variable remained positive and statistically significant at the 1% level, with a slightly larger coefficient, suggesting that urban agglomeration construction continued to promote digital-green synergy. Given that policy effects might vary across economic cycles, this study followed Chen et al. (2016) [38] and constructed an economic cycle variable based on the annual GDP growth rate relative to the sample period mean. A value of 1 was assigned to expansionary periods, where the growth rate was above the mean, and 0 was assigned to recessionary periods, where the growth rate was below the mean. The interaction term between the policy variable and the economic cycle variable was then incorporated into the baseline model, with the regression results reported in Column (5) of Table 11. Meanwhile, to exclude interference from major shock events, the sample was re-estimated after excluding the years affected by the 2008 financial crisis and the 2020 COVID-19 pandemic. The results are reported in Column (6) of Table 11. Across all relevant regressions, the coefficients of the policy variable were positive and statistically significant at the 1% level, and the estimated directions remained consistent. These results further verify the robustness of the research conclusions. This indicates that the policy effect of urban agglomeration construction identified in this study was not driven by random sample assignment or model specification bias, but reflected the stable impact of spatial integration policies on the synergistic development of digitalization and greening in cities.

4.5. Mechanism Analysis

4.5.1. Mediating Pathway

The baseline regression results showed that the implementation of urban agglomeration planning significantly promoted the level of digital-green synergy within urban agglomerations. On this basis, the underlying mechanisms through which the policy effects were formed were further explored. To test for the presence of a mediating effect of industrial collaboration ( Ic ), with all other variables consistent with the baseline regression model, the approach of Jiang (2022) [39] for testing mediating variables was followed, and the following model was constructed:
Ic it   =   α   +   β 1 Ua it   +   γ X it   +   μ i   +   λ t   +   ε it .
Drawing on the studies of Liu and Liang (2021) and Zhang and Xiang (2021) [40,41], the level of industrial collaboration within urban agglomerations was measured using the industrial structure similarity index. I c i was calculated as follows:
I c i   =   1     1 2 ( m     1 ) c   =   1 m j   =   1 n R cj     R ¯ j ,
where i represents the urban agglomeration, c denotes a city within urban agglomeration i , with c = 1, 2, …, m , and m represents the total number of cities within the corresponding urban agglomeration. In this study, the maximum value of m was 28 (the urban agglomeration in the middle reaches of the Yangtze River comprised 28 cities). j denotes the industry sector, with j = 1, 2, …, n. Given data availability, only the primary, secondary, and tertiary industries were distinguished, meaning the maximum value of n was 3. R cj represents the share of the value added of industry j in city c relative to the total value added of city c , and R ¯ j is the mean share of the value added of industry j across all cities in urban agglomeration i relative to the total value added of those cities. The value of i c i ranges from 0 to 1, with a smaller value indicating a higher level of industrial collaboration within the urban agglomeration.
In Column (1) of Table 12, the level of industrial collaboration among cities was proxied by the industrial structure similarity index. A smaller value of this index indicated weaker industrial homogeneity among cities and, correspondingly, stronger specialization and industrial complementarity, that is, a higher level of industrial collaboration. The regression results show that urban agglomeration construction had a significantly negative effect on the industrial structure similarity index at the 1% level. This indicates that national-level urban agglomeration construction reduced industrial homogeneity among cities and promoted deeper industrial division and stronger collaboration. This finding is consistent with Hypothesis H2 of this study, suggesting that industrial collaboration is an important intermediate link through which urban agglomeration construction affects the synergy.
Through cross-regional planning coordination and institutional linkages, urban agglomeration construction breaks down the administrative barriers to industrial division and factor flows, enabling the reallocation of upstream and downstream industrial chains over a larger spatial scale. From the perspective of value chain integration, core cities, relying on their advantages in R&D resources, digital platforms, and green technology innovation, export technical solutions, management models, and industrial standards to peripheral cities. Peripheral cities, in turn, embed themselves into the regional value chain division system through industrial transfer, localized adaptation, and scenario-based application, facilitating the cross-regional transmission and integrated application of digital and green technologies through the industrial collaboration network of the urban agglomeration, rather than being confined to diffusion within a single city. From the perspective of regional innovation systems, industrial collaboration also strengthens knowledge spillovers and innovation interactions within the urban agglomeration. Cross-city industrial chain linkages improve resource sharing and technological coordination efficiency among firms and promote interactive learning among industry, academia, and research institutions, enabling the integrated innovation of green low-carbon technologies and digital intelligent technologies through cross-industry and cross-regional collaboration, while reducing transaction costs and information asymmetry between firms. Thus, the urban agglomeration policy does not function solely through spatial agglomeration; rather, by reshaping regional value chain division, strengthening industrial complementarity, and promoting innovation system linkages, it provides a realistic industrial carrier and technology diffusion channel for the synergistic development of digitalization and greening.

4.5.2. Moderating Effects

Drawing on existing studies, this study interacted the difference-in-differences term with two mechanism variables—market segmentation S e g and factor flow w a s   c a l c u l a t e d —and included these interaction terms in the empirical specification. This approach was used to examine the moderating roles of the two mechanisms and to clarify how urban agglomeration construction policies affected digital-green synergy under different conditions. The model was specified as follows:
Couple it   =   α   +   β 2 Ua it   +   β 3 Ua it   ×   pat h it   +   β 4 pat h it   +   γ X it   +   μ i   +   λ t   +   ε it ,
where p a t h i t denotes the mechanism variable. The remaining variables are interpreted consistently with the baseline regression model. β 3 captures how the difference-in-differences term interacts with the mechanism variable. A positive coefficient indicates that urban agglomeration planning strengthens the mechanism variable, whereas a negative coefficient indicates a weakening effect.
(1) Market Segmentation
Considering the economic implications of market segmentation and data availability, this study adopted the “iceberg cost” concept proposed by Sheng and Mao (2011) [42]. The relative price method was then used to quantify market segmentation and to capture institutional barriers affecting cross-regional commodity circulation. The consumer price indices for each city were obtained from city-level statistical yearbooks and statistical bulletins. Given that the categories of price indices varied considerably across the statistical yearbooks of different cities, eight major categories of consumer price indices—including food and clothing—were selected to calculate the absolute value of relative prices, Δ Q ijt k , between city i and other cities j (i j):
| Δ Q i j t k | = l n p i t k p j t k l n p i t 1 k p j t 1 k = l n p i t k p i t 1 k l n p j t k p j t 1 k ,
where p it k and p jt k represent the retail prices of commodity category k in two regions i and j (ij) in period t , respectively, and p it 1 k and p jt 1 k represent the retail prices of commodity category k in the two regions in period t     1 , respectively. The above relative price fluctuations contained fixed effects specific to particular commodities. To eliminate these fixed effects, the mean relative price of commodity category k in year t was subtracted from the relative price between region i and region j, i.e., q ijt k   =   Δ Q ijt k     Δ Q ¯ t k , where q ijt k represents the component of relative price variation, and Δ Q ¯ t k is the mean relative price of commodity category k in year t. On this basis, the variance of relative price fluctuations, Var q ijt k , was calculated, and the average variance across the k categories was used to measure regional market segmentation. Column (2) of Table 12 examines the moderating effect of market segmentation. The interaction coefficient between urban agglomeration construction and market segmentation was negative and statistically significant at the 1% level. This result indicates that a lower degree of market segmentation enables urban agglomeration construction to generate a stronger promoting effect on the synergy. Market segmentation increases the cost of cross-city flows of goods, technologies, and factors, thereby reducing the efficiency of coordinated allocation of digital resources and green technologies within the urban agglomeration. By contrast, market integration unifies access rules, lowers institutional transaction costs, and mitigates local protectionism, thereby facilitating technology diffusion and resource allocation and further strengthening the contribution of urban agglomeration construction to the synergy. Therefore, reducing market segmentation is not only an institutional prerequisite for the effective operation of urban agglomeration construction, but also an important guarantee for advancing coordination between digitalization and greening.
(2) Factor Flows
The factor flows examined in this study primarily included labor flow (Lfm) and capital flow (Cfm). Drawing on Bai et al. (2017) [43], cross-city flows of the two types of factors were measured using a gravity model. Labor flow was significantly influenced by factors such as living costs and public service levels. Accordingly, four dimensions—wage level, housing price, educational resources, and transportation convenience—were selected as core indicators for measuring the attractiveness of labor factors. The calculation formula was specified as follows:
Lfm ij   =   ln labor i   ×   D ij 2   ×   ln ( wage j     wage i )   ×   ln ( price j     price i ) × ,
ln ( traffic j     traffic i )   ×   ln ( education j     education i ) ,
where Lfm represents the number of people flowing from region i to region j; labor denotes the number of employed persons in region i; wage represents the average wage level of employed persons in urban units in the respective region; price represents the regional housing price level, proxied by the mean residential housing sales price [44]; education represents the educational level of the region (considering the pronounced public good attribute of education, the share of regional fiscal expenditure on education in GDP was adopted to measure educational level); traffic represents the transportation convenience of the region (as the most inclusive green mode of transportation, buses provide equal mobility opportunities for talent across all income levels, and the number of buses per 10,000 persons was used as the measure), and where D denotes the geographical distance between regions. Thus, the total flow of people from region i in a given year was expressed as:
Lfm i   =   j   =   1 n Lfm ij .
Regarding capital flow (Cfm), given the “profit-seeking” nature of capital, the selected attractiveness variables included interregional profit level (profit), financial marketization environment (finance), and market vitality (market). Specifically, profit level was proxied by the average profit of industrial enterprises above a designated size, reflecting capital’s sensitivity to regional return potential. Financial marketization environment was captured by new loans issued by regional financial institutions; compared with government-led investment, this indicator better reflected the guiding role of market mechanisms in capital allocation. Market vitality was measured by newly registered enterprises in the region, capturing the capacity of the institutional and business environment to attract capital factors. To capture regional capital input, this study calculated capital stock through the perpetual inventory method using fixed asset investment data.
The moderating effects of factor flow are examined in Columns (3) and (4) of Table 12. The interaction term between labor flow and urban agglomeration construction, as well as the interaction term between capital flow and urban agglomeration construction, was positive with 1% statistical significance. This finding suggests that stronger labor flow and capital flow both strengthened the contribution of urban agglomeration construction to the synergy. Spatial economic theory suggests that labor flow facilitates the diffusion of digital skills, green knowledge, and innovation experience within the urban agglomeration, thereby enhancing regional innovation capacity and technology absorption capacity. Capital flow, in turn, helps direct financial resources toward digital infrastructure, green technology R&D, and low-carbon industrial projects, improving the funding support for digital-green transformation. When labor and capital are able to flow freely and be allocated efficiently within the urban agglomeration, the technological and capital advantages of core cities can be effectively combined with the industrial carrying space and green application scenarios of peripheral cities. These findings suggest that lower market segmentation and stronger factor flows create the institutional and spatial basis through which urban agglomeration construction can more effectively promote the synergy, thereby supporting research hypotheses H3a and H3b.

4.6. Heterogeneity Analysis

4.6.1. Heterogeneity in Inter-Agglomeration Structure

To assess whether urban agglomeration construction produced heterogeneous effects among cities with different development bases, this study grouped cities according to permanent resident population, following the Notification of the State Council on Adjusting the Standards for Urban Size Classification. Specifically, cities with a permanent resident population of 10 million or more were classified as megacities; those with 5 million to less than 10 million were classified as super-large cities; those with 1 million to less than 5 million were classified as large cities; those with 500,000 to less than 1 million were classified as medium-sized cities; and those with less than 500,000 were classified as small cities. To ensure sufficient sample size and regression stability, and following Jiang et al. (2023) [45], medium-sized and small cities were combined into the category of small and medium-sized cities. Table 13 shows that the promoting effect of urban agglomeration construction on digital-green synergy was mainly found in small and medium-sized cities, whereas megacities, supercities, and large cities did not show a statistically significant response. This pattern suggests a clear “gap-filling” role in less developed areas. Small and medium-sized cities, characterized by relatively weaker factor endowments and development foundations, benefited from urban agglomeration construction through integrated planning, which provided them with platforms for co-constructing and sharing digital infrastructure and for collaborative innovation in green technologies. This enabled these cities to undertake industrial activities with higher levels of digitalization and greening under lower environmental constraints, thereby achieving significant improvements in digital-green synergy through the late-mover advantage. In contrast, megacities and supercities already possessed relatively high levels of digitalization and environmental governance, leaving limited marginal benefits from the policy. Additionally, high-density agglomeration in these cities may have induced certain congestion effects, and they faced the dual constraints of insufficient resource agglomeration and limited institutional flexibility, resulting in relatively limited policy benefits.

4.6.2. Heterogeneity in Synergy Effects

To further reveal the differential policy responses of urban agglomeration construction to the synergy across different types of regions, this study followed Yu and Lyu (2023) [46] and applied the Jenks natural breaks method. According to the full-sample distribution of the synergy index, cities were classified into low-synergy, medium-synergy, and high-synergy groups, after which group-wise regression tests were conducted. This method endogenously identifies the optimal grouping thresholds according to the distributional characteristics of the data by reducing within-group variance and enlarging between-group differences, thereby enhancing the objectivity and reproducibility of the grouping procedure. Columns (1)–(3) of Table 14 show that the promoting effect of urban agglomeration construction on digital-green synergy varied significantly across different strata. Specifically, the promoting effect was most pronounced and the coefficient was largest for regions with low synergy levels. For regions with medium synergy levels, the policy effect remained significant but the marginal effect was attenuated, while for regions with high synergy levels, an insignificant negative effect was observed. This finding suggests that urban agglomeration construction played a more prominent role in “filling the gaps” in regions with weaker synergy foundations. Through resource integration, institutional coordination, and co-construction of infrastructure, urban agglomeration construction effectively stimulated the momentum for digital and green transformation. In regions where synergy levels were already high, the marginal policy effect diminished and may even have been suppressed due to resource misallocation, highlighting the governance logic of urban agglomeration policies in promoting coordinated regional development through “downward compatibility and targeted empowerment”.

4.6.3. Government Cooperation Awareness

Drawing on relevant studies on regional collaborative governance and environmental synergy development, this study constructed a lexicon containing 33 keywords by referring to the expressions commonly used in urban agglomeration policy documents and government work reports. The lexicon included terms such as “collaborative development,” “collaborative governance,” “regional cooperation,” “win-win cooperation,” “resource sharing,” and “environmental synergy”. Using Python 3.12.7, this study conducted word segmentation on prefecture-level city government work reports spanning 2003–2023 and calculated the occurrence frequency of these keywords.
The degree of policy attention paid by local governments to promoting regional collaborative development was then used as a proxy measure for government cooperation awareness. On this basis, the sample was divided into high and low government cooperation awareness groups based on the median value of the full-sample government cooperation awareness indicator, and heterogeneity analysis was then conducted.
Columns (4) and (5) in Table 14 provide evidence that the effect of urban agglomeration construction on digital-green synergy became stronger when government cooperation awareness was higher. Specifically, the policy coefficient for the high cooperation awareness group reached 1% statistical significance and was larger than the coefficient estimated for the low cooperation awareness group. These findings suggest that government cooperation awareness strengthened the implementation effectiveness of urban agglomeration construction by improving policy coordination capacity and cross-regional resource allocation efficiency. Through this mechanism, urban agglomeration construction was better able to support the co-construction of digital infrastructure and collaborative green governance, thereby further amplifying its promoting effect on digital-green synergy.

4.6.4. Heterogeneity in Intra-Agglomeration Distance

The policy effects of urban agglomerations may also vary across spatial locations within the agglomeration.
Within the framework of new economic geography, central cities promote surrounding areas through factor agglomeration and spillover effects. However, their radiating influence exhibits clear distance decay, and the “borrowed size” effect also depends on geographical proximity and functional linkages. Based on the definition of central cities in official urban agglomeration planning documents, the treatment group was divided into a proximity group and a peripheral group according to whether the city was adjacent to a central city, and subgroup regressions were conducted.
Columns (6) and (7) of Table 14 report significantly positive policy coefficients for both groups. However, the proximity group had a significantly larger coefficient than the peripheral group. This indicates that the policy dividends of urban agglomeration construction followed a center-to-periphery attenuation pattern, with areas adjacent to central cities benefiting more.

5. Discussion on Individual Treatment Effects Based on the Generalized Random Forest Algorithm

This study further used the generalized random forest (GRF) method developed by Athey et al. (2019) [47] to examine heterogeneous policy effects. Compared with traditional propensity score matching and difference-in-differences methods, GRF provides a robust framework for estimating conditional average treatment effects (CATEs) at the individual level, particularly in settings involving high-dimensional covariates, sample imbalance, and limited time-varying features [47]. After screening for important confounding variables, Figure 7 presents the CATE distributions for the impact of urban agglomeration construction on digital-green synergy under tree numbers of 500, 2000, 4000, and 8000, respectively. The results show that under different specifications, the CATE distributions consistently exhibited a stable unimodal pattern, concentrated predominantly in the positive range, with only a few individuals showing negative effects, indicating that urban agglomeration construction exerted a robust positive impact on digital-green synergy for the majority of cities. At the same time, the CATE distributions did not exhibit significant shifts as the number of trees varied, suggesting that the estimation results possessed good stability and convergence. The slight right skewness of the CATE distributions suggests that certain cities derived greater benefits from the policy, reflecting the structural heterogeneity of urban agglomeration policies across different city characteristics. These findings further reinforce the baseline regression conclusions and support, at the individual level, the overall judgment that urban agglomeration construction promotes digital-green synergy.

6. Conclusions and Policy Implications

Digital-green synergy provides an important basis for reconciling economic growth with resource and environmental constraints and for supporting high-quality development. Using the formally approved national-level urban agglomeration plans of the State Council as a quasi-natural experiment, this study constructed a time-varying difference-in-differences (DID) model based on panel data covering 280 prefecture-level cities from 2003 to 2023. The analysis systematically assessed whether and how urban agglomeration construction affects urban digital-green synergy. The empirical results show that urban agglomeration construction has a significant positive effect on urban digital-green synergy, and this conclusion remains valid after a series of endogeneity treatments and robustness tests. Mechanism analysis reveals the underlying logic through which urban agglomerations influence digital-green synergy, identifying industrial collaboration as a key pathway. By promoting specialization and complementary advantages among cities, urban agglomerations improve factor resource allocation while strengthening coordinated industrial upgrading and cross-regional functional linkages. At the same time, faster factor flows and reduced market segmentation significantly strengthen the synergistic effects of urban agglomeration construction. By lowering barriers to factor flows within urban agglomerations and advancing regional integration, these mechanisms further enhance the contribution of urban agglomerations to digital-green synergy. Heterogeneity analysis also shows that the effects of urban agglomeration policies vary across cities and regions. Compared with megacities, supercities, and large cities, the policy effect is more evident in small and medium-sized cities. This pattern highlights that urban agglomeration construction helps “fill the gaps” by providing stronger support for relatively underdeveloped cities. Additionally, for regions with initially low synergy levels, the promoting effect of urban agglomeration construction was most significant; for regions with medium synergy levels, a positive but marginally diminishing effect was observed; for regions with high synergy levels, no significant effect was found, reflecting the diminishing marginal effects of the policy. Furthermore, intergovernmental cooperation awareness and geographical location also moderate the policy effects. The policy effect was stronger in regions with higher cooperation awareness and in areas located closer to central cities. The individual treatment effect analysis using the generalized random forest (GRF) algorithm further indicates that urban agglomeration construction generates a robust positive impact on urban digital-green synergy. This result strengthens the credibility of the main model findings and offers additional evidence for identifying spatial heterogeneity in urban agglomeration policy effects.
Furthermore, this study confirms that urban agglomeration construction promotes the synergy and situates this evidence within existing research on urban agglomerations, green development, and the digital economy. First, existing studies on urban agglomerations have largely emphasized their roles in economic growth, industrial upgrading, market integration, and innovation performance. In contrast, this study demonstrates that urban agglomeration construction affects not only traditional economic outcomes but also the emerging development goal centered on synergistic transformation between digitalization and greening [2,3,4,5]. This implies that urban agglomerations, as spatial governance instruments, exhibit not only agglomeration economies and scale economies but also an institutional function in promoting development pattern transformation.
Compared with existing studies on green development and the digital economy, this study further extends the spatial-institutional perspective on the synergy. Most existing literature has explained the one-way effects of digitalization or greening from the perspectives of technological progress, industrial structure, policy support, and environmental regulation [1,6,7], while insufficient attention has been paid to how the two can co-evolve within a cross-regional spatial governance framework. This study shows that urban agglomeration construction, through industrial collaboration, factor flow, and market integration, places digital technology diffusion, green technology application, and regional governance coordination within the same spatial network, thereby providing a realistic carrier for digitalization-enabled greening and greening-guided digital transformation. This finding extends the spatial-institutional perspective that has been relatively lacking in digital economy and green development research.
The analysis also shows that the effects of urban agglomeration construction varied substantially across different contexts. The underlying logic is that cities differ in their development foundations, institutional coordination capacity, and spatial accessibility [8,9]. Cities in the small and medium-sized categories, as well as areas with low initial synergy levels, tend to have weaker digital infrastructure, green governance capacity, and industrial collaboration. Therefore, after receiving radiation effects, industrial transfer, and technology spillovers from core cities, they have greater marginal room for improvement, which makes the policy effects more pronounced. Regions with stronger government cooperation awareness are more capable of reducing cross-regional coordination costs and forming mechanisms for policy coordination, standard alignment, and resource sharing, thereby amplifying the synergistic effect of urban agglomeration construction on the synergy. Cities located closer to core cities are more likely to benefit from knowledge spillovers, industrial chain extension, and infrastructure connectivity, thus obtaining stronger policy gains. It is therefore concluded that urban agglomeration construction does not exert a homogeneous effect on all cities; rather, differentiated policy effects are formed under different development foundations and spatial conditions.
Based on the above findings, this study proposes several policy implications for leveraging urban agglomerations to promote digital-green synergy.
First, the industrial layout of urban agglomerations needs to be optimized through “specialization–complementarity synergy”. Leveraging the scientific research resources and digital industry advantages of central cities, innovation growth poles centered on high-end manufacturing and platform-based digital services should be established, driving surrounding small and medium-sized cities to actively undertake industrial segments such as clean energy development, resource recycling, and green supply chain construction, thereby forming a development pattern characterized by upstream–downstream linkages and resource complementarity. At the same time, relying on unified data standards and cross-regional technology sharing platforms, the deep integration of green and digital technologies in design, production, circulation, and recycling should be promoted, accelerating the expansion of digital-green synergy from pilot demonstrations to systematic and large-scale implementation.
Second, the integration of factor markets and the co-construction of infrastructure should be accelerated. Based on unified rules for capital, talent, and data markets, investment and financing channels for cross-regional green finance and special funds for digital industry should be broadened to eliminate cross-regional capital flow barriers and establish a more efficient financial support system. Coordinated planning and the co-construction of cross-regional computing centers, zero-carbon industrial parks, and regional carbon management platforms should be promoted to ensure the synchronous planning and collaborative construction of digital and green infrastructure, breaking down the institutional barriers formed by administrative divisions and fully unleashing the multiplier effects of urban agglomeration construction on digital-green synergy.
Third, differentiated governance strategies by tier and category should be implemented, with refined policy arrangements tailored to cities at different stages of development. For cities in the small and medium-sized categories and peripheral areas with weaker synergy foundations, special fiscal subsidies and demonstration projects should be established to address gaps in technology, capital, and infrastructure. For regions that have already achieved relatively high synergy levels, efforts should focus on deepening institutional innovation and expanding application scenarios, promoting the opening of data interfaces and green innovation platforms in core cities to enhance overall regional marginal benefits. Additionally, a regularized mechanism for intergovernmental cooperation assessment and benefit sharing across urban agglomerations should be established, incorporating regional collaborative emission reduction, factor free flow, and joint investment promotion into the evaluation system. This would stimulate cooperation within urban agglomerations, further strengthen spatial linkage effects, and effectively advance regional digital-green synergy.

Author Contributions

Conceptualization, N.L. and M.S.; methodology, N.L.; software, N.L.; validation, N.L. and M.S.; formal analysis, N.L.; investigation, N.L.; resources, N.L.; data curation, N.L.; writing—original draft preparation, N.L.; writing—review and editing, N.L. and M.S.; visualization, N.L.; supervision, M.S.; project administration, M.S. All authors have read and agreed to the published version of the manuscript.

Funding

This research received no external funding.

Institutional Review Board Statement

Not applicable.

Informed Consent Statement

Not applicable.

Data Availability Statement

The original contributions presented in this study are included in the article. Further inquiries can be directed to the corresponding author.

Acknowledgments

This study forms part of the research outputs of the Henan Provincial Soft Science Project (No. 262400410201), entitled “Research on the Mechanism and Effects of Digitalization and Greening Synergy in Promoting High-Quality Economic Development in Henan Province”. The project provided the research framework for this study but did not provide direct financial support for the present article.

Conflicts of Interest

The authors declare no conflict of interest.

References

  1. Shan, Z.; Han, X.; Huang, D.; Xu, G. Regional Digital–Green Synergy Transformation and Enterprise New Quality Productive Forces. Financ. Res. Lett. 2025, 79, 107349. [Google Scholar] [CrossRef]
  2. Asheim, B.T.; Smith, H.L.; Oughton, C. Regional Innovation Systems: Theory, Empirics and Policy. Reg. Stud. 2011, 45, 875–891. [Google Scholar] [CrossRef]
  3. Zhang, H.; Zhang, K.; Yan, T.; Cao, X. The Impact of Digital Infrastructure on Regional Green Innovation Efficiency through Industrial Agglomeration and Diversification. Humanit. Soc. Sci. Commun. 2025, 12, 220. [Google Scholar] [CrossRef]
  4. Yuan, C.; Ren, S.; Han, Z.; Shang, M.; Hu, Z. Do National Urban Agglomeration Policies Reduce Regional Disparity? Evidence from Nineteen Urban Agglomerations in China. Int. J. Urban Sci. 2024, 1–35. [Google Scholar] [CrossRef]
  5. Li, L.; Ma, S.; Zheng, Y.; Xiao, X. Integrated Regional Development: Comparison of Urban Agglomeration Policies in China. Land Use Policy 2022, 114, 105939. [Google Scholar] [CrossRef]
  6. Zheng, C.; Zhang, X.; Hu, S.; Hao, P. How Does Digital-Green Synergy Affect Key Core Technological Innovation in China? Empirical Evidence from A-Share Listed Companies. Emerg. Mark. Financ. Trade 2025, 1–26. [Google Scholar] [CrossRef]
  7. Zhang, X.; Wu, Z.; Zhang, Z. Can Functional Industrial Policy Promote Digital–Green Synergy Development? Sustainability 2025, 17, 7233. [Google Scholar] [CrossRef]
  8. Hu, P.; Huang, Y.; He, Q.; Zhang, G. Can urban agglomeration policies promote regional economic agglomeration? Evidence from the Yangtze River Economic Belt in China. Environ. Plan. B Urban Anal. City Sci. 2025, 52, 1335–1352. [Google Scholar]
  9. Zhong, X.; Duan, Z.; Liu, C.; Chen, W. Research on the Coupling Mechanism and Influencing Factors of Digital Economy and Green Technology Innovation in Chinese Urban Agglomerations. Sci. Rep. 2024, 14, 5150. [Google Scholar] [CrossRef] [PubMed]
  10. Duan, S.; Chen, H.; Han, J. Green Innovation Quality in Center Cities and Economic Growth in Peripheral Cities: Evidence from the Yangtze River Delta Urban Agglomeration. Systems 2025, 13, 642. [Google Scholar] [CrossRef]
  11. Li, C.; Lin, S.; Wang, Y.; Chen, L. Evaluation of Regional Integration in Urban Agglomeration Area from the Perspective of Urban Symbiosis. Sustain. Cities Soc. 2024, 105, 105338. [Google Scholar] [CrossRef]
  12. Ma, S.; Cai, Y.; Xie, D.; Zhang, X.; Zhao, Y. Towards Balanced Development Stage: Regulating the Spatial Pattern of Agglomeration with Collaborative Optimal Allocation of Urban Land. Cities 2022, 126, 103645. [Google Scholar] [CrossRef]
  13. Tang, J.; Li, H. China’s Urban Agglomerations: Surging from Industrial-Led to Innovation-Driven. China Econ. Rev. 2025, 95, 102449. [Google Scholar] [CrossRef]
  14. Ma, S.; Li, L.; Zuo, J.; Gao, F.; Ma, X.; Shen, X.; Zheng, Y. Regional Integration Policies and Urban Green Innovation: Fresh Evidence from Urban Agglomeration Expansion. J. Environ. Manag. 2024, 354, 120485. [Google Scholar] [CrossRef]
  15. Wang, C.; Ye, Y.; Huang, Z. Synergistic Development in the Guangdong-Hong Kong-Macao Greater Bay Area: Index Measurement and Systematic Evaluation Based on Industry-Innovation-Infrastructure-Institution Perspectives. J. Clean. Prod. 2024, 434, 140093. [Google Scholar] [CrossRef]
  16. Wang, S.; Hou, D.; Liu, Y.; Wang, X.; Dai, L. Can Urban Agglomeration Policy Improve the Innovation Efficiency of Cities in China? Reg. Stud. 2024, 12, 58. [Google Scholar] [CrossRef]
  17. Chen, S.; Du, Y.; Liu, Y. Regional Integration and Urban Green and Low-Carbon Development: A Quasi-Natural Experiment Based on the Expansion of the Yangtze River Delta Urban Agglomeration. Sustainability 2025, 17, 3621. [Google Scholar] [CrossRef]
  18. Du, W.; Liu, X.; Liu, Y.; Xie, J. Digital Economy and Carbon Emission Efficiency in Three Major Urban Agglomerations of China: A U-Shaped Journey Towards Green Development. J. Environ. Manag. 2025, 373, 123571. [Google Scholar] [CrossRef]
  19. Luo, K.; Lee, C.C.; Zeng, M.; Hu, W.Z.M. How Does the Development of Digital Economy in Central Cities Promote the Coordinated Development of Regions? Evidence from 19 Urban Agglomerations in China. Technol. Soc. 2024, 78, 102674. [Google Scholar] [CrossRef]
  20. Tang, J.; Li, W.; Hu, J.; Ren, Y. Can Government Digital Transformation Improve Corporate Energy Efficiency in Resource-Based Cities? Energy Econ. 2025, 141, 108043. [Google Scholar] [CrossRef]
  21. Li, X.; Chen, M.; Wang, J. Evaluation, Spatiotemporal Characteristics and Influencing Factors of Collaborative Development Between Digitalization and Greenization at the Provincial Level. Econ. Geogr. 2024, 44, 126–134. [Google Scholar]
  22. Gao, H.; Shi, W. The Scale Paradox of Digital Economy: Revealing Its Dual Effects on Manufacturing Chain Resilience in China’s Urban Agglomerations. Financ. Res. Lett. 2025, 89, 109282. [Google Scholar] [CrossRef]
  23. Zeng, G.; Hu, Y.; Zhong, Y. Industrial agglomeration, spatial structure and economic growth: Evidence from urban cluster in China. Heliyon 2023, 9, e19963. [Google Scholar] [CrossRef]
  24. Wang, X.; Pan, M. Will Connectedness Between Urban Areas Foster Cooperation? The Impact of Urban Agglomerations on Open Innovation. Q. Rev. Econ. Financ. 2025, 103, 102037. [Google Scholar] [CrossRef]
  25. Zhang, F.; Qiu, L.; Wang, H.; Zhi, Y.; Fang, Z.; Zhong, Y.; Wang, T. Realizing Individual Positioning in Urban Agglomeration under Competitive-Cooperative Networks of Niche. Environ. Dev. Sustain. 2025, 1–26. [Google Scholar] [CrossRef]
  26. Li, S.; Xiang, N.; Shu, C.; Xu, F. Unveiling the Industrial Synergy Optimization Pathways in Beijing-Tianjin-Hebei Urban Agglomeration Based on Water-Energy-Carbon Nexus. J. Environ. Manag. 2025, 376, 124528. [Google Scholar] [CrossRef]
  27. Wu, K.; Yang, S.; Li, Y.; Zhu, M. The Effect of Regional Integration on the Efficiency of Enterprise Resource Allocation. Sci. Rep. 2025, 15, 708. [Google Scholar] [CrossRef]
  28. Wang, S.J.; Kong, W.; Ren, L.; Zhi, D.D. Research on Misuses and Modification of Coupling Coordination Degree Model in China. J. Nat. Resour. 2021, 36, 793–810. [Google Scholar] [CrossRef]
  29. Nunn, N.; Qian, N. US food aid and civil conflict. Am. Econ. Rev. 2014, 104, 1630–1666. [Google Scholar] [CrossRef]
  30. Zhang, X.; Zhuo, J.; Mao, Y.; Zhai, D. How Urban Agglomeration Construction Promotes Inter-City Joint Innovation: An Explanation from the Perspective of Multidimensional Proximity. China Soft Sci. 2024, 13, 87–97. [Google Scholar]
  31. Stock, J.H.; Yogo, M. Asymptotic Distributions of Instrumental Variables Statistics with Many Instruments. In Identification and Inference for Econometric Models; Cambridge University Press: Cambridge, UK, 2005; pp. 109–120. [Google Scholar]
  32. Goodman-Bacon, A. Difference-in-Differences with Variation in Treatment Timing. J. Econom. 2021, 225, 254–277. [Google Scholar] [CrossRef]
  33. Sun, L.; Abraham, S. Estimating Dynamic Treatment Effects in Event Studies with Heterogeneous Treatment Effects. J. Econom. 2021, 225, 175–199. [Google Scholar] [CrossRef]
  34. Cengiz, D.; Dube, A.; Lindner, A.; Zipperer, B. The Effect of Minimum Wages on Low-Wage Jobs. Q. J. Econ. 2019, 134, 1405–1454. [Google Scholar] [CrossRef]
  35. Dube, A.; Girardi, D.; Jordà, O.; Taylor, A.M. A Local Projections Approach to Difference-in-Differences Event Studies; Working Paper 2023-12; Federal Reserve Bank of San Francisco: San Francisco, CA, USA, 2023. [Google Scholar]
  36. Borusyak, K.; Jaravel, X.; Spiess, J. Revisiting Event-Study Designs: Robust and Efficient Estimation. Rev. Econ. Stud. 2024, 91, 3253–3285. [Google Scholar] [CrossRef]
  37. Shang, H.; Liu, J. The Impact of National-Level Urban Agglomeration Planning Implementation on the Economic Growth of Non-Central Cities. Reform 2025, 1, 138–154. [Google Scholar]
  38. Chen, D.; Kong, M.; Wang, H. “You Scratch My Back, I’ll Scratch Yours”: Economic Cycles and Tax Avoidance of State-Owned Enterprises. Manag. World 2016, 5, 46–63. [Google Scholar]
  39. Jiang, T. Mediating Effects and Moderating Effects in Causal Inference. China Ind. Econ. 2022, 5, 100–120. [Google Scholar]
  40. Liu, X.; Liang, C. Comprehensive Evaluation and Spatiotemporal Evolution Characteristics of Integration Level of Urban Agglomerations in China: An Analysis of the Impact of Urban Agglomeration Scale. J. Lanzhou Univ. Soc. Sci. 2021, 49, 49–61. [Google Scholar]
  41. Zhang, Y.; Xiang, B. Measurement of Integration Level of Urban Agglomerations and Its Economic Growth Effect: Empirical Evidence from China’s Ten Major Urban Agglomerations. Macroecon. Res. 2021, 12, 136–148+158. [Google Scholar]
  42. Sheng, B.; Mao, Q. Trade Openness, Domestic Market Integration, and Inter-Provincial Economic Growth in China: 1985–2008. World Econ. 2011, 11, 44–66. [Google Scholar]
  43. Bai, J.; Wang, Y.; Jiang, F.; Li, J. R&D Factor Flow, Spatial Knowledge Spillover and Economic Growth. Econ. Res. J. 2017, 52, 109–123. [Google Scholar]
  44. Chen, J.; Sun, H.; Han, R.; Cai, Z. The Emerging Driving Force of Inclusive Green Growth in Chinese Cities: The Role of Digital Intelligence. Appl. Econ. 2025, 1–18. [Google Scholar] [CrossRef]
  45. Jiang, R.; Yang, S.; Wen, J. High-Speed Rail and High-Quality Economic Development: Mechanisms and Effects. Nankai Econ. Stud. 2023, 7, 70–89. [Google Scholar]
  46. Yu, Y.; Lyu, L. Spatial Pattern of Knowledge Innovation Function among Chinese Cities and Its Influencing Factors. J. Geogr. Sci. 2023, 33, 1161–1184. [Google Scholar] [CrossRef]
  47. Athey, S.; Tibshirani, J.; Wager, S. Generalized random forests. Ann. Stat. 2019, 47, 1148–1178. [Google Scholar] [CrossRef]
Figure 1. Theoretical Analytical Framework for Urban Agglomeration Construction Promoting Digital-Green Synergy.
Sustainability 18 04659 g001
Figure 2. Distribution of Treatment and Control Groups Across Policy Implementation Years.
Sustainability 18 04659 g002
Figure 3. Kernel Density of Urban Digital-Green Synergy, 2003–2023.
Sustainability 18 04659 g003
Figure 4. Evolution of Policy Intervention in Digital-Green Synergy and Proportions of Coordination Types, 2003–2023.
Sustainability 18 04659 g004
Figure 5. Parallel Trends Test.
Sustainability 18 04659 g005
Figure 6. Placebo Test.
Sustainability 18 04659 g006
Figure 7. Treatment Effect Distribution of Urban Agglomeration Construction on Digital-Green Synergy.
Sustainability 18 04659 g007
Table 1. Approval Status of Urban Agglomeration Development Plans.
No.Approved National Urban AgglomerationApproval DateDocument Issuance Date
1Middle Reaches of the Yangtze River26 March 201513 April 2015
2Beijing–Tianjin–Hebei30 April 20159 June 2015
3Harbin–Changchun23 February 20167 March 2016
4Chengdu–Chongqing12 April 201627 April 2016
5Yangtze River Delta22 May 20161 June 2016
6Central Plains28 December 201629 December 2016
7Beibu Gulf20 January 201710 February 2017
8Guanzhong Plain9 January 20182 February 2018
9Hohhot–Baotou–Ordos–Yulin5 February 201827 February 2018
10Lanzhou–Xining22 February 201813 March 2018
11Guangdong–Hong Kong–Macao Greater Bay Area18 February 201918 February 2019
Table 3. Descriptive Statistics of Variables.
CategoryVariableObservationsMeanStandard DeviationMinimumMaximum
Dependent Variablecouple58800.5180.1970.0120.965
Explanatory VariableUa58800.2170.4120.0001.000
Control Variablespgdp588016.0501.4567.56520.806
govsize58800.1780.1110.0332.074
open58800.2240.527−0.67417.176
finance58802.4061.3020.41921.297
envreg58800.9690.5700.00012.199
urban58800.3770.2030.0751.000
Table 2. Evaluation Indicator System for Urban Digitalization and Greening Levels.
Target LayerPrimary IndicatorSecondary IndicatorMeasurementDirectionWeight
DigitalizationDigital InfrastructureMobile Communication DeploymentNumber of mobile phone subscribers (10,000 households)/Year-end total population (10,000 persons)Positive0.0768227
Network Facility UsageNumber of internet users (10,000 households)/Year-end total population (10,000 persons)Positive0.1202782
Technological SupportTechnological InnovationNumber of patent grants (items)/Year-end total population (10,000 persons)Positive0.2459006
Talent ReserveNumber of students enrolled in regular higher education institutions (10,000 persons)/Year-end total population (10,000 persons)Positive0.1661478
Digital IndustryDigital Outputln (Total telecommunications business (10,000 Yuan)/GDP (10,000 Yuan))Positive0.1380505
Technology InvestmentLocal government expenditure on science (10,000 Yuan)/Year-end total population (10,000 persons)Positive0.1250281
Digital GovernanceGovernment Digital AttentionObtained through textual analysis of government work reports, counting keywords related to “digital,” primarily involving “digital technology” and “digital application” (121 terms in total)Positive0.1277721
GreeningResource ConservationEnergy Consumption LevelTotal energy consumption/GDP, tons of standard coal per 10,000 Yuan of GDPNegative0.1332636
Water Resource Carrying CapacityTotal water supply (10,000 tons)/Year-end total population (10,000 persons)Negative0.1019011
Environmental ProtectionGreening IndexGreen coverage rate in built-up areas (%)Positive0.1484586
Air QualityAnnual average PM2.5 concentration (μg/m3)Negative0.2085370
Low-Carbon Circular EconomyCarbon Emission IntensityTons of CO2/10,000 Yuan, total CO2 emissions/GDPNegative0.1326217
Harmless TreatmentHarmless treatment rate of domestic waste (%)Positive0.1563976
Sewage Treatment RateVolume of sewage treated/Total volume of sewage generatedPositive0.1188204
Table 4. Baseline Regression Results.
Variable(1)(2)
CoupleCouple
Ua0.023 ***0.021 ***
(0.006)(0.006)
pgdp 0.010 **
(0.005)
govsize 0.039
(0.033)
open 0.008
(0.006)
finance −0.007 ***
(0.002)
envreg 0.002
(0.002)
urban 0.020
(0.024)
_cons0.513 ***0.346 ***
(0.001)(0.081)
City Fixed EffectsYESYES
Year Fixed EffectsYESYES
Observations58805880
R20.9380.939
Note: **, and *** indicate statistical significance at the 5% and 1% levels, respectively. Robust standard errors clustered at the city level are reported in parentheses.
Table 5. Endogeneity Treatment Results.
Variable2SLS First Stage2SLS Second Stage2SLS First Stage2SLS Second Stage
(1)(2)(3)(4)
UaCoupleUaCouple
Ua 0.084 ** 0.0535 **
(0.039) (0.0245)
ds × rd × year0.034 ***
(0.007)
tr × year −0.0129 ***
(0.0022)
_cons−24.68 *** 16.9474 ***
(4.653) (3.0526)
City Fixed EffectsYESYESYESYES
Year Fixed EffectsYESYESYESYES
Observations5880588058805880
R20.642 0.6488
Kleibergen–Paap rk Wald F statistic 26.736 32.9441
(16.380) (16.380)
Kleibergen–Paap LM statistic 22.609 23.759
[0.000] [0.000]
Note: Values in brackets [ ] represent the p-values of the LM test, and values in angle brackets ( ) represent the Stock-Yogo 10% critical values. ** and *** indicate statistical significance at the 5% and 1% levels, respectively. Robust standard errors clustered at the city level are reported in parentheses.
Table 6. PSM-DID Robustness Test.
Variable(1)
Baseline Regression
(2)
Nearest Neighbor (1:2)
(3)
Caliper Matching
(4)
Kernel Matching
Ua0.021 ***0.020 ***0.022 ***0.022 ***
(0.006)(0.006)(0.006)(0.006)
_cons0.346 ***0.215 **0.320 ***0.320 ***
(0.081)(0.102)(0.087)(0.087)
City Fixed EffectsYESYESYESYES
Year Fixed EffectsYESYESYESYES
Observations5880.0003844.0005845.0005853.000
R20.9350.9370.9360.936
Note: **, and *** indicate statistical significance at the 5% and 1% levels, respectively. Robust standard errors clustered at the city level are reported in parentheses.
Table 7. Double/Debiased Machine Learning Test Results.
Variable(1)
Gradient Boosting
(2)
Random Forest
(3)
LASSO
(4)
SVM
(5)
Elastic Net
Ua0.034 ***0.035 ***0.020 ***0.027 ***0.020 ***
(0.003)(0.004)(0.003)(0.003)(0.003)
_cons0.0000.000−0.000−0.003 ***0.000
(0.001)(0.001)(0.001)(0.001)(0.001)
Control VariablesYESYESYESYESYES
City Fixed EffectsYESYESYESYESYES
Year Fixed EffectsYESYESYESYESYES
Observations58805880588058805880
Note: *** indicates statistical significance at the 1% level. Robust standard errors clustered at the city level are reported in parentheses.
Table 8. Goodman-Bacon Decomposition Test Results.
“2 × 2” DID Group TypeEstimated CoefficientWeight
Treatment group vs. never-treated group0.02580770.860119
Earlier treatment group vs. later treatment group0.01424250.092719
Later treatment group vs. earlier treatment group−0.01609980.047161
Table 9. Heterogeneity-Robust Estimator Test Results.
Estimation MethodEstimated Coefficient
SADID0.045 ***
(0.010)
Stacked Estimator0.021 ***
(0.006)
Local Projection Method0.041 ***
(0.012)
Imputation Estimator0.024 ***
(0.006)
Note: *** indicates statistical significance at the 1% level. Robust standard errors clustered at the city level are reported in parentheses.
Table 10. Robustness Test Results Excluding Interference from Other Policies.
Variable(1)(2)(3)(4)(5)(6)(7)
Ua0.019 ***0.022 ***0.021 ***0.023 ***0.020 ***0.025 ***0.023 ***
−0.005−0.006−0.006−0.006−0.006−0.006(0.006)
_cons0.336 ***0.355 ***0.346 ***0.357 ***0.348 ***0.346 ***0.362 ***
−0.078−0.08−0.081−0.08−0.082−0.082(0.076)
Control VariablesYESYESYESYESYESYESYES
City Fixed EffectsYESYESYESYESYESYESYES
Year Fixed EffectsYESYESYESYESYESYESYES
Observations5880588058805880588058805880
R20.9370.9360.9350.9360.9360.9360.936
Note: *** indicates statistical significance at the 1% level. Robust standard errors clustered at the city level are reported in parentheses.
Table 11. Other Robustness Test Results.
Variable(1)(2)(3)(4)(5)(6)
Controlling for Non-Parallel TrendsExcluding Provincial Capitals and MunicipalitiesExcluding Economic Cycle EffectsExcluding Major Disruption Years
Ua0.0175 ***0.0165 ***0.0224 ***0.0315 ***0.0175 ***0.0216 ***
(0.0050)(0.0047)(0.0055)(0.0072)(0.006)(0.0053)
year0.0203 ***
(0.0010)
Control × yearNoYesNo
id × yearNoNo0.0000 **
(0.0000)
Ua × Economic Cycle 0.0111 ***
0.003
_cons−40.6948 ***0.3988 ***−3.5203 **0.4052 ***0.352 ***0.3668 ***
(1.8488)(0.0540)(1.5041)(0.0700)(0.081)(0.0740)
Control VariablesYESYESYESYESYESYES
City Fixed EffectsYESYESYESYESYESYES
Year Fixed EffectsNOYESYESYESYESYES
Observations588058805880352858805320
R20.9280.9440.9390.9350.9390.940
Note: ** and *** indicate statistical significance at the 5% and 1% levels, respectively. Robust standard errors clustered at the city level are reported in parentheses.
Table 12. Mechanism Analysis Regression Results.
VariableIc
(1)
Couple
(2)
Couple
(3)
Couple
(4)
Ua−0.081 ***0.022 ***0.021 ***0.023 ***
(0.028)(0.006)(0.006)(0.005)
Ua × Seg −0.071 ***
(0.024)
Seg 0.032 *
(0.018)
Ua × Lfm 0.001 ***
(0.000)
Lfm −0.001
(0.001)
Ua × Cfm 0.000 ***
(0.000)
Cfm −0.000 **
(0.000)
_cons4.727 ***0.346 ***0.352 ***0.363 ***
(0.635)(0.081)(0.081)(0.078)
Control VariablesYESYESYESYES
City Fixed EffectsYESYESYESYES
Year Fixed EffectsYESYESYESYES
Observations5880588058805880
R20.9080.9390.9390.940
Note: *, **, and *** indicate statistical significance at the 10%, 5%, and 1% levels, respectively. Robust standard errors clustered at the city level are reported in parentheses.
Table 13. Heterogeneity Test Results for Inter-Agglomeration Structure.
Variable(1)
Megacities
(2)
Supercities
(3)
Large Cities
(4)
Small and Medium-Sized Cities
Ua0.00182−0.01030.003830.0400 ***
(0.00988)(0.0106)(0.00933)(0.00680)
_cons−0.246−0.5570.472 ***0.335 ***
(0.611)(0.595)(0.131)(0.0837)
Control VariablesYESYESYESYES
City Fixed EffectsYESYESYESYES
Year Fixed EffectsYESYESYESYES
Observations14729417223717
R20.9770.9520.9470.925
Note: *** indicates statistical significance at the 1% level. Robust standard errors clustered at the city level are reported in parentheses.
Table 14. Heterogeneity Test Results.
Variable(1)(2)(3)(4)(5)(6)(7)
Low SynergyMedium SynergyHigh SynergyHigh Government Cooperation AwarenessLow Government Cooperation AwarenessProximity GroupPeripheral Group
Ua0.021 ***0.014 ***−0.0030.032 ***0.013 **0.028 ***0.015 **
(0.008)(0.004)(0.006)(0.008)(0.007)(0.007)(0.007)
_cons0.352 ***0.420 ***0.500 ***0.443 ***0.515 ***0.364 ***0.413 ***
(0.082)(0.073)(0.062)(0.198)(0.065)(0.088)(0.078)
Control VariablesYESYESYESYESYESYESYES
City Fixed EffectsYESYESYESYESYESYESYES
Year Fixed EffectsYESYESYESYESYESYESYES
Observations1945238315522898298242004158
R20.8050.7150.8850.9360.9460.9300.938
Note: **, and *** indicate statistical significance at the 5%and 1% levels, respectively. Robust standard errors clustered at the city level are reported in parentheses.
Disclaimer/Publisher’s Note: The statements, opinions and data contained in all publications are solely those of the individual author(s) and contributor(s) and not of MDPI and/or the editor(s). MDPI and/or the editor(s) disclaim responsibility for any injury to people or property resulting from any ideas, methods, instructions or products referred to in the content.