Article

An Affordance-Based Model for the Sustainable Design of Community Food Waste Management Facilities
1
School of Industrial Design, Hubei University of Technology, Wuhan 430068, China
2
School of Art & Design, Hubei University of Technology, Wuhan 430068, China
*
Author to whom correspondence should be addressed.
Sustainability 2026, 18(10), 4658; https://doi.org/10.3390/su18104658
Submission received: 29 March 2026 / Revised: 30 April 2026 / Accepted: 2 May 2026 / Published: 7 May 2026
(This article belongs to the Section Sustainable Products and Services)

Abstract

This study addresses the issue of low utilization rates of kitchen waste recycling facilities in urban communities in China, caused by insufficient resident willingness to participate and sustain use, which impacts the efficiency of urban sustainability. A system design model based on Affordance Theory (BIATM) is proposed to connect behavioral insights with design and decision-making tools to improve sustainability outcomes at the local level. This model includes three components: demand classification identification based on Affordance Theory and the Best-Worst Method (BWM), hierarchical relationship analysis of demand based on Interpretive Structural Modeling (ISM), and design transformation based on Affordance Theory. Unlike prior approaches that apply affordance theory as a post hoc interpretive lens, this study operationalizes it as a generative design tool integrated with quantitative demand analysis. The results indicate that “Incentive Feedback” is a key factor directly influencing sustained participation behavior, while factors related to hygiene anxiety and operational burden are fundamental constraints to residents’ use of community kitchen waste recycling facilities. This suggests that the explicit needs expressed by residents may not always be the primary drivers of behavior initiation and continuity. To promote sustained participation, design should prioritize meeting deeper behavioral prerequisites and maintain participation through superficial feedback and incentive mechanisms. Based on this analysis, three design proposals for community kitchen waste management facilities are presented, evaluated, and optimized using the TOPSIS method. The study concludes that combining demand weight identification, hierarchical relationship analysis, and Affordance Theory translation effectively supports the identification, design generation, and optimization of community kitchen waste management facilities, providing a methodological reference for the sustainable design of public service facilities and practical pathways for promoting resident participation in community resource recycling.

1. Introduction

With the acceleration of urbanization and changes in residents’ lifestyles, the amount of municipal solid waste continues to grow, and the requirements for waste classification and resource utilization have become more demanding [1,2]. As an important organic component of urban waste, food waste typically has characteristics such as high moisture content, easy spoilage, and high organic matter content. Improper disposal not only affects end-management efficiency but also leads to environmental pollution and resource waste [3,4]. If properly recycled and processed, food waste can realize its potential as a resource. Research indicates that food waste can be converted into fertilizers through resource recovery methods like composting and further used as organic nitrogen fertilizer or soil improver in agricultural production [5,6].
Regarding the recycling and reutilization of community food waste, existing studies have begun to explore decentralized processing, community composting, and the construction and application of community-based processing facilities, aiming to promote on-site reduction and resource utilization of food waste at the community level [7,8]. These facilities have certain technical and environmental feasibility, but their actual operational effectiveness depends not only on the equipment itself but also heavily on residents’ participation rate, willingness to use, and sustained waste disposal behavior [9].
The proper disposal of food waste at the source by residents plays a critical role in promoting resource recycling and enhancing urban governance [10]. The key lies in how to translate the experiential factors involved throughout the entire process of food waste disposal into actionable design strategies [11], so as to address the problem that residents have access to facilities but lack the willingness to use them, and to sustain continued usage behavior in everyday life.
Existing studies have explored this challenge from the perspectives of community governance, resident participation, and behavioral guidance. Case studies indicate that the success of community waste management is not only determined by the proper installation of facilities but also by multi-party collaboration, the completeness of supporting mechanisms, and the foundation of resident participation [12,13,14]. Further studies suggest that, in addition to policy constraints, the formation and maintenance of waste sorting and proper disposal behaviors among residents are influenced by various factors such as infrastructure conditions, governance perceptions, and community atmosphere [15,16,17]. This highlights that, within the context of sustainable community governance, public food waste management facilities are no longer confined to simple collection or temporary storage functions. Instead, these facilities are increasingly tasked with more complex governance requirements, including classification guidance, hygiene assurance, resource conversion, and the facilitation of public participation [18,19,20,21,22].
In research on waste sorting behavior, Linda et al., based on the Theory of Planned Behavior (TPB) and related behavioral models, demonstrated that factors such as attitude, social norms, and perceived behavioral control influence both the intention and behavior of waste sorting [23]. Although TPB has proven highly effective in explaining the formation of pro-environmental behaviors, a significant intention–behavior gap persists in the context of waste sorting. This gap suggests that merely assessing individuals’ intentions is insufficient for ensuring sustained behavior, as resource limitations or perceived physical and cognitive burdens may impede the translation of intentions into consistent actions [2].
However, while existing research has identified numerous influencing factors, it typically treats them as parallel “demands” or “influencing variables”, failing to discuss the causal relationships among them and rarely distinguishing between those that represent residents’ explicitly expressed preferences and those that serve as the underlying prerequisites for the initiation and continuation of behavior. In the context of community public facility design, if design resources are allocated solely based on explicitly high-weighted demands, it may prioritize surface features like incentives, feedback, or visual appeal, neglecting the foundational conditions that truly determine whether residents are willing to approach, engage with, and complete the disposal behavior. This can lead to an inability to maintain residents’ long-term willingness to use the facilities, affecting the sustainable management of food waste in the community. In addition, although the studies mentioned above are valuable for explaining why waste-sorting behavior occurs, they are not sufficient on their own for guiding the design of public food waste management facilities. Even when facility-related factors are considered, they are usually treated as general external conditions such as convenience or accessibility, rather than being translated into concrete design attributes that users can directly perceive, understand, and act upon in public settings.
Therefore, the research question addressed in this study is: In the design of community-based food waste management systems, do the key needs explicitly expressed by residents correspond to the fundamental drivers of behavioral initiation and maintenance? If the two are not consistent, how should design identify this discrepancy and systematically translate it into facility design strategies that promote sustained participation? Addressing this issue, this study proposes the BIATM based on the affordance theory. It identifies residents’ needs from an affordance perspective, introduces BWM to prioritize residents’ explicit needs, and further uses ISM to reveal the hierarchical relationships and causal pathways among these needs. Finally, drawing on Affordance theory, the structural differences among these needs are translated into facility design elements, forming actionable design rules across five dimensions: physical, perceptual, cognitive, functional, and social. The contribution of this study does not lie in proposing yet another explanatory framework, but in combining behavioral insights with multi-criteria decision-making tools in the perspective of affordance to improve sustainable outcomes at the local level. Pilar Buil and Olga Roger Loppacher propose that waste recycling is an environmental behavior highly correlated with human behavior, requiring the construction of a “dialogue space” between people and the environment through design analysis to further narrow the gap between residents’ willingness to recycle and their actual actions [24], suggests that affordance design helps promote the occurrence of behavior.
Finally, this study applies the model to the design of community food waste management facilities and uses TOPSIS for solution evaluation and optimization to preliminarily verify the potential of this model in promoting sustained resident participation in resource recycling. By combining the exploration of participation behavior motivations with design and decision-making tools, the study aims to improve sustainable development outcomes at the local level and provide practical pathways for guiding and maintaining residents’ participation in the sustainable resource recycling process.

2. Materials and Methods

2.1. Affordance Theory

Affordance Theory was first proposed by American ecological psychologist James Gibson in the 1970s and later introduced to the design field by cognitive psychologist Donald Norman. Its core idea is that objects or elements in the environment not only have their inherent functions but also provide cues for users to operate and utilize them. These “cues” or “opportunities” guide users’ behavior based on the environment and individual characteristics. Building on this, Hartson further proposed four types of affordances—physical, perceptual, cognitive, and functional—clarifying how design features support users in perceiving, understanding, operating, and completing tasks, thus providing a solid foundation for interaction design [25].
Affordance Theory emphasizes how objects and the environment shape the possibilities for human behavior through actionable cues, meaning that the characteristics of objects and human cognition work together to stimulate the spontaneity and sustainability of user behavior [26]. This theory provides a systematic analytical tool for the design of community support services, enabling design to activate or inhibit the possibility of specific behaviors, thereby supporting the flexible adjustment and sustainable development of community services. Duffy and Verges (2009) [27] validated this theory through a study on the design of public recycling container openings. They found that designing more directional openings significantly increased the correct disposal rate by users [27]. This finding suggests that the form of the container itself can serve as a behavioral cue, influencing users’ disposal behavior. Nemat et al. also noted that the shape, size, texture, and visual communication properties of objects affect users’ judgments about their categorization methods, indicating that people’s classification judgments are directly influenced by the affordances of design [28]. Both studies emphasize the core concept of Affordance Theory, where objects provide “behavioral cues” to users, showing that design optimization can effectively guide user behavior. In theoretical research, Hsiao et al. proposed an affordance evaluation model from the design methodology perspective, demonstrating that affordances can be broken down, evaluated, and used for product optimization [29]. These studies suggest that applying Affordance Theory to food waste management product design can effectively guide user behavior through clear perceptual and operational cues, enabling users to complete food waste disposal without significantly deviating from their existing cognition and daily habits, thus promoting the initiation and sustainability of food waste disposal behavior among community residents.
For public facilities designed for community food waste management, whether residents are willing to approach the facility, able to complete waste disposal smoothly, capable of quickly understanding the logic of use, and willing to continue participating after receiving feedback correspond to behavioral support needs at different levels. In community public settings, user behavior is influenced not only by the availability of facilities but also by factors such as the social context, visibility to others, and relevant feedback [30,31]. Therefore, building upon Hartson’s theoretical framework, this study incorporates social affordance as an additional analytical dimension, defining it as the potential for social interaction or socializing provided by the physical environment, focus on whether facilities can serve as mediators of social activities to facilitate the emergence of behavior and sustain the willingness to participate [32]. Taking into account the context of community public facility use, this study categorizes the affordance theory into two main levels—physical and psychological—and further breaks them down into five dimensions: physical, perceptual, cognitive, functional, and social, as shown in Table 1.
These five dimensions of affordance represent distinct design attributes and are directly related to residents’ experience of using the facilities. Therefore, guided by these five dimensions, this study will develop a system of design need indicators and translate these need indicators into specific design elements.

2.2. Best-Worst Method

The Best–Worst Method (BWM), proposed by the Dutch scholar Rezaei, is a quantitative weighting method that enables the relative importance of different needs to be represented intuitively through pairwise comparisons among indicators [33]. In new product development research, Li et al. introduced fuzzy BWM into the screening process for new product ideas to determine weights across dimensions such as finance, marketing, engineering, manufacturing, and sustainability, thereby supporting front-end concept selection [34]. Ayvaz-Çavdaroğlu et al. likewise applied BWM to assign weights to dimensions of smart service quality, with the aim of identifying the more critical quality attributes in service experience design [35]. The above studies demonstrate that BWM can effectively support the identification of priority needs and inform design decision-making in the context of complex requirements. However, these studies primarily focus on general consumer products or market-oriented services, whereas community food waste management facilities are public service products embedded in residents’ everyday life contexts, characterized by stronger publicness, shared use, and behavioral guidance. Their design not only affects functional performance but also shapes residents’ attitudes, willingness to participate, and sustained disposal behavior. In this context, different needs not only vary in importance but may also have hierarchical relationships and interact with one another. Since BWM alone is insufficient to reveal the underlying interaction mechanisms among needs or the prerequisite conditions for their realization, Interpretive Structural Modeling (ISM) is introduced to conduct a hierarchical analysis of key needs.

2.3. Interpretive Structural Modeling

Interpretive Structural Modeling (ISM) is a method for addressing the relational structure of complex systems. Proposed by Warfield in 1974, it can decompose and construct relationship matrices among multiple factors, thereby identifying core factors by clarifying their internal influence relationships. Praneashram et al. applied ISM in smart product development to conduct a structured analysis of 20 factors affecting smart product development and identified key driving factors, including data storage and the facilitation of user interaction [36]. Liu et al. introduced an ISM approach based on online reviews in consumer satisfaction research, constructing a hierarchical structure of how product and service attributes influence satisfaction to reveal the pathways through which different attributes interact [37]. By using ISM to further supplement the interrelationships among factors identified through the Best–Worst Method (BWM), more accurate design priorities can be obtained.

2.4. Research Framework

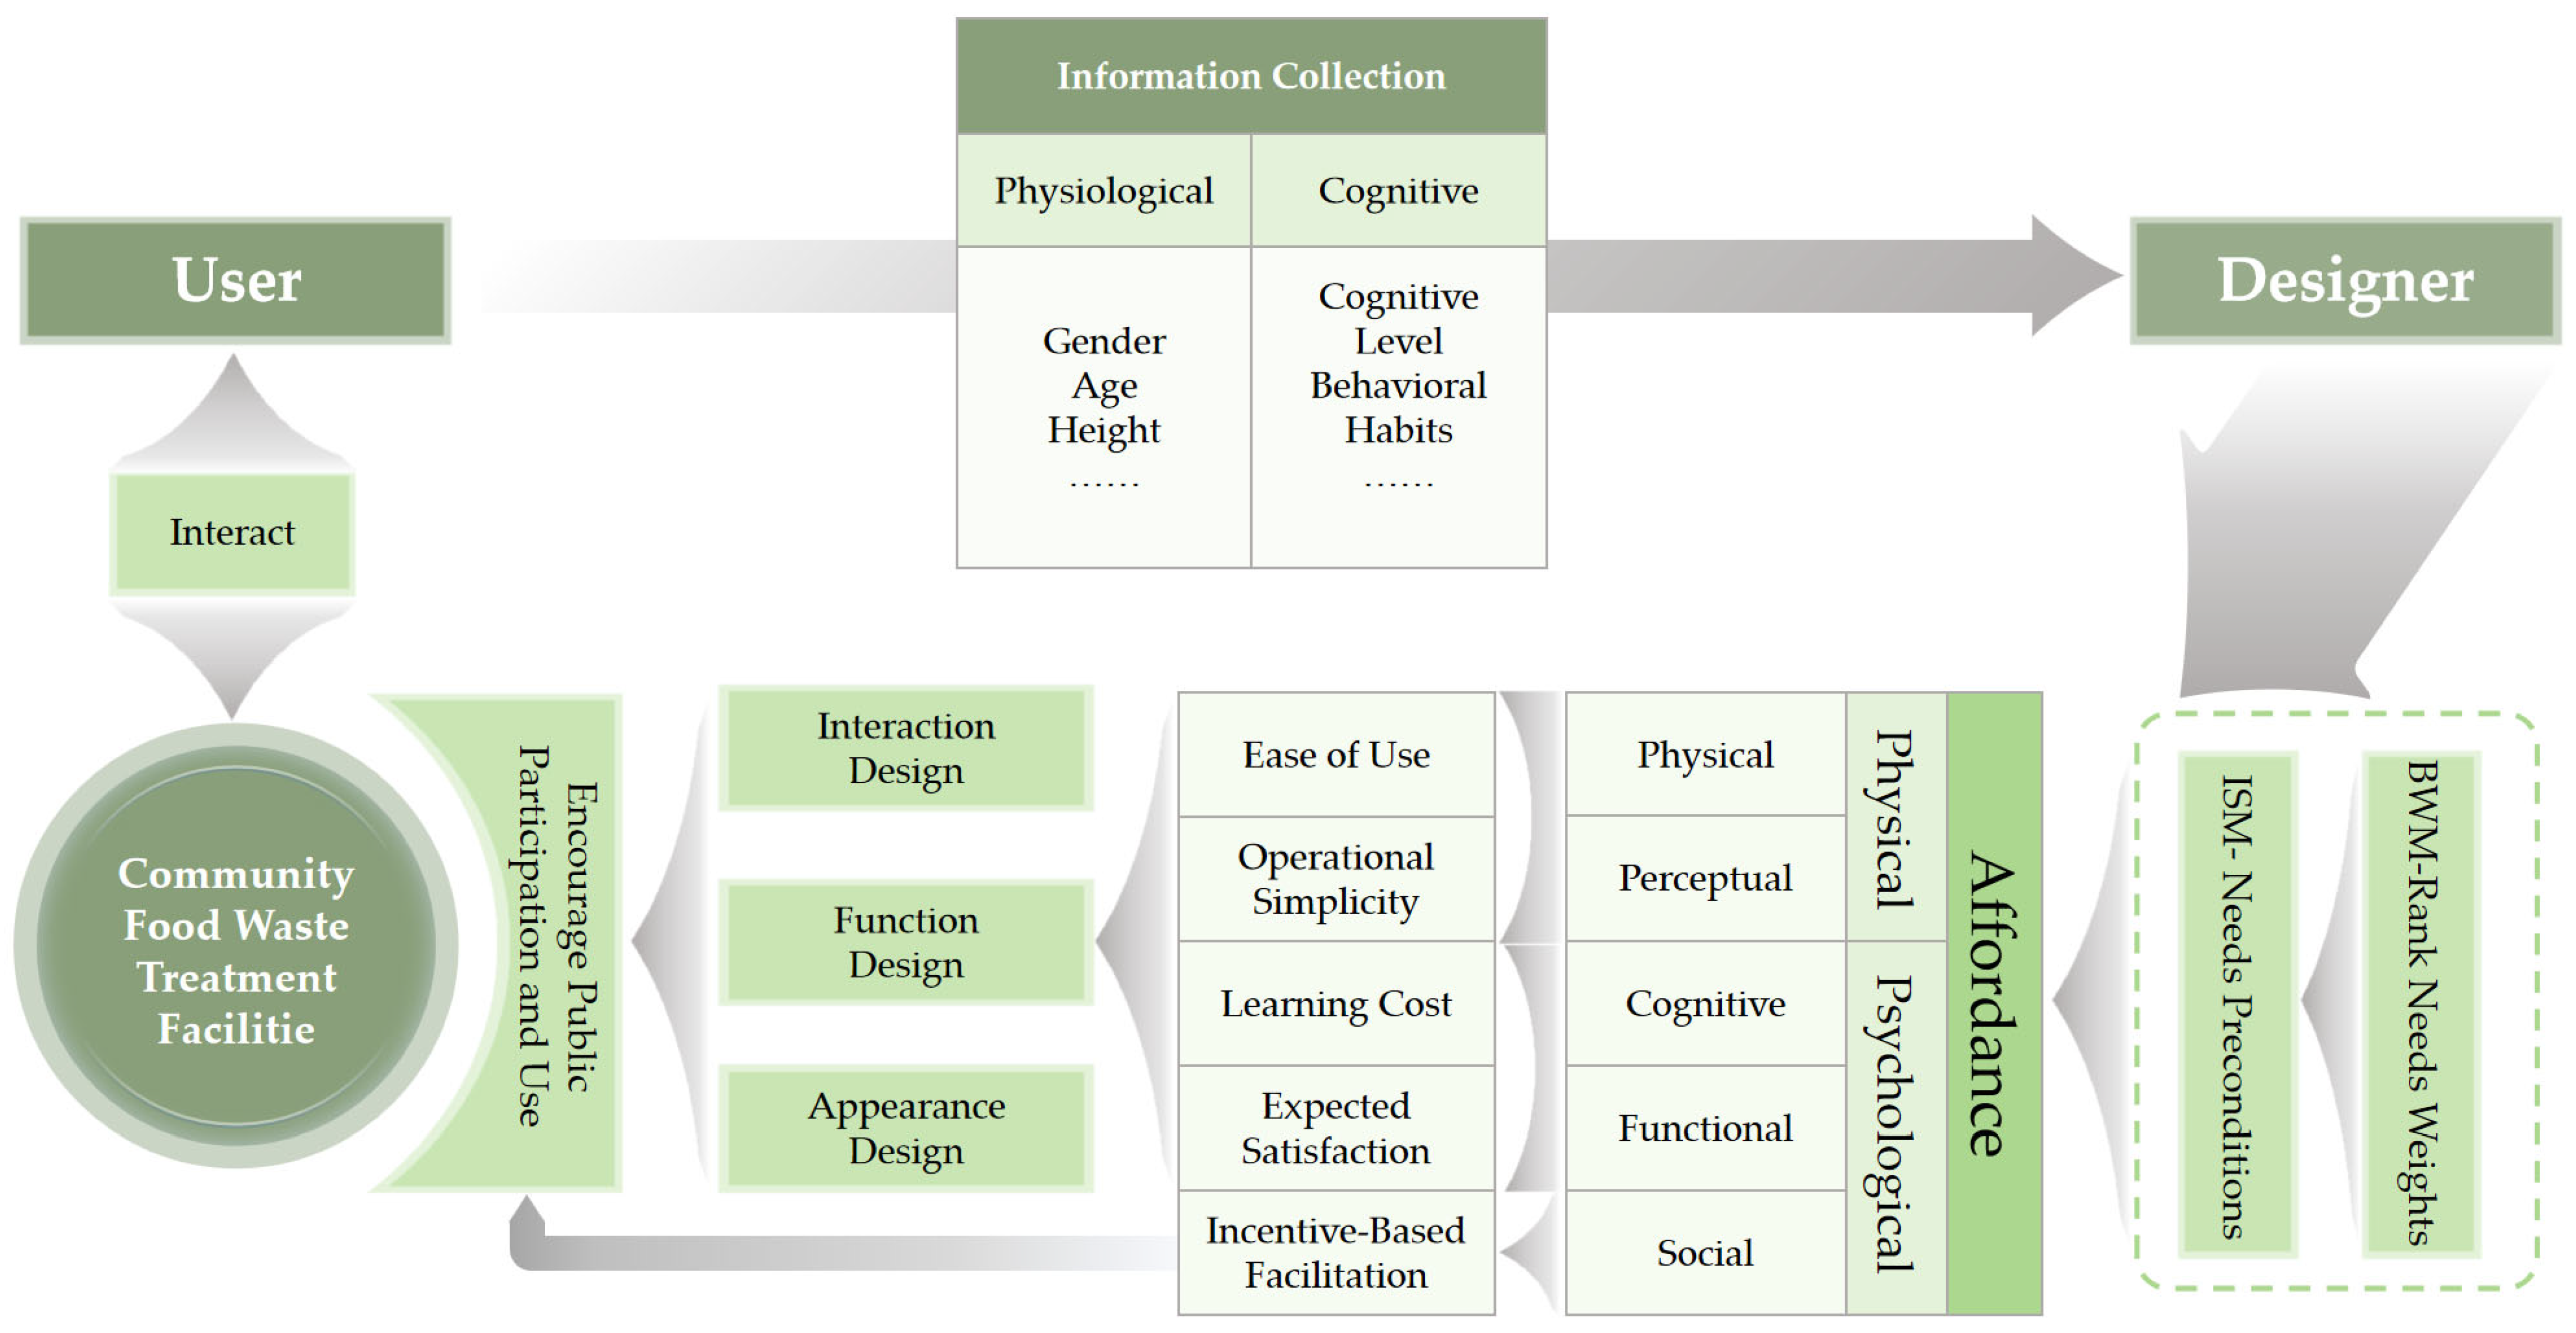
Affordance Theory can provide guidance for design; however, relying solely on it might be difficult to address key decision-making issues, such as the prioritization of needs, the interrelationships among needs, and the allocation of design resources. This limitation hinders its effective translation into design practice. To address this gap, this study constructs a systematic design strategy, as illustrated in Figure 1, which is grounded in Affordance Theory and integrates BWM and ISM for demand analysis. Specifically, BWM is employed to compare demand elements and determine their relative weights, while ISM is used to establish a hierarchical structure of needs to guide the prioritization of affordance-based design. By combining BWM and ISM, the study establishes a needs-analysis framework linking need importance, structural hierarchy, and design priority, and ultimately achieves a systematic translation from user needs to design elements based on affordance theory.

3. Demand Analysis

3.1. Identification of Initial User Needs

User needs were identified through three methods: literature review, expert consultation, and user interviews. The interviews covered the respondents’ experiences with handling food waste, as well as their opinions on the installation of food waste management facilities within the community, which were elicited through guided questions.
The interviews selected community residents with experience in disposing of daily household food waste as participants. To ensure the widest possible coverage of diverse user experiences, a combination of purposive and convenience sampling was used to recruit participants. The inclusion criteria were as follows: Respondents must be permanent residents of the community with experience in daily waste disposal. The initial sample included residents of different age groups, genders, and lifestyles. Through the interviews, we obtained samples of food waste disposal behavior patterns and identified related needs. Additionally, property management staff, community workers, and volunteers were included as interview subjects to gather management-related feedback on the design and disposal of food waste bins within the community. All interviews were recorded with the respondents’ consent for analysis. At the outset of each interview, the purpose of the study and the recording process were explained to the respondents, and their identities were kept anonymous. The interviews were conducted until thematic saturation was reached, defined as the point at which no new themes or insights emerged from subsequent interviews [38]. Specifically, saturation was reached after conducting 40 interviews, which led to a comprehensive understanding of the main themes and patterns discussed by participants. Among the 40 participants, middle-aged adults aged 31–45 constituting a significant proportion of the sample. This demographic represents the community’s primary resident group and typically bears the primary responsibility for managing food waste within households. The interview sample is shown in Table 2.
The usability of public facilities for food waste disposal in communities depends not only on their physical functions but also on whether residents can identify action cues, perceive the task as relevant to their own roles, and integrate the behavior into their daily routines. Based on the interactive relationship between people and objects as outlined in usability theory, the interviews posed guided questions across three dimensions: cognition, identity and responsibilities, and behavioral habits:
(1)
Cognitive dimension: To understand the interviewee’s awareness of and opinions regarding the food waste disposal process and the public facilities for waste disposal within the community;
(2)
Role and responsibility dimension: To understand the interviewee’s identity within the community and whether they are responsible for food waste disposal within their household;
(3)
Behavioral habits: To understand the interviewee’s habits regarding food waste disposal and the challenges they face.
During the analysis of interview data, to avoid relying solely on intuitive judgments when classifying indicators, this study incorporated the aforementioned five dimensions of affordance into the process of categorizing needs, using them as a guiding framework to identify and integrate different types of needs. In this way, the theory of affordance provided conceptual boundaries for the selection and integration of indicators within the interview data.
Statements regarding product hardware configuration were primarily interpreted from the perspective of physical accessibility; statements concerning the ease of product use were categorized under perceived accessibility. Together with physical accessibility, these represent the physical conditions that support the occurrence of interactive behaviors at the physical level.
Confusions, uncertainties, or difficulties in understanding related to waste disposal are classified as cognitive affordances. Expectations regarding the actual effectiveness of product functions, such as waste disposal, disposal feedback, and incentive rewards, are categorized under functional affordances. Statements related to joint participation and community interaction are understood from the perspective of social affordances. Together, these three types of affordances represent users’ surface preferences from a psychological standpoint.
After a preliminary review of the interview transcripts, the researchers discussed the content with significant repetition. This content was seen as reflecting the residents’ straightforward needs regarding food waste management facilities within the community. These needs specifically include the experience of the waste disposal process and the operational efficiency of the facility. The purpose of the discussion was to establish a coding scheme based on affordance theory. To ensure the smooth progress of the coding process, when disagreements arose among team members, the disputed content was temporarily set aside, and further discussions were held to check for similar content. During the discussion, in addition to the previously mentioned interview content, one team member suggested that there were related need-based insights in the literature. After joint research by the team, it was found that the content from the literature could supplement the interview findings, and therefore, the literature reviewed by the team was incorporated into the scope of the coding content.
After finalizing the research design, the researchers conducted open-coding of the interview data. During the open-coding phase, initial concepts related to waste disposal experience and willingness to use the facilities were extracted from both the respondents’ original statements and relevant literature. These concepts were then categorized into two groups based on the design objectives:
(1)
Reducing users’ operational burden;
(2)
Guiding users toward sustained participation.
In the axial coding phase, these concepts were further clustered based on Affordance Theory to identify the corresponding types of behavioral support, that is, the actions the facility can enable across five dimensions: physical, perceptual, cognitive, functional, and social. Based on this, the construction of demand indicators considers two aspects:
(1)
The key behavioral goals that residents face in sustaining food waste disposal behavior, such as reducing the use burden and promoting continued participation;
(2)
The primary affordance support types on which these goals depend.
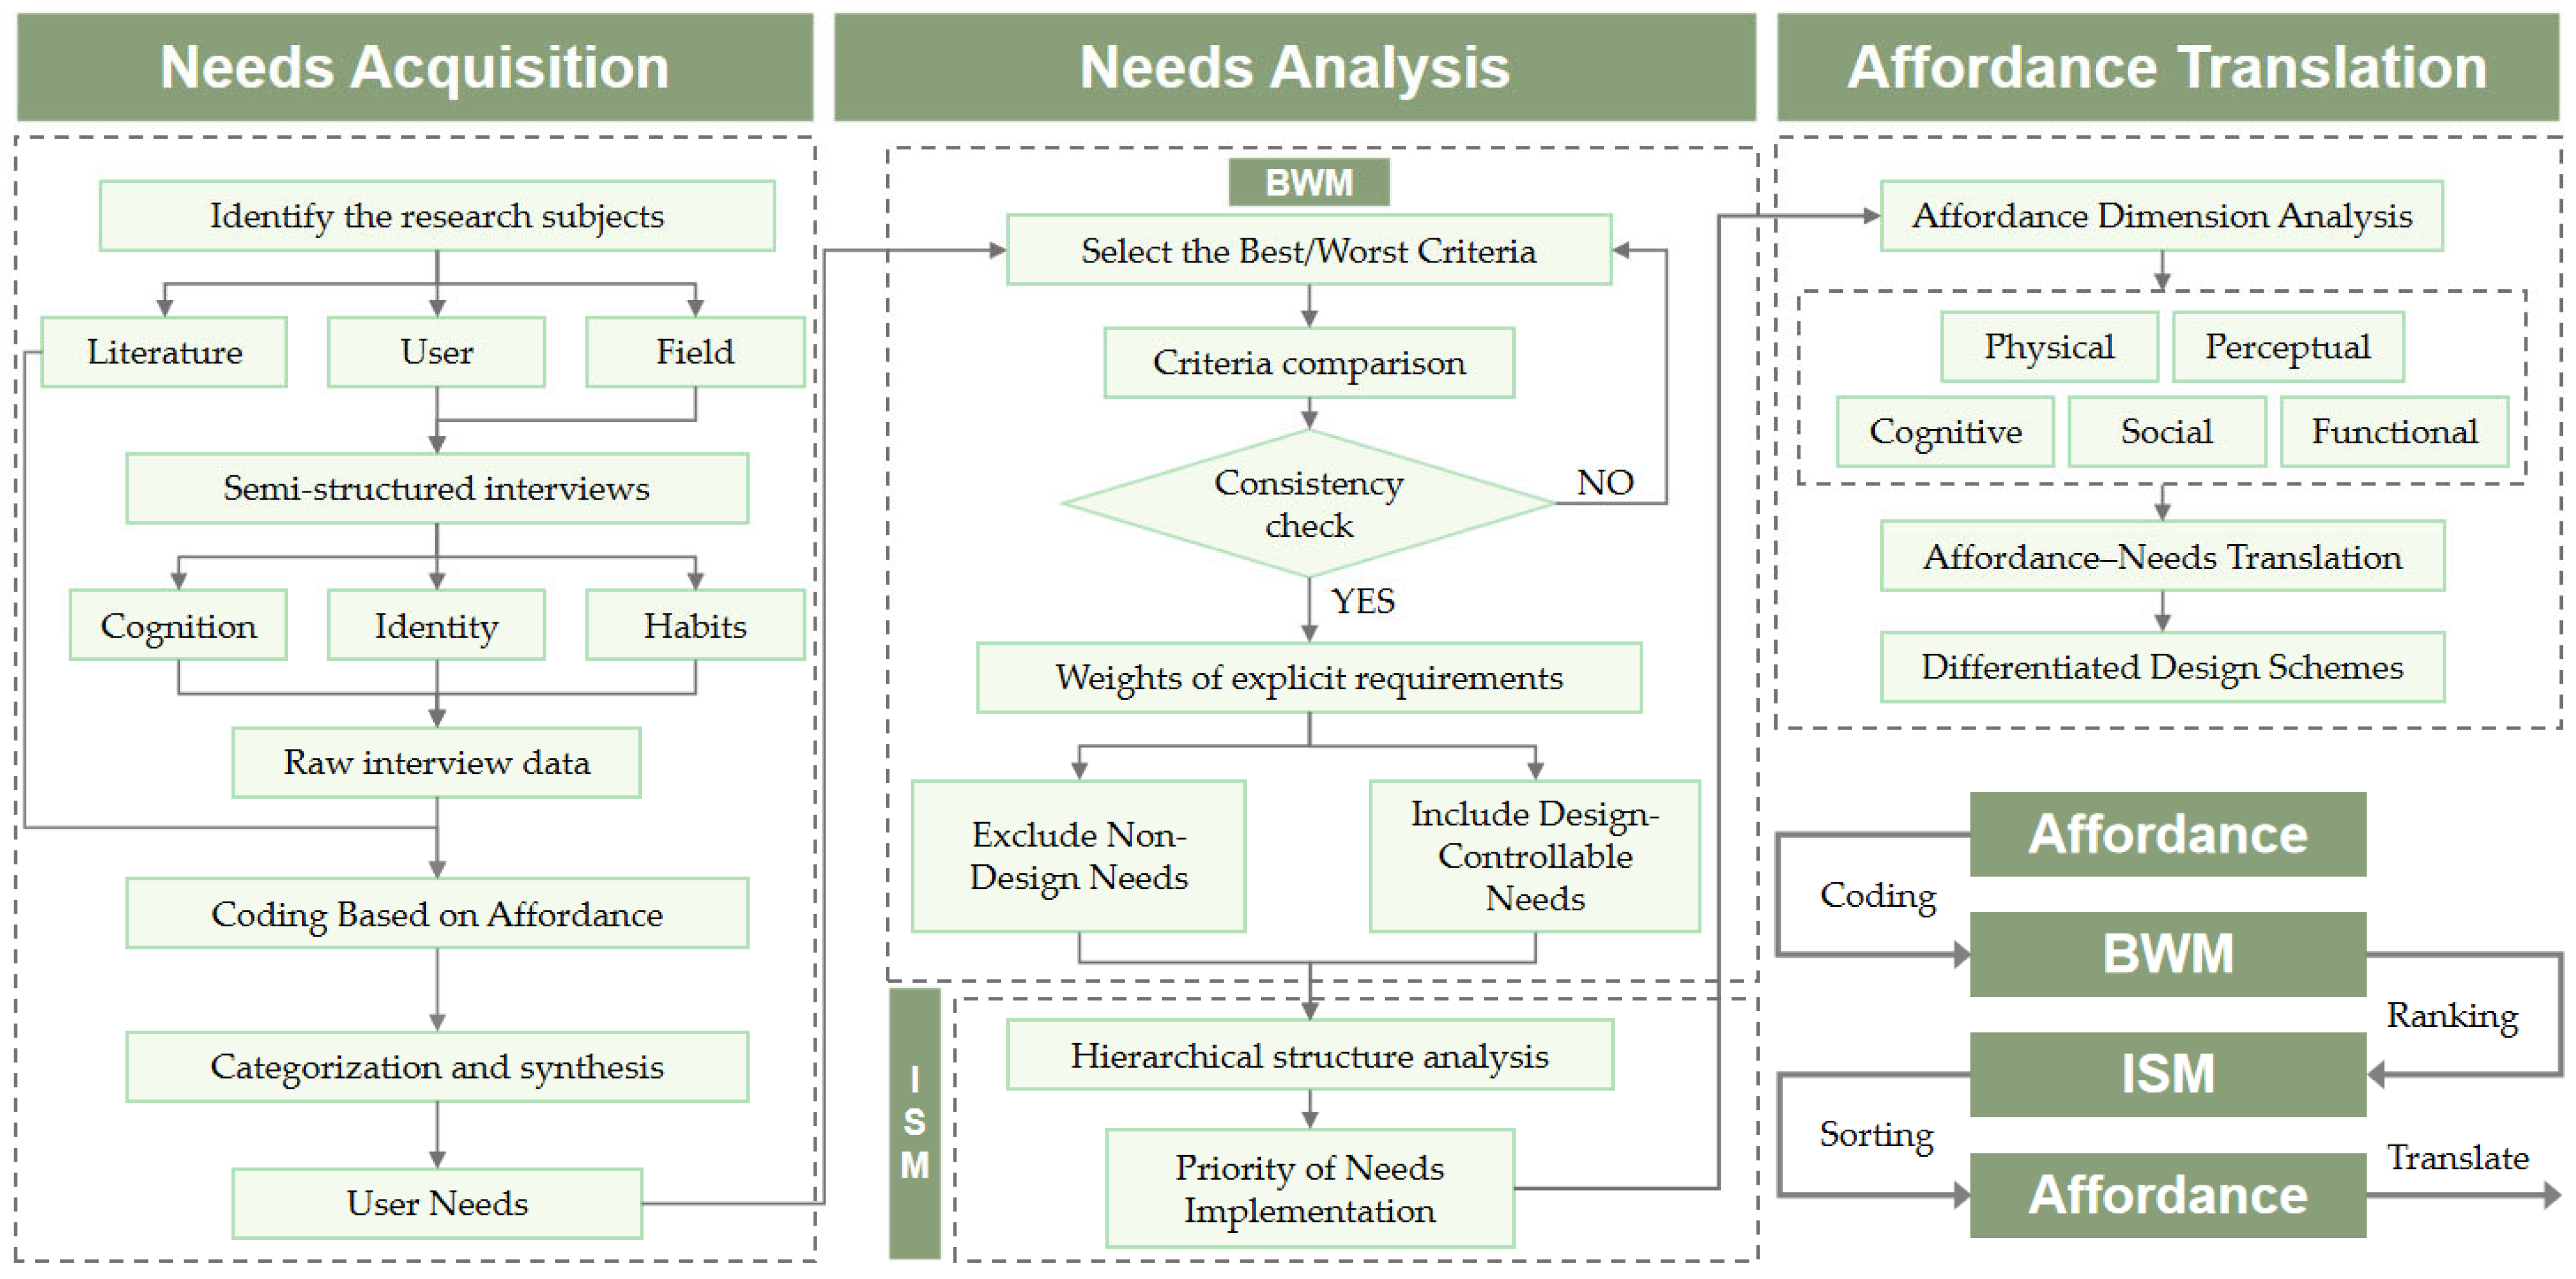
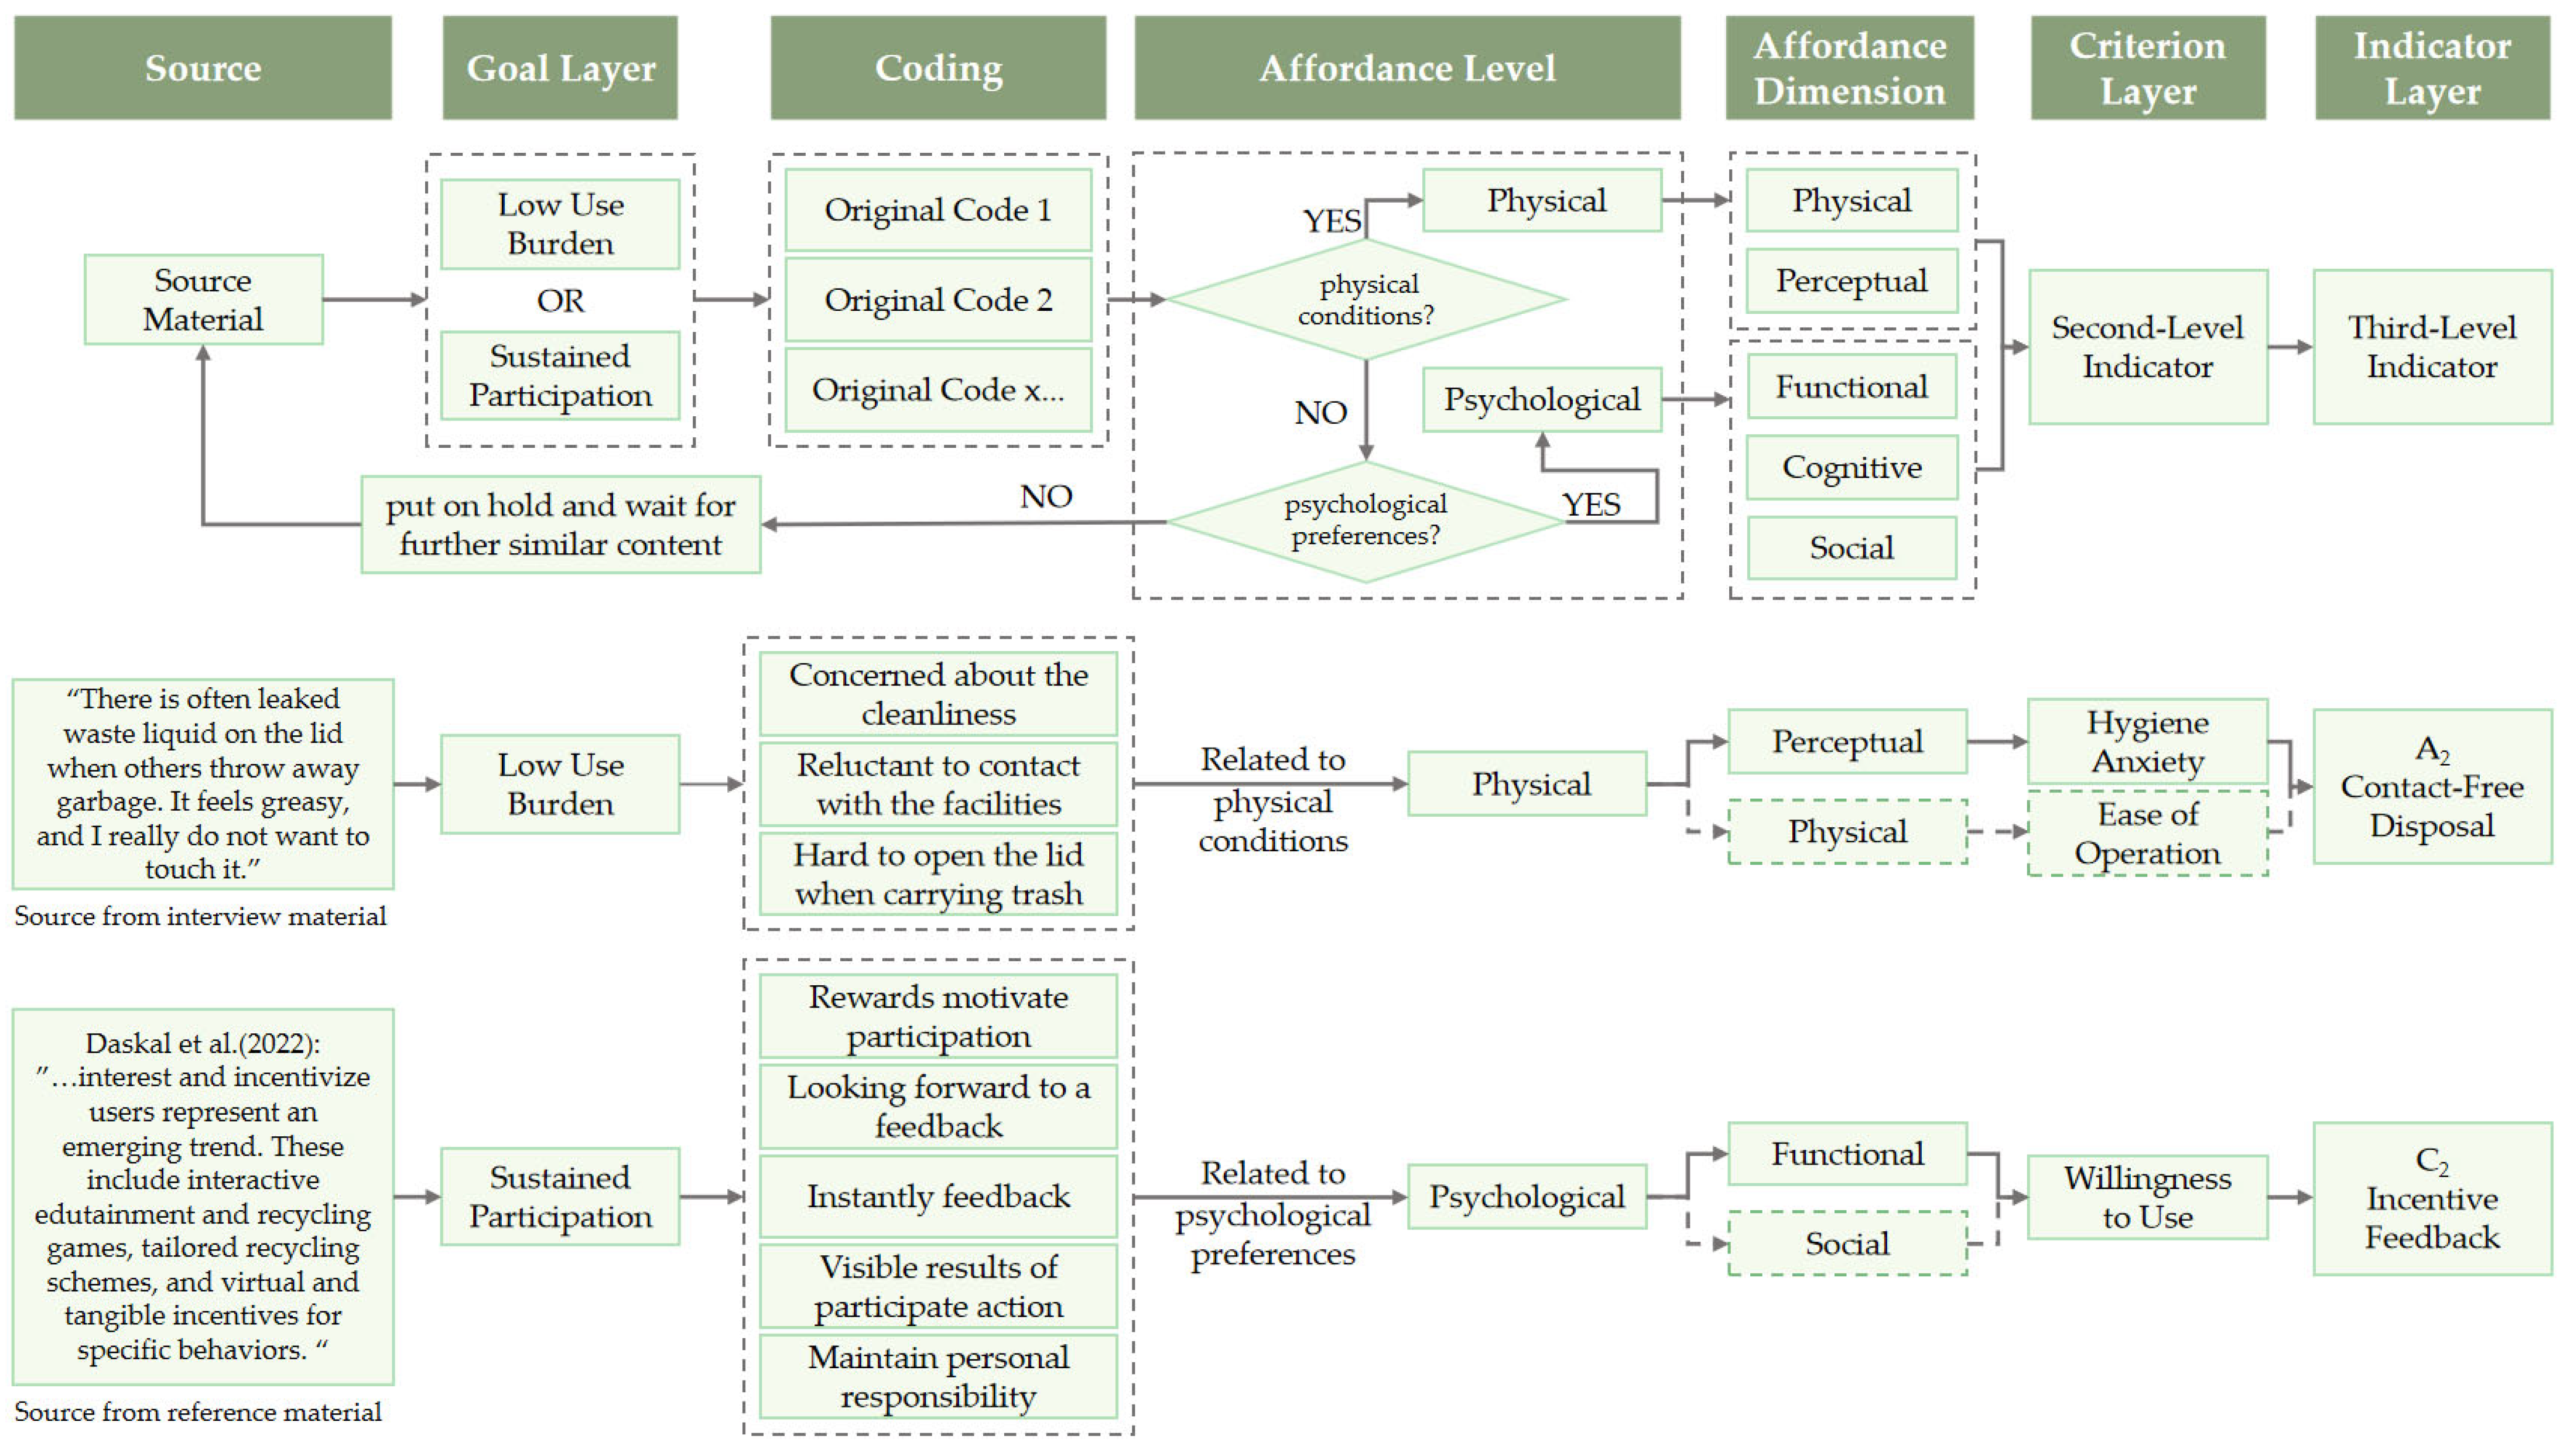
The coding process is shown in Figure 2. For example, the researchers first extracted open codes from the original statements such as “fear of touching stains”, “concern about contamination”, and “inconvenience due to hands being occupied”, then in the axial coding phase, they aggregated these into themes such as “hygiene anxiety” and “low-burden operation demand”, ultimately converging into the A2 indicator. Further analysis based on Affordance Theory indicates that this indicator primarily reflects perceptual affordance, as the cleanliness of the facility surface or its surrounding environment influences whether users are willing to approach and use the facility, as well as their judgment of the action’s feasibility. At the same time, it also involves physical affordance, specifically whether the facility supports residents in completing the disposal action through low-contact interaction.
Ultimately, two primary indicators, four secondary indicators, and sixteen tertiary indicators were identified, as shown in Table 3. The secondary indicators represent factors that influence residents’ use of food waste management products, while the tertiary indicators represent the design factors that need to be incorporated.

3.2. Demand Analysis Based on the Best–Worst Method (BWM)

Ten experts from relevant fields were invited, including two industrial designers, three community property management staff, and five neighborhood committee representatives. Based on the criteria layer in Table 3, a factor set D = {d1, d2, … dn} was established. The experts then identified the best criterion dB and the worst criterion dW from this set based on subjective judgment. Subsequently, a 1–9 rating scale was adopted, with the degree of importance increasing progressively from 1 to 9. The best criterion dB was compared pairwise with each of the other criteria to obtain the corresponding preference values, which were expressed as the comparison vector AB = (aB1, aB2, … aBn). Here, aBj denotes the importance of the best criterion dB relative to another criterion dj, where 1 indicates equal importance and 9 indicates that the best criterion is absolutely more important than criterion dj. Similarly, each of the other criteria dj was compared with the worst criterion dW, yielding the comparison vector AW = (aW1, aW2aWn), where aWj represents the importance of criterion dj relative to the worst criterion dW. The best/worst criterion selected by each expert, along with their respective B-O and W-O coefficients are as shown in Table A1 and Table A2 in the Appendix A.
A linear model was employed to derive the optimal weights of the indicators as follows:
min max { | w B a B j w j | , | w j a j W w w | } s . t . j = 1 n w j = 1 w j 0
where w’B represents the subjective weight of the best indicator, and w’W represents the subjective weight of the worst indicator.
Accordingly, the model can be reformulated as follows:
min ξ s . t . | w B a B j w j | ξ | w j a j W w w | ξ j = 1 n w j = 1 w j > 0
The symbol ξ denotes the consistency deviation coefficient. A smaller value of ξ indicates a higher degree of consistency in expert judgments and, consequently, greater reliability. In addition, the consistency ratio (CR) must be less than 0.1. The formula for calculating the CR coefficient is shown in Equation (3).
C R = ξ C I
In the BWM, the CI value is fixed, as shown in Table 4.
After the calculations were completed, all results passed the consistency test (CR < 0.1), as shown in Table 5.
The collected data was analyzed to determine the subjective weights for each indicator, which were then ranked according to their weights, as shown in Table 6.
The BWM weight results show that “C: Willingness to Use” is at the highest priority in residents’ explicit needs, with “C2: Incentive Feedback” and “C1: Simple and Clear Appearance” ranking high. This reflects that residents wish to quickly understand the facility with low cognitive cost and develop sustained participation motivation after receiving positive feedback. However, the weight ranking alone is insufficient to guide the allocation of design resources. When designing public facilities, it is essential to first meet the needs that influence the willingness to use at a deeper level to establish stable, continued usage behavior.

3.3. Further Demand Analysis Using Interpretive Structural Modeling (ISM)

To further reveal the intrinsic relationships among various requirements and clarify the priority of functional elements, this study introduces the Interpretive Structural Modeling (ISM) approach. To ensure that the ISM analysis results can more accurately inform subsequent design translation, this study focuses on key requirements that can be translated into design. Based on the weight rankings of design indicators calculated using the BWM, as well as considerations of controllability across design, technology, and operations, factors that can be directly addressed within the design scheme itself were excluded. Subsequently, the 16 indicators at the indicator layer were screened according to the criteria shown in Table 7. Ultimately, nine indicators—A1, A2, A4, B1, B2, B4, C1, C2, and D4—were selected for extended ISM calculation and hierarchical structure analysis.
Before conducting a hierarchical structure analysis, it is necessary to determine the degree of influence among the various factors. In addition to the 10 experts mentioned earlier, residents from three different communities were selected through purposive sampling to participate in the questionnaire survey. A total of 120 questionnaires were collected. Combined with the questionnaires completed by the 10 experts, this yielded a total of 130 sets of questionnaire data. After excluding invalid questionnaires (such as those with contradictory or conflicting responses), 113 valid questionnaires were ultimately obtained. To avoid a single source of samples, this study selected three communities with slight differences when conducting the community selection. These differences were primarily reflected in the composition of residents, age structure, and management models. An overview of the communities is shown in Table 8.
Respondents were asked to rate the degree of influence of each factor on another using a 0–4 scale, with the degree of influence increasing from 0 to 4, where 0 indicates no influence and 4 indicates a strong influence. Unlike the binary 0/1 scale used in the classic ISM, the 0–4 impact rating scale adopted in this study allows respondents to precisely express the varying degrees of influence between factors, thereby revealing more nuanced relationships among them. A direct influence matrix X was constructed from the data, as shown in Table 9.
The direct influence matrix X was normalized using Equation (4) to obtain the normalized direct influence matrix Z.
Z = X m a x 1 i n j = 1 n x i j
Further calculations were then performed using Equation (5), where A denotes the identity matrix, to derive the comprehensive influence matrix T for representing the influence relationships among the factors, as shown in Table 10.
T = Z ( A Z ) 1
Based on the comprehensive influence matrix T, the intercept λ is set to λ = α + β, where α is the mean of all elements in matrix T and β is the standard deviation of matrix T; λ is calculated to be 0.664. By introducing the intercept λ to evaluate the off-diagonal elements, an adjacency matrix F = [fij] n × n is constructed. When tij ≥ λ, fij is set to 1, indicating that an influence relationship exists between the two factors; When tij < λ, fij is set to 0, indicating that no influence relationship exists between the two elements. The adjacency matrix F is added to the identity matrix A, as shown in Equation (6), to obtain the initial Reachability Matrix D0. Capture all indirect paths using the power operation until the matrix no longer changes. The iterative formula is as shown in Equation (7), yielding the final Reachability Matrix D, as shown in Table 11.
D 0 = F + A
D 0 k + 1 = D 0 k D 0
Based on the reachability matrix D, Equation (8) was used to derive the reachable set U, the antecedent set V, and the intersection set W, thereby enabling the hierarchical structuring of the influencing factors. As a result, the hierarchy of influencing factors shown in Table 12 and the hierarchical structure of influencing factors shown in Table 13 were obtained.
U ( S i ) = { S j S j S , r i j = 1 } V ( S i ) = { S i S i S , r i j = 1 } W ( S i ) = U ( S i ) V ( S i )
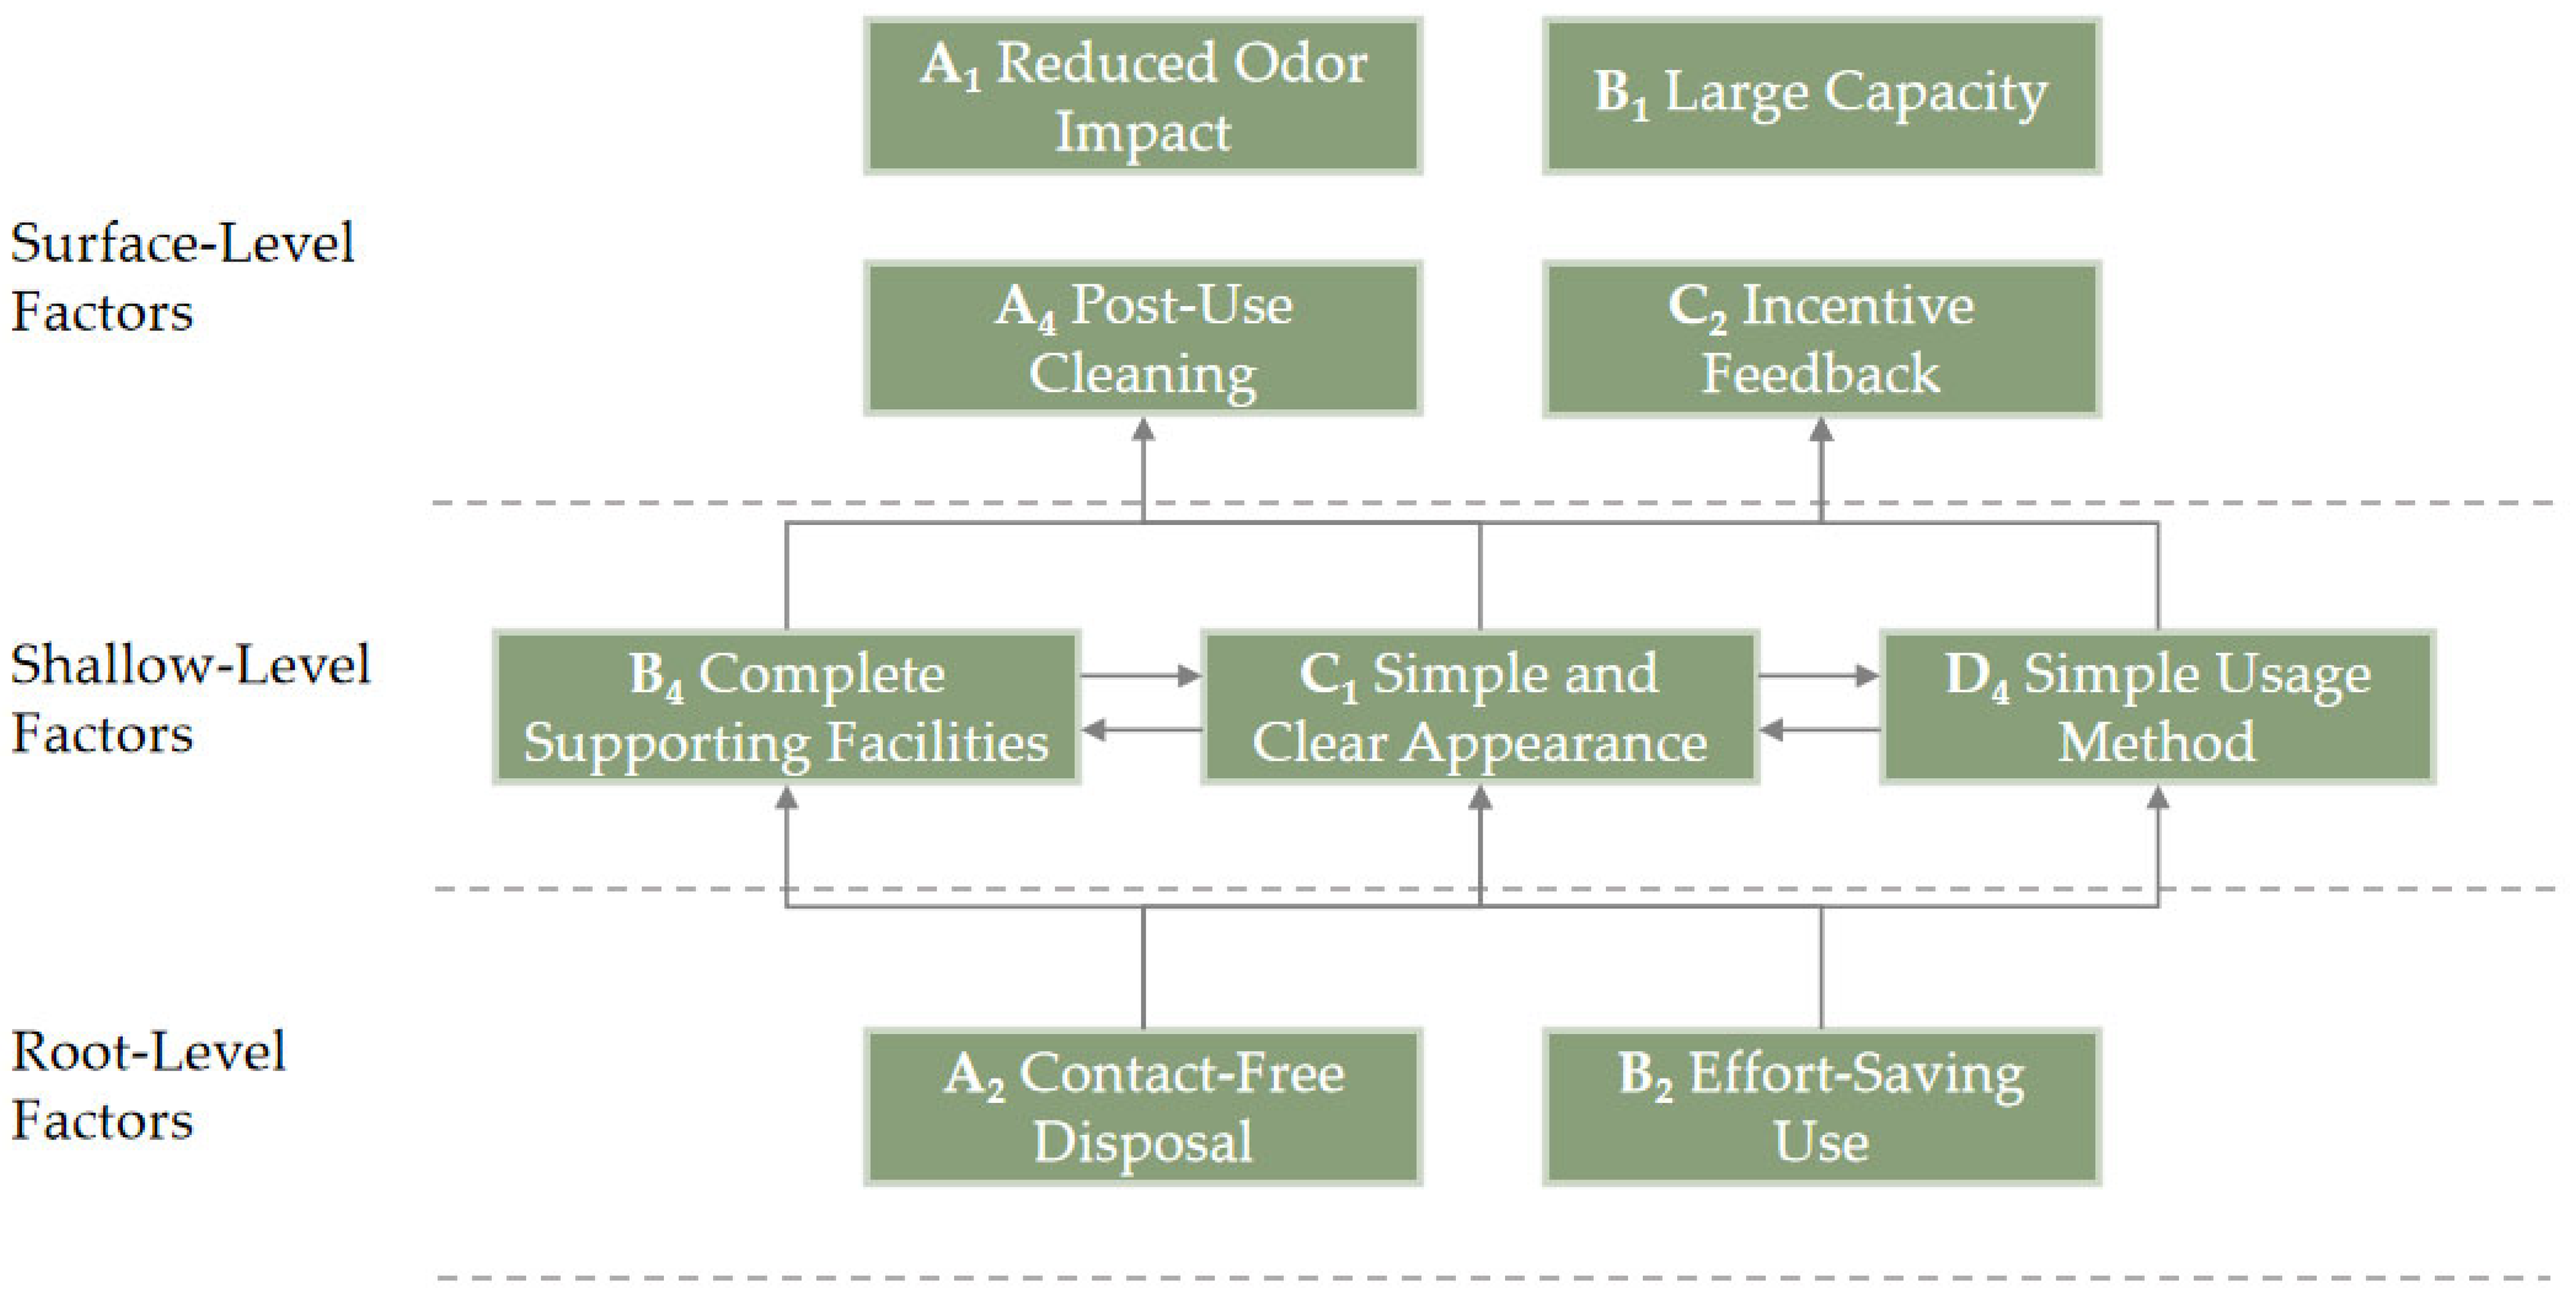
Finally, based on the ISM analysis results (Table 12 and Table 13), a hierarchical structure diagram of the influence relationships among the design factors of the community food waste management product was constructed, as shown in Figure 3.

3.4. Integrated Data Analysis

Building upon the use of BWM for demand prioritization, ISM was further applied to analyze the structural hierarchy of key demands, the results are as shown in Table 14. The results indicate that “C2: Incentive Feedback”, which ranked highest in the BWM analysis, is located at the surface result layer in the ISM analysis, while “A2: Contact-Free Disposal” and “B2: Effort-Saving Use” are root-level factors. These factors determine whether residents are willing to approach and use the system and influence whether the delivery process proceeds smoothly. Therefore, “A2: Contact-Free Disposal” and “B2: Effort-Saving Use” must be prioritized.
The result also shows that “A1: Reduced Odor Impact” and “B1: Large Capacity” are structurally isolated under the selected threshold. Specifically, neither “A1: Reduced Odor Impact” nor “B1: Large Capacity” has off-diagonal values exceeding λ in terms of outgoing or incoming influence relationships after thresholding. Therefore, their reachable sets, antecedent sets, and intersection sets contain only themselves. It also suggests that these two indicators function as relatively independent design needs within the selected indicator system. This does not mean that reduced odor impact or large capacity is unimportant in design practice. Rather, it means that these indicators act more as independent basic design constraints than as relational drivers within the causal hierarchy. In subsequent design translation, they are still retained as necessary design elements.
The demand priorities derived from the BWM analysis and the subsequent ISM analysis seem to be contradictory. In fact, the results reflect that the most direct user need, “Willingness to Use”, is identified as the design goal through the BWM. However, fulfilling this design goal requires addressing the “Hygiene Anxiety” and “Ease of Operation” identified through the ISM analysis as prerequisites. These two secondary indicators, along with the other tertiary indicators under them, serve as the foundation for ensuring user engagement and the link to sustained participation motivation.
In the initial stage of constructing requirement metrics for analysis, the concept of affordance was used to distinguish between “the physical conditions that enable interactions to occur” and “superficial user preferences”. This distinction is crucial for understanding why certain metrics carry greater weight in BWM analysis, while others function as root-cause prerequisites within the ISM hierarchy.

4. Research Model and Design Strategies

4.1. Development of the Model

4.1.1. Translation Model of BWM—ISM—Affordance

To translate demand analysis into executable design elements, a community food waste management product design Translation Model of BWM—ISM—Affordance (BIATM) is constructed, as shown in Figure 4. The BWM is used to determine the weights of users’ explicitly stated needs. Subsequently, the ISM is employed to identify the prerequisites and causal hierarchy required to fulfill these needs. Based on the theory of affordance, these prerequisites and objectives are translated into design elements across five dimensions—physical, perceptual, cognitive, functional, and social—divided into physical and psychological levels. BIATM analysis enables the linking of explicit demand priorities with the underlying prerequisites for behavioral occurrence. This model is suitable for community service facilities characterized by public nature, shared usage attributes, behavior-driven demands, and goals of sustained participation.
The affordance on the physical level mainly refers to the physical affordance and perceptual affordance presented to users by various physical information. The key design considerations focus on the product’s functional hardware, typically referring to components and dimensions designed based on user habits and ergonomics to ensure the product is usable by the user [44,45].
On the psychological level, affordance corresponds to cognitive affordance, functional affordance, and social affordance. The primary design considerations involve product design semantics that align with users’ cognitive habits, as well as how the product’s work efficiency meets users’ psychological expectations and the emotional changes this evokes in users [46,47].

4.1.2. Mapping Process

To avoid the mapping of needs to affordance dimensions relying solely on the researchers’ subjective judgment, this study further introduces a theoretical “user needs—affordance dimensions” mapping process, which is carried out in three steps.
(1) Based on Gibson’s theory of primal affordances—which explains the relationship among people, objects, and the environment—each user need is reformulated as “what obstacles the user encounters in achieving their goal”. This approach interprets needs as manifestations of how certain action possibilities are constrained within the user-facility-environment relationship, thereby identifying the factors influencing the generation of supportive actions through a reverse-engineering approach.
(2) Based on Norman’s interpretation of perceptible affordance in design and Hartson’s classification framework for affordance, this study categorizes the factors influencing supportive actions into five specific dimensions: physical execution, perceptual acquisition, cognitive understanding, task feedback, and social participation.
To avoid any bias in judgment resulting from individual differences in the interpretation of the evaluation criteria, the researchers, following discussion, established the following five evaluation questions and engaged in further deliberation after reaching their conclusions to determine the classification of the affordance dimensions, as shown in Table 15.
(3) Additionally, since the same user need may involve multiple factors that support action initiation, to avoid indiscriminate multi-label categorization, this study determines the dominant affordance based on the primary action barriers that the design aims to address. When there is another clear supporting layer, it is classified as a secondary affordance. Following the principle of “prioritizing dominant affordances and supplementing with secondary affordances”, the needs are classified into affordance dimensions, and the systematic translation from needs to design elements is completed accordingly. Specifically, four researchers within the team independently judged the affordance dimension associated with each need according to the above procedure. When disagreements arose, they were resolved through repeated communication, ultimately determining the affordance dimension associated with each need. For example, when analyzing the usability dimensions of “B2: Large Capacity”, the research team first considered that the capacity of waste disposal facilities affects the smoothness of residents’ waste disposal process and imposes an operational burden on them. However, fulfilling this need requires large container components as support, so it was categorized under perceptual/physical affordance.

4.2. Design Strategies

4.2.1. Physical Affordances

Public facilities deployed in communities prioritize convenience and ease of use. The key lies in minimizing the number of steps required to achieve a goal and reducing the duration of the process. Physical affordance and perceptual affordance are the foundations for activating public participation and usage. Therefore, while integrating the necessary functions for food waste disposal, it is essential to consider both the functional requirements and the physical conditions needed for users to complete the process. This helps improve the efficiency of the food waste disposal process and ensures the sustainability of food waste management.
For example, through affordance analysis, this study adapted the “A2: Contact-Free Disposal” concept into a foot-operated pedal mechanism. This design retains the operational logic of traditional trash cans while preventing users from touching potentially contaminated surfaces with their hands. This design element alleviates users’ hygiene concerns when they approach and dispose of waste, while also aligning with their established habits regarding trash can usage. It communicates the possibility of opening the lid via foot operation, thereby lowering the barrier to use.

4.2.2. Psychological Affordances

From the perspective of cognitive affordance, perceptual guidance can be used to reduce users’ decision-making costs during operation by means of intuitive cues. Jeremiah et al. examined the formation mechanism and functional pathway of cognitive affordance from the perspective of the characteristics of the human cognitive system, thereby providing a theoretical basis for cognitive affordance [41]. In everyday situations where no direct contact occurs between a person and an object, visual cues are typically the primary source of information used for recognition and judgment [48]. Moreover, according to the BWM-based analysis, “C1: Simple and Clear Appearance” is a high-weight demand. Therefore, when guiding participation and use through cognitive affordance, priority should be given to visual guidance [49]. In this study, a nature-associated color scheme dominated by white and green [50] is adopted to abstractly map the process of ecological organic circulation and to provide users with cues that encourage their participation in the ecological cycle [51].
From the perspective of functional affordance, low-threshold and progressive task and feedback mechanisms can be established [52] to enable residents to gradually develop stable participation habits through repeated engagement, situational cues, and positive reinforcement [53]. By providing users with the material basis for completing food waste management through affordance-based design, such an approach can facilitate the emergence of proactive food waste disposal behavior and sustain users’ continued engagement through various forms of incentives [54]. Therefore, translating “C2 Incentive Feedback” into a low-threshold, progressive feedback mechanism, centers on converting processed food waste into reusable resources, making the results of food waste processing visible—thereby fulfilling the “C3 Visibility of Processing Results” requirement—and distributing these resources to residents who participate in food waste processing. This effectively incentivizes community residents to engage in the food waste processing process and enhances their governance capabilities as key actors in environmental and social governance [8,55].
From the perspective of social affordance, ecological identity reinforces value alignment [56]. By enhancing the visibility of behavioral outcomes, fostering a sense of identity, and reinforcing alignment with sustainable values—with the goal of stimulating intrinsic motivation—through cognitive restructuring and achievement feedback. Therefore, by incorporating interactive app design into the user-facility interaction process—serving as a vehicle for social and identity verification functions—food waste disposal is transformed into a process through which individual residents affirm their own eco-friendly identity [57]. Combined with the labeling effect, this encourages users to actively align with the eco-conscious identity that has been evoked [58].
Ultimately, a summary table of design strategies was compiled, as shown in Table 16.

4.3. BIATM-Based Affordance Translation

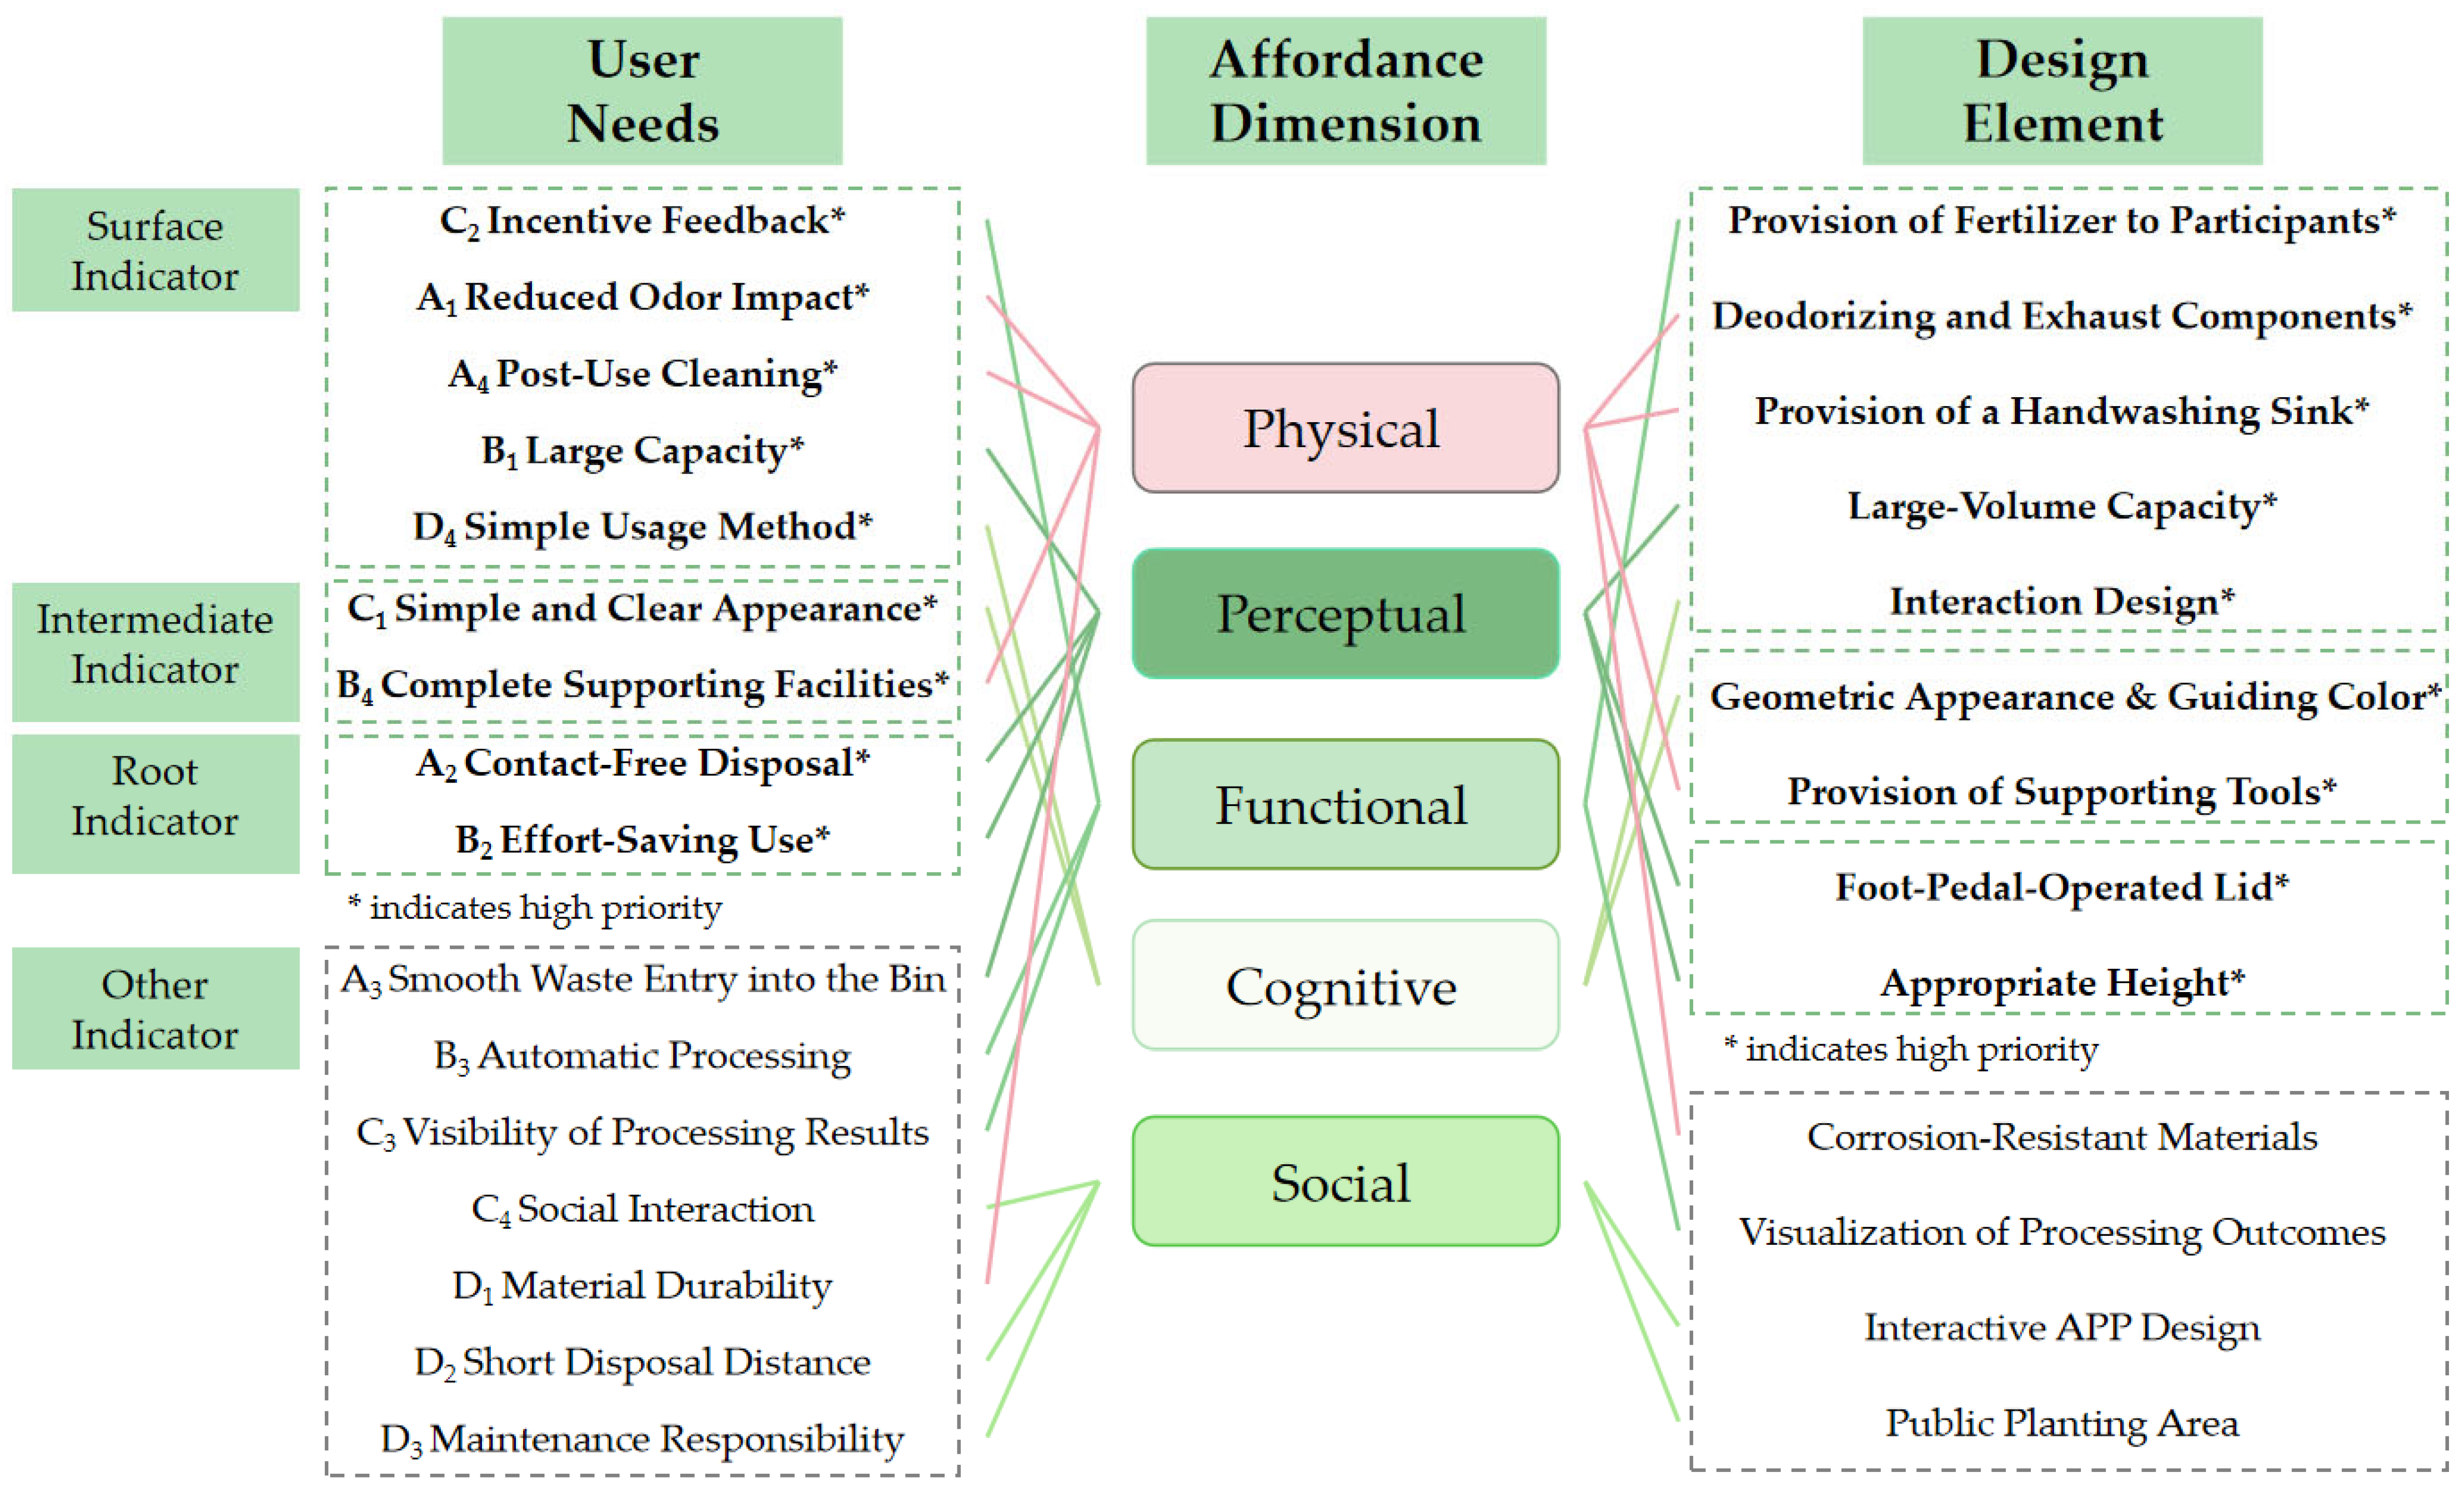
The user need priorities were identified from the preliminary analysis. According to the BIATM affordance translation rules, the needs were classified into five dimensions of affordance, resulting in the design elements required to guide residents within the community to actively and continuously engage in accurate food waste disposal, as shown in Figure 5, where * denotes high priority.
Based on Figure 5, to ensure that users can carry out food waste disposal actions as expected, affordance cue analysis is introduced. Affordance cues are generated for each high-priority need, aligned with residents’ cognition, and expanded into a mapping table of key needs and affordance translation design elements, as shown in Table 17.
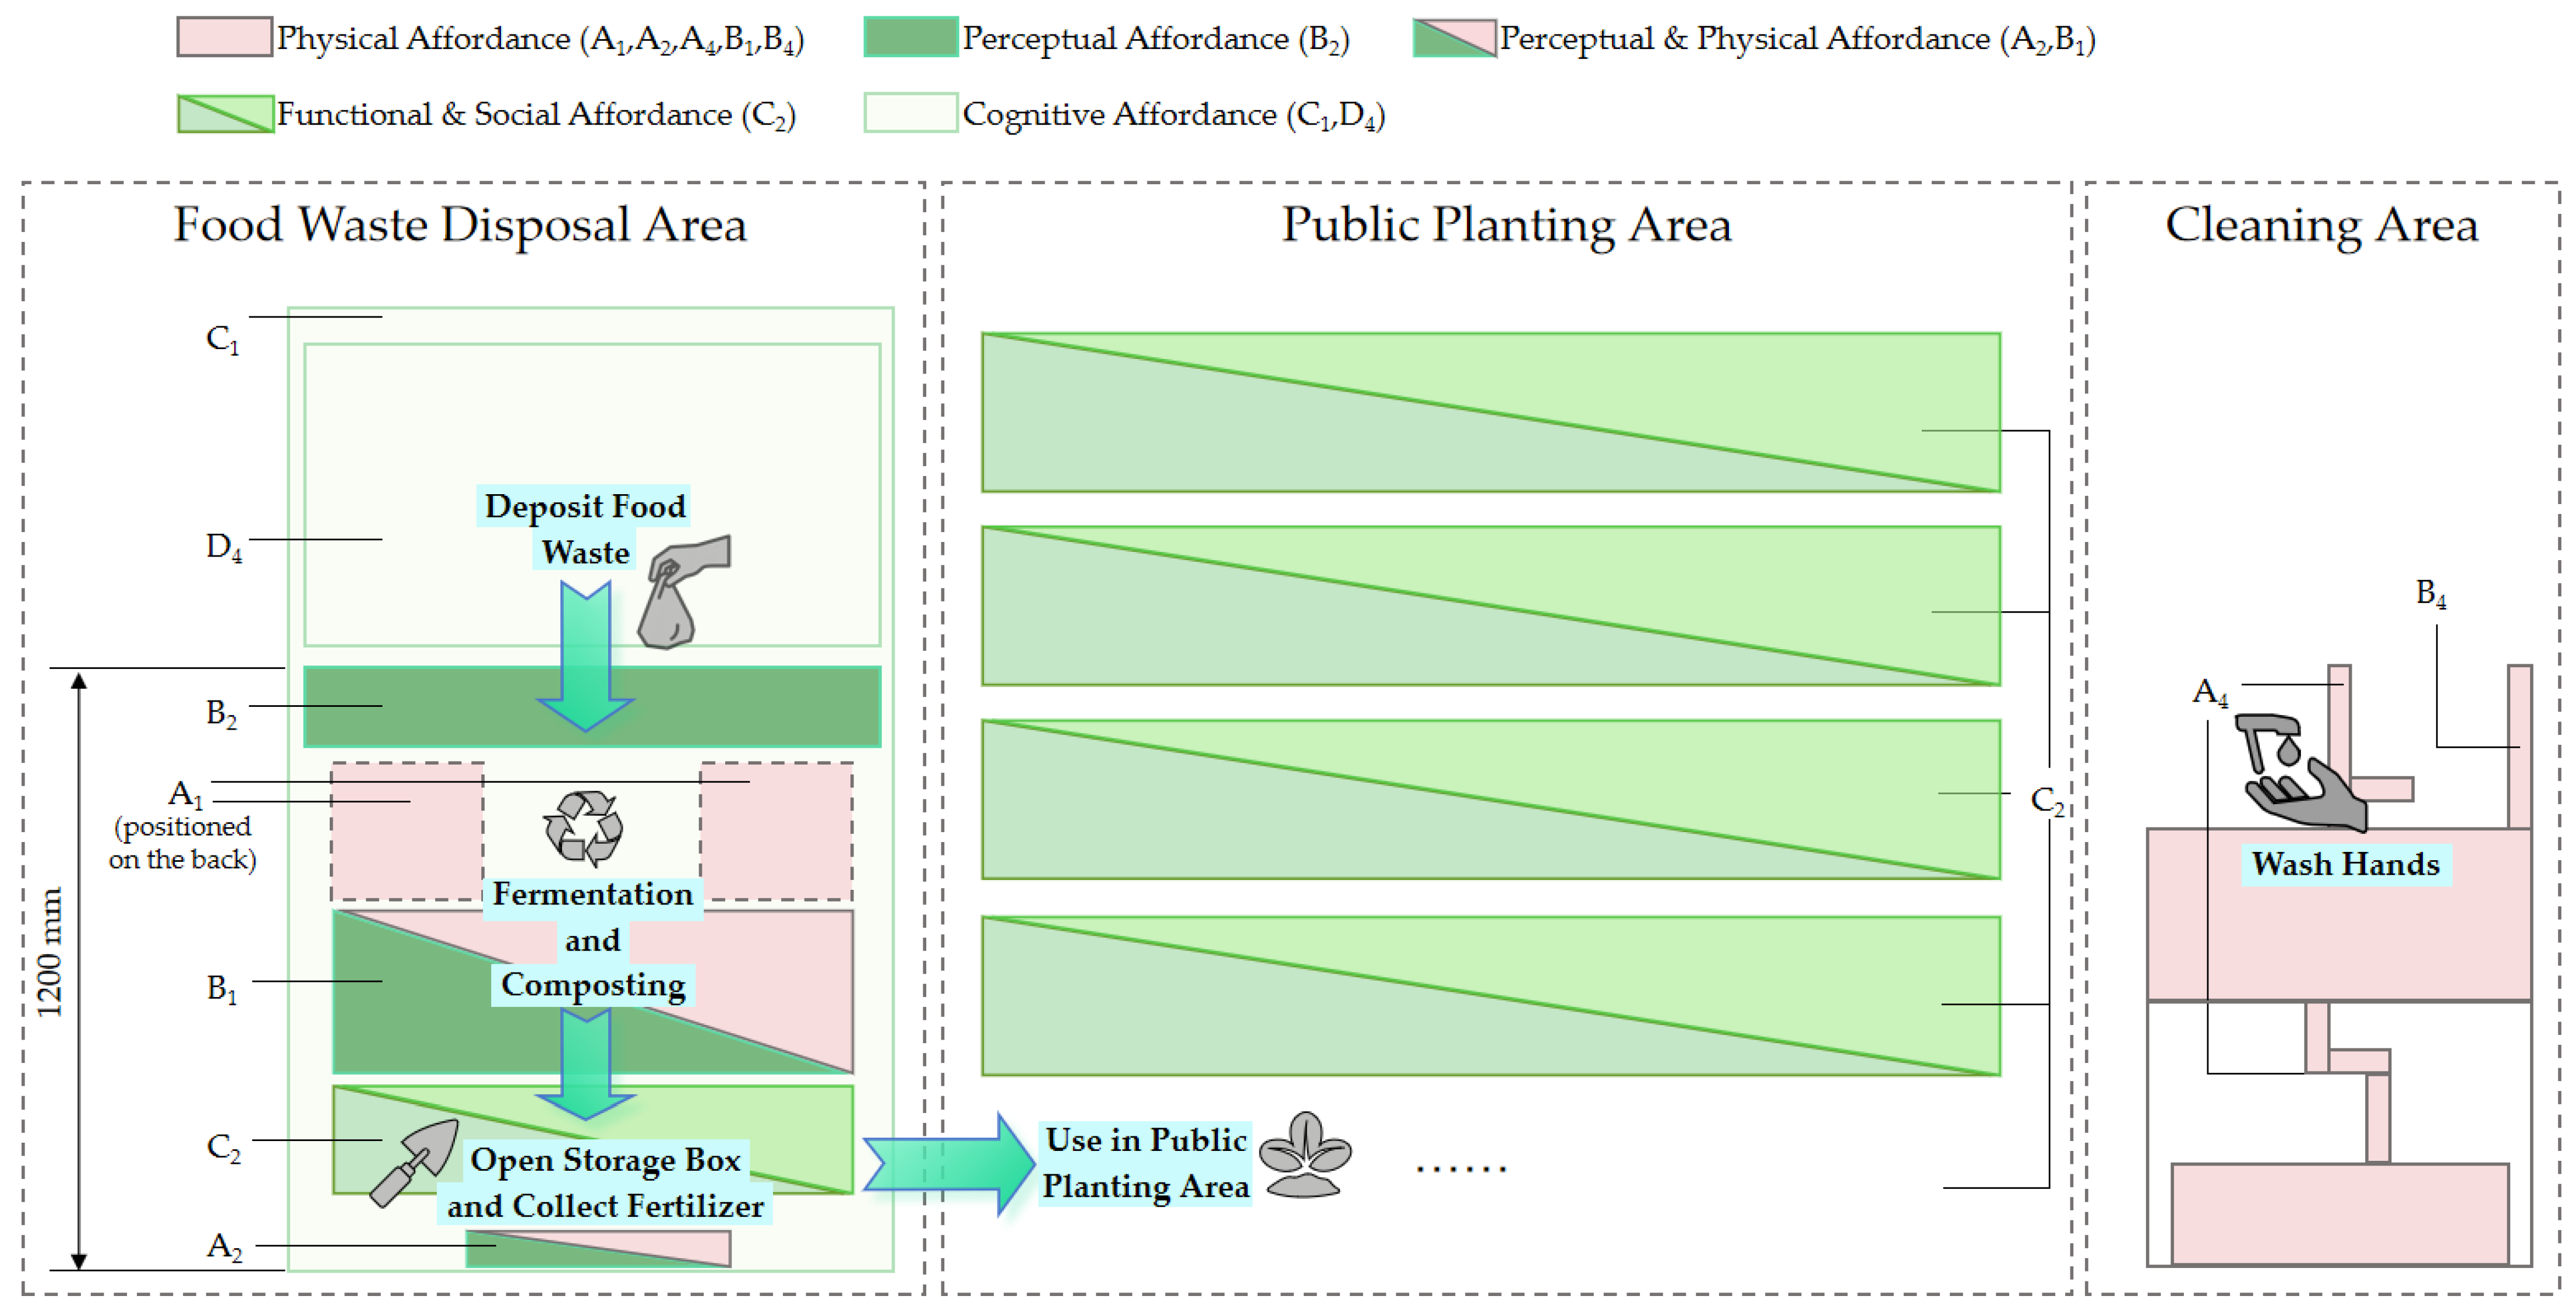
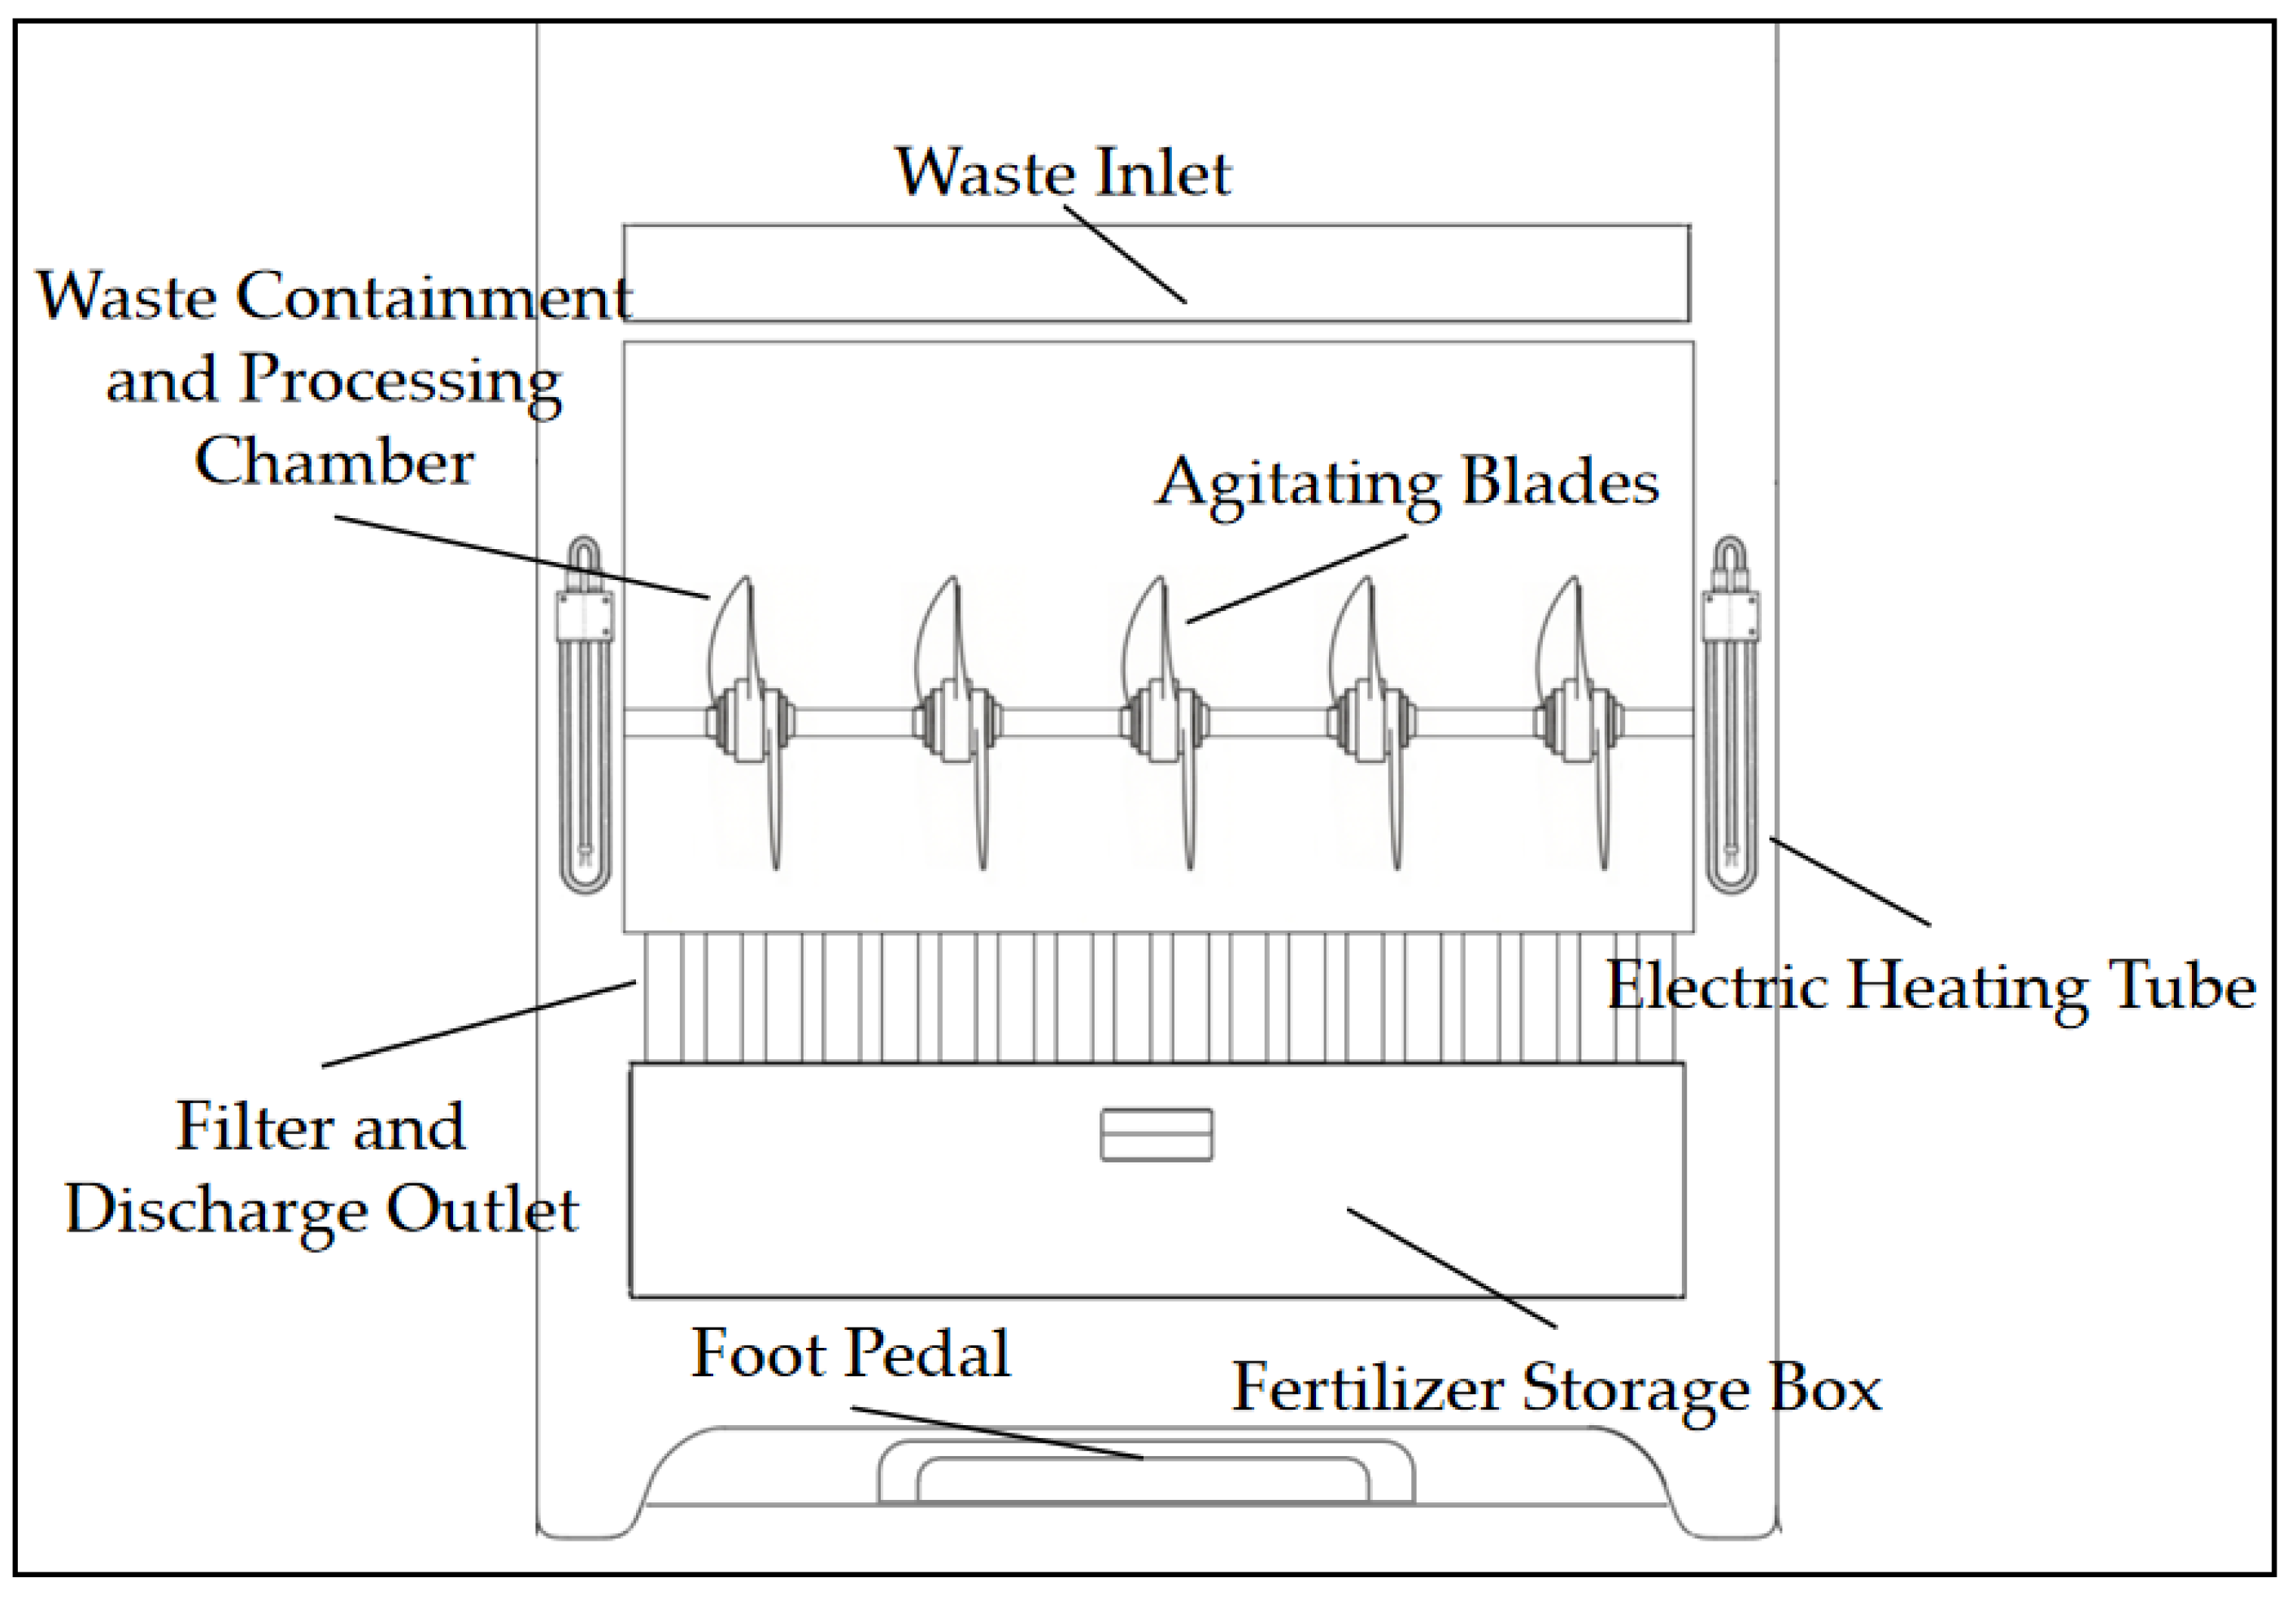
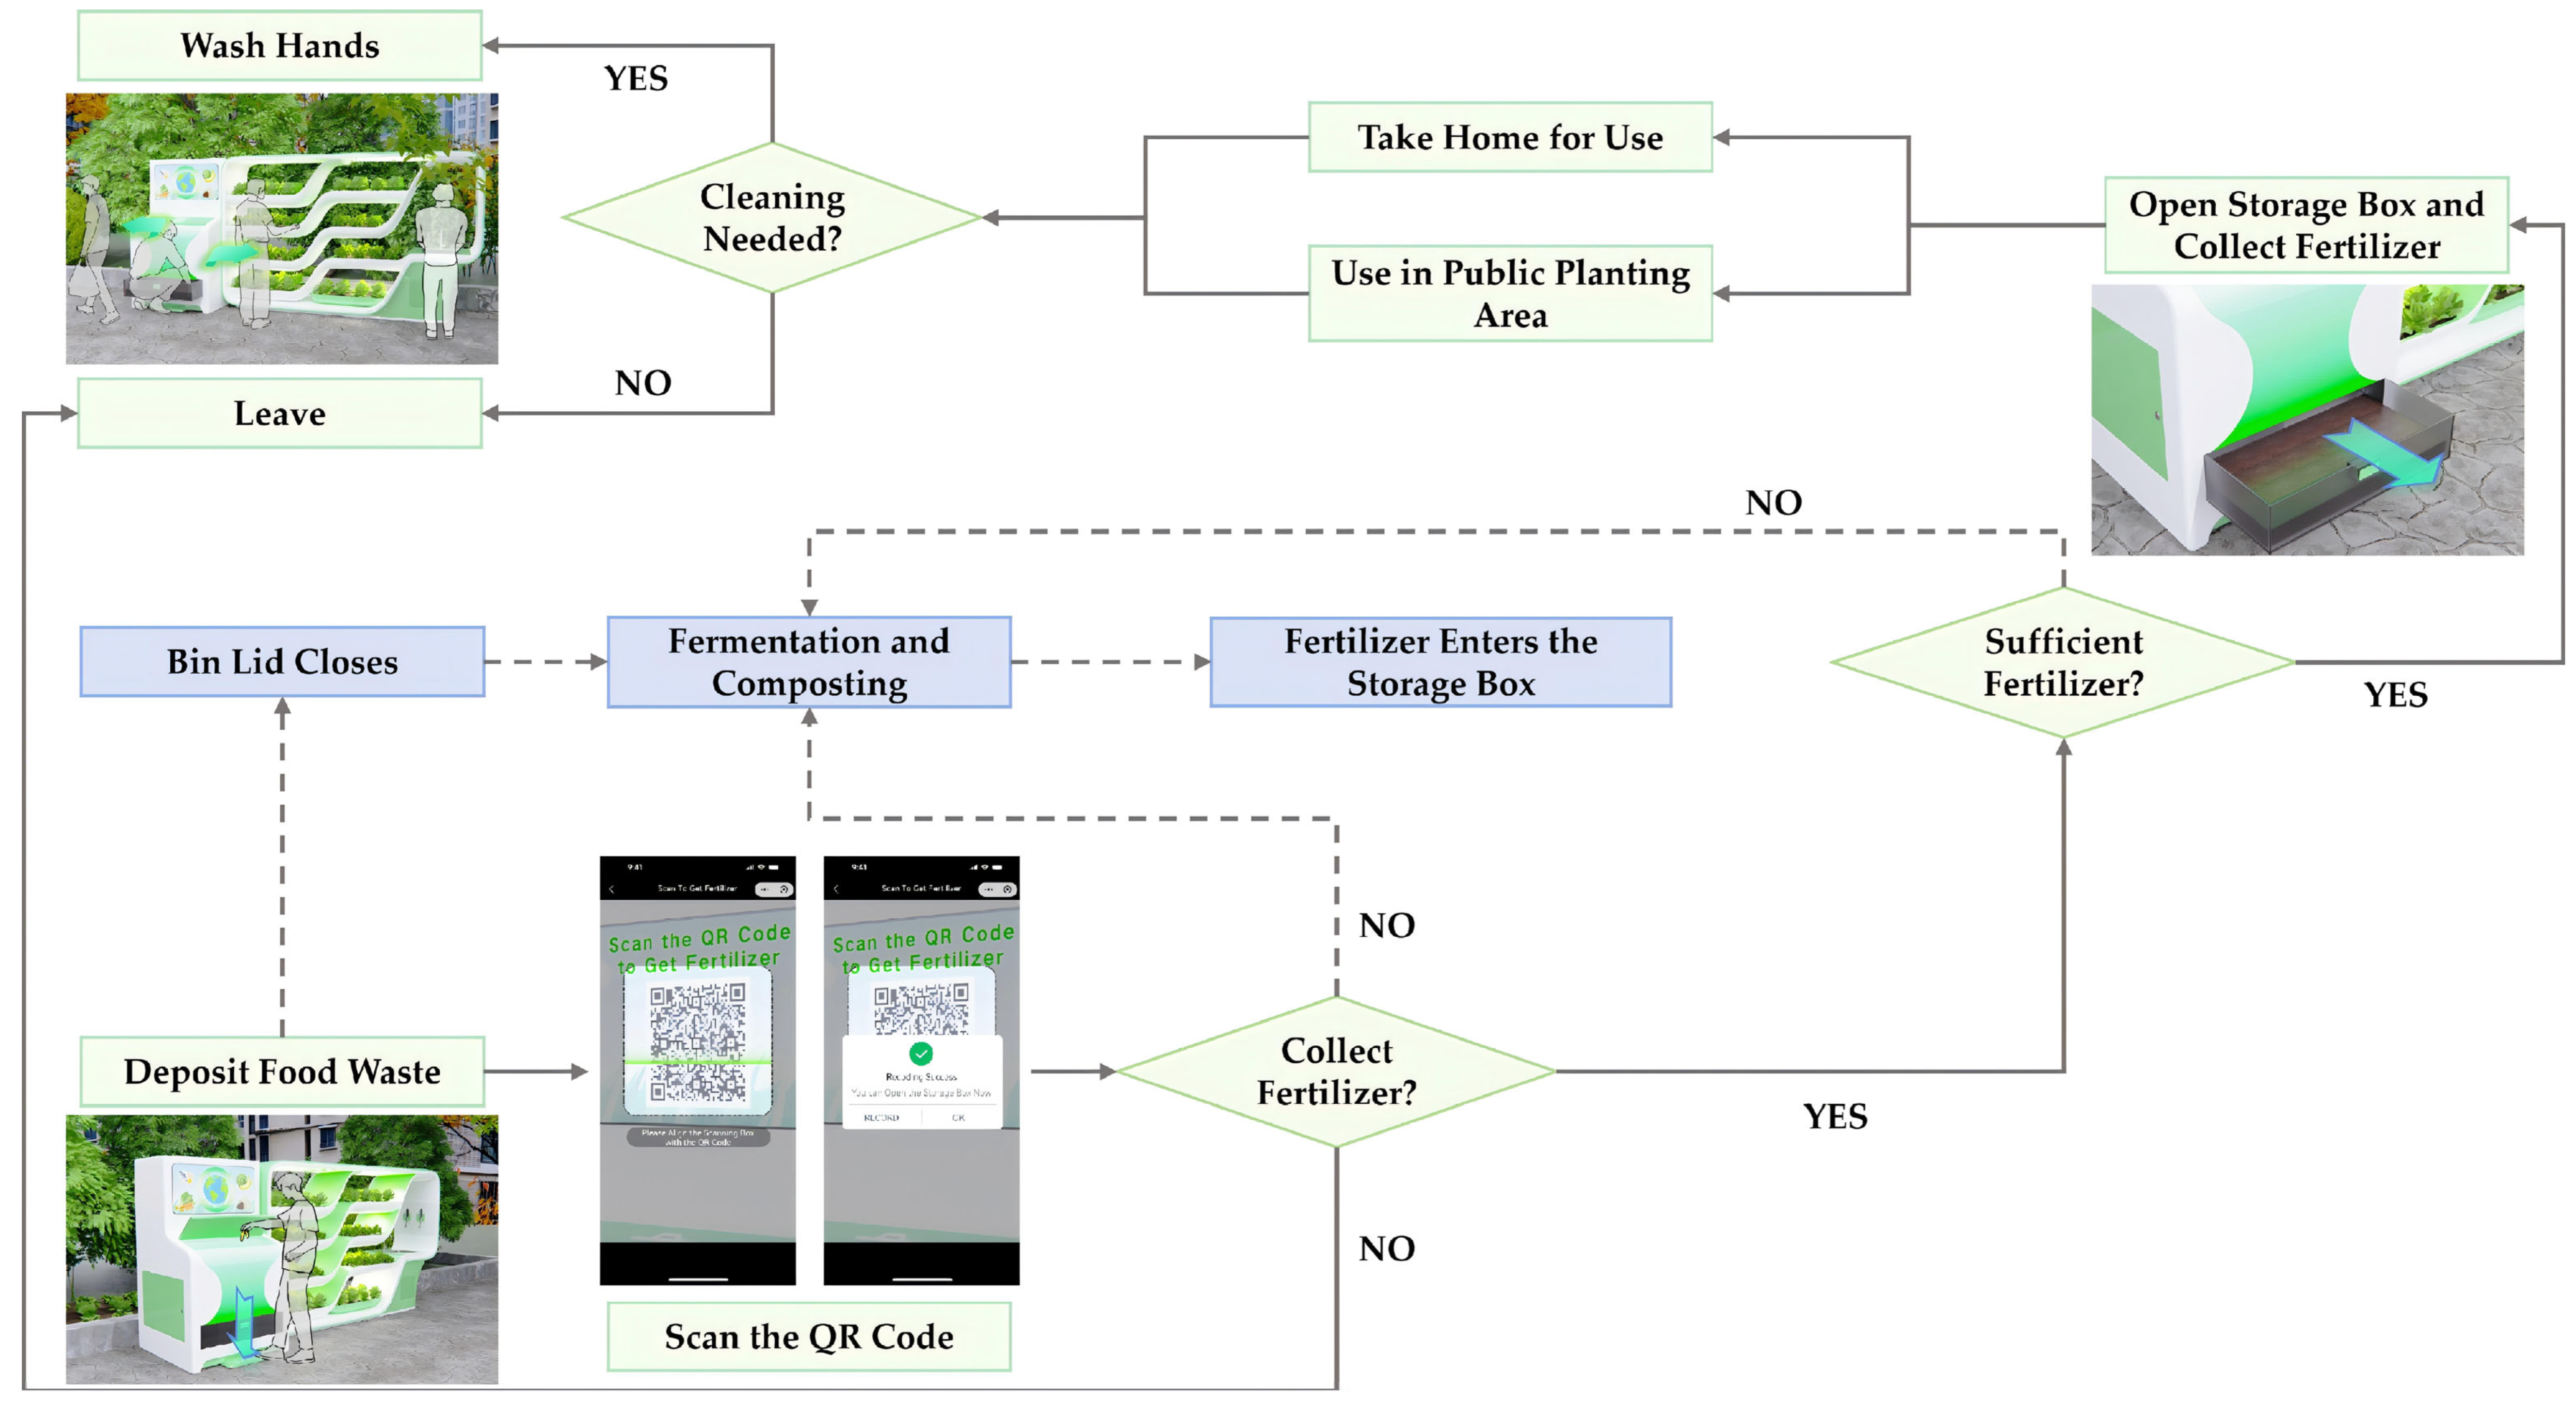
Based on the aforementioned analysis results, this study organizes the key design elements and divides the facility into three main functional areas: the food waste disposal area, the public planting area, and the cleaning area, forming the functional module layout diagram shown in Figure 6. The waste disposal inlet is located in the center of the facility and is designed in a different color from the facility body to guide residents in quickly finding the correct waste disposal location. Waste enters the container through the disposal inlet, undergoes fermentation, and is converted into compost, which then falls into the fertilizer storage box. Residents can open the fertilizer storage box to collect the compost and use it in the public planting area. After completing the process, they can clean their hands in the cleaning area.

5. Design Practice

5.1. Design Scheme Generation

The purpose of this design project is to conduct a preliminary assessment of the feasibility of applying the design strategy—based on affordance—to community food waste management facilities through the processes of scheme generation, design presentation, and expert evaluation, thereby demonstrating its potential for application in the design of such facilities. Furthermore, it aims to explain how to translate the deep influencing factors of residents’ willingness to use into executable design elements to improve the efficiency of food waste recycling and resource reuse.
Based on the above theoretical framework and demand analysis, a product is designed to support residents in developing more accurate waste sorting habits and to promote the recycling and reuse of food waste. After residents dispose of food waste, the product processes it through crushing and mixing, followed by high-temperature sterilization, and then conducts decomposition and fermentation to produce compost for their use. Residents can collect the compost and either apply it directly in the public planting area or take it home for personal use.
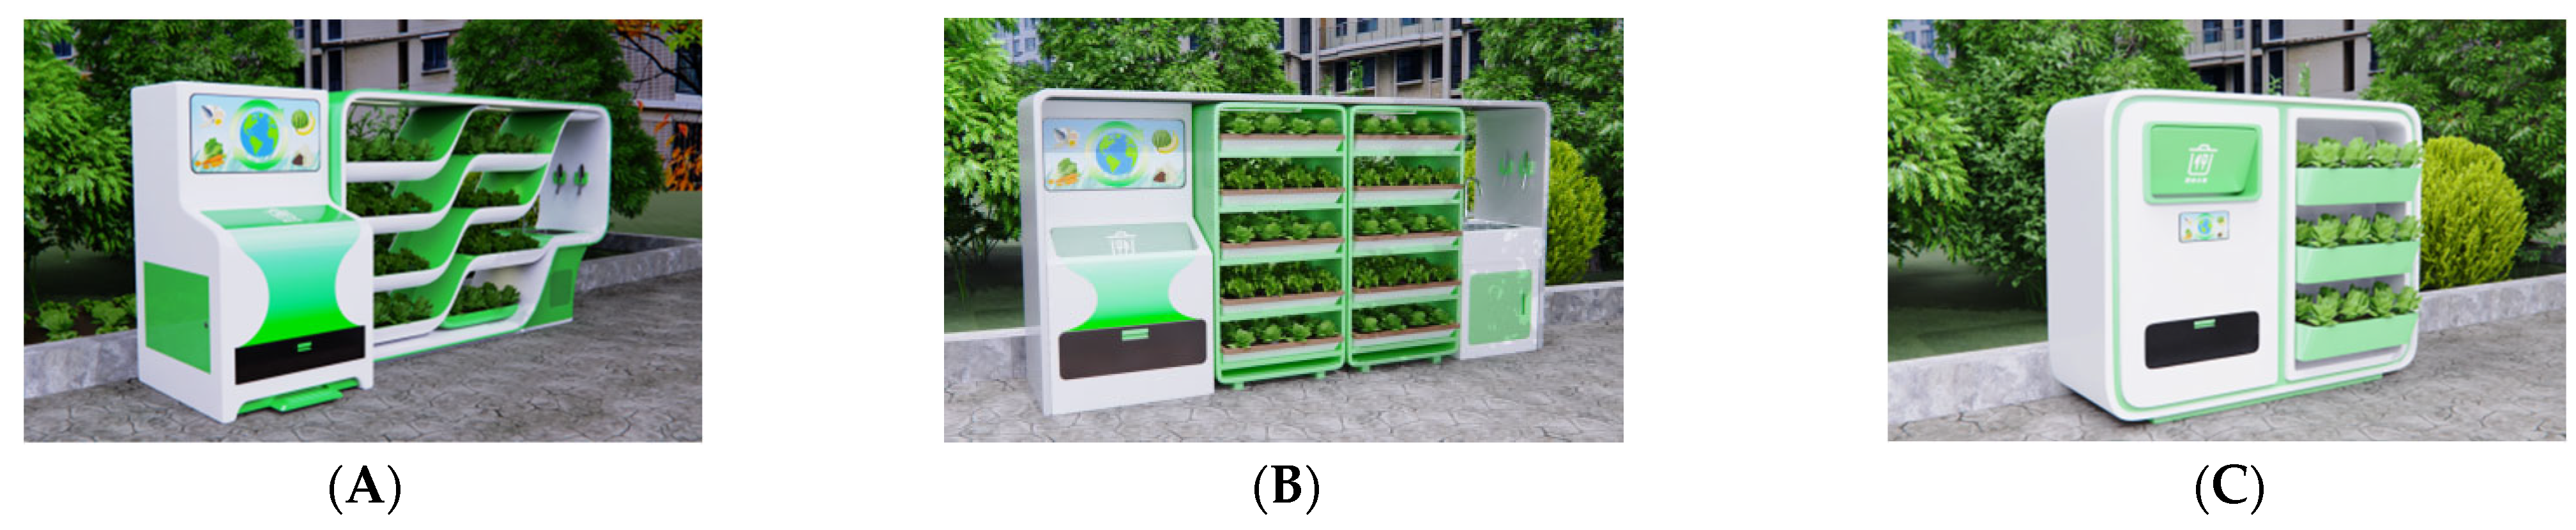
To evaluate the differences in performance of the key design elements derived from BIATM in solution selection, three design schemes are initially proposed, as shown in Figure 7. Based on the weight ranking and affordance-based design element analysis, and to ensure that the evaluation results mainly reflect the differences in key needs derived from BIATM, the three schemes remain consistent in basic functions (such as “A1: Reduced Odor Impact” and “B1: large capacity”), processing procedures (such as “A4: post-use cleaning” and “D4: ease of use”), and in how they address the need of “C2: incentive feedback”, which influences sustained user motivation. Differences are introduced in four needs that affect users’ willingness to use: “A2: Contact-Free Disposal”, “B2: Effort-Saving Use”, “B4: complete supporting facilities” and “C1: simple and clear appearance”.
Among them, Scheme A focuses on providing affordance cues by addressing “A2: Contact-Free Disposal”, “B2: Effort-Saving Use” and “B4: complete supporting facilities”. Scheme B focuses on “B2: Effort-Saving Use” and “B4: complete supporting facilities”, while Scheme C focuses solely on achieving “C1: simple and clear appearance”.

5.2. Selection of the Optimal Design Scheme Using TOPSIS

To conduct a rigorous evaluation and achieve optimal selection among the design schemes, seven evaluation criteria were established: Odor Impact, Hygiene Anxiety, Physical Burden, Ease of Use, Clarity of Appearance, Sustained Willingness to Use, and Learning Cost. Ten experts were invited to evaluate the three schemes, including three industrial designers, three community property management staff, and four neighborhood committee representatives. After providing explanations of the functions and evaluation criteria, the experts rated the performance of each scheme under different criteria using a 100-point scale. The evaluation was primarily based on the experts’ judgment of the conceptual schemes, resulting in the Original Decision Matrix Q, as shown in Table 18.
After obtaining the original scoring matrix, to assess the reliability of the expert ratings used in the TOPSIS evaluation, Kendall’s coefficient of concordance (Kendall’s W) was calculated for each criterion, with adjustments applied for tied rankings when necessary. Cronbach’s alpha was also used to examine the overall internal consistency of the expert rating matrix. The results are shown in Table 19. The Kendall’s W values for the seven criteria range from 0.790 to 1.000, and all values are statistically significant (p < 0.001). In addition, the overall Cronbach’s alpha coefficient is 0.994, indicating a high level of internal consistency among the ten experts. This confirms that the expert ratings are highly reliable and suitable for subsequent scheme selection based on TOPSIS.
The original scoring data were normalized using the square root of the sum of squares method to obtain the Standardization Matrix M, as shown in Table 20. The Weighted Normalization Matrix K was then calculated by multiplying the absolute weights in Table 3 with the normalized matrix, as shown in Table 21.
After the Weighted Normalization Matrix K had been obtained, the positive and negative ideal solutions were defined. Specifically, the maximum value in each row was taken as the positive ideal solution, whereas the minimum value was taken as the negative ideal solution, yielding the positive ideal solution k j + = ( k 1 + , k 2 + , …, k m + ) and the negative ideal solution k j =( k 1 , k 2 , …, k m ) . The Euclidean distances were then calculated according to Equations (9) and (10), after which the relative closeness coefficient Z between each scheme and the ideal solutions was calculated using Equation (11). The schemes were subsequently ranked according to their relative closeness coefficients to determine the optimal scheme: the higher the relative closeness coefficient, the higher the priority of the scheme, and vice versa. The calculation results are shown in Table 22.
Euclidean Distance to the Positive Ideal Solution:
D i + = j = 1 m ( k j + k i j ) 2
Euclidean Distance to the Negative Ideal Solution:
D i = j = 1 m k j k i j 2
Calculation of the Relative Closeness Coefficient:
Z i = D i D i + D i +
Based on the relative proximity results calculated using the TOPSIS method, the differences in overall performance among the various schemes are quite pronounced. The results indicate that Scheme A, which meets the requirements that influence users’ initial willingness to use the product—namely, “A2: Contact-Free Disposal”, “B2: Effort-Saving Use”, and “B4: Complete Supporting Facilities”—possesses a clear advantage under multi-criteria evaluation and is the optimal choice. This demonstrates that the design scheme derived from the BIATM exhibits good application potential in the comparison of conceptual designs.
What should be noted is that the purpose of using TOPSIS to conduct a comparative evaluation of the conceptual designs in this study was to verify whether the key design elements derived from the BIATM could yield relatively consistent preferred results at the design level, thereby providing preliminary support for the practical application of this model.

5.3. Presentation of the Final Design Scheme

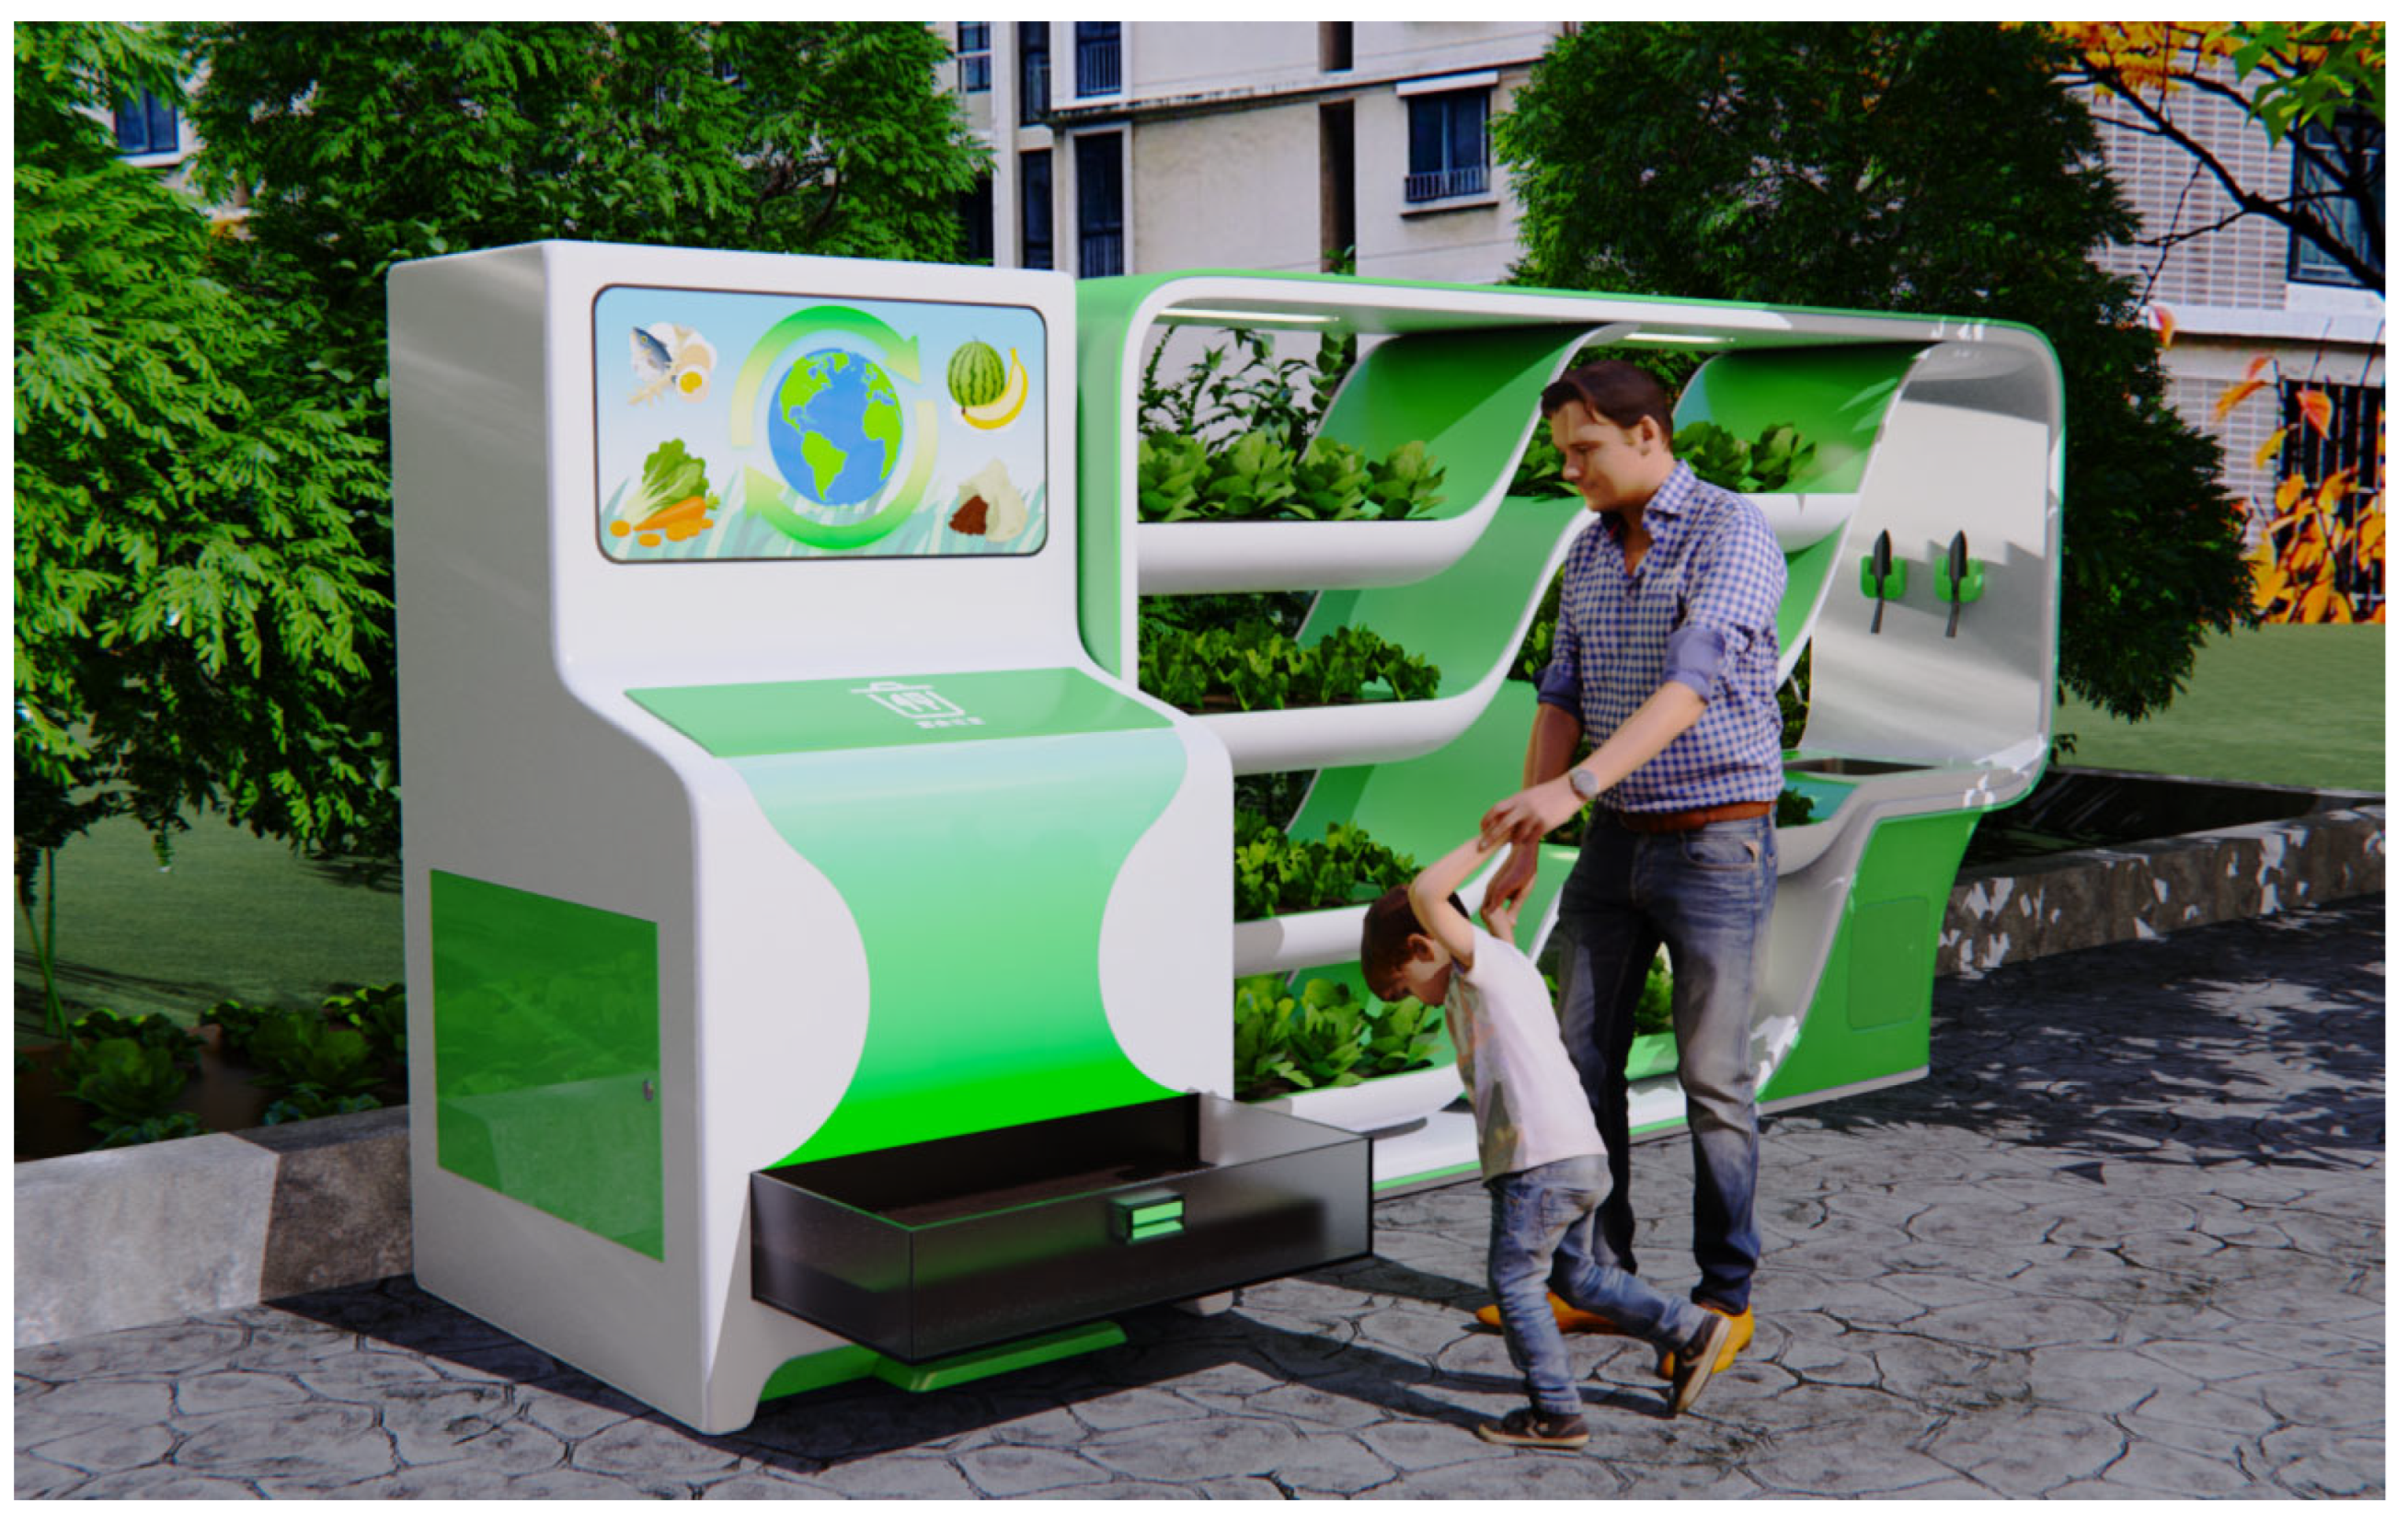
The overall scheme stands 1.8 m tall, with the waste disposal opening located 1.2 m above the ground. It adopts a white–green color palette. The white base symbolizes cleanliness, while green corresponds to the natural cycle in which food waste is fermented into fertilizer and supports plant growth, conveying a visual sense of environmental sustainability and vitality. In terms of form, smooth and fluid wave-like curves run throughout the design. The curved contour of the waste bin on the left naturally connects with the layered wave structure of the planting area on the right, forming an integrated visual composition. This design metaphorically represents the dynamic process of material circulation and communicates, through intuitive visual language, the vision of waste resource utilization and community sustainability, as shown in Figure 8, and the internal components are shown in Figure 9.

5.4. Public Participation in the Sustainable Food Waste Management Process

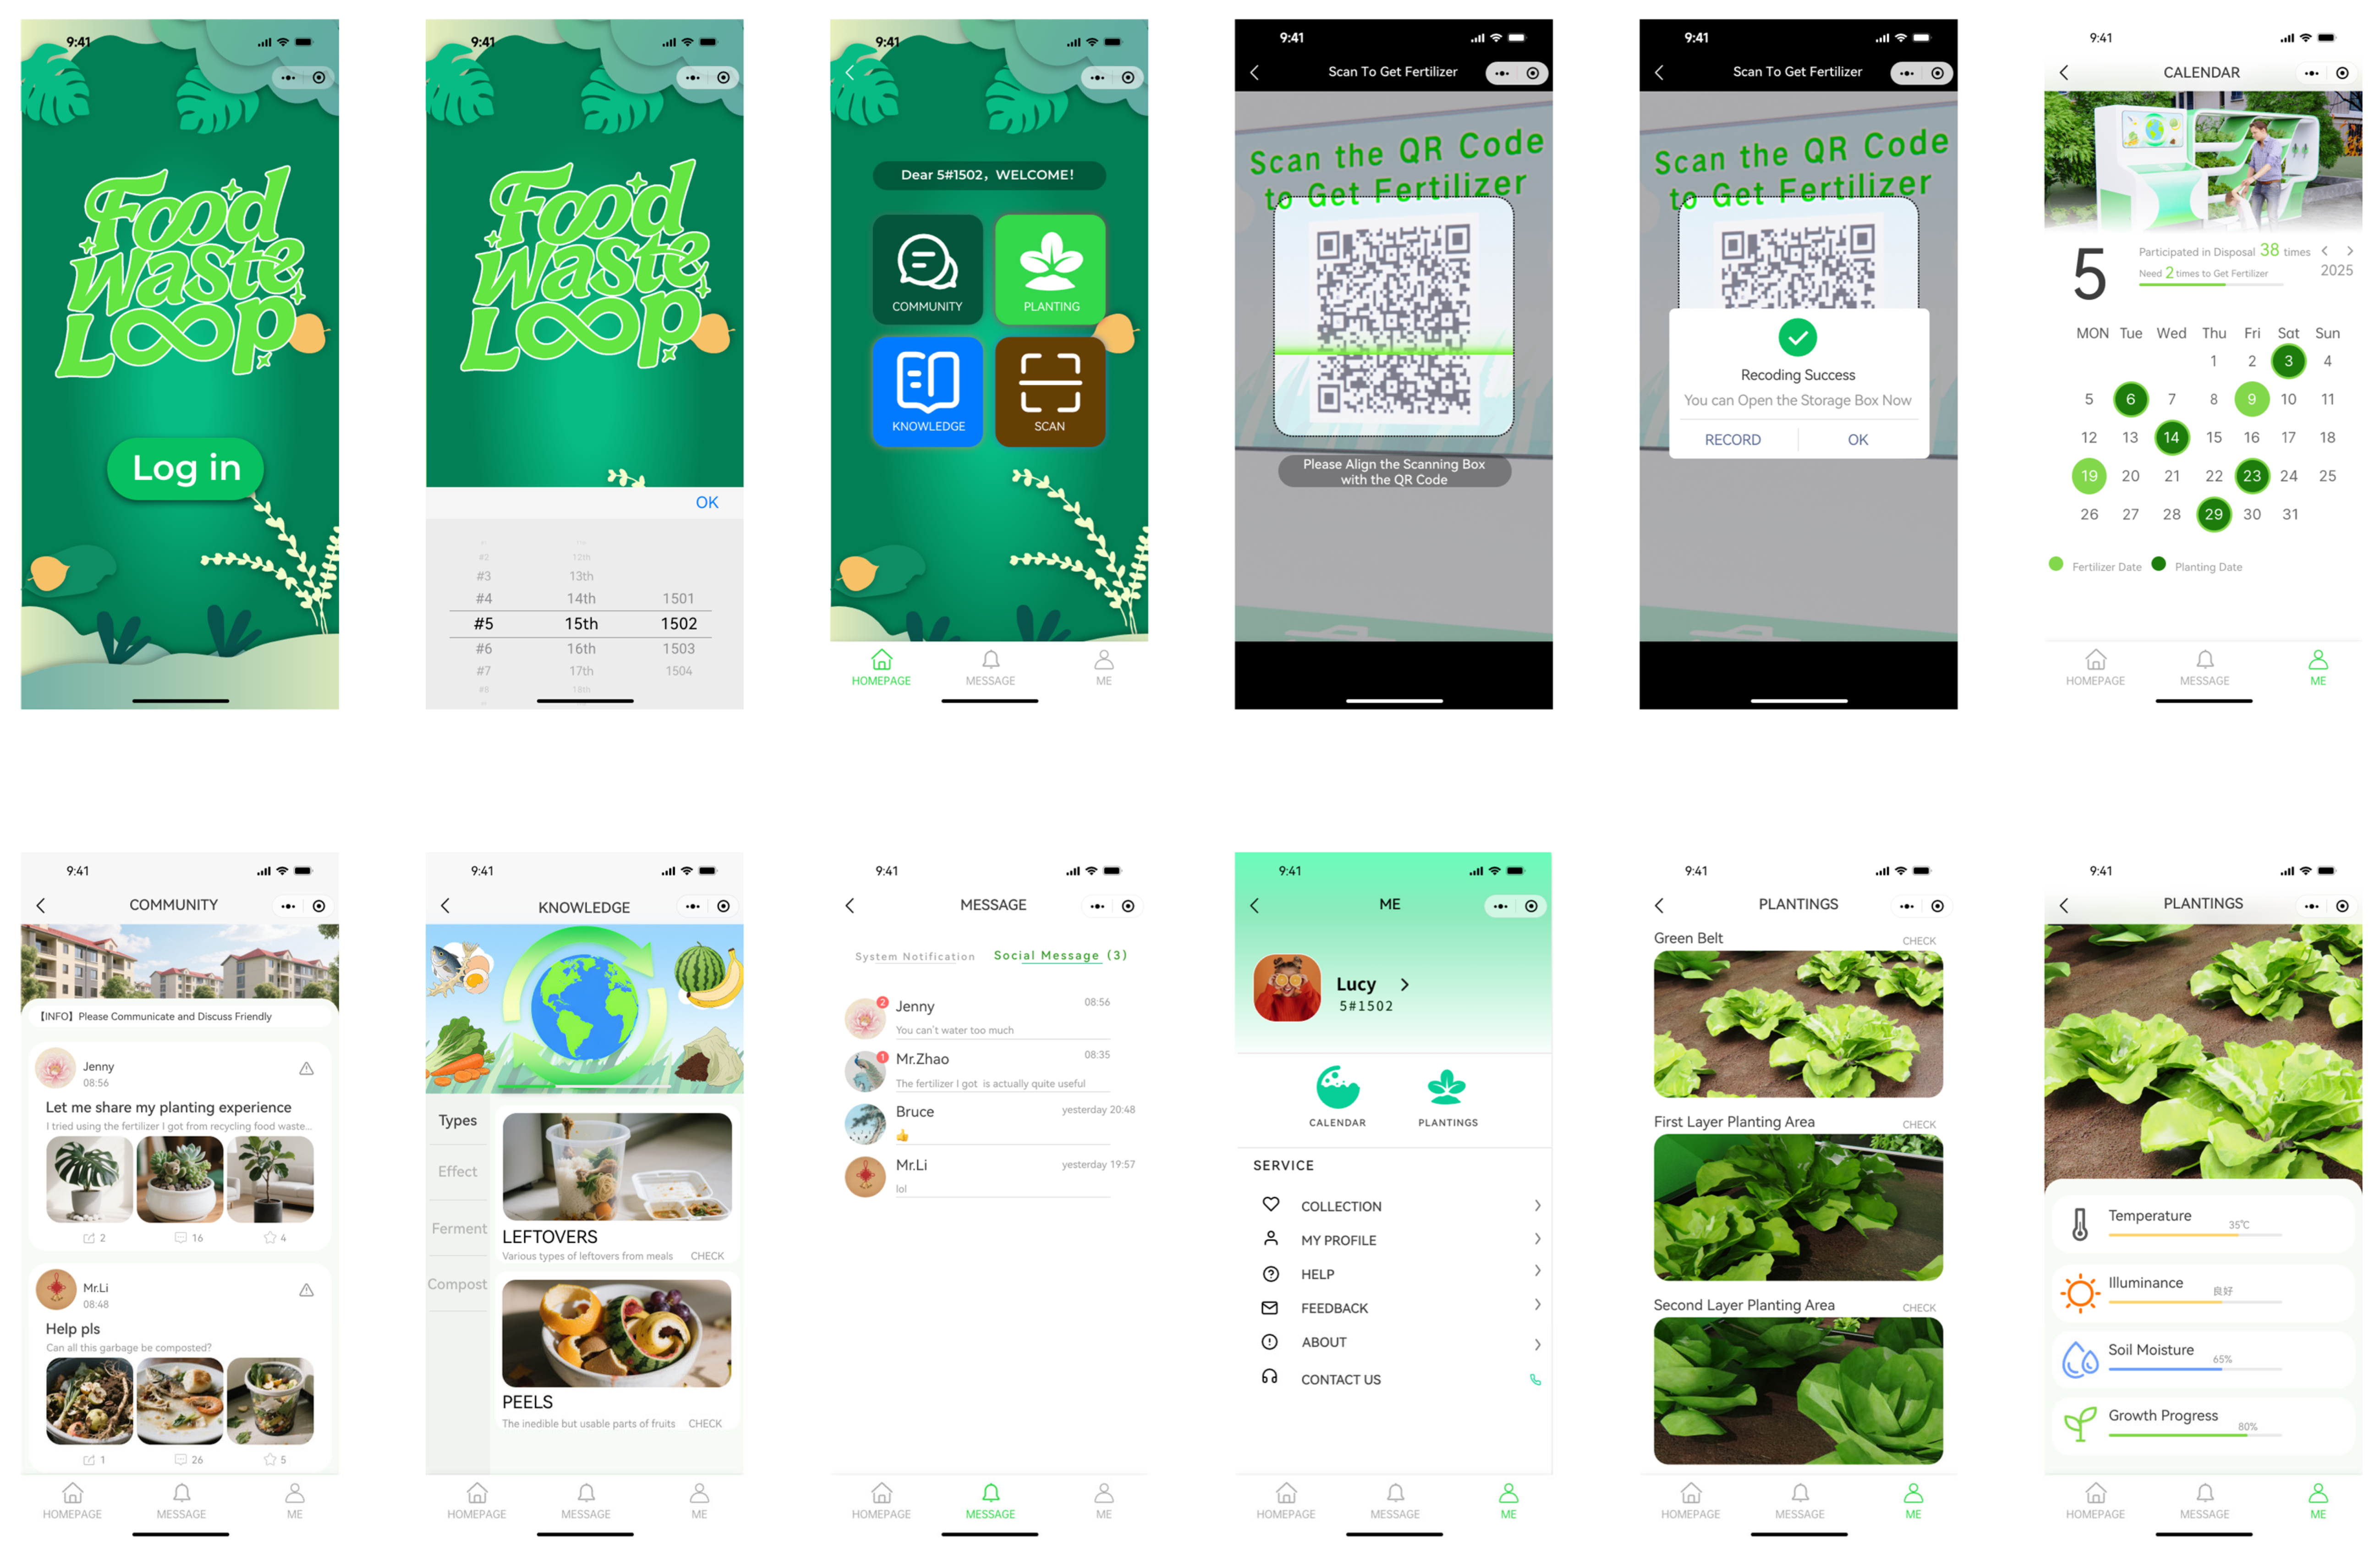
Intelligent interaction has become an integral part of everyday life and urban environments [59]. Integrating intelligent interaction into public facilities helps foster positive interactions between residents and facilities [60,61]. Therefore, to support residents’ active participation in the food waste management process and enhance their sense of gain, deservedness, and identity, a mechanism is introduced—within the process shown in Figure 10—where simple identity verification is required before rewards can be obtained. Centered on the process of “food waste disposal—fertilizer acquisition—fertilizer use for planting”, additional functions such as a community communication platform, knowledge dissemination, and activity records are incorporated. These functions are integrated into an APP for residents’ use, as shown in Figure 11.

6. Discussion

6.1. Main Findings

This study aims to guide residents to participate in food waste resource recycling and promote sustainable development, with a focus on maintaining residents’ willingness to continuously use community food waste management facilities. A system design strategy based on Affordance Theory is constructed to deeply analyze the intrinsic relationships underlying residents’ willingness to use. The results show that, at the level of explicit expression, residents place the greatest emphasis on “C: willingness to use”, particularly the needs of “C2: incentive feedback” and “C1: simple and clear appearance”. However, according to the hierarchical analysis of needs, the root factors that determine whether behavior can occur are not incentives themselves, but “A2: Contact-Free Disposal” and “B2: Effort-Saving Use” which are directly related to hygiene and operational burden. This indicates that, in the context of community food waste management, residents’ sustained participation is not determined solely by the added value of facilities, but depends on whether there are hygiene risks during approach, contact, and disposal, as well as the physical burden imposed during operation.
The study shows that residents’ explicit preference needs are not fully aligned with the prerequisites for behavior initiation. For community public facility design, it is necessary to first address deeper constraints such as hygiene anxiety and operational burden. Only then can incentive mechanisms and positive feedback function effectively to sustain continued use behavior. In this way, the study extends existing research on community waste classification, which tends to emphasize publicity, institutional constraints, or incentive mechanisms, by highlighting the critical role of facilities themselves as mediators that trigger behavior.
This result can also be understood in relation to the specific characteristics of the study sample. The reason why needs related to hygiene and operational burden appear as root-level driving factors may not only reflect the inherent characteristics of food waste disposal behavior but also relate to the sociodemographic structure of participating residents. In communities where residents are more sensitive to hygiene and physical contact, or where there is a higher proportion of elderly residents, hygiene anxiety and physical burden are likely to play a more prominent role in influencing whether residents are willing to approach and use the facilities. In this sense, the root-level positions of “A2: Contact-Free Disposal” and “B2: Effort-Saving Use” carry both behavioral significance and contextual sensitivity. Discussing this possibility helps to more rigorously define these findings as context-dependent design implications and provides directions for further validation across different population groups and community settings.

6.2. Theoretical Contributions

This study proposes and preliminarily validates a more explanatory design proposition: in the design of community public service facilities, residents’ explicitly expressed important needs are not necessarily the fundamental drivers of behavior initiation and sustainability. Design aimed at promoting sustained participation should first address deeper behavioral prerequisites, and then maintain engagement through surface-level feedback and incentive mechanisms.
Existing studies indicate that hygiene concerns and convenience barriers are important factors influencing waste disposal behavior [62,63]. Consistent with these findings, this study also shows that needs related to hygiene and operational burden play a significant role. In this study, the BWM results indicate that “C2: incentive feedback” and its related needs have higher weights in explicit expressions, while the ISM results further reveal that “A2: Contact-Free Disposal” and “B2: Effort-Saving Use” are the root-level prerequisites that determine whether behavior occurs. Together, these findings suggest that the ranking of explicit needs does not always align with the underlying behavioral drivers. Therefore, public facility design should not rely solely on surface-level preferences for resource allocation, but should first address the fundamental conditions required for behavior initiation.
In the application of Affordance Theory, compared with existing studies on affordance and behavior guidance, this study not only uses affordance as an explanatory framework for existing design outcomes, but also positions it as a link between demand analysis methods and design intervention. In addition, social affordance is incorporated into the analytical framework. Through this approach, the application of Affordance Theory is further extended to the design context of sustained participation in community public service facilities, where it is used to explain and guide how facilities support the initiation and continuation of behavior through physical, perceptual, cognitive, functional, and social cues.
Therefore, the contribution of this study does not lie in repeatedly identifying the determinants of pro-environmental or waste sorting behavior that have already been extensively examined in existing studies. Instead, it lies in reconstructing these factors from “behavioral influencing factors” into “design objectives with hierarchical differences”, and revealing how the relationships among these factors influence users’ willingness to use. These are then systematically translated into public facilities design strategies through the BIATM, expanded the scope of application of affordance theory in the field of sustainability. The significance of BIATM is not limited to demand ranking or scheme selection. Its core lies in uncovering the structural relationship between explicit preferences and deeper behavioral prerequisites, and further translating this relationship into an affordance-oriented design logic. Accordingly, this study defines BIATM as a design research model with contextual transfer potential. It is more suitable for community service facilities characterized by publicness, shared use, behavior guidance objectives, and requirements for sustained participation, rather than as a universal model applicable to all design problems.

6.3. Policy Discussion

The results of this study indicate that the key factors influencing residents’ sustained participation are not fully aligned with their explicitly expressed preferences. Conditions such as hygiene assurance, including Contact-Free Disposal, and basic usability are more likely to serve as prerequisites for behavior initiation. Therefore, facility provision standards should shift from “whether facilities should be installed” to “whether they can be continuously used”.
In addition, relevant policies should incorporate coordinated facility operation and maintenance into the design scope, rather than treating them as secondary issues after installation. Without stable cleaning and maintenance, equipment repair, clear responsibility allocation, and feedback mechanisms, even facilities with strong behavioral guidance potential at the conceptual design level may lose user trust and the basis for sustained use due to negative user experiences.
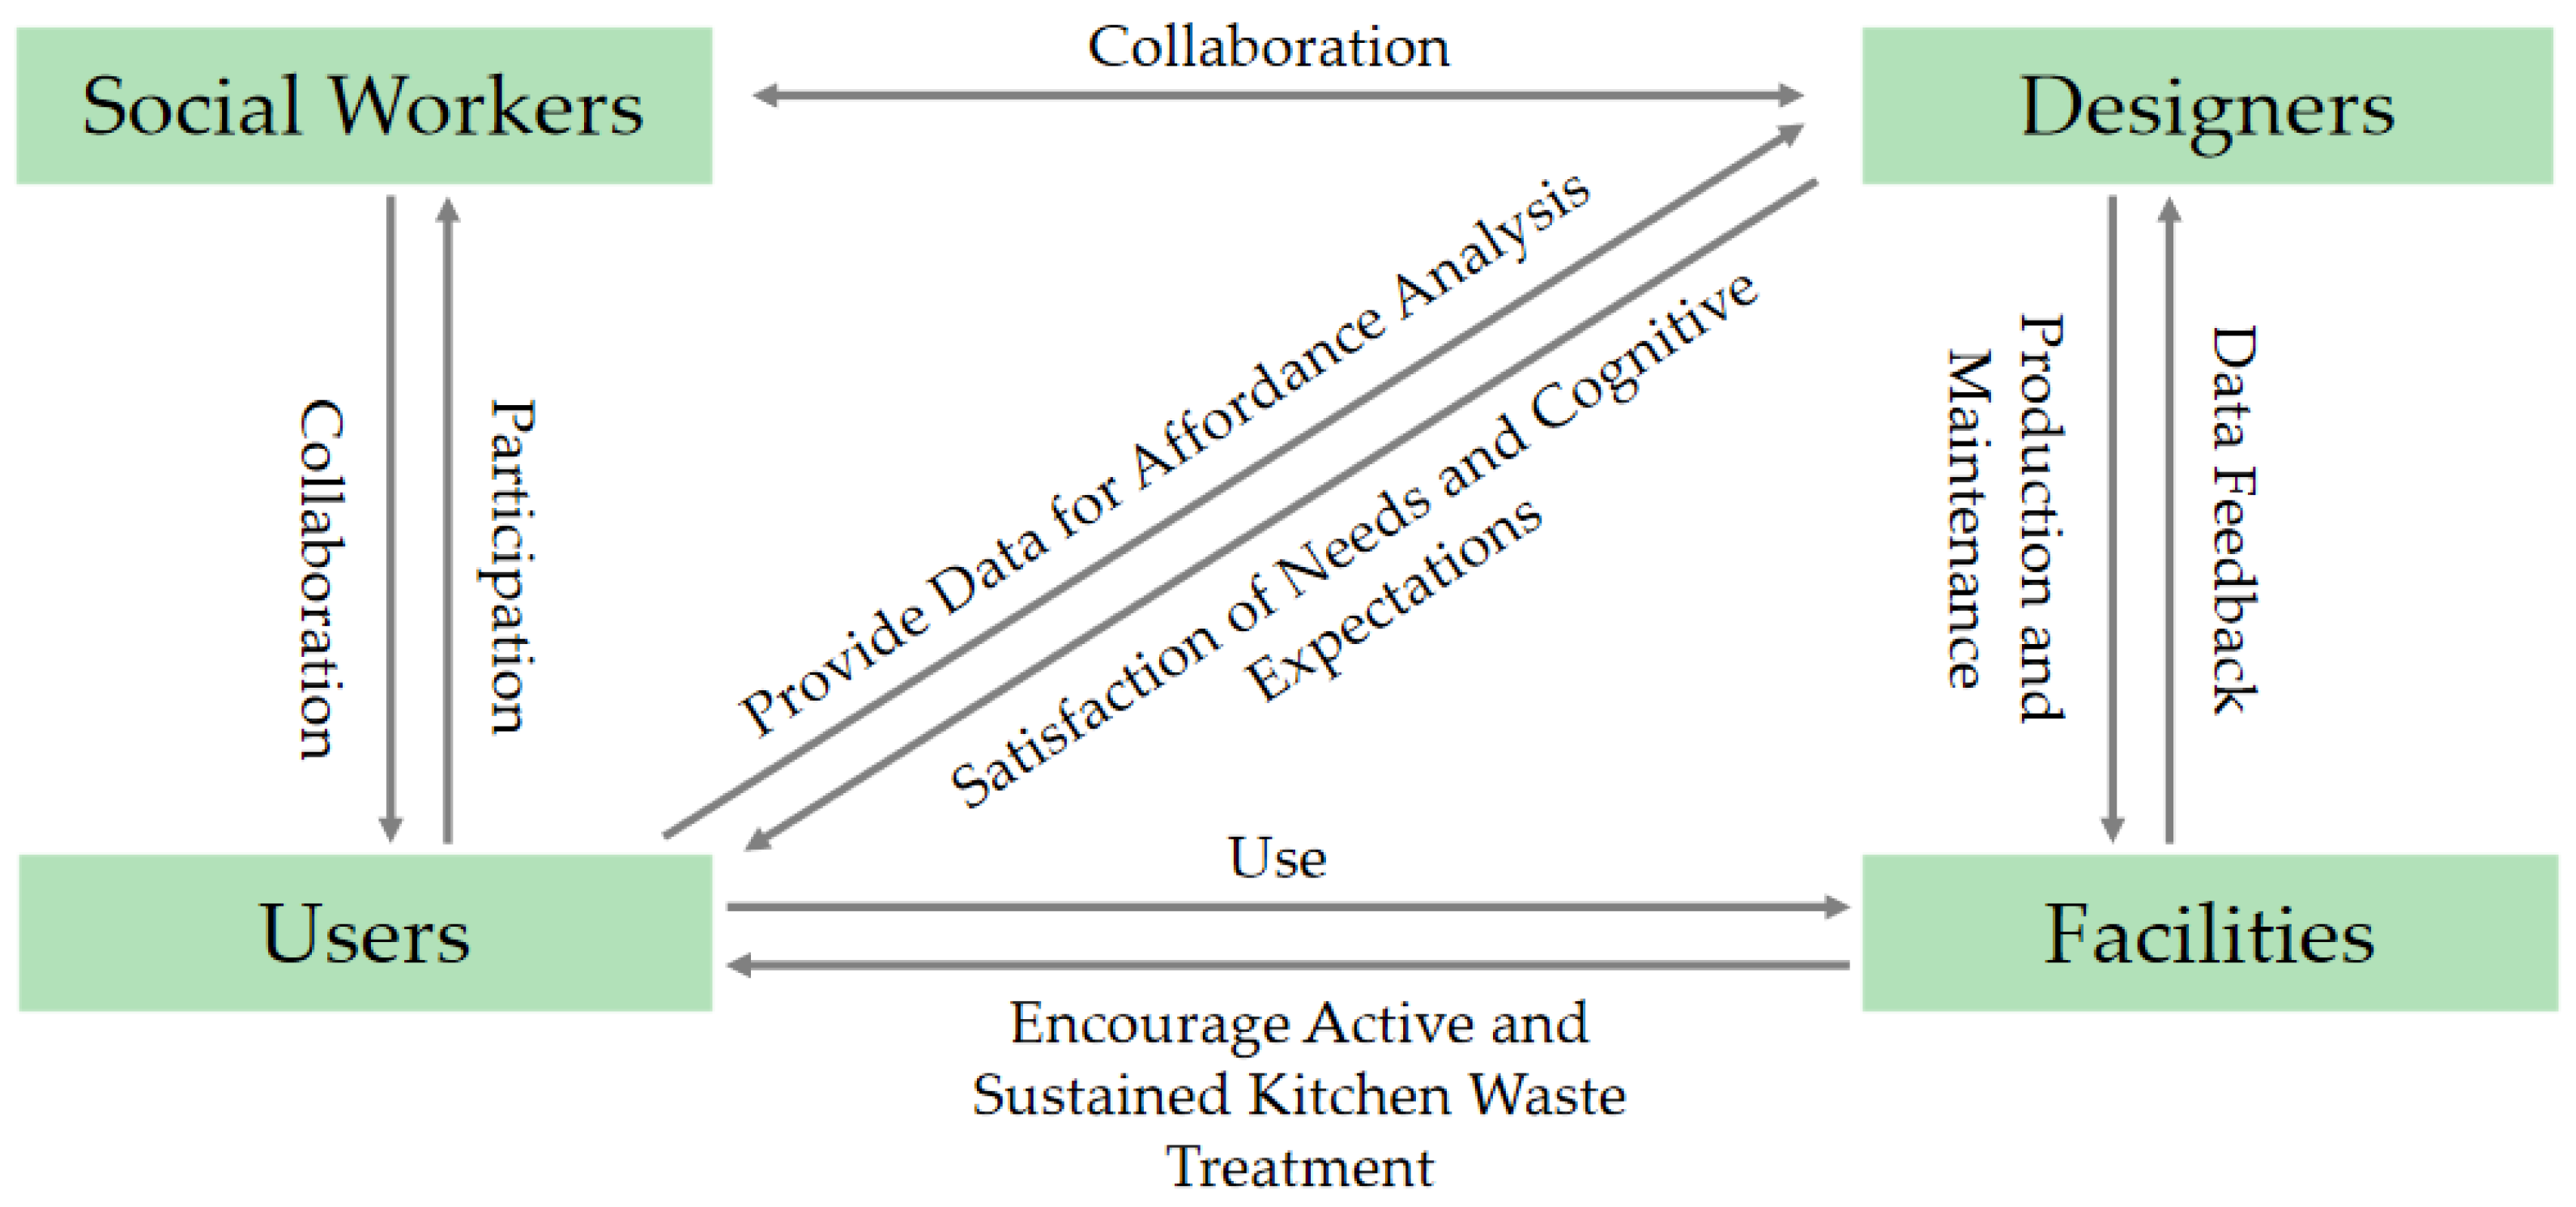
Although incentive feedback helps enhance residents’ willingness to participate continuously, its effectiveness depends on appropriate boundaries and stable operation and maintenance. On the one hand, if rewards are designed to be overly immediate or excessively frequent, they may induce utilitarian participation or even opportunistic misuse, thereby undermining the fairness of community public resource allocation [64]. On the other hand, if the facility lacks stable cleaning, consumable replenishment, fault maintenance, and status management, the Hygiene Anxiety formed during residents’ initial experience may be reinforced, quickly eroding trust and interrupting continued use [65,66]. Therefore, the incentive mechanism should place greater emphasis on low-threshold participation, phased feedback, and the visualization of outcomes, so as to avoid reducing participation to a short-term exchange behavior. Meanwhile, the operation and maintenance mechanism should rely on coordination among the community, property management, and residents to ensure the continuous and reliable functioning of the facility in terms of hygiene, functionality, and feedback [67,68], as shown in Figure 12.

6.4. Limitations and Future Research Directions

This study conducts demand ranking and identifies the relationships among needs for community food waste management facilities, and constructs a pathway from demand analysis to design translation. However, several limitations remain. The interview and survey samples are mainly drawn from specific community contexts, and the sample size and geographic coverage are limited. Differences in needs across varying urban governance models, community densities, and resident structures have not been fully compared. In addition, factors such as population density, age distribution, management approaches, and cognitive levels within communities may influence both the priority and structural position of different user needs. Future research can enhance external validity by including more communities, larger samples, and cross-regional comparisons.
In addition, although the qualitative coding process was conducted collaboratively and disagreements between researchers were resolved through discussion to improve coding consistency, a formal inter-rater reliability index, such as Cohen’s kappa, was not calculated or reported. Therefore, the reliability of the coding process was ensured primarily through consensus-based discussion rather than through a statistically verifiable measure of coder agreement. This may limit the methodological rigor and reproducibility of the qualitative analysis to some extent.
In the ISM analysis, this study adopts a 0–4 influence scale instead of the traditional binary 0/1 scale. While the 0–4 scale allows for a more nuanced distinction of influence levels and captures partial or moderate relationships between factors, it also introduces greater subjectivity. Respondents may interpret intermediate values differently, which could affect the hierarchical structure of needs. Future research may combine quantitative ratings with actual behavioral data to further validate the relationships among factors.
Similarly, when using TOPSIS for scheme selection, the results still rely to some extent on expert judgment and subjective ratings rather than actual user behavior data from real communities. Therefore, this study remains at the level of conceptual validation of schemes rather than empirical verification of residents’ willingness to use, sustained participation behavior, or community engagement outcomes. And cannot fully replace long-term behavioral data from real usage contexts. It has not yet been tested through real community deployment to examine the long-term effects of the facilities on disposal frequency, misclassification rate, dwell time, sustained usage rate, and community interaction.

7. Conclusions

To enhance residents’ willingness for sustained participation in food waste management and to promote environmental and social sustainability, this study proposes a system design strategy that integrates demand weight identification, hierarchical relationship analysis, and Affordance Theory. On this basis, the BIATM demand translation model is constructed and applied to the design of community food waste management facilities, with TOPSIS used to complete scheme evaluation and selection.
The results show that integrating demand weight identification, hierarchical analysis of demand structure, and affordance-based design translation helps more accurately identify the factors influencing residents’ participation and sustained use of community public facilities. It also enables community food waste management facilities to function as behavioral mediators that promote resident participation, support community resource circulation, and contribute to sustainable development.
The broader significance of this study lies in its relevance to the United Nations Sustainable Development Goals. By integrating demand analysis, hierarchical decomposition of needs, and Affordance Theory, this study provides a practical pathway for public facility design to support more sustainable patterns of consumption, disposal, and resource reuse. It offers preliminary theoretical support in areas such as hygiene assurance, usability, resident participation, and community-level resource circulation, thereby contributing to the achievement of SDG 11 (Sustainable Cities and Communities). These aspects are essential for improving the quality and sustainability of everyday urban living environments. In addition, by promoting food waste management and resource recovery at the source, and by transforming disposal behavior into a more sustainable and responsible form of participation, this study also contributes to the achievement of SDG 12 (Responsible Consumption and Production).
Finally, this study provides a methodological reference for the design of community food waste management facilities and offers new practical evidence for the application of Affordance Theory in sustainable public product design. It contributes to the recycling and reuse of food waste within communities, improves resource recovery rates and value realization, and promotes the harmonious development of society and the environment.

Author Contributions

Conceptualization, C.L. and K.W.; methodology, C.L.; validation, K.W. and T.W.; formal analysis, T.W.; investigation, K.W.; data curation, Y.H.; writing—original draft preparation, K.W.; writing—review and editing, C.L.; visualization, Y.H. All authors have read and agreed to the published version of the manuscript.

Funding

This work was supported by the Philosophy and Social Science Research Project of the Hubei Provincial Department of Education (23Y048).

Institutional Review Board Statement

The study was conducted in accordance with the Declaration of Helsinki, and approved by Hubei University of Technology Committee on Scientific Research Ethics and Science and Technology Security (protocol code HBUT20260017 and date of approval 17 December 2025).

Informed Consent Statement

Informed consent was obtained from all subjects involved in the study.

Data Availability Statement

The original contributions presented in the study are included in the article, further inquiries can be directed to the corresponding author.

Conflicts of Interest

The authors declare no conflicts of interest.

Abbreviations

The following abbreviations are used in this manuscript:
BWMBest–Worst Method
ISMInterpretive Structural Modeling
CRConsistency Ratio
CIConsistency Index
BIATMBWM—ISM—Affordance Translation Model
k+Positive Ideal Solution
kNegative Ideal Solution
D+Euclidean Distance to Positive Ideal Solution
DEuclidean Distance to Negative Ideal Solution
ZᵢRelative Closeness Coefficient

Appendix A

Table A1. The Best Criteria Selected by Experts and B—O Vectors.
ExpertThe Best Criterion
Selected
B—O Vectors
Hygiene
Anxiety
Ease of
Operation
Willingness to
Use
Use
Cost
1Willingness to Use4318
2Willingness to Use2317
3Hygiene Anxiety1753
4Hygiene Anxiety1575
5Willingness to Use3215
6Ease of Operation7157
7Willingness to Use1217
8Ease of Operation5124
9Use Cost2511
10Willingness to Use4315
Table A2. The Worst Criteria Selected by Experts and W—O Vectors.
ExpertThe Worst Criterion
Selected
W—O Vectors
Hygiene
Anxiety
Ease of
Operation
Willingness to
Use
Use
Cost
1Use Cost7581
2Use Cost6891
3Willingness to Use7717
4Willingness to Use6417
5Use Cost4651
6Use Cost8671
7Use Cost5571
8Hygiene Anxiety1541
9Ease of Operation4155
10Use Cost3251

References

  1. Meng, X.; Zhang, Y.; Meng, F.; Zheng, X.; Guo, J. The way out for urban household solid waste classification in China: From the perspective of multi-agent based behavior simulation. J. Clean. Prod. 2024, 472, 143363. [Google Scholar] [CrossRef]
  2. Xie, S.; Gong, Y.; Zhang, A.; Liu, Y.; Li, C. Untangling the critical success factors of the latest compulsory waste sorting initiative in Shanghai: The role of accountability governance. J. Clean. Prod. 2024, 444, 141268. [Google Scholar] [CrossRef]
  3. Cheng, G.; Luo, E.; Kou, F.; Luan, X.; Li, T.; Zhao, Y. A comparative life cycle assessment of kitchen garbage utilization approaches in China. Int. J. Life Cycle Assess. 2025, 30, 121–133. [Google Scholar] [CrossRef]
  4. Sayin, F.E.; Göktaş, R.K.; Özbay, B.; Çalli, B.; Özbay, İ. Towards Sustainable MSW via Biodrying: Enhancing Biodegradability of High Moisture Kitchen Wastes. Water Air Soil Pollut. 2026, 237, 203. [Google Scholar] [CrossRef]
  5. Peng, X.-Y.; Wang, S.-P.; Chu, X.-L.; Sun, Z.-Y.; Xia, Z.-Y.; Xie, C.-Y.; Gou, M.; Tang, Y.-Q. Valorizing kitchen waste to produce value-added fertilizer by thermophilic semi-continuous composting followed by static stacking: Performance and bacterial community succession analysis. Bioresour. Technol. 2023, 373, 128732. [Google Scholar] [CrossRef]
  6. Chu, X.-L.; Peng, X.-Y.; Sun, Z.-Y.; Xie, C.-Y.; Tang, Y.-Q. Converting kitchen waste into value-added fertilizer using thermophilic semi-continuous composting-biofiltration two-stage process with minimized NH3 emission. Bioresour. Technol. 2024, 406, 130955. [Google Scholar] [CrossRef]
  7. Pai, S.; Ai, N.; Zheng, J. Decentralized community composting feasibility analysis for residential food waste: A Chicago case study. Sustain. Cities Soc. 2019, 50, 101683. [Google Scholar] [CrossRef]
  8. De Boni, A.; Melucci, F.M.; Acciani, C.; Roma, R. Community composting: A multidisciplinary evaluation of an inclusive, participative, and eco-friendly approach to biowaste management. Clean. Environ. Syst. 2022, 6, 100092. [Google Scholar] [CrossRef]
  9. Chen, Q.; Liu, H.; Mao, P.; Qian, J.; Tan, Y.; Xiahou, X.; Cui, P. How Does NIMBYism Influence Residents’ Behavioral Willingness to Dispose of Waste in Centralized Collection Points?—An Empirical Study of Nanjing, China. Int. J. Environ. Res. Public Health 2022, 19, 15806. [Google Scholar] [CrossRef]
  10. Zhang, A.; Xie, S.; Gong, Y.; Li, C.; Liu, Y. Barriers to compulsory waste sorting for a circular economy in China. J. Environ. Manag. 2023, 342, 118180. [Google Scholar] [CrossRef] [PubMed]
  11. Luo, W.; Yu, Z.; Zhou, P.; Ren, Y.; Lv, H. Research on the Influencing Factors of Urban Community Residents’ Willingness to Segregate Waste Based on Structural Equation Model. Sustainability 2024, 16, 10767. [Google Scholar] [CrossRef]
  12. He, J.; Wu, S.; Yu, H.; Bao, C. Optimizing municipal solid waste management in Hangzhou: Analyzing public willingness to pay for circular economy strategies. Sustainability 2025, 17, 3269. [Google Scholar] [CrossRef]
  13. Zhuo, Q.; Liu, C.; Wang, B.; Yan, W. Bridging local governments and residents for household waste source separation using a business-driven, multi-stakeholder cooperative partnership model—A case study of HUGE recycling in Yuhang, Hangzhou, China. Sustainability 2023, 15, 11727. [Google Scholar] [CrossRef]
  14. Hu, J.; Hui, T.Y.; Chan, J.K. The governance mechanism of household waste sorting in China: Insights from residential communities in Yuelu, Changsha. Environ. Dev. Sustain. 2025, 1–19. [Google Scholar] [CrossRef]
  15. Ge-Zhang, S.; Cai, T.; Hu, Z.; Zhu, H.; Mu, P.; Cui, J. Investigation and Suggestions regarding Residents’ Understanding of Waste Classification in Chinese Prefecture-Level Cities—A Case Study of Maanshan City, Anhui Province, China. Sustainability 2023, 15, 11124. [Google Scholar] [CrossRef]
  16. Wang, Z.; Huang, L.; Li, W.; Xu, D. Approach or avoidance? The mechanisms underlying the impact of community goal orientation on residents’ waste separation recycling behaviors. Behav. Sci. 2024, 15, 23. [Google Scholar] [CrossRef]
  17. Li, X.; Murayama, T.; Nishikizawa, S.; Suwanteep, K. Waste Separation Behavioral Intention Among Residents After the Abolition of the Zero-COVID Policy: A Case Study of Shanghai, China. Waste 2026, 4, 1. [Google Scholar] [CrossRef]
  18. Wang, M.; Cao, K.; Muhammad Khan, N.; Hu, X.; Zhao, Y.; Dong, F. A study of residents’ behavior in participating in smart waste sorting system based on structural equation modeling. J. Mater. Cycles Waste Manag. 2025, 27, 354–368. [Google Scholar] [CrossRef]
  19. Eriksen, E.; Madsen, A.M.; Afanou, A.K.; Straumfors, A.; Eiler, A.; Graff, P. Occupational exposure to inhalable pathogenic microorganisms in waste sorting. Int. J. Hyg. Environ. Health 2023, 253, 114240. [Google Scholar] [CrossRef]
  20. Xiao, N.; Kong, L.; Wei, M.; Hu, X.; Li, O. Innovations in food waste management: From resource recovery to sustainable solutions. Waste Dispos. Sustain. Energy 2024, 6, 401–417. [Google Scholar] [CrossRef]
  21. Zebua, R.S.Y.; Sunarti; Wahyudi, A.; Hermawati, I.; Wiryanto, W.; Adnan, A.; Takariani, C.S.D.; Saputra, A.; Abidin, Z. Social learning, public participation and community engagement in waste management: A bibliometric analysis of trends and gaps. Clean. Waste Syst. 2025, 12, 100411. [Google Scholar] [CrossRef]
  22. Xiao, L.; Fu, B.; Lin, T.; Meng, L.; Zhang, O.; Gao, L. Promoting and maintaining public participation in waste separation policies—A comparative study in Shanghai, China. Resour. Environ. Sustain. 2023, 12, 100112. [Google Scholar] [CrossRef]
  23. Steg, L.; Vlek, C. Encouraging pro-environmental behaviour: An integrative review and research agenda. J. Environ. Psychol. 2009, 29, 309–317. [Google Scholar] [CrossRef]
  24. Buil, P.; Roger-Loppacher, O.; Tintoré, M. Creating the Habit of Recycling in Early Childhood: A Sustainable Practice in Spain. Sustainability 2019, 11, 6393. [Google Scholar] [CrossRef]
  25. Hartson, R. Cognitive, physical, sensory, and functional affordances in interaction design. Behav. Inf. Technol. 2003, 22, 315–338. [Google Scholar] [CrossRef]
  26. Chemero, A. An Outline of a Theory of Affordances. Ecol. Psychol. 2003, 15, 181–195. [Google Scholar] [CrossRef]
  27. Duffy, S.; Verges, M. It Matters a Hole Lot:Perceptual Affordances of Waste Containers Influence Recycling Compliance. Environ. Behav. 2009, 41, 741–749. [Google Scholar] [CrossRef]
  28. Nemat, B.; Razzaghi, M.; Bolton, K.; Rousta, K. Design affordance of plastic food packaging for consumer sorting behavior. Resour. Conserv. Recycl. 2022, 177, 105949. [Google Scholar] [CrossRef]
  29. Hsiao, S.-W.; Hsu, C.-F.; Lee, Y.-T. An online affordance evaluation model for product design. Des. Stud. 2012, 33, 126–159. [Google Scholar] [CrossRef]
  30. Gaver, W.W. Situating Action II: Affordances for Interaction: The Social Is Material for Design. Ecol. Psychol. 1996, 8, 111–129. [Google Scholar] [CrossRef]
  31. Rietveld, E.; Rietveld, R.; Martens, J. Trusted strangers: Social affordances for social cohesion. Phenomenol. Cogn. Sci. 2019, 18, 299–316. [Google Scholar] [CrossRef]
  32. Wellman, B.; Quan-Haase, A.; Boase, J.; Chen, W.; Hampton, K.; Díaz, I.; Miyata, K. The Social Affordances of the Internet for Networked Individualism. J. Comput.-Mediat. Commun. 2003, 8, JCMC834. [Google Scholar] [CrossRef]
  33. Rezaei, J. Best-worst multi-criteria decision-making method: Some properties and a linear model. Omega 2016, 64, 126–130. [Google Scholar] [CrossRef]
  34. Li, S.M.; Chan, F.T.S.; Tsang, Y.P.; Lam, H.Y. New Product Idea Selection in the Fuzzy Front End of Innovation: A Fuzzy Best-Worst Method and Group Decision-Making Process. Mathematics 2021, 9, 337. [Google Scholar] [CrossRef]
  35. Ayvaz-Çavdaroğlu, N.; Iyanna, S.; Foster, M. Smart service quality in hospitality—A quantitative assessment using MCDM and clustering methods. Int. J. Hosp. Manag. 2024, 123, 103931. [Google Scholar] [CrossRef]
  36. Praneashram, D.; Vinodh, S.; Agrawal, R. Analysis of factors influencing smart product development using Interpretive Structural Modelling: A case study. Int. J. Sustain. Eng. 2021, 14, 1353–1371. [Google Scholar] [CrossRef]
  37. Liu, X.; Li, M.-Y.; Yuan, D.-N. Analyzing consumer satisfaction using Interpretive Structural Modeling driven by online reviews: An integrated approach. J. Bus. Res. 2026, 205, 115908. [Google Scholar] [CrossRef]
  38. Guest, G.; Bunce, A.; Johnson, L. How Many Interviews Are Enough? Field Methods 2006, 18, 59–82. [Google Scholar] [CrossRef]
  39. Daskal, S.; Asi, O.; Sabbah, I.; Ayalon, O.; Baransi-Karkaby, K. Decentralized Composting Analysis Model—Benefit/Cost Decision-Making Methodology. Sustainability 2022, 14, 16397. [Google Scholar] [CrossRef]
  40. Lane, G.W.S.; Wagner, T.P. Examining recycling container attributes and household recycling practices. Resour. Conserv. Recycl. 2013, 75, 32–40. [Google Scholar] [CrossRef]
  41. Still, J.D.; Dark, V.J. Cognitively describing and designing affordances. Des. Stud. 2013, 34, 285–301. [Google Scholar] [CrossRef]
  42. Venturi, S.; Zulauf, K.; Cuel, R.; Wagner, R. Trash to treasure: Gamification and informed recycling behavior. Resour. Conserv. Recycl. 2025, 215, 108108. [Google Scholar] [CrossRef]
  43. Wu, D.W.L.; Lenkic, P.J.; DiGiacomo, A.; Cech, P.; Zhao, J.; Kingstone, A. How does the design of waste disposal signage influence waste disposal behavior? J. Environ. Psychol. 2018, 58, 77–85. [Google Scholar] [CrossRef]
  44. Dianat, I.; Molenbroek, J.; Castellucci, H.I. A review of the methodology and applications of anthropometry in ergonomics and product design. Ergonomics 2018, 61, 1696–1720. [Google Scholar] [CrossRef]
  45. Sareh, P.; Loudon, G. The form-affordance-function (FAF) triangle of design. Int. J. Interact. Des. Manuf. (IJIDeM) 2024, 18, 997–1017. [Google Scholar] [CrossRef]
  46. Sunstrum, F.N.; Demirbilek, O.; Gardner, N.; Viengkham, C.; Spehar, B. Revealing the synergy between formal aesthetics and product semantics: Exploring the impact of visual form on product perception. Int. J. Ind. Ergon. 2024, 101, 103593. [Google Scholar] [CrossRef]
  47. Gao, Y.; Song, D.; Liu, L.; Huang, Y. Nested affordance-based intuitive design tool: Affordance interaction matrix. Cogent Eng. 2023, 10, 2231723. [Google Scholar] [CrossRef]
  48. Colavita, F.B. Human sensory dominance. Percept. Psychophys. 1974, 16, 409–412. [Google Scholar] [CrossRef]
  49. Wang, A.; Zhou, H.; Hu, Y.; Wu, Q.; Zhang, T.; Tang, X.; Zhang, M. Endogenous Spatial Attention Modulates the Magnitude of the Colavita Visual Dominance Effect. i-Perception 2021, 12, 20416695211027186. [Google Scholar] [CrossRef]
  50. Nagy, L.B.; Temesi, Á. Color Matters: A Study Exploring the Influence of Packaging Colors on University Students’ Perceptions and Willingness to Pay for Organic Pasta. Foods 2024, 13, 3112. [Google Scholar] [CrossRef]
  51. Sun, M.; Kim, J. Sustainability and Brand Equity: The Moderating Role of Brand Color and Brand Gender. Sustainability 2023, 15, 8908. [Google Scholar] [CrossRef]
  52. Zhu, Y.; Long, Y.; Wang, H.; Lee, K.P.; Zhang, L.; Wang, S.J. Digital Behavior Change Intervention Designs for Habit Formation: Systematic Review. J. Med. Internet Res. 2024, 26, e54375. [Google Scholar] [CrossRef]
  53. Buabang, E.K.; Donegan, K.R.; Rafei, P.; Gillan, C.M. Leveraging cognitive neuroscience for making and breaking real-world habits. Trends Cogn. Sci. 2025, 29, 41–59. [Google Scholar] [CrossRef]
  54. Kaaronen, R.O.; Rietveld, E. Practical lessons for creating affordance-based interventions for sustainable behavior change. One Earth 2021, 4, 1412–1424. [Google Scholar] [CrossRef]
  55. Morrow, O.; Davies, A. Creating careful circularities: Community composting in New York City. Trans. Inst. Br. Geogr. 2022, 47, 529–546. [Google Scholar] [CrossRef] [PubMed]
  56. Wang, X.; Van der Werff, E.; Bouman, T.; Harder, M.K.; Steg, L. I Am vs. We Are: How Biospheric Values and Environmental Identity of Individuals and Groups Can Influence Pro-environmental Behaviour. Front. Psychol. 2021, 12, 618956. [Google Scholar] [CrossRef] [PubMed]
  57. van der Werff, E.; Steg, L.; Keizer, K. It is a moral issue: The relationship between environmental self-identity, obligation-based intrinsic motivation and pro-environmental behaviour. Glob. Environ. Change 2013, 23, 1258–1265. [Google Scholar] [CrossRef]
  58. Jin, H.; Oh, J. How Social Labeling Enhances Pro-Environmental Intentions: Identity and Anticipated Guilt as Mediators. Soc. Mark. Q. 2025, 31, 123–142. [Google Scholar] [CrossRef]
  59. Lockwood, F. Bristol’s smart city agenda: Vision, strategy, challenges and implementation. IET Smart Cities 2020, 2, 208–214. [Google Scholar] [CrossRef]
  60. Clarinval, A.; Simonofski, A.; Vanderose, B.; Dumas, B. Public displays and citizen participation: A systematic literature review and research agenda. Transform. Gov. People Process Policy 2020, 15, 1–35. [Google Scholar] [CrossRef]
  61. Goncalves, J.; Hosio, S.; Liu, Y.; Kostakos, V. Eliciting situated feedback: A comparison of paper, web forms and public displays. Displays 2014, 35, 27–37. [Google Scholar] [CrossRef]
  62. Hartl, B.; Hofmann, E. To sort or not to sort?—Consumers’ waste behavior in public. J. Clean. Prod. 2024, 475, 143677. [Google Scholar] [CrossRef]
  63. Harden, C.W.; Pedersen, T.; Jensen, P.D.Ø. Motivation or Inconvenience—What matters most? Understanding recycling behavior of healthcare waste. Clean. Responsible Consum. 2024, 15, 100240. [Google Scholar] [CrossRef]
  64. Yang, Z.; He, L.; Huang, T. Powering Pro-Environment Behavior: The Impact of Unlocking Reward Strategy on Pro-Environmental Behavior. Sustainability 2024, 16, 9561. [Google Scholar] [CrossRef]
  65. Hsiao, C.-H.; Tang, K.-Y. Key Factors in the Continuance of Self-Service Technology and Its Mobile App Adoption—A Case Study of Convenience Stores in Taiwan. Appl. Sci. 2025, 15, 3804. [Google Scholar] [CrossRef]
  66. Mao, L.; Peng, M.; Tian, Z.; Liu, B.; Zhang, Y. Development of an Index System for Public Toilets Based on HRWS-PS Theory and Improvement Strategies. Buildings 2024, 14, 3424. [Google Scholar] [CrossRef]
  67. Gerlak, A.K.; Baldwin, B.; Zuñiga-Terán, A.A.; Colella, T.; Elder, A.D.; Bryson, M.; Gupta, N.; Yang, B.; Doyle, T.; Heflin, S.; et al. A collaborative effort to address maintenance of green infrastructure through a university–community partnership. Socio-Ecol. Pract. Res. 2022, 4, 393–408. [Google Scholar] [CrossRef]
  68. Shen, Y.; Tan, R.; Zhang, S. Co-Creation, Co-Construction, and Co-Governance in Community Renewal: A Case Study of Civic Participation and Sustainable Mechanisms. Land 2025, 14, 1577. [Google Scholar] [CrossRef]
Figure 1. Research framework of public facilities for community food waste management.
Sustainability 18 04658 g001
Figure 2. Schematic of Coding Process [39].
Sustainability 18 04658 g002
Figure 3. Hierarchical structure diagram of influencing factors.
Sustainability 18 04658 g003
Figure 4. BWM—ISM—Affordance Translation Model (BIATM).
Sustainability 18 04658 g004
Figure 5. Analysis and Summary of Requirement-Integrated Affordances and Design Elements.
Sustainability 18 04658 g005
Figure 6. Functional Module Layout Diagram.
Sustainability 18 04658 g006
Figure 7. Design Schemes (AC) of public facilities for community food waste management.
Sustainability 18 04658 g007
Figure 8. Main Rendering of Scheme A.
Sustainability 18 04658 g008
Figure 9. Schematic Diagram of Main Functional Components.
Sustainability 18 04658 g009
Figure 10. Usage and Interaction Process.
Sustainability 18 04658 g010
Figure 11. User Interface Design.
Sustainability 18 04658 g011
Figure 12. Multi-Stakeholder Collaboration Mechanism.
Sustainability 18 04658 g012
Table 1. Classification of Affordance Dimensions.
LevelDimensionDescription
PhysicalPhysical AffordanceRefers to the support provided by the availability and usability of facility structures, components, and other material elements.
Perceptual AffordanceRefers to the support derived from the convenience of facility size, component arrangement, and other perceptible design features.
PsychologicalCognitive AffordanceRefers to the extent to which the form, color, and other design attributes of the facility align with residents’ cognitive understanding of public facilities.
Functional AffordanceRefers to the actual effectiveness of the facility in enabling activities such as waste disposal, processing, and feedback.
Social AffordanceRefers to the extent to which the facility fosters communication, interaction, and sustained participation within the community context.
Table 2. Interview Sample.
CategoryItemnProportion
Gender Male2050%
Female2050%
AgeUnder 1837.5%
18–30922.5%
31–451332.5%
46–60820%
Over 60717.5%
AttributeResidents1947.5%
Property Management Personnel1025%
Community Staff820%
Volunteers37.5%
Household Food Waste DisposalMain Responsible Person2767.5%
Occasional Responsible Person1332.5%
Food Waste ClassificationFrequent615%
Occasional2255%
Rare1230%
Table 3. Demand and Metrics Compilation Table.
First-Level Indicator
(Goal Layer)
Second-Level Indicator
(Criterion Layer)
Third-Level Indicator
(Indicator Layer)
Affordance
Dimension
Source
Low Use BurdenA
Hygiene Anxiety
A1
Reduced Odor Impact
Physical“Every time I pass by the bin, I can smell a bad odor from a distance”.
A2
Contact-Free Disposal
Perceptual
/
Physical
“There is often leaked waste liquid on the lid when others throw away garbage. It feels greasy, and I really do not want to touch it”.
A3
Smooth Waste Entry into the Bin
Perceptual“Sometimes when I throw the waste away in a hurry, it gets caught by the lid, and I have to push it in again myself”.
A4
Post-Use Cleaning
Physical“Sometimes I accidentally get my hands dirty when disposing of waste, which is quite troublesome”.
B
Ease of Operation
B1
Large Capacity
Perceptual
/
Physical
[40]
B2
Effort-Saving Use
Perceptual“The bin lid is difficult to open”.
B3
Automatic Processing
Functional“I only know how to throw the waste away; I do not know how it is processed afterward”.
B4
Complete Supporting Facilities
Physical[39]
Sustained ParticipationC
Willingness to Use
C1
Simple and Clear Appearance
Cognitive[41]
C2
Incentive Feedback
Functional
/
Social
[42]
C3
Visibility of Processing Results
Functional“I do not know what the waste can be used for after it is processed”.
C4
Social Interaction
Social“When chatting with neighbors, we sometimes talk about what dishes we have cooked recently”.
D
Use Cost
D1
Material Durability
Physical“Will this thing be durable enough?”
D2
Short Disposal Distance
Social“Food waste contains a lot of liquid, and it is quite tiring to carry it all the way to dispose of it”.
D3
Maintenance Responsibility
Social“Who is going to manage this thing?”
D4
Simple Usage Method
Cognitive[41,43]
Table 4. Consistency Index (CI) Value Table.
Preference123456789
CI00.4411.632.333.734.475.23
Table 5. Consistency Ratio (CR) Value Table.
Expert12345678910
CR0.03630.04190.07310.06590.05130.08080.01820.02810.02170.0458
Table 6. Subjective Weights Determined by BWM.
Criterion LayerWeightIndicator LayerRelative WeightAbsolute WeightRanking
A0.2727A10.27090.07395
A20.30280.08263
A30.19520.053211
A40.23110.06308
B0.2588B10.23140.059910
B20.30580.07914
B30.20250.052412
B40.26030.06746
C0.3408C10.28280.09642
C20.34020.11591
C30.18440.06289
C40.19260.06567
D0.1279D10.20890.026715
D20.27110.034714
D30.18220.023316
D40.33780.043213
Table 7. Screening Criteria for Indicators.
IndicatorDesign ControllabilityTechnical ControllabilityMaintenance ControllabilityImplementation ApproachIncluded in ISMReason
A1×Exhaust componentYesAchieved through functional design
A2×Pedal-operated lid-opening structureYesAchieved through functional design
A3×Waste inlet structureNoCan be implemented simultaneously with A2
A4×WashbasinYesAchieved through functional design
B1×Large container bodyYesAchieved through structural design
B2×Height of waste inletYesAchieved through structural design
B3××Internal fermentation managementNoA functional and technical element
B4×Placement of auxiliary toolsYesAchieved through component configuration
C1×Appearance designYesAchieved through appearance design
C2Provision of rewardsYesAchieved through functional design
C3×Display of processing resultsNoCan be implemented simultaneously with C2
C4×Provision of communication opportunitiesNoNot achieved through design alone
D1×Material selectionNoCan be implemented simultaneously with C1
D2Disposal locationNoRelated to property management
D3Property logisticsNoRelated to property management
D4×Simplified useYesAchieved through functional design
Table 8. Overview of the Selected Communities.
Community
Code
Community
Attribute
Population
Composition
Age
Structure
Management
Model
AOld UrbanLocal ResidentsPredominantly Middle-aged and RlderlyResident
Self-management
BCommercial Housing CommunityMigrant Workers and TenantsPredominantly Middle-aged and YoungProperty
Management
CCommercial Housing CommunityLong-term Resident OwnersPredominantly Middle-aged, with a Balanced Ratio of Elderly and YoungProperty
and
Neighborhood Committee Management
Table 9. Direct Influence Matrix X.
IndicatorA1A2A4B1B2B4C1C2D4
A1021324310
A2304233213
A4310014323
B1320012333
B2143302333
B4424130342
C1133333024
C2202323202
D4031231440
Table 10. Comprehensive influence matrix T.
IndicatorA1A2A4B1B2B4C1C2D4
A10.3820.4590.4530.4920.4830.6260.6080.4860.449
A20.580.4720.6560.5410.6160.7060.70.5960.664
A40.5000.4330.4240.3940.4660.6430.630.5420.567
B10.4880.4630.4120.3910.4570.5560.6180.5660.56
B20.5250.640.6420.6020.5220.690.7560.690.696
B40.6470.5770.6920.5450.650.6380.7740.7370.662
C10.5260.6120.6440.6030.6430.7250.6480.6650.734
C20.4380.3680.4620.4780.4640.5680.5580.4330.502
D40.4040.530.4890.4990.560.5540.6880.6370.494
Table 11. Reachability Matrix D.
IndicatorA1A2A4B1B2B4C1C2D4
A1100000000
A2011001111
A4001000000
B1000100000
B2001011111
B4001001111
C1001001111
C2000000010
D4001001111
Table 12. Hierarchical Classification of Influencing Factors.
IndicatorReachable Set UAntecedent Set VIntersection Set W = UV
A1A1A1A1
A2A2, A4, B4, C1, C2, D4A2A2
A4A4A2, A4, B2, B4 C1, D4A4
B1B1B1B1
B2A4, B2, B4, C1, C2, D4B2B2
B4A4, B4, C1, C2 D4A2, B2, B4, C1 D4B4, C1, D4
C1A4, B4, C1, C2, D4A2, B2, B4, C1, D4B4, C1, D4
C2C2A2, B2, B4, C1, C2 D4C2
D4A4, B4, C1, C2, D4A2, B2, B4, C1, D4B4, C1, D4
Table 13. Hierarchy structure table of influencing factors.
LevelIndicatorDegree of Influence
Level 1 (Top Level)A1, A4, B1, C2Surface Indicator
Level 2B4, C1, D4Shallow Indicator
Level 3 (Bottom Level)A2, B2Root Indicator
Table 14. Integrated Date Analysis Table.
IndicatorBWM WeightBWM RankingISM Level
A20.08263Root Indicator
B20.07914
C10.09642Shallow Indicator
B40.06746
C20.11591Surface Indicator
A10.07395
A40.06308
B10.059910
D40.043213
C40.06567Other Surface
C30.06289
A30.053211
B30.052412
D20.034714
D10.026715
D30.023316
Table 15. Table of Questions and Dimensions.
QuestionsObstacle
Dimension
Affordance
Dimension
Does the need primarily concern whether the facility provides sufficient components to ensure users can use it smoothly?Physical
Execution
Physical
Affordance
Does the need primarily concern whether the facility provides sufficient components to ensure users can use it smoothly?Perceptual
Acquisition
Perceptual
Affordance
Does the need primarily concern whether the facility allows users to understand its purpose, rules, and procedures?Cognitive
Understanding
Cognitive
Affordance
Does the need primarily concern whether the facilities truly support task completion and feedback on results?Task
Feedback
Functional
Affordance
Does the need primarily concern whether the facility fosters social interaction, a sense of identity, and shared participation?Social
Participation
Social
Affordance
Table 16. Affordance Dimensions, Strategies, and Design Approaches.
LevelDimensionStrategiesApproach
PhysicalPhysical AffordanceEnhancing convenienceFunctional component configuration
Perceptual AffordanceEnhancing ease of useErgonomic design
PsychologicalCognitive AffordanceReducing decision-making costsAppearance design
Functional AffordanceProgressive task designProcess design for obtaining incentive feedback
Social AffordanceStrengthening value identity through ecological identityIdentity authentication and community interaction
Table 17. Mapping between Key Needs and Affordance-Translated Design Elements.
Key
Need
DimensionDesign
Intent
Affordance
Cue
Design
Element
Design
Rule
A1
Reduced Odor Impact
Physical AffordanceTransform odor emission into a controllable factorInstall an exhaust componentExhaust fan installed at the rearAvoid direct orientation toward residents
A2
Contact-Free Disposal
Perceptual/
Physical Affordance
Reduce residents’ resistance and anxiety regarding hygieneFollowing the logic of conventional waste bins, install a pedal-operated lid-opening device at the bottomPedal-operated lid openingThe installation position should accommodate different user groups
A4
Post-Use Cleaning
Physical AffordanceEnable users to clean their hands after waste disposalEstablish a cleaning areaWashbasin with sufficient depthInstalled together with the main body of the product
B1
Large Capacity
Perceptual/
Physical Affordance
Accommodate a larger volume of food wasteExterior design conveying a sense of large volumeContainer bodyThe volume should be configured as large as possible
B2
Effort-Saving Use
Perceptual AffordanceReduce users’ physical burdenWaste inlet height within easy reachLid-opening height set at 1.2 mHeight range should be determined based on ergonomics
B4
Complete Supporting Facilities
Physical AffordanceProvide tools to support the entire process of waste disposal and managementProvision of auxiliary toolsWashbasin, storage for planting toolsPriority should be given to essential tools
C1
Simple and Clear Appearance
Cognitive AffordanceEnable rapid recognition of the product as a food waste binGuiding colors and simple geometric formWaste icon signage and gradient green decorationMultiple visual cues should be used to reinforce guidance
C2
Incentive Feedback
Functional/Social AffordanceTransform occasional behavior into sustained habitsDispose of waste, collect fertilizer, and visualize outcomesCompost box and public planting areaShould be low-threshold, practical, and sustainable
D4
Simple Usage Method
Cognitive AffordanceEnable direct use without additional instruction or trainingReduce the number of usage stepsInteraction flow designRetain only the necessary steps for waste disposal and incentive acquisition
Table 18. Original Decision Matrix Q.
IndicatorScheme AScheme BScheme C
Odor Impact90.584.885.3
Hygiene Anxiety86.976.272.9
Physical Burden80.583.274.5
Ease of Use87.277.172.4
Clarity of Appearance92.080.190.3
Sustained Willingness to Use81.574.778.6
Learning Cost83.388.580.9
Table 19. Consistency Analysis.
IndicatorKendall’s WChi-Squarep-Value
Odor Impact0.83216.6320.000245
Hygiene Anxiety0.97719.5380.000057
Physical Burden0.97719.5380.000057
Ease of Use1200.000045
Clarity of Appearance0.7915.80.000371
Sustained Willingness to Use0.97719.5380.000057
Learning Cost1200.000045
Overall internal consistencyCronbach’s α = 0.994
Table 20. Standardization Matrix M.
IndicatorScheme AScheme BScheme C
Odor Impact0.60120.56340.5667
Hygiene Anxiety0.63590.55760.5335
Physical Burden0.58470.60430.5412
Ease of Use0.63610.56250.5282
Clarity of Appearance0.60620.52780.5950
Sustained Willingness to Use0.60080.55070.5794
Learning Cost0.57050.60620.5541
Table 21. Weighted Normalization Matrix K.
IndicatorScheme AScheme BScheme C
Odor Impact0.04440.04160.0419
Hygiene Anxiety0.05250.04610.0441
Physical Burden0.04630.04780.0428
Ease of Use0.04290.03790.0356
Clarity of Appearance0.05840.05090.0574
Sustained Willingness to Use0.06960.06380.0672
Learning Cost0.02460.02620.0239
Table 22. Relative Closeness Coefficient.
Scheme D i + D i ZiRanking
Scheme A0.00220.01530.87471
Scheme B0.01280.00630.32963
Scheme C0.01290.00730.36222
Disclaimer/Publisher’s Note: The statements, opinions and data contained in all publications are solely those of the individual author(s) and contributor(s) and not of MDPI and/or the editor(s). MDPI and/or the editor(s) disclaim responsibility for any injury to people or property resulting from any ideas, methods, instructions or products referred to in the content.