Article

Preemptive Move or Wait-and-See? Climate Policy Uncertainty and Equity Financing of SRDI Enterprises in China

1
School of Economics and Management, China University of Mining and Technology, Xuzhou 221116, China
2
The University of Sydney Business School, The University of Sydney, Sydney, NSW 2006, Australia
3
Zhongtai Securities Institute for Financial Studies, Shandong University, Jinan 250100, China
*
Author to whom correspondence should be addressed.
Sustainability 2026, 18(10), 4632; https://doi.org/10.3390/su18104632
Submission received: 17 March 2026 / Revised: 2 May 2026 / Accepted: 4 May 2026 / Published: 7 May 2026

Abstract

Rising climate policy uncertainty increases the complexity of firms’ financing decisions, particularly for Specialized, Refinement, Differential, and Innovation (SRDI) enterprises that rely heavily on external financing. Accordingly, using data on 262 SRDI firms from 2011 to 2023, this paper conducts empirical analysis to systematically examine the relationship between climate policy uncertainty and SRDI firms’ equity financing decisions. We find a significant inverted U-shaped relationship between climate policy uncertainty and the equity financing ratio of SRDI firms. When uncertainty is low to moderate, firms are more inclined to raise the proportion of equity financing to preemptively lock in capital; however, as uncertainty rises further, valuation discounts and financing frictions intensify, thereby suppressing equity financing. These conclusions remain unchanged after a series of robustness checks. Mechanism tests indicate that climate policy uncertainty affects equity financing mainly through two channels: higher debt financing costs and lower firm value. The former encourages substitution from debt-to-equity financing, whereas the latter suppresses equity financing by increasing its implicit costs. Further heterogeneity analyses show that this effect is more pronounced among private firms, firms in more highly concentrated industries, and firms with weaker risk resilience. Our findings inform innovative firms’ financing decisions and sustainable development under climate policy uncertainty.

1. Introduction

As global warming intensifies and extreme weather events become more frequent, risks driven by climate volatility are increasingly affecting economic and social development. In response, governments around the world have introduced a series of targeted climate policies, such as strengthening environmental regulation [1], providing green finance [2], and improving carbon market development [3]. However, amid evolving climate conditions and changing emissions-reduction pressures, climate policy instruments are frequently adjusted, leading to rising climate policy uncertainty [4]. This, in turn, increases the complexity of firms’ financing decisions. Specialized, Refinement, Differential, and Innovation (SRDI) enterprises’ core businesses are often concentrated in climate-policy-sensitive areas such as green and low-carbon industries and advanced manufacturing, and they are highly dependent on external financing [5]. Therefore, they are more significantly exposed to shocks from climate policy uncertainty. Against this backdrop, by examining how climate policy uncertainty affects SRDI enterprises’ equity financing decisions, this paper provides important insights for innovative SMEs to optimize financing decisions, enhance risk resilience, and promote sustainable development.
Climate policy uncertainty (CPU) refers to unclear or frequently changing climate and environmental policies issued by governments and other relevant institutions [6,7]. Existing research suggests that the impacts of CPU on firms are mainly reflected in investment, innovation, and green performance. In terms of corporate investment, rising climate policy uncertainty increases the volatility of investment returns, which leads firms to reduce investment, especially energy-related investment [8,9]. In terms of corporate innovation, climate policy uncertainty can stimulate firms to engage in green innovation [10,11]. However, policy uncertainty such as changes in government green subsidies can also hinder green innovation [12]. In terms of firms’ green performance, an increase in climate policy uncertainty can raise corporate carbon emissions, undermine firms’ ESG performance, and exacerbate ESG greenwashing [13,14].
As innovative firms characterized by specialization, refinement, distinctiveness, and innovation, SRDI enterprises are a key force in driving industrial upgrading and enhancing economic development. Most of these firms focus on niche markets and build competitive advantages through innovation capabilities [15]. Common features of such firms include high R&D investment, long cash conversion cycles, and relatively weak risk-bearing capacity [16]. Compared with large firms, SRDI enterprises rely more on external capital to sustain ongoing R&D and capacity upgrading, and are therefore more vulnerable to policy changes [17].
SRDI firms operating in areas such as energy-saving and environmental protection equipment, new-energy materials, and green intelligent manufacturing are often important carriers of low-carbon transition and green technological innovation [18]. Their operating costs, technology-path choices, and financing conditions are therefore closely tied to the climate policy environment [19]. When climate policy uncertainty rises, SRDI enterprises face a more complex financing environment: On the one hand, higher uncertainty may raise the risk premium for debt financing and tighten external financing constraints, making debt financing more difficult and thereby prompting firms to increase the share of equity financing [20]. More importantly, this response may also reflect firms’ active efforts to hedge policy uncertainty in anticipation of future mandatory policy changes and stricter regulatory implementation. On the other hand, when uncertainty escalates further, climate policy uncertainty can increase the risk premium demanded by financial institutions, leading to lower firm valuations [21]. A decline in firm value weakens the pricing basis for equity issuance, thereby increasing the cost of equity financing and exerting a restraining effect on equity financing. Therefore, as climate policy uncertainty increases, SRDI enterprises may need to balance between two financing strategies: “Preemptive Move” and “Wait-and-See.”
At present, research examining how climate policy uncertainty affects firms remains relatively limited, which is mainly reflected in three aspects: first, the discussion of climate policy uncertainty’s impact on firms’ financing structure is still insufficient; second, there is a lack of attention to the effects and mechanisms of climate policy uncertainty on SRDI enterprises as a distinctive group of firms; third, there is a lack of systematic testing of the internal mechanisms through which climate policy uncertainty affects equity financing, as well as its heterogeneous effects across firms with different characteristics. Therefore, uncovering how climate policy uncertainty reshapes SRDI firms’ equity-financing choices through multiple channels is not only of major theoretical value, but also of practical significance for improving the efficiency of green finance policies and promoting the sustainable development of SRDI enterprises.
Based on this, this paper conducts an empirical analysis using data on 262 SRDI enterprises from 2011 to 2023 and systematically examines how climate policy uncertainty affects the equity-financing decisions of SRDI enterprises, as reflected in the proportion of equity capital in firms’ total assets. The results show that climate policy uncertainty has a significant inverted U-shaped relationship with the share of equity capital among SRDI enterprises. When uncertainty is at a low to moderate level, firms tend to increase equity financing; however, when uncertainty rises further, firms reduce equity financing. This conclusion remains valid after robustness checks. Mechanism tests indicate that climate policy uncertainty affects equity financing mainly through higher debt-financing costs and lower firm value: the former induces equity financing to substitute for debt financing, while the latter suppresses equity financing by raising its implicit cost and tightening pricing constraints. Further heterogeneity analysis shows that this effect is more pronounced among privately owned firms, firms in more highly concentrated industries, and firms with weaker risk resilience.
The contributions of this paper are mainly reflected in the following three aspects.
First, in terms of research perspective, this paper extends the boundaries of research on the economic consequences of climate policy uncertainty. The existing literature mostly focuses on the effects of climate policy uncertainty on firms’ green investment or environmental performance and rarely examines in depth its role in reshaping firms’ capital-structure decisions [22,23]. By incorporating climate policy uncertainty into a framework of corporate financing choices, this paper empirically reveals a nonlinear inverted U-shaped effect of uncertainty on equity financing. This not only enriches theoretical research in the field of climate finance, but also offers a new perspective for understanding corporate financial behavior under uncertainty.
Second, in terms of the research object, this paper depicts the financing-decision responses of SRDI enterprises to climate policy uncertainty. Existing studies on policy uncertainty mostly focus on large, listed firms with abundant resources, often overlooking small and medium-sized innovative enterprises [24]. Given that SRDI enterprises are characterized by high R&D intensity and strong reliance on external financing, this paper’s in-depth analysis of this specific group can help the government formulate relevant climate policies more precisely.
Third, regarding the mechanism, this paper clarifies the transmission channels through which climate policy uncertainty affects equity-financing decisions. This paper finds that climate policy uncertainty influences SRDI firms’ equity financing through a debt financing cost channel and a firm-value channel, and that its effects are heterogeneous across firms with different ownership types, industry concentration, and risk resilience. The conclusions provide useful references for optimizing corporate financing and enhancing firms’ sustainable development.
The structure of this paper is as follows. Section 2 presents theoretical analysis and research hypotheses. Section 3 describes the research design. Section 4 reports empirical results and robustness tests. Section 5 conducts mechanism and heterogeneity analysis. Section 6 provides a discussion of the main findings. Section 7 draws conclusions and puts forward policy implications.

2. Theoretical Analysis and Hypotheses

2.1. Climate Policy Uncertainty and Equity Financing of SRDI Enterprises: An Inverted U-Shaped Relationship

In the context of China, climate policy uncertainty stems from the evolving implementation of climate-related policies, including carbon peaking and carbon neutrality goals, environmental regulation, green finance policies, and local enforcement differences across regions [25,26]. Rising climate policy uncertainty increases the unpredictability of future regulatory stringency and compliance costs [27,28], thereby intensifying uncertainty in firms’ operations and financing decisions. As a group characterized by R&D-intensive investment, long cash recovery cycles, and limited collateral capacity, SRDI enterprises rely more on equity financing than traditional firms [29]. On the one hand, equity financing does not require regular repayment of principal and interest, which can effectively ease the sustained funding pressure associated with R&D investment and reduce the risk of cash-flow disruptions [30]. On the other hand, equity financing can attract investors through risk-sharing arrangements that better match the high-risk, high-return nature of firms’ R&D activities, which is also a core reason for their preference for equity financing [31]. Based on the theory of financing constraints, climate policy uncertainty generates a two-stage effect on SRDI firms’ equity financing.
First, when climate policy uncertainty is at a relatively low level, an increase in uncertainty typically makes creditors more cautious and tightens the supply of debt capital [32,33], which is reflected in higher borrowing costs for firms [34]. For SRDI enterprises with intensive R&D investment and long cash recovery cycles, this implies a risk of rising financing costs in the future, making firms more likely to adopt a “preemptive” equity-financing strategy to hedge policy uncertainty in anticipation of future policy tightening. Therefore, within this range, climate policy uncertainty is expected to be positively correlated with the share of equity financing.
Second, when climate policy uncertainty rises to a relatively high level, uncertainty leads to a higher risk premium and a more pronounced valuation discount, thereby reducing firm value [35,36]. In this case, firms may choose to delay or reduce equity financing to avoid issuing equity at depressed valuations [37]. Therefore, at high levels of climate policy uncertainty, firms are more likely to adopt a “wait-and-see” strategy, implying a negative relationship between climate policy uncertainty and the share of equity financing.
In summary, the above analysis suggests an inverted U-shaped effect of climate policy uncertainty on the equity financing of SRDI enterprises. Specifically, as climate policy uncertainty increases, the equity financing ratio of SRDI enterprises first rises and then falls after a certain threshold is reached. This implies that the relationship is positive at low to moderate levels of uncertainty but negative once uncertainty exceeds that threshold. The turning point reflects the level of uncertainty at which the positive preemptive-financing effect is outweighed by the negative valuation-discount effects. Accordingly, this paper proposes the following hypothesis:
H1. 
Climate policy uncertainty has an inverted U-shaped effect on the equity financing ratio of SRDI enterprises.

2.2. Mechanisms Through Which Climate Policy Uncertainty Affects Equity Financing

Climate policy uncertainty may affect equity financing through two mediating channels that operate in opposite directions. On the one hand, rising uncertainty can increase debt financing costs, making debt financing less attractive and inducing firms to substitute equity for debt, thereby increasing the equity financing ratio. On the other hand, rising uncertainty can reduce firm value through valuation discounts, which raises the implicit cost of equity issuance and discourages equity financing. Therefore, debt financing cost and firm value are selected as mediating variables because they capture the two key channels through which climate policy uncertainty may respectively strengthen and weaken firms’ incentives to use equity financing. More specifically, the debt financing cost channel is expected to reinforce the positive side of the relationship at lower to moderate levels of uncertainty, whereas the firm value channel is expected to reinforce the negative side of the relationship when uncertainty becomes sufficiently high. Importantly, the overall inverted U-shaped relationship does not imply that each mediating channel is itself nonlinear. Rather, it reflects the net effect of two countervailing mechanisms. Specifically, the debt-cost channel is more salient at low to moderate levels of climate policy uncertainty, whereas the firm-value channel becomes more important when uncertainty is sufficiently high.
Debt financing cost channel: As climate policy uncertainty rises, creditors tend to price policy risk and default risk more conservatively [38,39]. Loan interest rates, credit spreads, and the stringency of debt covenants often increase accordingly, thereby raising firms’ debt-financing costs [40]. For SRDI enterprises, which face tighter financing constraints and possess relatively limited collateralizable assets [41], higher debt-financing costs reduce the relative attractiveness of debt and induce a shift in financing structure toward equity financing [42], which features stronger risk-sharing attributes and is better suited to funding R&D investment and capacity upgrading. Consequently, by increasing debt-financing costs, climate policy uncertainty raises the relative share of equity financing.
Firm value channel: Rising climate policy uncertainty increases the volatility of firms’ future cash flows and reduces their predictability [43,44], while also elevating the risk compensation demanded by investors [45]. This raises the discount rate and leads capital markets to apply a valuation discount, ultimately lowering firm value [46]. A decline in firm value increases both the dilution cost and the undervaluation cost of equity issuance [47], making firms more likely to postpone or scale back equity financing to avoid issuing shares under unfavorable valuation conditions [48]. Therefore, by reducing firm value, climate policy uncertainty exerts a restraining effect on equity financing. Based on the above, this paper proposes the following mechanism hypotheses:
H2a. 
Climate policy uncertainty increases firms’ debt financing costs, thereby increasing the equity financing ratio.
H2b. 
Climate policy uncertainty reduces firm value, thereby decreasing the equity financing ratio.

2.3. Heterogeneity Analysis of the Impact of Climate Policy Uncertainty on Equity Financing

Financing-constraints theory implies that firms differ in external-finance dependence, credit backing, and risk-management capacity [49,50], leading to heterogeneous responses to climate policy uncertainty. We examine three dimensions.
First, ownership type matters. Compared with state-owned enterprises (SOEs), privately owned enterprises (POEs) typically lack implicit guarantees and stronger credit support [51], making them more exposed to credit tightening and risk-premium increases when climate policy uncertainty rises. POEs are also more likely to face larger valuation discounts [52], which amplifies adjustments in equity-financing decisions and strengthens the inverted U-shaped pattern.
Second, industry concentration can magnify policy shocks. In more concentrated industries, policy adjustments are more likely to alter entry barriers and regulatory stringency [53], increasing uncertainty perceived by creditors and investors. This tends to raise required returns and valuation discounts [54], thereby strengthening firms’ financing responses to climate policy uncertainty.
Third, risk resilience moderates firms’ ability to absorb uncertainty. Firms with stronger resilience can mitigate financing frictions through internal resource reallocation and external-network support, reducing the sensitivity of equity financing to climate policy uncertainty [55,56]. By contrast, firms with weaker resilience have limited buffers and constrained access to external resources [57], making their equity-financing decisions more responsive as uncertainty changes. In this study, risk resilience is considered from both external and internal perspectives. External resilience refers to a firm’s ability to access information and resources through external networks, whereas internal resilience refers to its ability to cope with shocks through internal governance and organizational coordination.
H3. 
The effect of climate policy uncertainty on the equity financing ratio is stronger for privately owned firms, firms in highly concentrated industries, and firms with weaker risk resilience.
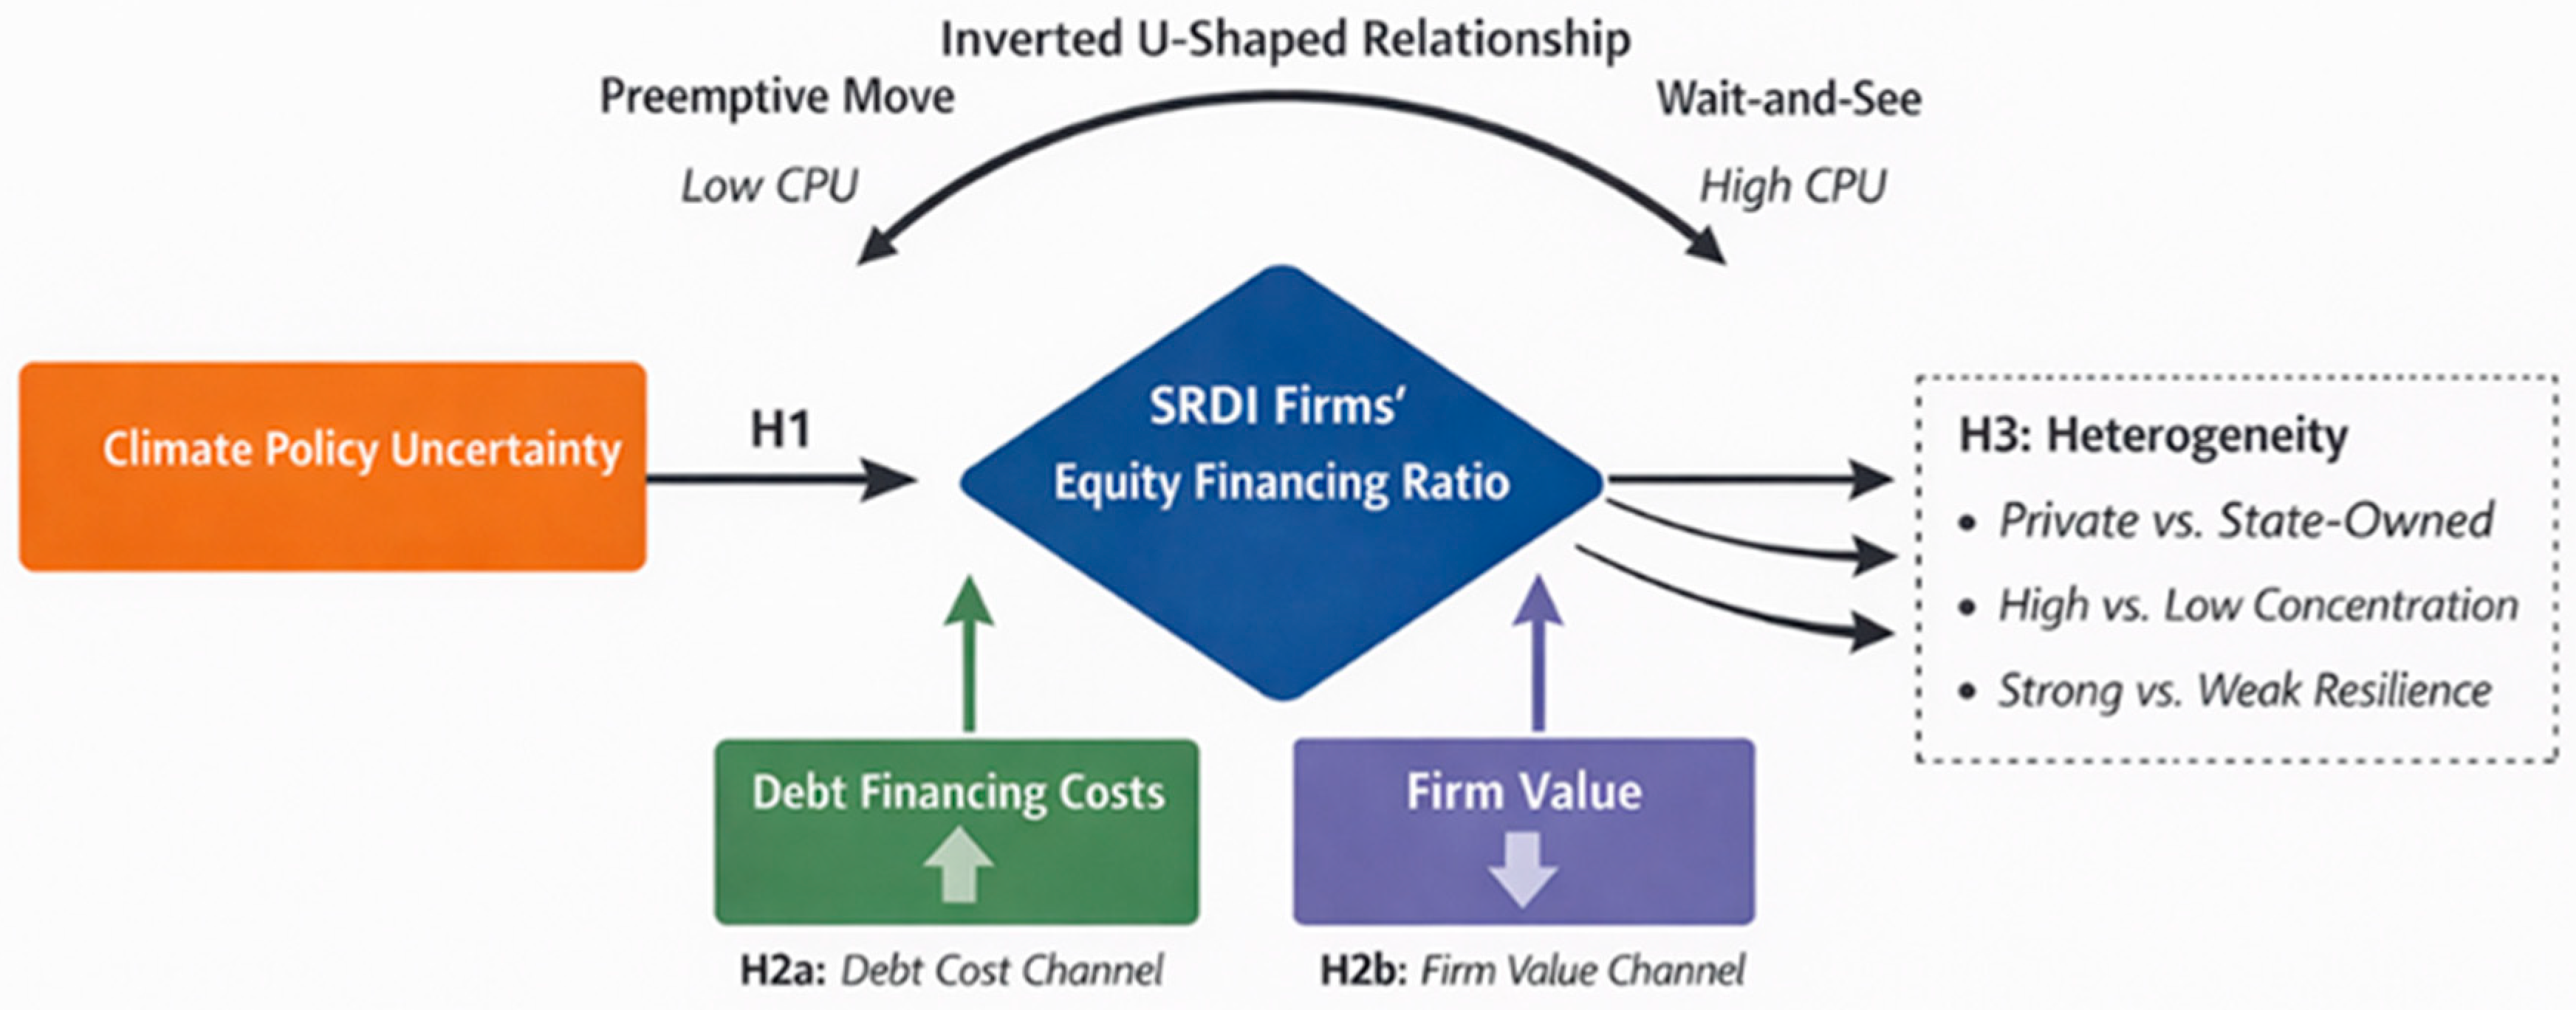
The research framework is shown in Figure 1.

3. Research Design

3.1. Data and Sample Selection

To ensure the authoritativeness of sample identification and the reliability of data sources, the data used in this study mainly come from the China Stock Market & Accounting Research (CSMAR) database and official public disclosures released by the Ministry of Industry and Information Technology (MIIT). Specifically, firms’ financial data are obtained from the CSMAR database, while the identification information of specialized, refined, distinctive, and innovative (SRDI) enterprises is drawn from six batches of SRDI enterprise lists successively released by MIIT in accordance with the Interim Measures for the Gradient Cultivation and Management of High-Quality Small and Medium-Sized Enterprises. Based on these data, we further restrict the sample to firms listed on the Shanghai Stock Exchange and the Shenzhen Stock Exchange, and ultimately identify 262 SRDI enterprises as the research sample. The sample period is set to 2011–2023, yielding a total of 3406 firm-year observations. To ensure the accuracy and robustness of the empirical results, we exclude firms designated as ST or *ST (Special Treatment), drop observations with missing values in key research variables, and apply two-sided 1% winsorization to the main continuous variables. These procedures provide high-quality data support for the subsequent empirical analysis.

3.2. Variables and Measurement

3.2.1. Equity Financing

The dependent variable, E q u i t y R a t i o i , t represents the equity ratio of SRDI enterprise i in year t and is used to measure the firm’s equity financing [58,59]. It is calculated as the ratio of total shareholders’ equity to total assets, which directly reflects the proportion of equity capital in the firm’s total assets.

3.2.2. Climate Policy Uncertainty

This study measures climate policy uncertainty (CPU) using the city-level Chinese Climate Policy Uncertainty index constructed by Ma et al. (2023) [60]. The index covers 293 cities in China and provides monthly and annual measures; it is built from news texts from six major Chinese newspapers, identified using a MacBERT classifier, and constructed following the standardization approach of Baker et al. (2016) [61]. We use annual city-level CPU data for 2010–2023 and match them to firms based on their registered location, thereby capturing differences in the climate policy uncertainty faced by firms.
This approach is appropriate because SRDI enterprises are predominantly small and medium-sized firms whose headquarters, government interactions, and financing activities are typically concentrated in the city of registration. Thus, the city-level measure does not imply that firms operate only locally; rather, it captures the local policy environment in which key financing decisions are embedded. Moreover, although some firms may operate across regions, climate-related policies in China are nationally guided but locally implemented with substantial variation, so city-level CPU can still capture meaningful differences in the policy uncertainty faced by firms [4,62]. Given that climate policy transmission to firms’ real operations and financing decisions typically involves lagged effects, we use the one-period lagged CPU, C P U c , t 1 , as the core explanatory variable and further include its squared term, ( C P U c , t 1 ) 2 , to test for potential nonlinear effects beyond the linear relationship.

3.2.3. Mediating Variables

To examine the mechanisms through which climate policy uncertainty affects SRDI firms’ equity-financing decisions, we consider two mediators: debt financing cost (DebtCost) and firm value (FirmValue). Debt financing cost are proxied by a debt-cost measure, defined as financial expenses divided by total liabilities. Firm value is measured by Tobin’s Q, calculated as the sum of the market value of equity and the book value of liabilities divided by total assets.

3.2.4. Control Variables

Following related studies [20,63], we control for a set of firm-level characteristics that may affect SRDI firms’ equity financing decisions. Specifically, we include firm size (Size), profitability (RoA), growth opportunities (Growth), asset tangibility (Tangibility), liquidity (Liquidity), non-debt tax shield (Non-debt-TaxShield), and R&D intensity (R&DIntensity). In addition, we incorporate firm fixed effects and year fixed effects to control unobserved industry heterogeneity and time-varying macroeconomic conditions. These control variables are included to capture firm characteristics that are commonly associated with financing decisions, including scale, profitability, growth potential, collateral capacity, liquidity conditions, tax-related financing incentives, and innovation intensity.
A summary of the variable definitions is provided in Table A1 in Appendix A.

3.3. Model Specification

To examine the impact of climate policy uncertainty on the equity financing of SRDI enterprises, this study constructs the following regression model, specified as Equation (1):
E q u i t y R a t i o i , t = β 0 + β 1 C P U c , t 1 + β 2 ( C P U c , t 1 ) 2 + ϑ X i , t + F i r m F E + Y e a r F E + ε i , c , t
where E q u i t y R a t i o i , t denotes the equity financing ratio of firm i in year t ; C P U c , t 1 refers to the climate policy uncertainty index of city c (the registered location of firm i ) in year t 1 ; and ( C P U c , t 1 ) 2 is its quadratic term, which is included to capture the potential nonlinear relationship between CPU and the dependent variable. X i , t represents a vector of control variables. F i r m F E and Y e a r F E account for firm-fixed effects and year-fixed effects, respectively, while ε i , c , t denotes the random error term.
Under this model specification, if β 1 and β 2 , it suggests an inverted U-shaped relationship between CPU and firms’ equity financing ratio. Specifically, when CPU is at a low to moderate level, the positive coefficient β 1 reflects firms’ tendency to adopt a preemptive strategy, that is, accelerating equity issuance to conduct equity financing in advance before potential credit tightening. However, once CPU exceeds the critical value, the negative quadratic term β 2 begins to dominate, indicating that firms switch to a wait-and-see strategy.

3.4. Descriptive Statistics

The descriptive statistics for the full sample after winsorization are reported in Table 1. The mean value of the dependent variable, the equity ratio (EquityRatio), is 0.692, indicating that equity financing generally accounts for a relatively large share of the sample firms’ equity financing, with an average level exceeding two thirds of total assets. Notably, the minimum and maximum values of this measure are 0.293 and 0.951, respectively, suggesting substantial cross-firm variation in equity financing.
The explanatory variable, the climate policy uncertainty index, has a mean of 2.881 and a standard deviation of 0.679, indicating substantial fluctuations in the climate policy environment across years during the sample period and pronounced differences in the degree of policy uncertainty faced by firms. The index ranges from a minimum of 2.125 to a maximum of 4.000, further confirming the dynamic nature of the policy environment.
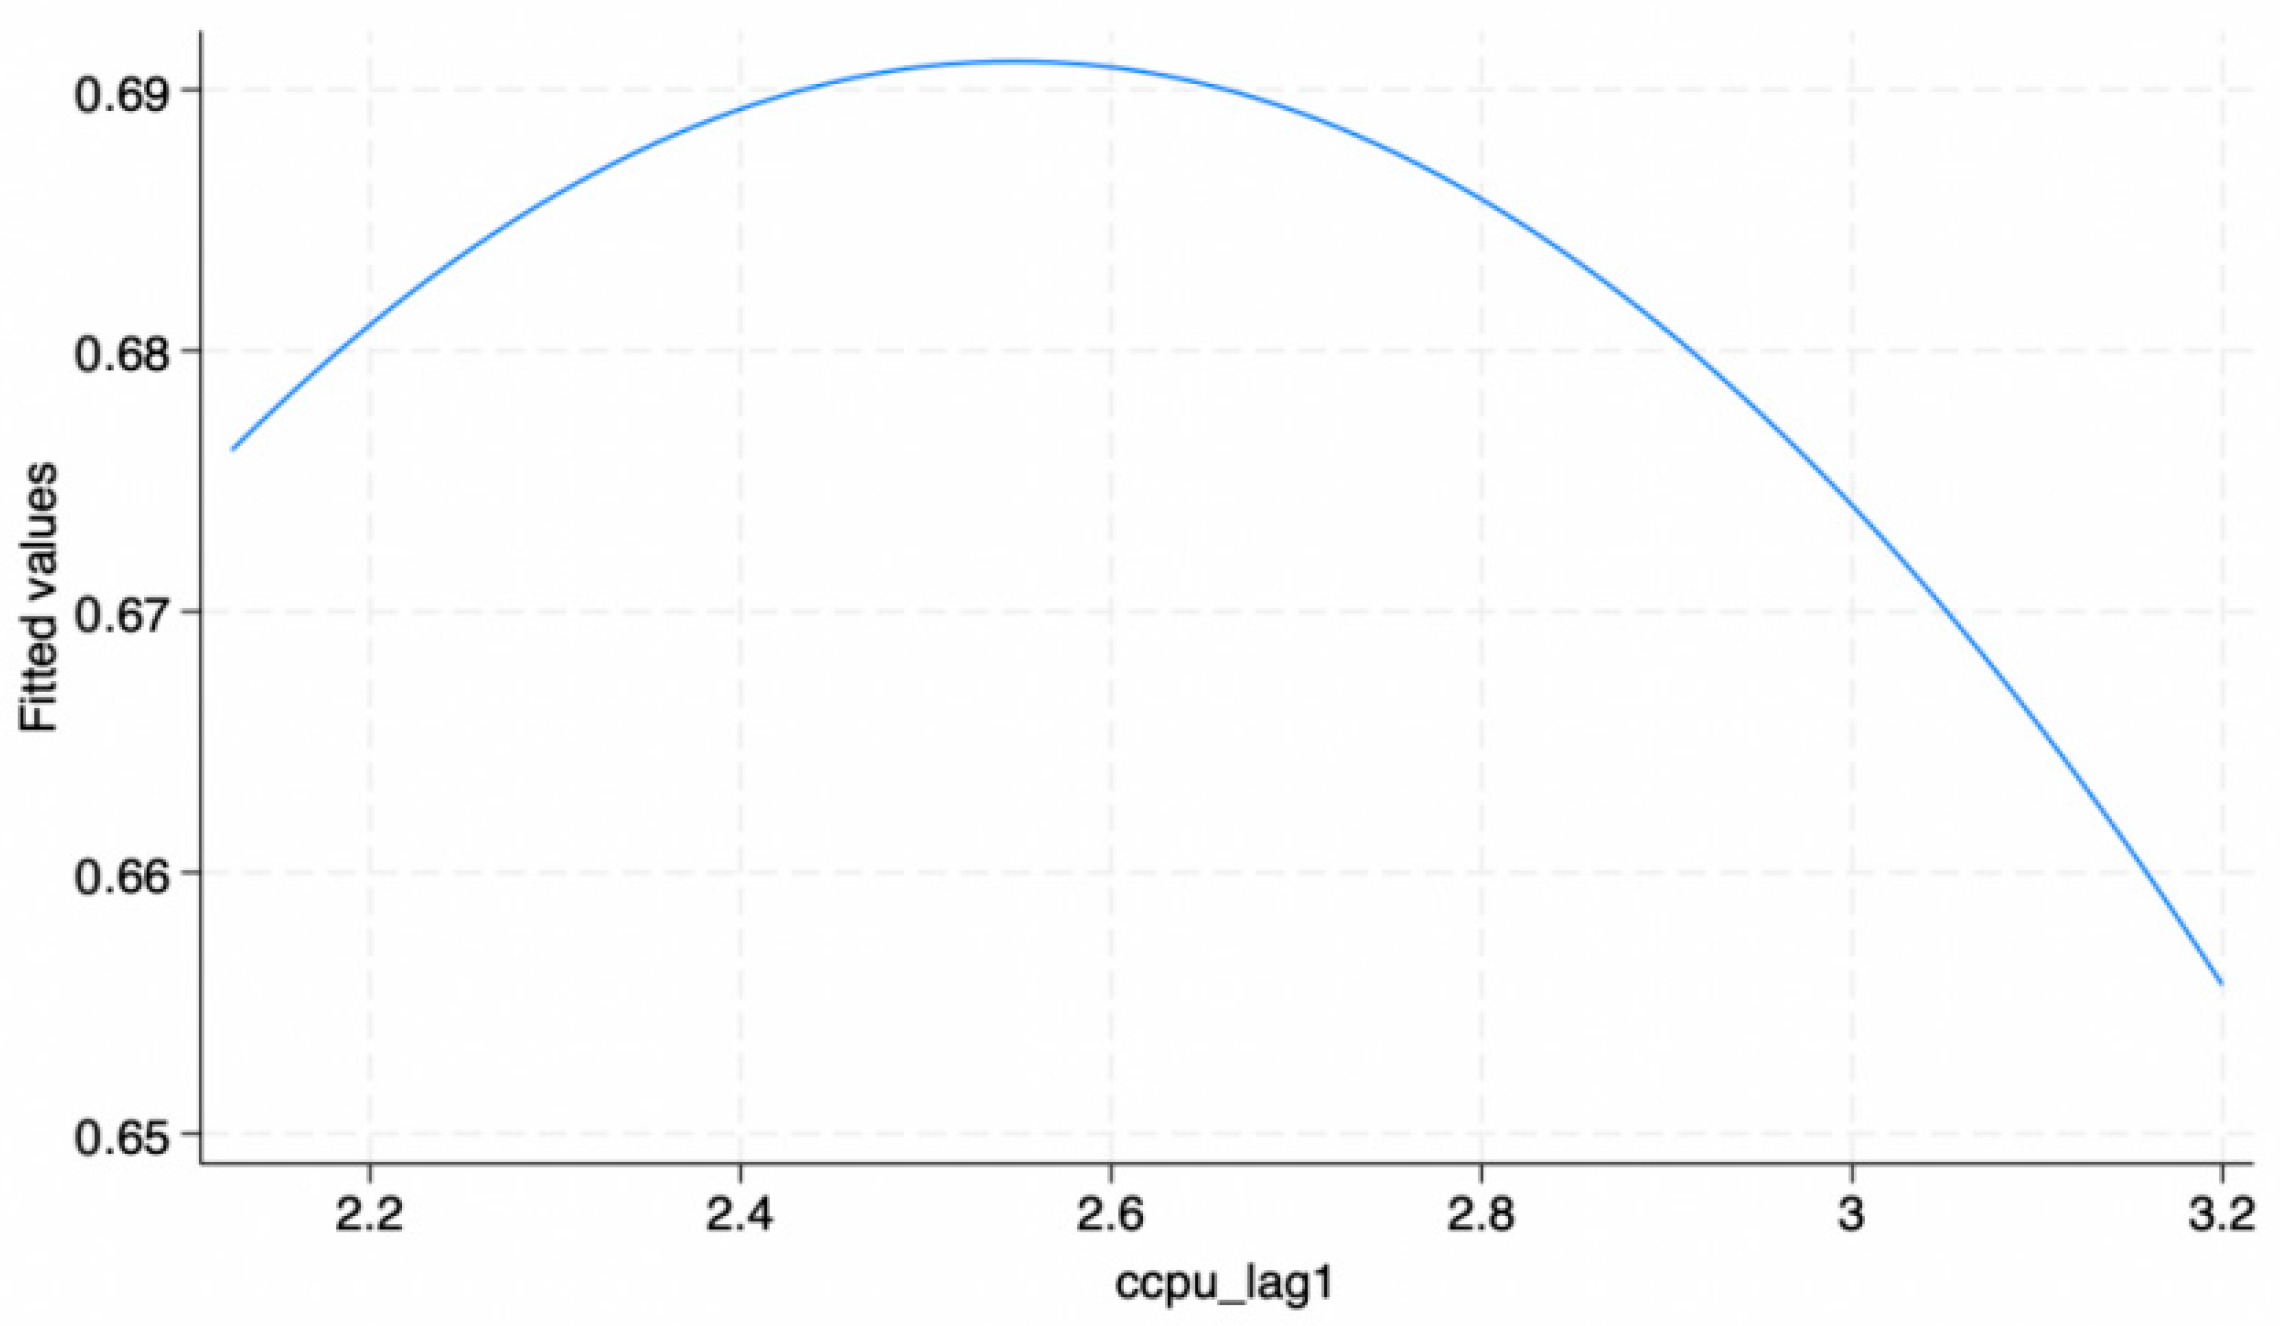
We conduct a U-test to examine the nonlinear relationship between climate policy uncertainty and firms’ equity share. The results are reported in Figure 2 and Table 2. The graphical evidence suggests an inverted U-shaped pattern. Using Stata 19’s U-Test command, Table 2 further shows that the corresponding p-value is well below 0.01, confirming a statistically significant inverted U-shaped relationship.

4. Empirical Results

4.1. Baseline Regression Results

Table 3 reports the baseline fixed-effects results on the relationship between city-level climate policy uncertainty and SRDI firms’ equity financing. Column (1) includes only key regressors. The estimates show that CPUt−1 enters positively ( β 1 = 0.795 ,   p < 0.01 ) and CPUt−12 enters negatively ( β 2 = 0.152 ,   p < 0.01 ), suggesting that equity financing initially increases with uncertainty but eventually declines as uncertainty intensifies. Column (2) adds control variables, and the nonlinear pattern remains unchanged ( β 1 = 0.224 ,   p < 0.01 ;   β 2 = 0.043 ,   p < 0.01 ), confirming that the concavity is not explained by observable firm characteristics. Column (3) reports the regression results after controlling for both year fixed effects and firm fixed effects, and the inverted U-shaped relationship between CPU and EquityRatio remains statistically significant ( β 1 = 0.879 ,   p < 0.05 ;   β 2 = 0.240 ,   p < 0.01 ). Column (4) further incorporates the control variables on this basis, and the coefficients remain significant ( β 1 = 1.453 ,   p < 0.05 ;   β 2 = 0.272 ,   p < 0.05 ) with a markedly higher explanatory power ( R 2 = 0.455 ). Although the R2 values are moderate, this is not unusual in firm-level panel regressions on financing behavior, because firms’ financing decisions are affected by many difficult-to-observe factors. Importantly, after adding firm-level controls, the explanatory power improves substantially, while the core inverted U-shaped relationship remains robust. These results support Hypothesis H1.
These regression results are consistent with those illustrated in Figure 2, where the turning point appears at a CPU level of around 2.6. When CPU is below 2.6, equity financing increases as CPU rises; however, when CPU exceeds 2.6, equity financing declines as CPU continues to rise. These results imply a “preemptive move vs. wait-and-see” pattern: SRDI firms tend to front-load equity issuance under low-to-moderate climate policy uncertainty, but shift toward more cautious equity financing once uncertainty becomes sufficiently elevated.

4.2. Model Robustness Tests

Following the baseline model analysis, this section conducts several robustness checks to ensure the reliability and stability of the research findings.

4.2.1. Alternative Measures of Equity Financing

To ensure that our findings are not contingent on the specific measurement of the equity ratio, we employ two alternative indicators of equity financing as dependent variables: the ratio of retained earnings to total assets (SVA) and the logarithm of net assets per share (NAPSL). Equation (1) is then re-estimated using these measures, with the results reported in Table 4.
In Column (1) of Table 4, where SVA is the dependent variable, the coefficient for CPUt−1 is significantly positive ( β 1 = 1.748 ,   p < 0.01 ), while the coefficient for CPUt−12 is significantly negative ( β 2 = 0.329 ,   p < 0.01 ). Similarly, Column (2) shows that when NAPSL is used, the coefficient for CPUt−1 remains significantly positive ( β 1 = 26.454 ,   p < 0.01 ) and CPUt−12 remains significantly negative ( β 2 = 4.964 ,   p < 0.01 ). These consistent results across different equity-related metrics further confirm the robust inverted U-shaped relationship between climate policy uncertainty and enterprise equity financing.

4.2.2. Additional Robustness Checks

To further verify the reliability of our baseline findings, we perform several additional robustness tests, as reported in Table 5. First, we exclude firms located in Hainan Province in Column (1), as the variation in CPU in this region is relatively limited [64]. Second, to rule out potential confounding effects from the COVID-19 pandemic, we exclude the 2020 sample in Column (2) to ensure that the core findings are not driven by major external shocks [65]. Regarding the inference method, Column (3) employs two-way clustered standard errors at the firm-city level to account for potential residual correlations across different dimensions. Finally, Column (4) implements a more stringent province-year fixed effects specification to control for time-invariant paired characteristics. Across all these specifications, the coefficients of CPUt−1 and CPUt−12 remain significantly positive and negative, respectively, providing further evidence for the robust inverted U-shaped relationship hypothesized earlier. The above robustness checks consistently indicate that the estimated turning point is around 2.6.

4.3. Endogeneity Analysis: Instrumental Variable Approach

Although the baseline fixed-effects model controls for firm-specific heterogeneity and year-specific shocks, potential endogeneity concerns may still remain. Specifically, climate policy uncertainty may be correlated with unobserved macroeconomic or regional factors that also affect firms’ equity-financing decisions. In addition, possible measurement error in the city-level CPU index may bias the estimated coefficients. To alleviate these concerns, this study further employs an instrumental variable (IV) approach.
Following Zheng et al. (2025), we utilize the U.S. CPU index ( I V _ C p u ), provided by Gavriilidis (2021), as an instrumental variable for Chinese CPU to address potential endogeneity concerns [66,67]. As the world’s largest economy, the United States is likely to influence Chinese government policy on climate issues. Accordingly, U.S. climate policy uncertainty is expected to be positively associated with Chinese climate policy uncertainty, thereby satisfying the relevance condition of the instrument. However, given China’s capital controls, U.S. climate policy uncertainty is less likely to directly affect the equity ratio of Chinese firms. Instead, its effect is more likely to operate through the transmission of climate policy uncertainty across major economies, which helps support the exclusion restriction.
Specifically, the first-stage regression confirms that the U.S. CPU is significantly positively associated with Chinese CPU, thereby validating the relevance criterion. Moreover, the first-stage F-statistics are 285.123 and 283.577, respectively, both of which are well above the conventional threshold of 10, suggesting that weak-instrument concerns are unlikely to be serious. Column (3) of Table 6 reports the results of the two-stage least squares (2SLS) estimation, which confirm a significant inverted U-shaped relationship between climate policy uncertainty and equity financing, indicating that the main findings remain robust after accounting for potential endogeneity.

5. Further Analysis

5.1. Mechanism Analysis

Consistent with the theoretical analysis, we examine whether debt financing cost and firm value mediate the relationship between climate policy uncertainty and equity financing in opposite directions, with the former reinforcing the positive side of the relationship and the latter reinforcing the negative side. The overall inverted U-shaped pattern should be understood as the net result of two channels with opposite signs, rather than nonlinearities in each mediator itself. The purpose of the mechanism analysis is not to assume that each mediator itself follows a nonlinear pattern. Instead, it is to examine whether the inclusion of each mediator changes the estimated curvature of the relationship between climate policy uncertainty and equity financing. In this sense, the overall inverted U-shaped pattern should be understood as the net result of two channels with opposite signs. To test the mediating mechanisms, we estimate the following Equations (2) and (3) [68]:
M i , t = α 0 + α 1 C P U c ,   t 1 + α 2 ( C P U c ,   t 1 ) 2 + θ C o n t r o l s i , c , t + F i r m F E + Y e a r F E + ε i , c , t
E q u i t y R a t i o i , t = γ 0 + γ 1 M i , t + γ 2 C P U c , t 1 + γ 3 ( C P U c , t 1 ) 2 + κ C o n t r o l s i , c , t + F i r m F E + Y e a r F E + ε i , c , t
Here, M i , t denotes the mediating variable, which is alternatively measured by debt financing cost ( D e b t C o s t ) and firm value (FirmValue). All other variables are defined in the same way as in the baseline regression. Equation (2) tests whether CPU significantly affects the mediator, while Equation (3) examines whether the mediator is significantly associated with equity financing after controlling for the linear and quadratic terms of CPU. Mediation is inferred when the mediator is significant and the CPU coefficients are attenuated after the mediator is introduced.
Table 7 reports the regression results for the debt financing cost channel. Column (1) presents the regression results for Equation (2). The linear term of C P U t 1 is significantly positive at the 1% level, while the quadratic term is insignificant. This indicates a significant positive linear relationship between climate policy uncertainty and debt-financing costs. As policy uncertainty increases, creditors require higher risk pricing, thereby raising the debt-financing costs of SRDI enterprises. Column (2) reports the regression results for Equation (3). The results show that the coefficient on D e b t C o s t is significantly positive ( γ 1 = 1.154 , p < 0.01 ). After DebtCost is included, the coefficients on the CPU terms are attenuated, and the implied turning point is no longer economically meaningful within the observed sample range. This indicates that the upward-sloping segment of the baseline inverted U-shaped relationship is largely transmitted through the debt financing cost channel. Therefore, Hypothesis H2a is supported.
Table 8 reports the regression results for the firm value channel. Column (1) presents the regression results for Equation (2). The coefficient on the linear term of C P U t 1 is significantly negative at the 1% level, while the quadratic term is insignificant, indicating that rising uncertainty generates a pronounced valuation discount in capital markets and suppresses firm value. Column (2) reports the regression results for Equation (3). The coefficient on FirmValue is significantly negative at the 1% level ( γ 1 = 0.988 , p < 0.01 ). After controlling for FirmValue, the absolute magnitudes of the CPU coefficients decline and the implied turning point shifts to the right, suggesting that the downward-sloping segment of the baseline inverted U-shaped relationship is largely explained by the firm-value channel. Therefore, Hypothesis H2b is supported.

5.2. Heterogeneity Analysis

To further investigate whether the effects of climate policy uncertainty on the equity financing decisions of SRDI firms vary across firm characteristics and competitive environments, this study conducts heterogeneity tests using subsample regressions.
Table 9 reports subgroup results by ownership type and industry concentration. Firms are classified into private firms and state-owned enterprises (SOEs). Industry concentration is proxied by the CR4 index, with 0.4 as the cutoff distinguishing high-concentration (CR4 > 0.4) from low-concentration (CR4 ≤ 0.4) industries [69]. The estimates indicate that for private firms (Columns 1–2), the coefficient on CPUt−1 is positive and statistically significant, whereas the coefficient on CPUt−12 is negative and statistically significant. PoEs rely more heavily on external equity financing; therefore, the share of equity financing is more sensitive to climate policy uncertainty. In contrast, the corresponding coefficients for SOEs are statistically insignificant, implying a relatively muted financing response to CPU. At the industry level (Columns 3–4), the effects are significant in high-concentration industries but insignificant in low-concentration industries, indicating that the influence of CPU on equity financing is more pronounced in more concentrated competitive structures.
Table 10 further examines heterogeneity with respect to firms’ risk resilience from both external and internal perspectives. External resilience is measured by the network centrality of independent directors, where higher centrality indicates stronger external resilience and lower centrality indicates weaker external resilience [70]. Internal resilience is proxied by internal governance deficiencies, where the absence of such deficiencies indicates stronger internal resilience, while their presence indicates weaker internal resilience [71]. For external resilience (Columns 1–2), the core coefficients for the high-resilience group are insignificant, whereas the low-resilience group shows a significant inverted U-shaped response. This demonstrates that firms with insufficient external network resources and information-gathering capabilities are more susceptible to the interference of climate policy uncertainty. Regarding internal resilience (Columns 3–4), the coefficient on CPUt−1 is significantly negative and the coefficient on CPUt−12 is significantly positive in the high-resilience group, whereas the low-resilience group exhibits the opposite signs. These results indicate that the equity financing of firms with low internal resilience is more sensitive to climate policy uncertainty, suggesting that weaker internal governance and insufficient organizational resilience significantly amplify the impact of policy uncertainty on corporate financing decisions.
Overall, the heterogeneity results suggest that the impact of CPU on SRDI firms’ equity financing is non-uniform. Ownership structure, industry concentration, and internal/external resilience significantly moderate both the magnitude and the direction of firms’ financing responses to climate policy uncertainty.

6. Discussion

This study contributes to the growing literature on climate policy uncertainty by showing that its effect on SRDI firms’ financing decisions is not monotonic, but follows an inverted U-shaped pattern. This finding suggests that climate policy uncertainty does not simply suppress firms’ financing activities. At relatively low to moderate levels, rising uncertainty may induce firms to increase equity financing in a preemptive manner, mainly because higher debt-financing costs encourage substitution from debt to equity. However, when uncertainty becomes sufficiently high, valuation discounts intensify and the implicit cost of equity issuance rises, which discourages firms from further equity financing. Therefore, the financing response of SRDI firms reflects a shift from “preemptive move” to “wait-and-see.”
This result extends the existing literature in two respects. First, while prior studies mainly focus on the effects of climate policy uncertainty on investment, innovation, ESG performance, or firm value, this study highlights its role in reshaping firms’ financing structure. Second, by identifying the debt-cost channel and the firm-value channel as two countervailing mechanisms, this study provides a more nuanced explanation of why the overall effect of climate policy uncertainty on equity financing is nonlinear. This is particularly important for SRDI firms, which are highly dependent on external financing and more vulnerable to policy-induced financing frictions.
More broadly, our findings imply that the economic consequences of climate policy uncertainty depend not only on its level, but also on how financial markets transmit uncertainty into firms’ financing costs and valuation conditions. For innovative SMEs, excessive policy uncertainty may weaken financing capacity and ultimately hinder green transition and long-term innovation. Thus, the policy challenge is not merely to promote more climate policy, but to improve its predictability, credibility, and implementation consistency so that firms can make financing decisions under a more stable institutional environment.

7. Conclusions and Implications

7.1. Conclusions

Using a panel of 262 SRDI enterprises over 2011–2023, we find a robust, statistically significant inverted U-shaped relationship between climate policy uncertainty and the share of equity financing. Equity financing increases when climate policy uncertainty is low to moderate, but decreases once uncertainty becomes sufficiently high. Mechanism evidence suggests two offsetting channels: rising climate policy uncertainty increases debt-financing costs, prompting firms to substitute equity for debt, while it also depresses firm value, which raises the implicit cost of equity issuance and tightens pricing constraints, thereby discouraging equity financing. The inverted U-shaped pattern is stronger for privately owned firms, firms in more highly concentrated industries, and firms with weaker risk resilience. Overall, our findings indicate that climate policy uncertainty does not simply suppress or promote SRDI firms’ equity financing in a linear manner; rather, it exhibits a clear inverted U-shaped pattern, under which firms dynamically switch between “preemptive action” and a “wait-and-see” stance as climate policy uncertainty changes.

7.2. Implications

The findings of this study carry important implications for policymakers, firms, and financial institutions. Since climate policy uncertainty affects equity financing mainly through two opposing channels, namely higher debt financing costs and lower firm value, effective responses should focus not only on reducing policy uncertainty itself, but also on alleviating the financing frictions and valuation pressures generated by such uncertainty. In this sense, improving policy predictability and strengthening the equity financing environment are equally important for supporting the sustainable development of SRDI enterprises.
For policymakers, the key task is to reduce unnecessary climate policy uncertainty by improving the stability, transparency, and consistency of climate related policy design and implementation. In particular, governments should provide clearer policy roadmaps, transition timetables, and implementation standards for climate related regulations, so that firms can form more stable expectations regarding future compliance costs, financing needs, and investment returns. In addition, greater consistency between central policy objectives and local enforcement practices would help reduce uncertainty arising from heterogeneous regional implementation. Because our results show that excessive uncertainty eventually suppresses equity financing by lowering firm value, policymakers should also improve supporting institutions for equity financing, such as green equity investment programs, listing support for innovative SMEs, and more standardized disclosure rules for climate related risks and opportunities.
For firms, the results imply that financing strategies should be adjusted dynamically according to the level of climate policy uncertainty. When uncertainty is at a low to moderate level, firms may benefit from preemptive equity financing arrangements that secure capital before financing frictions intensify. However, when uncertainty becomes excessively high, firms should place greater emphasis on stabilizing firm value, improving climate related information disclosure, and strengthening communication with investors, so as to mitigate valuation discounts and avoid issuing equity under unfavorable pricing conditions. More broadly, SRDI firms should strengthen climate risk management, maintain financing flexibility, and enhance organizational resilience in order to better cope with policy induced financing shocks.
For financial institutions, the findings suggest the need to avoid mechanically amplifying policy uncertainty into excessively high risk premia or severe valuation discounts. Banks, equity investors, and other financial intermediaries should improve climate risk assessment frameworks for SRDI firms and distinguish between temporary policy uncertainty and firms’ long term growth potential. In particular, more diversified equity financing instruments, stronger green equity investment support, and greater participation of long term capital would help innovative firms obtain funding without suffering excessive undervaluation during periods of policy uncertainty. Such efforts would help ease both the debt cost channel and the firm value channel identified in this study.


Author Contributions

Conceptualization, Z.C. (Zhang Cheng) and Z.C. (Zhiyu Chen); methodology, Z.C. (Zhang Cheng) and Z.C. (Zhiyu Chen); software, Z.C. (Zhiyu Chen); validation, Z.C. (Zhang Cheng), Z.C. (Zhiyu Chen) and Y.W.; formal analysis, Z.C. (Zhang Cheng); investigation, Z.C. (Zhiyu Chen); resources, Y.W.; data curation, Z.C. (Zhiyu Chen); writing—original draft preparation, Z.C. (Zhang Cheng) and Z.C. (Zhiyu Chen); writing—review and editing, Y.W.; visualization, Z.C. (Zhiyu Chen); supervision, Z.C. (Zhang Cheng); project administration, Z.C. (Zhiyu Chen); funding acquisition, Z.C. (Zhang Cheng). All authors have read and agreed to the published version of the manuscript.

Funding

This research was funded by the National Social Science Fund of China (grant number: 25CJY116) and the Jiangsu Provincial Department of Education (grant number: 2025SJZD028).

Institutional Review Board Statement

Not applicable.

Informed Consent Statement

Not applicable.

Data Availability Statement

The datasets presented in this article are not readily available because they were obtained from commercial databases (e.g., CSMAR and Wind) under license agreements, and the authors do not have the right to redistribute them publicly. Requests to access the datasets should be directed to the corresponding authors.

Acknowledgments

The authors would like to thank the editors and anonymous reviewers for their insightful comments and suggestions.

Conflicts of Interest

The authors declare no conflicts of interest. The funders had no role in the design of the study; in the collection, analyses, or interpretation of data; in the writing of the manuscript; or in the decision to publish the results.

Appendix A

Table A1 presents the detailed definitions of all variables.
Table A1. Variable definitions.
Vars. Abbr.Definition
EquityRatioEquity financing ratio. Shareholders’ equity divided by total assets
CPUt1One-period lag of the city-level climate policy uncertainty index.
CPUt12Squared term of the one-period lagged CPU index.
DebtCostDebt financing constraint proxied by debt cost. Financial expenses divided by total liabilities.
FirmValueTobin’s Q. (Market value of equity + book value of liabilities) divided by total assets.
SizeFirm Size. Natural logarithm of the firm’s total assets at year-end.
RoAThe ratio of net profit to total assets.
GrowthGrowth rate of operating revenue (sales growth).
TangibilityFixed assets divided by total assets.
LiquidityCurrent ratio: current assets divided by current liabilities.
Non-debt-TaxShieldDepreciation divided by total assets.
R&DIntensityR&D expenditure is divided by operating revenue.
Year FEYear dummies to control for time-varying macroeconomic conditions and common shocks.
Firm FEFirm dummies to control for time-invariant unobserved firm heterogeneity.

References

  1. Chen, F.; Wang, M.; Pu, Z. The impact of technological innovation on air pollution: Firm-level evidence from China. Technol. Forecast. Soc. Change 2022, 177, 121521. [Google Scholar] [CrossRef]
  2. Fei, J.; Pu, Z.; Tavera, C. The power of patent transfer: The impact of green technology acquisition on non-residential CO2 emissions under the intervention of government actions. J. Asian Econ. 2024, 94, 101787. [Google Scholar] [CrossRef]
  3. Wang, S.; Yu, D.; Sun, M. Can internet development improve carbon emission efficiency for manufacturing? The role of market integration. J. Environ. Manag. 2024, 366, 121815. [Google Scholar] [CrossRef]
  4. Zhang, H.; Liu, J.; Guo, Q.; Zhang, X.; Hu, X. The impact of climate policy uncertainty on urban climate risk: Evidence from 274 cities in China. Sustain. Cities Soc. 2025, 119, 106097. [Google Scholar] [CrossRef]
  5. Gao, J.; Hu, W. Heterogeneous Effects of SRDI Policy on Asset Valuation. Int. Rev. Econ. Financ. 2026, 106, 104965. [Google Scholar] [CrossRef]
  6. Fu, J.; Zhou, Y.; Gao, Y.; Managi, S. Stranded assets from climate change and its response strategies. Environ. Res. Lett. 2025, 20, 113008. [Google Scholar] [CrossRef]
  7. Cheng, S.; Chen, Y.; Wang, K.; Jia, L. Climate policy uncertainty influences carbon emissions in the semiconductor industry. Int. J. Prod. Econ. 2024, 278, 109436. [Google Scholar] [CrossRef]
  8. Zhao, L.; Ma, Y.; Chen, N.; Wen, F. How does climate policy uncertainty shape corporate investment behavior? Res. Int. Bus. Financ. 2025, 74, 102696. [Google Scholar] [CrossRef]
  9. Huang, T.; Sun, Z. Climate policy uncertainty and firm investment. Int. J. Financ. Econ. 2024, 29, 4358–4371. [Google Scholar] [CrossRef]
  10. Bai, D.; Du, L.; Xu, Y.; Abbas, S. Climate policy uncertainty and corporate green innovation: Evidence from Chinese A-share listed industrial corporations. Energy Econ. 2023, 127, 107020. [Google Scholar] [CrossRef]
  11. Sun, G.; Fang, J.; Li, T.; Ai, Y. Effects of climate policy uncertainty on green innovation in Chinese enterprises. Int. Rev. Financ. Anal. 2024, 91, 102960. [Google Scholar] [CrossRef]
  12. Lu, H.; Hunt, A. Towards sustainability: How does climate policy uncertainty affect regional green innovation in China? Sustainability 2025, 17, 2857. [Google Scholar] [CrossRef]
  13. Cheng, Z.; Wu, Y. The impact of climate policy uncertainty on corporate ESG greenwashing. J. Environ. Manag. 2025, 394, 127353. [Google Scholar] [CrossRef]
  14. Wang, J.; Li, L. Climate risk and Chinese stock volatility forecasting: Evidence from ESG index. Financ. Res. Lett. 2023, 55, 103898. [Google Scholar] [CrossRef]
  15. Li, B.; Guo, W.; Lv, X.; Guo, Y. The mediating role of supply chain integration to supply chain resilience–an empirical study on SRDI SMEs in new energy vehicle supply chains. Int. J. Logist. Manag. 2025, 36, 1790–1815. [Google Scholar] [CrossRef]
  16. Bai, J.; Qu, G. How does digital intelligence drive the SRDI development of SMEs? Evidence from Chinese-style niche enterprises. Technol. Forecast. Soc. Change 2025, 219, 124260. [Google Scholar] [CrossRef]
  17. Zhang, L.; Qiu, H.; Chen, J.; Li, H.; Wan, X. How to enhance enterprises’ radical innovation performance through multiple pathways—A machine learning analysis of SRDI enterprises in China. Systems 2025, 13, 198. [Google Scholar] [CrossRef]
  18. Huang, J.; Zhou, L.; Song, S.; Zhou, H. The impact of de-familization on green innovation: Evidence from SRDI family firms in China. PLoS ONE 2025, 20, E0314110. [Google Scholar] [CrossRef]
  19. Wang, L.; Tang, Y.; Zhao, X. From niche to green: Configurational pathways to enhance green innovation in Chinese chemical SRDI enterprises. Environ. Prog. Sustain. Energy 2025, 2025, E70192. [Google Scholar] [CrossRef]
  20. Qu, G.; Bai, J. How to achieve the high-quality development of SRDI enterprises? Evidence from machine learning. Manag. Decis. Econ. 2024, 45, 2023–2041. [Google Scholar] [CrossRef]
  21. An, Y.; Sheng, X.; Zhu, X.; Zhang, Q. The role of financial flexibility in sustainable development performance of SRDI enterprises. J. Syst. Sci. Syst. Eng. 2025, 34, 78–101. [Google Scholar] [CrossRef]
  22. Huang, W. Climate policy uncertainty and green innovation. Econ. Lett. 2023, 233, 111423. [Google Scholar] [CrossRef]
  23. Ge, H.; Zhang, X. From uncertainty to sustainability: How climate policy uncertainty shapes corporate ESG? Int. Rev. Econ. Financ. 2025, 98, 104011. [Google Scholar] [CrossRef]
  24. Huo, M.; Li, C.; Liu, R. Climate policy uncertainty and corporate green innovation performance: From the perspectives of organizational inertia and management internal characteristics. Manag. Decis. Econ. 2024, 45, 34–53. [Google Scholar] [CrossRef]
  25. Wang, C.; Wang, H.; Bai, Y.; Shan, J.; Nie, P.; Chen, Y. The impact of climate policy uncertainty on corporate pollution emissions—Evidence from China. J. Environ. Manag. 2024, 363, 121426. [Google Scholar] [CrossRef]
  26. Dong, D.; Zheng, D. The adverse impact of climate policy uncertainty on air quality in China. J. Environ. Manag. 2025, 392, 126597. [Google Scholar] [CrossRef]
  27. Persakis, A. The impact of climate policy uncertainty on ESG performance, carbon emission intensity and firm performance: Evidence from Fortune 1000 firms. Environ. Dev. Sustain. 2024, 26, 24031–24081. [Google Scholar] [CrossRef]
  28. Zhang, Z.; Feng, Y.; Zhou, H.; Chen, L.; Liu, Y. The impact of climate policy uncertainty on the ESG performance of enterprises. Systems 2024, 12, 495. [Google Scholar] [CrossRef]
  29. Dowling, M.; O’gorman, C.; Puncheva, P.; Vanwalleghem, D. Trust and SME attitudes towards equity financing across Europe. J. World Bus. 2019, 54, 101003. [Google Scholar] [CrossRef]
  30. Wu, L.; Xu, L. The role of venture capital in SME loans in China. Res. Int. Bus. Financ. 2020, 51, 101081. [Google Scholar] [CrossRef]
  31. Tsuruta, D. SME policies as a barrier to growth of SMEs. Small Bus. Econ. 2020, 54, 1067–1106. [Google Scholar] [CrossRef]
  32. Hackett, B.; Moxnes, E. Natural capital in integrated assessment models of climate change. Ecol. Econ. 2015, 116, 354–361. [Google Scholar] [CrossRef]
  33. Hu, D.; Zhang, S.; Fang, T. Firm-level climate policy uncertainty perception and the cost of equity capital: Evidence from textual analysis. J. Appl. Econ. 2026, 29, 2618420. [Google Scholar] [CrossRef]
  34. Angelidis, T.; Sakkas, A.; Spiliotopoulos, G. Climate uncertainty and marginal climate capital needs. Financ. Res. Lett. 2023, 56, 104060. [Google Scholar] [CrossRef]
  35. Jia, J.; Li, Z. Does external uncertainty matter in corporate sustainability performance? J. Corp. Financ. 2020, 65, 101743. [Google Scholar] [CrossRef]
  36. Azimli, A. The impact of climate policy uncertainty on firm value: Does corporate social responsibility engagement matter? Financ. Res. Lett. 2023, 51, 103456. [Google Scholar] [CrossRef]
  37. Huang, S.; Foglia, M.; Pacelli, V.; Fan, Y. Substantive action: The Italian corporate ESG response to Climate Policy uncertainty. J. Environ. Manag. 2025, 395, 127948. [Google Scholar] [CrossRef]
  38. Liu, J.; Deng, G.; Yan, J.; Ma, S. Unraveling the impact of climate policy uncertainty on corporate default risk: Evidence from China. Financ. Res. Lett. 2023, 58, 104385. [Google Scholar] [CrossRef]
  39. Chen, W.; Wang, J.; Yi, B.; Zhao, C. How climate policy uncertainty affects corporate debt default risks. Appl. Econ. 2025, 2025, 1–15. [Google Scholar] [CrossRef]
  40. Silva, F.; Ferreira, A.; Cortez, M.C. The performance of green bond portfolios under climate uncertainty: A comparative analysis with conventional and black bond portfolios. Res. Int. Bus. Financ. 2024, 70, 102354. [Google Scholar] [CrossRef]
  41. Li, Z.; Zheng, P. Creditor judicial protection and innovation in SRDI firms: A perspective from bankruptcy judicial specialization. Appl. Econ. Lett. 2025, 2025, 1–8. [Google Scholar] [CrossRef]
  42. Liu, J.; Lu, H.; Qiao, Y. The impact of SRDI policy for SMEs on corporate innovation under the COVID-19: Evidence from China. Appl. Econ. Lett. 2024, 31, 2356–2362. [Google Scholar] [CrossRef]
  43. Mo, Y.; Liu, X. Climate policy uncertainty and digital transformation of enterprise—Evidence from China. Econ. Lett. 2023, 233, 111377. [Google Scholar] [CrossRef]
  44. Zhang, L.; Gao, J. Does climate policy uncertainty influence corporate cash holdings? Evidence from the US tourism and hospitality sector. Tour. Econ. 2024, 30, 1704–1728. [Google Scholar] [CrossRef]
  45. Bouri, E.; Iqbal, N.; Klein, T. Climate policy uncertainty and the price dynamics of green and brown energy stocks. Financ. Res. Lett. 2022, 47, 102740. [Google Scholar] [CrossRef]
  46. Hoque, M.E.; Soo-Wah, L.; Bilgili, F.; Ali, M.H. Connectedness and spillover effects of US climate policy uncertainty on energy stock, alternative energy stock, and carbon future. Environ. Sci. Pollut. Res. 2023, 30, 18956–18972. [Google Scholar] [CrossRef]
  47. Xu, Z.; Zhou, D.; Ma, J.; Yuan, J. The time-varying relationship between climate uncertainty, low-carbon stocks and green bonds. N. Am. J. Econ. Financ. 2025, 77, 102387. [Google Scholar] [CrossRef]
  48. Xiong, B.; Xie, X. Impact of environmental regulation on the employment effect of high-tech industries: Evidence from spatial durbin model. Sustainability 2024, 16, 7960. [Google Scholar] [CrossRef]
  49. Zhang, T.; Pu, Z. Can energy-consuming rights trading promote green continuous innovation in enterprises? The moderating role of digitization. Energy Econ. 2025, 2025, 108754. [Google Scholar] [CrossRef]
  50. Zhan, K.; Pu, Z. Responsible for inequality: How does climate policy uncertainty increase income inequality? Appl. Econ. 2026, 58, 3227–3246. [Google Scholar] [CrossRef]
  51. Zhang, S.; Cheung, A.W. Are green finance and inclusive finance complements or substitutes for MSMEs?–Evidence from China’s green finance reform and innovation pilot zone. Energy Econ. 2025, 141, 108125. [Google Scholar] [CrossRef]
  52. Iqbal, N.; Bouri, E.; Shahzad, S.J.H.; Alsagr, N. Asymmetric impacts of Chinese climate policy uncertainty on Chinese asset prices. Energy Econ. 2024, 133, 107518. [Google Scholar] [CrossRef]
  53. Liu, C.; Liu, L.; Zhang, D.; Fu, J. How does the capital market respond to policy shocks? Evidence from listed solar photovoltaic companies in China. Energy Policy 2021, 151, 112054. [Google Scholar] [CrossRef]
  54. Ambulkar, S.; Blackhurst, J.; Grawe, S. Firm’s resilience to supply chain disruptions: Scale development and empirical examination. J. Oper. Manag. 2015, 33, 111–122. [Google Scholar] [CrossRef]
  55. Parker, H.; Ameen, K. The role of resilience capabilities in shaping how firms respond to disruptions. J. Bus. Res. 2018, 88, 535–541. [Google Scholar] [CrossRef]
  56. Conz, E.; Magnani, G. A dynamic perspective on the resilience of firms: A systematic literature review and a framework for future research. Eur. Manag. J. 2020, 38, 400–412. [Google Scholar] [CrossRef]
  57. Li, X.; Fung, A.; Fung, H.G.; Jin, H. Enhancing firm resilience: A dual focus on value creation and risk mitigation. Int. Rev. Financ. Anal. 2025, 2025, 104562. [Google Scholar] [CrossRef]
  58. Martinsson, G. Equity financing and innovation: Is Europe different from the United States? J. Bank. Financ. 2010, 34, 1215–1224. [Google Scholar] [CrossRef]
  59. Liu, Y.; Gao, Q. Economic policy uncertainty and enterprise innovation in China: From the perspective of equity financing and financing structure. Econ. Anal. Policy 2024, 81, 17–33. [Google Scholar] [CrossRef]
  60. Ma, Y.R.; Liu, Z.; Ma, D.; Zhai, P.; Guo, K.; Zhang, D.; Ji, Q. A news-based climate policy uncertainty index for China. Sci. Data 2023, 10, 881. [Google Scholar] [CrossRef]
  61. Baker, S.R.; Bloom, N.; Davis, S.J. Measuring economic policy uncertainty. Q. J. Econ. 2016, 131, 1593–1636. [Google Scholar] [CrossRef]
  62. Lin, Y. Climate policy uncertainty and energy transition: Evidence from prefecture-level cities in China. Energy Econ. 2024, 139, 107938. [Google Scholar] [CrossRef]
  63. Zhang, Y. Can the “Little Giant” label enhance firms’ supply chain positions? Econ. Lett. 2025, 246, 112064. [Google Scholar] [CrossRef]
  64. Hu, Y.; Bai, W.; Farrukh, M.; Koo, C.K. How does environmental policy uncertainty influence corporate green investments? Technol. Forecast. Soc. Change 2023, 189, 122330. [Google Scholar] [CrossRef]
  65. Raza, S.A.; Khan, K.A. Climate policy uncertainty and its relationship with precious metals price volatility: Comparative analysis pre and during COVID-19. Resour. Policy 2024, 88, 104465. [Google Scholar] [CrossRef]
  66. Zheng, P.; Ning, Z.; Wu, Q.; Li, W. Climate policy uncertainty and labor demand in high-carbon industries. Financ. Res. Lett. 2025, 84, 107588. [Google Scholar] [CrossRef]
  67. Gavriilidis, K. Measuring Climate Policy Uncertainty. Available online: https://ssrn.com/abstract=3847388 (accessed on 16 May 2021).
  68. Haans, R.F.J.; Pieters, C.; He, Z.L. Thinking about U: Theorizing and testing U-and inverted U-shaped relationships in strategy research. Strateg. Manag. J. 2016, 37, 1177–1195. [Google Scholar] [CrossRef]
  69. Bessen, J. Industry concentration and information technology. J. Law Econ. 2020, 63, 531–555. [Google Scholar] [CrossRef]
  70. Mohammed, A.; Jabbour, A.B.L.S.; Diabat, A. COVID-19 pandemic disruption: A matter of building companies’ internal and external resilience. Int. J. Prod. Res. 2023, 61, 2716–2737. [Google Scholar] [CrossRef]
  71. Stulz, R.M. Risk, the limits of financial risk management, and corporate resilience. Annu. Rev. Financ. Econ. 2025, 17, 411–430. [Google Scholar] [CrossRef]
Figure 1. Research framework.
Sustainability 18 04632 g001
Figure 2. Graphical verification of U-shaped relationships.
Sustainability 18 04632 g002
Table 1. Descriptive statistics of selected samples.
VariableObservationsMeanStd. Dev.MinMax
EquityRatio34060.6920.1620.2930.951
CPU34062.8810.6792.1254.000
Size340621.3260.69819.83123.256
RoA34060.0610.087−0.3800.250
Growth34060.1700.317−0.4871.487
Tangibility34060.1700.1070.0090.491
Liquidity34063.8223.3770.83820.443
Non-debt-TaxShield34060.0190.0110.0020.061
R&DIntensity34067.8436.2221.46037.140
Table 2. U-shaped relationship test results.
Specification: f(x) = x2Extreme Point: 2.603
Test: H1: Inverse U shape vs. H0: Monotone or U shape
Lower boundUpper bound
Interval2.1253.200
Slope0.041−0.051
t-value2.766−3.290
p > |t|0.0030.001
Overall test of presence of an Inverse U shape:
t-value = 2.770p > |t| = 0.003 ***
Notes: *** indicates significance at the 1% level.
Table 3. Baseline regression: climate policy uncertainty and equity financing.
(1)(2)(3)(4)
VariablesEquityRatioEquityRatioEquityRatioEquityRatio
CPUt−10.795 ***0.224 ***0.879 **1.453 **
(9.103)(3.050)(2.176)(2.158)
CPUt−12−0.152 ***−0.043 ***−0.240 ***−0.272 **
(−9.257)(−3.107)(−12.018)(−2.156)
Size −0.073 *** −0.060 ***
(−17.970) (−11.189)
RoA 0.236 *** −1.192 ***
(11.805) (−7.740)
Growth −0.018 *** −0.019 ***
(−3.589) (−3.860)
Tangibility −0.009 −0.042
(−0.296) (−1.364)
Liquidity 0.020 *** 0.019 ***
(22.641) (21.513)
Non-debt-TaxShield 0.184 0.596 **
(0.658) (2.096)
R&DIntensity 0.003 *** 0.004 ***
(5.372) (6.321)
Constant−0.335 ***1.855 ***−0.577 ***−0.033
(−2.953)(12.348)(−2.576)(−0.036)
Year FENoNoYesYes
Firm FENoNoYesYes
Observations3406340634063406
R20.0410.4260.1780.455
F47.245181.24142.014235.211
Notes: t-statistics are in parentheses. *** and ** denote statistical significance at the 1% and 5% levels, respectively.
Table 4. Robustness check: using alternative dependent variables.
(1)(2)
VariablesSVANAPSL
CPUt11.748 ***26.454 ***
(2.841)(11.008)
CPUt12−0.329 ***−4.964 ***
(−2.846)(−11.009)
Size−0.0050.400 ***
(−1.054)(20.906)
RoA0.511 ***0.592 ***
(27.953)(8.299)
Growth−0.033 ***0.013
(−7.432)(0.712)
Tangibility0.078 ***−0.186 *
(2.783)(−1.708)
Liquidity0.003 ***0.015 ***
(3.549)(4.717)
Non-debt-TaxShield0.682 ***−2.663 ***
(2.623)(−2.622)
R&DIntensity0.001 **0.001
(2.313)(0.456)
Constant−2.073 **−41.131 ***
(−2.484)(−12.620)
Year FEYesYes
Firm FEYesYes
Observations34063406
R20.3400.329
F21.76320.677
Notes: t-statistics are in parentheses. ***, **, and * denote statistical significance at the 1%, 5%, and 10% levels, respectively.
Table 5. Robustness checks: alternative samples and fixed effects settings.
(1)(2)(3)(4)
VariablesEquityRatioEquityRatioEquityRatioEquityRatio
CPUt11.603 ***1.547 ***1.607 ***1.544 ***
(10.546)(9.609)(10.642)(9.650)
CPUt12−0.378 ***−0.271 ***−0.314 ***−0.422 **
(−27.000)(−18.067)(−20.933)(−2.439)
Size−0.078 ***−0.074 ***−0.099 ***0.045 ***
(−4.875)(−4.353)(−5.824)(2.813)
RoA0.460 **0.128 **0.321 *0.190 **
(2.201)(2.327)(1.824)(1.959)
Growth−0.037 **0.044−0.018 *−0.019 ***
(−2.067)(0.431)(−1.800)(−3.860)
Tangibility−0.041 *−0.0320.041−0.038
(−1.864)(−1.000)(1.414)(−1.056)
Liquidity0.010 **−0.384 *0.055 **0.011 **
(2.500)(−1.714)(2.391)(1.833)
Non-debt-TaxShield−0.373 **−0.343 **−0.367 **−0.341 *
(−2.194)(−1.994)(−2.050)(−1.894)
R&DIntensity0.002 ***0.0010.003 ***0.006 *
(15.615)(0.019)(21.585)(1.689)
Constant0.447 ***0.422 **−0.345 **−0.546 ***
(2.709)(2.411)(−2.041)(−2.951)
Year FEYesYesYesNo
Firm FEYesYesYesYes
Province × Year FENoNoNoYes
Observations3380314434063406
R20.3400.3290.3290.455
F221.763220.677327.314335.211
Notes: t-statistics are in parentheses. ***, **, and * denote statistical significance at the 1%, 5%, and 10% levels, respectively. Standard errors in column (3) are two-way clustered at the firm and city levels, while those in the other columns are clustered at the firm level.
Table 6. Endogeneity test: instrumental variable approach.
(1)(2)(3)
First-StageSecond-Stage
VariablesCPUt1CPUt12EquityRatio
IV_CPUt−10.091 ***
(16.886)
IV_CPUt12 0.015 ***
(16.840)
CPUt1 0.894 **
(2.133)
CPUt12 −0.240 ***
(−12.018)
Size −0.060 ***
(−11.189)
RoA 0.026 **
(2.135)
Growth −0.019 ***
(−3.860)
Tangibility −0.042
(−1.364)
Liquidity 0.019 ***
(21.513)
Non-debt-TaxShield 0.596 **
(2.096)
R&DIntensity 0.004 ***
(6.321)
Constant4.099 ***10.887 ***−5.797
(45.339)(44.268)(−1.600)
Year FEYesYesYes
Firm FEYesYesYes
Observations340634063406
R20.1150.1140.455
F285.123283.577135.211
Notes: t-statistics are in parentheses. *** and ** denote statistical significance at the 1% and 5% levels, respectively.
Table 7. Mechanism analysis: the mediating effect of debt financing cost.
(1)(2)
VariablesDebtCostEquityRatio
CPUt118.480 ***0.852 *
(92.668)(1.786)
CPUt12−0.1720.066
(−0.348)(0.143)
DebtCost 1.154 ***
(7.212)
Size−0.069 ***−0.130 *
(−43.179)(−1.831)
RoA−0.013 **0.460 **
(−2.134)(2.201)
Growth−0.004 **0.016 *
(−2.453)(1.660)
Tangibility0.033 ***−0.036 ***
(3.597)(−25.786)
Liquidity0.001 ***0.019 ***
(5.086)(12.671)
Non-debt-TaxShield0.162 *0.296
(1.917)(0.822)
R&DIntensity−0.001 ***0.064
(−5.024)(0.808)
Constant−26.093 ***8.439 ***
(−96.476)(4.133)
Year FEYesYes
Firm FEYesYes
Observations34063406
R20.4790.631
F638.5211970.883
Notes: t-statistics are in parentheses. ***, **, and * denote statistical significance at the 1%, 5%, and 10% levels, respectively.
Table 8. Mechanism analysis: the mediating effect of firm value.
(1)(2)
VariablesFirmValueEquityRatio
CPUt1−45.132 ***0.873 *
(−4.148)(1.785)
CPUt120.609−0.031
(1.360)(−1.616)
FirmValue −0.988 ***
(−5.916)
Size−0.668 ***−0.090 ***
(−7.706)(−3.948)
RoA0.790 **0.199 ***
(2.446)(8.728)
Growth−0.285 *−0.016 ***
(−1.930)(−9.310)
Tangibility−3.464 ***−0.176 *
(−92.563)(−1.842)
Liquidity−0.0220.042 **
(−1.580)(2.344)
Non-debt-TaxShield13.834 ***0.337 ***
(3.009)(8.963)
R&DIntensity−0.018 *0.099 **
(−1.771)(2.492)
Constant74.821 ***2.581 ***
(5.070)(14.104)
Year FEYesYes
Firm FEYesYes
Observations34063406
R20.3850.428
F130.158212.638
Notes: t-statistics are in parentheses. ***, **, and * denote statistical significance at the 1%, 5%, and 10% levels, respectively.
Table 9. Heterogeneity results: ownership and industry concentration.
(1)(2)(3)(4)
POEsSOEsHigh-ConcentrationLow-Concentration
VariablesEquityRatioEquityRatioEquityRatioEquityRatio
CPUt11.518 *−0.9902.646 ***−4.065
(1.930)(−0.772)(3.736)(−1.415)
CPUt12−0.276 ***0.187−0.497 ***0.765
(−3.465)(0.779)(−3.741)(1.420)
ControlsYesYesYesYes
Constant−0.1803.665 **−1.5047.447 *
(−0.169)(2.068)(−1.572)(1.837)
Year FEYesYesYesNo
Firm FEYesYesYesYes
Observations845256122751131
R20.4490.5430.4990.480
F129.92998.130235.89664.783
Notes: t-statistics are in parentheses. ***, **, and * denote statistical significance at the 1%, 5%, and 10% levels, respectively.
Table 10. Heterogeneity results: external and internal risk resilience.
(1)(2)(3)(4)
Low External
Resilience
High External
Resilience
Low Internal
Resilience
High Internal
Resilience
VariablesEquityRatioEquityRatioEquityRatioEquityRatio
CPUt12.562 ***0.6951.532 **−5.803 **
(2.665)(0.664)(2.204)(−2.468)
CPUt12−0.481 ***−0.131−0.287 **1.088 **
(−2.667)(−0.665)(−2.201)(2.466)
ControlsYesYesYesYes
Constant−1.6040.954−0.21410.435 ***
(−1.229)(0.674)(−0.225)(3.224)
Year FEYesYesYesNo
Firm FEYesYesYesYes
Observations1638176818461560
R20.4520.5290.4570.490
F215.78375.930128.59078.738
Notes: t-statistics are in parentheses. *** and ** denote statistical significance at the 1% and 5% levels, respectively.
Disclaimer/Publisher’s Note: The statements, opinions and data contained in all publications are solely those of the individual author(s) and contributor(s) and not of MDPI and/or the editor(s). MDPI and/or the editor(s) disclaim responsibility for any injury to people or property resulting from any ideas, methods, instructions or products referred to in the content.