Article

Ambient PM2.5 Concentrations, Chemical Composition and Source Characteristics in a Residential Area of the Industrial Highveld Priority Area, South Africa


1
School of Health Systems and Public Health, Faculty of Health Sciences, University of Pretoria, Pretoria 0001, South Africa
2
Department of Occupational and Environmental Medicine, Institute of Medicine, Sahlgrenska Academy, University of Gothenburg, 413 90 Goteborg, Sweden
3
Department of Chemistry and Molecular Biology, University of Gothenburg, 413 90 Gothenburg, Sweden
*
Author to whom correspondence should be addressed.
Sustainability 2026, 18(10), 4629; https://doi.org/10.3390/su18104629
Submission received: 1 February 2026 / Revised: 16 April 2026 / Accepted: 27 April 2026 / Published: 7 May 2026
(This article belongs to the Section Air, Climate Change and Sustainability)

Abstract

Sustainable air quality governance requires robust monitoring and updated air quality management plans (AQMPs) to translate legislation into meaningful environmental and health protection. The Highveld Priority Area (HPA), which was declared South Africa’s second National Air Pollution Priority Area in 2007, includes the Ekurhuleni Metropolitan Municipality (EMM), where AQMPs are outdated and long-term chemical characterization data remain limited. This study provides baseline evidence to support AQMP revision by characterizing PM2.5 mass concentrations and chemical composition in a residential area of Kempton Park within the EMM and HPA. A total of 57 24 h PM2.5 samples were collected every sixth day from May 2021 to April 2022. Concentrations ranged from 0.9 to 32 µg/m3 (annual mean 10 µg/m3), exceeding the WHO annual guideline (5 µg/m3) but remaining below the South African standard (20 µg/m3). The daily WHO guideline (15 µg/m3) was exceeded on 13 days. PM2.5, black carbon and organic carbon peaked during winter and spring, consistent with enhanced atmospheric stability and combustion emissions, while elements Br, Fe, K, S, Si and Sr exhibited seasonal variability. Principal component analysis and enrichment factor assessment distinguished crustal sources (Si, Ca, Fe, Ti) from enriched anthropogenic elements (S, Zn, Br, U), indicating contributions from combustion, industrial activities and mining. Correlation patterns and 72 h back-trajectory analysis further demonstrated shared sources and significant regional transport influences. These findings highlight the combined role of local emissions, meteorology and long-range transport, providing locally relevant evidence to inform sustainable air quality management within the EMM and HPA.

1. Introduction

Air pollution comprises a complex mixture of gases, including sulfur dioxide (SO2), nitrogen dioxide (NO2), carbon monoxide (CO), ground-level ozone (O3), and particulate matter (PM), many of which are designated as criteria pollutants [1]. PM is typically classified by aerodynamic diameter: PM10, PM2.5 and ultrafine particles (PM1 or nanoparticles). PM2.5 is of particular health concern, due to its capacity to penetrate deep into the pulmonary alveoli and enter the bloodstream, whereas PM10 is largely removed by the upper respiratory tract [1].
Framing air pollution reduction within a sustainability context is increasingly important, as cleaner air contributes not only to improved health but also to the long-term resilience and environmental integrity of communities. The World Health Organization (WHO) estimates that exposure to ambient and household PM2.5 is responsible for approximately 7 million premature deaths each year [1]. Ambient PM2.5 exposure is a major contributor, with well established associations with cardiovascular and respiratory diseases, particularly among vulnerable populations such as children and individuals with underlying health conditions [1,2,3].
Populations in low- and middle-income countries (LMICs) are disproportionately affected by the health impacts of air pollution, largely due to limited access to healthcare, inadequate infrastructure, restricted technological capacity, and diverse livelihood strategies [4,5]. These structural challenges contribute to a substantial share of the global air pollution-related mortality occurring in LMICs [1,2,3]. Recognizing this inequity, the WHO has called for increased investment in epidemiological research across LMICs, including South Africa, to better understand local exposure–response relationships and to inform targeted policy interventions and public health strategies [1]. Addressing these inequities aligns with broader sustainability objectives centered on reducing environmental burdens while strengthening social and economic resilience in vulnerable populations.
In recent years, global and regional policy frameworks have increasingly emphasized the need for sustainable approaches to air quality management, recognizing that reducing air pollution is integral to environmental, social, and economic sustainability. Improved air quality supports multiple Sustainable Development Goals (SDGs), particularly SDG 3 (Good Health and Well-being), SDG 11 (Sustainable Cities and Communities), and SDG 13 (Climate Action) [6]. Many PM2.5 components, especially black carbon (BC), also act as short-lived climate pollutants, meaning that air pollution control measures can simultaneously advance public health objectives and climate mitigation targets [7,8]. For LMICs such as South Africa, embedding sustainability principles into monitoring networks, regulatory systems, and intervention strategies is essential for ensuring long-term resilience, equity, and co-benefits across health and climate domains.
Furthermore, the WHO has emphasized the need for health studies that assess not only PM2.5 mass concentrations, but also its chemical composition, including BC, organic carbon (OC), trace elements, sulfates, and nitrates, to better understand source-specific toxicity and strengthen evidence-based policymaking [1]. In the Southern African region, although some progress has been made in quantifying ambient PM2.5 levels in selected urban centers, critical gaps remain in long-term monitoring networks and comprehensive chemical speciation of PM [3,9,10,11,12,13]. These limitations hinder the ability to identify dominant pollution sources and assess their relative health impacts. Understanding the chemical composition and sources of PM2.5 is critical for sustainable air quality management, as it enables policymakers to prioritize interventions that reduce human exposure while supporting long-term environmental and public health resilience. Addressing these methodological challenges, such as the lack of standardized measurement protocols, insufficient laboratory infrastructure, and limited temporal coverage, is essential for generating robust, region-specific evidence to support targeted interventions.
A sustainability-oriented approach to air quality management requires both comprehensive monitoring and evidence-based interventions that yield co-benefits for public health, climate change mitigation, and responsible resource use. South Africa is among the few African nations with a long-established air quality legislative framework, which was initially introduced in 1965 and substantially revised in 2004 [14]. Despite this, the national air quality monitoring infrastructure is aging, poorly maintained, and plagued by equipment malfunctions and frequent data gaps [15]. Although PM2.5 monitoring became a legal requirement in 2012, implementation remains inconsistent across municipalities [16]. Additionally, chemical speciation of PM is rarely conducted, with limited data available from a few stations south of Johannesburg—such as Sebokeng and Sharpeville, which monitor BC, but are compromised by data quality issues [17].
Embedding principles of sustainability into air quality governance, including the maintenance of monitoring systems, transparent reporting, and long-term investment, remains critical for ensuring that legislative mandates translate into meaningful environmental and health outcomes.
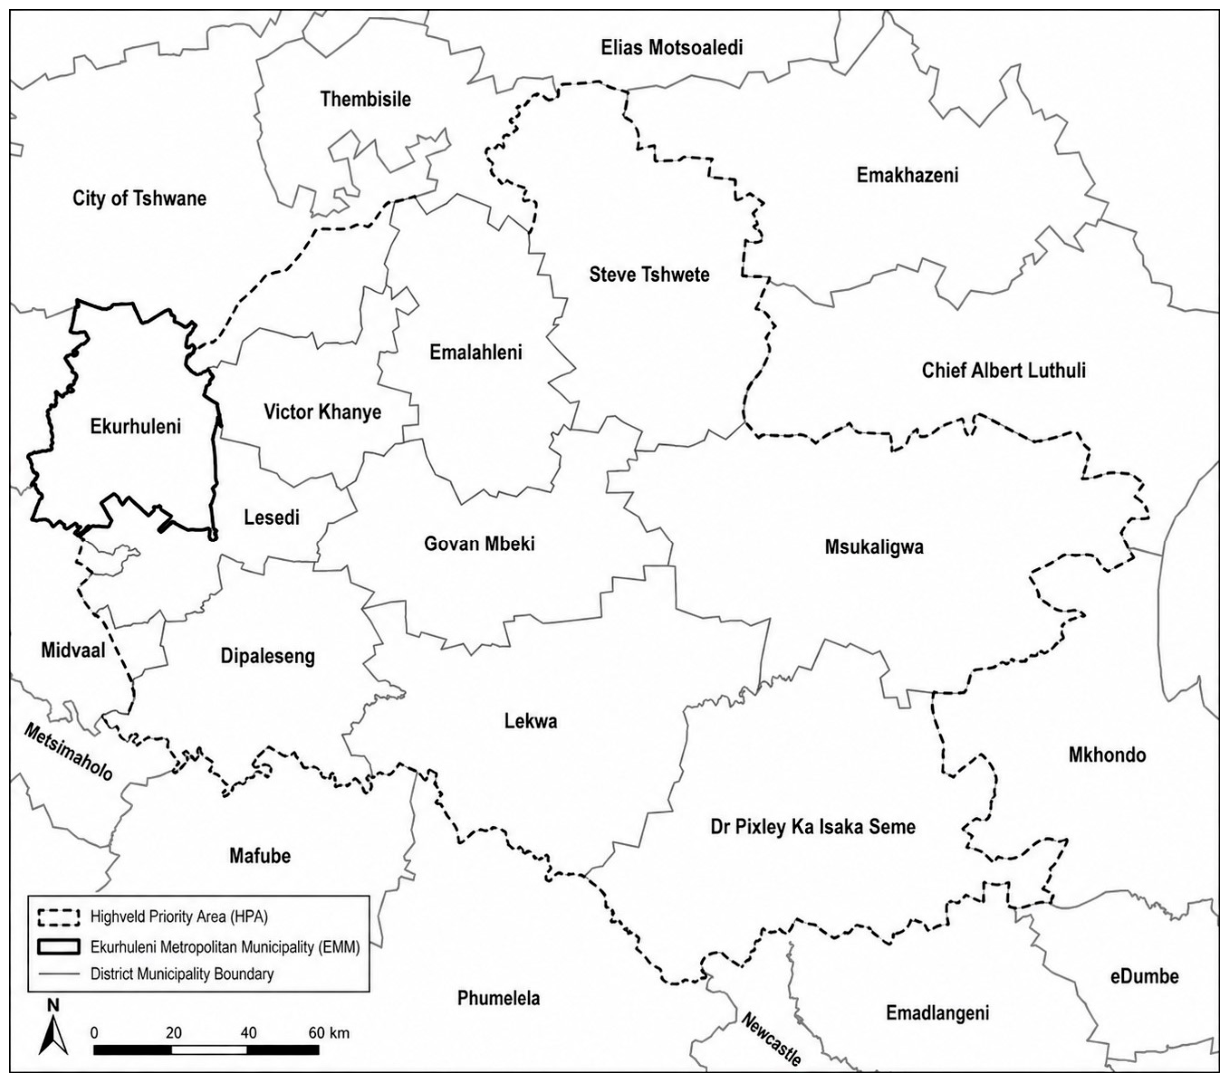
To address critical air pollution hotspots, the Highveld Priority Area (HPA) was declared as South Africa’s second National Air Pollution Priority Area on 23 November 2007 [18]. The HPA spans parts of the Mpumalanga and Gauteng provinces and includes the Ekurhuleni Metropolitan Municipality (EMM) (Figure 1). The latest air quality management plan (AQMP) for the HPA was published in March 2025, after being outdated for 13 years [19,20]. AQMPs are due for revision every five years, as required by the National Environmental Management: Air Quality Act (2004) [21]. The first AQMP of the EMM was in 2005 [22] and there was a call in June 2020 to review it [23]. Currently, no updated AQMP has been published. EMM has 10 air quality monitoring stations located in Bedfordview, Etwatwa, Germiston, Leondale, Olifantsfontein, Springs, Tembisa, Thokoza, Tsakane and Wattville. However, the data quality is poor.
In this context, the present study provides essential baseline data to inform the development of an AQMP for EMM and to support the revision of existing AQMP for the HPA. Although prior studies have examined PM2.5 concentrations and, to a limited extent, its chemical composition in South African residential settings [24,25,26], none have specifically targeted the HPA or EMM. This study should therefore be viewed as a first step toward strengthening the scientific evidence base needed for sustainable air quality governance in the EMM and the HPA. The results provide an initial foundation that can inform future detailed source apportionment studies and support evidence-based revisions of regional and municipal AQMPs.

2. Material and Methods

2.1. Study Area

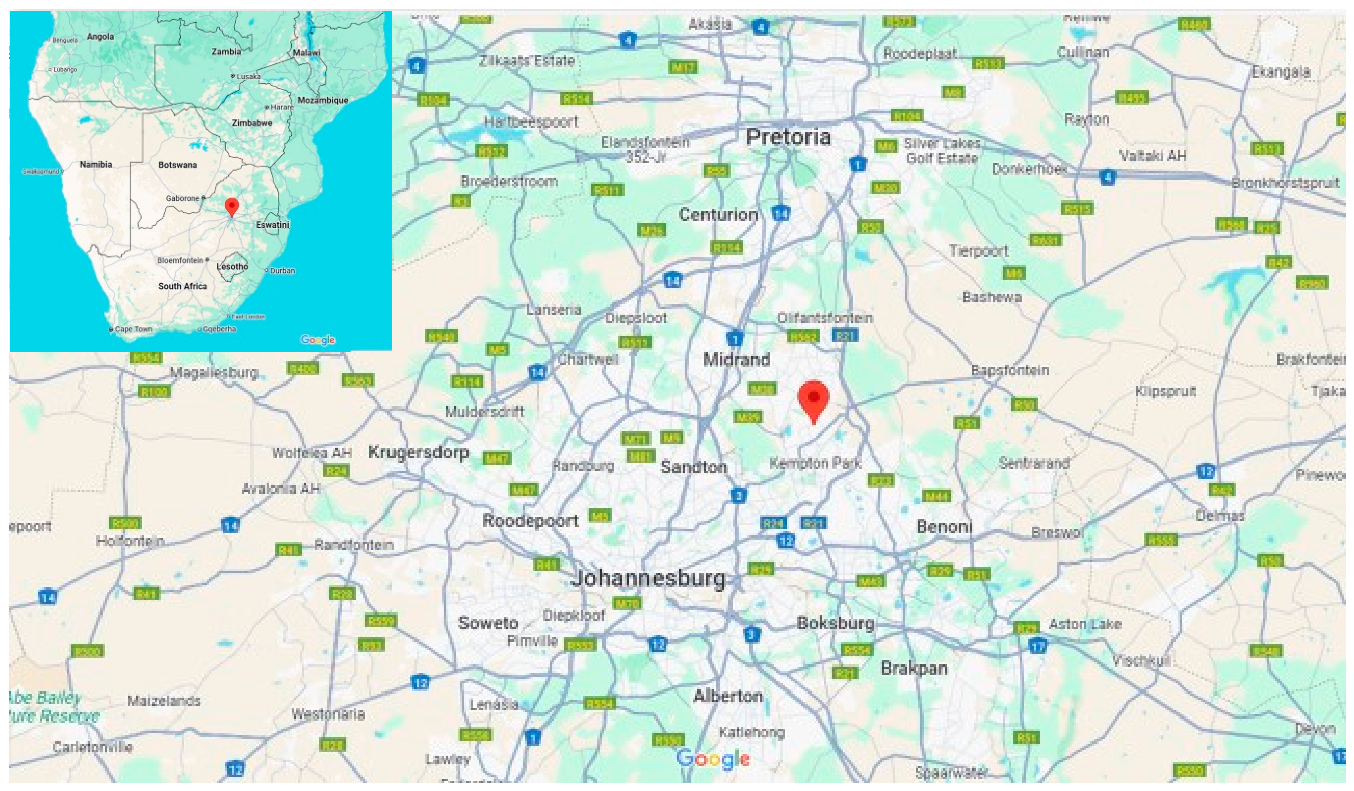
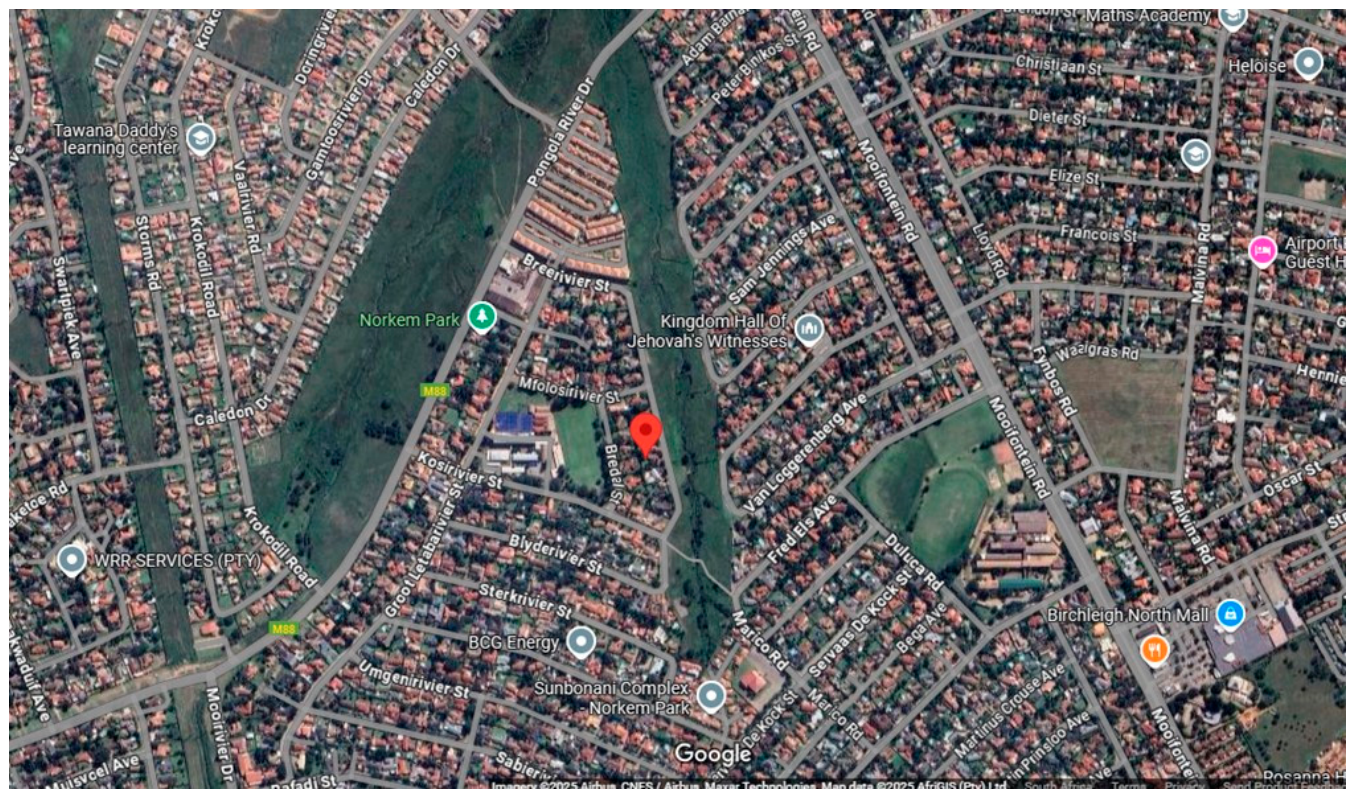
Data were collected from the roof of a residence in Kempton Park, EMM (coordinates: −26.05, 28.22) (Figure 2). The area lies on gently undulating terrain (1460–1760 m above sea level) and has a temperate climate with mean annual rainfall of 710 mm, occurring mainly during summer thunderstorms [22]. Regional meteorology is controlled by seasonal high-pressure systems: winter is characterized by stable conditions, light winds and frequent temperature inversions that limit dispersion, whereas summer features stronger north-easterly winds, convective activity and deeper mixing layers that enhance pollutant dilution [22]. The EMM hosts South Africa’s largest industrial complex, with major activities in Kempton Park being centered around the airport and rail network, including petrochemical, metallurgical, cement, glass and power-generation facilities [19,22]. Additional pollution sources include household fuel burning, traffic and airport emissions, industrial and commercial boilers, landfill and wastewater treatment operations, and dust from unrehabilitated mine tailings. Together, these sources contribute to a complex air quality environment with elevated particulate and gaseous pollutant levels.

2.2. PM2.5 Sampling and Gravimetric Analysis

Samples, including 10 duplicates, were collected over a 24 h period (from 8:00 a.m. to 8:00 a.m.) between 10 May 2021 and 22 April 2022. The use of an every-sixth-day sampling strategy represents a practical approach that is frequently employed in long-term air quality monitoring programs, particularly where resource and laboratory capacity constraints exist [27,28]. Such strategies support sustainable monitoring by enabling extended observational periods while maintaining analytical feasibility, thereby providing valuable baseline information on seasonal variability and pollutant composition. Although this approach may not capture all short-duration pollution episodes, it is well suited for characterizing longer-term patterns in particulate matter composition and potential source influences. Despite the reduced temporal resolution that is inherent in the sampling schedule, the year-long monitoring period ensured coverage of all major seasons, enabling the assessment of seasonal variability in PM2.5 composition.
The collection was conducted using 37 mm Teflon (PTFE) membrane filters (Zefon International, Ocala, FL, USA), mounted on a single-channel GilAir5 personal air sampler (Sensidyne, St Petersburg, FL, USA) fitted with a GK 2.05 KTL PM2.5 cyclone (Sensidyne, Schauenburg Electronic Technologies Group, Mulheim-Ruhr, Germany). This sampling approach follows methods used in previous local studies [26,29,30]. The GilAir5 pump was operated at a flow rate of 4 L/min, which was verified before and after each sampling session, using a field rotameter calibrated against a GilAir calibrator (Sensidyne, St Petersburg, FL, USA). The choice of sampling equipment was informed by its affordability and availability compared to continuous real-time monitoring instruments.
Filter weights were determined using a Mettler-Toledo XP6 Ultra-microbalance (Greifensee, Switzerland) housed in a climate-controlled weighing room at the School of Health Systems and Public Health (SHSPH), University of Pretoria. The room was maintained at a temperature of 21 ± 0.5 °C and a relative humidity of 50 ± 5%. Before weighing, filters were conditioned in this environment for at least 24 h. Following measurement, filters were placed in individual holders and stored under refrigeration at 4 °C. Both exposed and unexposed filters were transported monthly by hand between Pretoria and Kempton Park in separate holders to avoid cross-contamination.

2.3. BC and OC Analyses

A Model OT21 Optical Transmissometer (Magee Scientific Corp., Berkeley, CA, USA) at the University of Gothenburg, Sweden, was used to determine the BC at 880 nm and ultraviolet-absorbing particulate matter, used as a proxy for OC at 370 nm [30].

2.4. Trace Element Analysis

The filter samples were couriered to the Department of Chemistry and Molecular Biology, University of Gothenburg, Sweden, as done in other local studies [29,31]. Trace element concentrations from the PM2.5 filter samples were analyzed using a XEPOS 5 energy-dispersive x-ray fluorescence (EDXRF) spectrometer (Spectro analytical instruments GmbH, Kleve, Germany). The Spectro XRF Analyzer Pro software Version 3.8 (Spectro analytical instruments GmbH, Kleve, Germany) processed and quantified the EDXRF spectra for each filter using a total analysis time of 3000 s, automatically divided between four analytical setup conditions that were similar to other studies [29,31]. The following 17 trace elements were detected: Ag, Ba, Br, Ca, Cl, Cu, Fe, K, Mn, Ni, P, S, Si, Sr, Ti, U and Zn.

2.5. Meteorological Data

Hourly temperature, relative humidity, wind speed and rainfall data were obtained from the South African Weather Services (SAWS). The hourly data were used to calculate 24 h averages from 8am to 8am, i.e., to correspond to the PM2.5 sampling time.

2.6. Statistical Analysis

Statistical analyses were performed using SAS version 9.4. Descriptive statistics were calculated for PM2.5, trace elements, BC, OC and meteorological variables.
Since the Shapiro–Wilk test indicated that these variables were not normally distributed, non-parametric methods were applied. Spearman’s rank correlation was used to assess the relationships between PM2.5, BC, OC, and meteorological parameters. Seasons were defined as autumn (March–May), winter (June–August), spring (September–November), and summer (December–February). The Kruskal–Wallis test was used to determine whether the median concentrations of air pollutants and meteorological variables differed significantly by season and by air mass origin (see below). Additionally, the Wilcoxon rank-sum test was employed to compare the median values between weekdays and weekends.

2.7. Principal Component Analysis

To strengthen source identification beyond descriptive statistics and correlation analysis, principal component analysis (PCA) and enrichment factor (EF) analysis (see next section) were applied. These complementary approaches provide both a statistical grouping of chemical species (PCA) and an independent assessment of crustal versus anthropogenic contributions (EF), thereby enhancing the robustness of the source interpretation.
PCA is widely used as an exploratory receptor modeling technique when datasets are limited or when the uncertainty estimates required for Positive Matrix Factorization (PMF) are not available. Given the relatively small number of samples and the absence of comprehensive uncertainty estimates for all species, PCA was considered to be appropriate for preliminary source identification in this study.
PCA was conducted using the R version 4.2.2 statistical package. Prior to analysis, missing trace element values were replaced with small positive values (0.01 ng m−3), and the data were log-transformed to reduce skewness. Variables were then standardized to ensure equal weighting. Components with eigenvalues greater than one were retained. Loadings with absolute values ≥ 0.5 were considered to be significant contributors to each principal component and were used to interpret potential emission source groupings.
Although the scree plot indicated an elbow after the second component, additional components were retained based on eigenvalues and their interpretability in terms of known emission sources. This approach allows for the identification of source-specific signals that may not be captured within the first few principal components.
A sensitivity analysis was conducted to assess the influence of substituted values for concentrations below detection limits (missing values). Substituting missing values with different small constants (0.01 and 0.001 ng m−3) yielded nearly identical component structures and variance distributions, demonstrating that the findings are robust and not driven by data handling assumptions.

2.8. Enrichment Factors

As mentioned before, EFs were calculated to assess the contribution of crustal versus anthropogenic sources, following the approaches applied in previous South African studies, e.g., a study conducted in Pretoria [31].
PM, particularly PM2.5, has been known to comprise mineral and elements which could originate from natural and anthropogenic sources. The EFs were therefore calculated to differentiate the sources between natural and anthropogenic.
For an element X and reference crustal element Y, the EF for the element X equals the following:
EFx = (X/Y)air/(X/Y)crust
where (X/Y) refers to the concentration ratio of X and Y elements in the PM2.5 aerosols or in the earth crust, respectively. Elements such as Al, Fe, Mn and Rb and also the total organic carbon and grain size have been used in many studies, but in our study, Fe was used as the reference element Y. The choice of this element was attributed to its stability in the soil and its origins are mainly natural sources [32]. The upper continental crust chemical composition used in this study was extracted from the study by Wedepohl [33].
Crustal reference concentrations were obtained from Table 1 of Wedepohl [33]. All elements were taken consistently from this source to ensure comparability in the enrichment factor calculations. Our estimation of EFs was performed with the assumption that the contribution of anthropogenic sources of Fe is insignificant in Pretoria compared with the contribution from natural sources. The Fe, Ca, K and Si concentrations were calculated from Fe2O3, CaO, K2O, and SiO2 values reported in Wedepohl [33], using conversion factors of 0.699, 0.715, 0.830 and 0.467, respectively. All concentrations were expressed in ppm.
Elements with EF values < 10 were considered to be predominantly of crustal origin, whereas EF values > 10 were indicative of non-crustal (anthropogenic) sources [31].

2.9. Geographical Origin of Air Mass Clusters

Building on the source categories that were identified through PCA and EF analysis, backward trajectory analysis was used to examine the geographical origin of air masses and assess the influence of regional transport on the PM2.5 concentrations and composition observed at the Kempton Park sampling site [28,29,31,35].
Throughout the nearly 12-month monitoring period, 72 h backward air mass trajectories were computed daily using the HYSPLIT (Hybrid Single Particle Lagrangian Integrated Trajectory) model [36]. The trajectories were generated via the NOAA Air Resources Laboratory (ARL) online platform, drawing on meteorological data from the NCEP/NCAR Global Reanalysis. This dataset offers atmospheric information with a spatial resolution of 2.5° × 2.5° across 17 vertical levels and is updated every six hours (00:00, 06:00, 12:00, and 18:00). Wind fields were linearly interpolated between these intervals to support accurate trajectory modeling.
To address the uncertainty associated with individual trajectory paths, an ensemble approach was employed. Trajectories were initialized at a central height of 500 m, with additional offsets at ±250 m (i.e., 250 m and 750 m) to enhance reliability. A total of 4248 backward trajectories were generated and subsequently analyzed using cluster analysis within HYSPLIT. Four distinct trajectory clusters were identified as the optimal grouping.

2.10. Ethics Approval

All research studies at the Faculty of Health Sciences, University of Pretoria, require ethics approval. Approval was obtained from the Faculty of Health Sciences Research Ethics Committee, University of Pretoria (References 240/2021).

3. Results and Discussion

A total of 70 PM2.5 filter samples were collected over the study period. Three samples were excluded due to technical issues, such as pump failures caused by power outages. Of the 67 valid samples, 10 were duplicates. For these, the values were averaged, resulting in a final dataset of 57 unique samples collected on 57 separate days.

3.1. Meteorological Conditions

During the 57 days of PM2.5 filter sampling, the median temperature was 15.9 °C (range: 7.7–23.3 °C), the relative humidity was 60.7% (range: 14.4–96.5%), and the wind speed was 4.3 m/s (range: 2.2–9.9 m/s), as shown in Table 2 and Figures S1–S6. Daily rainfall ranged from 0 to 38.8 mm. The wind direction was mostly from the north (11 days) (Figure S5).
None of the meteorological variables varied significantly by season (p > 0.05) (Figure S7). Wind plays a critical role in shaping air pollution concentrations, as it can disperse pollutants by transporting them away from the source or intensify concentrations through atmospheric chemical or physical processes [37].

3.2. PM2.5 Concentrations

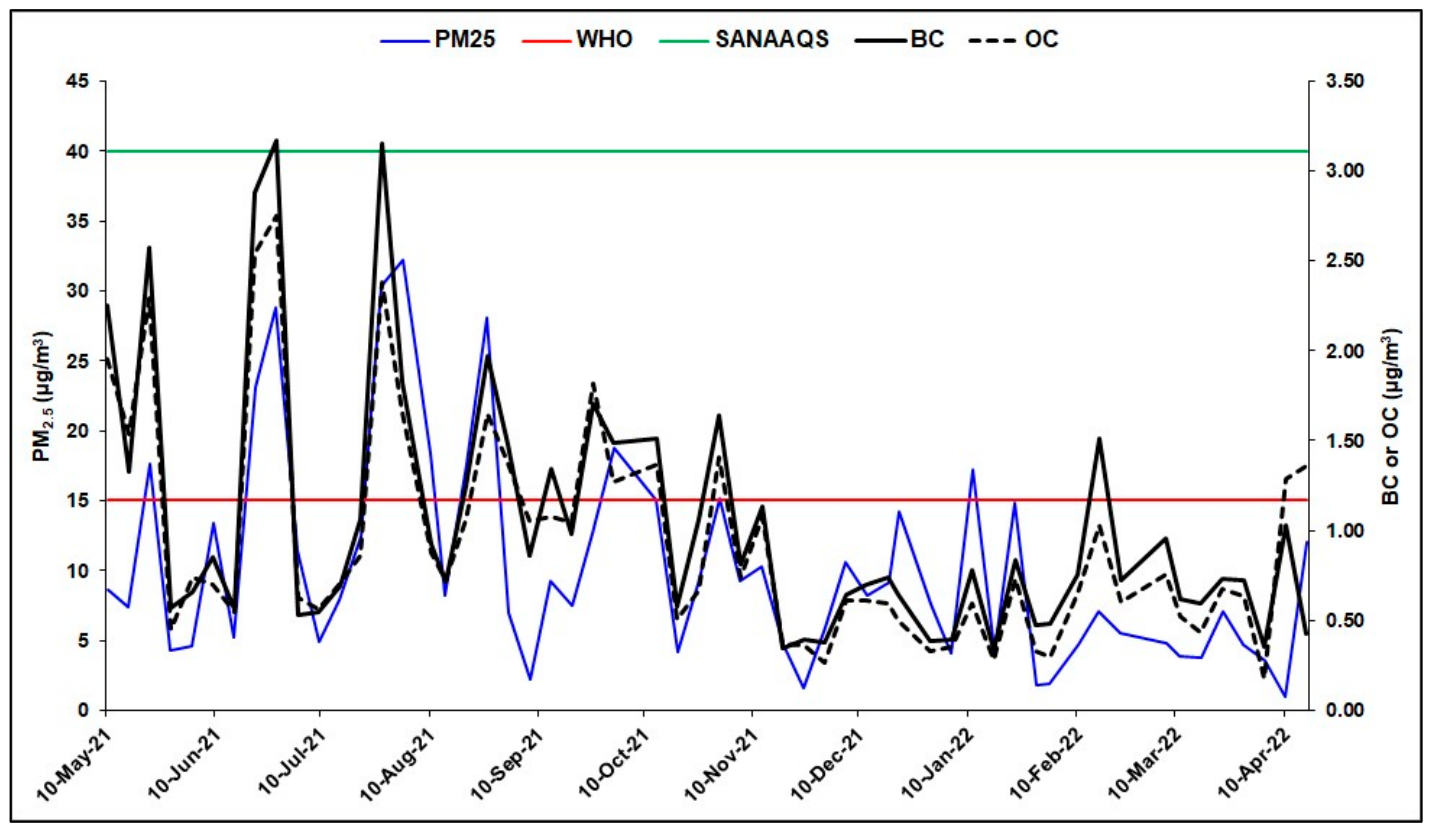
The PM2.5 levels ranged from 0.9 to 32 μg/m3 with an annual average of 10 μg/m3. The daily PM2.5 concentrations exceeded the daily WHO air quality guideline (15 µg/m3) [1] on 13 occasions (Figure 3). The daily South African NAAQS (40 µg/m3) [16] was never exceeded during the study period. The annual average of PM2.5 was twice that of the yearly WHO air quality guideline (5 µg/m3) [1], but lower than the yearly South African NAAQS (20 µg/m−3) [16].
PM2.5 concentrations exhibited clear seasonal variability, with the highest levels observed in winter (13 µg/m3), followed by spring (9.1 µg/m3) and summer (7.4 µg/m3), and the lowest median concentration in autumn (4.7 µg/m3) (p < 0.05) (Figure S8). The daily PM2.5 levels exceeded the daily WHO air quality guidelines on one, two, seven and three occasions during summer, autumn, winter and spring, respectively. The interior of South Africa experiences temperature inversions during autumn and winter, which traps air pollution. Kempton Park is located in a summer rainfall zone. One of the possible sources for higher PM2.5 concentrations in spring is the yearly burning of fields prior to the summer rains [22].
The median PM2.5 levels on weekends (7.0 µg/m3) and weekdays (9.3 µg/m3) did not differ significantly (p > 0.05) (Figure S9), indicating that a clear weekday–weekend contrast was not observed during the sampling period. This lack of temporal variation suggests that PM2.5 concentrations were influenced by multiple sources, as further supported by the PCA results.
In South Africa, studies reported similar mean PM2.5 concentrations in rural Thohoyandou (10 μg/m3, range: 1.1–37.5 μg/m3) [24] and urban Bloemfontein (11 μg/m3, range: 0.5–33 μg/m3) [29]. A study in the small town of Kimberley reported lower concentrations (6.3 μg/m3, range: 0.7–25.4 μg/m3) [26]. Higher concentrations were reported in a residential area in Cape Town (13.4 μg/m3, range: 1.17–39.1 μg/m3) [25,28] and at an urban site in Pretoria (21.1 μg/m3, range: 0.7–66.8 μg/m3) [31]. Several factors could account for this discrepancy, including differences in site location, proximity to pollution sources and local meteorological conditions.
Due to the scarcity of ground-based PM2.5 monitoring across Africa, researchers often depend on models to estimate concentrations. Bachwenkizi et al. [35] used a combination of satellite data, chemical transport model simulations, and limited ground measurements to estimate the PM2.5 levels between 1998 and 2018. Their findings indicated an estimated annual mean of 13 μg/m3 in South Africa, 14 μg/m3 in Angola, and 69 μg/m3 in Nigeria. In Nairobi and Kenya, Gaita et al. [38] reported mean PM2.5 concentrations of 21 μg/m3 at an urban background site and 13 μg/m3 at a suburban location. In Uganda, Kirenga et al. [39] documented outdoor daily PM2.5 concentrations ranging from 0 to 535 μg/m3 in Jinja and Kampala, and from 8 to 384 μg/m3 in industrial areas of Kampala. Similarly, Agbo et al. [10] found that the daily PM2.5 concentrations exceeded the WHO guideline of 15 μg/m3 in the majority of the 22 African cities studied. Exceedances of both the daily and annual WHO air quality guidelines, as well as South Africa’s National Ambient Air Quality Standards (NAAQS), observed in this study suggest that residents of Kempton Park may face elevated health risks due to poor air quality [1,16].

3.3. BC and OC Concentrations

There are limited studies in Africa that have examined ambient concentrations of BC and OC. Soot, produced by the incomplete combustion of fossil fuels or biomass, which consists of chains of elemental carbon (EC) particles mixed with OC compounds. The OC fraction, often referred to as the volatile or solvent-extractable component, may include light-absorbing brown carbon (BrC), which is typically associated with tar-like substances. BC, a subset of carbonaceous aerosols, refers specifically to the light-absorbing component, which is primarily composed of EC. While related, BC and EC are not interchangeable: BC is defined by its optical properties, whereas EC is characterized by its chemical structure [40]. BC is mainly associated with emissions from diesel engines and biomass burning, while OC is derived from a broader range of sources, including vehicle exhaust, industrial activities, and natural (biogenic) emissions [41].
BC levels ranged from 0.3 to 3.2 µg/m3 with an annual average of 1.0 µg/m3. Figure 3 indicates the seasonal variation in BC concentrations. The median BC concentration in spring (1.1 µg/m3) was higher than in autumn (0.7 µg/m3), winter (0.9 µg/m3) and summer (0.7 µg/m3) (p > 0.05) (Figure S8). One of the possible sources for higher BC concentrations in spring may be the yearly burning of fields prior to the summer rains [22]. The median BC concentration on weekdays (0.8 µg/m3) was slightly higher than that on weekends (0.7 µg/m3) (p > 0.05) (Figure S9). The absence of a significant weekday–weekend contrast suggests that the BC levels were not strongly driven by weekday-specific activities. Consistent with the PCA results below, which grouped BC with other combustion-related species (e.g., OC and Zn), BC concentrations likely reflect contributions from multiple combustion sources, rather than traffic emissions alone.
Several South African studies have reported higher median BC concentrations than those observed in this study (0.8 µg/m3). The reported median values include 8 µg/m3 in Thohoyandou [24], 3 µg/m3 in the industrial area of the Vaal Triangle Air Pollution Priority Area [17], 3 µg/m3 in Pretoria [31] and 2 µg/m3 in Cape Town [30]. In contrast, Bloemfontein [29] and Kimberley [26] recorded lower means of 0.3 µg/m3 and 0.6 µg/m3, respectively. Outside South Africa, the mean BC levels were higher in Nairobi, Kenya (3 µg/m3) [38], and extremely elevated in Benin (16 µg/m3), while South Africa had the lowest mean among countries in that comparison (2 µg/m3) [35]. Similarly, elevated mean concentrations were reported in London, UK (2 µg/m3) [42], and the Uzice region of Serbia (33.9 µg/m3) [43]. A broader review, primarily including studies from China, found BC concentrations ranging from 2 to 55 µg/m3 [41]. These differences are likely influenced by factors such as geographical location, proximity to pollution sources, and local meteorological conditions.
The OC level ranged from 0.2 to 2.8 µg/m3 with an annual average of 0.9 µg/m3. Figure 3 shows the seasonal variation in OC concentrations. As with BC, the median OC concentration in spring (1.1 µg/m3) was higher than in autumn (0.7 µg/m3), winter (0.9 µg/m3) and summer (0.6 µg/m3) (p < 0.05) (Figure S8). One of the possible sources for higher OC concentrations in spring may be the yearly burning of fields prior to the summer rains [22]. The median OC levels on weekends (0.7 µg/m3) were significantly lower than on weekdays (1.0 µg/m3) (Figure S9), indicating a measurable temporal contrast. Consistent with the PCA results below, which grouped OC with BC and Zn in a combustion-related component, this pattern suggests variation in combustion sources between weekdays and weekends. However, given the multiple primary and secondary sources of OC, the weekday enhancement cannot be attributed solely to traffic emissions.
The mean OC concentration of this study was lower than those reported in Thohoyandou (1.5 µg/m3) [24] and Pretoria (3.3 µg/m3) [31]. The median concentration reported in Cape Town (3 µg/m3) was higher than in this study [30]. In Kimberley [26] and Bloemfontein [27], the mean OC concentrations were lower, at 0.4 µg/m3 and 0.5 µg/m3, respectively. According to Bachwenkizi et al. [35], mean concentrations of organic particulate matter, comparable to OC, ranged from 2 µg/m3 in South Africa to 13 µg/m3 in Nigeria. A broader review by Bachwenkizi et al. [43], which focused mainly on studies from China, reported a range of 4–60 µg/m3. These variations may be attributed to several factors, including the geographical settings of the monitoring sites, their proximity to local pollution sources, and differing meteorological conditions.

3.4. Trace Element Concentrations

S (360 ng/m3), Si (150 ng/m3), K (76 ng/m3), Ca (54 ng/m3) and Fe (51 ng/m3) had the highest median concentrations of the 17 detected trace elements. Nan et al. [34] summarized the air pollution sources of some of the trace elements observed in PM2.5 samples (Table 1).
As with PM2.5 and OC, the median concentrations of Br, Fe, K, S, Si and Sr showed significant differences across seasons (p < 0.05) (Figure S8). The median Fe concentration was also highest in spring, as with OC. Median concentrations of Br, Si, Sr and K were significantly higher (p < 0.05) in winter (Figure S8). Br and K are tracers for coal burning [34,44,45]. Si may be higher during the colder months due to lack of rain, which may lead to more dusty conditions [34,46]. The median Sr concentrations were highest in winter. Sr is commonly associated with coal burning [34,47]. Wintertime atmospheric stability (frequent inversions and a shallow boundary layer) can enhance the accumulation of Sr-containing particles from these sources. The median S concentrations were higher in spring and summer than in winter and autumn, with peak levels observed in summer. A plausible explanation is that secondary sulfate formation is enhanced during spring and summer [48]. Higher solar radiation and temperatures in these seasons promote photochemical oxidation of SO2 to sulfate, leading to elevated particulate S concentrations [48]. In addition, less stagnant conditions in the warmer months may lead to an influx of sulfate-rich air masses from industrial and power-generation regions around Kempton Park, further increasing the S levels [34,49]. In contrast, winter conditions, although associated with higher PM2.5 mass, tend to favor primary combustion aerosols (e.g., BC, K) rather than secondary sulfate, while autumn often reflects a transition period with reduced photochemical activity and lower regional sulfate influence. No significant differences in the median concentrations were observed for the other 11 trace elements (p > 0.05). As with OC, the median concentration of Ni was highest on weekdays compared to weekends (p < 0.05) (Figure S9). Ni is a known tracer of industrial combustion and fuel–oil-related emissions, including power generation, metal processing and heavy-duty vehicle activity [34,50,51].

3.5. Correlations

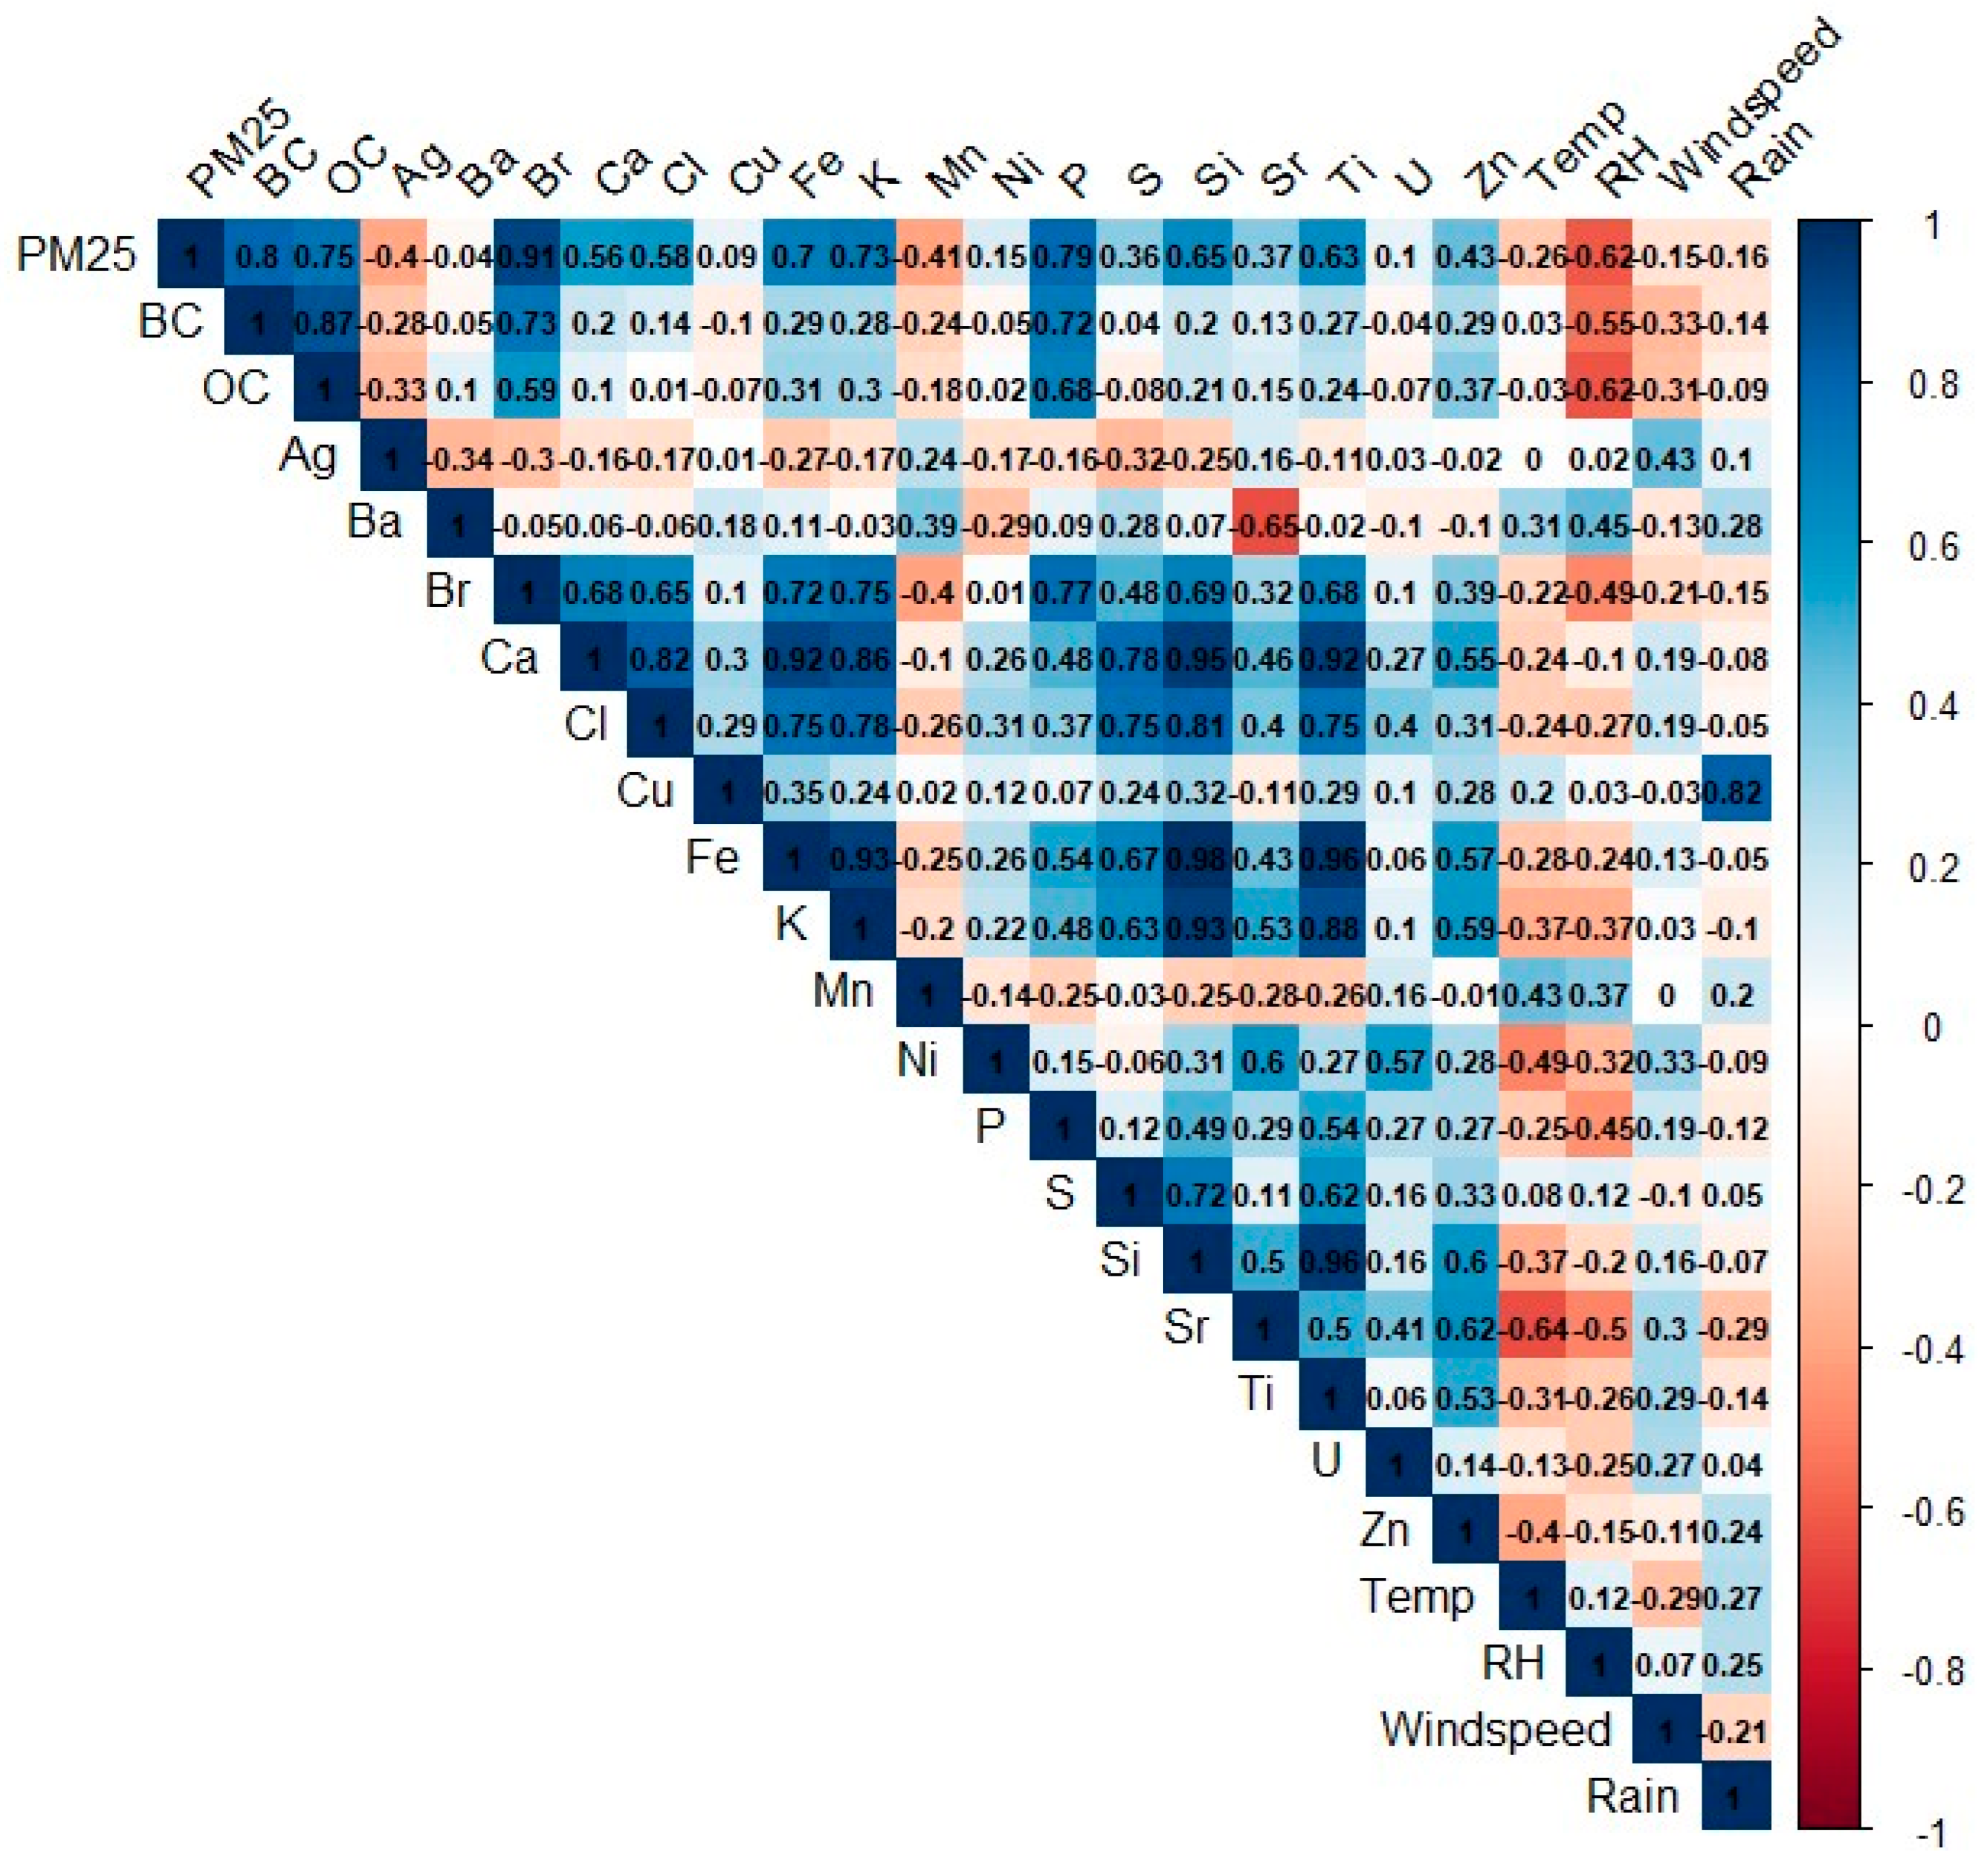
PM2.5, BC and OC were all correlated (p < 0.05) (Figure 4). The strongest correlation (0.87) was observed between BC and OC, which indicate that they share common sources such as coal/fuel burning. PM2.5 had the weakest correlation (0.75) with OC. A large study of 15 African countries reported weaker correlations between estimated PM2.5 and BC concentrations (0.67) and estimated PM2.5 and organic matter PM concentrations (0.65) [35].
Figure 4 indicates the correlations between PM2.5 and the trace elements, of which most were positive and significant (p < 0.05). Between PM2.5 and the trace elements, the strongest correlation was observed with Br (0.91), which indicates that they share similar sources such as coal/biomass burning and traffic exhaust (Table 1) [34,44,52,53]. Among the most abundant trace elements (Ca, Fe, K, S and Si), the strongest correlation was between Fe and Si (0.98), followed by the Ca-Si (0.95), Fe-K (0.93) and K-Si (0.93) combinations, of which all were significant (p < 0.05). Si-Ti (0.96) also had a strong correlation (p < 0.05). Ca, Fe, Si, Ti and K are crustal elements that are present in soil and dust (Table 1) [34,46], which may explain the strong correlations. Other strong correlations were observed between Br-Fe (0.72), Br-K (0.75) and Cl-K (0.78). Br and Fe are emitted at by traffic sources, such as traffic exhaust, brake and tire wear [34,52,53], whilst Br, Cl and K are emitted during coal/biomass burning (Table 1) [34,44,45].
Meteorological conditions can diffuse, dilute, and accumulate air pollution. Nearly all the meteorological variables had negative correlations with PM2.5, BC, OC and trace elements in the study (mostly p > 0.05) (Figure 4). Most concentrations of trace elements decreased as the temperature, RH and rainfall increased (Figure 4). The positive correlation (p < 0.05) between the wind speed and several trace elements, particularly crustal markers (Ca, Ti, Fe, and Si) [34,46], suggests that wind-driven resuspension and the transport of mineral dust substantially influence their ambient concentrations.

3.6. Source Identification Using PCA and EF Analysis

PCA identified multiple components representing distinct source groupings, with the retained components explaining approximately 77.4% of the total variance in the dataset. Although the first two components accounted for a substantial proportion of the variance (35.5%), their relatively diffuse loadings across several species suggest mixed or regional background influences, rather than clearly defined single sources.
More distinct source-related patterns emerged in subsequent components (Table 3). A component characterized by strong loadings of Si, Ca, Fe and Ti reflects crustal material and resuspended soil dust. These elements are typical mineral tracers and are commonly associated with local surface dust and unpaved areas [34,46]. In contrast, another component dominated by Ba is consistent with traffic-related non-exhaust emissions, particularly brake wear [34,53]. A separate component with high Cl loadings points to combustion-related sources, which are likely linked to coal combustion and domestic fuel use [34,45].
Industrial and mining influences were also apparent. A component characterized by elevated Ni suggests contributions from fuel combustion and metallurgical processes [34,50,51], while a distinct U-dominated component reflects regional mining activities [54]. In addition, a component associated with P may indicate biomass burning or agricultural emissions [55]. Moderate loadings of Mn and Ag likely reflect additional industrial or metallurgical contributions [56], although these were interpreted cautiously due to the absence of strongly dominant loadings.
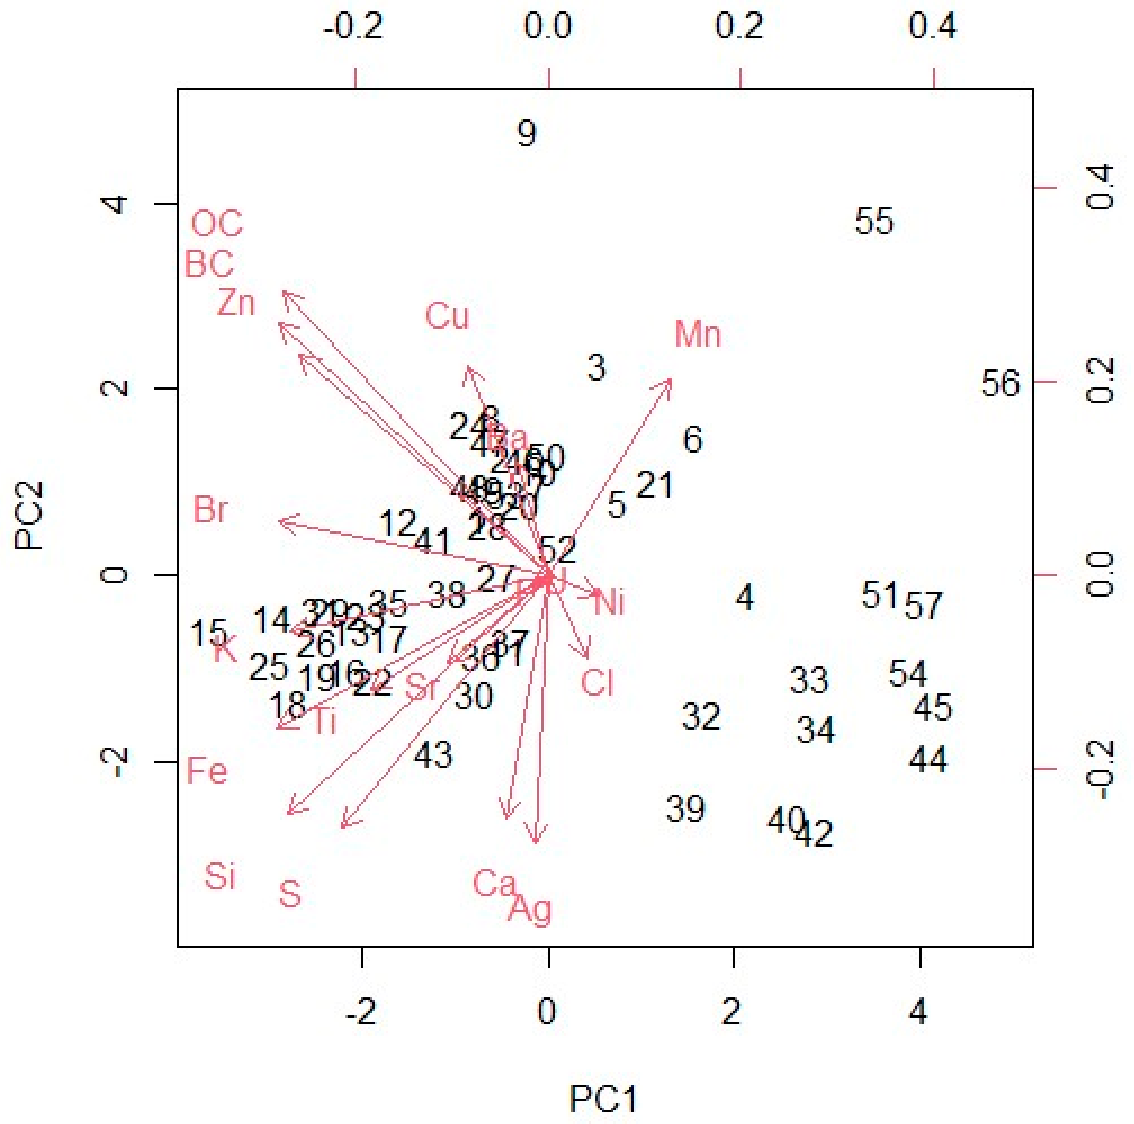
The PCA biplot (Figure 5) further illustrates these relationships. The clear clustering of BC, OC and Zn supports a combustion-related source profile [34,53], while the grouping of Si, Fe and Ti reinforces the importance of crustal inputs [34,46]. The spatial separation of elements such as Ni, Mn and U reflects industrial and mining influences [51,53,54]. A subset of samples (e.g., 44, 45, 51, 54 and 57) deviated from the main cluster, indicating episodic events or periods of stronger influence from specific sources.
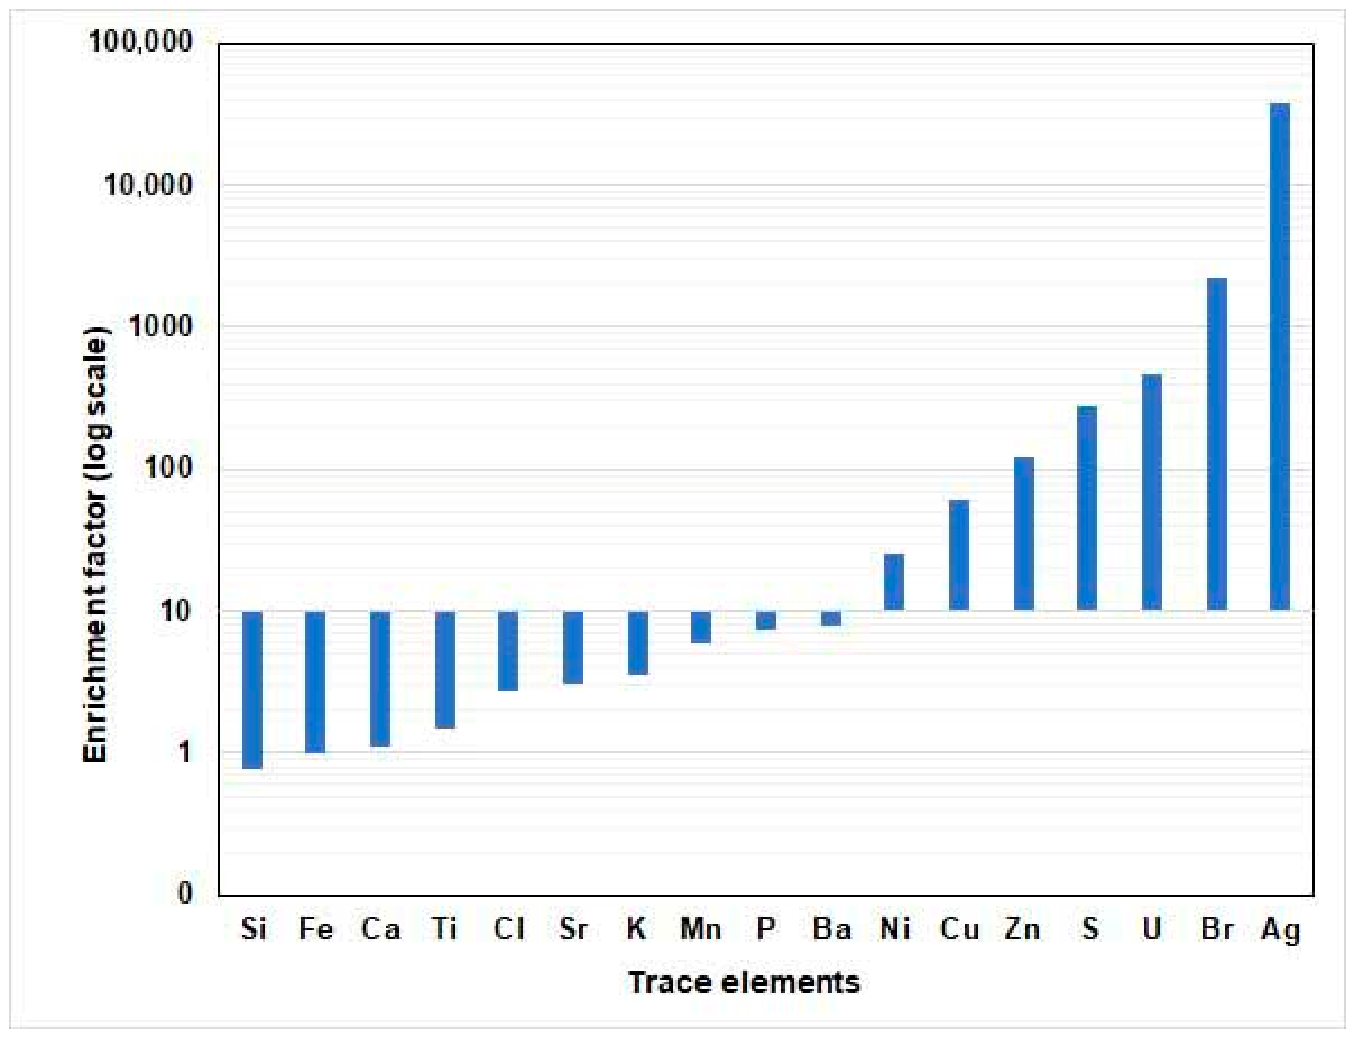
To further distinguish between crustal and anthropogenic origins, EF analysis was applied (Figure 6). The EF results closely aligned with the PCA-derived source groupings and provided independent confirmation of elemental origin. Elements such as Si, Ca, Ti and Sr exhibited EF values that were close to unity (EF < 10), confirming their predominantly crustal nature and association with resuspended soil and dust [34,46]. This is consistent with the semi-urban characteristics of the study area.
In contrast, several elements showed substantial to extreme enrichment. Zn (EF ≈ 120), S (EF ≈ 281), U (EF ≈ 461), Br (EF ≈ 2236) and Ag (EF ≈ 37,540) displayed very high EF values, indicating strong anthropogenic contributions. These elements are commonly linked to coal combustion, vehicular emissions (including brake and tire wear), industrial activities, mining operations and waste burning [34,44,52,53]. Moderately enriched elements such as Ni and Cu suggest mixed contributions from combustion and traffic-related processes [34,50,51,53]. Elements including K, Mn and Ba exhibited low to moderate enrichment, consistent with mixed crustal and combustion-related sources, in agreement with their intermediate PCA loadings.
Taken together, the combined multivariate and enrichment analyses demonstrate that PM2.5 at the study site is influenced by both natural and anthropogenic sources. Crustal dust contributes substantially to the elemental composition, while combustion-related activities—including coal burning, traffic emissions and industrial processes—drive the enrichment of several trace elements. The convergence of PCA groupings and EF classifications strengthens the confidence in the identified source categories, despite the absence of quantitative receptor modeling such as PMF.
From an air quality management perspective, distinguishing between crustal and combustion-related contributions is critical for targeted mitigation within the HPA. These findings provide locally relevant baseline evidence to support the refinement of the HPA AQMP and the development of municipal-level interventions aimed at reducing population exposure to fine particulate pollution.

3.7. Pollutant Concentrations by Geographical Origin of Air Masses and Wind Direction

Building on the source categories identified through PCA and EF analysis, 72 h backward trajectory modeling was applied to evaluate the influence of regional transport pathways on PM2.5 mass and composition. This approach enables an assessment of whether the combustion-, crustal- and mining-related signatures observed at the site are associated with specific upwind source regions.
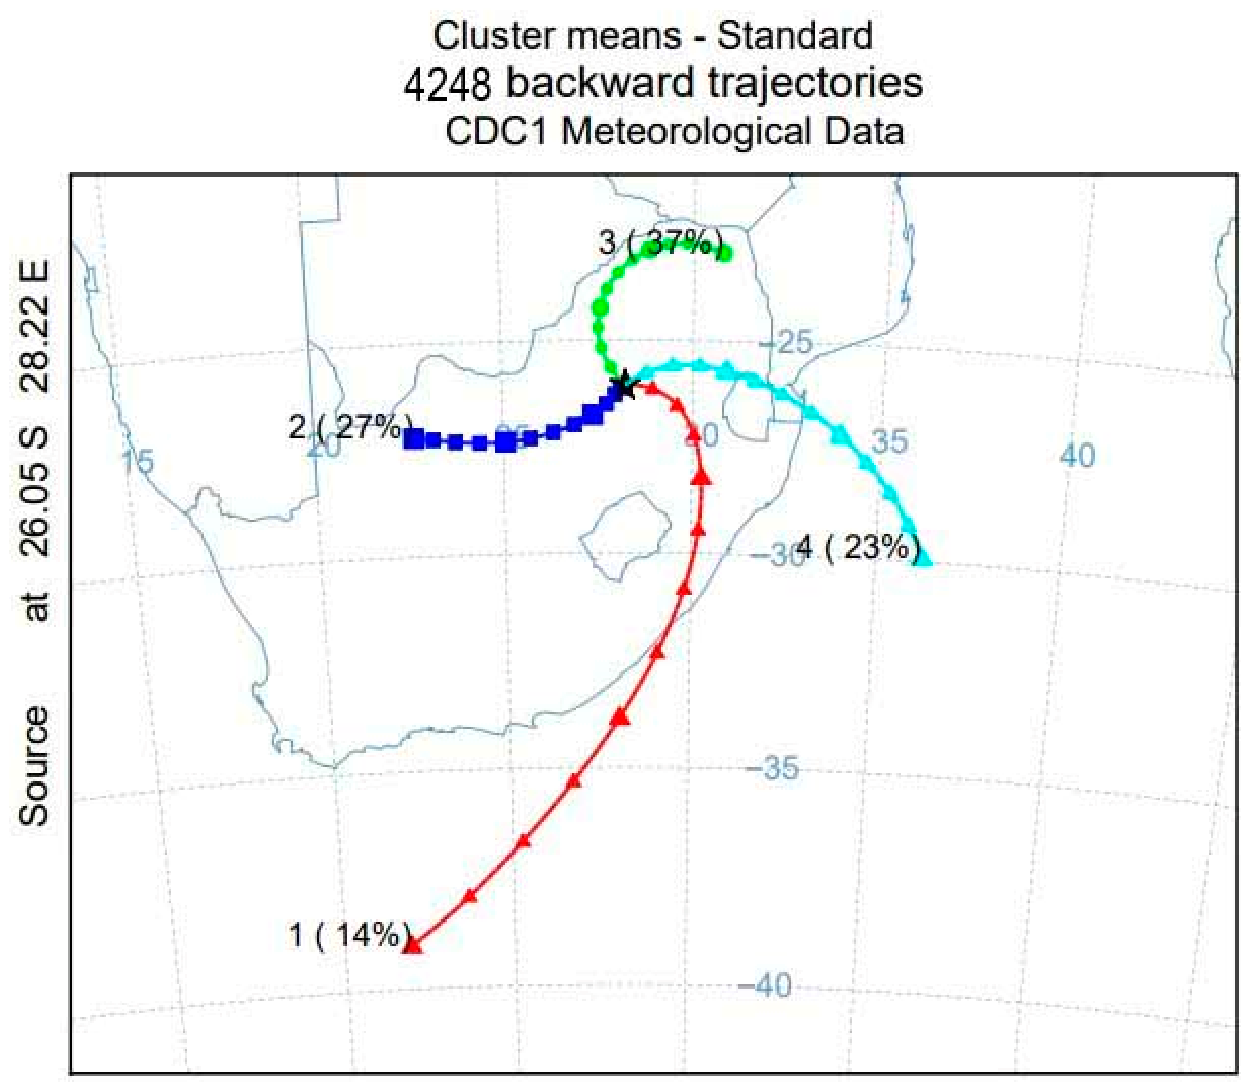
Four geographical origins of air masses were identified (Figure 7). During the 57 sampling days, most of the air masses emanated from the north (Cluster 3, 18 sampling days), followed by those from the west (Cluster 2, 16 sampling days) and east (Cluster 4, 12 sampling days), and the rest were from a more south-easterly direction (Cluster 1, 11 sampling days). The percentages indicated in Figure 7 are based on all days during the study period. These clusters indicate possible distant source areas that may have an influence on the increase in PM2.5 concentrations at the sampling site in Kempton Park. These distant source areas are located in the Northern Cape, North West and Limpopo provinces in South Africa (Clusters 2, 4 and 3). These provinces are well known for their mining activities, which might be the sources of air pollution coming from those areas.
The air mass cluster analysis indicates that the PM2.5 concentrations and chemical composition at the site are strongly influenced by the geographical origins of air masses (Figure S10). Air masses arriving from the west (Cluster 2) were associated with the highest median PM2.5 concentrations (9.7 µg/m−3, range 4.3–32 µg/m−3) and elevated median levels of BC, OC, K, S, Si, Fe and Sr, suggesting a strong influence of regional industrial and mining sources, biomass burning and crustal material. Northern air masses (Cluster 3) passed another critical air pollution hotspot that was declared in 2012: namely, the Waterberg–Bojanala Priority Area [57]. Relatively high median concentrations of PM2.5 (8.7 µg/m−3, range 1.8–28 µg/m−3), Ni, Fe, Si and Sr were observed when air masses originated from the north, pointing to contributions from industrial combustion and mineral dust, which are potentially linked to mining and metallurgical activities. In contrast, air masses from the south-east (Cluster 1) were characterized by the lowest PM2.5 (median 7.5 µg/m−3, range 1.0–12 µg/m−3) and trace element concentrations, likely reflecting cleaner maritime or less industrialized source regions and enhanced atmospheric dispersion. The eastern air masses (Cluster 4) passed over other areas of the HPA, which resulted in intermediate PM2.5 concentrations (median 5.9 µg/m−3, range 0.9–30 µg/m−3), but elevated the median concentrations of S, Zn and crustal elements, suggesting a mix of industrial emissions, secondary aerosol formation and resuspended dust. Of note, median U concentrations varied by air mass origin, with higher levels being associated with western and south-eastern air masses (Clusters 2 and 1), consistent with the influence of gold mining and uranium-bearing mine tailings along these transport pathways. Overall, the results highlight the importance of regional transport and source region characteristics in shaping PM2.5 mass and composition at the site.
Meteorological conditions varied modestly across air mass origin clusters, but showed consistent patterns linked to transport pathways (Figure S11). Air masses arriving from the south-east (Cluster 1) were characterized by higher relative humidity (median 80%) and the highest wind speeds (median 5.5 m/s), consistent with more maritime-influenced flow and enhanced atmospheric mixing. In contrast, western air masses (Cluster 2) were associated with lower relative humidity (median 49%) and moderate wind speeds, reflecting drier continental conditions. Northern air masses (Cluster 3) exhibited the highest median temperatures (18.6 °C) and intermediate humidity and wind speeds, while eastern air masses (Cluster 4) showed comparable temperatures, but were associated with the highest median rainfall totals, indicating a greater influence of moist, precipitation-prone systems. Overall, differences in meteorological variables across air mass clusters were less pronounced than those observed for PM2.5 and chemical composition, suggesting that air mass origin primarily modulates pollutant concentrations through source-region characteristics and transport history, rather than large contrasts in local meteorology.
As with the geographical origin of air masses, the wind direction was mostly from the north (11 days), NNW (9 days) and NW (8 days) (Figure S5). Only K, temperature and RH varied significantly by wind direction (p < 0.05) (Figures S12 and S13). The windspeed was generally also low; mostly 2.2 to 5 m.s−1 with few days over 5 m.s−1, which may also be another reason why the wind direction did not influence the exposure variables (Figure S5).

3.8. Implications for Sustainable Air Quality Management

The findings of this study have important implications for sustainable air quality management in complex urban–industrial environments such as Kempton Park within the EMM and HPA. The study area is characterized by mixed emission sources, including petrochemical, metallurgical, cement and power-generation activities, major transport infrastructure (airport and rail), household fuel combustion, mine tailings and other diffuse sources operating under seasonally variable meteorological conditions that can either suppress or enhance atmospheric dispersion. In such settings, generic mitigation strategies are unlikely to be effective. By distinguishing between crustal, combustion-related, traffic-associated and mining-influenced contributions, the present analysis provides a basis for prioritizing targeted interventions. For example, the identification of highly enriched combustion and industrial tracers highlights the importance of emission controls on coal combustion, industrial boilers and traffic-related sources, while the strong crustal signature underscores the need for dust management and mine tailing rehabilitation. Furthermore, the demonstrated role of regional air mass transport suggests that sustainable air quality improvement requires coordination beyond municipal boundaries. In resource-constrained regions, the integrated use of PCA, EF analysis and trajectory modeling offers a practical and scalable framework to support evidence-based, source-oriented air quality planning aimed at reducing long-term population exposure.

3.9. Applicability to Other Regions and Research Contexts

Although this study was conducted in Kempton Park, the analytical framework is readily transferable to other semi-urban and industrialized regions that are characterized by diverse emission sources and variable meteorology. Many rapidly urbanizing areas in LMIC share similar features, including proximity to industrial complexes, transport corridors, mining activities and informal or domestic fuel combustion. The combination of seasonal atmospheric stability, episodic inversions and regional transport further complicates source attribution in such environments. The integrated approach applied here, combining chemical characterization, PCA, EF and backward trajectory modeling, provides a cost-effective methodology for disentangling local and regional source contributions where detailed emission inventories or advanced receptor modeling may not be available. This framework can therefore support the development or refinement of AQMPs, guide the monitoring network design and serve as a baseline for future health risk assessments or quantitative source apportionment studies in comparable regions.

4. Conclusions

This study characterized PM2.5 mass concentrations and chemical composition in a residential area of Kempton Park in the EMM and also within the industrialized HPA. Although the median PM2.5 levels were generally below the national standards, frequent exceedances of the stricter WHO guidelines indicate persistent risks to public health. Clear seasonal patterns were observed, with higher PM2.5, BC, OC and several trace elements in winter and spring, reflecting enhanced atmospheric stability, biomass burning and primary combustion emissions. Elevated S during warmer months suggests an additional contribution from secondary aerosol formation.
PCA and EF assessment provided complementary evidence for source identification. Crustal elements (Si, Ca, Fe, Ti) were linked to resuspended dust, while the strong enrichment of S, Zn, Br and U indicates substantial contributions from combustion, industrial activities and mining. Moderately enriched elements such as Cu and Ni point to traffic-related and mixed anthropogenic sources. Air mass trajectory analysis further demonstrated the combined influence of local emissions and regional transport, particularly along pathways that are associated with mining and industrial regions.
Although quantitative source apportionment was beyond the scope of this study, the integrated analytical approach provides robust baseline evidence for understanding PM2.5 sources in a complex urban–industrial environment. These findings support the refinement of the EMM AQMP and the HPA AQMP and highlight the need for coordinated regional strategies targeting combustion emissions, dust control and cleaner energy transitions to advance sustainable air quality management and reduce population exposure in the Highveld and similar settings.

Supplementary Materials

The following supporting information can be downloaded at: https://www.mdpi.com/article/10.3390/su18104629/s1. Figure S1: Time-series of PM2.5 concentrations measured in a residential area in Kempton Park, which is located in the Highveld Priority Area, Gauteng province, South Africa (black line) and temperature (blue line) from 10 May 2021 to 22 April 2022. Red line: Daily World Health Organization PM2.5 air quality guideline (15 µg/m3). Green line: Daily South African National Ambient Air Quality Standard PM2.5 (40 µg/m3); Figure S2: Time-series of PM2.5 concentrations measured in a residential area in Kempton Park, which is located in the Highveld Priority Area, Gauteng province, South Africa (black line) and relative humidity (blue line) from 10 May 2021 to 22 April 2022. Red line: Daily World Health Organization PM2.5 air quality guideline (15 µg/m3). Green line: Daily South African National Ambient Air Quality Standard PM2.5 (40 µg/m3); Figure S3: Time-series of PM2.5 concentrations measured in a residential area in Kempton Park, which is located in the Highveld Priority Area, Gauteng province, South Africa (black line) and wind speed (blue line) from 10 May 2021 to 22 April 2022. Red line: Daily World Health Organization PM2.5 air quality guideline (15 µg/m3). Green line: Daily South African National Ambient Air Quality Standard PM2.5 (40 µg/m3); Figure S4: Time-series of PM2.5 concentrations measured in a residential area in Kempton Park, which is located in the Highveld Priority Area, Gauteng province, South Africa (black line) and rainfall (blue bars) from 10 May 2021 to 22 April 2022. Red line: Daily World Health Organization PM2.5 air quality guideline (15 µg/m3). Green line: Daily South African National Ambient Air Quality Standard PM2.5 (40 µg/m3); Figure S5: Wind direction and windspeed (in m/s1) observed over 57 days in Kempton Park, which is located in the Highveld Priority Area, Gauteng province, South Africa, from 10 May 2021 to 22 April 2022; Figure S6: Box-whisker plots of 24-h PM2.5, BC, OC and trace elemental concentrations in a residential area in Kempton Park, which is located in the Highveld Priority Area, Gauteng province, South Africa, from 10 May 2021 to 22 April 2022; Figure S7: Box-whisker plots of weather variables in Kempton Park, which is located in the Highveld Priority Area, Gauteng province, South Africa from 10 May 2021 to 22 April 2022. By season: summer (1), autumn (2), winter (3), and spring (4). p > 0.05 for all meteorological variables; Figure S8: Box-whisker plots of PM2.5, BC, OC and trace element concentrations measured in a residential area in Kempton Park, which is located in the Highveld Priority Area, Gauteng province, South Africa, from 10 May 2021 to 22 April 2022. By season: summer (1), autumn (2), winter (3), and spring (4). p < 0.05 for PM2.5, OC, Br, Fe, K, S, Si and Sr; Figure S9: Box-whisker plots of PM2.5, BC, OC and trace element concentrations in a residential area in Kempton Park, which is located in the Highveld Priority Area, Gauteng province, South Africa, from 10 May 2021 to 22 April 2022. By weekend/weekday: weekday (0) and weekend (1). p < 0.05 for OC and Ni; Figure S10: Box-whisker plots of 24-h PM2.5, BC, OC and trace elemental concentrations in a residential area in Kempton Park, which is located in the Highveld Priority Area, Gauteng province, South Africa, from 10 May 2021 to 22 April 2022, by the geographical origin of air masses. During the 57 sampling days, most of the air masses emanated from the north (cluster 3, on 18 sampling days), followed by those from the west (cluster 2, 16 sampling days) and east (cluster 4, 12 sampling days) and the rest from a more south-easterly direction (cluster 1, 11 sampling days). p < 0.05 for Ca and Ni; Figure S11: Box-whisker plots of weather variables in Kempton Park, which is located in the Highveld Priority Area, Gauteng province, South Africa, from 10 May 2021 to 22 April 2022, by geographical origin of air masses. During the 57 sampling days, most of the air masses emanated from the north (cluster 3, on 18 sampling days), followed by those from the west (cluster 2, 16 sampling days) and east (cluster 4, 12 sampling days), and the rest from a more south-easterly direction (cluster 1, 11 sampling days). p < 0.05 for relative humidity; Figure S12: Box-whisker plots of 24-h PM2.5, BC, OC and trace elemental concentrations in a residential area in Kempton Park, which is located in the Highveld Priority Area, Gauteng province, South Africa, from 10 May 2021 to 22 April 2022, by wind direction. White box: Missing values for wind direction. p < 0.05 for K; Figure S13: Box-whisker plots of weather variables in a residential area in Kempton Park, which is located in the Highveld Priority Area, Gauteng province, South Africa, from 10 May 2021 to 22 April 2022, by wind direction. White box: Missing values for wind direction. p < 0.05 for temperature and relative humidity.

Author Contributions

K.H.: Conceptualization, Methodology, Writing—review and editing. A.A.: Conceptualization, Data curation, Methodology, Writing—review and editing. P.M.: Conceptualization, Data curation, Methodology, Resources, Writing—review and editing. J.B.: Conceptualization, Data curation, Formal analysis, Methodology, Resources, Writing—review and editing. J.W.: Conceptualization, Data curation, Formal analysis, Funding acquisition, Investigation, Methodology, Project administration, Resources, Writing—original draft, Writing—review and editing. All authors have read and agreed to the published version of the manuscript.

Funding

The authors express gratitude towards the University of Pretoria for funding.

Institutional Review Board Statement

Not applicable.

Informed Consent Statement

Not applicable.

Data Availability Statement

The data presented in this study are available on request from the corresponding author.

Acknowledgments

The authors express gratitude towards the University of Pretoria for funding and the South African Weather Services for the meteorology data.

Conflicts of Interest

The authors declare no conflict of interest.

References

  1. World Health Organization. WHO Global Air Quality Guidelines: Particulate Matter (PM2.5 and PM10), Ozone, Nitrogen Dioxide, Sulfur Dioxide and Carbon Monoxide; WHO Regional Office for Europe: Copenhagen, Denmark. Available online: https://www.who.int/publications/i/item/9789240034228 (accessed on 15 April 2026).
  2. GBD 2021 Risk Factors Collaborators. Global burden and strength of evidence for 88 risk factors in 204 countries and 811 subnational locations, 1990–2021: A systematic analysis for the Global Burden of Disease Study 2021. Lancet 2024, 403, 2162–2203. [Google Scholar] [CrossRef] [PubMed]
  3. Health Effects Institute. State of Global Air 2024; Special Report; Health Effects Institute: Boston, MA, USA, 2024; Available online: https://www.stateofglobalair.org/sites/default/files/documents/2024-06/soga-2024-report_0.pdf (accessed on 21 November 2025).
  4. Green, H.; Bailey, J.; Schwarz, L.; Vanos, J.; Ebi, K.; Benmarhnia, T. Impact of heat on mortality and morbidity in low and middle income countries: A review of the epidemiological evidence and considerations for future research. Environ. Res. 2019, 171, 80–91. [Google Scholar] [CrossRef]
  5. Safo-Adu, G.; Attiogbe, F.; Emahi, I.; Ofosu, F.G. Outdoor and indoor particle air pollution and its health consequences in African cities: New evidence and an exhortation. Sustain. Environ. 2023, 9, 2265729. [Google Scholar] [CrossRef]
  6. United Nations. Department of Economic and Social Affairs: Sustainable Development. Sustainable Development Goals. 2015. Available online: https://sdgs.un.org/goals (accessed on 15 April 2026).
  7. Mathew, N.; Somanathan, A.; Tirpude, A.; Arfin, T. The impact of short-lived climate pollutants on human health. Environ. Pollut. Manag. 2024, 1, 1–14. [Google Scholar] [CrossRef]
  8. Climate and Clean Air Coalition Supporting National Action & Planning (SNAP). Guidance Document: National Planning for reducing short-lived climate pollutants (SNAP). Available online: https://www.ccacoalition.org/resources/guidance-document-national-planning-reducing-short-lived-climate-pollutants-snap (accessed on 15 April 2026).
  9. Katoto, P.D.M.C.; Byamungu, L.; Brand, A.S.; Mokaya, J.; Strijdom, H.; Goswami, N.; De Boever, P.; Nawrot, T.S.; Nemery, B. Ambient air pollution and health in Sub-Saharan Africa: Current evidence, perspectives and a call to action. Environ. Res. 2019, 173, 174–188. [Google Scholar] [CrossRef] [PubMed]
  10. Agbo, K.E.; Walgraeve, C.; Eze, J.E.; Ugwoke, P.E.; Ukoha, P.O.; Van Langenhoven, H. A review on ambient and indoor air pollution status in Africa. Atmos. Pollut. Res. 2021, 12, 243–260. [Google Scholar] [CrossRef]
  11. Jia, N.; Li, Y.; Chen, R.; Yang, H. A review of global PM2.5 exposure research trends from 1992 to 2022. Sustainability 2023, 15, 10509. [Google Scholar] [CrossRef]
  12. Lolli, S. Urban PM2.5 concentration monitoring: A review of recent advances in ground-based, satellite, model, and machine learning integration. Urban Clim. 2025, 63, 102566. [Google Scholar] [CrossRef]
  13. World Health Organization. Overview of Methods to Assess Population Exposure to Ambient Air Pollution; World Health Organization: Geneva, Switzerland, 2023; Available online: https://www.who.int/publications/i/item/9789240073494 (accessed on 21 November 2025).
  14. United Nations Environment Programme. Actions on Air Quality: A Global Summary of Policies and Programmes to Reduce Air Pollution. Nairobi, Kenya. 2021. Available online: https://www.unep.org/resources/report/actions-air-quality-global-summary-policies-and-programmes-reduce-air-pollution (accessed on 21 November 2025).
  15. Department of Fisheries, Forestry and the Environment (2022) State of Air Report 2022 and AQM Highlights. Available online: https://soer.environment.gov.za/soer/UploadLibraryImages/UploadDocuments/180123115927_National%20air%20quality%20officer%20report%20october%202022.pdf (accessed on 28 January 2026).
  16. Department of Fisheries, Forestry and the Environment. National Environmental Management: Air Quality Act: National Ambient Air Quality Standard for Particulate Matter with Aerodynamic Diameter Less Than 2.5 Micron Metres (PM2.5). 2012. Available online: https://www.gov.za/documents/national-environmental-management-air-quality-act-national-ambient-air-quality-standard-0#:~:text=National%20Environmental%20Management%3A%20Air%20Quality%20Act%3A%20National%20ambient,diameter%20less%20than%202.5%20micron%20metres%20%28PM%202.5%29 (accessed on 28 January 2026).
  17. Mwase, N.; Olutola, B.; Wichmann, J. Temperature modifies the association between air pollution and respiratory disease hospital admissions in an industrial area of South Africa: The Vaal Triangle Air Pollution Priority Area. Clean Air J. 2022, 32, 1–15. [Google Scholar] [CrossRef]
  18. Department of Fisheries, Forestry and the Environment. Highveld Priority Area Declared. Available online: https://www.gov.za/sites/default/files/gcis_document/201409/30518.pdf (accessed on 23 November 2007).
  19. Department of Fisheries, Forestry and the Environment. Air Quality Management Plan for the Highveld Priority Area. Available online: https://www.gov.za/sites/default/files/gcis_document/202503/52387-rg11821-gen6040.pdf (accessed on 2 March 2025).
  20. Department of Fisheries, Forestry and the Environment. Air Quality Management Plan for the Highveld Priority Area. 2012. Available online: https://www.gov.za/sites/default/files/gcis_document/201409/35072144.pdf (accessed on 28 January 2026).
  21. Department of Fisheries, Forestry and the Environment. National Environmental Management: Air Quality Act. 2005. Available online: https://www.gov.za/documents/national-environment-management-air-quality-act (accessed on 28 January 2026).
  22. Department of Fisheries, Forestry and the Environment. Air Quality Management Plan for the Ekurhuleni Metropolitan Municipality. 2005. Available online: https://www.ekurhuleni.gov.za/wp-content/uploads/2022/05/env_air_quality_managment_plan_2005.pdf (accessed on 15 April 2026).
  23. Department of Fisheries, Forestry and the Environment. Air Quality Management Plan for the Ekurhuleni Metropolitan Municipality. 2020. Available online: https://www.ekurhuleni.gov.za/public-notices/review-of-city-of-ekurhuleni-air-quality-management-plan-aqmp-invitation-to-webinar (accessed on 15 April 2026).
  24. Novela, R.J.; Gitari, W.M.; Chikoore, H.; Molnar, P.; Mudzielwana, R.; Wichmann, J. Chemical characterization of fine particulate matter, source apportionment and long-range transport clusters in Thohoyandou, South Africa. Clean Air J. 2020, 30, 1–12. [Google Scholar] [CrossRef]
  25. Williams, J.; Petrik, L.; Wichmann, J. PM2.5 chemical composition and geographical origin of air masses in Cape Town, South Africa. Air Qual. Atmos. Health 2021, 14, 431–442. [Google Scholar] [CrossRef]
  26. Becker, D.; Alfeus, A.; Molnár, P.; Boman, J.; Wichmann, J. Ambient PM2.5, soot, black carbon and organic carbon levels in Kimberley, South Africa. Clean Air J. 2024, 34, 1–10. [Google Scholar] [CrossRef]
  27. UK Government. Monitoring Ambient Air: Monitoring Strategy. Available online: https://www.gov.uk/guidance/monitoring-ambient-air-monitoring-strategy (accessed on 9 April 2026).
  28. Nevada Division of Environmental Protection. General Air Sampling Guidelines; NDEP: Carson City, NV, USA. Available online: https://ndep.nv.gov/uploads/env-brownfields-qaplans-docs/SOP_General_Air_Sampling_Guidelines_ERT.pdf (accessed on 9 April 2026).
  29. van der Westhuizen, D.; Howlett-Downing, C.; Molnar, P.; Boman, J.; Wichmann, J.; von Eschwege, K.G. Source apportionment of fine atmospheric particles in Bloemfontein, South Africa, using positive matrix factorization. Environ. Monit. Assess. 2024, 196, 188. [Google Scholar] [CrossRef]
  30. Alfeus, A.; Molnar, P.; Boman, J.; Wichmann, J. PM2.5 in Cape Town, South Africa: Chemical characterization and source apportionment using dispersion-normalised positive matrix factorization. Atmos. Pollut. Res. 2024, 15, 102025. [Google Scholar] [CrossRef]
  31. Adeyemi, A.; Molnar, P.; Boman, J.; Wichmann, J. Particulate matter (PM2.5) characterization, air quality level and origin of air masses in an urban background in Pretoria. Arch. Environ. Contam. Toxicol. 2022, 83, 77–94. [Google Scholar] [CrossRef] [PubMed]
  32. Barbieri, M. The importance of enrichment factor (EF) and Geoaccumulation Index (Igeo) to evaluate soil contamination. J. Geol. Geophys. 2016, 5, 1–4. [Google Scholar] [CrossRef]
  33. Wedepohl, K.H. The composition of the continental crust. Geochim. Cosmochim. Acta 1995, 59, 1217–1232. [Google Scholar] [CrossRef]
  34. Nan, N.; Yan, Z.; Zhang, Y.; Chen, R.; Qin, G.; Sang, N. Overview of PM2.5 and health outcomes: Focusing on components, sources, and pollutant mixture co-exposure. Chemosphere 2023, 323, 138181. [Google Scholar] [CrossRef]
  35. Bachwenkizi, J.; Liu, C.; Meng, X.; Zhang, L.; Wang, W.; van Donkelaar, A.; Martin, R.V.; Hammer, M.S.; Chen, R.; Kan, H. Fine particulate matter constituents and infant mortality in Africa: A multicountry study. Environ. Int. 2021, 156, 106739. [Google Scholar] [CrossRef] [PubMed]
  36. Stein, A.F.; Draxler, R.R.; Rolph, G.D.; Stunder, B.J.B.; Cohen, M.D.; Ngan, F. NOAA’s HYSPLIT atmospheric transport and dispersion modeling system. Bull. Am. Meteorol. Soc. 2015, 96, 2059–2077. [Google Scholar] [CrossRef]
  37. Department of Fisheries, Forestry and the Environment. City of Johannesburg Air Quality Management Plan. 2017. Available online: https://joburg.org.za/documents_/Documents/By-Laws/Draft%20CoJ%20AQMP%202017.pdf (accessed on 28 January 2026).
  38. Gaita, S.M.; Boman, J.; Gatari, M.J.; Pettersson, J.B.C.; Janhäll, S. Source apportionment and seasonal variation of PM2.5 in a sub-Saharan African city: Nairobi, Kenya. Atmos. Chem. Phys. 2014, 14, 9565–9601. [Google Scholar] [CrossRef]
  39. Kirenga, B.J.; Meng, Q.; van Gemert, F.; Aanyu-Tukamuhebwa, H.; Chavannes, N.; Katamba, A.; Obai, G.; Van Der Molen, T.; Schwander, S.; Mohsenin, V. The state of ambient air quality in two Ugandan cities: A pilot cross-sectional spatial assessment. Int. J. Environ. Res. Public Health 2015, 12, 8075–8091. [Google Scholar] [CrossRef] [PubMed]
  40. Watson, J.G.; Chow, J.C.; Chen, L.-W.A. Summary of organic and elemental carbon/black carbon analysis methods and intercomparisons. Aerosol Air Qual. Res. 2005, 5, 65–102. [Google Scholar] [CrossRef]
  41. Bachwenkizi, J.; Shabani, S.; Nyarubeli, I.P.; Mamuya, S. Chemical concentrations, source emission, potential toxicity, and health risk of ambient fine particulate matter and its constituents: A recent literature review. Curr. Pollut. Rep. 2025, 11, 2. [Google Scholar] [CrossRef]
  42. Samoli, E.; Atkinson, R.W.; Analitis, A.; Fuller, G.W.; Green, D.C.; Mudway, I.; Anderson, H.R.; Kelly, F.J. Associations of short-term exposure to traffic-related air pollution with cardiovascular and respiratory hospital admissions in London, UK. Occup. Environ. Med. 2016, 73, 300–307. [Google Scholar] [CrossRef]
  43. Tomic-Spiric, V.; Kovacevic, G.; Marinkovic, J.; Janković, J.; Ćirković, A.; Đerić, A.M.; Relić, N.; Janković, S. Evaluation of the impact of black carbon on the worsening of allergic respiratory diseases in western Serbia: A time-stratified case-crossover study. Medicina 2019, 55, 261. [Google Scholar] [CrossRef]
  44. Lanzerstorfer, C. Pre-processing of coal combustion fly ash by classification for enrichment of rare earth elements. Energy Rep. 2018, 4, 660–663. [Google Scholar] [CrossRef]
  45. Zhang, S.; Tong, D.Q.; Dan, M.; Pang, X.; Chen, W.; Zhang, X.; Zhao, H.; Wang, Y.; Shang, B. Chemical composition and source apportionment of wintertime airborne PM2.5 in Changchun, Northeastern China. Int. J. Environ. Res. Public Health 2021, 18, 4354. [Google Scholar] [CrossRef]
  46. Lai, A.; Lee, M.; Carter, E.; Chan, Q.; Elliott, P.; Ezzati, M.; Kelly, F.; Yan, L.; Wu, Y.; Yang, X.; et al. Chemical investigation of household solid fuel use and outdoor air pollution contributions to personal PM2.5 exposures. Environ. Sci. Technol. 2021, 55, 15969–15979. [Google Scholar] [CrossRef] [PubMed]
  47. Oboirien, B.O.; Thulari, V.; North, B.C. Enrichment of trace elements in bottom ash from coal oxy-combustion: Effect of coal types. Appl. Energy 2016, 177, 81–86. [Google Scholar] [CrossRef]
  48. Rubin, H.J.; Yang, C.-E.; Hoffman, F.M.; Fu, J.S. Projected global sulfur deposition with climate intervention. Glob. Environ. Change Adv. 2024, 3, 100011. [Google Scholar] [CrossRef]
  49. Lee, P.K.H.; Brook, J.R.; Dabek-Zlotorzynska, E.; Mabury, S.A. Identification of the major sources contributing to PM2.5 observed in Toronto. Environ. Sci. Technol. 2003, 37, 4831–4840. [Google Scholar] [CrossRef]
  50. Scerri, M.M.; Kandler, K.; Weinbruch, S.; Yubero, E.; Galindo, N.; Prati, P.; Caponi, L.; Massabò, D. Estimation of the contributions of the sources driving PM2.5 levels in a central Mediterranean coastal town. Chemosphere 2018, 211, 465–481. [Google Scholar] [CrossRef] [PubMed]
  51. Proshad, R.; Uddin, M.; Idris, A.M.; Al, M.A. Receptor model-oriented sources and risk evaluation of metals in sediments of an industrially affected riverine system in Bangladesh. Sci. Total Environ. 2022, 838, 156029. [Google Scholar] [CrossRef] [PubMed]
  52. Bukowiecki, N.; Hill, M.; Gehrig, R.; Zwicky, C.N.; Lienemann, P.; Hegedüs, F.; Falkenberg, G.; Weingartner, E.; Baltensperger, U. Trace metals in ambient air: Hourly size-segregated mass concentrations determined by synchrotron-XRF. Environ. Sci. Technol. 2005, 39, 5754–5762. [Google Scholar] [CrossRef]
  53. Jain, S.; Sharma, S.K.; Vijayan, N.; Mandal, T.K. Investigating seasonal variability in source contribution to PM2.5 and PM10 using different receptor models during 2013–2016 in Delhi, India. Environ. Sci. Pollut. Res. 2021, 28, 4660–4675. [Google Scholar] [CrossRef]
  54. Geng, T.; Péron, O.; Mangeret, A.; Montavon, G.; Gourgiotis, A. Tracing the impact of former uranium mine sites using stable Pb isotopes: A review. J. Environ. Radioact. 2024, 280, 107547. [Google Scholar] [CrossRef]
  55. Li, J.; Pósfai, M.; Hobbs, P.V.; Buseck, P.R. Individual aerosol particles from biomass burning in southern Africa: 2. Compositions and aging of inorganic particles. J. Geophys. Res. 2003, 108, 8484. [Google Scholar] [CrossRef]
  56. Petitjean, Q.; Choulet, F.; Walter-Simonnet, A.-V.; Mariet, A.-L.; Laurent, H.; Rosenthal, P.; de Vaufleury, A.; Gimbert, F. Origin, fate and ecotoxicity of manganese from legacy metallurgical wastes. Chemosphere 2021, 277, 130337. [Google Scholar] [CrossRef]
  57. Department of Fisheries, Forestry and the Environment. Notice 495 of 2012. Department of Environmental Affairs. National Environmental Management: Air Quality Act, 2004 (Act No. 39 Of 2004) Declaration of The Waterberg National Priority Area. 2012. Available online: https://www.gov.za/sites/default/files/gcis_document/201409/35435gen495a.pdf (accessed on 28 January 2026).
Figure 1. Ekurhuleni Metropolitan Municipality is located in the air pollution hotspot Highveld Priority Area (Modified from [19,20]).
Sustainability 18 04629 g001
Figure 2. PM2.5 filter sampling site in a residential area in Kempton Park, which is located in the Ekurhuleni Metropolitan Municipality and the Highveld Priority Area, Gauteng province, South Africa. Map source: Google maps.
Sustainability 18 04629 g002aSustainability 18 04629 g002b
Figure 3. Time-series of daily PM2.5, BC and OC concentrations from 10 May 2021 to 22 April 2022 in a residential area in Kempton Park, which is located in the Highveld Priority Area, Gauteng province, South Africa. Red line: Daily World Health Organization PM2.5 air quality guideline (15 µg/m3). Green line: Daily South African National Ambient Air Quality Standard PM2.5 (40 µg/m3).
Sustainability 18 04629 g003
Figure 4. Correlation between 24 h PM2.5, BC, OC, trace element concentrations and meteorological variables on 57 sampling days from 10 May 2021 to 22 April 2022 in a residential area in Kempton Park, which is located in the Highveld Priority Area, Gauteng province, South Africa.
Sustainability 18 04629 g004
Figure 5. PCA biplot of detected trace elements and carbonaceous species in PM2.5 filter samples collected during the study period from 10 May 2021 to 22 April 2022 in a residential area in Kempton Park, which is located in the Highveld Priority Area, Gauteng province, South Africa.
Sustainability 18 04629 g005
Figure 6. Enrichment factors of the detected trace elements in PM2.5 filter samples collected during the study period from 10 May 2021 to 22 April 2022 in a residential area in Kempton Park, which is located in the Highveld Priority Area, Gauteng province, South Africa.
Sustainability 18 04629 g006
Figure 7. Four clusters of geographical origin of air masses identified in the 72 h backward trajectory model runs on all days during the study period from 10 May 2021 to 22 April 2022 in a residential area in Kempton Park, which is located in the Highveld Priority Area, Gauteng province, South Africa.
Sustainability 18 04629 g007
Table 1. Trace elements detected in PM2.5 filter samples from 10 May 2021 to 22 April 2022 in a residential area in Kempton Park, which is located in the Highveld Priority Area, Gauteng province, South Africa and their likely sources [34].
ElementLikely Sources
BaCoal burning. Brake wear. Tire wear. Firework discharge.
BrCoal/biomass burning. Traffic exhaust. Coal-fired thermal power plants. Metal working industries.
CaCrustal elements. Ocean spray (coastal areas).
ClCoal/biomass burning. Ocean spray (coastal areas).
CuFuel burning. Traffic exhaust. Brake wear. Tire wear. Coal-fired thermal power plants. Metal working industries.
FeBrake wear. Tire wear. Crustal elements.
KFuel burning. Coal/biomass burning. Soil dust. Ocean spray (coastal areas).
MnFuel burning. Traffic exhaust. Coal/biomass burning. Crustal element.
NiFuel burning. Traffic exhaust. Coal/biomass burning. Industrial emissions, agricultural activities.
SCoal burning. Secondary sulfate formation.
SiCrustal elements.
SrFuel burning. Traffic exhaust. Coal/biomass burning.
TiCrustal elements.
ZnFuel burning. Traffic exhaust. Brake wear. Tire wear. Industrial emissions. Coal-fired thermal power plants. Metal working industries.
Table 2. Descriptive statistics of 24 h levels of PM2.5, black carbon, organic carbon, trace elements and meteorological conditions from 10 May 2021 to 22 April 2022 (57 days) in a residential area in Kempton Park, which is located in the Highveld Priority Area, Gauteng province, South Africa.
VariablesMeanStd DevMedianMinMax
PM2.5107.57.90.932
BC1.00.70.80.33.2
OC0.90.60.70.22.8
Ag6.74.26.80.316
Ba128.0110.435
Br5.76.43.51.139
Ca7981540.0330
Cl3.34.32.40.028
Cu3.84.02.50.116
Fe7799510.4630
K160240760.41200
Mn116.9120.026
Ni3.62.92.70.215
P14277.40.0180
S5004603600.31800
Si2703801552.72300
Sr2.61.82.50.17.6
Ti15207.60.9110
U2.01.42.10.17.7
Zn20368.80.1190
Temperature15.94.416.27.723.3
Relative humidity60.721.063.514.496.5
Rainfall2.16.20.00.038.8
Wind speed4.31.53.92.29.9
Units: PM2.5, BC and OC (μg/m3), trace elements (ng/m3), temperature (°C), relative humidity (%), wind speed (m/s), and rainfall (mm). Number of values below detection limit was set as missing: Ag (3), Ba (1), Br (15), Cu (12), Mn (24), U (4), and Zn (9). Meteorological variables have 2 missing values each.
Table 3. PCA loadings for selected components.
SpeciesPC3
(Traffic)
PC4
(Industrial)
PC5
(Combustion)
PC6
(Mining)
PC7
(Industrial)
PC8
(Biomass)
Ba−0.55
Mn 0.49
Ag 0.48
Cl 0.65
U 0.420.56
Ni −0.63
P 0.67
Only loadings ≥ |0.5| are considered significant and are shown in bold. Components were interpreted based on dominant contributing species.
Disclaimer/Publisher’s Note: The statements, opinions and data contained in all publications are solely those of the individual author(s) and contributor(s) and not of MDPI and/or the editor(s). MDPI and/or the editor(s) disclaim responsibility for any injury to people or property resulting from any ideas, methods, instructions or products referred to in the content.