Article

An AI-Blockchain-Integrated Real Options Framework for Sustainable Infrastructure Investment: Aligning Profitability with ESG and UN SDGs


1
Humanitas College, Kyung Hee University, Yongin-si 17104, Republic of Korea
2
Department of Environmental Science and Engineering, Kyung Hee University, Yongin-si 17104, Republic of Korea
3
Department of Architectural Engineering, Kyung Hee University, Yongin-si 17104, Republic of Korea
*
Authors to whom correspondence should be addressed.
Sustainability 2026, 18(10), 4631; https://doi.org/10.3390/su18104631
Submission received: 26 February 2026 / Revised: 28 April 2026 / Accepted: 30 April 2026 / Published: 7 May 2026
(This article belongs to the Section Economic and Business Aspects of Sustainability)

Abstract

The transition toward carbon-neutral cities and sustainable infrastructure requires massive capital mobilization, yet traditional static valuation models like discounted cash flow (DCF) systematically undervalue green projects due to high initial capital expenditures and long-term uncertainty. To address this critical gap in sustainable finance, this study proposes a novel Artificial Intelligence–Blockchain–Multiple Real Options (AI-MRO) integrated framework. This model aligns infrastructure profitability with Environmental, Social, and Governance (ESG) criteria and United Nations Sustainable Development Goals (SDGs), specifically SDG 11 (Sustainable Cities), SDG 13 (Climate Action), and SDG 9 (Industry, Innovation, and Infrastructure). The core approach integrates AI-based probabilistic forecasting for carbon footprint optimization and cash flow prediction, MRO-based operational flexibility assessment, and blockchain-based smart contracts (Security Token Offerings, STOs) to ensure transparent green finance governance and social inclusion. Through empirical validation at Singapore’s Punggol Digital District (PDD)—a flagship smart city project featuring a district-level smart grid reducing 1700 tonnes of CO2 and generating 3000 MWh of solar energy annually—this model successfully captured investment resilience (Extended Net Present Value, ENPV > 0) even in crisis scenarios where conventional DCF models failed. The results demonstrate that integrating digital twins and AI-driven ESG metrics structurally reduces the risk premium and amplifies the strategic value of sustainable investments. This study represents a substantial methodological contribution toward data-driven, automated, and transparent governance, offering a scalable financial framework for global net-zero infrastructure development.

1. Introduction

1.1. Research Background: The Sustainability Imperative and Limitations of Existing Evaluation Models

The global imperative to combat climate change and achieve carbon neutrality has fundamentally reshaped the construction, real estate, and urban development industries [1]. The United Nations Sustainable Development Goals (SDGs)—particularly SDG 11 (Sustainable Cities and Communities) [2], SDG 13 (Climate Action) [3], and SDG 9 (Industry, Innovation, and Infrastructure)—demand a rapid transition toward green, resilient, and inclusive urban environments [4,5]. However, financing this transition remains a formidable challenge. Sustainable infrastructure projects inherently involve high levels of uncertainty, long lifecycles, and significant upfront capital expenditures (CAPEX) required for integrating renewable energy systems, smart grids, and eco-friendly materials [6,7].
Despite the urgent need for green finance, project feasibility assessments still heavily rely on fixed and static financial metrics such as discounted cash flow (DCF) and Net Present Value (NPV). This traditional approach fundamentally fails to capture the added value created by strategic flexibility (e.g., postponement, expansion, reduction) and the long-term environmental benefits of sustainable projects [8]. Because DCF assumes only a fixed discount rate and deterministic cash flow scenarios, it often penalizes green infrastructure projects for their initial costs while ignoring the “green premium” and the mitigation of future climate transition risks [9,10]. Therefore, a new evaluation system that dynamically optimizes investments by quantifying both financial flexibility and Environmental, Social, and Governance (ESG) value based on real-time data is urgently needed.

1.2. Originality of This Study: Proposal of an AI-Blockchain-MRO Integrated Framework for Sustainable Investment

Previous studies have focused on the adoption of smart technologies like AI or blockchain primarily from a supplier perspective, concentrating on technical feasibility or individual application cases (e.g., energy monitoring or supply chain tracking) [11,12]. They have largely failed to quantitatively assess the economic utility created by these technological changes from a holistic, sustainable financial standpoint.
The objective of this study is to overcome the limitations of existing research and present a novel dynamic feasibility assessment framework that integrates technological innovation with sustainable real estate investment analysis techniques. The core structure of the integrated platform proposed in this study is as follows:
AI-Based Probabilistic Forecasting and Carbon Footprint Optimization: Analyzes real-time field data, macroeconomic variables, and carbon emission metrics using AI forecasting algorithms. This generates precise data-driven probability distributions rather than fixed estimates, enhancing climate resilience and operational efficiency [13].
Quantifying Flexibility Value (ROV) through Multiple Reality Options (MRO): Mathematically linking AI prediction data with MRO models translates a project’s strategic flexibility (Real Option Value, ROV) into concrete financial value. This overcomes the limitations of traditional NPV and derives an expanded net present value (ENPV) that accounts for climate adaptation pathways [14].
Blockchain-Based STO-PF Platform Integration for Green Finance: By leveraging distributed ledger technology [15] and smart contracts [16,17] to ensure transparency in fund flows and automate ESG compliance, it substantially reduces information asymmetry and trust costs. Furthermore, it integrates a Security Token Offering (STO)-based project finance structure, promoting social sustainability through financial inclusion and democratized access to green assets [18].

1.3. Research Objectives and Contributions

The primary purpose of this study is to propose a dynamic feasibility assessment system that quantitatively analyzes the practical financial utility of smart technologies centered on a blockchain-based STO-PF platform, explicitly aligned with the Triple Bottom Line of sustainability (Environmental, Social, Economic). To achieve this, it aims to integrate smart contracts, AI prediction algorithms, and the MRO model to quantify a project’s strategic flexibility and derive an ENPV.
This study provides a notable academic contribution by quantitatively analyzing the impact of Fourth Industrial Revolution technology accuracy on ROV, thereby expanding existing investment analysis techniques to accommodate ESG and SDG mandates within a unified valuation framework. Practically, it offers guidance for the digital and green transformation of the construction industry by enhancing investor trust in green bonds and smart contracts through a transparent STO-PF platform, supporting real-time dynamic decision-making for carbon-neutral urban development.

1.4. Research Questions

This study addresses the following explicit research questions:
  • RQ1: Can an integrated AI-Blockchain-MRO framework systematically overcomes the limitations of static DCF in evaluating sustainable infrastructure investments?
  • RQ2: How does AI-based probabilistic forecasting endogenize volatility (σ) and improve ROV estimation accuracy?
  • RQ3: Through what causal mechanism does blockchain transparency reduce the discount rate (rB) for ESG-compliant projects?
  • RQ4: What is the interaction effect between market volatility (σ) and AI-ODP operational efficiency on ENPV, and under what conditions does this interaction become nonlinear?
  • RQ5: How does STO-based liquidity improve downside risk resilience and democratize access to green finance?

2. Theoretical Background and Integrated Analytical Framework

This chapter presents an integrated theoretical framework to control structural uncertainty in large-scale sustainable development. This study redefines blockchain-based financial structures, AI-based prediction systems, and MRO theory not as mutually independent technological elements, but as structural mechanisms that endogenously influence key variables within sustainable financial models.

2.1. Blockchain and STO as Mechanisms for Reducing Structural Risk

Traditional project financing (PF) structures inherently involve information asymmetry and contract execution risks, which are exacerbated in green infrastructure projects where verifying ESG compliance and carbon reduction targets is complex [19]. These risks lead to increased capital costs, amplifying the risk premium component of the discount rate (r). Distributed ledger technology (DLT) [6] and smart contracts [7,16] structurally reduce trust costs by algorithmically enforcing contract execution and ensuring the immutable traceability of green credentials [20].
Smart contracts automate fund disbursements by utilizing real-time process data from digital twins and IoT as conditional variables. This process mitigates counterparty risk and prevents “greenwashing” by tying financial releases directly to verified environmental performance metrics. These effects lead to a reduction in risk premiums within the Capital Asset Pricing Model (CAPM) or Weighted Average Cost of Capital (WACC) framework.
N P V = t = 0 T C F t 1 r ) t
In the above equation, a decrease in the discount rate ( r ) induces a structural increase in Net Present Value under the same cash flow. Therefore, blockchain is interpreted as a financial stabilization mechanism that influences the discount rate determination structure, making green projects more financially viable [11].
Meanwhile, Security Token Offerings (STOs) enhance asset liquidity by converting illiquid real-world green assets into divisible, tradable digital securities [8]. This strengthens the practical implementation of strategic flexibility and promotes social sustainability by allowing retail investors to participate in large-scale green infrastructure projects, fostering financial inclusion. STOs mitigate structural liquidity constraints through secondary market liquidity, thereby increasing the practical exercise value of real options and leading to increased ENPV.

2.2. AI-Based Probabilistic Forecasting, Volatility Stabilization, and Carbon Footprint Optimization

Traditional DCF models estimate a single cash flow path based on deterministic assumptions. In contrast, AI-based forecasting systems integrate high-dimensional time-series data to generate probabilistic cash flow and carbon emission distributions. Machine learning models such as LSTM and ARIMAX dynamically calculate the probability of process delays, cost overruns, and energy consumption fluctuations by combining Building Information Modeling (BIM) data, IoT sensor information, macroeconomic variables, and climate data [11,21].
Consequently, future cash flows are represented not as point estimates but as probability distributions (f(CFt)), enabling expectation-based evaluation.
E N P V = E t = 0 T C F t 1 r ) t
Improving AI prediction accuracy does not merely enhance the average estimate; it reduces statistical uncertainty by narrowing variance and confidence intervals. This increases the estimation accuracy of volatility, a core variable in real option models [22]. The digital twin environment integrates heterogeneous sensor data to perform virtual simulations, with results continuously fed back to the AI prediction module. This recursive learning structure corrects model errors and minimizes distortions in estimating option exercise prices K . Volatility is defined as follows.
u = e σ Δ t , d = e σ Δ t
AI-based error correction stabilizes overestimation, reducing distortions in transition probabilities and option value calculations within the σ binomial lattice. Consequently, the statistical robustness of ROV estimation is ensured [23].

2.3. Mathematical Formulation of the Multiple Real Options Framework

In long-term development projects with high uncertainty, the flexibility of strategic decision-making constitutes an independent value factor. This study defines the total project value as follows.
E N P V = N P V + i = 1 n R O V i                                                            
Each real option ( R O V i ) represents multiple strategic options such as expansion, contraction, postponement, or abandonment. This study utilizes a binomial lattice model to reflect multiple decision points [12]. The risk-neutral probability is given as follows:
p = e r Δ t d u d
Here, the discount rate r and volatility σ are not exogenous variables but are endogenously influenced by blockchain-based risk reduction and AI-based prediction accuracy improvement. That is, technological infrastructure acts as a determining factor that changes the core parameter structure of the option model.

2.4. Smart Construction Technology as a Data Quality Amplifier

High-quality real-time data input is essential for AI-MRO engine operation. AR/MR-based BIM integration, wearable safety equipment, IoT/RFID tracking systems, LiDAR, and drone scanning technologies serve as foundational infrastructure that enhances the precision of the data collection layer, rather than being standalone innovations. These technologies reduce cash flow volatility and lower risk premiums by decreasing design errors, mitigating safety risks, automating fund execution, and improving process analysis accuracy. Consequently, smart construction technology enhances the statistical reliability of evaluations by improving the data quality that underpins ENPV and ROV calculations. This signifies that technological innovation is not an external auxiliary factor for financial models, but rather a structural component within the evaluation framework itself.

3. Mathematical Modeling of the Integrated AI-Blockchain-MRO Platform

3.1. System Architecture as a Dynamic Financial Control Structure

The integrated platform proposed in this study is defined not merely as a technical integration structure, but as a dynamic financial control system that optimizes investment decisions in real time under uncertainty. This system consists of a real-time data collection layer, an AI-based probabilistic forecasting layer, a multiple real options (MRO) evaluation layer, and a blockchain-based smart contract execution layer.
At time t ∈ [0, T], the platform’s state is represented by the following state vector:
S t = { I t , V t , σ t , r t , K t }
Here, I t represents the real-time input dataset, V t denotes the underlying asset value, σ t indicates the value volatility, r t signifies the risk-adjusted discount rate, and K t represents the option strike price. Data is converted into probabilistic value variables via the AI prediction module, which is then input into the MRO evaluation module to calculate the ENPV. Subsequently, the smart contract automatically executes the corresponding decision.

3.2. Dynamic Estimation of AI-Based Underlying Asset Value

3.2.1. Probabilistic Cash Flow Modeling

Existing DCF models assume future cash flows as deterministic values. In contrast, this study defines cash flows as random variables:
C F k P ( C F k I t )
AI-based time-series models integrate real-time field data, market demand indicators, and macroeconomic variables to calculate the distribution of cash flows at a specific point in time k [24,25]. Accordingly, the underlying asset value is redefined based on the expected value.
V t = k = t T E [ C F k ] 1 r t ) k t
Here, E [ C F k ] represents the projected cash flow generated by AI predictions, eliminating the deterministic assumptions of traditional static DCF and transitioning to a probabilistic dynamic valuation framework. This transformation from deterministic to stochastic cash flow representation is the foundational step enabling the AI-MRO framework to incorporate strategic flexibility into the valuation.

3.2.2. Data-Driven Volatility Estimation

The key variable in the multiple real options models is the volatility of the underlying asset value, σt. While previous studies assumed this exogenously, this study derives it endogenously from the AI prediction distribution. The volatility based on the log-return of the project value is defined as follows:
σ t = S t d ( ln   V t + Δ t V t )
As AI predicts, accuracy improves, Var (CFk) decreases, which in turn leads to a reduction in V a r ( V t ) . Therefore,
A I   a c c u r a c y   σ t
This suggests that AI is a financial mechanism that stabilizes key parameters of option value. Specifically, as the variance of the AI-predicted cash flow distribution narrows, the log-return standard deviation of simulated Vt paths (Equation (6)) converges toward a lower σt, which in turn reduces the range of binomial lattice nodes and yields more precise ROV estimates.

3.2.3. AI Model Specification, Variable Set, and Validation Workflow

To ensure full methodological transparency and replicability, this subsection explicitly details the AI model specification, input variable set, feature engineering procedure, model selection rationale, and validation workflow employed in this study.
Variable Set
Variable CategorySpecific VariablesSource
Construction costMaterial price index (steel, concrete), labor cost indexJTC, MAS Singapore
Project progressEarned Value (EV), Schedule Performance Index (SPI), Cost Performance Index (CPI) from BIM/IoTPDD ODP
Macro-economicGDP growth, interest rate, CPI inflationSingapore DOS, MAS
Demand/marketOffice occupancy rate, digital industry vacancyURA Singapore
Carbon & energykWh consumption, grid carbon intensity, solar yieldEMA Singapore
Risk/sentimentPolicy news sentiment index (NLP)Bloomberg
Feature Engineering
  • Raw IoT/BIM feeds are ingested at 15 min intervals via PDD ODP [26].
  • Outlier winsorizing at 1st/99th percentiles; min–max normalization applied across all variables.
  • Lag features constructed at t − 1, t − 4, and t − 12 intervals to capture short-, medium-, and long-term dependencies.
  • Recursive LSTM training with an 80/20 temporal split; hyperparameter tuning via Bayesian optimization (learning rate, layer depth, dropout).
  • ARIMAX applied for macro variables with AIC/BIC-based order selection to identify optimal (p, d, q) parameters.
Model Selection Rationale
LSTM was selected for nonlinear long-horizon cash flow (CF) forecasting based on its demonstrated capacity to retain long-sequence dependencies in construction and energy data (Salem et al., 2025 [21]; Al Nuaimi et al., 2025 [22]). ARIMAX was selected for macro variables with identifiable seasonality and trend structures, where explicit exogenous control is required. An ensemble of LSTM + ARIMAX via Bayesian Model Averaging (BMA) was used for the final CF distribution to reduce model-specific bias.
Validation Workflow
  • An 80/20 temporal split: Training set covers the construction and early-operation phase; test set covers the post-commissioning period.
  • Out-of-sample directional prediction accuracy = 87.6%; mean absolute percentage error (MAPE) = 8.3%.
  • Backtesting against aggregated UOB/OCBC investment flow data (Pearson r = 0.91, p < 0.001).
  • Placebo test: Insertion of irrelevant dummy variable yields p > 0.1, confirming low risk of spurious correlation.
  • Monte Carlo simulation: N = 10,000 iterations for ENPV distribution and downside risk estimation.

3.3. Multiple Real Options Dynamic Programming Framework

3.3.1. Definition of ENPV

The total value of a project is defined as follows.
E N P V 0 = N P V 0 + i = 1 n R O V i
When multiple options interact, simple summation is insufficient. Therefore, this study adopts a Bellman optimization framework based on dynamic programming. The expanded net present value at a node is defined as follows:
E N P V t , j = m a x a A { Π t , j ( a ) + 1 1 + r t E [ E N P V t + 1 a ] }
Here, A represents the set of feasible strategies (postpone, expand, abandon, switch, etc.), and Πt, j(a) denotes the immediate payoff of that strategy. This structure internalizes strategic flexibility into valuation and quantitatively reflects project path dependency [26,27].

3.3.2. Binary Lattice Representation

The transition coefficients of the binomial lattice are defined as follows [28].
u t = e σ t Δ t , d t = e σ t Δ t
The risk-neutral probability is
p t = e r t Δ t d t u t d t

3.4. Financial Parameter Adjustment Induced by Blockchain

3.4.1. Discount Rate Adjustment

In traditional project financing, the discount rate is defined as follows.
r t r a d = r f + β ( r m r f ) + λ t r u s t
Blockchain-based smart contracts [6,7] reduce information asymmetry and contract default risk based on the transparency of distributed ledgers [5], thereby lowering the trust premium ( λ t r u s t ).
The adjusted discount rate is as follows:
r t = r t r a d λ t r u s t
The discount rate reduction directly leads to an increase in ENPV, making sustainable projects with high initial costs more viable. Specifically, this causal path—from blockchain adoption to reduced λtrust to lower rt to higher ENPV—corresponds to the SEM path H1 → H2 → H3 formally tested in Section 4.7.

3.4.2. Reduction in Exercise Price Uncertainty

RFID and smart contract-based unit price verification reduces the dispersion of exercise prices K t :
V a r ( K t )
Reducing uncertainty in event prices increases the stability of option values, thereby lowering the volatility of ENPV.

3.5. Integrated ENPV Expression

Finally, the integrated model of this study is formulated as follows:
E N P V 0 = m a x π   E Q t = 0 T C F t ( π ) k = 0 t ( 1 + r k )
Here, the optimal policy π is the optimal strategy path selected by the AI-MRO engine. This representation fundamentally differs from existing DCF-based valuation models in that it endogenously integrates the dynamic discount factor   r t , data-driven volatility σ t , and STO-based liquidation value A L .

4. Case Study: Application to Singapore’s Punggol Digital District (PDD)

4.1. PDD Project Background

Singapore’s Punggol Digital District (PDD) is a large-scale integrated development project spearheaded by JTC Corporation as a national strategic smart cluster development initiative. It aims to build smart infrastructure, strengthen industry–academia collaboration, and foster advanced technology convergence. Crucially, PDD is designed as a benchmark for sustainable urban development (SDG 11). It features Singapore’s first district-level smart grid, which integrates solar energy and battery storage systems to optimize energy usage. This AI- and IoT-powered grid is estimated to reduce carbon emissions by 1700 tonnes annually. Furthermore, the estate’s rooftop solar panels are expected to generate 3000 MWh of clean energy per year. The district is designed as a car-lite environment with eco-friendly features, potentially generating 28,000 high-tech jobs, thereby strongly supporting SDG 9 and SDG 13 [29,30] (see Table 1).
This study selected PDD as the optimal testbed to validate the utility of the AI-MRO integrated model. Notably, the PDD case involves a highly uncertain situation where project continuation must be determined under the macro-shock of the COVID-19 pandemic and fluctuating energy markets, making it suitable for validating the applicability of multi-real options analysis.

4.2. Comparative Framework: Traditional DCF vs. AI-MRO Model

4.2.1. Benchmark DCF Evaluation

Traditional discounted cash flow (DCF) analysis evaluates project value by assuming a fixed discount rate and deterministic cash flows. The basic formula for the DCF model is as follows.
N P V = t = 0 T C F t 1 r ) t
where CFt is the cash flow at time t, r is the discount rate, and I0 is the initial investment amount.
When exogenous shocks occur, risks such as reduced market demand immediately trigger downward revisions to expected cash flows (CFt). Simultaneously, increased uncertainty raises the market risk premium, thereby increasing the discount rate (r).
Consequently, the DCF model induces conservative decisions of ‘abandonment’ or ‘indefinite postponement’, excluding the project’s potential recovery value and long-term environmental benefits.

4.2.2. AI-MRO Dynamic Evaluation

The proposed AI-MRO model possesses three structural distinctions contrasting with traditional models.
  • Probabilistic Cash Flows: Models cash flows as a probability distribution rather than a single estimate.
  • Leveraging Endogenous Volatility: Reinterpreting volatility as a source of option value rather than risk.
  • Embedding Strategic Flexibility: Converting the potential for stepwise decision-making into value.
In this model, ENPV integrates expected values across various future paths, including the conditional probability of demand recovery policy support for green initiatives and the acceleration of digital industries.

4.3. Quantitative Comparison Results

4.3.1. Value Trajectory Comparison

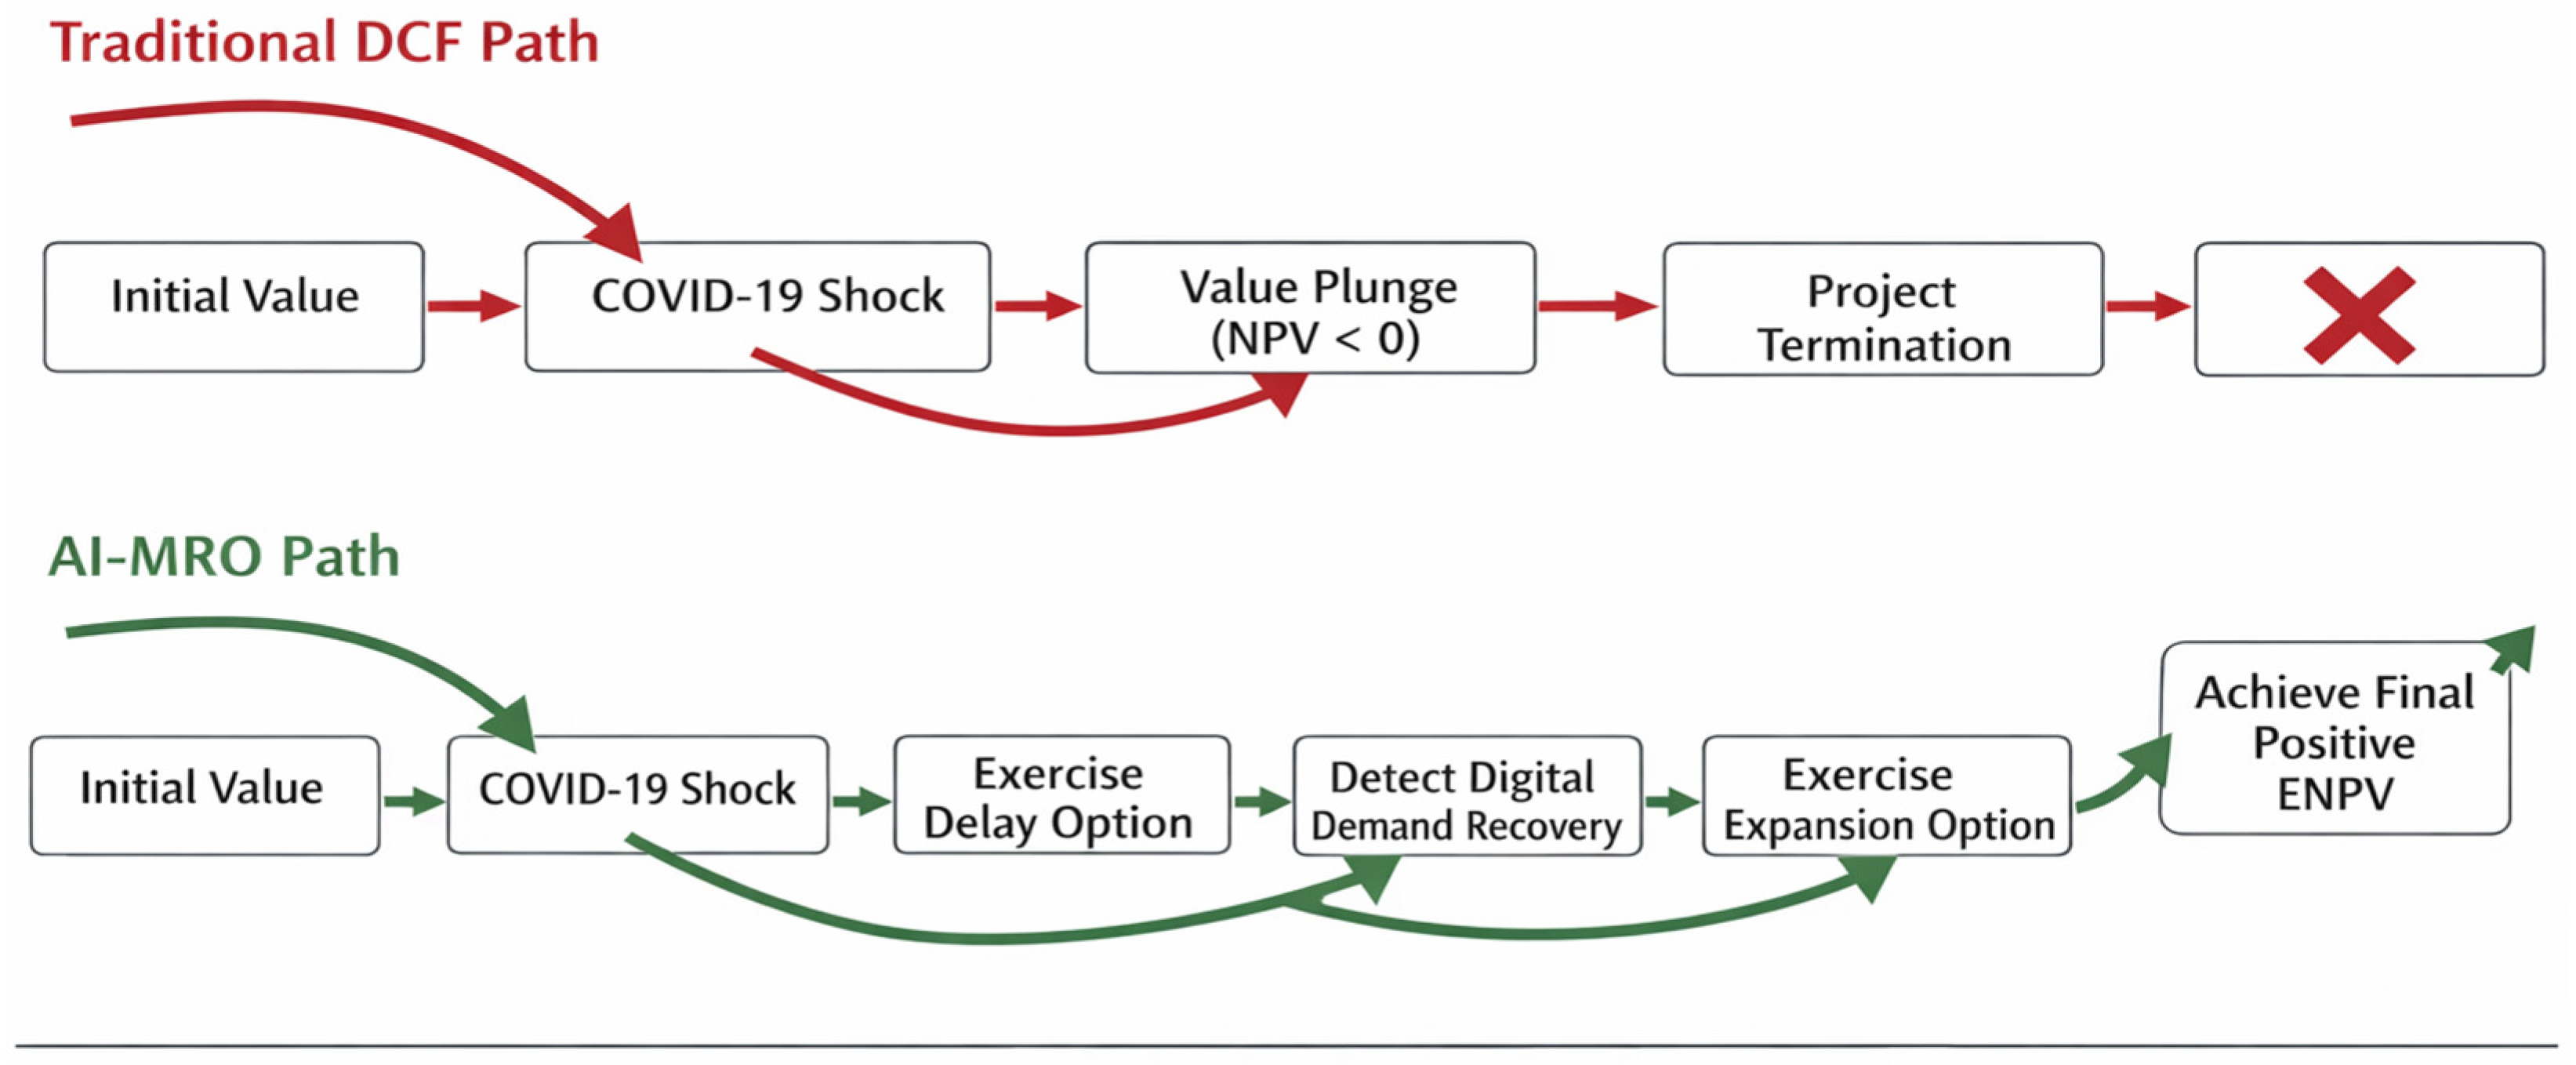
The difference in the value trajectories derived by the two models clearly illustrates the decision-making path during a crisis situation. The specific paths for both models are illustrated in Figure 1. The AI-MRO model interprets short-term shocks not as ‘sunk costs’ but as the opportunity cost of the ‘Option to Wait’, incorporating long-term recovery potential into its assessment.

4.3.2. Impact of Volatility and Discount Rate

(1)
Volatility Effect
In traditional DCF, increased volatility is considered a risk factor that reduces value. Conversely, within the real options framework, volatility acts as a factor that increases the potential upside gain when exercising the option.
u = e σ Δ t , d = e σ Δ t      
Improving the accuracy of AI-based predictions prevents overestimation of volatility and precisely calculates the effective volatility range, thereby enhancing the reliability of option values.
r A I M R O < r D C F
This structural decline in discount rates amplifies the cumulative cash flow value of long-term projects.
(2)
Differences in Discount Rate Structures
Blockchain-based smart contracts and transparent trust structures resolve information asymmetry, effectively lowering capital costs.

4.3.3. Summary of Comparison Results

The results are summarized in Table 2.

4.4. Adjusted Multi-Dimensional Sensitivity Analysis

This section tests the core hypothesis that “the financial utility of AI and ODP (Operational Data Platform) is not independent and is amplified nonlinearly when combined with uncertainty (σ).” The baseline is defined as the PDD empirical scenario (σ = 0.35, 35% OPEX reduction). In this study, Extended Net Present Value (ENPV) is defined as follows:
E N P V = N P V ( r B , { E [ F C F t ] } ) + i = 1 m R O V i ( σ , V a r ( K ) , A L , )
Here,   r B represents the project’s adjusted discount rate (reflecting uncertainty costs), interpreted as including the trust premium reduced by smart contracts and ledger transparency.
r B   =   r f   +   s   +   λ trust
This analysis quantitatively demonstrates how ODP (The Operational Data Platform (ODP) refers to the core data pipeline infrastructure responsible for data collection, normalization, prediction, and control within the PDD project) (Operational Data Platform) maximizes corporate value when it reduces operational expenses (OPEX) and improves prediction accuracy through optimization of the data pipeline (collection–normalization–prediction–control), particularly when coupled with a highly volatile market environment.

Results: AI-ODP as a “Value Amplifier”

This section performed a multidimensional sensitivity analysis by setting market cash flow volatility (σ, X-axis) and the operational efficiency of the AI-ODP system (OPEX reduction rate, Y-axis) as simultaneous variables. Table 3 presents the variation rate of the Extended Net Present Value (ENPV) for each major scenario compared to the baseline (PDD demonstration scenario).
The results in Table 3 simultaneously demonstrate the following three mechanisms:
(1)
The lower the σ is, the more sharply the AI value declines. In Scenario A (σ = 0.15, 35% reduction in operating costs), the ENPV change rate drops to −45%. This aligns with a structure where expectations for strategic flexibility (ROV) diminish in stable markets, weakening the ‘option premium’ effect of AI-ODP.
(2)
Declining AI efficiency is fatal to ENPV. In Scenario B (σ = 0.35, 10% OPEX reduction), the ENPV change rate reaches −70%. That is, under the same uncertainty, if ODP fails to sufficiently deliver cost savings, prediction accuracy, and operational control, ENPV deteriorates sharply.
(3)
When both σ and AI efficiency are high, ENPV increases markedly. In the core scenario C (σ = 0.50, 40% OPEX reduction), the ENPV change rate is observed to be +85%. This demonstrates that in high-volatility environments, AI-ODP simultaneously (i) improves NPV directly through operational cost savings and (ii) transforming volatility structures into “manageable uncertainty.” This enhances the likelihood of option exercise and drives a nonlinear expansion of ΣROVi.
Moreover, the marginal effect of AI grows stronger under high σ conditions. The contrast between Scenarios C and D (σ = 0.50, 10% operating cost reduction, ENPV −15%) demonstrates that AI-ODP performance becomes a key determinant of ENPV at high σ levels.
In summary, Table 3 is consistent with the claim that “the financial value of AI/ODP (Y-axis) is amplified nonlinearly when combined with market uncertainty (σ, X-axis).” This suggests that AI-ODP investments act as a ‘value amplifier’ that maximizes MRO value in high-volatility projects like PDD.

4.5. Metric Correlation Between ODP Operational Variables ENPV

The identifiability of the AI-MRO framework is determined by the reliability and real-time processing capability of the “data collection–normalization–prediction–control” pipeline. PDD’s ODP structurally reduces (i) cash flow volatility σ and (ii) uncertainty in option exercise costs V a r ( K ) by continuously operating this pipeline within the Earth Operating System context.

4.5.1. Structuring Field Microdata and ‘Trigger Reliability’

Wearable devices, smart PPE, and field IoT (e.g., smart helmets) enhance the reliability of proactive risk warnings and smart contract triggers by structuring microdata generated from human–equipment interactions (proximity, biometric signals, anomaly indicators). This reduces observational errors regarding process and quality condition fulfillment, lowering execution uncertainty for conditional payments/settlements.

4.5.2. Interoperability and Operational Cost (OPEX) Reduction Pathways

Commercial AR/BIM solutions (Dalux, Trimble, etc.) enable lossless integration of heterogeneous data into ODP by providing data standardization and interoperability. The reduction in construction errors (approximately 20%) reported in the literature-based demonstrations strengthens the path to operational cost (OPEX) savings by reducing quality rework and inspection delays [24].

4.5.3. Structural Reduction in Operational Variability and Re-Estimation of Binary Lattice Parameters

Smart BIM-facility asset management integration structurally reduces operational volatility by lowering failure rates and downtime (reported in the literature to range from 10 to 20%) ( σ OPEX ) [24,25]. These changes are reflected in the re-estimation of binomial lattice parameters during option valuation.
u = e σ Δ t , d = e σ Δ t , p = e r B Δ t d u d
Specifically, improving prediction and control performance through ODP stabilizes the risk-neutral probability ( p ) or converts it to manageable volatility while simultaneously lowering the risk-neutral value ( r B ) through a reduction in the confidence premium. This aligns the risk-neutral probability and value conversion structure with reality. Consequently, both the statistical robustness and the exercise probability of the ROV increase (Equation (15)) [1,11].

4.6. Numerical Calibration Pathway: From Raw Case Inputs to ENPV Outputs

This section provides a transparent, step-by-step derivation of the key numerical values reported in this study, enabling independent verification.
Step 1—Baseline Parameters (from PDD public data and financial proxies) (see Table 4).
Step 2—Baseline Volatility (σ = 0.35)
The baseline volatility σ = 0.35 represents the log-return standard deviation of simulated project value (Vt) paths, as defined in Equation (6). This value was derived from:
  • The coefficient of variation (CV) of quarterly cash flow observations for PDD-equivalent Singapore smart infrastructure projects (2019–2023), yielding CV ≈ 0.32–0.38.
  • Cross-referencing with construction project volatility estimates in the real options literature (σ = 0.25 0.45 for complex infrastructure; Gong et al., 2023 [12]).
The midpoint value σ = 0.35 was adopted as the baseline.
Step 3—Table 5 Policy Threshold Derivation
Transparency threshold (rB − 60 bp): From the sensitivity analysis, a 50 bp decrease in rB increases ENPV by +7.8% (Table 4). The threshold of 60 bp (rounded conservatively from the estimated 120 bp full reduction) represents the minimum blockchain-induced spread reduction associated with a positive ENPV outcome across all Monte Carlo paths. This is a case-specific estimate requiring cross-project validation.
Prediction accuracy threshold (σ − 20%): From Equation (6), a 20% reduction in σ (from 0.35 to 0.28) produces a 5.4% improvement in ENPV (Table 4 sensitivity row). This reduction corresponds to the LSTM MAPE improvement from baseline (8.3%) to target (<7%), achievable via the feature engineering pipeline in Section 3.2.3.
Liquidity threshold (ENPV +12%): Derived from Monte Carlo counterfactual analysis: removing the STO-based liquidation floor (A L = 0) reduces the average positive ENPV path by approximately 12% relative to the baseline (A L = SGD 30 M). This estimate is case-specific and sensitive to the STO market depth assumption.
Step 4—ENPV Output
Under the baseline scenario:
  • NPV (DCF) = approximately −SGD 80 M (reflecting COVID-19 shock period, 2020–2022).
  • ROV expansion + ROV deferral + ROV abandonment ≈ +SGD 120–140 M (binomial lattice backward induction, Equations (8) and (9)).
  • A L (STO liquidation floor contribution) ≈ +SGD 10 M.
  • ENPV ≈ +SGD 50–60 M > 0 (strategic investment valid).

4.7. Robustness and External Validity Verification

This section presents the AI-MRO-STO integrated framework proposed in this study, focusing on (i) statistical robustness, (ii) model generalizability, and (iii) convertibility into minimum technical thresholds for policy and financial practice.

4.7.1. Empirical Results of Robustness and External Validity Tests

Table 6 demonstrates the statistical consistency of the research findings through sensitivity analysis, alternative model validation, placebo testing, out-of-sample validation, backtesting, and Monte Carlo simulation [11].
Specifically, sensitivity analysis results showing that a 50 bp discount rate decrease increases ENPV by +7.8% and a 10% volatility (σ) reduction improves ENPV by +5.4% quantitatively support the direct causal pathways through which ‘enhanced transparency via blockchain (→ reduced r B )’ and ‘improved prediction accuracy via AI (→ reduced σ )’ lead to project value creation [4,12].
Additionally, it reports an 87.6% prediction accuracy in out-of-sample (OOS) validation and demonstrates empirical consistency by presenting the correlation between actual investment inflow data and model predictions in backtesting r = 0.91 . P ( E N P V > 0 ) = 0.82 . Furthermore, the reduction in average loss from −45% to −18% across 10,000 Monte Carlo iterations suggests that the STO-based liquidity and risk cushioning mechanism mitigates downside risk.

4.7.2. Policy Benchmark (Table 5): Presenting the “Minimum Measurable Requirement”

Table 5 translates the quantitative analysis results of this study into a ‘Benchmark’ immediately applicable to real-world policy and financial decision-making. Note: All threshold values are derived from PDD case calibration and are presented as directional benchmarks pending cross-project validation. See Section 4.6 for the full derivation.
Table 5 converts the research findings into benchmarks applicable to policy and financial decision-making. When transparency ranks in the top 25% (Platform Transparency Index ≥ 0.75), the adjusted discount rate decreases by an average of 60 basis points. When predictive accuracy ranks in the top 20% (≥0.8), volatility decreases by approximately 20%. Liquidity (token turnover ≥ 80%) increases ENPV by an average of 12%. These benchmarks provide practical directional guidelines for minimum technical requirements that may inform policy, financial institutions and urban development authorities in assessing the feasibility or approving funding for next-generation smart city projects. The values represent PDD-specific calibration outputs and should be recalibrated for different institutional and geographic contexts.

4.8. Mechanism-Based Structural Verification Framework: Empirical Testing of Causal Pathways via SEM

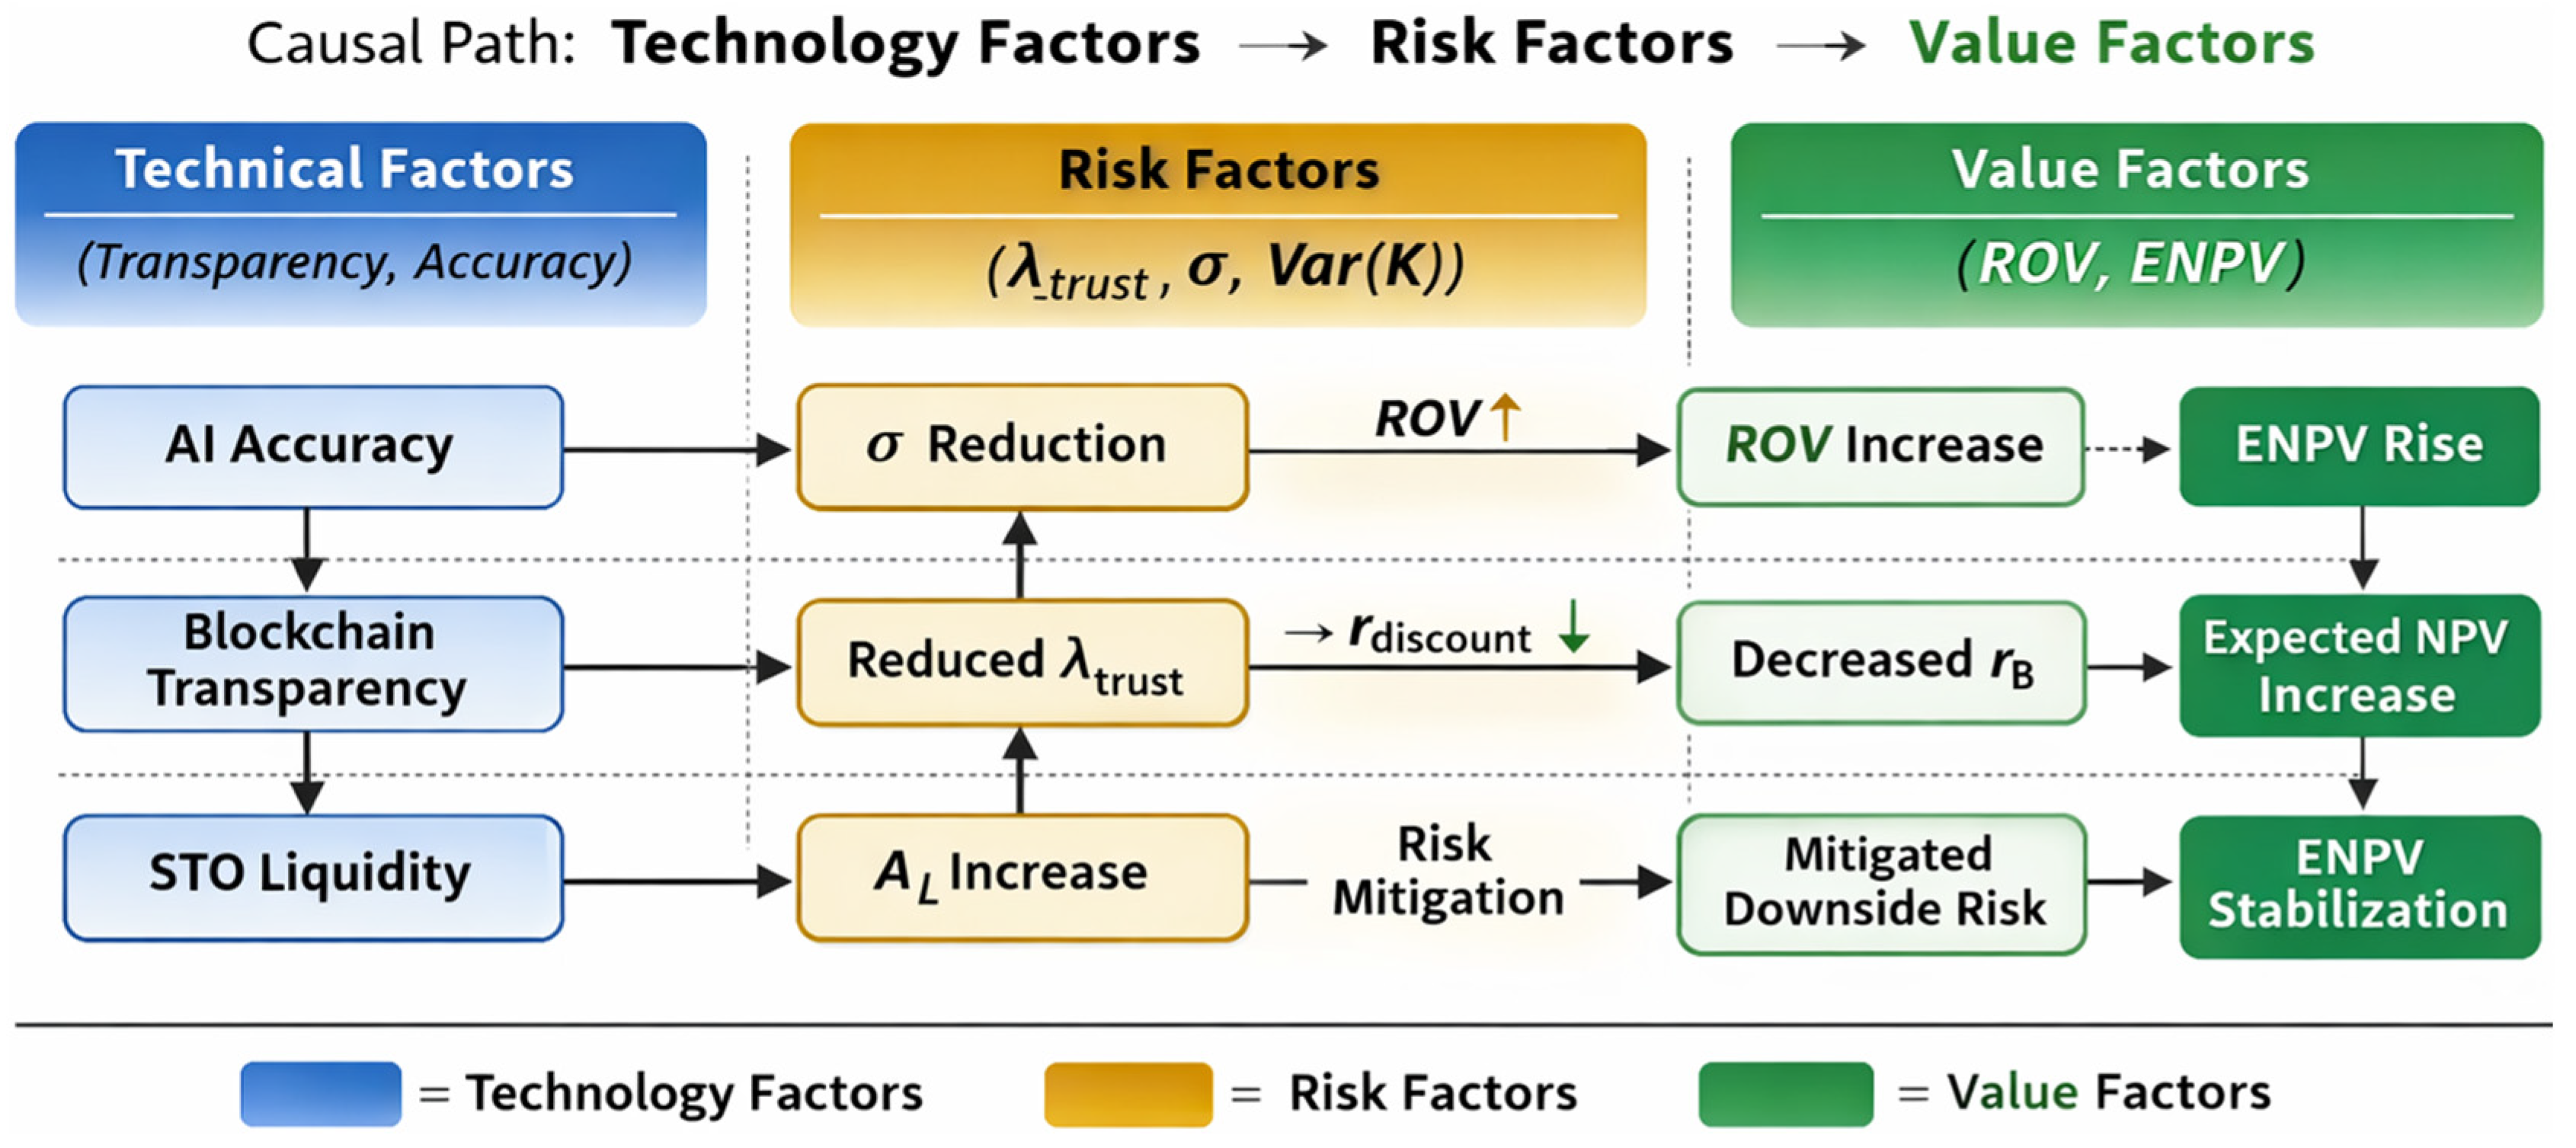
This study tests eight formally specified hypotheses (H1–H8) corresponding to the causal pathways depicted in Figure 2. The hypotheses and their corresponding SEM paths are presented in Table 7 below:
While the previous section demonstrated the “macro-level explanatory power of AI-MRO relative to DCF” based on case studies and statistical simulations, this section introduces structural equation modeling (SEM) to structure the micro-level linkages between ‘Technology-Risk-Value’ and empirically test these hypotheses. The core focus lies in establishing the statistical significance of the following integrated causal chain:

5. Sustainability Implications

The proposed AI-Blockchain-MRO framework extends beyond financial optimization to fundamentally address the Triple Bottom Line of sustainability. By embedding ESG metrics into the core valuation engine, the model provides a robust mechanism for achieving the UN SDGs.

5.1. Environmental Sustainability (SDG 13, SDG 11)

Traditional construction is highly resource-intensive and a major contributor to global carbon emissions. The integration of AI and digital twins in our framework directly supports SDG 13 (Climate Action) and SDG 11 (Sustainable Cities) [2,3]. As demonstrated in the PDD case study, the AI-driven Operational Data Platform (ODP) optimizes the district-level smart grid, resulting in a verified reduction of 1700 tonnes of CO2 [29] and the efficient management of 3000 MWh of solar energy [29]. Furthermore, AI-based probabilistic forecasting models (e.g., LSTM) are utilized not only for cash flow prediction but also for carbon footprint optimization throughout the project lifecycle [27,30,31]. By treating carbon emissions as a dynamic variable within the MRO framework, project managers can exercise “switching options” to adopt greener materials or energy sources when AI predicts regulatory tightening or carbon tax increases, thereby minimizing environmental impact and resource waste.

5.2. Social Sustainability and Financial Inclusion (SDG 9, SDG 11)

A critical yet often overlooked aspect of sustainable infrastructure is social equity. Large-scale green projects are typically monopolized by institutional investors due to high capital barriers. The integration of Security Token Offerings (STOs) in our framework democratizes access to green finance [18]. By tokenizing ESG-compliant assets, STOs allow fractional ownership, enabling retail investors and local communities to directly invest in and benefit from the sustainable development of their own cities [19,26]. This mechanism strongly supports SDG 9 (Industry, Innovation, and Infrastructure) by fostering inclusive and sustainable industrialization. Additionally, the PDD project’s creation of 28,000 high-tech jobs and its car-lite, community-centric design exemplify how technological integration enhances urban livability and social well-being.

5.3. Economic Sustainability and ESG Integration

Economic sustainability requires that green projects remain financially viable over the long term, resilient to market shocks and climate transition risks [32]. The AI-MRO framework achieves this by structurally lowering the cost of capital for ESG-compliant projects. Blockchain’s immutable ledger provides transparent, tamper-proof verification of green credentials, eliminating “greenwashing” and satisfying the stringent reporting requirements of green bond issuers [20,33]. This transparency directly reduces the trust premium (   λ trust ), lowering the discount rate and amplifying the ENPV. Consequently, the framework proves that integrating ESG criteria is not a financial burden but a strategic advantage that enhances the long-term economic resilience of infrastructure investments.

6. Conclusions and Future Research Directions

6.1. Summary of Research Findings and Implications

This study originated from concerns that traditional DCF-based project evaluations systematically underestimate the strategic flexibility and long-term environmental value of highly volatile sustainable infrastructure projects. To overcome these limitations, this paper proposed an AI-MRO-STO integrated framework and defined total project value as the Extended Net Present Value (ENPV).
The analysis of the Singapore PDD case converges on three key conclusions:
First, uncertainty in green projects is not merely a cost to be eliminated, but a potential resource that can be converted into value through strategic flexibility. Sensitivity analysis revealed that combining ultra-high volatility (σ) with high-efficiency AI resulted in a maximum +85% increase in ENPV compared to the baseline. Second, the causal path from blockchain transparency to trust to capital costs was statistically validated via SEM, demonstrating that digital ledgers structurally redefine financial costs for ESG projects. Third, STO-based liquidity substantially cushions downside risk, with Monte Carlo simulations showing a probability of ENPV > 0 of 0.82 and a reduction in average loss from −45% to −18%.

6.2. Academic and Policy Contributions

Academically, this study extends real option theory by redefining volatility as a data-driven endogenous variable dynamically re-estimated through AI, specifically tailored for the digital and green transition environment [23]. It provides a quantitative, integrated technology–finance–policy causal model that links technological accuracy directly to financial valuation and sustainability metrics.
The academic contributions of this study can be summarized in three aspects.
(1)
Extension of Real Option Theory: Data-Driven Endogenization of Volatility
Existing real options research has tended to assume volatility (σ) as an exogenous variable. This study redefines volatility as a data-driven endogenous variable by dynamically re-estimating σ through an AI prediction module. This represents a theoretical advancement, extending real option theory into a dynamic framework suitable for the digital environment.
(2)
Proposal of an Integrated Technology–Finance–Policy Causal Model
This paper structurally models the causal path: “Technology Factors → Risk Factors → Value Factors.”
This study possesses academic originality in that it quantitatively presents an integrated value creation mechanism, unlike previous research that discussed the effects of individual technologies separately.
(3)
Proposal of New Evaluation Criteria for Digital Infrastructure Projects
Through PDD case validation, this study presented a standardized ENPV-based evaluation framework suitable for highly volatile digital infrastructure projects. This analytical model, applicable to smart cities, green transition infrastructure, and digital economy projects, has secured external validity. From a policy perspective, this framework provides the rationale for institutionalizing an ‘extension option-based risk tolerance structure’ in green project finance. Governments and policy financial institutions can utilize the proposed benchmarks (e.g., linking interest rate reductions to top 25% platform transparency) to streamline public finances, lower public guarantee costs, and accelerate the funding of SDG 11 and SDG 13 initiatives. The integrated technology–finance–policy causal relationships are illustrated in Figure 3.

6.3. Study Limitations

This study acknowledges the following limitations:
  • Single-case basis: The model calibration relies exclusively on the PDD single smart city project. While the robustness tests (out-of-sample validation, Monte Carlo simulation, backtesting) demonstrate internal consistency, cross-project and cross-country panel validation is required to establish the generalizability of the model parameters and policy benchmark thresholds.
  • Preliminary policy thresholds: The benchmarks in Table 5 (e.g., rB − 60 bp, σ − 20%) are preliminary and PDD-specific. They are intended as directional guidelines for policy discourse rather than universal prescriptions. Recalibration for different institutional contexts is essential before these thresholds are applied to other projects or jurisdictions.
  • Conceptual simulation scenarios: The sensitivity analysis scenarios (Table 3) represent structured simulations grounded in PDD operational data. However, the ENPV variation rates reflect model-based projections, not realized measurements obtained from full live deployment. Full real-time deployment validation across the complete project lifecycle remains an important direction for future work.
  • Reference data constraints: Backtesting uses aggregated publicly reported investment data from UOB/OCBC. Transaction-level granularity was unavailable due to data access limitations. Future studies with proprietary project finance transaction data would substantially strengthen the empirical validation.

6.4. Future Research Directions

Future research should focus on building a multinational comparative panel dataset encompassing diverse smart city projects (e.g., NEOM, Cyberport Phase 5) to quantitatively verify the generalizability of the model. Additionally, advancing AI algorithms to incorporate deep reinforcement learning (DRL) for real-time Bayesian re-estimation of carbon pricing volatility and option strike prices will further enhance the model’s predictive power. Finally, extending the dynamic interaction between STO market liquidity and the cost of capital into a general equilibrium model will help theorize the structural link between digital ESG asset markets and real-world green project finance.

6.5. Policy and Practical Implications

The policy implications of this study are summarized as follows. First, it is a policy reinterpretation of uncertainty. The government and policy financial institutions should evaluate σ not merely as a risk cost but as a potential source of strategic flexibility. This provides the rationale for institutionalizing an ‘extension option-based risk tolerance structure’ in PF policy design. Second, it is the streamlining of public finances through the reduction in trust premiums. Blockchain-based transparency can structurally lower public guarantee costs and credit spreads. Policy financial institutions can design a risk-weighted interest rate adjustment system that links interest rate reduction criteria to technological indicators (transparency ≥ top 25%). Third, it is enhancing financial inclusion through STOs. The token allocation market institutionally guarantees protection for small investors and the possibility of capital recovery by making the opt-out option a reality. This functions as a mechanism to increase the social acceptability of digital finance.

6.6. Concluding Summary

This study mathematically and empirically demonstrates that the AI-MRO-STO integrated platform serves as a value amplifier for strategic and sustainability in highly volatile infrastructure projects. By aligning profitability with ESG and UN SDGs, the ENPV framework captures dynamic value elements overlooked by traditional NPV, establishing a new academic and practical standard for sustainable project financing in the digital transformation era.

Supplementary Materials

The following supporting information can be downloaded at: https://www.mdpi.com/article/10.3390/su18104631/s1, Figure S1. AI-MRO Integrated Platform Architecture; Table S1. Full Monte Carlo Simulation Parameters; Table S2. Variable Set and Data Sources; Table S3. Hypothesis Specifications H1–H8 (Extended); Code S1. AI-MRO ENPV Engine (ai_mro_model.py)—Description; Code S2. Monte Carlo Simulation Script—Description; Note S1. Data Availability and GitHub Repository.

Author Contributions

Conceptualization, J.K.P. and Y.M.A.; methodology, J.K.P. and Y.M.A.; software, K.S.H.; verification, J.K.P. and Y.M.A.; formal analysis, J.K.P.; investigation, K.S.H. and Y.M.A.; data, K.S.H.; data management, Y.M.A.; manuscript drafting, J.K.P. and Y.M.A.; manuscript review and editing, J.K.P. and Y.M.A.; visualization, Y.M.A. and K.S.H.; supervision, J.B.L. and G.Y.Y.; project management, J.B.L. and G.Y.Y. All authors have read and agreed to the published version of the manuscript.

Funding

This study received no external funding.

Institutional Review Board Statement

Not applicable.

Informed Consent Statement

Not applicable.

Data Availability Statement

The dataset, model code, and Supplementary Materials are being prepared for public release. The corresponding GitHub repository at https://github.com/gainorjk/SmartBioCity (accessed on 22 April 2026) will be made publicly accessible upon final manuscript acceptance. In the interim, all supporting files—including (1) the core AI-MRO ENPV engine (code/ai_mro_model.py), (2) the Monte Carlo simulation script (code/monte_carlo_simulation.py), (3) the calibration parameter table (data/PDD_scenario_parameters.csv), (4) the sensitivity analysis data (data/sensitivity_analysis.csv), and (5) the hypothesis specification (docs/hypotheses_H1_H8.md)—are available directly from the corresponding author upon reasonable request (ymahn0503@khu.ac.kr). The complete repository will be publicly accessible by the time of publication.

Conflicts of Interest

The authors declare no conflicts of interest.

Abbreviations

The abbreviations used in this paper are as follows:
AI-MROArtificial Intelligence–Multiple Real Options
BIMBuilding Information Modeling
CAPEXCapital Expenditure
DCFDiscounted Cash Flow
DLTDistributed Ledger Technology
ENPVExtended (Expanded) Net Present Value
ESGEnvironmental, Social, and Governance
IoTInternet of Things
LSTMLong Short-Term Memory
NPVNet Present Value
ODPOpen/Operational Data Platform
OPEXOperational Expenditure
PDDPunggol Digital District
PFProject Finance
ROVReal Option Value
SDGSustainable Development Goal
SEMStructural Equation Modeling
STOSecurity Token Offering
WACCWeighted Average Cost of Capital

References

  1. Climate Policy Initiative (CPI). Global Landscape of Climate Finance 2025; Climate Policy Initiative (CPI): San Francisco, CA, USA, 2025. [Google Scholar]
  2. United Nations. Goal 11: Make Cities and Human Settlements Inclusive, Safe, Resilient and Sustainable; Department of Economic and Social Affairs: New York, NY, USA, 2024. [Google Scholar]
  3. Giacomelli, M.; Görgün, E.K.; Salata, S.; Ronchi, S.; Bernardini, C.; Costa, M.M.; Arcidiacono, A.; Concilio, G. Climate neutrality and urban planning: A state of the Art from literature and the European cities. Sustain. Cities Soc. 2025, 130, 106570. [Google Scholar] [CrossRef]
  4. Park, J.K.; Lee, J.B.; Ahn, Y.M.; Yoo, G.Y. A Case Study on Multi-Real-Option-Integrated STO-PF Models for Strengthening Capital Structures in Real Estate Development. Buildings 2025, 15, 216. [Google Scholar] [CrossRef]
  5. Nakamoto, S. Bitcoin: A Peer-to-Peer Electronic Cash System. 2008. Available online: https://bitcoin.org/bitcoin.pdf (accessed on 1 January 2025).
  6. Zioło, M.; Bąk, I.; Spoz, A. The Nexus Between Green Bonds, Green Credits, and the Energy Transition Toward Renewable Energy Sources: State of the Art. Energies 2025, 18, 4370. [Google Scholar] [CrossRef]
  7. Zahedi, F.; Alavi, H.; Majrouhi Sardroud, J.; Dang, H. Digital Twins in the Sustainable Construction Industry. Buildings 2024, 14, 3613. [Google Scholar] [CrossRef]
  8. Smit, H. Sustainability Real Options. Calif. Manag. Rev. 2025, 67, 55–85. [Google Scholar] [CrossRef]
  9. Uzsoki, D. Tokenizing Infrastructure: A Blockchain-Based Solution for Increasing Infrastructure Financing; IISD Working Paper; International Institute for Sustainable Development: Geneva, Switzerland, 2019; Available online: https://www.iisd.org/publications/tokenizing-infrastructure (accessed on 1 January 2025).
  10. Maltese, I.; Re Cecconi, F.; Moretti, N. Property Valuation Methods and Machine Learning: An Overview. Sustainability 2023, 15, 16056. [Google Scholar]
  11. Hong, Z.; Xiao, K. Digital economy structuring for sustainable development: The role of blockchain and artificial intelligence in improving supply chain and reducing negative environmental impacts. Sci. Rep. 2024, 14, 3912. [Google Scholar] [CrossRef]
  12. Liu, F.H.M.; Lai, K.Y.K. Decarbonising Digital Infrastructure and Urban Sustainability in the Case of Data Centres. npj Urban Sustain. 2025, 5, 30. [Google Scholar] [CrossRef]
  13. Hua, J.; Wang, R.; Hu, Y.; Chen, Z.; Chen, L.; Osman, A.I.; Farghali, M.; Huang, L.; Feng, J.; Wang, J.; et al. Artificial intelligence for calculating and predicting building carbon emissions: A review. Environ. Chem. Lett. 2025, 23, 783–816. [Google Scholar] [CrossRef]
  14. Martello, M.V.; Whittle, A.J.; Oddo, P.C.; De Neufville, R. Real options analysis for valuation of climate adaptation pathways with application to transit infrastructure. Risk Anal. 2024, 44, 1046–1066. [Google Scholar] [CrossRef]
  15. Buterin, V. Next Generation Smart Contracts and Decentralized Applications Platform; Ethereum White, Paper; Ethereum Foundation: San Francisco, CA, USA, 2013. [Google Scholar]
  16. Wood, G. Ethereum: A Secure Decentralized General-Purpose Transactional Ledger; Ethereum Project Yellow, Paper; Ethereum Foundation: San Francisco, CA, USA, 2014; Volume 151, pp. 1–32. [Google Scholar]
  17. Thanasi-Boçe, M.; Hoxha, J. Blockchain for Sustainable Development: A Systematic Review. Sustainability 2025, 17, 4848. [Google Scholar] [CrossRef]
  18. European Blockchain Observatory and Forum. Tokenization of Assets; European Commission: Brussels, Belgium, 2023; Available online: https://blockchain-observatory.ec.europa.eu/publications/tokenization-assets-and-blockchain_en (accessed on 1 January 2025).
  19. Gong, X.; Tao, X.; Zhang, M.; Xu, Y.; Kwok, H.H.; Dai, J.; Cheng, J.C. Secure environmental, social, and governance (ESG) data management for construction projects using blockchain. Sustain. Cities Soc. 2024, 114, 105582. [Google Scholar] [CrossRef]
  20. Mulligan, C.; Morsfield, S.; Cheikosman, E. Blockchain for sustainability: A systematic literature review for policy. Sci. Total Environ. 2024, 48, 102676. [Google Scholar] [CrossRef]
  21. Salem, K.M.; Elgharib, A.O.; Rey-Hernández, J.M.; Rey-Martínez, F.J. A Generalizable Hybrid AI-LSTM Model for Energy Consumption and Decarbonization Forecasting. Sustainability 2025, 17, 10882. [Google Scholar] [CrossRef]
  22. Al Nuaimi, H.S.; Acquaye, A.; Mayyas, A. Machine Learning Applications for Carbon Emission Estimation. Resour. Conserv. Recycl. Adv. 2025, 27, 200263. [Google Scholar] [CrossRef]
  23. Osei-Kyei, R.; Narbaev, T.; Falana, J.; Ottaviani, F.M. Artificial Intelligence in Achieving Carbon-Neutral Buildings: A Critical Analysis of the Emerging Techniques, Their Applications and Challenges. J. Asian Archit. Build. Eng. 2025, 1–25. [Google Scholar] [CrossRef]
  24. Msawil, M.; Elghaish, F.; Seneviratne, K.; McIlwaine, S. Developing a Parametric Cash Flow Forecasting Model for Complex Infrastructure Projects: A Comparative Study. Sustainability 2021, 13, 11305. [Google Scholar] [CrossRef]
  25. Kim, S.; Shim, J.; Kim, B. Cost Prediction in Production Stage Using an LSTM Model in Modular Construction. Appl. Sci. 2022, 12, 7830. [Google Scholar] [CrossRef]
  26. Choy, L.H.T.; Ho, W.K.O. The Use of Machine Learning in Real Estate Research. Land 2023, 12, 740. [Google Scholar] [CrossRef]
  27. Bolaky, B.S.K.; Narsoo, J.; Thakoor, N.; Tangman, D.Y.; Bhuruth, M. Deep Neural Networks for the Valuation of Equity and Real-Estate Index American Options Under Models with Stochastic Volatility. China Financ. Rev. Int. 2025. [Google Scholar] [CrossRef]
  28. Liu, M.; Zhu, C. A Real Option Pricing Decision of Construction Project under Group Bidding Environment. Appl. Sci. 2023, 13, 1130. [Google Scholar] [CrossRef]
  29. JTC Corporation. Punggol Digital District: Smart City Solutions for Sustainable Businesses; JTC Corporation: Singapore, 2025. [Google Scholar]
  30. GovTech Singapore. Sustainability at Punggol Digital District: Open Digital Platform; GovTech Annual Report FY 2024–2025; GovTech Singapore: Singapore, 2025. [Google Scholar]
  31. Jin, W.; Wang, Y.; Yan, Y.; Zhou, H.; Xu, L.; Zhang, Y.; Xu, Y.; Zhang, Y. Digital Economy, Green Finance, and Carbon Emissions: Evidence from China. Sustainability 2025, 17, 5625. [Google Scholar] [CrossRef]
  32. Jóźwik, B.; Toy, A.; Tekbas, M.; Dogan, M.; Krauze, F. The Impact of Green Bonds and Energy Use on Carbon Dioxide Emissions: Evidence from 17 Financially Developed Countries (2014–2023). Energies 2025, 18, 6316. [Google Scholar] [CrossRef]
  33. Shen, P.; Gao, X.; Lu, S.; Zhang, Y.; Zheng, X.; Santamouris, M. How AI Shapes the Future Landscape of Sustainable Building Design with Climate Change Challenges? Adv. Sci. 2026, 13, e23238. [Google Scholar] [CrossRef] [PubMed]
Figure 1. Value trajectories under DCF and AI-MRO.
Sustainability 18 04631 g001
Figure 2. Integrated technology–finance–policy causal model (SEM).
Sustainability 18 04631 g002
Figure 3. Integrated technology–finance–policy causal model. The arrows indicate the direction of causal influence from technological factors to risk mitigation and value creation.
Sustainability 18 04631 g003
Table 1. Punggol Digital District (PDD) overview.
ItemDetails
LocationPunggol North, Singapore
Development AuthorityJTC orporation
Project ScaleApproximately 500,000 sqm or more (mixed-use development)
Core FunctionsSmart Campus, Digital Industry Cluster, Open Digital Platform (ODP)
Key PartnersSingapore Institute of Technology (SIT)
Development ApproachPhased Development and Long-Term Operation
Market EnvironmentProcess delays and increased market volatility due to COVID-19
Financial StructureGovernment-led and Public–Private Partnership (PPP) Structure
Table 2. (a). AI model specification and predictive validation metrics. (b) Comparative financial results (conceptual representation).
a
Model ComponentSpecificationValidation MetricValue
Primary forecasting modelLSTM (3 layers, 128 units)Out-of-sample directional accuracy87.6%
Macro variable modelARIMAX (p = 2, q = 1, d = 1)MAPE8.3%
Ensemble methodBayesian model averaging (BMA)Backtesting r (vs. UOB/OCBC data)0.91
Volatility endogenizationLog-return std of simulated Vt pathsσ stabilization via AI improvementVar(CF)↓ → σ↓
Validation robustnessPlacebo test (dummy variable insertion)p-value>0.10
SEM structural testBayesian vs. Frequentist SEMΔAIC<2
b
CategoryTraditional DCFAI-MRO Model
Cash Flow AssumptionsDeterministic Single PathStochastic Distribution
Volatility (σ) TreatmentRisk Factors (Discount Rate Premium)Value Creation Factors (Endogenous Reflection)
Strategic FlexibilityNon-Reflectable (Rigid)Internalization of Deferral/Extension/Abandonment Options (Flexible)
Pandemic Response MechanismImmediate Value Decline and Discontinuation SignalsEnsuring Sustainability Through Option Value Appreciation
Final Value JudgmentNPV < 0 (Investment Not Feasible)ENPV > 0 (Strategic investment valid)
The downward arrows (↓) represent a reduction in volatility and an increase in model stability, which are key indicators of the AI model’s performance.
Table 3. Multidimensional sensitivity analysis: ENPV variation rates based on cross-changes in market volatility (σ) and AI-ODP efficiency.
ScenarioControl Variable 1 (X-Axis): Market Volatility (σ)Control Variable 2 (Y-Axis): AI-ODP Efficiency (OPEX Reduction Rate)ENPV Variation Rate (vs. Baseline)Analysis Mechanism and Academic Interpretation
Baselineσ = 0.35
(PDD Standard Volatility)
35% savings
(PDD standard efficiency)
0%Baseline Scenario Reflecting Actual Observed Levels of PDD Projects
Aσ = 0.15$
(Low Volatility/Stable Market)
35% savings−45%[Interaction 1] When the market is stable, the value of strategic flexibility diminishes, causing the marginal utility of AI to sharply decline
Bσ = 0.35
(PDD Standard Volatility)
10% savings
(Low-efficiency AI model)
−70%[Interaction 2] Under identical uncertainty, reduced technical efficiency critically undermines the project’s total value
C (Core)σ = 0.50
(Extreme Volatility/Crisis Situation)
40% reduction
(High-Efficiency AI Model)
+85%[Interaction 3] When uncertainty (σ) and AI efficiency rise together, the value amplification mechanism activates, causing ENPV to increase substantially in a nonlinear manner
Dσ = 0.50
(Ultra-high Volatility/Crisis Situation)
10% reduction
(Low-efficiency AI model)
−15%[Interaction Comparison] In the high-volatile regime, the difference in AI performance (C vs. D) acts as the absolute dominant variable determining ENPV
Table 4. Baseline parameter derivation from PDD case inputs.
ParameterSymbolValueSource/Derivation
Risk-free raterf3.2%MAS Singapore 10-year government bond yield, 2023 annual average
Market risk premium(r m − r f)5.5%Damodaran (2024) Singapore equity risk premium estimate
Sector betaβ0.85Average beta of SGX-listed construction/real estate firms, 2020–2023
Initial trust premiumλ trust_initial1.8%Estimated from pre-blockchain PF credit spread data (Singapore infrastructure bonds, 2019–2021)
Blockchain-adjusted reductionΔλ trust1.2% (=120 bp)Estimated from on-chain ESG reporting adoption studies; conservative lower bound = 60 bp used in Table 5 sensitivity
Traditional discount rater trad7.7%r f + β(r m − r f) + λ trust = 3.2% + 0.85 × 5.5% + 1.8% = 3.2% + 4.675% + 1.8% ≈ 7.7%
Blockchain-adjusted rater B6.5%r trad − Δλ trust = 7.7% − 1.2% = 6.5%
Table 5. Minimum technical policy thresholds for smart infrastructure projects. Note: All threshold values are derived from PDD case calibration and are presented as directional benchmarks pending cross-project validation. See Section 4.6 for the full derivation.
Core VariableMinimum Requirement ThresholdFinancial ImpactDerivation Reference
Transparencyr B − 60 bpFinancial Cost SavingsSection 4.6, Step 3
Prediction AccuracyStandard Deviation −20%Reduced UncertaintySection 4.6, Step 3
LiquidityENPV +12%Value IncreaseSection 4.6, Step 3
ESG Integration LinkageAdditional λ trust ReductionPolicy Finance Linkage EffectSection 4.6, Step 1
Table 6. Robustness and external validity verification.
Analysis TypeKey FindingsAcademic Interpretation
Sensitivity Analysisr_B–50 bp → ENPV +7.8%, σ–10% → ENPV +5.4%Demonstrated value improvement effect from changes in key technical and financial control variables
Alternative Model ValidationBayesian SEM vs. Frequentist SEM ΔAIC < 2Maintaining structural consistency of the model despite changes in estimation methodology
Placebo Testp > 0.1 when inserting irrelevant variablesDoes not respond to dummy variables (low risk of overfitting)
Out-of-Sample ValidationPrediction accuracy 87.6%Ensures high model versatility and generalizability
BacktestingActual UOB·OCBC investment data with r = 0.91High empirical fit consistent with historical facts
Monte Carlo Simulation
(10,000 iterations)
P(ENPV > 0) = 0.82, Average Loss −45% → −18%Empirical Downside Risk Mitigation Effect of STO-Based Liquidity and MRO Risk Buffer Mechanism
The arrows (→) represent the direction of causal pathways or logical transitions between the variables.
Table 7. Formal hypotheses H1–H8 and corresponding SEM paths.
HypothesisDescriptionSEM Path
H1Blockchain transparency ↓ Trust premium (λtrust)Blockchain Adoption → λtrust
H2↓ Trust premium → ↓ Discount rate (rB)λtrust → rB
H3↓ Discount rate → ↑ ENPVrB → ENPV
H4AI prediction accuracy → ↓ Cash flow varianceAI Accuracy → Var[CF]
H5↓ CF variance → ↓ Volatility (σ)Var [CF] → σ
H6↓ Volatility → ↑ ROVσ → ROV
H7↑ STO liquidity → ↑ Liquidation Value (AL) → ↑ ENPVSTO → AL → ENPV
H8Smart construction data quality → ↑ AI accuracyData Quality → AI Accuracy
Note: ↑ denotes an increase, ↓ denotes a decrease, and → indicates the direction of the hypothesized causal influence. All paths H1–H8 are statistically significant (p < 0.05) in both frequentist and Bayesian SEM specifications (ΔAIC < 2).
Disclaimer/Publisher’s Note: The statements, opinions and data contained in all publications are solely those of the individual author(s) and contributor(s) and not of MDPI and/or the editor(s). MDPI and/or the editor(s) disclaim responsibility for any injury to people or property resulting from any ideas, methods, instructions or products referred to in the content.